simulations of chemical vapor deposition diamond …simulations of chemical vapor deposition diamond...
TRANSCRIPT

Simulations of chemical vapor deposition diamond film growth usinga kinetic Monte Carlo model and two-dimensional models of microwaveplasma and hot filament chemical vapor deposition reactors
P. W. May,1,a� J. N. Harvey,1 N. L. Allan,1 J. C. Richley,1 and Yu. A. Mankelevich2
1School of Chemistry, University of Bristol, Bristol BS8 1TS, United Kingdom2Skobel’tsyn Institute of Nuclear Physics, Moscow State University, Leninskie gory, Moscow 119991, Russia
�Received 23 September 2010; accepted 15 October 2010; published online 9 December 2010�
A one-dimensional kinetic Monte Carlo �KMC� model has been developed to simulate the chemicalvapor deposition of a diamond �100� surface under conditions used to grow single-crystal diamond�SCD�, microcrystalline diamond �MCD�, nanocrystalline diamond �NCD�, and ultrananocrystallinediamond �UNCD� films. The model considers adsorption, etching/desorption, lattice incorporationand surface migration but not defect formation or renucleation processes. Two methods have beendevised for estimation of the gas phase concentrations of species at the growing diamond surface,and are used to determine adsorption rates for C1Hx hydrocarbons for the different conditions. Therate of migration of adsorbed carbon species is governed by the availability of neighboring radicalsites, which, in turn, depend upon the rates of H abstraction and of surface-radical migration. TheKMC model predicts growth rates and surface roughness for each of diamond types consistent withexperiment. In the absence of defect formation and renucleation the average surface diffusionlength, �, is a key parameter controlling surface morphology. When ��2, surface migration islimited by the lack of availability of surface radical sites, and the migrating surface species simplyhop back and forth between two adjacent sites but do not travel far beyond their initial adsorptionsite. Thus, Eley–Rideal processes dominate the growth, leading to the rough surfaces seen in NCDand UNCD. The maximum or “intrinsic” surface roughness occurs for nominally zero-migrationconditions ��=0� with an rms value of approximately five carbon atoms. Conversely, whenmigration occurs over greater distances ���2�, Langmuir–Hinshelwood processes dominate thegrowth producing the smoother surfaces of MCD and SCD. By extrapolation, we predict thatatomically smooth surfaces over large areas should occur once migrating species can travelapproximately five sites ���5�. �-scission processes are found to be unimportant for MCD andSCD growth conditions, but can remove up to 5% of the adsorbing carbon for NCD and UNCDgrowth. C1Hx insertion reactions also contribute �1% to the growth for nearly all conditions, whileC2Hx �x�2� insertion reactions are negligible due their very low concentrations at the surface.Finally, the predictions for growth rate and morphology for UNCD deposition in a microwavesystem were found to be anomalous compared to those for all the other growth conditions,suggesting that carbonaceous particulates created in these plasmas may significantly affect the gaschemistry. © 2010 American Institute of Physics. �doi:10.1063/1.3516498�
I. INTRODUCTION
Chemical vapor deposition �CVD� of diamond is a ma-turing technology that is beginning to find many commercialapplications in electronics, cutting tools, medical coatingsand optics.1 The CVD process usually involves the gas-phaseactivation of a gas mixture containing a small quantity of ahydrocarbon in excess hydrogen.2,3 A typical gas mixtureuses a few percent CH4 in H2 �plus sometimes additional Aror N2�, and depending upon the growth conditions, substrateproperties and growth time, this produces polycrystallinefilms with grain sizes from �5 nm to mm. Films with grainsizes less than 10–20 nm are often called ultrananocrystallinediamond �UNCD� films; those with grain sizes a few tens orhundreds of nanometers are nanocrystalline diamond �NCD�;those with grain sizes microns or tens of microns are termed
microcrystalline diamond �MCD�; and those with grain sizesapproaching or exceeding 1 mm are single crystal diamond�SCD�.
However, to obtain a diamond film with the desired mor-phology combined with controlled electronic and mechanicalproperties requires a detailed understanding of the many pa-rameters affecting growth, such as the substrate temperature,gas mixture, process pressure, etc. The so-called ‘standardgrowth mechanism’4 developed in the early 1990s is a rea-sonably robust description of the general CVD diamond pro-cess, although it fails to fully explain many of the complexi-ties of growth, such as the growth rate and crystal size ofpolycrystalline films. In this model, atomic H created bythermal or electron-impact dissociation of H2 is the drivingforce behind all the chemistry. It is widely accepted5,6 thatthe main growth species in standard diamond CVD is theCH3 radical, which adds to radical sites �“dangling bonds”�created on the diamond surface following hydrogen abstrac-a�Electronic mail: [email protected].
JOURNAL OF APPLIED PHYSICS 108, 114909 �2010�
0021-8979/2010/108�11�/114909/14/$30.00 © 2010 American Institute of Physics108, 114909-1
Downloaded 10 Dec 2010 to 137.222.40.127. Redistribution subject to AIP license or copyright; see http://jap.aip.org/about/rights_and_permissions

tion by H atoms. The fraction of surface carbon atoms, F,which support such radical sites is the result of dynamicequilibrium between H abstraction and H addition reactionswhich are dependent upon the process conditions, especiallythe concentration of gas phase atomic H just above the sur-face, �H�s, and the substrate temperature, Ts. Under typicalCVD diamond conditions F�0.1, i.e., �10% of the surfacesupports radical sites.
An elevated substrate temperature �typically Ts
�700 °C� allows migration of the adsorbed carbon speciesacross the surface until they meet a step-edge and add to thediamond lattice �so-called “step-flow growth”�,7 or are re-moved back to the gas phase by an etching process. Anotherproposed role for the atomic H is to preferentially etch intothe gas phase any adsorbed carbon groups that have depos-ited as non-diamond phases, while for the most part sp3 car-bon species are left behind. However, the etch rate of surfacesp3 hydrocarbon species is not zero and depends upon theirlocation. As such, it provides an alternative explanation forgrowth via step-edges. Such ‘preferential etching’8 meansthat sp3 hydrocarbon species adsorbed on flat diamond sur-faces are etched away faster than those adsorbed next to astep-edge, resulting in hydrocarbon species preferentially re-siding at step-edges. It is believed that hydrocarbons CxHy
with two or more carbons �x�2� are prevented from contrib-uting to the growth by the “�-scission” reaction4 which is arapid, low energy, efficient process that stops the build-up oflong-chained molecules on the growing surface. Therefore,in this standard model, diamond growth is seen as a compe-tition between etching and deposition, with carbons beingadded to and removed from the diamond surface on an atom-by-atom basis.
Surface migration of carbon species is still a somewhatcontentious issue, and the mechanism and role it plays ingrowth remains unclear. Chemisorbed molecular groups,such as CH2, can, in principle, migrate along or across adimer row so long as they have an adjacent radical site intowhich to move. Because these radical sites are created by Habstraction reactions, the migration process can be consid-ered to be mediated by the local atomic H concentrationsince this determines abstraction rate. Such chemical migra-tion has been modeled in the group of Frenklach,9–11 andtheir estimated migration length of �10 Å is consistent withthe experimentally observed terrace sizes.12 Detailed calcu-lations of potential energy surfaces for migration steps on the�100� and �111� surfaces have also been performed usingmore accurate methods by Cheesman et al.13 and Larsson etal.,14 respectively, and both groups confirm the existence oflow overall barriers for migration, suggesting very rapid in-trinsic “hopping” rates at higher Ts values.
Our group recently developed a modified version of thestandard growth model which considers the effects of all theC1 hydrocarbon radicals �CH3, CH2, CH, and C atoms� onboth monoradical and biradical sites on a �100� diamondsurface.15 Our growth model also relies upon surface migra-tion of CH2 groups along and across the reconstructed dimerrows in order to predict growth rates to within a factor of twoof experimental observations, but it has an advantage in alsobeing able to predict the average grain size in the resulting
polycrystalline film, which can vary from a few nanometersin UNCD films to millimeters for MCD films.
Despite the successes of both growth models, direct evi-dence for surface migration, nucleation processes, the effectsof gas impurities and gas-surface reactions remain sparse andmostly circumstantial. Due to the difficulties of obtainingdirect evidence for many of the gas-surface processes byexperimental means, various workers have turned to theoret-ical models of these interactions, such as kinetic MonteCarlo �KMC� simulations. In KMC, a model of the diamondsurface is created and a set of relevant processes and mecha-nisms are constructed, including those in which C species�usually CH3� are allowed to strike the surface randomlywith an overall average impact rate. Some of these will ad-sorb with probability given by the rates estimated from ex-periment or theoretical models. Another possibility in theKMC simulations is to allow migration of the adsorbed Cspecies to an adjacent site, the probability of which dependson the magnitude of the activation barrier, the surface tem-perature, and the pre-exponential �attempt� frequency. Whenthe C species meets the bottom of a step-edge, the speciesmay bond to the edge thereby extending the diamond struc-ture, with a probability related to the results of detailed cal-culations previously carried out based on geometries, stericeffects and energies, and kinetic data. Given sufficient num-bers of impinging methyls and sufficient computing time, thegrowth of many layers of diamond can be simulated.
One of the most successful recent KMC implementa-tions is that of Netto and Frenklach,16 which used methylradicals as the only growth species, with incorporation of Cinto the diamond structure described by a ring-opening/closing mechanism. CH2 migrations along and across thedimer reconstructions were included, as well as etching ofisolated CH2 groups. The energetics and kinetic data forthese reactions were obtained from numerous semiempiricalelectronic structure calculations and from experimental mea-surements. Nevertheless, some of the required rate constantsremain only estimates, with varying degrees of accuracy.
With the aim of using the KMC approach to obtain in-sights into the overall growth mechanisms—but in reason-able timescales in terms of computing time—we developed asimplified one-dimensional KMC model of the growth ofdiamond films,17 initially for a fixed set of process conditionsand substrate temperature. Although the model was only one-dimensional �1D�, the interplay between adsorption, etching/desorption, and addition to the lattice was qualitatively mod-eled using known or estimated values for the rates of eachprocess. Color-coding the various surface species allowedthe interplay between these various processes to be readilyobserved as the simulation progressed. We included in themodel migration of sp3-bonded CH2 groups across the �100�diamond surface using a simplified version of the ring-opening mechanism described by Cheesman et al.13
In a follow-up paper18 we added the possibility of sur-face defects to the model, and more recently we extended theKMC model of SCD growth to include the temperature de-pendence of the various surface processes.19 To do so, were-examined the values of all the kinetic parameters previ-ously obtained from literature sources to determine their ac-
114909-2 May et al. J. Appl. Phys. 108, 114909 �2010�
Downloaded 10 Dec 2010 to 137.222.40.127. Redistribution subject to AIP license or copyright; see http://jap.aip.org/about/rights_and_permissions

curacy and consistency with the microscopic rates for el-ementary processes at the diamond surface. Preliminaryanalysis of the etching mechanism suggested that removal ofadsorbed sp3-bonded carbon species from the diamond sur-face by etching or desorption was highly unlikely on thermo-dynamic grounds.13 The only mechanism considered able toremove such species was �-scission, but this only accountedfor removal of at most 2% of the adsorbing species. Thus,with no rapid removal process, the net growth rate was de-termined simply by the adsorption rate of carbon speciesonto the surface. Further modifications arose from separatedetailed ab initio calculations20 which showed that migrationdown a step-edge had a similar energy barrier to migrationon the flat, and thus migration down steps �the “lemmings”scenario19� is facile. Most importantly, we modified themodel for surface migration, taking better account of the factthat the migration mechanism10,13 requires the presence of aradical site both on the initial and final positions of the mi-grating carbon. Under many conditions the rate-limiting stepin surface migration is the rate of creation of surface radicalsites, which is determined by the rate of H-abstraction reac-tions. Incorporating these improvements into the KMCmodel for typical MCD growth conditions revealed that sur-face migration still occurs rapidly, but is mostly limited tothe adsorbed CH2 species oscillating back and forth betweentwo adjacent radical sites. Despite the average number ofmigration hops being in the thousands, the average surfacediffusion length, �, for a surface species—before it eitheradds to the diamond lattice or is removed back to the gasphase—is �2 sites. At low substrate temperature we foundthat migration is negligible, with film growth being domi-nated by direct adsorption �Eley–Rideal� processes. The re-sulting films were rough and spiky, reminiscent of amor-phous carbon. With increasing substrate temperature,migration increases in significance until, for temperatures�1000 K, migration is the major process by which the sur-face becomes smoother. Under these conditions, Langmuir–Hinshelwood processes dominate �70%� the growth mecha-nism.
These simulations all assumed diamond growth was oc-curring under typical MCD growth conditions, e.g., a hotfilament �HF� reactor containing a gas mixture of1%CH4 /H2 at 20 Torr, with a 2000 K filament positioned 5mm away from a single-crystal �100� diamond substrate, butwith varying substrate temperature, Ts. The concentrations ofgas-phase species striking the diamond surface had been pre-viously estimated15 using a three-dimensional model for theactivated C/H/�Ar� gas mixture which includes 200 directand reverse reactions for 27 neutral species, electronicallyexcited levels of H, and H2, electrons and five ions. Themodel also includes the important gas-surface reactions, plusdiffusion, convection and transport processes within the re-actor, and its predictions have compared favorably with laserspectroscopy and in situ mass spectrometric measurementsmade in the center of the plasma or close to the filament. Fora given set of process conditions this model can be used asthe basis to determine the concentrations of all the major gasphase species at any position within a given reactor.
In this paper we now report the results of our KMC
model using the gas chemistry and conditions employed forthe growth of SCD, MCD, NCD, and UNCD. The gas chem-istry activation, the species concentrations and gas tempera-ture distributions are calculated using the previously reportedmodels of hot-filament21 and microwave-plasma CVD reac-tors mentioned above.22 The aim is to gain insight into theroles played by the various precursor gas species in thegrowth process, and to ascertain their relative importance incontrolling the growth rate and morphology of the resultingfilm.
II. MODIFICATION TO THE KMC MODEL
A full description of the KMC model for MCD condi-tions at different substrate temperatures has been presentedin detail previously.19 However, to simulate a more extensiverange of conditions than just those used for deposition ofMCD, this model required a few important modifications,which are outlined in the sections below.
A. Estimation of species concentrations at thesurface
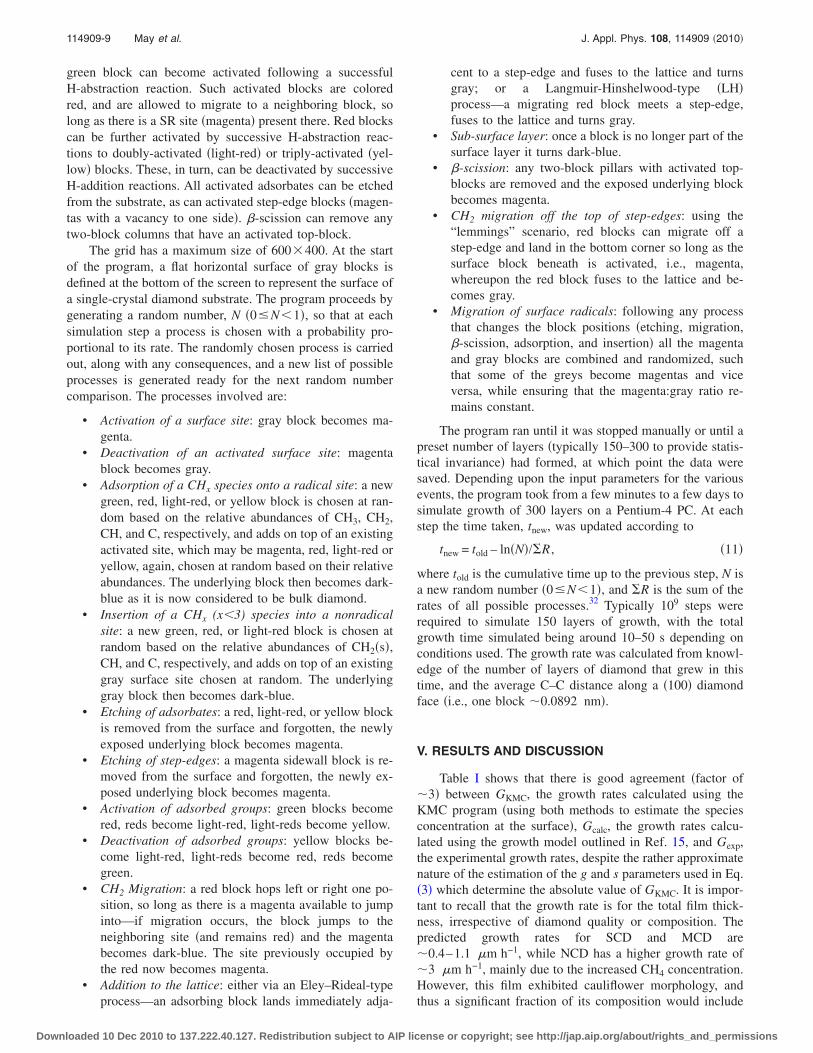
The first consideration is that for some conditions �e.g.,those used for UNCD deposition� the concentrations of otherC1 species, in particular C atoms, may no longer be negli-gible in comparison to that of CH3. Thus, we now need todetermine the rates of adsorption for all relevant hydrocar-bon radical species onto the surface, and decide their subse-quent fates. The first task was to re-evaluate the data fromthe simulations of the gas-phase chemistry publishedpreviously15 to estimate the concentrations for all the impor-tant C1 species at the diamond surface. Figures 1�a� and 1�b�show an example of such data for SCD conditions for asub-set of the species present. Similar data exist for MCD,NCD, and UNCD conditions �see Ref. 23�. The model cal-culates the concentrations of species as a function of posi-tion, z, above the diamond surface, but is restricted in reso-lution to the grid size, the value of which was chosen to be0.5 mm based upon the limitations of computation speed.Therefore, the data in Fig. 1 taken from Ref. 15 for speciesconcentrations near the substrate equate to a distance of z=0.5 mm in the model. Previously we have assumed that thespecies concentrations at the surface �z=0� can be taken tobe the same as those calculated at z=0.5 mm. However, nearthe surface there is often a thin boundary layer ��1 mm� inwhich temperatures, gas flows, and concentrations canchange significantly. For previous KMC calculations, theonly species that needed to be considered were H and CH3,which �as can be seen in Fig. 1�b�� have relatively weakdependences of concentration with z for z�5 mm, despitethe steep temperature drop over this distance. As a result, ourprevious assumption that the concentration of CH3 at z=0can be taken to be the same as that at z=0.5 mm is reason-able. However, such an assumption would be incorrect forthe other hydrocarbon species, whose dependences of con-centration with z near the surface are much stronger. Wehave tackled this problem using two approaches:
Method A: In the first approach, we found that power-law expressions of the form �X�= pzq, where �X� is the con-
114909-3 May et al. J. Appl. Phys. 108, 114909 �2010�
Downloaded 10 Dec 2010 to 137.222.40.127. Redistribution subject to AIP license or copyright; see http://jap.aip.org/about/rights_and_permissions
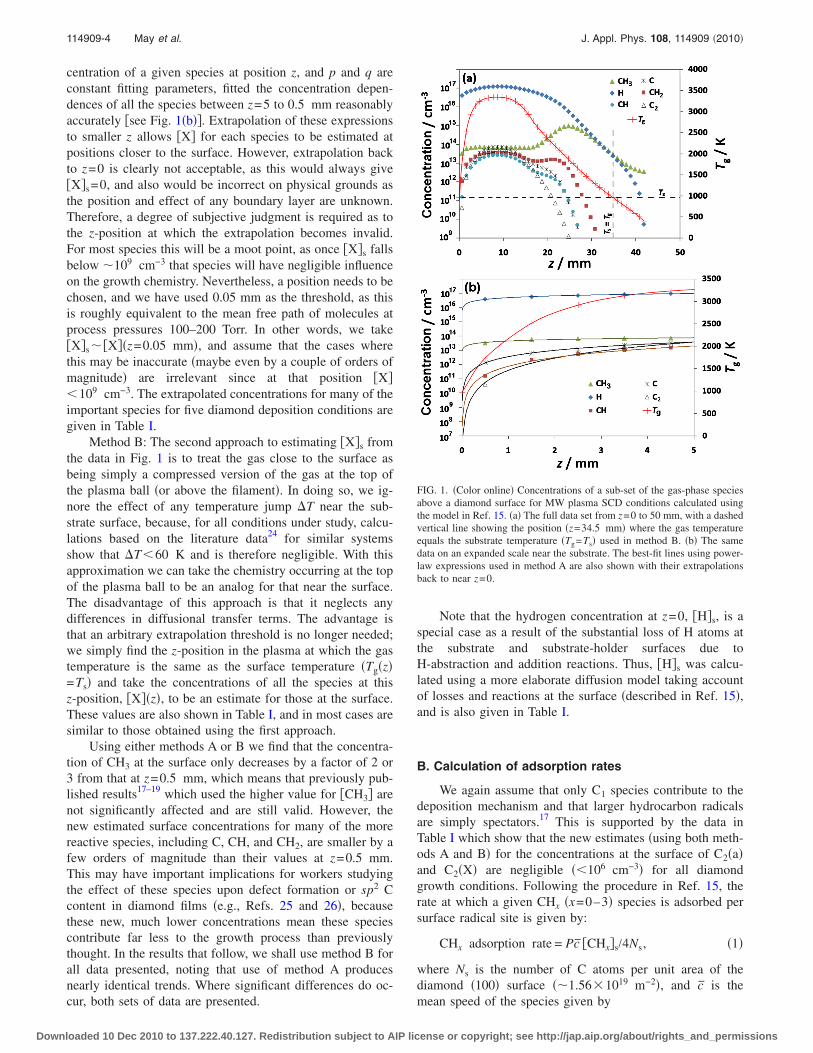
centration of a given species at position z, and p and q areconstant fitting parameters, fitted the concentration depen-dences of all the species between z=5 to 0.5 mm reasonablyaccurately �see Fig. 1�b��. Extrapolation of these expressionsto smaller z allows �X� for each species to be estimated atpositions closer to the surface. However, extrapolation backto z=0 is clearly not acceptable, as this would always give�X�s=0, and also would be incorrect on physical grounds asthe position and effect of any boundary layer are unknown.Therefore, a degree of subjective judgment is required as tothe z-position at which the extrapolation becomes invalid.For most species this will be a moot point, as once �X�s fallsbelow �109 cm−3 that species will have negligible influenceon the growth chemistry. Nevertheless, a position needs to bechosen, and we have used 0.05 mm as the threshold, as thisis roughly equivalent to the mean free path of molecules atprocess pressures 100–200 Torr. In other words, we take�X�s��X��z=0.05 mm�, and assume that the cases wherethis may be inaccurate �maybe even by a couple of orders ofmagnitude� are irrelevant since at that position �X��109 cm−3. The extrapolated concentrations for many of theimportant species for five diamond deposition conditions aregiven in Table I.
Method B: The second approach to estimating �X�s fromthe data in Fig. 1 is to treat the gas close to the surface asbeing simply a compressed version of the gas at the top ofthe plasma ball �or above the filament�. In doing so, we ig-nore the effect of any temperature jump �T near the sub-strate surface, because, for all conditions under study, calcu-lations based on the literature data24 for similar systemsshow that �T�60 K and is therefore negligible. With thisapproximation we can take the chemistry occurring at the topof the plasma ball to be an analog for that near the surface.The disadvantage of this approach is that it neglects anydifferences in diffusional transfer terms. The advantage isthat an arbitrary extrapolation threshold is no longer needed;we simply find the z-position in the plasma at which the gastemperature is the same as the surface temperature �Tg�z�=Ts� and take the concentrations of all the species at thisz-position, �X��z�, to be an estimate for those at the surface.These values are also shown in Table I, and in most cases aresimilar to those obtained using the first approach.
Using either methods A or B we find that the concentra-tion of CH3 at the surface only decreases by a factor of 2 or3 from that at z=0.5 mm, which means that previously pub-lished results17–19 which used the higher value for �CH3� arenot significantly affected and are still valid. However, thenew estimated surface concentrations for many of the morereactive species, including C, CH, and CH2, are smaller by afew orders of magnitude than their values at z=0.5 mm.This may have important implications for workers studyingthe effect of these species upon defect formation or sp2 Ccontent in diamond films �e.g., Refs. 25 and 26�, becausethese new, much lower concentrations mean these speciescontribute far less to the growth process than previouslythought. In the results that follow, we shall use method B forall data presented, noting that use of method A producesnearly identical trends. Where significant differences do oc-cur, both sets of data are presented.
Note that the hydrogen concentration at z=0, �H�s, is aspecial case as a result of the substantial loss of H atoms atthe substrate and substrate-holder surfaces due toH-abstraction and addition reactions. Thus, �H�s was calcu-lated using a more elaborate diffusion model taking accountof losses and reactions at the surface �described in Ref. 15�,and is also given in Table I.
B. Calculation of adsorption rates
We again assume that only C1 species contribute to thedeposition mechanism and that larger hydrocarbon radicalsare simply spectators.17 This is supported by the data inTable I which show that the new estimates �using both meth-ods A and B� for the concentrations at the surface of C2�a�and C2�X� are negligible ��106 cm−3� for all diamondgrowth conditions. Following the procedure in Ref. 15, therate at which a given CHx �x=0–3� species is adsorbed persurface radical site is given by:
CHx adsorption rate = Pc̄ �CHx�s/4Ns, �1�
where Ns is the number of C atoms per unit area of thediamond �100� surface ��1.56�1019 m−2�, and c̄ is themean speed of the species given by
FIG. 1. �Color online� Concentrations of a sub-set of the gas-phase speciesabove a diamond surface for MW plasma SCD conditions calculated usingthe model in Ref. 15. �a� The full data set from z=0 to 50 mm, with a dashedvertical line showing the position �z=34.5 mm� where the gas temperatureequals the substrate temperature �Tg=Ts� used in method B. �b� The samedata on an expanded scale near the substrate. The best-fit lines using power-law expressions used in method A are also shown with their extrapolationsback to near z=0.
114909-4 May et al. J. Appl. Phys. 108, 114909 �2010�
Downloaded 10 Dec 2010 to 137.222.40.127. Redistribution subject to AIP license or copyright; see http://jap.aip.org/about/rights_and_permissions

TABLE I. Concentrations, �X�, �in cm−3� of selected gas-phase species near and at the surface, for different experimental diamond film growth conditions �Ref. 15�.Briefly, MCD conditions are 1%CH4 /H2 at 20 Torrin a HFCVD reactor with Ts�1173 K; NCD conditions are the same except using 5%CH4 /H2; UNCD�HF� conditions used the same reactor but with 80%Ar /18.5%H2 /1.5%CH4 at 100 Torr; UNCD�MW� films weredeposited using 1%CH4 /1%H2 /98%Ar in a 700 W MW plasma at 170 W and a reduced Ts�873 K; and SCD conditions are for a high density, 600 W MW plasma at 180 Torr using 10%CH4 /H2 and Ts
�973 K. The concentrations near the surface �z=0.5 mm� have been calculated using the procedures given in Ref. 15, while those at the surface have been estimated from these data using the methods A and Bdescribed in Sec. II A. Tg is the gas temperature, Ts is the experimental substrate temperature, and Tns is the calculated temperature of the gas near �z=0.5 mm� the substrate. �H�s is a special case, and has beencalculated using a detailed treatment of diffusion and surface reaction. CH2�s� refers to the singlet state, while C2�X� and C2�a� are the ground state and first excited state of C2, respectively. The conditions forUNCD�MW� have been recalculated using a lower value for Ts. The total growth rate, Gcalc, and crystal sizes, �d�, are calculated using the equations in Ref. 15 while GKMC is the growth rate calculated using the KMCmodel in this paper. Experimental values for Gexp and �d� are from the references given in Ref. 15.
Film type SCD MCD NCD UNCD UNCD
Reactor MW HF HF HF MWTs /K 973 973 973 1173 1173 1173 1173 1173 1173 1173 1173 1173 873 873 873Tns /K 1736 1267 1267 1145 1263z /mm, Method 0.5 0, A 0, B 0.5 0, A 0, B 0.5 0, A 0, B 0.5 0, A 0, B 0.5 0, A 0, B
Species, X �X�ns �X�s �X�s �X�ns �X�s �X�s �X�ns �X�s �X�s �X�ns �X�s �X�s �X�ns �X�s �X�s
H 3.38�1016 3.38�1016 3.38�1016 1.85�1014 1.85�1014 1.85�1014 1.52�1014 1.52�1014 1.52�1014 3.00�1013 3.00�1013 3.00�1013 4.31�1014 4.31�1014 4.31�1014
CH3 3.24�1013 1.0�1013 2.86�1013 1.46�1013 8.0�1012 2.18�1013 5.68�1013 6.0�1013 7.30�1013 3.82�1013 8.0�1012 2.49�1013 5.60�1011 1.0�1012 8.48�1012
CH2 1.06�1012 1.0�1010 5.65�106 2.72�1010 1.0�109 4.50�1010 8.12�1010 2.0�109 1.00�1011 1.55�1010 1.0�108 2.76�109 2.31�109 1.0�108 6.13�109
CH2�s� 5.97�1010 1.0�108 6.38�105 3.66�108 1.0�106 6.90�108 1.14�109 5.0�106 1.00�109 5.62�108 1.0�105 6.97�107 6.08�107 1.0�106 9.46�107
CH 1.60�1011 5.0�108 2.36�103 2.74�108 1.0�106 1.10�109 6.53�108 1.0�106 1.40�109 5.28�107 1.0�104 7.61�106 7.05�108 1.0�107 1.10�109
C 1.41�1012 1.0�1010 1.29�104 3.37�109 6.0�108 1.95�1010 5.45�109 2.0�109 1.24�1010 1.05�107 1.0�104 9.34�105 1.47�1011 5.0�109 8.14�109
H2 9.33�1017 9.33�1017 9.33�1017 1.52�1017 1.52�1017 1.52�1017 1.51�1017 1.51�1017 1.51�1017 1.83�1017 1.83�1017 1.83�1017 2.06�1016 2.06�1016 2.06�1016
C2�a� 4.19�1010 1.0�106 2.66�100 6.57�104 1.0�105 2.25�105 1.74�105 2.0�105 1.76�105 2.49�105 1.0�103 1.11�102 1.16�1011 1.0�1010 6.58�106
C2�X� 1.12�1010 1.0�105 9.42�10−1 1.41�104 4.0�104 1.50�105 5.40�104 6.0�104 1.33�105 1.49�104 1.0�100 1.11�101 4.93�1010 5.0�109 3.4�106
C2H2 2.96�1016 4.0�1017 1.41�1016 2.49�1011 2.8�1011 1.80�1011 2.97�1012 3.7�1012 1.81�1012 2.97�1013 2.95�1013 1.13�1013 2.35�1015 2.7�1015 3.42�1015
Ar 5.34�1017 1.21�1018
Gcalc / ��m h−1� 4.4 1.3 3.8 1.6 1.4 3.3 11.1 9.2 11.6 1.7 0.5 1.6 0.034 0.07 0.5GKMC / ��m h−1� 2.1 0.4 1.0 0.85 0.45 1.1 3.0 2.7 3.2 0.9 0.2 0.4 0.036 0.03 0.18�d� 2.1 cm 25 cm 3.1 cm 2.2 �m 7.04 �m 0.94 �m 94 nm 84 nm 57 nm 8.1 nm 185 nm 19 nm 12 mm 6 mm 84 �m
Experimental valuesGexp / ��m h−1� 3–4 0.35 �1.0 �0.1 �0.1�d�exp �100 �m a 1–50 �m b �100 nm �10 nm �15 nm
aSCD over an area 2.5�2.5 mm2 but with some round-shaped growth structures with heights up to 0.5 �m and widths �100 �m.bDepends on thickness.
114909-5M
ayet
al.J.A
ppl.P
hys.108,
114909�2010
�
Downloaded 10 Dec 2010 to 137.222.40.127. Redistribution subject to AIP license or copyright; see http://jap.aip.org/about/rights_and_permissions

c̄ = �8RTns/mCHx�1/2, �2�
where R is the gas constant, Tns is the gas temperature nearthe surface �taken to be the same as Ts if the species concen-trations are calculated for z=0�, mCHx is the relative molarmass of the species, and �CHx�s is the concentration of thespecies with x=0–3 at the surface estimated using one of thetwo methods mentioned above. P is the probability of ad-sorption onto a radical site �i.e., the sticking probability�. Thevalue of P results from a combination of factors that reducethe reaction probability, such as a geometrical factor �g� dueto unfavorable collision orientations and a steric-electronicfactor �s�, and we assume the two are independent, so that Pis simply:
P = gs . �3�
The factor s was previously estimated for CH3 since it isknown27 from electronic-spin statistics that, on average,three collisions out of four will be on the triplet surface andwill not lead to reaction at the high temperatures of diamondCVD. We also know that not all the surface radical sites willbe accessible for adsorption, say �50%–60%, giving an es-timate for s�0.25�0.6=0.15. Taking a value for g of 0.5gives an estimated value for P for CH3 of �0.075. In theabsence of appropriate experimental data and a suitablemethod for their accurate calculation, the values of s and gfor the other CHx species have simply been estimated assum-ing that species with smaller radii are less sterically hindered�larger g� and have greater reaction probability �larger s�.The estimates used are given in Table II.
C. Multiply-activated surface species
The second new consideration is that the CHx specieswhich adsorb onto the surface will not all form stable CH2
bridging structures. Adsorbates other than CH3 will first ad-sorb as ‘activated’ adducts, supporting one or more danglingbonds, with the degree of activation dependent upon theidentity of the species adsorbed. As before, adsorbing CH3 ismodeled as an unactivated surface block, which is immobileand unreactive. Adsorbing CH2 results in an activated sur-face block �i.e., it has one dangling bond�, which is reactiveand mobile, assuming there is an adjacent surface radicalinto which it can jump. Adsorbing CH leads to a doubly-activated block �i.e., two dangling bonds�, which is highlyreactive. Finally, adsorbing C atoms forms triply-activatedblocks �three dangling bonds�, which are more reactive still.
All of these activated surface species have three possiblereaction pathways. One pathway is for the species and itsdangling bonds to restructure locally on the surface forming
a surface defect. This defect may become a renucleation sitefor the initiation of a new layer or for the creation of a newmismatched crystallite, resulting in polycrystalline growth.Modeling this pathway has been left for future work. Thesecond pathway involves activation and deactivation of thevarious surface adsorbates. As before, unactivated CH2
blocks can undergo an H-abstraction reaction with a rategiven by
Activation rate = �k1�H�s�U , �4�
while the rate of deactivating a surface radical site is
Deactivation rate = �k2�H�s + k−1�H2��A , �5�
with U and A being the number of unactivated and activatedsurface blocks, respectively, and the rate constants, k1, k2,and k−1 given in Ref. 19. However, the activated blocks nowhave the possibility of undergoing a second H abstraction,and activating further to doubly-activated sites, or, furtherstill, to triply-activated blocks. The reverse is also possible,the triply- and doubly-activated blocks can deactivate viasequential H-addition reactions. These reactions would obeyrate equations of the same form as Eqs. �4� and �5�, with thereplacement of U and A, by the number of relevant activatedor deactivated blocks, respectively.
D. Etching
The third possible pathway is removal of the activatedspecies back to the gas phase via etching. Previously, weincluded an etching step for all the types of activatedsp3-bonded CHx adsorbates19 but only by the high-energyroute of direct C–C bond cleavage. For Ts=1173 K, and aC–C bond energy of �350 kJ mol−1, this gave a typical persite etching rate a factor of 1000 times slower than mostother processes, suggesting that such etching processes are�almost� negligible. This is however incompatible with ex-perimental evidence28 whereby etching does occur underCVD conditions in the absence of methane. Recent etchingexperiments in our laboratory29 using single-crystal diamondand H2 microwave �MW� plasmas under similar conditionsto that used for CVD showed that the average etch-rate ofdiamond �calculated by mass loss� over the whole surface istypically �10% of the growth rate obtained for the sameplasma conditions but with added CH4. While the mecha-nism of this process is not yet clear, it should be included inour model. Thus, in the present study the etch-rate is chosensemi-empirically to reproduce the known ratio of depositionand etching rates. In terms of the KMC program, this issimply obtained by setting, as follows:
overall etch rate = 0.1 � �CH3 adsorption rate� . �6�
Closer examination of the experimentally etched diamondsurfaces29 also showed that etching does not occur homoge-neously across the surface. Etching appears to begin by theremoval of an individual atom, probably a defect or impurityin the surface. The exposed sidewalls of this vacancy thenetch back rapidly producing shallow, flat-bottomed, rectan-gular etch-pits many tens or hundreds of micrometers across,as shown in Fig. 2. Similar pits have also been seen when
TABLE II. Estimated values for g, s, and P for each CHx species used in Eq.�3�.
Species g s P
CH3 0.5 0.15 0.075CH2 0.6 0.2 0.12CH 0.7 0.25 0.175C 1.0 0.3 0.3
114909-6 May et al. J. Appl. Phys. 108, 114909 �2010�
Downloaded 10 Dec 2010 to 137.222.40.127. Redistribution subject to AIP license or copyright; see http://jap.aip.org/about/rights_and_permissions
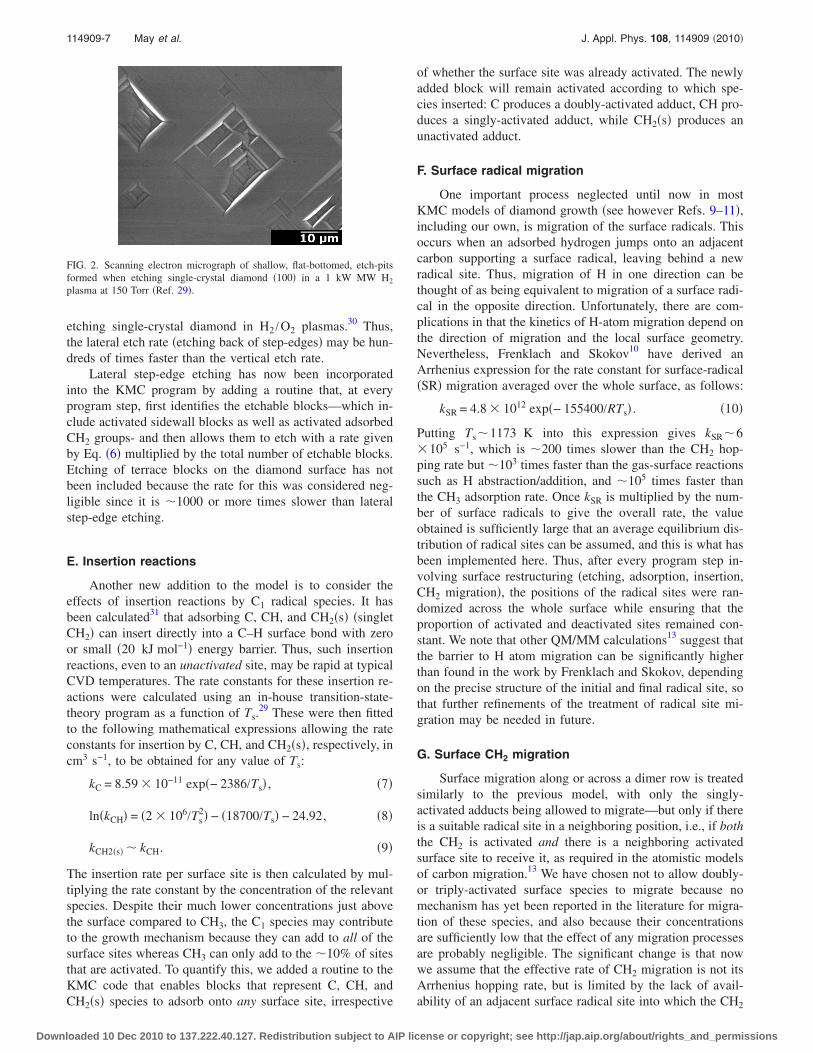
etching single-crystal diamond in H2 /O2 plasmas.30 Thus,the lateral etch rate �etching back of step-edges� may be hun-dreds of times faster than the vertical etch rate.
Lateral step-edge etching has now been incorporatedinto the KMC program by adding a routine that, at everyprogram step, first identifies the etchable blocks—which in-clude activated sidewall blocks as well as activated adsorbedCH2 groups- and then allows them to etch with a rate givenby Eq. �6� multiplied by the total number of etchable blocks.Etching of terrace blocks on the diamond surface has notbeen included because the rate for this was considered neg-ligible since it is �1000 or more times slower than lateralstep-edge etching.
E. Insertion reactions
Another new addition to the model is to consider theeffects of insertion reactions by C1 radical species. It hasbeen calculated31 that adsorbing C, CH, and CH2�s� �singletCH2� can insert directly into a C–H surface bond with zeroor small �20 kJ mol−1� energy barrier. Thus, such insertionreactions, even to an unactivated site, may be rapid at typicalCVD temperatures. The rate constants for these insertion re-actions were calculated using an in-house transition-state-theory program as a function of Ts.
29 These were then fittedto the following mathematical expressions allowing the rateconstants for insertion by C, CH, and CH2�s�, respectively, incm3 s−1, to be obtained for any value of Ts:
kC = 8.59 � 10−11 exp�− 2386/Ts� , �7�
ln�kCH� = �2 � 106/Ts2� − �18700/Ts� − 24.92, �8�
kCH2�s� � kCH. �9�
The insertion rate per surface site is then calculated by mul-tiplying the rate constant by the concentration of the relevantspecies. Despite their much lower concentrations just abovethe surface compared to CH3, the C1 species may contributeto the growth mechanism because they can add to all of thesurface sites whereas CH3 can only add to the �10% of sitesthat are activated. To quantify this, we added a routine to theKMC code that enables blocks that represent C, CH, andCH2�s� species to adsorb onto any surface site, irrespective
of whether the surface site was already activated. The newlyadded block will remain activated according to which spe-cies inserted: C produces a doubly-activated adduct, CH pro-duces a singly-activated adduct, while CH2�s� produces anunactivated adduct.
F. Surface radical migration
One important process neglected until now in mostKMC models of diamond growth �see however Refs. 9–11�,including our own, is migration of the surface radicals. Thisoccurs when an adsorbed hydrogen jumps onto an adjacentcarbon supporting a surface radical, leaving behind a newradical site. Thus, migration of H in one direction can bethought of as being equivalent to migration of a surface radi-cal in the opposite direction. Unfortunately, there are com-plications in that the kinetics of H-atom migration depend onthe direction of migration and the local surface geometry.Nevertheless, Frenklach and Skokov10 have derived anArrhenius expression for the rate constant for surface-radical�SR� migration averaged over the whole surface, as follows:
kSR = 4.8 � 1012 exp�− 155400/RTs� . �10�
Putting Ts�1173 K into this expression gives kSR�6�105 s−1, which is �200 times slower than the CH2 hop-ping rate but �103 times faster than the gas-surface reactionssuch as H abstraction/addition, and �105 times faster thanthe CH3 adsorption rate. Once kSR is multiplied by the num-ber of surface radicals to give the overall rate, the valueobtained is sufficiently large that an average equilibrium dis-tribution of radical sites can be assumed, and this is what hasbeen implemented here. Thus, after every program step in-volving surface restructuring �etching, adsorption, insertion,CH2 migration�, the positions of the radical sites were ran-domized across the whole surface while ensuring that theproportion of activated and deactivated sites remained con-stant. We note that other QM/MM calculations13 suggest thatthe barrier to H atom migration can be significantly higherthan found in the work by Frenklach and Skokov, dependingon the precise structure of the initial and final radical site, sothat further refinements of the treatment of radical site mi-gration may be needed in future.
G. Surface CH2 migration
Surface migration along or across a dimer row is treatedsimilarly to the previous model, with only the singly-activated adducts being allowed to migrate—but only if thereis a suitable radical site in a neighboring position, i.e., if boththe CH2 is activated and there is a neighboring activatedsurface site to receive it, as required in the atomistic modelsof carbon migration.13 We have chosen not to allow doubly-or triply-activated surface species to migrate because nomechanism has yet been reported in the literature for migra-tion of these species, and also because their concentrationsare sufficiently low that the effect of any migration processesare probably negligible. The significant change is that nowwe assume that the effective rate of CH2 migration is not itsArrhenius hopping rate, but is limited by the lack of avail-ability of an adjacent surface radical site into which the CH2
FIG. 2. Scanning electron micrograph of shallow, flat-bottomed, etch-pitsformed when etching single-crystal diamond �100� in a 1 kW MW H2
plasma at 150 Torr �Ref. 29�.
114909-7 May et al. J. Appl. Phys. 108, 114909 �2010�
Downloaded 10 Dec 2010 to 137.222.40.127. Redistribution subject to AIP license or copyright; see http://jap.aip.org/about/rights_and_permissions

may hop. The rate at which adjacent radical sites becomeavailable is governed initially by the equilibrium between Habstraction and H addition rates, and then by a combinationof the H abstraction rate and rate of SR migration. For mostCVD conditions, the SR migration rate is much faster thanthat of H abstraction, the exception being under the high-power, higher pressure conditions used for SCD growthwhere the two rates can become comparable. To account forthis, the effective CH2 migration rate in the KMC model issimply made equal to the faster of these two rates.
We have continued to use the “lemmings” scenario asthe default process that occurs when migrating blocks en-counter the top of a step-edge. This scenario allows theblocks to migrate off the top of a step-edge at the same rateas migration on the flat, so long as there is a radical siteadjacent to the bottom of the step-edge upon which the blockcan land.
H. �-scission
�-scission is also modeled as before, with the rate beinggiven simply by k�B, where k� is the rate constant for the�-scission reaction19 and B the number of activated 2-blockcolumns present on the surface at any one time. In this case,we have allowed �-scission to occur if the topmost block issingly-, doubly-, or triply-activated, although this choicemakes little difference because, for most growth conditions,�-scission makes only a minor contribution to the overalldeposition process.
III. GROWTH PARAMETERS
In order to test the predictions of the KMC model overthe range of deposition conditions used for growth of differ-ent types of diamond we require knowledge of the concen-trations of atomic H, CH3 and the remainder of the other C1
hydrocarbon radicals �C, CH, and CH2� at the growing dia-mond surface, all as a function of deposition conditions�pressure, Ts, etc.�. These parameters have been calculatedusing the model described in Ref. 15 for the gas mixturesand conditions used experimentally to deposit SCD, MCD,NCD, and UNCD in both hot filament and microwave �MW�reactors, allowing the identities and concentrations of thegaseous species near the diamond surface in each of these
situations to be estimated. These data were then analyzedusing the two methods described in Sec. II A to estimate theconcentrations �X�s of all these species at the surface �z=0�. The concentrations for a sub-set of the most abundantand relevant species are given in Table I. Based on our pre-vious growth model these data were used to calculate theexpected growth rate, G, and average crystal size, �d�, foreach type of diamond film, and the results agreed reasonablywell with experimental findings. The exception was forUNCD grown in a MW reactor, where the predicted �d� wasincorrect by many orders of magnitude. Until now, the originof this discrepancy remained unclear, and we assumed thatthere must be some factor in the modeling of either the gasphase chemistry or the gas-surface interactions for UN-CD�MW� conditions that was not accounted for. We shallreturn to this point later in Sec. V.
IV. THE KMC MODEL
The original model for the KMC program is given inRefs. 17 and 18, and so only a brief description will be givenhere. The �100� diamond lattice is represented in only 2 di-mensions, as a cross-section. Each C atom is represented bya square block within the lattice. New blocks are allowed toadsorb onto random �but previously activated� positions onthis surface, after which they may adsorb, migrate across thesurface, be etched away, or add to the lattice, with each pro-cess having a rate generated at each step of the programbased upon the current occupancy of the lattice array. Thesenew blocks represent generic C1 adsorbing units, which areusually CH3 but may now include C, CH, CH2, or CH2�s�.
Color-coding the blocks within the array is used to rep-resent different “types” of carbon bonding and for ease ofdescription �see Table III�. Carbons that are fully bonded intothe bulk diamond lattice are colored dark-blue whereas hy-drogenated carbons that form the surface layer are coloredgray. A surface radical site is colored magenta, and is createdas a result of a gray block being “activated” by a successfulH abstraction. Green blocks are used to represent pendantCH3 groups or bonded CH2 structures that bridge along oracross the rows of the dimer pairs on the reconstructed �100�surface. These are considered to be immobile, although theymay rapidly interconvert between the CH3 and CH2 forms asa result of H addition/abstraction reactions. An immobile
TABLE III. Color codes for the blocks used in the KMC algorithm. “Yes” in the “Adsorption allowed?” columnmeans that these blocks allow other blocks to attach on top of them, either by direct adsorption from the gasphase, migration, or “lemmings” processes.
Color code Description
Mobileon
surface? Etchable?Adsorptionallowed?
Dark-blue The subsurface bulk diamond lattice. No No NoGrey Hydrogenated �unactivated� surface layer. No No No
MagentaDehydrogenated activated surface radical site �dangling
bond�. No No YesGreen Hydrogenated �unactivated� adsorbed CH2 /CH3 unit. No Yes NoRed Dehydrogenated activated adsorbed CH2 unit. Yes Yes YesLight-red Doubly-activated adsorbed CH unit. No Yes YesYellow Triply-activated adsorbed C unit. No Yes Yes
114909-8 May et al. J. Appl. Phys. 108, 114909 �2010�
Downloaded 10 Dec 2010 to 137.222.40.127. Redistribution subject to AIP license or copyright; see http://jap.aip.org/about/rights_and_permissions
green block can become activated following a successfulH-abstraction reaction. Such activated blocks are coloredred, and are allowed to migrate to a neighboring block, solong as there is a SR site �magenta� present there. Red blockscan be further activated by successive H-abstraction reac-tions to doubly-activated �light-red� or triply-activated �yel-low� blocks. These, in turn, can be deactivated by successiveH-addition reactions. All activated adsorbates can be etchedfrom the substrate, as can activated step-edge blocks �magen-tas with a vacancy to one side�. �-scission can remove anytwo-block columns that have an activated top-block.
The grid has a maximum size of 600�400. At the startof the program, a flat horizontal surface of gray blocks isdefined at the bottom of the screen to represent the surface ofa single-crystal diamond substrate. The program proceeds bygenerating a random number, N �0N�1�, so that at eachsimulation step a process is chosen with a probability pro-portional to its rate. The randomly chosen process is carriedout, along with any consequences, and a new list of possibleprocesses is generated ready for the next random numbercomparison. The processes involved are:
• Activation of a surface site: gray block becomes ma-genta.
• Deactivation of an activated surface site: magentablock becomes gray.
• Adsorption of a CHx species onto a radical site: a newgreen, red, light-red, or yellow block is chosen at ran-dom based on the relative abundances of CH3, CH2,CH, and C, respectively, and adds on top of an existingactivated site, which may be magenta, red, light-red oryellow, again, chosen at random based on their relativeabundances. The underlying block then becomes dark-blue as it is now considered to be bulk diamond.
• Insertion of a CHx (x�3) species into a nonradicalsite: a new green, red, or light-red block is chosen atrandom based on the relative abundances of CH2�s�,CH, and C, respectively, and adds on top of an existinggray surface site chosen at random. The underlyinggray block then becomes dark-blue.
• Etching of adsorbates: a red, light-red, or yellow blockis removed from the surface and forgotten, the newlyexposed underlying block becomes magenta.
• Etching of step-edges: a magenta sidewall block is re-moved from the surface and forgotten, the newly ex-posed underlying block becomes magenta.
• Activation of adsorbed groups: green blocks becomered, reds become light-red, light-reds become yellow.
• Deactivation of adsorbed groups: yellow blocks be-come light-red, light-reds become red, reds becomegreen.
• CH2 Migration: a red block hops left or right one po-sition, so long as there is a magenta available to jumpinto—if migration occurs, the block jumps to theneighboring site �and remains red� and the magentabecomes dark-blue. The site previously occupied bythe red now becomes magenta.
• Addition to the lattice: either via an Eley–Rideal-typeprocess—an adsorbing block lands immediately adja-
cent to a step-edge and fuses to the lattice and turnsgray; or a Langmuir-Hinshelwood-type �LH�process—a migrating red block meets a step-edge,fuses to the lattice and turns gray.
• Sub-surface layer: once a block is no longer part of thesurface layer it turns dark-blue.
• �-scission: any two-block pillars with activated top-blocks are removed and the exposed underlying blockbecomes magenta.
• CH2 migration off the top of step-edges: using the“lemmings” scenario, red blocks can migrate off astep-edge and land in the bottom corner so long as thesurface block beneath is activated, i.e., magenta,whereupon the red block fuses to the lattice and be-comes gray.
• Migration of surface radicals: following any processthat changes the block positions �etching, migration,�-scission, adsorption, and insertion� all the magentaand gray blocks are combined and randomized, suchthat some of the greys become magentas and viceversa, while ensuring that the magenta:gray ratio re-mains constant.
The program ran until it was stopped manually or until apreset number of layers �typically 150–300 to provide statis-tical invariance� had formed, at which point the data weresaved. Depending upon the input parameters for the variousevents, the program took from a few minutes to a few days tosimulate growth of 300 layers on a Pentium-4 PC. At eachstep the time taken, tnew, was updated according to
tnew = told – ln�N�/�R , �11�
where told is the cumulative time up to the previous step, N isa new random number �0N�1�, and �R is the sum of therates of all possible processes.32 Typically 109 steps wererequired to simulate 150 layers of growth, with the totalgrowth time simulated being around 10–50 s depending onconditions used. The growth rate was calculated from knowl-edge of the number of layers of diamond that grew in thistime, and the average C–C distance along a �100� diamondface �i.e., one block �0.0892 nm�.
V. RESULTS AND DISCUSSION
Table I shows that there is good agreement �factor of�3� between GKMC, the growth rates calculated using theKMC program �using both methods to estimate the speciesconcentration at the surface�, Gcalc, the growth rates calcu-lated using the growth model outlined in Ref. 15, and Gexp,the experimental growth rates, despite the rather approximatenature of the estimation of the g and s parameters used in Eq.�3� which determine the absolute value of GKMC. It is impor-tant to recall that the growth rate is for the total film thick-ness, irrespective of diamond quality or composition. Thepredicted growth rates for SCD and MCD are�0.4–1.1 �m h−1, while NCD has a higher growth rate of�3 �m h−1, mainly due to the increased CH4 concentration.However, this film exhibited cauliflower morphology, andthus a significant fraction of its composition would include
114909-9 May et al. J. Appl. Phys. 108, 114909 �2010�
Downloaded 10 Dec 2010 to 137.222.40.127. Redistribution subject to AIP license or copyright; see http://jap.aip.org/about/rights_and_permissions

nondiamond carbon. UNCD grown in a HF reactor also has alow growth rate �0.2–0.4 �m h−1�, consistent with its re-duced substrate temperature during growth.
Figure 3 shows the root-mean-square �rms� roughness ofthe diamond surface for the different film types followinggrowth of 150 layers. Since renucleation and grain formationis not yet included in the model, this roughness value reflectsthe intrinsic atomic-scale roughness that results from the ran-dom nature of CVD growth. As expected, SCD is relativelysmooth on this scale �Fig. 4�a��, while NCD and UNCDfilms are much rougher �Fig. 4�b��.
The average surface-diffusion length, �, is defined as themean distance �measured in a straight line from its initialadsorption site� that a migrating species has traveled when itsmigration is permanently terminated by processes such asetching, attachment to the lattice, etc. Figure 5 shows � plot-ted for each of the different diamond growth conditions. As
expected, � decreases from a value of �2.2 sites for SCDgrowth to �1.25 sites for UNCD. This is evidence that mi-gration is a key mechanism by which the surface becomessmoother. Figure 6 emphasizes this idea, as it shows that thepercentage of the total growth that results from ER processes�direct adsorption/addition� increases from a low value of�28% for SCD to a much higher value of 48% for UNCD.Similarly, the percentage growth that results from LH pro-cesses �migration then addition� is very high for SCD �70%�,dropping to �46% for UNCD. Thus, migration-driven LHprocesses dominate for the smoother films �SCD, MCD�,while direct-adsorption-driven ER processes dominate forthe rougher films �UNCD�.
Another insight into the growth mechanism is revealedby Fig. 7, which shows the average number of migrationhops, n, made by the surface species for the different growthconditions. For UNCD, NCD, and MCD, n is of the order ofseveral hundred, and increases as the migration rate in-creases. This is consistent with our previous findings19 �al-though the n values are now approximately ten times smallerthan those calculated before due to the inclusion of the sur-face radical migration mechanism� and can be explained bymigrating species hopping back and forth between two adja-cent empty surface sites. Thus, for these conditions n is verylarge, while � remains low at �2 �see Fig. 5�. However, forSCD conditions n drops significantly to �130, and this co-incides with the films becoming smoother, as mentioned
FIG. 3. �Color online� The rms roughness of the various diamond filmsfollowing growth of 150 layers. A value of rms roughness of, say, twoblocks for growth of 150 layers means the surface had a mean height of150�2 blocks over a width of 300 blocks. Data are calculated for speciesconcentrations at the surface that were estimated using method B. Method Aproduced roughness values and trends very similar to these.
FIG. 4. �Color online� Simulated cross-sections of �100� diamond growthusing �a� SCD �MW reactor� and �b� UNCD �HF reactor� conditions, show-ing their relative surface roughness. The scale is 150 blocks �equivalent tocarbon atoms� high by 300 blocks wide.
FIG. 5. �Color online� Average surface diffusion length, �, calculated for thedifferent diamond growth conditions. Methods A and B produced similarresults.
FIG. 6. �Color online� Percentage of total diamond growth that resultedfrom Eley–Rideal-type �left, blue� and Langmuir–Hinshelwood-type �right,red� processes for the different diamond growth conditions. The small dif-ference between ER%+LH% and 100% is due to growth by other mecha-nisms such as insertions. Methods A and B produced similar results.
114909-10 May et al. J. Appl. Phys. 108, 114909 �2010�
Downloaded 10 Dec 2010 to 137.222.40.127. Redistribution subject to AIP license or copyright; see http://jap.aip.org/about/rights_and_permissions

above. Therefore, it appears that for these smoother filmsmigration is now able to proceed beyond the immediateneighbors to sites two or three atoms distant. The fraction ofavailable surface radical sites, F, changes from �4% to 10%for the different growth conditions, but not in a monotonicfashion. Thus, the steady-state number of surface radicalsites cannot account for these apparent differences in migra-tion behavior.
Further clues can be obtained from Fig. 8, which showsthe relative rates of surface H abstraction, and migrationrates of radicals and CH2 groups on the surface. For allgrowth conditions the rates of CH2 migration are roughlysimilar, as are the rates of SR migration except for the caseof SCD where the rate is markedly reduced due to the lowerTs. For MCD, NCD, and UNCD growth conditions, the rateof CH2 migration is greater than that of H abstraction bymore than two orders of magnitude. In these cases, CH2 mi-gration is limited by the rate at which existing surface radi-cals migrate across the surface, which is a function of �H�s
and especially Ts. However, for SCD conditions, theH-abstraction rate is now much larger than the SR migrationrate, and H abstraction now governs the rate of CH2 migra-tion. In this case the rapid rate of activation of the CH2
surface groups, not the surface radicals, is key to their in-creased migration rate and, therefore, to the overall growthprocess.
We have already inferred from Figs. 3 and 5 that surfaceroughness is related to �, and this can be quantified by plot-ting in Fig. 9 a graph of rms roughness against � for the setsof data obtained using the two methods for estimation of thespecies concentrations at the surface. This graph suggests alinear dependence of the approximate form: Roughness=�0-k�, where �0 is the ‘intrinsic roughness’ that would beobtained during diamond deposition if surface diffusion didnot occur. In other words, �0 can be thought of as the rough-ness value resulting from 100% ER growth. Taking the av-erage for the fitted gradients and intercepts for the two sets ofdata we find: �0�5 blocks and k�1.1. Conversely, assum-ing it is valid to extrapolate the straight lines in Fig. 9 tolarger �, and using the average values for k and �0 above, theequation predicts a perfectly flat surface �roughness=0� for adiffusion length of approximately four to five sites.
Previously, for MCD conditions, we found that�-scission reactions usually play only a small part in smooth-ing the film surface.19 Fig. 10 shows the relative importanceof �-scission for the different growth conditions. As ex-pected, �-scission remains a minority process for SCD con-ditions, where the migration rates are high enough thatblocks can migrate down off the top of two-block pillarsfaster than they can be removed by �-scission. However,
FIG. 7. �Color online� The average number of jumps, n, made by speciesmigrating on the surface for each of the different diamond growth condi-tions. Methods A and B produced similar results.
FIG. 8. �Color online� Rates of H abstraction �left, blue�, CH2 surface-migration �center, orange� and surface-radical migration �right, red� plottedon a common-logarithmic scale for the different diamond growth conditions.Methods A and B produced similar results.
FIG. 9. �Color online� The rms surface roughness for the different diamonddeposition conditions plotted against the surface diffusion length, �. The twosets of data are for the two different methods used to estimate the speciesconcentrations at the surface described in Sec. II A: Method A �red squares�and method B �blue diamonds�. There was typically �15% run-to-run varia-tion in the calculated values of roughness due to the random nature of theMonte Carlo procedure and these have been indicated as error bars.
FIG. 10. �Color online� Percentage of carbons added to the surface subse-quently removed by a �-scission reaction for the different diamond growthconditions. Methods A and B produced similar results.
114909-11 May et al. J. Appl. Phys. 108, 114909 �2010�
Downloaded 10 Dec 2010 to 137.222.40.127. Redistribution subject to AIP license or copyright; see http://jap.aip.org/about/rights_and_permissions

when the migration rates are slower, as in the case of MCD,NCD, and UNCD �or at low Ts�, �-scission starts to becomea significant loss mechanism for C species, and is respon-sible for removing between �2%–5% of the surface carbonsas well as helping to smooth the surface.
Figure 11 shows the percentage contribution to thegrowth made by the C1 insertion processes for each of thediamond deposition conditions. Although insertion by all C1
species is included, C atoms account for the majority �99%�of these reactions due to their high abundance relative to theother C1 species and high reaction probability, P �see TableII�. It can be seen that, as expected, for most conditions suchinsertion reactions play only a small role in growth, typicallycontributing �0.5% of the carbon atoms in the diamond lat-tice. The two cases �SCD and MCD� where there is an ap-parently large contribution are probably misleading, as thetwo methods �A and B� used to determine the species con-centrations at the surface in each case produce contradictoryvalues. When method A predicts a �5%–6% contribution,method B predicts �0.5%, and vice versa. This contradictionhighlights the need to develop a more accurate method toestimate these surface concentrations from existing modelsof the gas-phase chemistry. Perhaps, also, different methodsof estimating these concentrations may be more accurate ormore applicable than others for different growth systems�e.g., hot filament or MW plasma� and/or growth regimes.Nevertheless, the values in Fig. 11 suggest that C1 insertionreactions contribute, at most, 6% to the growth, but morelikely contribute much less than this. As a result, insertionreactions can usually be neglected when considering thebroader aspects of diamond growth, although they may stillplay an important role in defect formation and renucleation.
Figure 12 shows the percentage of adsorbed carbons thatwere subsequently removed from the surface by etching.This figure includes direct etching of both the migrating CH2
groups and sidewall etching. The values of 6%–13% are con-sistent with the experimental findings mentioned earlier,which is the expected result of the fitting factor of 0.1 used inEq. �6�. Figure 12 shows etching becomes less common withincreasing quality of diamond film. This is because we havenot included any dependence of etching upon growth param-eters �e.g., Ts or �H�s�, and therefore the etch rate simply
reflects the roughness of the surface. When the surface issmoother �as for SCD� there are less sidewalls to attack andthe etch-rate is reduced; when the surface is rougher �e.g.,UNCD� there are many more sidewalls and step-edges toattack and a corresponding increase in etch-rate.
The analysis we have presented until now has deliber-ately omitted the data for UNCD grown in a MW system�see Table I, last column�, because almost always theUNCD�MW� data did not fit the trend and/or gave anoma-lous behavior. Indeed, we commented previously15 that thecalculated gas phase concentrations for UNCD�MW� ap-peared inconsistent with our general diamond growth mecha-nism, and that the value for �d� calculated from the use ofthese concentrations predicted grain sizes of the order of mil-limeters rather than nm.
We previously had no clear explanation for this discrep-ancy, although we suggested that secondary growth pro-cesses that are not included in the growth model might besignificant. These could be factors such as unknown specificfeatures of the C-atom growth mechanism, or a possible in-creased rate of renucleation due to other hydrocarbon species�e.g., C2, C2H, C3, and C3H�. Using the UNCD�MW� valuesfrom Table I, method A, as inputs in the KMC program pre-dicts values for the rms surface roughness �3.3�, n ��640�and � �1.5�, which are more consistent with SCD growththan UNCD, although the predicted growth rate�0.03 �m h−1�, though small, is realistic. These values sug-gest that the discrepancy lies in the values for the gas phaseconcentrations, and not in the growth or KMC models. Oneobvious difference between the gas chemistry inUNCD�MW� growth conditions and all the other �MW orHF� conditions is in the number of observed gas phase par-ticulates. There are many reports that the plasmas used forUNCD�MW� growth produce a significant number of solidparticulates, with sizes ranging from 10−9 to 10−5 m. Thecomposition and nature of the particulates in these so-called“dusty” plasmas is not certain, but they are believed to besoot �amorphous or sp2 carbon�, polyaromatic hydrocarbons�PAHs�,33 fullerenes, or even nanodiamonds.34 They are be-lieved to be formed by homogeneous nucleation in the coolerparts of the chamber, such as around the periphery of theplasma ball, but can diffuse around the chamber and re-enter
FIG. 11. �Color online� Percentage contribution to growth by C1 insertionprocesses for the different diamond deposition conditions. Data are formethod A �right, red� and method B �left, blue�.
FIG. 12. �Color online� Percentage of carbons which are etched from thediamond surface for the different diamond deposition conditions. Methods Aand B produced similar results.
114909-12 May et al. J. Appl. Phys. 108, 114909 �2010�
Downloaded 10 Dec 2010 to 137.222.40.127. Redistribution subject to AIP license or copyright; see http://jap.aip.org/about/rights_and_permissions

the plasma ball whereupon they contribute to and perturb thechemical environment. Indeed, we have previously used thepresence of such particulates in the plasma ball to estimatethe gas temperature, as they absorb energy via collisions withother gas phase species, which they then emit as black-bodyradiation.35
The effect of particulates on UNCD�MW� depositionconditions has not been intensively studied to date. Despitethe apparent similarity in conditions, far fewer particulateshave been observed under UNCD�HF� conditions thanUNCD�MW�. There is a much smaller volume of hot gaspresent in a HF system �a few cubic millimeters at most�compared to that in a MW system ��100 cm3�. Also, inHFCVD reactors the temperatures are generally lower, andmethane conversion to C2H2 and heavy hydrocarbons �prob-able precursors of the particulates� is reduced. Under UN-CD�MW� conditions these particulates may reduce the elec-tron concentration because particles in the plasma canaccumulate large negative charge and increase the electrontemperature,34 and this may affect the heat balance in theplasma. But another major factor may be the large surfacearea that is now present within the hot plasma region andwhich is available for gas-surface reactions.
The soot particle nucleation rate has been estimated36 at�1011 nuclei cm−3 h−1 for Tg�1500 K in an Ar /H2 /CH4
�97:2:1� plasma. If such high rates could provide significantparticulate concentrations �say �108–109 cm−3� than therewill be an additional large surface �with area up to dozens ofsquare centimeters for particulate diameters of�10–100 nm� in the outer plasma regions duringUNCD�MW� growth. Various gas-surface reactions �e.g., Hatom recombination, loss of hydrocarbon species, ions� onsuch a large surface area may drastically change the plasma-chemistry and species concentrations. Our first calculationsinvolving the heterogeneous recombination of H atomsshowed that this produced a serious drop in H atom concen-tration, but that this did not disturb significantly the�H�s / �CHx�s �x=0–3� ratio, and, moreover, failed to providethe relevant conditions for UNCD growth.
The particulates are subject to diffusion and convectionwithin the chamber, and often deposit on many cold surfacesin the chamber, including the walls, viewport, and quartzwindow. There has been speculation that these particulatesmay also land onto the surface of the substrate and eitherhelp to nucleate diamond growth, or even be responsible fornanodiamond growth.37 However, we have never found anyevidence for the particulates depositing onto the hot substratesurface, although we cannot exclude that they may have de-posited and embedded in growing film, as has been observedfor SiC nanocrystalline film growth at substrate temperatures�350 °C.38
In favor of this mechanism we note that the gas-phaseconditions and reaction mechanisms in the peripheral shell ofthe plasma region �the location where the particulates arecommonly observed33� are replicated39 in the thin layer �fewmillimeters� above the substrate. �This was the assumptioninherent in one of the methods described earlier to estimatethe concentration of species at the surface�. Thus, intensiveformation of nanoparticles within this boundary layer and at
the substrate surface, e.g., from C2Hx, heavy hydrocarbonsCxHy �via the hydrogen-abstraction carbon-addition �HACA�mechanism40�, and/or charged species, is quite probable, andmay contribute to or be an essential part of the UNCD�MW�deposition mechanism in conventional Ar /H2 /CH4 MWplasma mixtures. The role of various processes involvingcharged species, i.e., deposition of positive ions CxHy
+, thecoagulation of negative particles to form charged clusterswhich have been described41 and observed in low-temperature plasmas42,43 needs to be studied in the context ofUNCD growth.
VI. CONCLUSIONS
Although defect formation and renucleation are not yetincluded in the growth model, the simple 1D KMC programpredicts reasonably successfully the growth rates and mor-phology trends for diamond films varying from UNCD toSCD. The intrinsic surface roughness has been shown to bedirectly related to the surface diffusion length, �. This isdetermined by the instantaneous availability of adjacent sur-face radical sites into which the migrating species can jump,which, in turn, is governed by the rates of surface-H abstrac-tion and of SR migration, both of which are ultimately de-termined by the substrate temperature and the H-atom con-centration at the surface. When these two rates are low,surface species simply hop back and forth between two ad-jacent sites many times, but never travel more than one ortwo sites from their original adsorption position. This leadsto predominantly ER growth with rough surfaces, consistentwith NCD or UNCD films. Conversely, when the rate of Habstraction and/or the rate of SR migration become highenough, the migrating species can hop more than one siteand begin to sample more of the surrounding area. This leadsto predominantly LH growth, smoother surfaces, and MCDor SCD films. The roughness values presented here are onthe atomic scale, and we predict that a maximum rms rough-ness of five atoms would occur for �=0, i.e., for pure ERgrowth. Conversely, atomically smooth films over very largeareas could be produced for ��5, but to achieve this wouldrequire an idealized system that could produce a very highratio of �H�s / �CHx�s �x=0–3� at the surface. Although re-nucleation and defect formation would modify this value,these findings nevertheless highlight the notion that for highquality SCD deposition we require extremely high H atomconcentrations.
An interesting conclusion from these studies is that de-spite the very different gas mixtures, temperatures and pro-cess conditions, used to deposit the four types of diamond,the growth process is dominated by only two species. Theflux of CH3 to the surface governs the growth rate while theflux of atomic H controls the rate of all surface reactions,including etch rate and mobility of adsorbed CH2 species,and hence surface roughness. The role of all other hydrocar-bon radicals �C, CH, CH2, C2, etc.� in the overall growthprocess is minimal due to their negligible concentrations atthe surface compared to that of CH3. The fact that thereappears to be no correlation between the relative contributionof insertion reactions to overall growth and crystal size, and
114909-13 May et al. J. Appl. Phys. 108, 114909 �2010�
Downloaded 10 Dec 2010 to 137.222.40.127. Redistribution subject to AIP license or copyright; see http://jap.aip.org/about/rights_and_permissions

that this contribution is minimal in all cases, suggests thatinsertion reactions are not a significant route to surface-defect formation and to subsequent renucleation events.Thus, the renucleation events that produce smaller grainsizes must arise from other mechanisms, such as surface re-structuring at biradical sites or misaligned bonding of themigrating CH2 species to step-edges. Identifying the cause ofsurface defects, and also which of these defects are the onesthat lead to renucleation26 will be a vital next step if we areto progress to model polycrystalline films.
Nanoparticle formation above and at the substrate sur-face from heavy hydrocarbons CxHy and/or charged speciesis proposed as being important during UNCD deposition inAr /H2 /CH4 MW-plasma mixtures. The effects of thesenanoparticles upon gas composition, reactions and tempera-tures require further study.
In future work we shall explore these implications fur-ther and investigate the effect of defect formation and re-nucleation upon the predicted growth rates and surface mor-phology. Converting the program to a full 2D geometry willalso help to shed light upon aspects of the growth that de-pend more critically upon the exact local surface morphol-ogy, such as the shape and size of the critical nucleus, kinks,and protrusions in step-edges, attachment of migrating blockto inside and outside corners, migration down risers, andpossible void formation.
ACKNOWLEDGMENTS
The authors wish to thank Mike Ashfold, Neil Fox, andKeith Rosser for useful discussions and suggestions. TheBristol-Moscow collaboration is supported by a Royal Soci-ety Joint Project Grant, and Y.A.M. acknowledges supportfrom the RF Government for Key Science, Schools GrantNo. 3322.2010.2.
1P. W. May, Science 319, 1490 �2008�.2P. W. May, Philos. Trans. R. Soc. London, Ser. A 358, 473 �2000�.3P. W. May, in Carbon Based Nanomaterials, edited by N. Ali, A. Öchsner,and W. Ahmed, �Trans Tech, Switzerland, 2010�, Chap. 6, pp. 145–176.
4D. G. Goodwin and J. E. Butler, in Handbook of Industrial Diamonds andDiamond Films, edited by M. A. Prelas, G. Popovici, and L. K. Bigelow�Marcel Dekker, New York, 1998�.
5S. J. Harris, Appl. Phys. Lett. 56, 2298 �1990�.6J. E. Butler, R. L. Woodin, L. M. Brown, and P. Fallon, Philos. Trans. R.Soc. London 342, 209 �1993�.
7K. Larsson, Phys. Rev. B 56, 15452 �1997�.8H. Kawarada, H. Sasaki, and A. Sato, Phys. Rev. B 52, 11351 �1995�.9S. Skokov, B. Weiner, M. Frenklach, T. Frauenheim, and M. Sternberg,Phys. Rev. B 52, 5426 �1995�.
10M. Frenklach and S. Skokov, J. Phys. Chem. B 101, 3025 �1997�.11M. Frenklach, S. Skokov, and B. Wiener, Nature �London� 372, 535
�1994�.12W. J. P. van Enckevort, G. Janssen, W. Vollenberg, J. J. Schermer, L. J.
Giling, and M. Seal, Diamond Relat. Mater. 2, 997 �1993�.
13A. Cheesman, J. N. Harvey, and M. N. R. Ashfold, J. Phys. Chem. A 112,11436 �2008�.
14K. Larsson and J.-O. Carlsson, Phys. Status Solidi A 186, 319 �2001�.15P. W. May and Yu. A. Mankelevich, J. Phys. Chem. C 112, 12432 �2008�.16A. Netto and M. Frenklach, Diamond Relat. Mater. 14, 1630 �2005�.17P. W. May, N. L. Allan, J. C. Richley, M. N. R. Ashfold, and Yu. A.
Mankelevich, J. Phys.: Condens. Matter 21, 364203 �2009�.18P. W. May, N. L. Allan, M. N. R. Ashfold, J. C. Richley, and Yu. A.
Mankelevich, Diamond Relat. Mater. 19, 389 �2010�.19P. W. May, J. N. Harvey, N. L. Allan, J. C. Richley, and Yu. A. Man-
kelevich, J. Appl. Phys. 108, 014905 �2010�.20J. C. Richley, J. N. Harvey, and M. N. R. Ashfold, in Diamond Electronics
and Bioelectronics—Fundamentals to Applications III, MRS SymposiaProceedings No. 1203, edited by P. Bergonzo, J. E. Butler, R. B. Jackman,K. P. Loh, and M. Nesládek �Materials Research Society, Pittsburgh,2010�, pp. J17–J32.
21Y. A. Mankelevich, A. T. Rakhimov, and N. V. Suetin, Diamond Relat.Mater. 5, 888 �1996�.
22Yu. A. Mankelevich, M. N. R. Ashfold, and J. Ma, J. Appl. Phys. 104,113304 �2008�.
23See supplementary material at http://dx.doi.org/10.1063/1.3516498 for thegas-phase concentrations calculated for a selected subset of the speciesnear the growing diamond surface during CVD for SCD, MCD, NCD, andUNCD�HF� growth conditions.
24A. D. Terekhov and E. N. Frolova, J. Appl. Mech. Tech. Phys. 13, 582�1974�.
25M. Eckert, E. Neyts, and A. Bogaerts, Cryst. Eng. Comm. 11, 1597�2009�.
26M. Eckert, E. Neyts, and A. Bogaerts, Cryst. Growth Des. 10, 3005�2010�.
27S. J. Klippenstein, Y. Georgievskii, and L. B. Harding, Phys. Chem.Chem. Phys. 8, 1133 �2006�.
28R. E. Rawles, S. F. Komarov, R. Gat, W. G. Morris, J. B. Hudson, and M.P. D’Evelyn, Diamond Relat. Mater. 6, 791 �1997�.
29J. C. Richley, Ph.D. thesis, University of Bristol �in preparation�.30J. Achard, F. Silva, O. Brinza, X. Bonnin, V. Milne, R. Issaoui, M. Kasu,
and A. Gicquel, Phys. Status Solidi A 206, 1949 �2009�.31J. C. Richley, J. N. Harvey, and M. N. R. Ashfold, J. Phys. Chem. A 113,
11416 �2009�.32A. B. Bortz, M. H. Kalos, and J. L. Lebowitz, J. Comput. Phys. 17, 10
�1975�.33K. Hassouni, F. Mohasseb, F. Bénédic, G. Lombardi, and A. Gicquel, Pure
Appl. Chem. 78, 1127 �2006�.34T. Gries, L. Vandenbulcke, J. N. Rouzaud, and S. de Persis, Plasma
Sources Sci. Technol. 19, 025015 �2010�.35O. J. L. Fox, J. Ma, P. W. May, M. N. R. Ashfold, and Yu. A. Man-
kelevich, Diamond Relat. Mater. 18, 750 �2009�.36N. Aggadi, C. Arnas, F. Bénédic, C. Dominique, X. Duten, F. Silva, K.
Hassouni, and D. M. Gruen, Diamond Relat. Mater. 15, 908 �2006�.37N.-M. Hwang, I.-D. Jeon, and D.-Y. Kim, J. Ceramic Proc Res. 1, 34
�2000�.38U. Kortshagen, J. Phys. D: Appl. Phys. 42, 113001 �2009�.39J. Ma, A. Cheesman, M. N. R. Ashfold, K. G. Hay, S. Wright, N. Lang-
ford, G. Duxbury, and Y. A. Mankelevich, J. Appl. Phys. 106, 033305�2009�.
40M. Frenklach, Phys. Chem. Chem. Phys. 4, 2028 �2002�.41Yu. A. Mankelevich, M. A. Olevanov, and T. V. Rakhimova, Plasma
Sources Sci. Technol. 17, 015013 �2008�.42Yu. A. Mankelevicha, M. A. Olevanov, A. F. Pal’, T. V. Rakhimova, A.N.
Ryabinkin, A. O. Serov, and A. V. Filippov, Plasma Phys. Rep. 35, 191�2009�.
43R. Basner, F. Sigeneger, D. Loffhagen, G. Schubert, H. Fehske, and H.Kersten, New J. Phys. 11, 013041 �2009�.
114909-14 May et al. J. Appl. Phys. 108, 114909 �2010�
Downloaded 10 Dec 2010 to 137.222.40.127. Redistribution subject to AIP license or copyright; see http://jap.aip.org/about/rights_and_permissions