simulations of ion permeation through a potassium channel
TRANSCRIPT
Simulations of Ion Permeation Through a Potassium Channel: MolecularDynamics of KcsA in a Phospholipid Bilayer
Indira H. Shrivastava and Mark S. P. SansomLaboratory of Molecular Biophysics, Department of Biochemistry, University of Oxford, Oxford OX1 3QU, United Kingdom
ABSTRACT Potassium channels enable K1 ions to move passively across biological membranes. Multiple nanosecond-duration molecular dynamics simulations (total simulation time 5 ns) of a bacterial potassium channel (KcsA) embedded in aphospholipid bilayer reveal motions of ions, water, and protein. Comparison of simulations with and without K1 ions indicatethat the absence of ions destabilizes the structure of the selectivity filter. Within the selectivity filter, K1 ions interact with thebackbone (carbonyl) oxygens, and with the side-chain oxygen of T75. Concerted single-file motions of water molecules andK1 ions within the selectivity filter of the channel occur on a 100-ps time scale. In a simulation with three K1 ions (initially twoin the filter and one in the cavity), the ion within the central cavity leaves the channel via its intracellular mouth after ;900 ps;within the cavity this ion interacts with the Og atoms of two T107 side chains, revealing a favorable site within the otherwisehydrophobically lined cavity. Exit of this ion from the channel is enabled by a transient increase in the diameter of theintracellular mouth. Such “breathing” motions may form the molecular basis of channel gating.
INTRODUCTION
Ion channels play a key role in the electrical activity ofexcitable cells (Hille, 1992), enabling passive movement ofions across membranes. Ions move at high rates (;107 ionss21 channel21), and yet channels can be highly selective asto which ions may pass. Furthermore, channels are gated,i.e., they open and close in response to changes in trans-membrane voltage and/or ligand binding to the channelprotein. In the membranes of excitable cells potassium (K)selective channels are responsible for the repolarizing phaseof action potentials and for controlling membrane excitabil-ity. Furthermore, potassium channels play diverse roles in awide range of cells, in organisms ranging from bacteria toplants and animals. In particular, certain potassium channels(so-called “background” K channels; Maingret et al., 1999)seem to be responsible for the passive permeability of cellmembranes to K1 ions, which is central to generation of avoltage difference across cell membranes. Despite this di-versity of function, potassium channels seem to share acommon pore-lining domain, composed of four repeats of amotif made up of two transmembrane (TM) helices flankinga re-entrant P-loop which carries the main determinants ofion selectivity (MacKinnon et al., 1998; Miller, 1991).
The structure of a bacterial potassium channel (KcsAfrom Streptomyces lividans;Schrempf et al., 1995) has beensolved by x-ray diffraction at 0.32 nm resolution (Doyle etal., 1998). Given the conservation of the pore-lining domainbetween the various potassium channels, this structure pro-vides a framework within which to understand K1 selectiv-ity and permeation. However, a crystal structure inevitably
provides a static, spatially and temporally averaged imageof a channel. To bridge the gap between molecular structureand physiological behavior an understanding of the atomicresolution dynamics of potassium channels is required. Oneway in which to approach this is via simulation studies. Thisapproach complements, continuum electrostatics calcula-tions (Roux and MacKinnon, 1999) by providing a moredynamic image of channel function.
Molecular dynamics (MD) simulations enable one toexplore the motions of biomolecules on a picosecond-to-multinanosecond time scale (Brooks et al., 1988; Daura etal., 1998; Duan and Kollman, 1998; McCammon and Har-vey, 1987; van Gunsteren and Mark, 1992). In particular, itis now possible to simulate fully solvated lipid bilayers in arealistic fashion (Jakobsson, 1997; Tieleman et al., 1997;Tobias et al., 1997). Simulations of pure lipid bilayers havebeen extended to simulations of lipid bilayers containingTM peptides (Belohorcova et al., 1997; Berne`che et al.,1998; Biggin and Sansom, 1998; Chiu et al., 1999; Forrestet al., 1999; Roux and Woolf, 1996; Shen et al., 1997;Tieleman et al., 1999c; Woolf and Roux, 1994), assembliesof TM peptides (Tieleman et al., 1999a), or large integralmembrane proteins (Tieleman and Berendsen, 1998). Thesesimulations allow one to explore the conformational dynam-ics of membrane-spanning peptides and proteins, and theirinteractions with their environment (Tieleman et al., 1999b)in some detail.
MD simulations of channel proteins also provide consid-erable information on channel/ion/water interactions. Pio-neering studies that applied this approach to model channelsformed by gramicidin (Chiu et al., 1996, 1999; Roux andKarplus, 1994) have since been extended to channelsformed bya-helix bundles such as alamethicin (Tieleman etal., 1999a) or synthetic channel-forming peptides (Randa etal., 1999; Zhong et al., 1998b, c). To fully exploit the powerof simulations to understand the energetics and dynamics of
Received for publication 22 July 1999 and in final form 4 November 1999.
Address reprint requests to Mark S. P. Sansom, Laboratory of MolecularBiophysics, Department of Biochemistry, The Rex Richards Building,South Parks Road, University of Oxford, Oxford OX1 3QU, UK. Tel.:144-1-865-275371; Fax:144-1-865-275182; E-mail: [email protected].
© 2000 by the Biophysical Society
0006-3495/00/02/557/14 $2.00
557Biophysical Journal Volume 78 February 2000 557–570

ion channels it is important to include as complete a repre-sentation as possible of the anisotropic environment pro-vided by a lipid bilayer. A fist approximation to simulationin a lipid bilayer may be obtained via simulation in anoctane “slab,” which is solvated on either side and intowhich the membrane protein is inserted. This approach hasbeen used by Klein and colleagues to study a number of ionchannels formed by bundles of peptide helices (Zhong et al.,1998a–c) and more recently has been extended to KcsA(Guidoni et al., 1999). However, it is feasible to represent alipid bilayer explicitly in such simulations (Chiu et al.,1999). This is important, as both the presence of lipidheadgroups and the fluidity properties of a lipid bilayer(which may differ significantly from those of an isotropicsolvent such as octane) may influence the dynamic proper-ties of the embedded channel. Indeed, some such differ-ences have been suggested by comparison of the behavior ofsimple peptide channels simulated in an octane slab (Zhonget al., 1998b, c) and in a phospholipid bilayer (Randa et al.,1999).
In this paper we present several simulations of a potas-sium channel (KcsA) embedded in a phospholipid bilayer.In our analysis of these simulation we focus on movementsof K1 ions and water through the central pore. Each of ourfive simulations is of 1 ns duration. This is about an orderof magnitude shorter than the mean time for passage of anion through a channel (;15 ns for a 100 pS conductancechannel at 100 mV transbilayer voltage). Thus one mayhope to capture some aspects of ion permeation, althoughlonger simulations will be required for proper statisticalsampling. Indeed, to fully address all aspects of ion perme-ation it may be necessary, in addition to MD simulations, torun longer-time scale coarse-grained simulations usingmethods such as Brownian dynamics (Bek and Jakobsson,1994).
The structure of KcsA is that of a truncated cone, with acentral pore running down the center (Fig. 1). The wider endof the cone corresponds to the extracellular mouth of thechannel. This contains a selectivity filter that is formed bya TVGYG sequence motif characteristic of potassium chan-nels. In the x-ray structure this adopts an irregular confor-mation, and binds two K1 ions plus an intervening watermolecule. Beneath the selectivity filter is a central water-filled cavity, which also appears to contain a (looselybound) cation in the x-ray structure. Finally, the pore con-stricts at its intracellular mouth to form a putative gateregion where the pore radius falls to;0.11 nm (i.e., lessthan the Pauling radius of a K1 ion, 0.13 nm). Our simu-lations reveal a concerted movement of water molecules andK1 ions within the selectivity filter, and suggest howbreathing motions of the channel protein (on a;0.1-ns timescale) may transiently open the intracellular gate, allowinga K1 ion to leave the channel.
METHODS
Simulation systems
All simulations started from the same protein structure and bilayer model.The protein structure was that in PDB file1bl8, with the modification thatatoms for all side chains were included. The “missing” residues were addedby building in stereochemically preferred conformers. Although notpresent in the x-ray structure, an inter-subunit salt bridge (D80 to R89) wasformed during the early stages of the simulations. Note that residues 1–22and 120–160 are missing from this model, which therefore represents thecore channel-forming domain of the protein. A fully equilibrated palmitoyloleoyl phosphatidylcholine (POPC) lipid bilayer (kindly provided by Dr.Peter Tieleman) was used as the starting point for generating the phospho-lipid bilayer into which KcsA was embedded (see below).
Five simulations were performed, differing in the number and locationsof K1 ions in the initial model. In describing these models we will use theion/water site nomenclature defined in Fig. 1A. Thus, sites S1 to S4 makeup the selectivity filter and site C is that near the center of the cavity. In thex-ray structure, sites S1 and S3 or S4 are occupied by a cation, while S2 isoccupied by a water molecule. In the subsequent discussions this water willbe referred to as the “crystallographic” water molecule, W1. In simulationMDK0 no K1 ions were included, either in the selectivity filter or in thecavity. In MDK1, a single K1 ion (henceforth referred to as K1) wasincluded at site S1 (Fig. 1). In MDK2, two K1 ions (K1 and K2) wereincluded at sites S1 and S3, with the crystallographic water at S2. Insimulation MDK29 the second ion (K2) occupied site S4. Thus MDK2 andMDK29 correspond to the two alternative configurations of ion found in thex-ray structure, in which sites S3 and S4 exhibit partial occupancy (Doyleet al., 1998). Simulation MDK3 started from the same structure as MDK2,except for a further ion (K3) in the cavity.
Setup of simulations
The simulation methodology was similar to that used in MD simulations ofthe bacterial porin OmpF (Tieleman and Berendsen, 1998), of a channelformed by alamethicin (Tieleman et al., 1999a), and of channels formed bya synthetic peptide (Randa et al., 1999), all of which have yielded reason-able correlations with experimental data. In the latter two studies a pre-existing equilibrated POPC bilayer was used, into which a cylindrical holewas introduced, by a combination of removing a small number of lipidmolecules and running a short MD simulation with a radially actingrepulsive force in order to drive any remaining lipid atoms out of thecylinder into the bilayer. The channel molecule was then embedded withinthe hole thus created. A similar protocol was adopted in this study.However, the more asymmetric shape of KcsA required that after embed-ding the protein, a somewhat longer preparatory MD simulation wasneeded to re-pack lipid molecules around the protein (see below). Thus, theKcsA channel (containing four subunits each of 97 residues) was embed-ded in a lipid bilayer containing 243 POPC molecules (116 in the upper,i.e., extracellular, leaflet and 127 in the lower, i.e., intracellular, leaflet).This provided a difference in lipid surface area between the two leafletsapproximately equivalent to the difference in cross-sectional area of KcsAat the extracellular and intracellular end of the molecule. The ions and/orcrystallographic water were then added. The resultant system was solvatedwith ;10,000 SPC water molecules, giving a total of;42,000 atoms.Upon solvation we observed the cavity to contain from 15 to 18 watermolecules. This was in agreement with a calculation of the cavity volumebased on integration of the pore radius profile, and was robust to eithersmall changes in van der Waals radii of the waters or to use of eitherstandard GROMACS or CHARMM solvation procedures (Shrivastava andRanatunga, unpublished results). All ionizable residues were in their de-fault protonation state. Sufficient Cl2 ions (from four (MDK0) to seven(MDK3)) were added to the bulk solvent on either side of the bilayer togive a net charge of zero. These ions replaced water molecules at the
558 Shrivastava and Sansom
Biophysical Journal 78(2) 557–570

positions of lowest Coulomb potential. This was done by removal ofsuccessive water molecules, one at a time, and calculation of the Coulom-bic interaction energy of a Cl2 ion at that position with the remainder of thesystem.
Following setup of the system close packing of the protein molecule andthe phospholipids was achieved by a 100-ps simulation, during which theprotein atoms were fixed and a lateral pressure of 500 bar was applied.Having thus embedded the protein in the bilayer, the protein and potassiumion coordinates were restrained during a further 100-ps equilibration periodduring which no excess lateral pressure was applied and lipids and waterwere free to move. Finally, all restraints were removed during the subse-quent 1-ns production runs.
Simulation methodology
MD simulations were run using GROMACS (http://rugmd0.chem.rug.nl/;gmx/gmx.html). A twin range cutoff was used for longer-range interac-
tions: 1.0 nm for van der Waals interactions and 1.7 nm for electrostaticinteractions. The time step was 2 fs, with the LINCS algorithm to constrainbond lengths. We used NPT conditions in the simulation. A constantpressure of 1 bar independently in all three directions was used, with acoupling constant oftp 5 1.0 ps (Berendsen et al., 1984). Water, lipid, andprotein were coupled separately to a temperature bath at 300 K, using acoupling constanttT 5 0.1 ps. MD simulations were performed on an80-node SGI Origin 2000, typically taking;10 days of cpu time on eightR10000 processors.
The lipid parameters were as in previous MD studies of DPPC bilayers(Berger et al., 1997; Marrink et al., 1998) (with the addition of someGROMOS parameters for the double bond in the acyl tail), and as inprevious MD simulations of Alm (Tieleman et al., 1999a, c). These lipidparameters give good reproduction of the experimental properties of aDPPC bilayer. The lipid-protein interactions used GROMOS parameters.The water model used was SPC (Berendsen et al., 1981), which has beenshown to be a reasonable choice for lipid bilayer simulations (Tieleman
FIGURE 1 Overview of simulations. (A) Location of the ion sites within the channel structure. On the left-hand side a diagram of the selectivity filter(T75VGY78) is given (for simplicity, only two subunits are shown) along with the ion (and water) binding sites defined in the x-ray structure. Sites S1–S4form the selectivity filter region and are defined by the O atoms. The cavity site C is also shown. The right-hand side of the diagram defines the locationsof the K1 ions and crystallographic water molecule included in the initial configurations of the simulations. Note that those sites not occupied by a K1
ion or crystallographic water may become occupied by water molecules during the solvation stage of the simulation setup procedure. The ions are namedK1, K2, and K3 according to their initial locations. This nomenclature will be used throughout the discussion of the simulations. (B) Three snapshots ofsimulation MDK3. Two subunits (B and D) of the four that make up the KcsA channel are shown, plus the three K1 ions (K1, K2, and K3). The M1 helix,P-region, and M2 helix are shown as red, green, and blue ribbons, respectively. The backbone of the selectivity filter and the side chains of T75 and T107are shown as individual bonds between atoms. The horizontal white dotted lines indicate the approximate position of the phospholipid headgroups, and thevertical blocks to the left of the diagram indicate the extent (along the pore axisz) of the selectivity filter (s;green), central cavity (c;gray), and gate (g;blue) regions. The snapshots correspond to the start of the simulation (100 ps), late in the simulation just before ion K3 leaves the pore (850 ps) and atthe end of the simulation when K3 is on the intracellular side of the membrane (1100 ps). Comparing 100 ps and 850 ps one can see the concerted movementof K1 and K2 between sites of the selectivity filter, and the movement of K3 deeper into the cavity to interact with one of the T107 side chains. Comparing850 ps and 1100 ps one can see the gradual movement of K2 toward the cavity and the exit of K3 through the intracellular mouth of the pore.
Potassium Channel Simulations 559
Biophysical Journal 78(2) 557–570

and Berendsen, 1996). The K1 parameters (kindly supplied by Dr. PeterTieleman) were as in Straatsma and Berendsen (1988).
Structural diagrams were prepared using Molscript (Kraulis, 1991) andRaster3D (Merritt and Bacon, 1997). Pore radius profiles were calculatedusing HOLE (Smart et al., 1993). Secondary structure analysis used DSSP(Kabsch and Sander, 1983). Other analyses used GROMACS and/or lo-cally written code.
RESULTS
Drift, fluctuations, and secondary structure
Analysis of the all-atom RMSD (root-mean-square devia-tion) versus time revealed a similar pattern for each of thefive simulations, namely an initial jump (over;100 ps) toan RMSD of 0.2 nm, followed by little further drift over thenext few hundred picoseconds to a plateau value of;0.25nm, which is maintained throughout the rest of the simula-tion (Fig. 2). This is typical of MD simulations of a mem-brane protein in a bilayer (see, e.g., Tieleman and Be-rendsen, 1998). The initial jump in RMSD is presumed toreflect relaxation of the protein upon transfer from a crystalto a bilayer environment and/or inaccuracies in the potentialfunction. There was no significant difference in overall
RMSD among the five different simulations, suggesting thatthe presence/absence of K1 ions does not influence theoverall conformational stability of the protein.
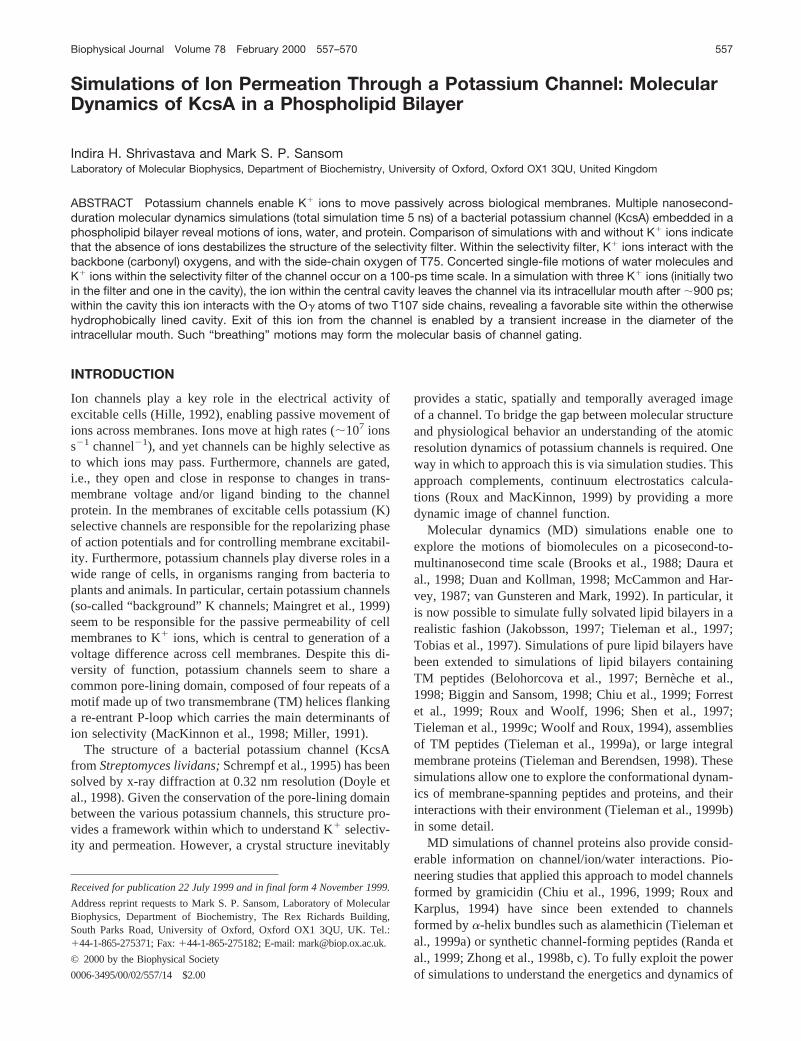
Identification of the more flexible regions of a proteinduring a simulation may be obtained via examination of theroot-mean-square fluctuation (RMSF) of the Ca atom ofeach residue from its time-averaged position (Fig. 3). Sim-ilar overall patterns of RMSF versus residue number wereseen for all five simulations, with the fluctuations rangingfrom 0.05 to 0.25 nm. The peaks in the Ca RMSF values aregenerally observed at the N- and C-termini of each subunitand in the extracellular surface loops on either side of theP-region. These residues have the largest B-factors in thecrystal structure. In particular, the loop between the M1helix and the P helix (i.e., the “turret” loop) seems tofluctuate most markedly. As this loop is oriented away fromthe rest of the protein, toward the surrounding solvent, it isnot unreasonable that it shows the greatest mobility. Com-parison of the five simulations shows no major difference.All exhibit Ca RMSF values of;0.05 nm for the cores ofthe M1 and M2 helices. However, there is some suggestionof greater fluctuations in the selectivity filter residues forsimulations MDK0 and MDK1 compared to MDK2,MDK29, and MDK3 (see below).
FIGURE 2 Drift of protein struc-ture from the initial model. The root-mean-square deviation (RMSD) ofall protein atoms of KcsA from thestarting structure is shown as a func-tion of time for all five simulations.(Note that these and subsequentgraphs start at 100 ps, as during 0 to100 ps the protein coordinates wererestrained.)
560 Shrivastava and Sansom
Biophysical Journal 78(2) 557–570
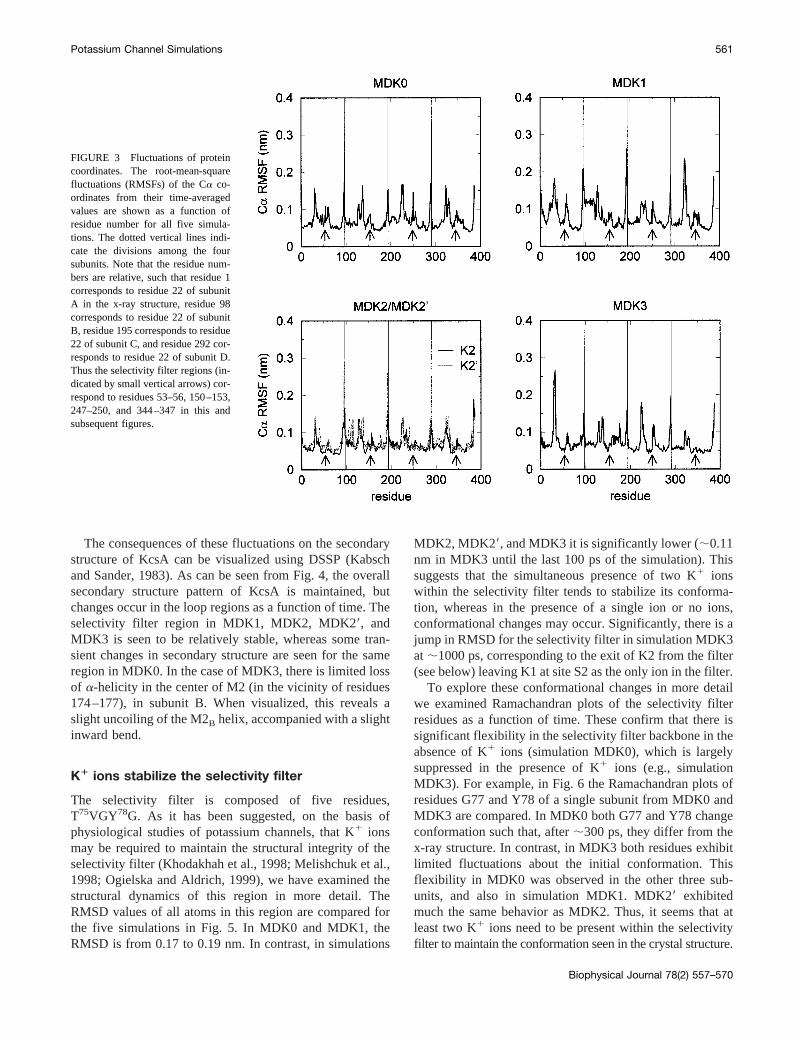
The consequences of these fluctuations on the secondarystructure of KcsA can be visualized using DSSP (Kabschand Sander, 1983). As can be seen from Fig. 4, the overallsecondary structure pattern of KcsA is maintained, butchanges occur in the loop regions as a function of time. Theselectivity filter region in MDK1, MDK2, MDK29, andMDK3 is seen to be relatively stable, whereas some tran-sient changes in secondary structure are seen for the sameregion in MDK0. In the case of MDK3, there is limited lossof a-helicity in the center of M2 (in the vicinity of residues174–177), in subunit B. When visualized, this reveals aslight uncoiling of the M2B helix, accompanied with a slightinward bend.
K1 ions stabilize the selectivity filter
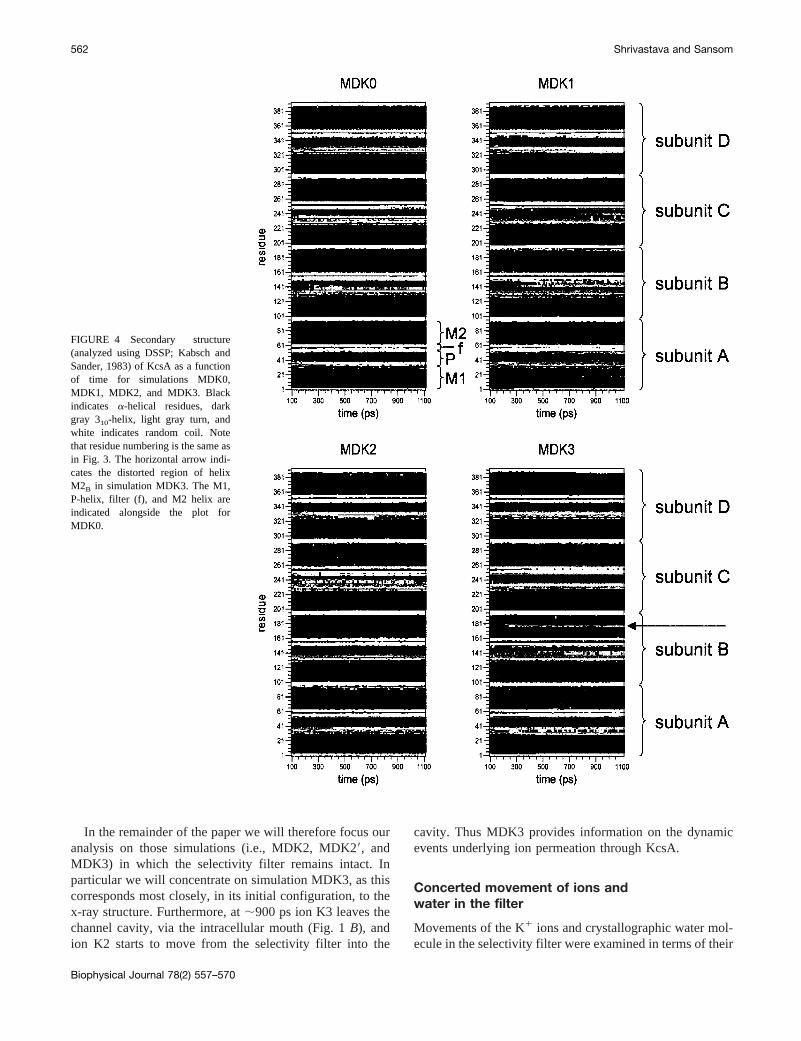
The selectivity filter is composed of five residues,T75VGY78G. As it has been suggested, on the basis ofphysiological studies of potassium channels, that K1 ionsmay be required to maintain the structural integrity of theselectivity filter (Khodakhah et al., 1998; Melishchuk et al.,1998; Ogielska and Aldrich, 1999), we have examined thestructural dynamics of this region in more detail. TheRMSD values of all atoms in this region are compared forthe five simulations in Fig. 5. In MDK0 and MDK1, theRMSD is from 0.17 to 0.19 nm. In contrast, in simulations
MDK2, MDK29, and MDK3 it is significantly lower (;0.11nm in MDK3 until the last 100 ps of the simulation). Thissuggests that the simultaneous presence of two K1 ionswithin the selectivity filter tends to stabilize its conforma-tion, whereas in the presence of a single ion or no ions,conformational changes may occur. Significantly, there is ajump in RMSD for the selectivity filter in simulation MDK3at ;1000 ps, corresponding to the exit of K2 from the filter(see below) leaving K1 at site S2 as the only ion in the filter.
To explore these conformational changes in more detailwe examined Ramachandran plots of the selectivity filterresidues as a function of time. These confirm that there issignificant flexibility in the selectivity filter backbone in theabsence of K1 ions (simulation MDK0), which is largelysuppressed in the presence of K1 ions (e.g., simulationMDK3). For example, in Fig. 6 the Ramachandran plots ofresidues G77 and Y78 of a single subunit from MDK0 andMDK3 are compared. In MDK0 both G77 and Y78 changeconformation such that, after;300 ps, they differ from thex-ray structure. In contrast, in MDK3 both residues exhibitlimited fluctuations about the initial conformation. Thisflexibility in MDK0 was observed in the other three sub-units, and also in simulation MDK1. MDK29 exhibitedmuch the same behavior as MDK2. Thus, it seems that atleast two K1 ions need to be present within the selectivityfilter to maintain the conformation seen in the crystal structure.
FIGURE 3 Fluctuations of proteincoordinates. The root-mean-squarefluctuations (RMSFs) of the Ca co-ordinates from their time-averagedvalues are shown as a function ofresidue number for all five simula-tions. The dotted vertical lines indi-cate the divisions among the foursubunits. Note that the residue num-bers are relative, such that residue 1corresponds to residue 22 of subunitA in the x-ray structure, residue 98corresponds to residue 22 of subunitB, residue 195 corresponds to residue22 of subunit C, and residue 292 cor-responds to residue 22 of subunit D.Thus the selectivity filter regions (in-dicated by small vertical arrows) cor-respond to residues 53–56, 150–153,247–250, and 344–347 in this andsubsequent figures.
Potassium Channel Simulations 561
Biophysical Journal 78(2) 557–570
In the remainder of the paper we will therefore focus ouranalysis on those simulations (i.e., MDK2, MDK29, andMDK3) in which the selectivity filter remains intact. Inparticular we will concentrate on simulation MDK3, as thiscorresponds most closely, in its initial configuration, to thex-ray structure. Furthermore, at;900 ps ion K3 leaves thechannel cavity, via the intracellular mouth (Fig. 1B), andion K2 starts to move from the selectivity filter into the
cavity. Thus MDK3 provides information on the dynamicevents underlying ion permeation through KcsA.
Concerted movement of ions andwater in the filter
Movements of the K1 ions and crystallographic water mol-ecule in the selectivity filter were examined in terms of their
FIGURE 4 Secondary structure(analyzed using DSSP; Kabsch andSander, 1983) of KcsA as a functionof time for simulations MDK0,MDK1, MDK2, and MDK3. Blackindicates a-helical residues, darkgray 310-helix, light gray turn, andwhite indicates random coil. Notethat residue numbering is the same asin Fig. 3. The horizontal arrow indi-cates the distorted region of helixM2B in simulation MDK3. The M1,P-helix, filter (f), and M2 helix areindicated alongside the plot forMDK0.
562 Shrivastava and Sansom
Biophysical Journal 78(2) 557–570
z-coordinates as a function of time (Fig. 7). At first site itappears that K1, W1, and K2 simply remain in the filterthroughout all three simulations. Closer examination revealsa subtler pattern, corresponding to a concerted, single-filemotion of ions and water. For example, in MDK3 at;350ps ions K1 (initially at site S1) and K2 (initially at site S3)both move one site down the selectivity filter to sites S2 andS4, respectively. These movements are in concert with oneanother, and with that of the intervening crystallographicwater from site S2 to S3. In simulation MDK2, the move-ments of the two ions are similar to those of K1 and K2 inMDK3, but occur at;150 ps. In MDK29 there is a com-parable transition at;830 ps, when K1 moves from S1 toS2 and the water from S2 to S3. (Note that before thistransition there is a “vacuum” between the water and K2. Itis possible that in the x-ray structure, when an ion is at S4,there is a second water at S3. This is being explored infurther simulations; Shrivastava and Sansom, unpublishedresults). In contrast, in MDK1 (data not shown), the singleK1 ion makes an initial jump from site S1 to S2, where itthen remains for nearly 1 ns. Snapshots of MDK3 at earlyand late stages in the simulation (Fig. 8) show that in additionto the crystallographic water initially at site S2, a water mol-ecule initially at the extracellular entrance to the selectivityfilter moves to site S1 to replace K1. Thus, there is concerted
movement of a water-K1-water-K1 column through the filteron a time scale of several hundred picoseconds.
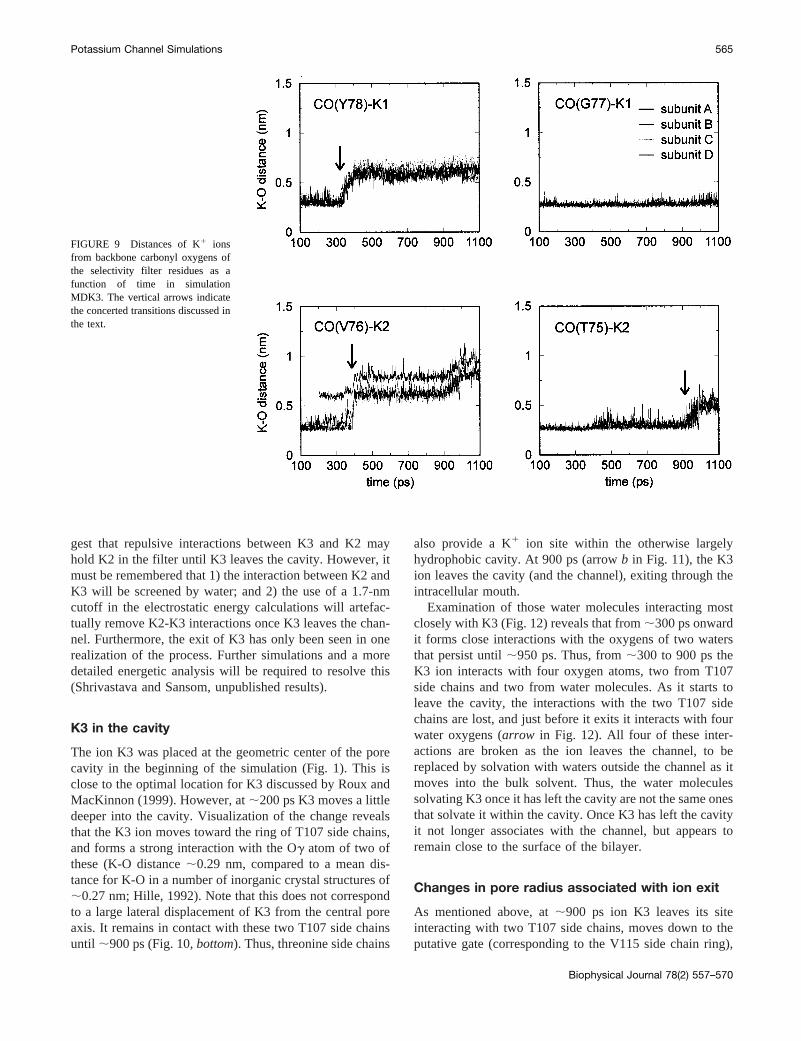
Examination of Fig. 8 also suggests subtle changes inbackbone conformation to maintain optimal interactionsbetween the K1 ions and the carbonyl oxygens (CO) of thefilter. The close association of ions K1 and K2 with thecarbonyl oxygens of the filter can be seen in Fig. 9. Thus,while the CO(78)-K1 distance increases (i.e., there is loss ofa favorable interaction) at;350 ps, the CO(77)-K1 distanceremains almost constant at a value of;0.27 nm (i.e., themean value of the K-O distance in a number of smallmolecule crystal structures; Hille, 1992). Shortly after thistransition, the CO(76)-K2 distance increases, as K2 movesfrom site S3 to S4. Similarly to CO(77)-K1, the CO(75)-K2distance remains close to its optimal value during thistransition. This remains the case until;930 ps, when K2leaves site S4 to be replaced by a water molecule. Incombination with the structures shown in Fig. 8, thesedistances suggest that the rings of carbonyl oxygens ofresidues G77 and T75 distort slightly to track the single filemotions of the ions.
It is not only the backbone carbonyl oxygen atoms thatplay a role in solvating K1 ions in the selectivity filter. TheOg atoms of the T75 side chains at the bottom of the filter,adjacent to the cavity, play an important role in helping to
FIGURE 5 Drift of the selectivityfilter structure from the initial model.The RMSD of all atoms of the selec-tivity filter (T 75VGY78) from itsstarting structure is shown as a func-tion of time for all five simulations.
Potassium Channel Simulations 563
Biophysical Journal 78(2) 557–570

form site S4. As can be seen in Fig. 10,top, when theconcerted motion of the K1 ions and water takes place at;350–400 ps, the distance from all four Og(T75) atoms toK2 drops to;0.29 nm, indicating that the ion sits within aring of threonine side chains. There is also a change in theconformation of the T75 side chains. Their Hg atoms areinitially directed toward the pore to interact with the oxygenatom of a water at or close to site S4 (Fig. 8;t 5 100 ps),but they rotate away from the pore when a K1 ion occupiesthe same site (Fig. 8;t 5 850 ps). Such a conformationalchange of channel-lining threonine side chains in responseto a permeant cation had been suggested by earlier theoret-ical studies (Sansom, 1992), and is also seen for the ion inthe cavity (see below).
Closer examination of the trajectories of water and K1
ions along the pore axis for simulation MDK3 (Fig. 11)reveals further changes at the selectivity filter that appear tobe coupled to the exit of ion K3 from the channel at;900ps (see below). Exit of K3 appears to result in a perturbation
of K2 such that it leaves site S4 and moves into the upperend of the cavity. It is replaced by a water molecule (W3 inFig. 11), which then occupies site S4. Thus, at 1100 ps theconfiguration within the selectivity filter is water-K1-water-water (for sites S1-S2-S3-S4, respectively). This might sug-
FIGURE 8 The selectivity filter at 100 ps and 850 ps in simulationMDK3, showing the concerted motion of ions and water. At 100 ps thereis a water molecule (dark gray/white) just extracellular to the filter (top ofdiagram), K1 ions (pale gray) at sites S1 and S3, and water molecules atsite S2 and just below site S4. At 850 ps there are water molecules at sitesS1 and S3 and just below site S4, and K1 ions at sites S2 and S4. Thepeptide backbone of the filter and the T75 side chains are shown (forsubunits A and C only, for clarity).
FIGURE 6 Backbone torsion angle dynamics in the selectivity filter.Ramachandran plots of residues G77 and Y78 in simulations MDK0 andMDK3. In each case the plot corresponds to a single subunit and shows thetorsion angles at all times during the simulation. The arrows in the MDK0plot indicate the change in torsion angles as time progresses.
FIGURE 7 Ion/waterz trajectories for simulations MDK2, MDK29, andMDK3. The time-dependent locations onz of K1 and K2 are shown, alongwith that of the crystallographic water (W1, gray lines) that is initiallylocated at site S2. The vertical arrows show the approximate times of theconcerted K1-water-K2 movement within the filter.
564 Shrivastava and Sansom
Biophysical Journal 78(2) 557–570
gest that repulsive interactions between K3 and K2 mayhold K2 in the filter until K3 leaves the cavity. However, itmust be remembered that 1) the interaction between K2 andK3 will be screened by water; and 2) the use of a 1.7-nmcutoff in the electrostatic energy calculations will artefac-tually remove K2-K3 interactions once K3 leaves the chan-nel. Furthermore, the exit of K3 has only been seen in onerealization of the process. Further simulations and a moredetailed energetic analysis will be required to resolve this(Shrivastava and Sansom, unpublished results).
K3 in the cavity
The ion K3 was placed at the geometric center of the porecavity in the beginning of the simulation (Fig. 1). This isclose to the optimal location for K3 discussed by Roux andMacKinnon (1999). However, at;200 ps K3 moves a littledeeper into the cavity. Visualization of the change revealsthat the K3 ion moves toward the ring of T107 side chains,and forms a strong interaction with the Og atom of two ofthese (K-O distance;0.29 nm, compared to a mean dis-tance for K-O in a number of inorganic crystal structures of;0.27 nm; Hille, 1992). Note that this does not correspondto a large lateral displacement of K3 from the central poreaxis. It remains in contact with these two T107 side chainsuntil ;900 ps (Fig. 10,bottom). Thus, threonine side chains
also provide a K1 ion site within the otherwise largelyhydrophobic cavity. At 900 ps (arrowb in Fig. 11), the K3ion leaves the cavity (and the channel), exiting through theintracellular mouth.
Examination of those water molecules interacting mostclosely with K3 (Fig. 12) reveals that from;300 ps onwardit forms close interactions with the oxygens of two watersthat persist until;950 ps. Thus, from;300 to 900 ps theK3 ion interacts with four oxygen atoms, two from T107side chains and two from water molecules. As it starts toleave the cavity, the interactions with the two T107 sidechains are lost, and just before it exits it interacts with fourwater oxygens (arrow in Fig. 12). All four of these inter-actions are broken as the ion leaves the channel, to bereplaced by solvation with waters outside the channel as itmoves into the bulk solvent. Thus, the water moleculessolvating K3 once it has left the cavity are not the same onesthat solvate it within the cavity. Once K3 has left the cavityit not longer associates with the channel, but appears toremain close to the surface of the bilayer.
Changes in pore radius associated with ion exit
As mentioned above, at;900 ps ion K3 leaves its siteinteracting with two T107 side chains, moves down to theputative gate (corresponding to the V115 side chain ring),
FIGURE 9 Distances of K1 ionsfrom backbone carbonyl oxygens ofthe selectivity filter residues as afunction of time in simulationMDK3. The vertical arrows indicatethe concerted transitions discussed inthe text.
Potassium Channel Simulations 565
Biophysical Journal 78(2) 557–570

and then leaves the channel. By 1000 ps it has entered theaqueous phase at the intracellular face of the bilayer (Fig. 1B). The exit of K3 from the channel is linked to breathingmotions of the protein. In the crystal structure the intracel-lular mouth of the pore is narrower than the radius of a K1
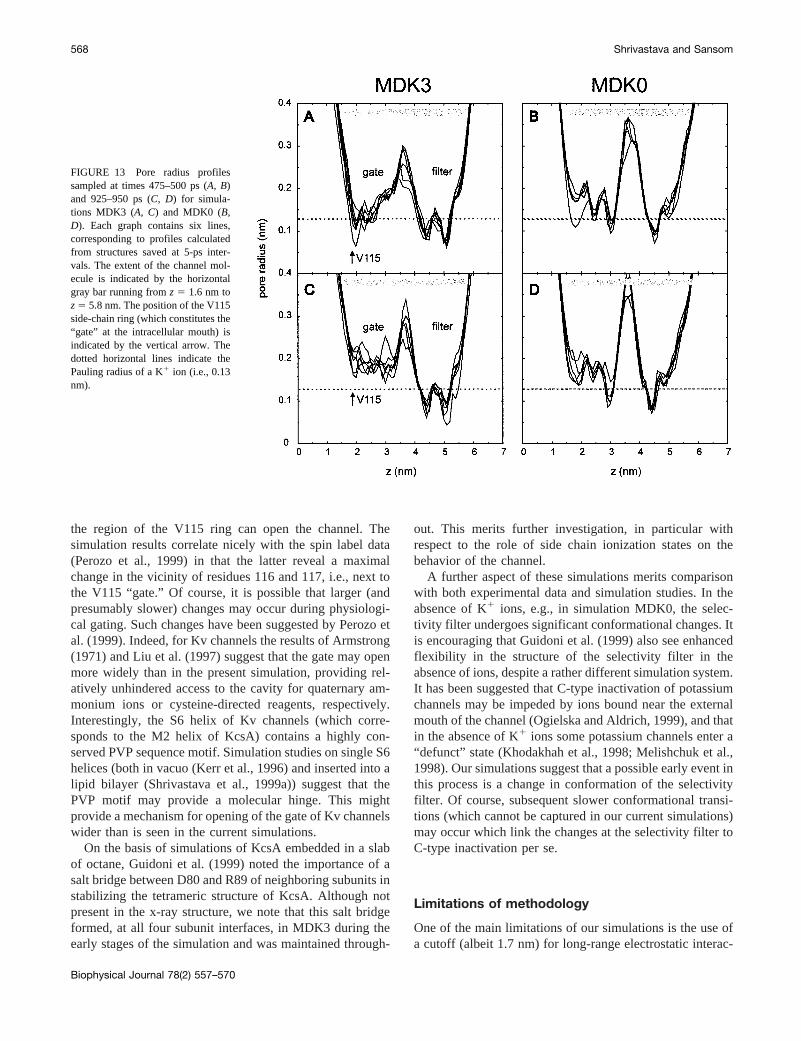
ion. The pore radius profile, calculated at 5-ps intervalsfrom 475 to 500 ps for MDK3 (Fig. 13A), illustrates thisocclusion of the pore, which is maintained throughout mostof this simulation. In particular, the V115 side chain ringmaintains a narrow and hydrophobic mouth to the channel.Indeed, short (;5-ps) time scale fluctuations in this regioncan reduce the pore radius to,0.1 nm. Similar fluctuationsin the pore radius profile in the gate region are seen insimulation MDK0 (Fig. 13B), suggesting that this propertyof the channel is independent of the presence/absence of K1
ions. The pore radius profile of MDK3 also reveals twonarrow regions in the selectivity filter. This suggests thatsmall dynamic changes in conformation must occur as theions and water migrate between sites in the filter, as can beseen from careful comparison of the 100 ps vs. 850 ps
structures in Fig. 8 or by visualization of the dynamics ofthe filter region (Shrivastava et al., 1999b).
In simulation MDK3 the radius profile around the gatechanges at the time of exit of the ion (;925–950 ps; Fig. 12C). The gate opens, as revealed by a 0.03 nm increase inradius to;0.16 nm, i.e., greater than that of a K1 ion. Thisopening is only seen while K3 leaves the pore, and ismaintained for;100 ps. Analysis of fluctuations in theprotein structure suggests that this opening is related to asmall movement of the M2 helix of subunit B of the chan-nel. The Ca RMS fluctuations of this helix, averaged overthe entire 1 ns, are;0.07 nm, compared to;0.04 nm forthe other three M2 helices. Thus small fluctuations in pack-ing of the M2 helices during the course of the simulationmay transiently open the gate at the V115 ring that other-wise occludes the pore. In contrast, in MDK0 (Fig. 12D)the radius remains,0.13 nm at both the intracellular andthe extracellular mouths throughout the simulation.
Detailed examination of the configuration around K3 as itis leaving the channel shows that it sits in a hydrophobicpocket. It interacts above with two waters in the cavity (bothK-O distances5 0.27 nm) and below with two waters in theintracellular mouth (K-O distances5 0.28 and 0.29 nm).However, it does not appear to form any favorable interac-tions with polar groups of the protein, either main chain orside chain. Thus, even while the gate is open there is likelyto be an energetic barrier to ion translocation. Inspection ofthe potential energies (not shown) of K3/protein and K3/water interactions reveal a loss of favorable electrostaticinteractions between ion and protein as K3 passes throughthe gate, which is more than compensated for by a gain infavorable interactions with water. However, a proper anal-ysis of energetics would require estimation of free energies(Roux, 1996; Roux and Karplus, 1991).
CONCLUSIONS
Biological relevance
Overall, our simulations reveal that interactions of K1
ions and water with the KcsA channel at both the selectivityfilter and at the intracellular gate are dynamic. At theselectivity filter a concerted translocation of K1-W2-K2between sites takes place. This is associated with small“peristaltic” changes in the conformation of the filter back-bone to maintain optimal K-O interactions (as was previ-ously seen in simulations of gramicidin-cation interactions;Roux and Karplus, 1991). Ion-ion interactions within thefilter have been analyzed by Dorman et al. (1999), who alsocommented on the inherent flexibility of the structure. TheMDK3 simulation confirms that there is a destabilizinginteraction between adjacent K1 ions within the pore (datanot shown) as originally suggested by Doyle et al. It appearsthat long-range interactions may occur between the ions inthe filter and that in the cavity, although interpretation of
FIGURE 10 Distances of threonine side chain hydroxyl oxygen atoms(Og) from K1 ions in simulation MDK3. The upper figure shows thedevelopment of the interaction of K2 with the ring of T75 side chains thatform site S4. The lower figure shows the evolution of the interaction of K3with two T107 side chains within the cavity. The vertical arrows indicatethe start and end of K/Og interactions (see text).
566 Shrivastava and Sansom
Biophysical Journal 78(2) 557–570

this is complicated by use of a 1.7-nm cutoff in the elec-trostatic energy evaluation. To some extent these destabi-lizing interactions may be overcome by the favorable inter-action of K3 with two T107 side chains. However, themovement of K2 toward the cavity after K3 has left thechannel suggests that movements in the selectivity filter andcavity may be coupled. Although a free energy analysis isneeded to probe these effects in more detail, our simulationsclearly reveal the dynamic and concerted behavior of K1
ions and water within a multi-ion pore. Furthermore, recentsimulations on a homology model of an inward rectifier
potassium channel (Capener, Shrivastava, and Sansom; un-published data) reveal similar concerted K1/water move-ments to those seen in the current study. This suggests thatthis aspect of our simulation results is robust to changes inthe detail of the channel structure, and so may be a moregeneral property of potassium channels.
The concerted, single-file motion within the selectivityfilter is consistent with both structural and electrophysio-logical data. In particular, the x-ray studies (Doyle et al.,1998) data indicate partial occupancy of sites S3 and S4 bya cation, demonstrating that multiple patterns of ion/filterinteractions are possible, even within a crystal. Potassiumchannels have long been suggested to form single-file,multi-ion pores (reviewed by Hille, 1992). This is consistentwith the observations of ion movement through the selec-tivity filter in the current simulation. Furthermore, althoughin principle the cavity might be occupied by multiple ions(but cf. the electrostatics calculations of Roux and Mac-Kinnon, (1999) which would argue against this), the mutualrepulsive interactions of K2 and K3 may suggest that thecavity essentially acts as an extension of the single file pore.We note (as have several others, e.g., Wallace, 1999) theresemblance between ion/water movement in the KcsA se-lectivity filter, and the concerted single-file motions of, e.g.,water (Chiu et al., 1999) in gramicidin channels.
The events at the gate in simulation MDK3 are of interestin the context of spin-labeling studies (Perozo et al., 1998,1999) which suggest that activation of KcsA at low pH islinked to a widening of the pore in this region. Our resultssuggest that relatively small (;0.1 nm or less) changes in
FIGURE 12 Ion K3 and water molecules in simulation MDK3, showingthe distance of K3 from the oxygen atoms of the four water molecules withwhich it liganded (as indicated by the vertical arrow) just before its exitfrom the channel cavity via the intracellular “gate” at;900 ps.
FIGURE 11 K1 ions and water moleculesin the selectivity filter in simulation MDK3,showing locations on the pore axis (z) of K1and K2 and of three water molecules (ofwhich W2 is the crystallographic water).The horizontal broken lines indicate the ap-proximate extent of the pore, from the intra-cellular (z 5 1.6 nm) to extracellular (z 55.8 nm) mouth. Arrowa indicates the con-certed motion of K1-W1-K2 down the filter;arrow b indicates the exit of K3 from thechannel; and arrowc indicates when K2leaves site S4 of the filter to enter the cavity.
Potassium Channel Simulations 567
Biophysical Journal 78(2) 557–570
the region of the V115 ring can open the channel. Thesimulation results correlate nicely with the spin label data(Perozo et al., 1999) in that the latter reveal a maximalchange in the vicinity of residues 116 and 117, i.e., next tothe V115 “gate.” Of course, it is possible that larger (andpresumably slower) changes may occur during physiologi-cal gating. Such changes have been suggested by Perozo etal. (1999). Indeed, for Kv channels the results of Armstrong(1971) and Liu et al. (1997) suggest that the gate may openmore widely than in the present simulation, providing rel-atively unhindered access to the cavity for quaternary am-monium ions or cysteine-directed reagents, respectively.Interestingly, the S6 helix of Kv channels (which corre-sponds to the M2 helix of KcsA) contains a highly con-served PVP sequence motif. Simulation studies on single S6helices (both in vacuo (Kerr et al., 1996) and inserted into alipid bilayer (Shrivastava et al., 1999a)) suggest that thePVP motif may provide a molecular hinge. This mightprovide a mechanism for opening of the gate of Kv channelswider than is seen in the current simulations.
On the basis of simulations of KcsA embedded in a slabof octane, Guidoni et al. (1999) noted the importance of asalt bridge between D80 and R89 of neighboring subunits instabilizing the tetrameric structure of KcsA. Although notpresent in the x-ray structure, we note that this salt bridgeformed, at all four subunit interfaces, in MDK3 during theearly stages of the simulation and was maintained through-
out. This merits further investigation, in particular withrespect to the role of side chain ionization states on thebehavior of the channel.
A further aspect of these simulations merits comparisonwith both experimental data and simulation studies. In theabsence of K1 ions, e.g., in simulation MDK0, the selec-tivity filter undergoes significant conformational changes. Itis encouraging that Guidoni et al. (1999) also see enhancedflexibility in the structure of the selectivity filter in theabsence of ions, despite a rather different simulation system.It has been suggested that C-type inactivation of potassiumchannels may be impeded by ions bound near the externalmouth of the channel (Ogielska and Aldrich, 1999), and thatin the absence of K1 ions some potassium channels enter a“defunct” state (Khodakhah et al., 1998; Melishchuk et al.,1998). Our simulations suggest that a possible early event inthis process is a change in conformation of the selectivityfilter. Of course, subsequent slower conformational transi-tions (which cannot be captured in our current simulations)may occur which link the changes at the selectivity filter toC-type inactivation per se.
Limitations of methodology
One of the main limitations of our simulations is the use ofa cutoff (albeit 1.7 nm) for long-range electrostatic interac-
FIGURE 13 Pore radius profilessampled at times 475–500 ps (A, B)and 925–950 ps (C, D) for simula-tions MDK3 (A, C) and MDK0 (B,D). Each graph contains six lines,corresponding to profiles calculatedfrom structures saved at 5-ps inter-vals. The extent of the channel mol-ecule is indicated by the horizontalgray bar running fromz 5 1.6 nm toz5 5.8 nm. The position of the V115side-chain ring (which constitutes the“gate” at the intracellular mouth) isindicated by the vertical arrow. Thedotted horizontal lines indicate thePauling radius of a K1 ion (i.e., 0.13nm).
568 Shrivastava and Sansom
Biophysical Journal 78(2) 557–570

tions. As discussed above, this cutoff means that in MDK3,the K1 ion does not “see” the K3 ion. It is unclear what theoptimal solution is. Either one could increase the cutoffdistance to, say, 3.0 n, or one might use a more sophisticatedapproach to long-range electrostatics, such as Ewald sum-mation (Tieleman et al., 1997; Tobias et al., 1997). How-ever, as the lipid parameters used have not been evaluatedusing Ewald summation, a series of detailed control simu-lations will be required to identify an optimal protocol. Untilsuch simulations are available, one must retain a degree ofcaution in interpretation of the current results. A secondlimitation is that the simulation system (area;9.5 nm3 9.5nm) is still relatively small. As emphasized by Gouliaev andNagle (1998), on a larger (50–100 nm) scale, distortions(undulations, compression/expansion) of the bilayer mayoccur. This suggests that channel gating might be stochas-tically modulated as a protein travels between differentregions. At present it would be too challenging to simulatea sufficiently large system to allow this to be exploreddirectly by MD simulation. However, simulations with dif-ferent lipid species could reveal the extent to which thechannel protein dynamics are sensitive to the local bilayerenvironment.
One limitation that may be addressed by further simula-tions is the relatively short time scale (1 ns). Future workwill extend the current simulations by an order of magnitude(Shrivastava and Sansom, work in progress). This mayreveal further aspects of M2 helix movement in relationshipto channel gating. In particular, longer simulations mayprovide some clues as to the rigid body motions of the M2helices and their relationship to gating. Longer simulationswill also enable detailed exploration of whether the protocoladopted here has allowed the bilayer to fully re-equilibrateafter “insertion” of the protein.
Future directions
This study has not addressed the physical basis of the K1
ion selectivity of KcsA. However, given the deformabilityof the selectivity filter in our simulations it seems likely thata straightforward stereochemical explanation of K1 vs. Na1
selectivity may prove too simple. An alternative approachmay be to calculate free energy profiles for K1 vs. Na1 ionsmoving through the KcsA channel. However, this willpresent a number of methodological challenges, particularlyfor a multi-ion channel.
So far we have omitted any representation of a transbi-layer voltage from our simulations. It will be of interest torepeat our simulations with a difference in voltage acrossthe membrane to see whether ion movement through thechannel may occur in either direction (as would be expectedfrom a physiological standpoint). Such simulations havebeen performed for bacterial porins (Suenaga et al., 1998).Simulations on simpler channel systems (Zhong et al.,1998c) have suggested how a transbilayer voltage might be
included in bilayer simulations. It will also be important toincrease the number of ions in the bulk aqueous phases oneither side of the bilayer. Furthermore, one must rememberthat 22 residues are absent from the N-terminus and 35 fromthe C-terminus of the KcsA chains in the x-ray structure. Itwould be interesting to attempt to include these in futuresimulations, although Perozo et al. (1999) have shown thatC-terminal truncation of KcsA does not lead to loss ofgating. Despite these reservations, it is encouraging that thecurrent simulations have provided direct visualization offundamental events of underlying ion permeation through apotassium channel in a phospholipid membrane.
Our thanks to all of our colleagues, especially Graham Smith, KishaniRanatunga, and Phil Biggin, for helpful discussions; to Peter Tieleman andLucy Forrest for assistance with GROMACS; to Rod MacKinnon for earlyaccess to the KcsA coordinates; and to Declan Doyle and Louise Johnsonfor valuable comments on an earlier version of the manuscript.
This work was supported by grants from The Wellcome Trust and com-puter time was provided by the Oxford Supercomputing Centre.
REFERENCES
Armstrong, C. M. 1971. Interaction of tetraethylammonium ion derivativeswith the potassium channels of giant axon.J. Gen. Physiol.58:413–437.
Bek, S., and E. Jakobsson. 1994. Brownian dynamics study of a multiply-occupied cation channel: application to understanding permeation inpotassium channels.Biophys. J.66:1028–1038.
Belohorcova, K., J. H. Davis, T. B. Woolf, and B. Roux. 1997. Structureand dynamics of an amphiphilic peptide in a lipid bilayer: a moleculardynamics study.Biophys. J.73:3039–3055.
Berendsen, H. J. C., J. P. M. Postma, W. F. van Gunsteren, A. DiNola, andJ. R. Haak. 1984. Molecular dynamics with coupling to an external bath.J. Chem. Phys.81:3684–3690.
Berendsen, H. J. C., J. P. M. Postma, W. F. van Gunsteren, and J. Hermans.1981. Intermolecular Forces. Reidel, Dordrecht, The Netherlands.
Berger, O., O. Edholm, and F. Jahnig. 1997. Molecular dynamics simula-tions of a fluid bilayer of dipalmitoylphosphatidylcholine at full hydra-tion, constant pressure and constant temperature.Biophys. J. 72:2002–2013.
Berneche, S., M. Nina, and B. Roux. 1998. Molecular dynamics simulationof melittin in a dimyristoylphosphatidylcholine bilayer membrane.Bio-phys. J.75:1603–1618.
Biggin, P. C., and M. S. P. Sansom. 1998. Interactions ofa-helices withlipid bilayers: a review of simulation studies.Biophys. Chem.76:161–183.
Brooks, C. L., M. Karplus, and B. M. Pettitt. 1988. Proteins: a TheoreticalPerspective of Dynamics, Structure and Thermodynamics. Wiley, NewYork.
Chiu, S. W., S. Subramaniam, and E. Jakobsson. 1999. Simulation study ofa gramicidin/lipid bilayer system in excess water and lipid. II. Rates andmechanisms of water transport.Biophys. J.76:1939–1950.
Chiu, S. W., S. Subramanian, and E. Jakobsson. 1996. Simulation of agramicidin channel in a fluid-phase DMPC bilayer.Biophys. J.70:80a.(Abstr.).
Daura, X., B. Jaun, D. Seebach, W. F. van Gunsteren, and A. E. Mark.1998. Reversible peptide folding in solution by molecular dynamicssimulation.J. Mol. Biol. 280:925–932.
Dorman, V. L., S. Garofoli, and P. C. Jordan. 1999. Ionic interactions inmultiply occupied channels.Novartis Foundation Symp.225:153–169.
Doyle, D. A., J. M. Cabral, R. A. Pfuetzner, A. Kuo, J. M. Gulbis, S. L.Cohen, B. T. Cahit, and R. MacKinnon. 1998. The structure of the
Potassium Channel Simulations 569
Biophysical Journal 78(2) 557–570

potassium channel: molecular basis of K1 conduction and selectivity.Science.280:69–77.
Duan, Y., and P. A. Kollman. 1998. Pathway to a folding intermediateobserved in a microsecond simulation in aqueous solution.Science.282:740–744.
Forrest, L. R., D. P. Tieleman, and M. S. P. Sansom. 1999. Defining thetransmembrane helix of M2 protein from influenza A by moleculardynamics simulations in a lipid bilayer.Biophys. J.76:1886–1896.
Gouliaev, N., and J. F. Nagle. 1998. Simulations of interacting membranesin the soft confinement regime.Phys. Rev. Lett.81:2610–2613.
Guidoni, L., V. Torre, and P. Carloni. 1999. Potassium and sodium bindingin the outer mouth of the K1 channel.Biochemistry.38:8599–8604.
Hille, B. 1992. Ionic Channels of Excitable Membranes, 2nd Ed. SinauerAssociates Inc., Sunderland, MA.
Jakobsson, E. 1997. Computer simulation studies of biological membranes:progress, promise and pitfalls.Trends Biochem. Sci.22:339–344.
Kabsch, W., and C. Sander. 1983. Dictionary of protein secondarystructure: pattern-recognition of hydrogen-bonded and geometrical fea-tures.Biopolymers.22:2577–2637.
Kerr, I. D., H. S. Son, R. Sankararamakrishnan, and M. S. P. Sansom.1996. Molecular dynamics simulations of isolated transmembrane heli-ces of potassium channels.Biopolymers.39:503–515.
Khodakhah, K., A. Melishchuk, and C. M. Armstrong. 1998. Killing Kchannels with TEA1. Proc. Natl. Acad. Sci. USA.94:13335–13338.
Kraulis, P. J. 1991. MOLSCRIPT: a program to produce both detailed andschematic plots of protein structures.J. Appl. Crystallogr.24:946–950.
Liu, Y., M. Holmgren, M. E. Jurman, and G. Yellen. 1997. Gated accessto the pore of a voltage-dependent K1 channel.Neuron.19:175–184.
MacKinnon, R., S. L. Cohen, A. Kuo, A. Lee, and B. T. Chait. 1998.Structural conservation in prokaryotic and eukaryotic potassium chan-nels.Science.280:106–109.
Maingret, F., M. Fosset, F. Lesage, M. Lazdunski, and E. Honore. 1999.TRAAK is a mammalian neuronal mechano-gated K1 channel.J. Biol.Chem.274:1381–1387.
Marrink, S. J., O. Berger, D. P. Tieleman, and F. Jahnig. 1998. Adhesionforces of lipids in a phospholipid membrane studied by moleculardynamics simulations.Biophys. J.74:931–943.
McCammon, J. A., and S. C. Harvey. 1987. Dynamics of Proteins andNucleic Acids. Cambridge University Press, Cambridge.
Melishchuk, A., A. Loboda, and C. M. Armstrong. 1998. Loss ofShakerKchannel conductance in 0 K1 solutions: role of the voltage sensor.Biophys. J.75:1828–1835.
Merritt, E. A., and D. J. Bacon. 1997. Raster3D: photorealistic moleculargraphics.Methods Enzymol.277:505–524.
Miller, C. 1991. 1990: Annus mirabilis of potassium channels.Science.252:1092–1096.
Ogielska, E. M., and R. W. Aldrich. 1999. Functional consequence of adecreased potassium affinity in a potassium channel pore-ion interac-tions and C-type inactivation.J. Gen. Physiol.113:347–358.
Perozo, E., D. M. Cortes, and L. G. Cuello. 1998. Three-dimensionalarchitecture and gating mechanism of a K1 channel studied by EPRspectroscopy.Nat. Struct. Biol.5:459–469.
Perozo, E., D. M. Cortes, and L. G. Cuello. 1999. Structural rearrange-ments underlying K1-channel activation gating.Science.285:73–78.
Randa, H. S., L. R. Forrest, G. A. Voth, and M. S. P. Sansom. 1999.Molecular dynamics of synthetic leucine-serine ion channels in a phos-pholipid membrane.Biophys. J.77:2400–2410.
Roux, B. 1996. Valence selectivity of the gramicidin channel: a moleculardynamics free energy perturbation study.Biophys. J.71:3177–3185.
Roux, B., and M. Karplus. 1991. Ion transport in a model gramicidinchannel: structure and thermodynamics.Biophys. J.59:961–981.
Roux, B., and M. Karplus. 1994. Molecular dynamics simulations of thegramicidin channel.Annu. Rev. Biophys. Biomol. Struct.23:731–761.
Roux, B., and R. MacKinnon. 1999. The cavity and pore helices in theKcsA K1 channel: electrostatic stabilization of monovalent cations.Science.285:100–102.
Roux, B., and T. B. Woolf. 1996. Molecular dynamics of Pf1 coat proteinin a phospholipid bilayer.In Biological Membranes: A Molecular Per-spective from Computation and Experiment. Birkha¨user, Boston. 587.
Sansom, M. S. P. 1992. The roles of serine and threonine sidechains in ionchannels: a modelling study.Eur. Biophys. J.21:281–298.
Schrempf, H., O. Schmidt, R. Kummerlein, S. Hinnah, D. Muller, M.Betzler, T. Steinkamp, and R. Wagner. 1995. A prokaryotic potassium-ion channel with 2 predicted transmembrane segments fromStreptomy-ces lividans. EMBO J.14:5170–5178.
Shen, L., D. Bassolino, and T. Stouch. 1997. Transmembrane helix struc-ture, dynamics, and interactions: multi-nanosecond molecular dynamicssimulations.Biophys. J.73:3–20.
Shrivastava, I. H., C. Capener, L. R. Forrest, and M. S. P. Sansom. 1999a.Structure and dynamics of K1 channel pore-lining helices: a compara-tive simulation study.Biophys. J.78:79–92.
Shrivastava, I. H., G. R. Smith, and M. S. P. Sansom. 1999b. Ion perme-ation through a bacterial K1 channel using molecular dynamics simu-lation. J. Physiol.520P:4P.
Smart, O. S., J. M. Goodfellow, and B. A. Wallace. 1993. The poredimensions of gramicidin A.Biophys. J.65:2455–2460.
Straatsma, T. P., and H. J. C. Berendsen. 1988. Free-energy of ionichydration: analysis of a thermodynamic integration technique to evaluatefree-energy differences by molecular-dynamics simulations.J. Chem.Phys.89:5876–5886.
Suenaga, A., Y. Komeiji, M. Uebayasi, T. Meguro, M. Saito, and I.Yamato. 1998. Computation observation of an ion permeation through achannel protein.Biosci. Reports.18:39–48.
Tieleman, D. P., and H. J. C. Berendsen. 1996. Molecular dynamicssimulations of a fully hydrated dipalmitoylphosphatidylcholine bilayerwith different macroscopic boundary conditions and parameters.J. Chem. Phys.105:4871–4880.
Tieleman, D. P., and H. J. C. Berendsen. 1998. A molecular dynamicsstudy of the pores formed byE. coli OmpF porin in a fully hydratedPOPE bilayer.Biophys. J.74:2786–2801.
Tieleman, D. P., H. J. C. Berendsen, and M. S. P. Sansom. 1999a. Analamethicin channel in a lipid bilayer: molecular dynamics simulations.Biophys. J.76:1757–1769.
Tieleman, D. P., L. R. Forrest, H. J. C. Berendsen, and M. S. P. Sansom.1999b. Lipid properties and the orientation of aromatic residues inOmpF, influenza M2 and alamethicin systems: molecular dynamicssimulations.Biochemistry.37:17554–17561.
Tieleman, D. P., S. J. Marrink, and H. J. C. Berendsen. 1997. A computerperspective of membranes: molecular dynamics studies of lipid bilayersystems.Biochim. Biophys. Acta.1331:235–270.
Tieleman, D. P., M. S. P. Sansom, and H. J. C. Berendsen. 1999c.Alamethicin helices in a bilayer and in solution: molecular dynamicssimulations.Biophys. J.76:40–49.
Tobias, D. J., K. C. Tu, and M. L. Klein. 1997. Atomic-scale moleculardynamics simulations of lipid membranes.Curr. Opin. Colloid InterfaceSci.2:15–26.
van Gunsteren, W. F., and A. E. Mark. 1992. On the interpretation ofbiochemical data by molecular dynamics computer simulation.Eur.J. Biochem.204:947–961.
Wallace, B. A. 1999. X-ray crystallographic structures of gramicidin andtheir relation to theStreptomyces lividanspotassium channel structure.Novartis Foundation Symp.225:23–37.
Woolf, T., and B. Roux. 1994. Molecular-dynamics simulation of thegramicidin channel in a phospholipid-bilayer.Proc. Natl. Acad. Sci.USA.91:11631–11635.
Zhong, Q., T. Husslein, P. B. Moore, D. M. Newns, P. Pattnaik, and M. L.Klein. 1998a. The M2 channel of influenza A virus: a molecular dy-namics study.FEBS Lett.434:265–271.
Zhong, Q., Q. Jiang, P. B. Moore, D. M. Newns, and M. L. Klein. 1998b.Molecular dynamics simulation of an ion channel.Biophys. J.74:3–10.
Zhong, Q., P. B. Moore, D. M. Newns, and M. L. Klein. 1998c. Moleculardynamics study of the LS3 voltage-gated ion channel.FEBS Lett.427:267–270.
570 Shrivastava and Sansom
Biophysical Journal 78(2) 557–570