simultaneous measurements of particle number size
TRANSCRIPT
Atmos. Chem. Phys., 17, 6797–6811, 2017https://doi.org/10.5194/acp-17-6797-2017© Author(s) 2017. This work is distributed underthe Creative Commons Attribution 3.0 License.
Simultaneous measurements of particle number size distributions atground level and 260 m on a meteorological tower in urban Beijing,ChinaWei Du1,2, Jian Zhao1,2, Yuying Wang3, Yingjie Zhang1,4, Qingqing Wang1, Weiqi Xu1,2, Chen Chen1,Tingting Han1,2, Fang Zhang3, Zhanqing Li3, Pingqing Fu1,5, Jie Li1, Zifa Wang1,5, and Yele Sun1,2,5
1State Key Laboratory of Atmospheric Boundary Layer Physics and Atmospheric Chemistry, Institute of AtmosphericPhysics, Chinese Academy of Sciences, Beijing 100029, China2College of Earth Sciences, University of Chinese Academy of Sciences, Beijing 100049, China3College of Global Change and Earth System Science, Beijing Normal University, Beijing 100875, China4School of Atmospheric Physics, Nanjing University of Information Science and Technology, Nanjing 210044, China5Center for Excellence in Regional Atmospheric Environment, Institute of Urban Environment, Chinese Academy ofSciences, Xiamen 361021, China
Correspondence to: Yele Sun ([email protected])
Received: 29 November 2016 – Discussion started: 2 January 2017Revised: 10 April 2017 – Accepted: 6 May 2017 – Published: 9 June 2017
Abstract. Despite extensive studies into the characterizationof particle number size distributions at ground level, real-time measurements above the urban canopy in the megacityof Beijing have never been performed to date. Here we con-ducted the first simultaneous measurements of size-resolvedparticle number concentrations at ground level and 260 min urban Beijing from 22 August to 30 September. Our re-sults showed overall similar temporal variations in numbersize distributions between ground level and 260 m, yet peri-ods with significant differences were also observed. Partic-ularly, accumulation-mode particles were highly correlated(r2= 0.85) at the two heights, while Aitken-mode particles
presented more differences. Detailed analysis suggests thatthe vertical differences in number concentrations stronglydepended on particle size, and particles with a mobility di-ameter between 100 and 200 nm generally showed higherconcentrations at higher altitudes. Particle growth rates andcondensation sinks were also calculated, which were 3.2 and3.6 nm h−1, and 2.8× 10⁻² and 2.9× 10⁻² s−1, at groundlevel and 260 m, respectively. By linking particle growth withaerosol composition, we found that organics appeared to playan important role in the early stage of the growth (09:00–12:00 LT) while sulfate was also important during the laterperiod. Positive matrix factorization of size-resolved numberconcentrations identified three common sources at ground
level and 260 m, including a factor associated with new parti-cle formation and growth events (NPEs), and two secondaryfactors that represent photochemical processing and regionaltransport. Cooking emission was found to have a large contri-bution to small particles and showed much higher concentra-tion at ground level than 260 m in the evening. These resultsimply that investigation of NPEs at ground level in megaci-ties needs to consider the influences of local cooking emis-sions. The impacts of regional emission controls on parti-cle number concentrations were also illustrated. Our resultsshowed that regional emission controls have a dominant im-pact on accumulation-mode particles by decreasing gas pre-cursors and particulate matter loadings, and hence suppress-ing particle growth. In contrast, the influences on Aitken par-ticles were much smaller due to the enhanced new particleformation (NPF) events.
1 Introduction
With frequent occurrence of haze episodes, the megacityof Beijing is faced with severe air pollution problems, asindicated by high concentrations of ambient aerosol parti-cles. For example, the annual average concentration of PM2.5
Published by Copernicus Publications on behalf of the European Geosciences Union.

6798 W. Du et al.: Simultaneous measurements of particle number size distributions
was 80.6 µg m−3 in 2015, which is more than twice theChina National Ambient Air Quality Standard (35 µg m−3 asan annual average) (http://www.bjepb.gov.cn/bjepb/413526/413663/413717/413719/index.html). Fine particles can sig-nificantly reduce atmospheric visibility, exert harmful effectson public health, and even have potential impacts on regionaland global climate. As a result, extensive efforts have beendevoted to characterize the sources, formation mechanisms,and evolution processes of aerosol particles in recent years(Ma et al., 2012; Takegawa et al., 2009; Sun et al., 2010,2014, 2016b). Among these studies, particle number concen-trations are one of the greatest concerns because particles canrapidly grow from a few nanometers to tens and even hun-dreds of nanometers in a short time, and hence play a signif-icant role in haze formation (Guo et al., 2014). However, ourunderstanding of the formation and growth of aerosol parti-cles is not complete, particularly in highly polluted environ-ments (Kulmala et al., 2016).
In the past decades, extensive studies have been conductedto characterize particle number size distributions in Beijingat ground level (Wehner et al., 2004; Yue et al., 2009; Wuet al., 2011; Gao et al., 2012; Wang et al., 2013b). The con-tinuous measurements of aerosol number size distributionsfrom 3 nm to 10 µm within the city area of Beijing in springindicated a high variability in number concentrations, andthe variations were substantially different among dust storm,clean, and polluted periods (Wehner et al., 2004). Yue etal. (2009) also found a clear shift of maximum diameter from60 nm on clean days to 80 nm during polluted days. Most pre-vious studies focused on new particle formation and growthevents (NPEs) (Wehner et al., 2004; Wu et al., 2011; Gaoet al., 2012; Zhang et al., 2011). While new particle forma-tion (NPF) events are mostly observed under conditions withlow relative humidity and clean air masses (Wu et al., 2007;Wehner et al., 2004), particle growth events are strongly as-sociated with high relative humidity (Gao et al., 2012). Theroles of chemical species in NPEs in Beijing were also ex-plored in several studies. For example, organics were foundto be the dominant species of PM1 during new particle for-mation events in summer in Beijing (Zhang et al., 2011) andlikely played a major role in NPF and growth, although sul-furic is also important as well (Yue et al., 2009). However,most of these studies were conducted at a ground site that issubject to the influences of multiple local sources, e.g., trafficand cooking emissions. Indeed, the source apportionment ofparticle numbers with positive matrix factorization showedsignificant contributions of traffic emissions and combus-tion sources to the total number concentration (Wang et al.,2013b; Liu et al., 2014). Therefore, measurements of size-resolved number concentrations at high altitude with less lo-cal cooking and traffic influences are essential for elucidat-ing the NPF and growth mechanisms, and also the role ofregional transport in haze formation.
During this study period, strict emission controls wereimplemented in Beijing and the surrounding regions, e.g.,
Hebei, Tianjin, and Shandong, from 20 August to 3 Septem-ber to ensure good air quality during the China Victory Day(V-day) parade on 3 September 2015. The control measures,such as restricting the number of vehicles, shutting down fac-tories and power plants, stopping construction activities, etc.,were even stricter than those implemented during the Asia-Pacific Economic Cooperation (APEC) summit in 2014 (Sunet al., 2016a). Several studies have addressed the impactsof regional emission controls on aerosol composition andgaseous species (Li et al., 2016; Han et al., 2016; Zhao et al.,2017). The results are overall consistent, showing significantreductions in most aerosol and gaseous species during thecontrol period (CP, 22 August–3 September). A recent studycomparing the number size distributions with those duringthe same period in 2010–2013 at a rural site in Beijing il-lustrated the most reductions in accumulation-mode particlesand condensation sink (CS) during the V-day period (Shen etal., 2016). Despite this, our understanding of the impacts ofemission controls on particle number size distributions is farfrom complete.
Here, we conducted the first simultaneous measurementsof particle number size distributions at two different heights,i.e., ground level and 260 m, within the city area of Beijingfrom 22 August to 30 September. This study is unique be-cause it provides an experimental opportunity to investigatethe vertical differences and processes of particle number sizedistributions and also the impacts of regional emission con-trols. The size-resolved particle number concentrations, di-urnal variations, particle growth rates, and their relationshipswith aerosol composition at ground level and 260 m are com-pared in detail, and the impacts of emission controls on parti-cle number concentrations in different sizes are elucidated. Inaddition, the sources of particle numbers at the two differentheights are investigated with positive matrix factorization.
2 Experimental method
2.1 Sampling and data analysis
The sampling site is located at the Tower Branch of the Insti-tute of Atmospheric Physics, Chinese Academy of Sciences,between the north third and fourth ring roads in Beijing. Twoscanning mobility particle sizers (SMPSs) were deployed forsimultaneous measurements of particle number size distribu-tions at ground level and 260 m on the Beijing 325 m meteo-rological tower. At 260 m, the size-resolved particle numberconcentration (15–685 nm) was measured in situ by a con-densation particle counter (TSI, 3775) equipped with a longdifferential mobility analyzer (TSI, 3081A). The time reso-lution is 5 min. Comparatively, an SMPS as part of an unat-tended multifunctional hygroscopicity tandem differentialmobility analyzer (H-TDMA) developed by the GuangzhouInstitute of Tropical and Marine Meteorology, China Mete-orological Administration (ITMM, CMA) was used to mea-
Atmos. Chem. Phys., 17, 6797–6811, 2017 www.atmos-chem-phys.net/17/6797/2017/

W. Du et al.: Simultaneous measurements of particle number size distributions 6799
Table 1. The geometric mean diameter (GMD) of average particle number size distribution for different periods at ground level and 260 m.Also shown are GMDs of three modes from log-normal fitting.
GMD Entire study Three modes
260 m Ground 260 m Ground
Entire study 88 45 27 44 116 24 41 111Control period 57 43 27 48 104 24 46 150Non-control period 106 47 27 43 119 23 40 102Clean 79 47 27 45 112 23 41 106Polluted 131 47 52 113 188 36 96 244
sure particle number concentrations (10–400 nm) at groundlevel. A detailed description of the H-TDMA was given inTan et al. (2013). According to previous comparisons of par-ticle number size distributions between different SMPSs ordifferential mobility particle sizers, the measurement uncer-tainties between 20 and 200 nm can be ∼ 10 %, and evenlarger for particles outside this range (Wiedensohler et al.,2012).
The non-refractory submicron aerosol (NR-PM1) species,including organics (Org), sulfate (SO4), nitrate (NO3), am-monium (NH4), and chloride (Chl), were measured at groundlevel by an Aerodyne high-resolution time-of-flight aerosolmass spectrometer (HR-AMS) and at 260 m by an aerosolchemical speciation monitor (ACSM). Co-located black car-bon (BC) was measured by a seven-wavelength (AE33) anda two-wavelength Aethalometer (AE22, Magee ScientificCorp.) at 260 m and ground level, respectively. The mete-orological variables, including wind speed (WS), wind di-rection (WD), relative humidity (RH), and temperature (T ),were obtained from the measurements on the meteorolog-ical tower. The operations of the HR-AMS, ACSM, andAethalometers and subsequent data analysis are detailed inSun et al. (2015b) and Zhao et al. (2017). All the data in thisstudy are reported in Beijing local time (UTC+8 h).
Figure S1 in the Supplement shows a comparison of thetotal PM1 mass (NR-PM1+BC) with that derived from theSMPS measurements at ground level and 260 m. The par-ticle number concentrations between 15 and 400 nm wereconverted to mass concentrations using chemically resolvedparticle density (Salcedo et al., 2006). As shown in Fig. S1,the time series of PM1 was highly correlated with that fromSMPS measurements at both ground level (r2
= 0.94) and260 m (r2
= 0.95). We also noticed some differences in theregression slopes, which are 0.44 and 0.66 at ground leveland 260 m, respectively. The reasons are not very clear yet,but these differences are likely due to the different size dis-tributions at the two different heights (Sect. 3.1).
2.2 Particle growth rates and condensation sink
The particle growth rates (GRs) at ground level and 260 mwere calculated using Eq. (1).
GR=1Dm
1t, (1)
where Dm is the geometric mean diameter from the log-normal fitting of each size distribution and 1Dm is the in-crease in diameter during the growth period of 1t .
Condensation sink (CS), indicating how rapidly vapormolecules can condense onto preexisting aerosols, is calcu-lated using Eq. (2) (Nieminen et al., 2010).
CS= 2πD∑i
βMiDp,iNi, (2)
where D is the diffusion coefficient of the condensing vapor,Dp and N are the particle diameter and the correspondingnumber concentration, and βM is the transitional regime cor-rection factor expressed as Eq. (3).
βM = (Kn+ 1)/(
1+ 0.377Kn+43α−1Kn2
+43α−1Kn
),
(3)
where α is assumed to be unity, andKn is the Knudsen num-ber. It should be noted that the CS calculated on the basisof dry particle number size distributions might be underesti-mated since ambient RH was not considered (Reutter et al.,2009).
2.3 Source apportionment of size-resolved particlenumber concentrations
Positive matrix factorization (PMF, 2.exe, v 4.2) was per-formed on the size-resolved number concentrations (Ulbrichet al., 2009; Paatero and Tapper, 1994) to resolve potentialsources. In this study, the measurement uncertainties were es-timated using an equation-based approach that was detailedin Ogulei et al. (2007). The required measurement errors(σij ) were first calculated using Eq. (4):
σij = C1× (Xij + X̄j ), (4)
www.atmos-chem-phys.net/17/6797/2017/ Atmos. Chem. Phys., 17, 6797–6811, 2017

6800 W. Du et al.: Simultaneous measurements of particle number size distributions
Figure 1. Average particle number size distributions during the (a) control period, (b) non-control period, and (c) the entire study at groundlevel (orange lines) and 260 m (green lines). Panel (d) shows the time series of meteorological parameters of relative humidity (RH) andtemperature (T ). Panels (e) and (g) are the particle number size distributions and condensation sinks (CSs) at 260 m and ground level,respectively. Panel (f) and (h) are the time series of mass concentrations of PM1 species at 260 m and ground level, respectively.
where C1 is a constant value assumed to be 0.01, Xij is themeasured particle number concentration, and X̄j is the arith-metic mean value for j th size bin. The measurement uncer-tainties (Unc) were then calculated with Eq. (5):
Uncij = σij +C2×Xij , (5)
where σij is the estimated measurement error and C2 is aconstant value assumed to be 0.1. After a careful evaluationof the PMF results, five factors and four factors were cho-sen at ground level and 260 m, respectively. A more detaileddiagnosis of PMF results is presented in Figs. S2 and S3.
3 Results and discussion
3.1 Characterization of particle number sizedistributions
The temporal variations in size-resolved number concen-trations and aerosol species at ground level and 260 m are
shown in Fig. 1. The size-resolved particle number con-centrations showed overall similar evolutionary patterns be-tween ground level and 260 m, and high number concentra-tions of large particles were generally associated with cor-respondingly higher concentrations of aerosol species, e.g.,the periods of case 1 and case 2 in Fig. 1. However, pe-riods with substantially different number size distributionswere also observed. For example, we observed significantlyhigher particle number concentrations at ground level than260 m in the evening on 26 August and 1 September due tothe influences of local cooking emissions. On average, theparticle numbers showed a broader size distribution at 260 mthan ground level, peaking at approximately 85 and 45 nm,respectively (Fig. 1c). The log-normal distribution fitting fur-ther illustrated three size modes at both ground level and260 m. While the second mode with geometric mean diame-ter (GMD) peaking at 41 nm accounted for the largest num-ber fraction at ground level (52 %), the largest mode (GMD= 116 nm) dominated the total number of particles at 260 m,accounting for 62 %. Such differences were likely due to
Atmos. Chem. Phys., 17, 6797–6811, 2017 www.atmos-chem-phys.net/17/6797/2017/

W. Du et al.: Simultaneous measurements of particle number size distributions 6801
1.21.00.80.60.40.20.0
2015-8-22 2015-8-27 2015-9-1 2015-9-6 2015-9-11 2015-9-16 2015-9-21 2015-9-26 2015-10-1Date & time
30
20
10
0
x 10
3
1086420
x 10
3
201510
50
x 10
3
15
10
5
0
x 10
3 1.00.80.60.40.20.0
1.6
1.2
0.8
0.4
0.01.21.00.80.60.40.20.0
N15
–40 (
cm-3
) Ground260 mControl period Non-control period
N40
–100
(cm
-3 )N
100–
400 (
cm-3
)N
15–4
00 (c
m-3)
R260 m
/ground
Case 1 Case 2(a)
(b)
(c)
(d)
10
8
6
4
2
0
x 10
3
86420x 103
Slope = 1.17
r2= 0.85
260
m
Ground
10
8
6
4
2
0
x 10
3
151050x 103
Slope = 0.42
r2= 0.66
260
m
Ground
16
12
8
4
0
x 10
3
20151050
x 103
Slope = 0.70
r2= 0.40
260
m
Ground
25
20
15
10
5
0
x 10
3
3020100
3x 10
Slope = 0.71
r2= 0.40
260
m
Ground2015-8-312015-9-102015-9-202015-9-30D
ate & time
Figure 2. Comparisons of particle number concentrations between ground level and 260 m for different size ranges, i.e., (a) small Aitkenmode (15–40 nm), (b) large Aitken mode (40–100 nm), (c) accumulation mode (100–400 nm), and (d) the total number of particles (15–400 nm). The right-hand panels show the scatter plots of the comparisons.
the stronger influences of local sources (e.g., cooking) withhigher emissions of smaller particles, and more influences ofregional transport with large aged particles at 260 m.
Figure 2 shows the comparisons of the total number con-centrations (15–400 nm,N15−400) and those for three modes,including small Aitken mode (15–40 nm, N15−40), largeAitken mode (40–100 nm,N40−100), and accumulation mode(100–400 nm, N100−400) between ground level and 260 m.The variation trends in the total number concentrations atthe two heights tracked relatively well (r2
= 0.40, slope =0.71), while the average number concentration from 15 to400 nm at 260 m (7473± 4324 cm−3) was 26 % lower thanthat (10 134± 4680 cm−3) at ground level. The total parti-cle number concentrations at ground level were generallylower than those previously observed in Beijing mainly dueto the smaller size range measured in this study (Wang etal., 2013b; Yue et al., 2009). The N15−400 ratio of 260 mto ground (R260 m/ground) varied dramatically throughout theentire study, with the daily average ranging from 0.42 to1.10. In contrast, the total volume concentrations showedmuch better correlations between ground level and 260 m(r2= 0.89) and the average ratio was close to 1. Such dif-
ferences were mainly caused by the different contributions
of different mode particles to the number and volume con-centrations.
The correlations of particle number and volume concen-trations between ground level and 260 m varied substan-tially for different mode particles. As shown in Fig. 2a, thesmall Aitken-mode particles were correlated between thetwo heights (r2
= 0.66), indicating their common sourcesthat are related to new particle formation. However, the av-erage number concentration at 260 m (1382± 1281 cm−3)
was only approximately 40 % of that at the ground level(3379± 2232 cm−3), and the daily average ratio of 260 m toground level for N15−40 varied from 0.91 to 0.51. These re-sults illustrated additional sources for small Aitken particlesat ground level. Indeed, pronounced peaks for N15−40 wereoften observed in the evening, likely indicating the influencesof local emissions, e.g., cooking and traffic emissions. Thelarge Aitken-mode particles showed the worst correlation be-tween ground level and 260 m (r2
= 0.40, slope = 0.70), al-though the average number concentrations were compara-ble (4188 vs. 3233 cm−3). These results suggested that thesources of large Aitken-mode particles were quite differentbetween ground level and 260 m. For example, the diurnalcycle of large Aitken-mode particles at ground level was re-markably similar to that of organic cooking aerosols (Zhao
www.atmos-chem-phys.net/17/6797/2017/ Atmos. Chem. Phys., 17, 6797–6811, 2017

6802 W. Du et al.: Simultaneous measurements of particle number size distributions
Table 2. Summary of average number concentrations of five factors for the entire study, control period (CP), non-control period (NCP), andalso the change percentages ((CP-NCP)/NCP× 100).
F1 F2 F3 F4 F5
260 m Ground 260 m Ground 260 m Ground 260 m Ground 260 m Ground
Entire study (cm−3) 867 695 – 2567 2066 3376 2859 2662 1412 801Control period (cm−3) 1067 816 – 2586 2271 3314 2049 1619 489 357Non-control period (cm−3) 771 621 – 2526 1967 3413 3249 3162 1856 1023(CP-NCP)/NCP (%) 38 % 31 % – 2 % 15 % −3 % −37 % −49 % −74 % −65 %
1.21.00.80.60.40.20.0
2015-8-22 2015-8-27 2015-9-1 2015-9-6 2015-9-11 2015-9-16 2015-9-21 2015-9-26 2015-10-1Date & time
5040302010
0
x 10
9
5040302010
0
x 10
9
3.0
2.0
1.0
0.0
x 10
9
150
100
50
0
x 10
6 1.00.80.60.40.20.0
1.6
1.2
0.8
0.4
0.01.21.00.80.60.40.20.0
V15
–40 (
nm3 c
m-3
)
Ground260 mControl period Non-control period
V40
–100
(nm
3 cm
-3 )V
100–
400 (
nm3
cm-3
)V
15–4
00 (n
m3
cm-3
)
R260 m
/ground
Case 1 Case 2
(a)
(b)
(c)
(d)
160
120
80
40
0
x 10
6
150100500x 106
Slope = 0.49
r2= 0.63
260
m
Ground
2.5
2.0
1.5
1.0
0.5
0.0
x 10
9
3.02.01.00.0x 109
Slope = 0.81
r2= 0.41
260
m
Ground
50
40
30
20
10
0
x 10
9
403020100x 109
Slope = 1.01
r2= 0.91
260
m
Ground
50
40
30
20
10
0
x 10
9
50403020100x 109
Slope = 1.00
r2= 0.90
260
m
Ground2015-8-312015-9-102015-9-202015-9-30D
ate & time
Figure 3. Comparisons of particle volume concentrations between ground level and 260 m for different size ranges, i.e., (a) small Aitkenmode (15–40 nm), (b) large Aitken mode (40–100 nm), (c) accumulation mode (100–400 nm), and (d) the total number of particles (15–400 nm). Right figure show the scatter plots of the comparisons.
et al., 2017), likely indicating a large source contributionfrom cooking emissions. Compared with Aitken particles,the number and volume concentrations of accumulation-mode particles were well correlated between the two heights(r2= 0.85 and 0.91, respectively). While the average num-
ber concentration at 260 m was 11 % higher than that atground level, the volume concentration was close. More-over, the temporal variations in accumulation-mode particlestracked well with those of secondary inorganic species thatwere mainly formed over a regional scale. Our results in-dicate that accumulation-mode particles were likely domi-nantly from regional transport and relatively homogeneouslydistributed across different heights. The different vertical ra-
tios between number and volume concentrations suggest thatthe particle size distributions were slightly different betweenground level and 260 m.
The regional emission control and meteorological condi-tions can have significant impacts on particle number sizedistributions. As shown in Fig. 1a and b, the GMD of num-ber size distributions peaked at 57 nm at 260 m and 43 nmat ground level during the control period, and the averagesize distribution showed three similar modes between thetwo heights. In contrast, the size distributions had substan-tial changes after the control period that were characterizedby much broader distributions and a clear shift from smallerto larger particles at both ground level and 260 m. For exam-
Atmos. Chem. Phys., 17, 6797–6811, 2017 www.atmos-chem-phys.net/17/6797/2017/

W. Du et al.: Simultaneous measurements of particle number size distributions 6803
(a)
(b)
(c) 1.5
1.2
0.9
0.6
0.3
0.0
R26
0 m
/gro
und
30
24
18
12
6
0
x10915
12
9
6
3
0
x 10
350
40
30
20
10
0
x 10
-3
30
24
18
12
6
0
x 109
60
48
36
24
12
0
x 10
-3 15
12
9
6
3
0
x 10
3
CS N15–40 N40–100 N100–400 N15–400 V15–40 V40–100 V100–400 V15–400
Ngr
ound
(cm
-3)
CS g
roun
d (s-1
)V
ground (nm3 cm
-3)V
260 m (nm3cm
-3)
N26
0 m
(cm
-3)
CS 2
60 m
(s-1
)
*100
*10
*100
*10
Entire study Control period Non-control period PollutedClean
Figure 4. Average number and volume concentrations and CS at (a) 260 m and (b) ground level for the entire study and four different periods.Panel (c) shows the box plots of the ratios of 260 m to ground level. The volume concentrations of small and large Aitken-mode particles areenhanced by factors of 100 and 10, respectively, for clarity.
ple, the GMD of particle number distributions was 106 nmat 260 m, which was much larger than that during the con-trol period, and the largest mode consistently dominated thetotal number of particles, on average accounting for 68 %.Figure 4 shows a comparison of average number and vol-ume concentration between control and non-control peri-ods for three-mode particles. While the average total num-ber concentrations during the control period were lower thanthose during non-control periods (6139 vs. 8116 cm−3 at260 m and 8708 vs. 10 824 cm−3 at ground level), the smalland large Aitken-mode particles were comparable betweencontrol and non-control periods. As a result, the decreasesin total number concentrations were mainly caused by thechanges in accumulation-mode particles, which were de-creased by 53 % at 260 m and 52 % at ground level during thecontrol period. Our results illustrate that regional emissioncontrol has a large impact on accumulation-mode particles,while the influences on Aitken-mode particles were small.One of the major reasons is that emission controls substan-tially decrease the gas precursors (e.g., SO2 and NOx) andPM2.5 mass concentrations, and hence suppress the growthof particles. This is also consistent with the large decreases inCS by 48 % at 260 m and 45 % at ground level during the con-trol period (Fig. 4a and b). In addition to regional emissioncontrols, we also found that the dominant northerly windslikely played an important role in decreasing the PM duringthe control period (Zhao et al., 2017). In contrast, the number
concentrations of small particles were relatively comparabledue to more frequent new particle formation events duringthe control period. To better evaluate the impacts of regionalemission controls, cluster analysis with hourly back trajecto-ries were performed on the entire dataset with an exclusion ofprecipitation days. As shown in Fig. S4, accumulation-modeparticles during the control period showed the largest reduc-tions for clusters 1 and 2 (39 and 42 %, respectively), whilethe large Aitken particles had small changes and the smallAitken ones even showed a large increase (43 %) for cluster1. These results further support our conclusion above.
We also compared the particle number size distribu-tions between polluted (PM2.5 > 75 µg m−3) and clean days(PM2.5 < 75 µg m−3) after the control period. As shown inFig. S5, the average size distribution on polluted days atground level showed a clear three-mode distribution, peak-ing at 36, 96, and 244 nm. The GMD of the three modeswas ubiquitously larger than those (23, 41, and 106 nm)observed during clean days. While the average total num-ber concentration increased from 10 258 (±4676) cm−3 dur-ing clean periods to 12 156 (±4406) cm−3 on polluted days(Fig. 4), we observed comparable concentrations for smalland large Aitken-mode particles. Therefore, the increasein total number concentration was mainly caused by theaccumulation-mode particles, which increased by 90 % dur-ing the polluted days. These results illustrate the differentroles of different mode particles between clean and pol-
www.atmos-chem-phys.net/17/6797/2017/ Atmos. Chem. Phys., 17, 6797–6811, 2017
6804 W. Du et al.: Simultaneous measurements of particle number size distributions
(a)
(b)
(c)
(d)1.6
1.4
1.2
1.0
0.8
0.6
0.4
0.2
0.0
R26
0 m
/gro
und
4003002001000Dp (nm)
Entire study Control period
Non-control periodPolluted
Clean
102
4
1002
4
Dp (
nm)
24201612840Hour of day
102
4
1002
4
Dp (
nm)
102
4
1002
4
Dp (
nm)
80
60
40
20
0
x 10-3
80
60
40
20
0
1086420 x 103
dN/dlogDp (cm-3)
1.21.00.80.60.40.2R260 m/ground
x 10-3 C
S (s-1)
CS (s
-1)
260 m
Ground
R260 m/ground
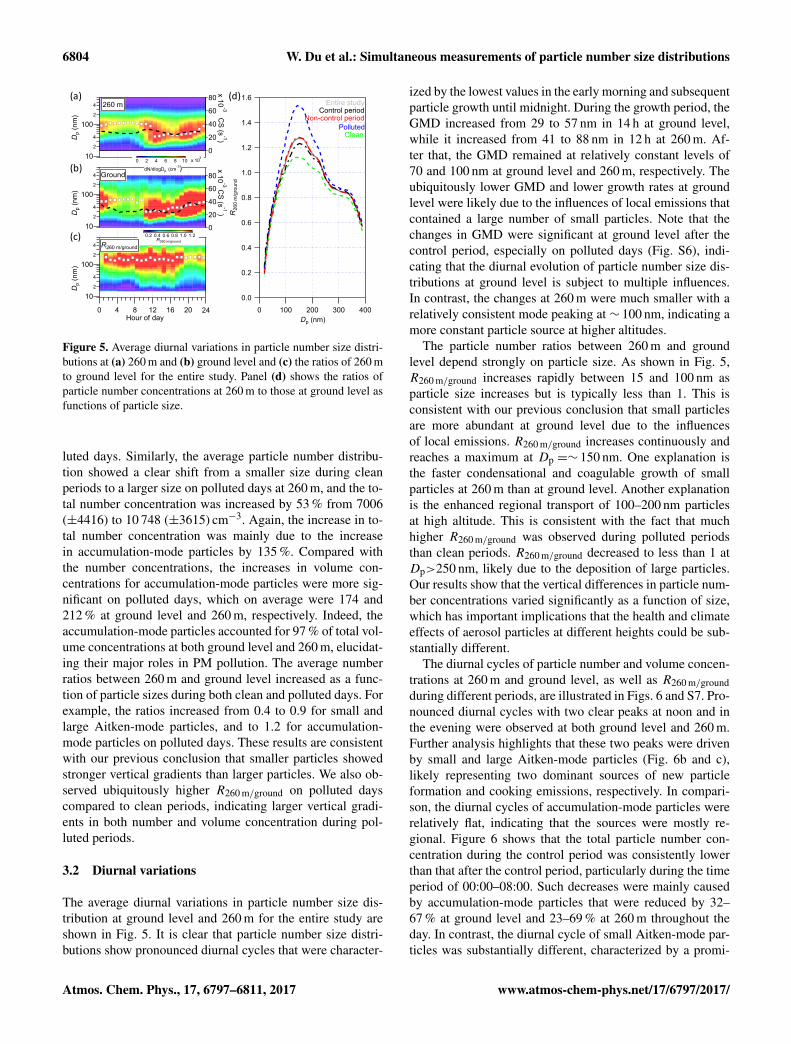
Figure 5. Average diurnal variations in particle number size distri-butions at (a) 260 m and (b) ground level and (c) the ratios of 260 mto ground level for the entire study. Panel (d) shows the ratios ofparticle number concentrations at 260 m to those at ground level asfunctions of particle size.
luted days. Similarly, the average particle number distribu-tion showed a clear shift from a smaller size during cleanperiods to a larger size on polluted days at 260 m, and the to-tal number concentration was increased by 53 % from 7006(±4416) to 10 748 (±3615) cm−3. Again, the increase in to-tal number concentration was mainly due to the increasein accumulation-mode particles by 135 %. Compared withthe number concentrations, the increases in volume con-centrations for accumulation-mode particles were more sig-nificant on polluted days, which on average were 174 and212 % at ground level and 260 m, respectively. Indeed, theaccumulation-mode particles accounted for 97 % of total vol-ume concentrations at both ground level and 260 m, elucidat-ing their major roles in PM pollution. The average numberratios between 260 m and ground level increased as a func-tion of particle sizes during both clean and polluted days. Forexample, the ratios increased from 0.4 to 0.9 for small andlarge Aitken-mode particles, and to 1.2 for accumulation-mode particles on polluted days. These results are consistentwith our previous conclusion that smaller particles showedstronger vertical gradients than larger particles. We also ob-served ubiquitously higher R260 m/ground on polluted dayscompared to clean periods, indicating larger vertical gradi-ents in both number and volume concentration during pol-luted periods.
3.2 Diurnal variations
The average diurnal variations in particle number size dis-tribution at ground level and 260 m for the entire study areshown in Fig. 5. It is clear that particle number size distri-butions show pronounced diurnal cycles that were character-
ized by the lowest values in the early morning and subsequentparticle growth until midnight. During the growth period, theGMD increased from 29 to 57 nm in 14 h at ground level,while it increased from 41 to 88 nm in 12 h at 260 m. Af-ter that, the GMD remained at relatively constant levels of70 and 100 nm at ground level and 260 m, respectively. Theubiquitously lower GMD and lower growth rates at groundlevel were likely due to the influences of local emissions thatcontained a large number of small particles. Note that thechanges in GMD were significant at ground level after thecontrol period, especially on polluted days (Fig. S6), indi-cating that the diurnal evolution of particle number size dis-tributions at ground level is subject to multiple influences.In contrast, the changes at 260 m were much smaller with arelatively consistent mode peaking at ∼ 100 nm, indicating amore constant particle source at higher altitudes.
The particle number ratios between 260 m and groundlevel depend strongly on particle size. As shown in Fig. 5,R260 m/ground increases rapidly between 15 and 100 nm asparticle size increases but is typically less than 1. This isconsistent with our previous conclusion that small particlesare more abundant at ground level due to the influencesof local emissions. R260 m/ground increases continuously andreaches a maximum at Dp =∼ 150 nm. One explanation isthe faster condensational and coagulable growth of smallparticles at 260 m than at ground level. Another explanationis the enhanced regional transport of 100–200 nm particlesat high altitude. This is consistent with the fact that muchhigher R260 m/ground was observed during polluted periodsthan clean periods. R260 m/ground decreased to less than 1 atDp>250 nm, likely due to the deposition of large particles.Our results show that the vertical differences in particle num-ber concentrations varied significantly as a function of size,which has important implications that the health and climateeffects of aerosol particles at different heights could be sub-stantially different.
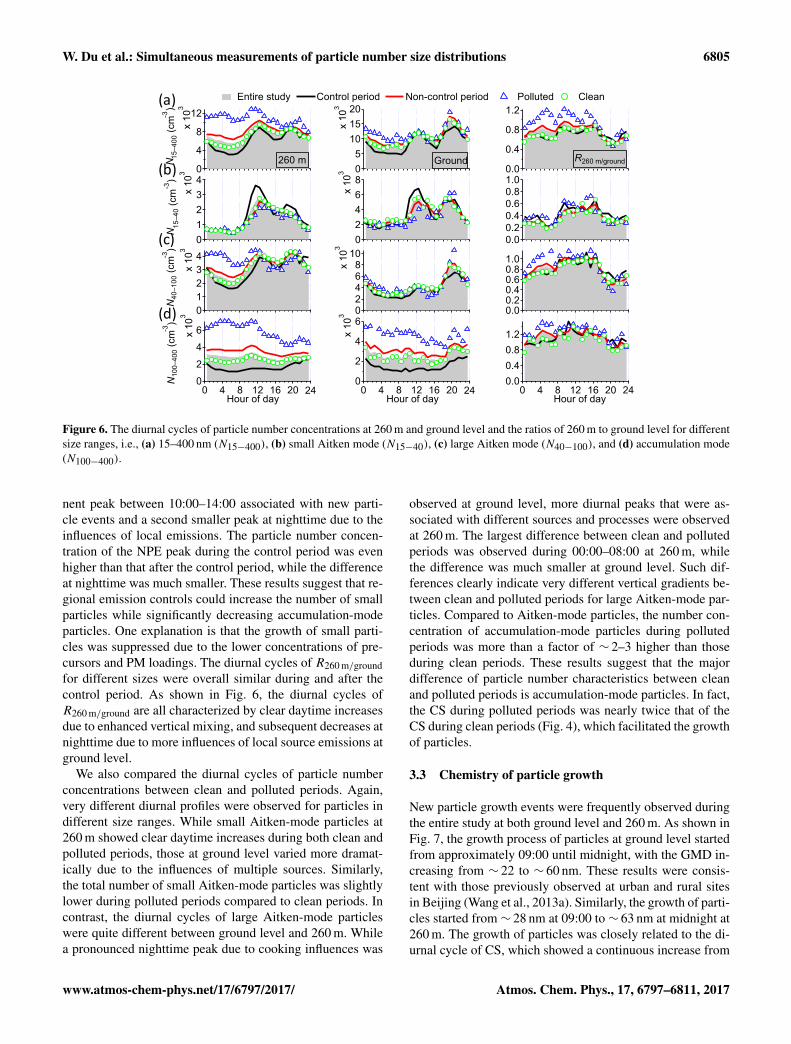
The diurnal cycles of particle number and volume concen-trations at 260 m and ground level, as well as R260 m/groundduring different periods, are illustrated in Figs. 6 and S7. Pro-nounced diurnal cycles with two clear peaks at noon and inthe evening were observed at both ground level and 260 m.Further analysis highlights that these two peaks were drivenby small and large Aitken-mode particles (Fig. 6b and c),likely representing two dominant sources of new particleformation and cooking emissions, respectively. In compari-son, the diurnal cycles of accumulation-mode particles wererelatively flat, indicating that the sources were mostly re-gional. Figure 6 shows that the total particle number con-centration during the control period was consistently lowerthan that after the control period, particularly during the timeperiod of 00:00–08:00. Such decreases were mainly causedby accumulation-mode particles that were reduced by 32–67 % at ground level and 23–69 % at 260 m throughout theday. In contrast, the diurnal cycle of small Aitken-mode par-ticles was substantially different, characterized by a promi-
Atmos. Chem. Phys., 17, 6797–6811, 2017 www.atmos-chem-phys.net/17/6797/2017/
W. Du et al.: Simultaneous measurements of particle number size distributions 6805
(a)
(b)
(c)
(d)
12
8
4
0x
103
43210
x 10
3
43210
x 10
3
6420
x 10
3
24201612840Hour of day
201510
50
x 10
3
86420
x 10
3
1086420
x 10
3
6
4
2
0
x 10
3
24201612840Hour of day
1.2
0.8
0.4
0.01.00.80.60.40.20.0
1.00.80.60.40.20.0
1.20.80.40.0
24201612840Hour of day
N 15–4
00 (c
m-3)
R260 m/groundN
15–4
0 (cm
-3)
N40
–100
(cm-3
)N
100–
400 (
cm-3
)
Entire study Control period Non-control period Polluted Clean
260 m Ground
Figure 6. The diurnal cycles of particle number concentrations at 260 m and ground level and the ratios of 260 m to ground level for differentsize ranges, i.e., (a) 15–400 nm (N15−400), (b) small Aitken mode (N15−40), (c) large Aitken mode (N40−100), and (d) accumulation mode(N100−400).
nent peak between 10:00–14:00 associated with new parti-cle events and a second smaller peak at nighttime due to theinfluences of local emissions. The particle number concen-tration of the NPE peak during the control period was evenhigher than that after the control period, while the differenceat nighttime was much smaller. These results suggest that re-gional emission controls could increase the number of smallparticles while significantly decreasing accumulation-modeparticles. One explanation is that the growth of small parti-cles was suppressed due to the lower concentrations of pre-cursors and PM loadings. The diurnal cycles of R260 m/groundfor different sizes were overall similar during and after thecontrol period. As shown in Fig. 6, the diurnal cycles ofR260 m/ground are all characterized by clear daytime increasesdue to enhanced vertical mixing, and subsequent decreases atnighttime due to more influences of local source emissions atground level.
We also compared the diurnal cycles of particle numberconcentrations between clean and polluted periods. Again,very different diurnal profiles were observed for particles indifferent size ranges. While small Aitken-mode particles at260 m showed clear daytime increases during both clean andpolluted periods, those at ground level varied more dramat-ically due to the influences of multiple sources. Similarly,the total number of small Aitken-mode particles was slightlylower during polluted periods compared to clean periods. Incontrast, the diurnal cycles of large Aitken-mode particleswere quite different between ground level and 260 m. Whilea pronounced nighttime peak due to cooking influences was
observed at ground level, more diurnal peaks that were as-sociated with different sources and processes were observedat 260 m. The largest difference between clean and pollutedperiods was observed during 00:00–08:00 at 260 m, whilethe difference was much smaller at ground level. Such dif-ferences clearly indicate very different vertical gradients be-tween clean and polluted periods for large Aitken-mode par-ticles. Compared to Aitken-mode particles, the number con-centration of accumulation-mode particles during pollutedperiods was more than a factor of ∼ 2–3 higher than thoseduring clean periods. These results suggest that the majordifference of particle number characteristics between cleanand polluted periods is accumulation-mode particles. In fact,the CS during polluted periods was nearly twice that of theCS during clean periods (Fig. 4), which facilitated the growthof particles.
3.3 Chemistry of particle growth
New particle growth events were frequently observed duringthe entire study at both ground level and 260 m. As shown inFig. 7, the growth process of particles at ground level startedfrom approximately 09:00 until midnight, with the GMD in-creasing from ∼ 22 to ∼ 60 nm. These results were consis-tent with those previously observed at urban and rural sitesin Beijing (Wang et al., 2013a). Similarly, the growth of parti-cles started from ∼ 28 nm at 09:00 to ∼ 63 nm at midnight at260 m. The growth of particles was closely related to the di-urnal cycle of CS, which showed a continuous increase from
www.atmos-chem-phys.net/17/6797/2017/ Atmos. Chem. Phys., 17, 6797–6811, 2017

6806 W. Du et al.: Simultaneous measurements of particle number size distributions
1.0
0.8
0.6
0.4
0.2
0.0
Frac
tion
Org SO4 NO3 NH4 Chl BC
1.0
0.8
0.6
0.4
0.2
0.0
Frac
tion
24201612840Hour of day
(a) (b)
(c) (d)10
2
468
100
2
46
Dp (
nm)
50
40
30
20
10
0
x 10-3
CS (s
-1)
260 m
10
2
468
100
2
46
Dp (
nm)
24201612840Hour of day
50
40
30
20
10
0
x 10-3
CS (s
-1)
Ground
Figure 7. Average diurnal evolution of particle number size distributions and aerosol composition at (a, b) 260 m and (c, d) ground level forthe new particle growth events. The dashed lines in panels (a) and (c) are the diurnal cycles of CS.
early morning to midnight. Also, aerosol composition hadsignificant changes during the growth periods. As indicatedin Fig. 7b and d, the contribution of organics first showed anincrease during the early growth period between 08:00 and12:00, while those of other chemical species remained small.After 12:00, both organics and sulfate showed increased con-tributions until 17:00. Although the increases in organics andsulfate were partly due to the decreases in nitrate and chloridebecause of the evaporative loss in the afternoon, our resultslikely indicate that organics played an important role in theearly stage of particle growth, while both organics and sulfateare important in the subsequent growth.
We further calculated the particle GRs for each growthevent that lasted more than 3 h (Fig. 8). The particle GRvaried from 1.4 to 7.5 nm h−1 at 260 m and from 1.5 to6.1 nm h−1 at ground level, which generally falls within therange that was reported previously in various environments,e.g., Beijing (Wu et al., 2007; Zhang et al., 2011), Shangdi-anzi (Shen et al., 2011), Egbert (Pierce et al., 2014), Mar-seille (Kulmala et al., 2005), and New Delhi (Sarangi et al.,2015). Particle growth rates strongly depend on temperatureand the availability of condensable vapors. Indeed, the par-ticle GR in the study generally correlated well with CS atboth ground level and 260 m during periods with low sulfateconcentrations (Fig. 8d and e). The average particle GR was3.6 nm h−1 at 260 m, which is slightly higher than 3.3 nm h−1
at ground level, which is likely due to the lower temperatureat high altitude. It is interesting to note that GR was cor-related with the change in organic concentration (1Org) at260 m, and also correlated well with 1Org during periodswith low sulfate concentrations (e.g., < 3 µg m−3) at groundlevel, likely indicating a dominant role of organics in parti-cle growth. As shown in Fig. 8a, high sulfate concentrationswere generally observed during polluted periods with high
PM loadings, and correspondingly, relatively higher GR wasrelated to higher sulfate concentration. Our results here sug-gest that the particle growth mechanisms could be differentbetween clean periods with a dominance of organics and pol-luted periods with significantly enhanced sulfate.
3.4 Source apportionment
PMF analysis of size-resolved particle number concentra-tions was able to identify four factors and five factors at260 m and ground level, respectively (Fig. 9). The five-factor solution at 260 m yielded a split factor that cannot bephysically interpreted. The average number size distributionsof factor 1 showed GMDs peaking at 20 and 27 nm at groundlevel and 260 m, respectively, and the temporal variationswere characterized by frequent sharp peaks on most days(Fig. 9c). It is clear that this factor was associated with newparticle events. This is further supported by the pronounceddiurnal cycles showing rapid increases between 08:00 and12:00, and a dominant source region to the west (Fig. S9a),where clean air masses were prevalent. However, we also no-ticed the differences in diurnal cycles between ground leveland 260 m. For example, the diurnal cycle of factor 1 at theground site showed two peaks during morning and eveningtraffic hours, likely indicating the influence of traffic emis-sions. In fact, the time series correlation between the twoheights was weak (r2
= 0.17), confirming that the sources offactor 1 are not the same. The average particle number con-centrations of factor 1 were 816 and 1067 cm−3 at groundlevel and 260 m during the control period. These values were31 and 38 % higher than those after the control period. Oneexplanation is due to the increase in CS after the control pe-riod, which facilitated the condensation and coagulation ofsmall particles. This result indicates that regional emission
Atmos. Chem. Phys., 17, 6797–6811, 2017 www.atmos-chem-phys.net/17/6797/2017/

W. Du et al.: Simultaneous measurements of particle number size distributions 6807
(a)
(b) (c)
(d) (e)8
6
4
2
0
GR
(nm
h-1
)
0.050.040.030.020.010.00CS (s-1)
Slope = 120.36
r2= 0.393
2
1
0
SO4 (µg m
-3)260 m
8
6
4
2
0
GR
(nm
h-1
)
0.050.040.030.020.010.00CS (s-1)
Slope = 253.82
r2= 0.704
3
2
1
0
SO4 (µg m
-3)
Ground
8
6
4
2
0
GR
(nm
h-1
)
121086420ΔOrg (µg m-3)
Slope = 1.02r2= 0.65
4
3
2
1
0
SO4 (µg m
-3)
Ground
40
30
20
10
0
Mass conc. (µg cm
-3)
2015-8-22 2015-8-27 2015-9-1 2015-9-6 2015-9-11 2015-9-16 2015-9-21 2015-9-26 2015-10-1
Date & time
8
6
4
2
0
GR
(nm
h-1
)
260 m GroundOrg SO4 NO3 NH4 Chl BC
8
6
4
2
0
GR
(nm
h-1
)
121086420ΔOrg (µg m-3)
Slope = 0.33
r2= 0.383
2
1
0
SO4 (µg m
-3)
260 m
Figure 8. (a) Time series of particle growth rates and corresponding average chemical composition for selected particle growth events. Panels(b) and (c) show the correlation of particle growth rates with the changes in the concentration of organics (1Org) at 260 m and ground level,respectively. Panels (d) and (e) show the correlation of particle growth rates with condensation sink at 260 m and ground level, respectively.The data points in (b–e) are color coded by the mass concentration of sulfate (SO4), and those with sulfate concentrations higher than3 µg m−3 (ground level) and 2.5 µg m−3 (260 m) are marked as triangle points.
controls could increase the number of nucleation mode par-ticles by reducing PM loadings and decreasing CS. Note thata higher number concentration of factor 1 during the controlperiod was also likely due to the more frequent new particleformation events associated with prevailing northerly winds(Zhao et al., 2017).
Factor 2 presented a size distribution peaking at ∼ 32 nmand a distinct diurnal cycle with two comparable and pro-nounced peaks at noon and in the evening. The diurnal cy-cle of factor 2 resembled that of organic aerosol from cook-ing that was widely reported in Beijing (Huang et al., 2010;Sun et al., 2013; Zhang et al., 2016; Elser et al., 2016; Xuet al., 2015). On average, this factor accounted for 25 % ofthe total particle number concentration and had only a smalldifference (2 %) between the control and non-control peri-ods. This factor was likely dominantly contributed by cook-
ing emissions, although particle growth can partly explainthe high concentrations during the late afternoon. Factor 3 atground level showed a similar diurnal cycle to factor 2, yetthe evening peak was much higher than the noon peak. Sucha diurnal profile was remarkably similar to that of organicaerosol from cooking that was resolved from PMF analy-sis of organic aerosol during the same study period (Zhaoet al., 2017). Also, the particle number size distribution offactor 3 was similar to that from cooking activities (Buo-nanno et al., 2011). These results supported the conclusionthat factor 3 was mainly from cooking emissions. Similar tofactor 2, there was only a small change (3 %) during and af-ter the control period, consistent with the fact that no controlmeasures were implemented near our sampling site duringthe control period. Compared to the ground site, factor 3 at260 m also showed two pronounced peaks in the diurnal pro-
www.atmos-chem-phys.net/17/6797/2017/ Atmos. Chem. Phys., 17, 6797–6811, 2017

6808 W. Du et al.: Simultaneous measurements of particle number size distributions
(a)
(b)
(c)10
8
6
4
2
0
x 10
3
102 4 6 8
1002 4 6
Dp
867 12 %
2066 29 %
2859 40 %
1412 20 %
dN/d
logD
p
Measured Model260 m
12
10
8
6
4
2
0
x 10
3
102 4 6 8
1002 4 6
Dp
695 7 %
2567 25 %
3376 33 %
2662 26 %
801 8 %
Factor 1
Factor 2
Factor 4
Fact
or 3
Factor 5
dN/d
logD
p
Ground
8
4
0
x 10
3 2015-8-22 2015-8-27 2015-9-1 2015-9-6 2015-9-11 2015-9-16 2015-9-21 2015-9-26 2015-10-1
Date & time
128
40
x 10
3
128
4
0
x 10
3
8
4
0
x 10
3
8
4
0x
103
Fact
or1
(cm
-3)
Fact
or2
(cm
-3)
Fact
or3
(cm
-3)
Fact
or4
(cm
-3)
Fact
or5
(cm
-3)
Control period Non-control periodCase 1 Case 2
Figure 9. Panels (a) and (b) show factor profiles of particle number size distributions at 260 m and ground level, respectively. (c) Comparisonsof the time series of PMF factors at 260 m (dashed gray lines) and ground level (color-coded lines).
file. However, the nighttime peak was much smaller than thatat ground level. This can be explained by the significantly en-hanced cooking emissions at nighttime at ground level. How-ever, the vertical mixing to high altitude was limited due tothe fact that the average number concentration at ground levelwas 3375 cm−3, which was 64 % higher than that at 260 m.This indicates stronger influences of local cooking emissionson particle numbers at lower altitudes. This factor moderatelycorrelated between ground level and 260 m (r2
= 0.37), indi-cating that cooking sources could also be different at differ-ent altitudes, for example, more contributions from regionalcooking emissions at higher altitudes. In addition, factor 3 at260 m was better correlated with the sum of factor 2 and fac-tor 3 at ground level (r2
= 0.40, Fig. S8), further supportingthat these three factors have similar sources. More evidenceis that factors 2 and 3 have the smallest influences from re-gional emission control among all factors.
Factors 4 and 5 showed quite different temporal varia-tions, but were generally characterized by high concentra-tions during polluted periods. As shown in Fig. 9, the timeseries of factor 4 was highly correlated between ground leveland 260 m (r2
= 0.74), although the peak diameter in sizedistributions was slightly different (114 and 98 nm, respec-tively). These results suggest a similar source of factor 4 atdifferent altitudes. The diurnal cycle of factor 4 was also sim-ilar at the two different heights, which both showed a smallnoon peak and high concentrations at night. Such a diurnalcycle was similar to that of less oxidized secondary organicaerosol (SOA) observed during the same study (Zhao et al.,2017). Therefore, we inferred that factor 4 is a secondary fac-tor that was associated with photochemical processing andsemi-volatile species. Compared to factor 4, factor 5 showed
the best correlation between the two heights (r2= 0.91), and
the time series and diurnal cycles were remarkably similar tothose of highly oxidized SOA and sulfate (Zhao et al., 2017),indicating that factor 5 is an aged secondary factor and wasmainly formed on a regional scale. Consistently, the bivari-ate polar plot of factor 5 showed a dominant source region tothe south, supporting a major influence of regional transportfrom the south. Regional emission controls showed large yetdifferent impacts on factor 4 and factor 5. While the averagenumber concentrations of factor 4 showed decreases of 49and 37 % at ground level and 260 m, respectively, during thecontrol period, those of factor 5 had the most reductions of 65and 74 %, respectively. These results are consistent with ourprevious conclusions that regional emission controls have themost impacts on highly aged secondary aerosols (Sun et al.,2016a; Zhao et al., 2017).
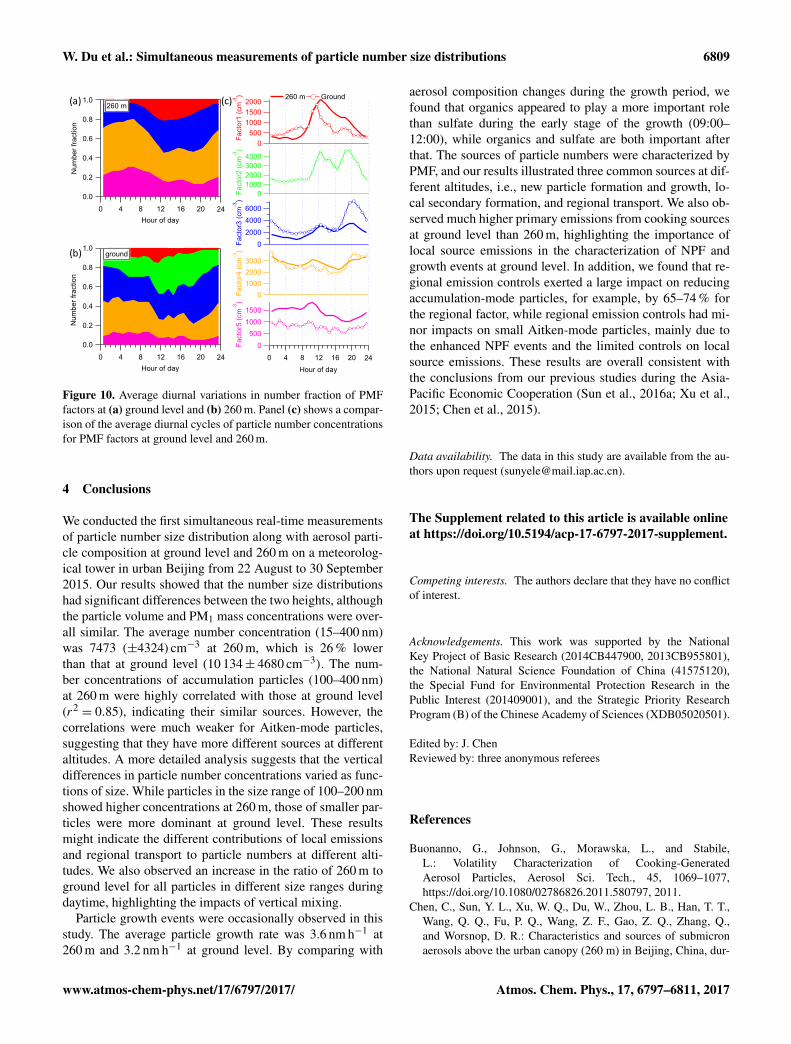
Overall, the five factors, which are associated with newparticle events, local primary emissions (e.g., cooking andtraffic emissions), and secondary formation with different ag-ing process, represent the major sources of particle numbersin the megacity of Beijing. The contribution of secondarysources was dominant at 260 m throughout the day by vary-ing from ∼ 50 to 80 % (Fig. 10b), and the average contribu-tion (60 %) was also higher than that (34 %) at ground level.In contrast, the cooking source was the largest contributor tothe total particle numbers, on average accounting for 33 %.Therefore, our results not only illustrated the similarities anddifferences of particle number concentrations and sourcesat different altitudes in the megacity, but also demonstratedthe different responses of source factors to regional emissioncontrols.
Atmos. Chem. Phys., 17, 6797–6811, 2017 www.atmos-chem-phys.net/17/6797/2017/
W. Du et al.: Simultaneous measurements of particle number size distributions 6809
(a)
(b)
(c)1.0
0.8
0.6
0.4
0.2
0.0
Num
ber f
ract
ion
24201612840Hour of day
260 m
1.0
0.8
0.6
0.4
0.2
0.0
Num
ber f
ract
ion
24201612840Hour of day
ground
200015001000500
0
Fact
or1
(cm
-3)
24201612840Hour of day
300020001000
0Fact
or4
(cm
-3)
15001000500
0Fact
or5
(cm
-3)
600040002000
0Fact
or3
(cm
-3)
4000300020001000
0Fact
or2
(cm
-3)
260 m Ground
Figure 10. Average diurnal variations in number fraction of PMFfactors at (a) ground level and (b) 260 m. Panel (c) shows a compar-ison of the average diurnal cycles of particle number concentrationsfor PMF factors at ground level and 260 m.
4 Conclusions
We conducted the first simultaneous real-time measurementsof particle number size distribution along with aerosol parti-cle composition at ground level and 260 m on a meteorolog-ical tower in urban Beijing from 22 August to 30 September2015. Our results showed that the number size distributionshad significant differences between the two heights, althoughthe particle volume and PM1 mass concentrations were over-all similar. The average number concentration (15–400 nm)was 7473 (±4324) cm−3 at 260 m, which is 26 % lowerthan that at ground level (10 134± 4680 cm−3). The num-ber concentrations of accumulation particles (100–400 nm)at 260 m were highly correlated with those at ground level(r2= 0.85), indicating their similar sources. However, the
correlations were much weaker for Aitken-mode particles,suggesting that they have more different sources at differentaltitudes. A more detailed analysis suggests that the verticaldifferences in particle number concentrations varied as func-tions of size. While particles in the size range of 100–200 nmshowed higher concentrations at 260 m, those of smaller par-ticles were more dominant at ground level. These resultsmight indicate the different contributions of local emissionsand regional transport to particle numbers at different alti-tudes. We also observed an increase in the ratio of 260 m toground level for all particles in different size ranges duringdaytime, highlighting the impacts of vertical mixing.
Particle growth events were occasionally observed in thisstudy. The average particle growth rate was 3.6 nm h−1 at260 m and 3.2 nm h−1 at ground level. By comparing with
aerosol composition changes during the growth period, wefound that organics appeared to play a more important rolethan sulfate during the early stage of the growth (09:00–12:00), while organics and sulfate are both important afterthat. The sources of particle numbers were characterized byPMF, and our results illustrated three common sources at dif-ferent altitudes, i.e., new particle formation and growth, lo-cal secondary formation, and regional transport. We also ob-served much higher primary emissions from cooking sourcesat ground level than 260 m, highlighting the importance oflocal source emissions in the characterization of NPF andgrowth events at ground level. In addition, we found that re-gional emission controls exerted a large impact on reducingaccumulation-mode particles, for example, by 65–74 % forthe regional factor, while regional emission controls had mi-nor impacts on small Aitken-mode particles, mainly due tothe enhanced NPF events and the limited controls on localsource emissions. These results are overall consistent withthe conclusions from our previous studies during the Asia-Pacific Economic Cooperation (Sun et al., 2016a; Xu et al.,2015; Chen et al., 2015).
Data availability. The data in this study are available from the au-thors upon request ([email protected]).
The Supplement related to this article is available onlineat https://doi.org/10.5194/acp-17-6797-2017-supplement.
Competing interests. The authors declare that they have no conflictof interest.
Acknowledgements. This work was supported by the NationalKey Project of Basic Research (2014CB447900, 2013CB955801),the National Natural Science Foundation of China (41575120),the Special Fund for Environmental Protection Research in thePublic Interest (201409001), and the Strategic Priority ResearchProgram (B) of the Chinese Academy of Sciences (XDB05020501).
Edited by: J. ChenReviewed by: three anonymous referees
References
Buonanno, G., Johnson, G., Morawska, L., and Stabile,L.: Volatility Characterization of Cooking-GeneratedAerosol Particles, Aerosol Sci. Tech., 45, 1069–1077,https://doi.org/10.1080/02786826.2011.580797, 2011.
Chen, C., Sun, Y. L., Xu, W. Q., Du, W., Zhou, L. B., Han, T. T.,Wang, Q. Q., Fu, P. Q., Wang, Z. F., Gao, Z. Q., Zhang, Q.,and Worsnop, D. R.: Characteristics and sources of submicronaerosols above the urban canopy (260 m) in Beijing, China, dur-
www.atmos-chem-phys.net/17/6797/2017/ Atmos. Chem. Phys., 17, 6797–6811, 2017
6810 W. Du et al.: Simultaneous measurements of particle number size distributions
ing the 2014 APEC summit, Atmos. Chem. Phys., 15, 12879–12895, https://doi.org/10.5194/acp-15-12879-2015, 2015.
Elser, M., Huang, R.-J., Wolf, R., Slowik, J. G., Wang, Q.,Canonaco, F., Li, G., Bozzetti, C., Daellenbach, K. R., Huang,Y., Zhang, R., Li, Z., Cao, J., Baltensperger, U., El-Haddad, I.,and Prévôt, A. S. H.: New insights into PM2.5 chemical composi-tion and sources in two major cities in China during extreme hazeevents using aerosol mass spectrometry, Atmos. Chem. Phys., 16,3207–3225, https://doi.org/10.5194/acp-16-3207-2016, 2016.
Gao, J., Chai, F., Wang, T., Wang, S., and Wang, W.: Particlenumber size distribution and new particle formation: New char-acteristics during the special pollution control period in Bei-jing, J. Environ. Sci., 24, 14–21, https://doi.org/10.1016/s1001-0742(11)60725-0, 2012.
Guo, S., Hu, M., Zamora, M. L., Peng, J., Shang, D., Zheng,J., Du, Z., Wu, Z., Shao, M., Zeng, L., Molina, M. J.,and Zhang, R.: Elucidating severe urban haze formationin China, P. Natl. Acad. Sci. USA, 111, 17373–17378,https://doi.org/10.1073/pnas.1419604111, 2014.
Han, X., Guo, Q., Liu, C., Strauss, H., Yang, J., Hu, J.,Wei, R., Tian, L., Kong, J., and Peters, M.: Effect ofthe pollution control measures on PM2.5 during the 2015China Victory Day Parade: Implication from water-solubleions and sulfur isotope, Environ. Pollut., 218, 230–241,https://doi.org/10.1016/j.envpol.2016.06.038, 2016.
Huang, X.-F., He, L.-Y., Hu, M., Canagaratna, M. R., Sun, Y.,Zhang, Q., Zhu, T., Xue, L., Zeng, L.-W., Liu, X.-G., Zhang,Y.-H., Jayne, J. T., Ng, N. L., and Worsnop, D. R.: Highlytime-resolved chemical characterization of atmospheric submi-cron particles during 2008 Beijing Olympic Games using anAerodyne High-Resolution Aerosol Mass Spectrometer, Atmos.Chem. Phys., 10, 8933–8945, https://doi.org/10.5194/acp-10-8933-2010, 2010.
Kulmala, M., Petäjä, T., Mönkkönen, P., Koponen, I. K., Dal Maso,M., Aalto, P. P., Lehtinen, K. E. J., and Kerminen, V.-M.: On thegrowth of nucleation mode particles: source rates of condensablevapor in polluted and clean environments, Atmos. Chem. Phys.,5, 409–416, https://doi.org/10.5194/acp-5-409-2005, 2005.
Kulmala, M., Petaja, T., Kerminen, V. M., Kujansuu, J., Ruuska-nen, T., Ding, A. J., Nie, W., Hu, M., Wang, Z. B., Wu, Z.J., Wang, L., and Worsnop, D. R.: On secondary new parti-cle formation in China, Front. Env. Sci. Eng., 10, 191–200,https://doi.org/10.1007/s11783-016-0850-1, 2016.
Li, H. Y., Zhang, Q., Duan, F. K., Zheng, B., and He, K.B.: The “Parade Blue”: effects of short-term emission con-trol on aerosol chemistry, Faraday Discuss., 189, 317–335,https://doi.org/10.1039/c6fd00004e, 2016.
Liu, Z. R., Hu, B., Liu, Q., Sun, Y., and Wang, Y. S.: Source ap-portionment of urban fine particle number concentration dur-ing summertime in Beijing, Atmos. Environ., 96, 359–369,https://doi.org/10.1016/j.atmosenv.2014.06.055, 2014.
Ma, J., Xu, X., Zhao, C., and Yan, P.: A review of atmosphericchemistry research in China: Photochemical smog, haze pollu-tion, and gas-aerosol interactions, Adv. Atmos. Sci., 29, 1006–1026, https://doi.org/10.1007/s00376-012-1188-7, 2012.
Nieminen, T., Lehtinen, K. E. J., and Kulmala, M.: Sub-10 nm par-ticle growth by vapor condensation – effects of vapor moleculesize and particle thermal speed, Atmos. Chem. Phys., 10, 9773–9779, https://doi.org/10.5194/acp-10-9773-2010, 2010.
Ogulei, D., Hopke, P. K., Chalupa, D. C., and Utell, M. J.: ModelingSource Contributions to Submicron Particle Number Concentra-tions Measured in Rochester, New York, Aerosol Sci. Tech., 41,179–201, https://doi.org/10.1080/02786820601116012, 2007.
Paatero, P. and Tapper, U.: Positive Matrix Factorization -A Nonnegative Factor Model With Optimal Utilization ofError-estimates of Data Values, Environmetrics, 5, 111–126,https://doi.org/10.1002/env.3170050203, 1994.
Pierce, J. R., Westervelt, D. M., Atwood, S. A., Barnes, E. A.,and Leaitch, W. R.: New-particle formation, growth and climate-relevant particle production in Egbert, Canada: analysis from 1year of size-distribution observations, Atmos. Chem. Phys., 14,8647–8663, https://doi.org/10.5194/acp-14-8647-2014, 2014.
Reutter, P., Su, H., Trentmann, J., Simmel, M., Rose, D., Gunthe,S. S., Wernli, H., Andreae, M. O., and Pöschl, U.: Aerosol- andupdraft-limited regimes of cloud droplet formation: influence ofparticle number, size and hygroscopicity on the activation ofcloud condensation nuclei (CCN), Atmos. Chem. Phys., 9, 7067–7080, https://doi.org/10.5194/acp-9-7067-2009, 2009.
Salcedo, D., Onasch, T. B., Dzepina, K., Canagaratna, M. R.,Zhang, Q., Huffman, J. A., DeCarlo, P. F., Jayne, J. T., Mor-timer, P., Worsnop, D. R., Kolb, C. E., Johnson, K. S., Zuberi,B., Marr, L. C., Volkamer, R., Molina, L. T., Molina, M. J., Car-denas, B., Bernabé, R. M., Márquez, C., Gaffney, J. S., Marley,N. A., Laskin, A., Shutthanandan, V., Xie, Y., Brune, W., Lesher,R., Shirley, T., and Jimenez, J. L.: Characterization of ambientaerosols in Mexico City during the MCMA-2003 campaign withAerosol Mass Spectrometry: results from the CENICA Supersite,Atmos. Chem. Phys., 6, 925–946, https://doi.org/10.5194/acp-6-925-2006, 2006.
Sarangi, B., Aggarwal, S. G., and Gupta, P. K.: A Simpli-fied Approach to Calculate Particle Growth Rate Dueto Self-Coagulation, Scavenging and Condensation Us-ing SMPS Measurements during a Particle Growth Eventin New Delhi, Aerosol Air Qual. Res., 15, 166–179,https://doi.org/10.4209/aaqr.2013.12.0350, 2015.
Shen, X. J., Sun, J. Y., Zhang, Y. M., Wehner, B., Nowak, A.,Tuch, T., Zhang, X. C., Wang, T. T., Zhou, H. G., Zhang, X.L., Dong, F., Birmili, W., and Wiedensohler, A.: First long-termstudy of particle number size distributions and new particle for-mation events of regional aerosol in the North China Plain, At-mos. Chem. Phys., 11, 1565–1580, https://doi.org/10.5194/acp-11-1565-2011, 2011.
Shen, X. J., Sun, J. Y., Zhang, X. Y., Zhang, Y. M., Zhang, L., Fan,R. X., Zhang, Z. X., Zhang, X. L., Zhou, H. G., Zhou, L. Y.,Dong, F., and Shi, Q. F.: The influence of emission control onparticle number size distribution and new particle formation dur-ing China’s V-Day parade in 2015, Sci. Total Environ., 573, 409–419, https://doi.org/10.1016/j.scitotenv.2016.08.085, 2016.
Sun, J., Zhang, Q., Canagaratna, M. R., Zhang, Y., Ng, N. L.,Sun, Y., Jayne, J. T., Zhang, X., Zhang, X., and Worsnop,D. R.: Highly time- and size-resolved characterization ofsubmicron aerosol particles in Beijing using an AerodyneAerosol Mass Spectrometer, Atmos. Environ., 44, 131–140,https://doi.org/10.1016/j.atmosenv.2009.03.020, 2010.
Sun, Y., Jiang, Q., Wang, Z., Fu, P., Li, J., Yang, T., and Yin, Y.:Investigation of the sources and evolution processes of severehaze pollution in Beijing in January 2013, J. Geophys. Res., 119,4380–4398, https://doi.org/10.1002/2014jd021641, 2014.
Atmos. Chem. Phys., 17, 6797–6811, 2017 www.atmos-chem-phys.net/17/6797/2017/

W. Du et al.: Simultaneous measurements of particle number size distributions 6811
Sun, Y. L., Wang, Z. F., Fu, P. Q., Yang, T., Jiang, Q., Dong, H. B.,Li, J., and Jia, J. J.: Aerosol composition, sources and processesduring wintertime in Beijing, China, Atmos. Chem. Phys., 13,4577–4592, https://doi.org/10.5194/acp-13-4577-2013, 2013.
Sun, Y. L., Wang, Z. F., Du, W., Zhang, Q., Wang, Q. Q., Fu, P.Q., Pan, X. L., Li, J., Jayne, J., and Worsnop, D. R.: Long-term real-time measurements of aerosol particle compositionin Beijing, China: seasonal variations, meteorological effects,and source analysis, Atmos. Chem. Phys., 15, 10149–10165,https://doi.org/10.5194/acp-15-10149-2015, 2015a.
Sun, Y. L., Du, W., Wang, Q., Zhang, Q., Chen, C., Chen,Y., Chen, Z., Fu, P., Wang, Z., Gao, Z., and Worsnop, D.R.: Real-Time Characterization of Aerosol Particle Composi-tion above the Urban Canopy in Beijing: Insights into theInteractions between the Atmospheric Boundary Layer andAerosol Chemistry, Environ. Sci. Technol., 49, 11340–11347,https://doi.org/10.1021/acs.est.5b02373, 2015b.
Sun, Y. L., Wang, Z. F., Wild, O., Xu, W. Q., Chen, C., Fu, P.Q., Du, W., Zhou, L. B., Zhang, Q., Han, T. T., Wang, Q.Q., Pan, X. L., Zheng, H. T., Li, J., Guo, X. F., Liu, J. G.,and Worsnop, D. R.: “APEC Blue”: Secondary Aerosol Reduc-tions from Emission Controls in Beijing, Sci. Rep., 6, 20668,https://doi.org/10.1038/srep20668, 2016a.
Sun, Y., Chen, C., Zhang, Y., Xu, W., Zhou, L., Cheng, X.,Zheng, H., Ji, D., Li, J., Tang, X., Fu, P., and Wang, Z.:Rapid formation and evolution of an extreme haze episodein Northern China during winter 2015, Sci. Rep., 6, 27151,https://doi.org/10.1038/srep27151, 2016b.
Takegawa, N., Miyakawa, T., Kuwata, M., Kondo, Y., Zhao, Y.,Han, S., Kita, K., Miyazaki, Y., Deng, Z., Xiao, R., Hu, M.,van Pinxteren, D., Herrmann, H., Hofzumahaus, A., Holland,F., Wahner, A., Blake, D. R., Sugimoto, N., and Zhu, T.: Vari-ability of submicron aerosol observed at a rural site in Bei-jing in the summer of 2006, J. Geophys. Res., 114, 1291–1298,https://doi.org/10.1029/2008jd010857, 2009.
Tan, H. B., Xu, H. B., Wan, Q. L., Li, F., Deng, X. J., Chan, P. W.,Xia, D., and Yin, Y.: Design and Application of an UnattendedMultifunctional H-TDMA System, J. Atmos. Ocean. Tech., 30,1136–1148, https://doi.org/10.1175/jtech-d-12-00129.1, 2013.
Ulbrich, I. M., Canagaratna, M. R., Zhang, Q., Worsnop, D. R., andJimenez, J. L.: Interpretation of organic components from Posi-tive Matrix Factorization of aerosol mass spectrometric data, At-mos. Chem. Phys., 9, 2891–2918, https://doi.org/10.5194/acp-9-2891-2009, 2009.
Wang, Z. B., Hu, M., Sun, J. Y., Wu, Z. J., Yue, D. L., Shen,X. J., Zhang, Y. M., Pei, X. Y., Cheng, Y. F., and Wieden-sohler, A.: Characteristics of regional new particle forma-tion in urban and regional background environments in theNorth China Plain, Atmos. Chem. Phys., 13, 12495–12506,https://doi.org/10.5194/acp-13-12495-2013, 2013a.
Wang, Z. B., Hu, M., Wu, Z. J., Yue, D. L., He, L. Y., Huang,X. F., Liu, X. G., and Wiedensohler, A.: Long-term measure-ments of particle number size distributions and the relation-ships with air mass history and source apportionment in thesummer of Beijing, Atmos. Chem. Phys., 13, 10159–10170,https://doi.org/10.5194/acp-13-10159-2013, 2013b.
Wehner, B., Wiedensohler, A., Tuch, T. M., Wu, Z. J., Hu, M.,Slanina, J., and Kiang, C. S.: Variability of the aerosol numbersize distribution in Beijing, China: New particle formation, duststorms, and high continental background, Geophys. Res. Lett.,31, 217–244, https://doi.org/10.1029/2004gl021596, 2004.
Wiedensohler, A., Birmili, W., Nowak, A., Sonntag, A., Weinhold,K., Merkel, M., Wehner, B., Tuch, T., Pfeifer, S., Fiebig, M.,Fjäraa, A. M., Asmi, E., Sellegri, K., Depuy, R., Venzac, H., Vil-lani, P., Laj, P., Aalto, P., Ogren, J. A., Swietlicki, E., Williams,P., Roldin, P., Quincey, P., Hüglin, C., Fierz-Schmidhauser, R.,Gysel, M., Weingartner, E., Riccobono, F., Santos, S., Grün-ing, C., Faloon, K., Beddows, D., Harrison, R., Monahan, C.,Jennings, S. G., O’Dowd, C. D., Marinoni, A., Horn, H.-G.,Keck, L., Jiang, J., Scheckman, J., McMurry, P. H., Deng, Z.,Zhao, C. S., Moerman, M., Henzing, B., de Leeuw, G., Löschau,G., and Bastian, S.: Mobility particle size spectrometers: har-monization of technical standards and data structure to facili-tate high quality long-term observations of atmospheric parti-cle number size distributions, Atmos. Meas. Tech., 5, 657–685,https://doi.org/10.5194/amt-5-657-2012, 2012.
Wu, Z., Hu, M., Liu, S., Wehner, B., Bauer, S., Ma ßling, A.,Wiedensohler, A., Petäjä, T., Dal Maso, M., and Kulmala,M.: New particle formation in Beijing, China: Statistical anal-ysis of a 1-year data set, J. Geophys. Res., 112, 797–806,https://doi.org/10.1029/2006jd007406, 2007.
Wu, Z., Hu, M., Yue, D., Wehner, B., and Wiedensohler,A.: Evolution of particle number size distribution in an ur-ban atmosphere during episodes of heavy pollution and newparticle formation, Sci. China. Earth. Sci., 54, 1772–1778,https://doi.org/10.1007/s11430-011-4227-9, 2011.
Xu, W. Q., Sun, Y. L., Chen, C., Du, W., Han, T. T., Wang, Q.Q., Fu, P. Q., Wang, Z. F., Zhao, X. J., Zhou, L. B., Ji, D.S., Wang, P. C., and Worsnop, D. R.: Aerosol composition,oxidation properties, and sources in Beijing: results from the2014 Asia-Pacific Economic Cooperation summit study, Atmos.Chem. Phys., 15, 13681–13698, https://doi.org/10.5194/acp-15-13681-2015, 2015.
Yue, D., Hu, M., Wu, Z., Wang, Z., Guo, S., Wehner, B., Nowak,A., Achtert, P., Wiedensohler, A., Jung, J., Kim, Y. J., and Liu,S.: Characteristics of aerosol size distributions and new particleformation in the summer in Beijing, J. Geophys. Res., 114, 1159–1171, https://doi.org/10.1029/2008jd010894, 2009.
Zhang, J. K., Wang, L. L., Wang, Y. H., and Wang, Y. S.: Sub-micron aerosols during the Beijing Asia–Pacific Economic Co-operation conference in 2014, Atmos. Environ., 124, 224–231,https://doi.org/10.1016/j.atmosenv.2015.06.049, 2016.
Zhang, Y. M., Zhang, X. Y., Sun, J. Y., Lin, W. L., Gong, S.L., Shen, X. J., and Yang, S.: Characterization of new particleand secondary aerosol formation during summertime in Beijing,China, Tellus B, 63, 382–394, https://doi.org/10.1111/j.1600-0889.2011.00533.x, 2011.
Zhao, J., Du, W., Zhang, Y., Wang, Q., Chen, C., Xu, W., Han,T., Wang, Y., Fu, P., Wang, Z., Li, Z., and Sun, Y.: Insightsinto aerosol chemistry during the 2015 China Victory Day pa-rade: results from simultaneous measurements at ground leveland 260?m in Beijing, Atmos. Chem. Phys., 17, 3215–3232,https://doi.org/10.5194/acp-17-3215-2017, 2017.
www.atmos-chem-phys.net/17/6797/2017/ Atmos. Chem. Phys., 17, 6797–6811, 2017