simultaneous saccharification and …oaktrust.library.tamu.edu/.../hernandez-thesis.pdf · joan...
TRANSCRIPT

SIMULTANEOUS SACCHARIFICATION AND FERMENTATION OF
DRY-GRIND HIGHLY DIGESTIBLE GRAIN SORGHUM LINES
FOR ETHANOL PRODUCTION
A Thesis
by
JOAN ROLLOG HERNANDEZ
Submitted to the Office of Graduate Studies of
Texas A&M University
in partial fulfillment of the requirements for the degree of
MASTER OF SCIENCE
May 2009
Major Subject: Biological and Agricultural Engineering

SIMULTANEOUS SACCHARIFICATION AND FERMENTATION OF
DRY-GRIND HIGHLY DIGESTIBLE GRAIN SORGHUM LINES
FOR ETHANOL PRODUCTION
A Thesis
by
JOAN ROLLOG HERNANDEZ
Submitted to the Office of Graduate Studies of
Texas A&M University
in partial fulfillment of the requirements for the degree of
MASTER OF SCIENCE
Approved by:
Chair of Committee, Sergio C. Capareda
Committee Members, Dirk B. Hays
Raghupathy Karthikeyan
Calvin B. Parnell, Jr.
William L. Rooney
Head of Department, Gerald L. Riskowsky
May 2009
Major Subject: Biological and Agricultural Engineering

iii
ABSTRACT
Simultaneous Saccharification and Fermentation of Dry-grind Highly Digestible Grain
Sorghum Lines for Ethanol Production. (May 2009)
Joan Rollog Hernandez, B.S.; M.S., University of the Philippines at Los Baños, Philippines
Chair of Advisory Committee: Dr. Sergio C. Capareda
The potential of high digestible grain sorghum (HDGS) with a modified starch
protein endosperm matrix to replace corn in ethanol production was investigated using dry
grind simultaneous saccharification and fermentation (SSF). Preliminary experiments
showed that HDGS yielded higher amounts of glucose and ethanol than normal digestible
grain sorghum (NDGS) and corn particularly in the first 48 hrs of fermentation. It was
hypothesized that fast conversion of starch to glucose and ethanol during hydrolysis and
fermentation are results of improved protein digestibility of HDGS.
The invagination of protein structures in HDGS produced a flourier endosperm
texture, softer kernels and lower starch content than the normal digestible protein (ND)
lines. Highly digestible protein (HD) lines have better pasting properties (significantly
lower pasting temperature, faster rate of gelatinization and higher peak viscosity) than ND
lines based on the RVA profile. Increasing protein digestibility of the HDGS improved
starch digestibility (increased rate of glucose conversion and total glucose yield during
saccharification), which is supported by highly significant correlation of turbidity with rate
of glucose conversion and efficiency of enzymatic conversion.

iv
The efficiency of ethanol conversion is significantly correlated with starch
digestibility, pasting properties, and protein digestibility. Results also showed that HD
sorghum lines had significantly faster rate of conversion and shorter reaction time needed
to achieve completion than ND sorghum lines and corn. Increasing the dry solid
concentration from 22% to 30% (w/v) increased the ethanol yield from 8% v/v to 13%v/v.
This will allow considerable saving of water, reduced distillation cost and increased
ethanol production for a given plant capacity and labor cost.
Fineness of grind influences the amount of sugar formed due to variation in surface
area of the flour. The hypothesis that finer particles has faster and higher glucose yield,
defined as g of glucose converted per g of theoretical glucose, is supported by highly
significant correlation of mass fraction of 3 to 60 m size range and mass median diameter
(MMD) of 60 to 1000 m size range with glucose conversion efficiency and glucose
conversion rate during saccharification and fermentation.
v
DEDICATION
This thesis is dedicated to my father, Jose F. Hernandez, my mother, Julie R.
Hernandez, and my only sister, Jonalyn R. Hernandez, who have always been supportive to
me since the beginning of my studies. Their unconditional love and unwavering faith in me
are my sources of strength and inspiration to dream more and achieve further.
Also, this thesis is dedicated to my fiancé, Amado L. Maglinao, Jr., who has been
there always beside me through thick and thin. Having you in my life, every moment has
been amazing, meaningful and exciting to live. Nothing is impossible to do having your
love, kindness and care. With these, all I can do is to care and love you more than you do.
And “… all I wanna do, is grow old with you…”.
Finally, this thesis is dedicated to all those who believe in the richness of learning,
specifically to my future parents-in-law, Erlinda Maglinao and Dr. Amado Maglinao, Sr.
Their guidance and advice, whether academic or personal, is a great source of direction,
motivation and inspiration to move forward.

vi
ACKNOWLEDGEMENTS
I would like to thank God for all the blessings that I have received, for providing
me the strength when I feel hopeless and down, and for the opportunity and gift of living in
a world filled with beauty and excitement. He has blessed me each day with a loving
family, supportive friends, and a great graduate committee all whom have made my
experience at Texas A&M University so wonderful and a reality.
Special thanks to the distinguished faculty members who served as my committee:
Sergio C. Capareda (chair), Dirk B. Hays, Raghupathy Karthikeyan, Calvin B. Parnell, Jr.
and William L. Rooney. As chair of my advisory committee, Dr. Capareda provided full
support and encouragement during research and thesis preparation. Thanks to all my
committee members for their guidance, patience, support, and helpful suggestions and
comments throughout the course of this research.
Thanks also to the BAEN department faculty and staff, co-majors and colleagues,
especially to my ―Kuya”, Froilan Aquino, for always giving me a helping hand throughout
my studies and research. Thanks for sharing the ―laughter‖, your friendship and wonderful
escapades, which really helped me enjoy every day at Texas A&M. To all the student
workers who helped me in the lab especially to Bert, Greg, Jared, Ellisa, Mary, Kyla and
Ordway, thank you very much. Thanks to all for your help and support. My stay at BAEN,
Texas A&M University has become a great learning experience.
I also want to extend my gratitude to the Texas Agricultural Experiment Station
(TAES), TAMU Cotton Chair (Dr. Parnell), the Cotton Foundation, Dr. Capareda and Dr.

vii
Hays for generously providing financial support during my studies and research. Thanks
are also given to Genencor International, Incorporated, to the Sorghum Breeding Program
at the Soil and Crop Sciences Department, Texas A&M University and to Ostilio Portillo
for providing enzymes, grain sorghum lines and the protein digestibilty characterization of
each line, respectively. Without them, this research would not have been started and
finished.
I would like to extend my gratitude to Dr. Maglinao for devoting his precious time
to edit my papers and manuscript. Thanks also to my current and former housemates
(Madz, Froi, Noah, Rose, Bjorn, Sam and JC) and to the entire Filipino community (Roy &
Faye, Kuya Pete & Ate Novie, Kuya Zenon, Ate Coco, Tita Nora and Tito Rey, Tita Lou
and Tito John, Kuya Amor and a lot more) that I have met here in Bryan-College Station
and all over the United States, for making my stay worthwhile. I really enjoy and
appreciate all your company and help. May God bless you always in your daily lives.
Finally, thanks to my family, both the Hernanadez and Maglinao families, for their
love, encouragement, support and guidance. I am so honored and grateful to have you all in
my life. Thank you and I love you very much!
viii
NOMENCLATURE
ANOVA- Analysis of Variance
BTU-British Thermal Unit
d.b-Dry basis
DDGS-Distiller Dried Grain Solubles
DG- Digestible Group
h- Hour
HD- Highly Digestible Protein
HDGS- High Digestible Grain Sorghum HPLC- High performance liquid chromatography
LSD- Fisher’s Least Significant Difference Test
min- Minute
N- Normality
MTBE- metyl tert butyl ether
NIR- Near Infrared Reflectance Spectrophotometer
ND- Normal Digestible Protein
NDGS- Normal Digestible Grain Sorghum
PDA- Potato Dextrose Agar
RIL- Recombinant Inbred Line
RFS- Renewable Fuel Standard
RVA-Rapid Visco Analyzer
rpm- Revolutions Per Minute
SKHT- Single Kernel Hardness Test
ix
SSF- Simultaneous Saccharification and Fermentation
TCA- Trichloro Acetic Acid
w.b.-Wet basis
WT- Wild Type
μL- Microliter
m- Micrometer
Hoc – Heat of combustion

x
TABLE OF CONTENTS
Page
ABSTRACT .............................................................................................................. iii
DEDICATION .......................................................................................................... v
ACKNOWLEDGEMENTS ...................................................................................... vi
NOMENCLATURE .................................................................................................. viii
TABLE OF CONTENTS .......................................................................................... x
LIST OF FIGURES ................................................................................................... xii
LIST OF TABLES .................................................................................................... xiii
CHAPTER
I INTRODUCTION: IMPORTANCE OF THE RESEARCH ............... 1
II SIMULTANEOUS SACCHARIFICATION AND FERMENTATION
OF HIGH DIGESTIBLE VARIETY OF GRAIN SORGHUM FOR
ETHANOL PRODUCTION ................................................................ 7
Overview…………………………………………..……………… 7
Introduction………………………………………….……………. 8
Materials and Methods……………………..................................... 11
Results and Discussion……………………………….…………… 15
Conclusions….................................................................................. 22
III FACTORS AFFECTING BIO-CONVERSION OF SORGHUM
FLOUR IN DRY GRIND ETHANOL PROCESS…………………… .. 24
Overview………………………………………….………………. 24
Introduction………………………………………….……………..... 25
Materials and Methods..……………………………………………... 30
Results and Discussion……………………………….……………… 39
Conclusions.......................................................................................... 57
IV CONCLUSIONS………………………………………………………….. 59

xi
Page
REFERENCES .......................................................................................................... 61
VITA ......................................................................................................................... 66

xii
LIST OF FIGURES
Page
Figure 1 The glucose to ethanol fermentation pathway. .................................. 4
Figure 2 HPLC chromatograms of NDGS, HDGS and corn. .......................... 17
Figure 3 Glucose concentration of the control during starch hydrolysis and
saccharification. ................................................................................. 18
Figure 4 Change in viable yeast cells and glucose concentration during 72
hours of the grain hydrolyzates fermentation .................................... 20
Figure 5 Ethanol concentration during 72 h of simultaneous hydrolysis and
ethanol fermentation. ......................................................................... 21
Figure 6 Comparison of the dry grind and wet mill processes for production
of ethanol ........................................................................................... 26
Figure 7 Digestible group based on 60 min turbidity assay. ........................... 31
Figure 8 RVA curves of HD and ND sorghum samples selected from 18
cultivars using the 13-min temperature profile ................................. 42
Figure 9 Ethanol concentrations (%v/v) at 24, 48 and 72 h SSF of 18
sorghum cultivars. ............................................................................. 48
Figure 10 Comparison of ethanol concentration during 72 h SSF of HDGS, NDGS
and corn at 30% dry solid .................................................................. 50
Figure 11 Particle size distribution of sorghum flour samples .......................... 52
Figure 12 Percentage (%w/w) of the bimodal distribution which has a
particle size range of 3 to 60 m and 60 to 1000 m ........................ 53

xiii
LIST OF TABLES
Page
Table 1 Absorbance reading of extraction buffer and starch content of the
sorghum grain samples. ..................................................................... 16
Table 2 Glucose yield during starch hydrolysis and saccharification of the
control samples of NDGS, HDGS and corn. ..................................... 19
Table 3 Ethanol yield during simultaneous saccharification and fermentation
of grain substrates. ............................................................................. 22
Table 4 Physical properties and chemical composition of the sorghum
samples. ............................................................................................. 40
Table 5 Mean squares from ANOVA of physical and chemical properties
among digestible group. .................................................................... 41
Table 6 RVA parameters for ND and HD RILs using the 13-min
temperature profile among digestible groups .................................... 43
Table 7 Mean squares from ANOVA of starch pasting properties among
digestible groups. .............................................................................. 44
Table 8 Rate and efficiency of starch enzymatic conversion to glucose
among digestible groups .................................................................... 45
Table 9 Mean squares from ANOVA of rate and efficiency of starch
enzymatic conversion to glucose among digestible groups. ............. 45
Table 10 Pearson correlation coefficients (r-values) of sorghum starch
properties, protein and starch digestibility and ethanol yield. ........... 46
Table 11 Mean squares from ANOVA of % ethanol yield at 24, 48 and 72 h
SSF among digestible groups ............................................................ 48
Table 12 Percent ethanol yield after 24, 48 and 72 h fermentation among
digestible group ................................................................................. 49
Table 13 Average MMD and GSD among digestible groups. ......................... 54
xiv
Page
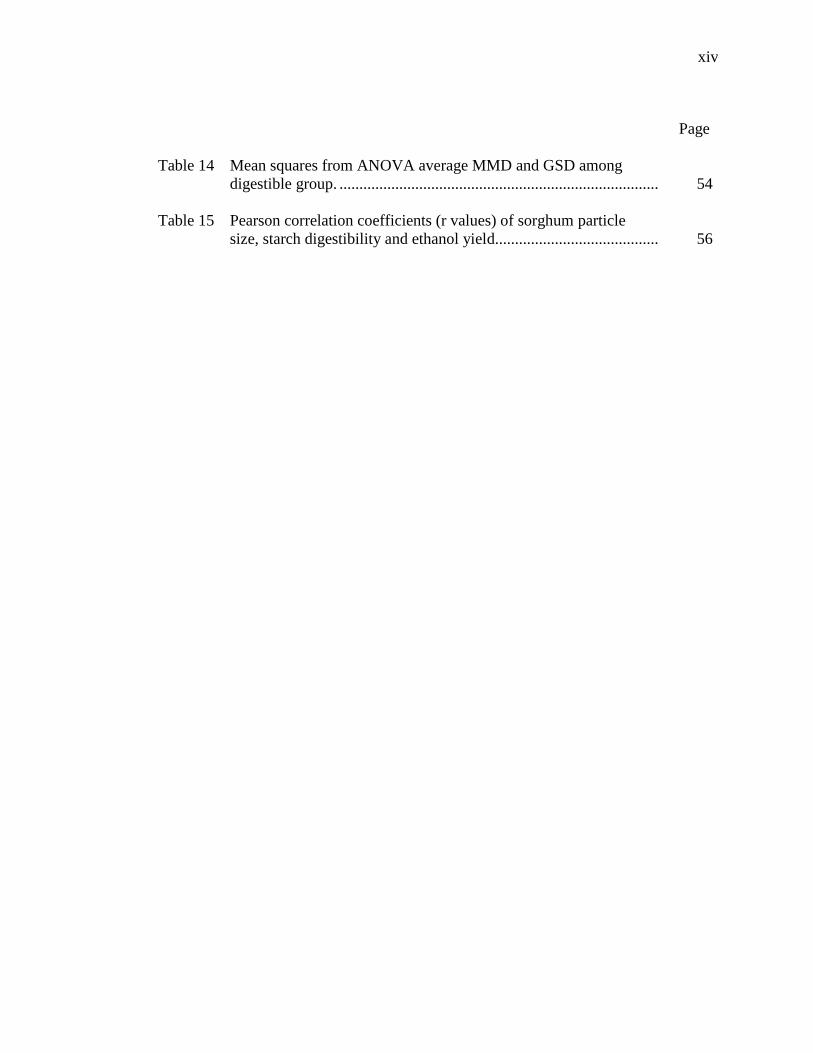
Table 14 Mean squares from ANOVA average MMD and GSD among
digestible group. ................................................................................ 54
Table 15 Pearson correlation coefficients (r values) of sorghum particle
size, starch digestibility and ethanol yield......................................... 56

1
CHAPTER I
INTRODUCTION: IMPORTANCE OF THE RESEARCH
The world’s energy consumption of 462 quadrillion British thermal units (Btu) in
2005 is estimated to increase by 50% (695 quadrillion Btu) in 2030 as indicated in the
International Energy Outlook 2008 projections of the Energy Information Administration
(EIA, 2008a). This significant growth of the world energy consumption is expected
despite the continuously increasing price of crude oil and natural gas in the global market
as a result of strong economic development and expanding populations in the world’s
developing countries like China and India. But even at this time, the United States of
America remains the overall world's largest energy producer, consumer, and net
importer/exporter of energy. The U.S. ranks first in coal reserves, sixth in natural gas
reserves, eleventh in oil reserves; but it is first in imports of oil and natural gas (EIA,
2008b).
The U.S. current consumption of crude oil is approximately 20 million barrels
daily (about 7 billion barrel crude oil annually), almost 60% of which (12 million
barrels) is imported according to the US Energy Profile 2008. Of the country's four
primary sectors, the industrial sector has always been the largest energy user, consuming
about 32% (32 quadrillion BTU) of the total (101 quadrillion BTU). It is followed by
the transportation sector (29 quadrillion BTU), the residential (18 quadrillion BTU) and
commercial sectors (EIA, 2008c).
____________
This thesis follows the style of the Transactions of the ASABE.

2
As of 2007, the transportation sector consumes approximately 5 billion barrels of
crude oil per year, currently accounting for 70% of the total crude oil consumption in the
U.S. (EIA, 2008d). Since the oil crisis of the 1970’s, ethanol as an octane enhancer to
replace lead additives and as a gasoline extender was already considered a means of
increasing the U.S. gasoline supply (Liu and Shen, 2007; and Coble et al., 1985).
Therefore, to decrease our dependence on foreign oil, domestic oil production must be
increased; and more fuel-efficient mode of transportation and/or new and existing forms
of alternative energy like bioethanol and biodiesel must be developed.
Starch from corn, a polymer of glucose which is present as amylose (a linear
molecule with alpha-1-4 glucosidic linkage) and amylopectin (contains alpha-1-6
glycosidic branch points in addition to alpha-1-4 linkages) (Shuller and Kargi, 2002) is
the main feedstock for ethanol production in the US. Ethanol production in the U.S.
reached 4.9 billion gallons in 2006, which corresponds to an increase of approximately
130% from 2002 (US RFA, 2007a and 2007b). In 2007, production was almost 7 billion
gallons and by the end of 2008, an additional 6 billion gallons per year capacity is
expected to be operational (EERE, 2007). With the ratification of the Energy
Independence and Security Act of 2007, a nearly five-fold increase of the 2007 ethanol
production in the year 2022 is anticipated.
Ethanol is produced from corn by either dry grind or wet milling process. These
processes share common chemical and biological features associated to saccharification
of starch to glucose and fermentation of glucose to ethanol. Producing soluble sugars
from starch involves physical, thermal and biochemical treatments. Starch is initially

3
gelatinized by heating the starch suspension to make it accessible during enzymatic
hydrolysis. Starch is a crystalline granule which is water insoluble. Cooking weakens the
inter- and intra-molecular hydrogen, making the granules swell and absorb water
resulting to increased viscosity of the starch solution. The starch suspension is thinned
(liquefied) by alpha-amylase, an endohydrolase that breaks internal alpha-D-(1,4)-
glucosidic linkages. The resulting short chain, referred to as dextrins, are subsequently
saccharified to glucose and the dimer maltose by glucoamylase by hydrolyzing the
alpha-D(1,6)-glucosidic linkages at branch points (Nichols et al., 2008).
The yeast Saccharomyces cerevisiae ferments glucose and maltose (a glucose
dimer) derived from starch. Glucose, fructose and maltose can be transported into yeast
cells and maltose is hydrolyzed intracellularly to glucose. Phosporylated glucose is
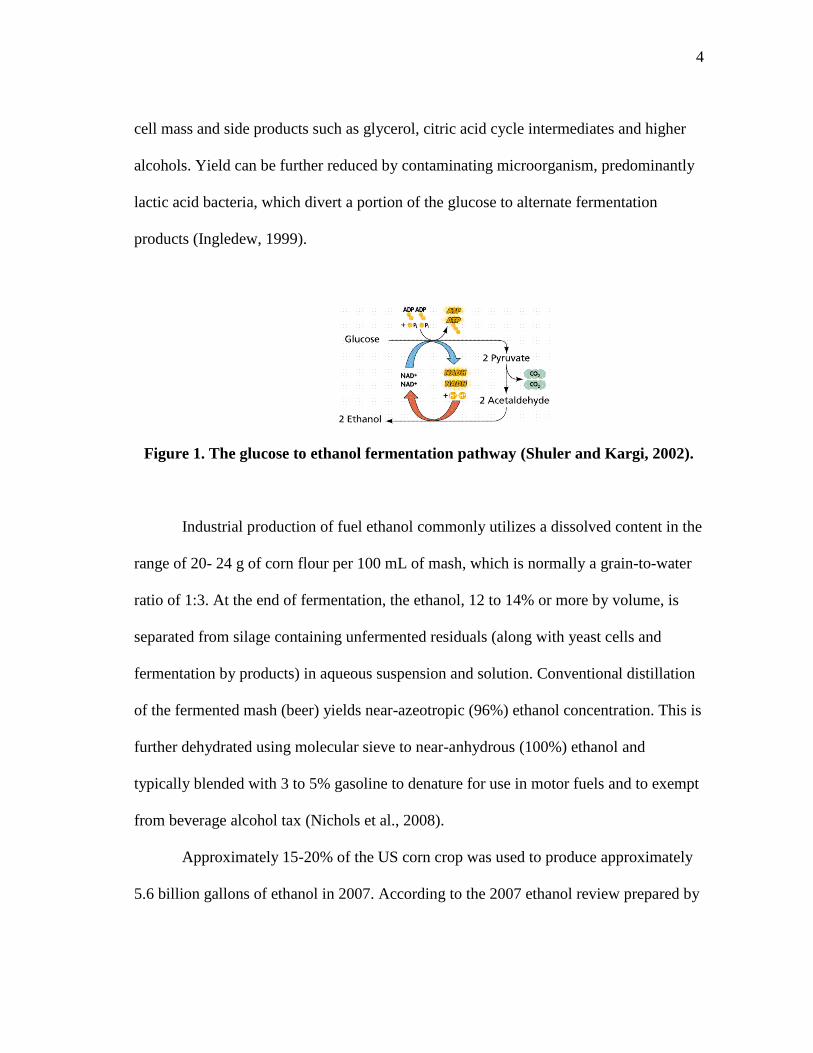
metabolized through glycolysis to pyruvate, which is decarboxylated to acetaldehyde.
Ethanol is formed by reduction of acetaldehyde. One glucose molecule is therefore
converted to two ethanol and two CO2 molecules. With the conversion of acetaldehyde
to ethanol, NADH is oxidized to NAD+, which serves to balance the reducing
equivalents produced in glycolysis (Figure 1). However, yeast cells actually gain little
energy benefit from fermenting glucose to ethanol, because most of the energy from
glucose (heat of combustion [Hoc] of glucose is 2807 kJ/mol) is retained in the
fermentation product (Hoc of ethanol is 1369 kJ/mol and 0 for CO2). The
thermodynamic yield for fermentation of glucose to ethanol is 97%. On a mass basis, the
theoretical yield is 0.51g of ethanol and 0.49 g of CO2 per g of fermented glucose. The
actual yield is about 90 to 93% of the theoretical. Some loss is due to production of yeast
4
cell mass and side products such as glycerol, citric acid cycle intermediates and higher
alcohols. Yield can be further reduced by contaminating microorganism, predominantly
lactic acid bacteria, which divert a portion of the glucose to alternate fermentation
products (Ingledew, 1999).
Figure 1. The glucose to ethanol fermentation pathway (Shuler and Kargi, 2002).
Industrial production of fuel ethanol commonly utilizes a dissolved content in the
range of 20- 24 g of corn flour per 100 mL of mash, which is normally a grain-to-water
ratio of 1:3. At the end of fermentation, the ethanol, 12 to 14% or more by volume, is
separated from silage containing unfermented residuals (along with yeast cells and
fermentation by products) in aqueous suspension and solution. Conventional distillation
of the fermented mash (beer) yields near-azeotropic (96%) ethanol concentration. This is
further dehydrated using molecular sieve to near-anhydrous (100%) ethanol and
typically blended with 3 to 5% gasoline to denature for use in motor fuels and to exempt
from beverage alcohol tax (Nichols et al., 2008).
Approximately 15-20% of the US corn crop was used to produce approximately
5.6 billion gallons of ethanol in 2007. According to the 2007 ethanol review prepared by
5
Brian Curtis Energies and Research Group (2008), the U.S. ethanol industry is
characterized as a maturing corn ethanol industry with technology development well
funded to accommodate cellulosic feedstock in the near future. Despite the remarkable
increase in ethanol production using the current grain-starch-based technology, corn
grain production for ethanol will become limited as it will compete with food and feed
production. To be able to meet the enormous amount of corn or starch based material
needed to produce the projected 15 billion gallon per year leveling capacity of corn
ethanol, there is a need to develop alternative crops for bioenergy production for
sustainable supply of sugar, starch and lignocellosic biomass.
There are several different species possible to be used as dedicated bioenergy
crops. Sorghum (Sorghum bicolor L. Moench) is one of those species for several
reasons. First, it is a drought tolerant crop because of its high water-use efficiency. Its
production is usually associated with the hot and dry subtropical and tropical regions,
like Sub Sahara Africa and India, where sorghum is used as a staple crop for food grain,
feed grain and forage and is even used in industry as a fuel source via combustion.
Second, it is a high yielding crop. When sorghum is cultivated under optimal conditions,
it has a grain yield potential equal to or greater than the other cereal grains. And lastly,
sorghum has a history of improvement in production of lignocelluloses, starch and sugar,
which are all feedstock for ethanol production. Given the existing genetics improvement
infrastructure available for the species, it is logical to expect that sorghum hybrids
dedicated for bioenergy production can be developed in the near future and grown and
used for ethanol production (Rooney et al., 2007).

6
The Sorghum Breeding Program at the Soil and Crop Sciences Department,
Texas A&M University has developed and identified high digestible protein grain
sorghum (HDGS) genotypes. This research intends to evaluate the potential of
developed and existing high yielding HDGS genotypes as supplement to corn for a much
economical starch based ethanol production. The objectives of this research are to:
1. investigate the production of ethanol using simultaneous saccharification and
fermentation (SSF) of HDGS in comparison with normal digestible grain
sorghum (NDGS) with low protein digestibility and corn; and
2. determine the best sorghum lines that have been developed by breeders that will
require lower energy input during gelatinization and liquefaction and shorter SSF
time for ethanol production.

7
CHAPTER II
SIMULTANEOUS SACCHARIFICATION AND FERMENTATION OF HIGH
DIGESTIBLE VARIETY OF GRAIN SORGHUM FOR ETHANOL
PRODUCTION
OVERVIEW
Ethanol presents a promising and fastest growing ―clean‖ fuel substitutes for
petroleum. Because of its high octane rating, it is currently used as the methyl tert-butyl
ether (MTBE) substitute that can be mixed directly with gasoline and be used, at a
certain blend, in existing internal combustion engine vehicles without any modifications.
In the U.S, ethanol is mainly produced via fermentation of starch from corn grains.
Because of the increasing demand for ethanol from corn and the competition it creates
with food and feed production, the identification and development of additional sources
of plant starch for conversion to ethanol become a priority.
The Sorghum Breeding Program at the Soil and Crop Sciences Department,
Texas A&M University has developed and identified high digestible protein grain
sorghum (HDGS) lines. These varieties have modified endosperm matrix that lack
kafirin protein body structures surrounding the starch granules and restricting
gelatinization. This study investigated the use of HDGS for dry grind ethanol
fermentation. It also compared the starch digestibility and efficiency of starch
conversion to glucose and ethanol of HDGS, normal digestible grain (NDGS) with low
protein digestibility, and corn using simultaneous saccharification and fermentation
(SSF).
8
INTRODUCTION
In recent years, world crude oil prices have risen dramatically because of
dwindling petroleum supplies coupled with increasing demand (EIA, 2003). As of 2006,
approximately 70% of the crude oil (about 840 million gallons) daily consumption in the
U.S. accounted for the liquid transportation fuels such as gasoline, diesel, and jet fuel
(Gray et al., 2006). In response, the U.S. government is constantly finding ways to
reduce its dependence on non-renewable energy resources and also to minimize the
environmental problems associated with fossil fuel combustion. Thus, more attention is
now focused on the production of renewable and environmentally friendly fuels like
bioethanol and biodiesel.
Ethanol presents one of the most promising and fastest growing ―clean‖ fuel
substitutes. It is already used as a substitute for methyl tert-butyl ether (MTBE) to
increase the octane number of gasoline. It is also being mixed directly with gasoline in
10% (E10), 15% (E15) or even 95% (E95) ethanol blend which can be easily utilized by
the current internal combustion engine vehicles (ICEVs) without any modifications
(Hamelinck et al.,2005). According to Hill et al. (2006), the production and combustion
of ethanol reduces 12% of the greenhouse gas emissions relative to the fossil fuels it has
displaced.
Ethanol can be made synthetically from petroleum or biochemically through
microbial fermentation of biomass materials (Badger, 2002). In the U.S, it is mainly
produced via biochemical conversion of starch from corn grains (Gray et al., 2006;
Mojovic et al., 2006). Based on the net energy balance of ethanol production, Hill et al.

9
(2006), estimated that ethanol yields 25% more energy than the energy invested in its
production (including crop production, transportation, conversion, and purification). If
all of the corn produced in the US were used for fermentation, about 13 billion gallons of
ethanol per year could be realized (Gray et al., 2006). But because corn is also utilized
for food and feeds, the use of a less expensive grain such as sorghum is advantageous.
Grain sorghum (Sorghum bicolor (L.) Moench) ranks third among the cereal
crops in the US (Zhan et al., 2006). It is primarily used as a feed grain for livestock in
the US, but in many semi-arid and tropical areas of the world, it serves as their staple
food grain (Dicko et al., 2006). The feed value of grain sorghum is similar to corn in
terms of its starch content (55% -75% of starch by kernel weight), but its protein and
starch are less digestible (Serna-Saldivar and Rooney, 1995; Zhan et al., 2003). Due to
poor wet-milling property and lower starch digestibility of normal sorghum, it has been
underutilized for bio-based products and bio-energy production (Zhan et al., 2003;
2006). Several hypotheses have been suggested to explain this low digestibility and high
energy requirements needed for gelatinization prior to liquefaction and saccharification.
The predominant theory is that the starch being imbedded in the protein body (kafirin)
matrices restricts gelatinization. During heating, the kafirins in the protein bodies form
more highly networked matrices of kafirins bridged together via disulfide cysteine
residues that surrounds the starch granules and restrict enzyme accessibility during
liquefication and saccharification; however, this theory remains largely untested (Taylor
et al., 1984; Chandrashekar and Kirlies, 1988).
10
The Sorghum Breeding Program at the Soil and Crop Sciences Department,
Texas A&M University has developed and identified high digestible grain sorghum
(HDGS) genotypes. These varieties with modified endosperm matrices lack kafirin
protein body structures that surround the starch granules and restrict gelatinization.
HDGS is hypothesized to have several added benefits in production of ethanol and
distillers dried grain solubles (DDGS) for animal feed. First, the modified endosperm
matrices lacking resistant protein body structures will reduce the temperature and
duration at elevated temperatures needed to solubilize the grain starch for hydrolytic
enzyme access and conversion to fermentable sugars. Second, the grain protein present
has improved bioavailability (i.e. is more digestible) for food and feed uses, and the
protein present has 60% higher lysine content, similar to high lysine corn lines (Weaver
et al., 1998). Lysine, an essential amino acid, is present at very low levels in vegetable
proteins and is frequently used as a nutrient supplement for herbivorous animals. This
amino acid is commonly ingested as lysine or lysine-containing proteins in animal feed
(Chen et al., 1996), therefore making HDGS more favorable feedstock for dry grind
ethanol fermentation.
The development of HDGS genotype increases the potential of grain sorghum as
feedstock in ethanol production as less time and energy will be required in the
conversion process. In the end, using high digestible grain sorghum could result in a
more positive net energy balance and more economically competitive ethanol
production. It will also provide distillers an increased income and market share via the
improved essential amino acid and nutrition quality of the DDGS feed product.

11
This study investigated the simultaneous saccharification and fermentation (SSF)
of grain sorghum with improved protein digestibility (high digestible grain sorghum or
HDGS) for ethanol production using commercially available α-amylase, glucoamylase
and Saccharomyces cerevisiae yeast. Specifically, it compared HDGS starch
digestibility with corn, and low protein digestibility grain sorghum (normal digestible
grain sorghum or NDGS) using enzymatic hydrolysis and saccharification. It also
evaluated the efficiency of starch conversion to glucose and ethanol during the
simultaneous saccharification and fermentation of the NDGS, HDGS, and corn substrate.
MATERIALS AND METHODS
Substrates
Dry-milled samples of HDGS, NDGS, and corn grains obtained from the
Sorghum Breeding Center, Soil and Crop Sciences Department, Texas A&M University,
College Station, Texas were used. The sample grains were ground using a Jay Bee 1647
hammer mill to pass through a sieve of 1 mm opening diameter and oven dried at 105oC
to constant mass for moisture determination.
The grain sorghum samples used were a recombinant inbred line from the cross
of BTx635 (high mold resistant grain sorghum cultivar) X P850029 (high lysine grain
sorghum cultivar). The starch content of the samples was determined using a
commercially available kit (Megazyme, Ireland) while in vitro protein digestibility was
analyzed using the method modified by Mertz et al. (1984). The protein digestibility
method involved three stages: (1) protein digestion; (2) protein extraction; and (3)

12
turbidity assay. The turbidity assay provided a measure of protein digestibility as
absorbance is directly proportional to the protein concentration in the extraction buffer.
The absorbance was measured using a spectrophotometer.
Microorganism and Culture Media
An industrial strain of Saccharomyces cerevisiae from the Home Brewery
(Ozark, MO) was used for the fermentation. It was isolated from a commercially
available Super Yeast® dry brewer’s yeast which can produce and tolerate up to 20%
ethanol. Stock culture was maintained in a 15 x 90 mm petri dish with Yeast Peptone
Dextrose (YPD) medium containing 5 g/L yeast extract, 10 g/L peptone, 20 g/L glucose,
and 20 g/L agar at pH 5.5 and stored at 4oC. Pre-cultures were prepared by inoculating a
loopful of yeast from an isolated colony of the stock culture into 400 ml of autoclaved
Yeast Malt (YM) broth in a 500-ml Erlenmeyer flask closed with a cotton plug. The
yeast cells were aerobically propagated in YM broth consisting of 3 g/L yeast extract, 2
g/L malt extract, 5 g/L peptone and 10 g/L glucose at pH 5.5 and 32 °C using a rotary
shaker with a speed of 150 rpm for 48 h. An inoculum concentration of 10% v/v was
used in the entire fermentation experiment.
Enzymes
The enzymes used in this study, namely SPEZYME®
XTRA and G-ZYME®
480
Ethanol, were samples given by Genencor International, Incorporated (Rochester, NY).
SPEZYME®
XTRA enzyme, derived from a genetically modified strain of Bacillus
licheniformis, was used to liquefy the grain samples. This thermostable starch-
13
hydrolyzing -amylase can tolerate liquefaction temperatures greater than 85oC (185
oF)
and is very stable at liquefaction pH as low as 5.4. According to Genencor
International’s standard method for determination of -amylase activity, one Alpha
Amylase Units (AAU) of bacterial -amylase was the amount of enzyme required to
hydrolyze 10 mg of starch per minute under specified conditions. The typical enzyme
activity of SPEZYME®
XTRA was 14,000 AAU per gram and its typical density was
1.14 g/ml.
The G-ZYME®
480 Ethanol enzyme, which was an optimized blend of
extracellular enzymes from selected strains of Aspergillus niger, Rhizopus oryzae and a
genetically modified strain of Bacillus licheniformis, was used to produce glucose from
the liquefied mash for ethanol fermentation. The typical density of the G-zyme®
480
Ethanol saccharifying enzyme was 1.13 g/ml to 1.15 g/ml and its minimum enzyme
activity was 380 Glucoamylase Unit (GAU) per gram. One GAU is the amount of
enzyme needed to release one gram of glucose per hour from soluble starch substrates
under the conditions of the assay set by Genencor International. The optimal temperature
range for G-ZYME®
480 Ethanol is 58 to 65 oC (137 to 149
oF), and it has excellent
stability up to 65 oC.
Starch Hydrolysis and Saccharification
Hydrolysis was performed in four 2000-ml Erlenmeyer flasks heated on a the
temperature-controlled hot plate (Fisher Scientific) with magnetic stirrer with agitation
speed at 150 rpm. Split dosing of Spezyme®
Xtra enzyme for liquefaction of dry-milled

14
grains of HDGS, NDGS and corn meal was used. The initial dose of enzyme (0.02%
w/w of dry substrate) was added during the gelatinization stage of the starch to reduce
the viscosity while cooking. Erlenmeyer flasks with 1000 ml mixture containing 220 g
dry grain substrate, 3 g peptone, 1 g KH2PO4, and 1 g NH4Cl at 5.6 pH were heated up to
100oC for 1 h. The second dosing of Spezyme
® Xtra enzyme (0.02% w/w of dry
substrate) was done when the temperature reached 85°C and the pH was adjusted to 5.5
using 1 N H2SO4. Liquefaction was continued for 30 min at 80°C and then cooled for
another 30 min until the temperature reached 65oC. G-zyme
® 480 Ethanol enzyme (0.1%
w/w of dry solid) was added after adjusting the pH to 4.5 using 1 N H2SO4 at 65°C.
Saccharification with G-zyme®
480 Ethanol was done for 30 min at 60°C and and the
solution was then cooled for until the hydrolyzate attained 35°C.
Fermentation
When the hydrolyzates reached 35°C, they were transferred into a 2000-ml
polyethylene bottle with screw cap that was sterilized using boiling water at 100oC. For
each type of substrate, three containers were inoculated with 48 h yeast culture (10%
v/v) and the remaining container served as the control. All containers were incubated in
a rotary shaker at 150 rpm and 32°C for 72 h. Samples were collected after the first 3 h
of inoculation and then every 10 to 12 h thereafter. After sampling, about 1 ml was
immediately plated for microbial analysis and approximately 15 ml was centrifuged at
3000 rpm for 10 min. The supernatant was placed in a 20 ml scintillation vial and stored
at -4 oC until it was analyzed for sugar and ethanol content. Fermentation set up for each
grain sample was done in triplicate while an additional set up that was not inoculated
15
with yeast served as a control for complete glucose conversion. Anaerobic condition
was provided for the yeast to maximize the glucose to ethanol fermentation pathway
during fermentation (Ingledew, 1999), except when the screw cap was being removed
during sampling times and venting out of CO2.
Analysis
For microbial analysis, samples were serially diluted using peptone saline diluent
(1g/L peptone and 8.5g/L NaCl) and plated using Plate Count Agar (PCA) which
contained 1g/L glucose, 2.5g/L yeast extract, 5g/L tryptone, and 15g/L agar. Sugar and
ethanol concentrations were measured using HPLC (Consta Metric 3200 solvent
delivery system from LCD Analytical) equipped with autosampler, Shodex SP0810
packed column and a Refractive Index (RI) detector. The column temperature was
maintained at 78oC. Each sample was analyzed for 20 min using HPLC water as the
eluent at 0.8 ml/min flowrate.
Statistical software SPSS was used to analyze the data. One-way analysis of
variance (ANOVA) was used to determine significant differences of the means. Least
significant difference (LSD) was performed for multiple comparison of three replicates
in each treatment at =0.05.
RESULTS AND DISCUSSION
Protein Digestibility and Starch Content of Grain Sorghum
There was a rapid turbidity development observed after the addition of Trichloro
Acetic Acid (TCA) extraction buffer (second stage extraction) to the washed NDGS

16
sample that was previously digested with pepsin solution. After 1 h of incubation, a
significantly higher absorbance reading was measured for NDGS than for the HDGS
sample (Table 1). It is to be noted that less protein were discarded from the NDGS
during the protein digestion with pepsin (first stage extraction), leaving a higher amount
of remaining protein in the digested grains and into the TCA extraction buffer (second
stage extraction). Since absorbance is directly proportional to amount of protein in the
TCA extraction buffer, turbidity assay showed a higher absorbance for NDGS than for
HDGS sample. Calculating the % difference in absorbance showed that protein
digestibility of HDGS was 34.15% higher than NDGS. The starch content of the NDGS
and the HDGS samples did also differ significantly (P-value = 0.0000) and NDGS had
higher starch content than the HDGS samples (Table 1).
Table 1. Absorbance reading of extraction buffer and starch content of the
sorghum grain samples
Analysis NDGS (a)
HDGS (a)
%Difference
(b)
Absorbance reading of
extraction buffer
after 1 h incubation
0.41 0.27 34.15
Starch Content (%w.b.) 73.46 70.94 3.43
(a) Means of three replicates
(b) %Difference= (NDGS-HDGS) / NDGS *100
Starch Hydrolysis and Saccharification
Figure 2 shows the chromatograms of the NDGS, HDGS and corn substrates
during the processes of gelatinization, liquefaction, and initial saccharification. After 1 h

17
of gelatinization at 100oC with 0.01% of SPEZYME®EXTRA -amylase enzyme, there
was a partial splitting of the large chains of carbon into various smaller units particularly
dextrin and small amounts of glucose. The peak representing dextrin was lowest in the
HDGS, followed by corn and NDGS. On the other hand, the glucose peak was observed
to be highest in the HDGS, followed by corn and NDGS. Because starch grains are
partially-crystalline form, gelatinization was needed to hydrolyze the starch granules and
make it susceptible to enzyme action.
Figure 2. HPLC chromatograms of NDGS, HDGS and corn.
(A) Gelatinization at 100oC for 1 h; (B) Liquifaction at 80
oC with SPEZYME®EXTRA
atoC for 1 h and another 1 h while cooling down to 35
oC with G-ZYME®480 Ethanol
glucoamylase enzyme. Peaks: 1—dextrin; 2—maltose; 3—glucose.
Liquefaction of the starch was characterized by thinning of the gelatinized
mixture due to further conversion of very long polymers of glucose monomer to shorter
chains of glucose units such as dextrin, maltriose, and maltose. Extension of the second
18
enzyme dosing action for another 1 h at 80oC drastically reduced the viscosity of the
gelatinized starch and increased in peak representing shorter monomer chains of glucose.
After 2 h of saccharification with G-ZYME®480, there was a drastic lowering of the
dextrin peak and rise of the glucose peak in all three substrates. Also observed was the
apprearance of maltose peak in both the NDGS and corn; whereas, maltose peak was
absent in the HDGS chromatogram (Figure 2).
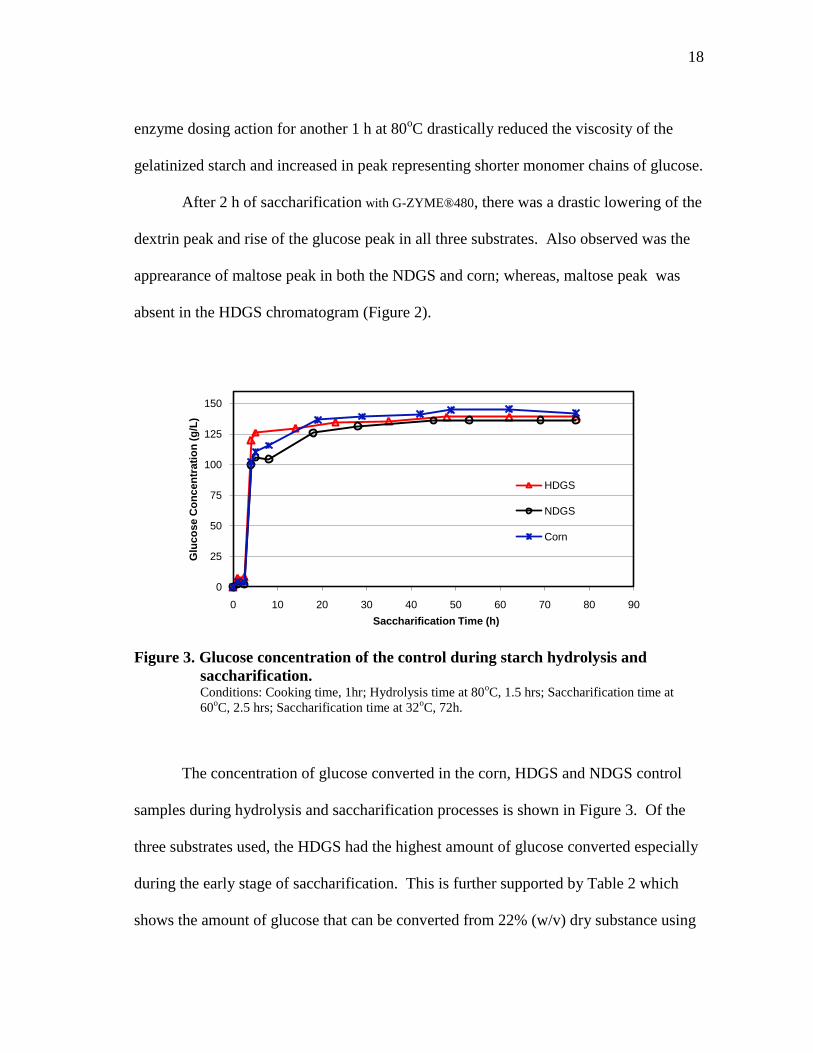
Figure 3. Glucose concentration of the control during starch hydrolysis and
saccharification. Conditions: Cooking time, 1hr; Hydrolysis time at 80
oC, 1.5 hrs; Saccharification time at
60oC, 2.5 hrs; Saccharification time at 32
oC, 72h.
The concentration of glucose converted in the corn, HDGS and NDGS control
samples during hydrolysis and saccharification processes is shown in Figure 3. Of the
three substrates used, the HDGS had the highest amount of glucose converted especially
during the early stage of saccharification. This is further supported by Table 2 which
shows the amount of glucose that can be converted from 22% (w/v) dry substance using
0
25
50
75
100
125
150
0 10 20 30 40 50 60 70 80 90
Glu
co
se C
on
cen
trati
on
(g
/L)
Saccharification Time (h)
HDGS
NDGS
Corn
19
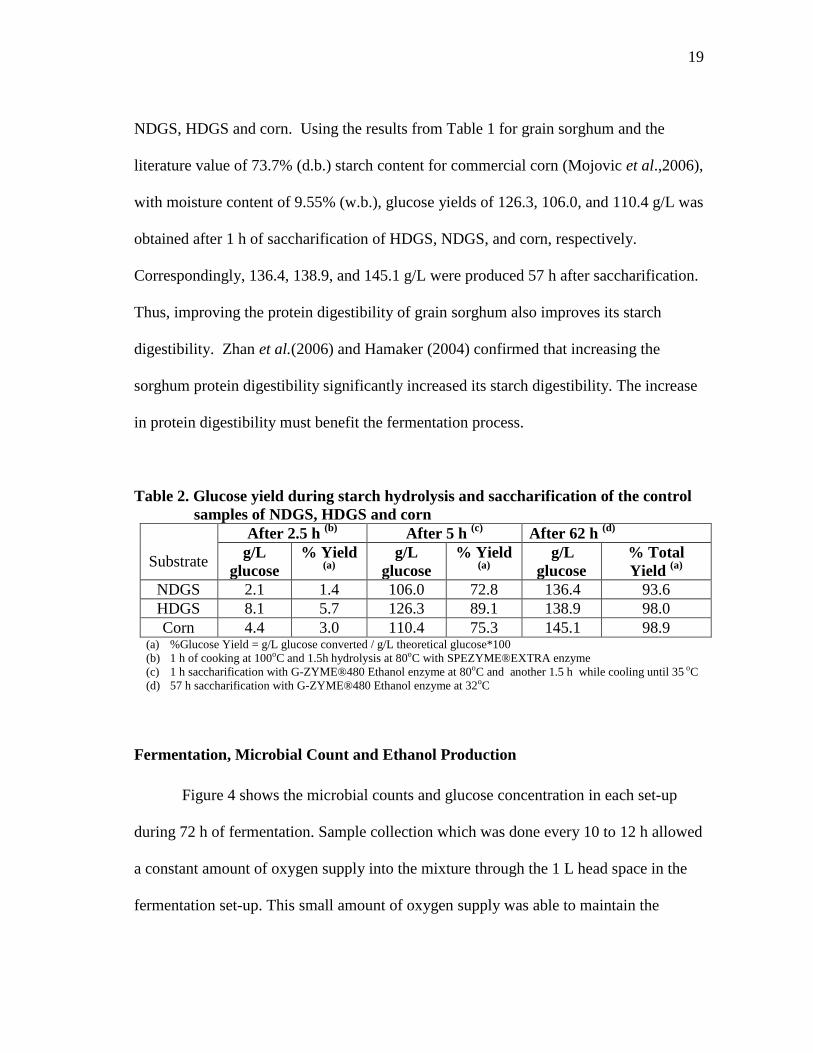
NDGS, HDGS and corn. Using the results from Table 1 for grain sorghum and the
literature value of 73.7% (d.b.) starch content for commercial corn (Mojovic et al.,2006),
with moisture content of 9.55% (w.b.), glucose yields of 126.3, 106.0, and 110.4 g/L was
obtained after 1 h of saccharification of HDGS, NDGS, and corn, respectively.
Correspondingly, 136.4, 138.9, and 145.1 g/L were produced 57 h after saccharification.
Thus, improving the protein digestibility of grain sorghum also improves its starch
digestibility. Zhan et al.(2006) and Hamaker (2004) confirmed that increasing the
sorghum protein digestibility significantly increased its starch digestibility. The increase
in protein digestibility must benefit the fermentation process.
Table 2. Glucose yield during starch hydrolysis and saccharification of the control
samples of NDGS, HDGS and corn
After 2.5 h (b)
After 5 h (c)
After 62 h (d)
Substrate g/L
glucose
% Yield (a)
g/L
glucose
% Yield (a)
g/L
glucose
% Total
Yield (a)
NDGS 2.1 1.4 106.0 72.8 136.4 93.6
HDGS 8.1 5.7 126.3 89.1 138.9 98.0
Corn 4.4 3.0 110.4 75.3 145.1 98.9 (a) %Glucose Yield = g/L glucose converted / g/L theoretical glucose*100
(b) 1 h of cooking at 100oC and 1.5h hydrolysis at 80oC with SPEZYME®EXTRA enzyme
(c) 1 h saccharification with G-ZYME®480 Ethanol enzyme at 80oC and another 1.5 h while cooling until 35 oC
(d) 57 h saccharification with G-ZYME®480 Ethanol enzyme at 32oC
Fermentation, Microbial Count and Ethanol Production
Figure 4 shows the microbial counts and glucose concentration in each set-up
during 72 h of fermentation. Sample collection which was done every 10 to 12 h allowed
a constant amount of oxygen supply into the mixture through the 1 L head space in the
fermentation set-up. This small amount of oxygen supply was able to maintain the

20
number of viable cells throughout the experiment. An approximate ten-fold increase in
microbial count was observed during the first 3 h of fermentation in all of the substrates
used while loss of cell viability was observed after 40 h of fermentation.
Figure 4. Change in viable yeast cells and glucose concentration during 72 hours of
the grain hydrolyzates fermentation. Hydrolysis conditions prior to inoculation: Cooking time, 1hr; Liquefaction and cooling time,
1.5 hrs; Saccharification and cooling time, 2.5 hrs.
1.00E+00
1.00E+01
1.00E+02
1.00E+03
1.00E+04
1.00E+05
1.00E+06
1.00E+07
1.00E+08
1.00E+09
1.00E+10
0 10 20 30 40 50 60 70 80
Via
ble
Cell
Co
un
t (C
FU
/ml)
Fermentation time (h)
HDGS Viable Yeast
NDGS Viable Yeast
Corn Viable Yeast
-20.0
0.0
20.0
40.0
60.0
80.0
100.0
120.0
140.0
0 10 20 30 40 50 60 70 80
Glu
co
se c
on
cen
trati
on
(g
/L)
Fermentation time (h)
HDGS Glucose
NDGS Glucose
Corn Glucose

21
Figure 5. Ethanol concentration during 72 h of simultaneous hydrolysis and
ethanol fermentation.
Ethanol production from dry milled HDGS, NDGS and corn using simultaneous
saccharification and fermentation is shown in Figure 5. Among the three substrates, the
HDGS gave the highest ethanol yield almost all throughout during the 72 h of
fermentation. The difference was more noticeable after 20 h of fermentation when the
calculated % ethanol yield was also highest in the HDGS (Table 3). After 21 to 24h of
fermentation, ethanol yield of 94% was obtained from the HDGS compared to 81 and
84% for NDGS and corn, respectively. These results again support the hypothesis that
the altered protein matrix in the genetically modified variety of grain sorghum improved
the sorghum starch digestibility during enzymatic hydrolysis. This then contributed to the
faster and higher starch conversion to glucose and ultimately to ethanol. It is to be noted
that the enzymes, yeast and substrates were maintained under similar conditions in all
tests during hydrolysis and fermentation so that the ethanol yield would just be dependent
on the starch digestibility. Since sorghum has lower demand as food, the new variety of
0.00
1.00
2.00
3.00
4.00
5.00
6.00
7.00
8.00
9.00
10.00
0 10 20 30 40 50 60 70 80
Eth
an
ol C
on
cen
trati
on
(%
v/v
)
Fermentation Time (h)
HDGS
NDGS
Corn

22
highly digestible grain sorghum could very well serve as a viable substitute for corn in
ethanol production.
Table 3. Ethanol yield during simultaneous saccharification and fermentation of
grain substrates After 21to 24 h SSF After 72 h of SSF Overall
(c)
Substrate v/v %(a)
g/L
ethanol
% Ethanol
Yield(b)
v/v%
(a)
g/L
ethanol
% Ethanol
Yield(b)
Y P/S
(g/g)
HDGS 8.59 67.77 94.24 8.77 69.18 95.51 0.49
NDGS 7.73 60.98 81.31 8.19 64.58 86.72 0.44
Corn 7.94 62.67 83.60 8.69 68.55 91.45 0.47 (a) Means of three replicates
(b) % Ethanol Yield = g/L ethanol converted / g/L theoretical ethanol*100
(c) Ethanol yield based on amount of starch (g ethanol converted/ g theoretical glucose)
No significant change in ethanol concentration was observed from 40 h to 72h of
SSF using NDGS
No significant change in ethanol concentration was observed from 21 h to 72h of
SSF using HDGS
No significant change in ethanol concentration was observed from 45 h to 72h of
SSF using corn
Efficiency of substrate for ethanol fermentation NDGS<CORN<HDGS
CONCLUSION
High digestible variety of grain sorghum (HDGS) yielded higher ethanol in
shorter amount of time than the low digestible grain sorghum (NDGS) and corn by
simultaneous saccharification and fermentation. The higher protein digestibility of
HDGS resulted in its higher starch digestibility which brings to a faster and higher starch
conversion to glucose and ethanol during hydrolysis and fermentation. The glucose yield

23
was highest in the HDGS particularly at the early part of saccharification. After 1 h of
saccharification, a glucose yield of 126.3 g/L was obtained for the HDGS compared to
106.0 and 110.4 g/L for the NDGS and corn, respectively. The HDGS likewise had the
highest ethanol production almost all throughout the 72 h of fermentation. Ethanol yield
of 94% was obtained from the HDGS compared to 81 and 84% for NDGS and corn,
respectively, after 21 to 24 h of fermentation. These results suggest that the altered
protein matrix in the genetically modified variety of grain sorghum improved its protein
digestibility. Consequently, it enhanced the sorghum starch digestibility during
enzymatic hydrolysis and contributed to the faster and higher starch conversion to
glucose and ultimately to ethanol.
Since sorghum has lower demand as food, the new variety of highly digestible
grain sorghum could very well provide a viable substitute for corn in ethanol production.
Aside from being a less expensive grain than corn, its enhanced starch digestibility may
further reduce both material and processing cost. Possible process improvements include
reducing enzyme dosages, shortening of liquefaction and fermentation times, and
eliminating some of the unit processes through very high gravity SSF to lower energy
needed during fermentation and distillation. Further cost reduction can also be achieved
by optimizing the combination of substrates, enzymes and yeast during hydrolysis and
fermentation. Moreover, using dry yeasts which are tolerant and viable at high ethanol
concentration and enzymes with higher specific activities than the current commercial
enzymes could provide more efficient starch conversion to glucose and ethanol at a
shorter time.
24
CHAPTER III
FACTORS AFFECTING BIO-CONVERSION OF SORGHUM
FLOUR IN DRY GRIND ETHANOL PROCESS
OVERVIEW
High world oil prices, supportive government policies, growing environmental
and energy security concerns have provided favorable market conditions for ethanol.
The need to generate a large and sustainable supply of biomass to make bioethanol will
require the development of crops grown specifically for bioenergy production. Given the
existing history of genetic improvement and infrastructure available for sorghum, it is
expected that sorghum (Sorghum bicolor L. Moench) hybrids will be one of the several
species dedicated as energy crop. Sorghum varieties with high protein digestibility and
improved starch digestibility have already been reported although most of the previous
research on grain sorghum was focused on the digestibility of sorghum protein from the
nutritional point of view. The aim of the current study was to select best sorghum lines
from a relatively large and diverse sorghum samples that breeders are currently working
with for the development of new low energy input liquefaction, saccharification and
fermentation methodologies to produce ethanol. Only few researches have been
conducted on the performance of sorghum varieties in ethanol fermentation in relation to
the protein and starch digestibility of sorghum.

25
INTRODUCTION
The worldwide production and consumption of ethanol as an alternative
transportation fuel are dramatically increasing in response to growing environmental
concerns and strengthening economic security. In the United States, ethanol is currently
used in transportation fuel primarily as gasoline supplement to reduce automotive
emissions and as oxygenate substitute for methyl-butyl ether (MTBE) because the use of
MTBE in gasoline was already prohibited due to concerns regarding groundwater
contamination. Since conventional cars produced from the late 1970’s can run on
gasoline with ethanol amounts of up to 10 percent by volume (E10), ethanol industry has
grown at a phenomenal rate. Over eight million barrels of oil, accounting for two-thirds
of the U.S. daily oil consumption, are required just to fuel over 225 million vehicles in
America. So driven by this desire to reduce petroleum use as well as the benefits of
bioethanol industry to farmers and rural economies, the U.S. annual production capacity
drastically rose from about 2 billion gallons per year in 2000 to nearly 7 billion gallon
per year in 2007, with an additional 6 billion gallon per year capacity expected to come
in line by the end of 2008 (EERE, 2007).
Brazil and the United States are the world’s largest ethanol consumers and
producers mainly from sugarcane and corn starch, respectively. Ethanol is produced in
the U.S from bioconversion of corn (70% starch, along with 9% protein, 4% lipids and
9% fiber on a dry weight basis) via two methods, dry grind and wet mill (Figure 6). In
wet milling, kernels are separated into components and only the starch portion is
fermented, whereas, in dry-grind process, whole kernels are ground to flour and fed

26
directly into the fermentation process. Though wet milling produces more co-products
such as oil, gluten meal and gluten feed, it requires higher capital and operating cost than
dry grind process (Nichols et al., 2008). Thus, most of the expansion of the ethanol
industry is in new and large dry grind ethanol plants. In 2006, 82% of the US ethanol-
producing capacity was in dry-grind facilities and 18% was in wet milling plants (RFA,
2008). Dry grind facilities produce 2.7 to 2.8 gallons (10.4 L) per bushel (25.5 kg) of
corn, as well as a co-product animal feed called distillers dried grains with solubles
(DDGS). DDGS is recovered at the end of the process and is mainly composed of yeast
and non-fermentable parts of the corn like germ, fiber, and protein (Nichols et al., 2008).
Figure 6. Comparison of the dry grind and wet mill processes for production of
ethanol. Courtesy of Corn to Ethanol Research Center. Reproduced from Nichols et al., 2006.
27
In a conventional dry-grind process, basic processes involve grinding, cooking,
liquefaction, saccharification, fermentation, distillation and co-product recovery. Corn is
ground and mixed with water to produce slurry. Slurry is cooked to breakdown the
crystalline structure of starch granules and the resulting mash is further liquefied and
saccharified by amylase enzymes to reduce viscosity and to produce sugars, respectively.
And the fermentable sugars produced are then converted to ethanol by yeast during
fermentation (Naidu et al., 2007 and Singh et al., 2006).
The combination of low corn prices, high energy prices, and strong ethanol
demand encouraged by various government measures, stimulated the rapid expansion of
corn-based ethanol production. This profitable growth in ethanol production
substantially increased the demand for corn and is deemed to be the main factor that
drove the price of corn up by approximately 90% from August 2006 to
February 2007. The current price of ethanol is around $2.50 a gallon while the corn
price has already reached a record of US $6 a bushel. Such increase is good news for
corn growers, but a burden for ethanol producers. If the selling price of ethanol stays the
same, and the cost of corn used in production increases, it is estimated that profit from
ethanol processing would decrease from US$1.06 per gallon to a net average of US$0.03
per gallon.
Since corn is also used as food and feed source, there is a need to develop a
dedicated bio-energy crop to generate a large, sustainable and low-cost feedstocks
supply that will fit the existing fermentation infrastructure. Currently, interest in the
utilization of sorghum in bio-industrial applications is growing in the U.S. Researchers
28
and ethanol producers have shown that grain sorghum is a reasonable feedstock for
ethanol since it is cheaper, more drought-tolerant than corn and it can fit the existing
fermentation infrastructure. On a well manage planting dates, grain sorghum offers
exceptional rotation crop for corn and cotton because it provides ample residue for
conservation-tillage system and potential yield for South Texas farmers (Smith, 2008).
In conservation tillage system, previous crop’s residues are purposely left on the soil
surface to conserve soil and for more efficient water use to get higher yields for crops
grown without irrigation in drought-prone soils like in semiarid regions (Sullivan, 2003).
Approximately 82 percent of the sorghum seed structure is the grain endosperm
(Hoseney, 1994) which is comprised of cells containing protein bodies trapped in a
protein matrix that surrounds the larger starch granules (Kulp and Ponte, 2000).
Although grain sorghum has a chemical composition similar to corn, it has been
underutilized for bio-based products and bio-energy production due to its poor wet-
milling properties (Zhan et al., 2003) and low ethanol yield relative to corn. Compared
with other cereals such as wheat and corn, sorghum is well known for its poor
digestibility and low nutritional value, especially after wet-cooked. Although the cause
of poor digestibility of sorghum proteins and starches is not yet fully understood, several
plausible explanations have been proposed. Duodu et al. (2003) based their explanations
on the interaction of the prolamins with polyphenolic tannins and starch and the protein
cross-linking in response to pH or temperature changes in the surrounding environment.
With the several proposed factors, the starch being imbedded in the protein body

29
(kafirin) matrices, which restrict gelatinization, is the predominant theory why normal
grain sorghum has low protein and starch digestibility.
Sorghum breeders are working with thousands of sorghum genotypes with
diverse genetic backgrounds, chemical, and physical properties. Most of the previous
research on grain sorghum was focused on the digestibility of sorghum protein from the
nutritional point of view (Beta et al., 2000, Duodu et al., 2003, Oria et al., 2000, Zhang
and Hamaker 1998). Not much research has been conducted on the performance of
sorghum varieties in ethanol fermentation in relation to the protein and starch
digestibility of sorghum. By understanding and analyzing the relationship among the key
factors impacting on the bio-processing of sorghum, the best sorghum genotypes with
high conversion efficiency for ethanol production could be identified. This will assist the
breeders in the development of new and improved sorghum hybrids for ethanol
production and will increase the production and utilization of sorghum to meet the
enormous feedstock demand of the future ethanol industry.
Recently, the Sorghum Breeding Program at the Soil and Crop Science
Department, Texas A&M University has developed and identified high digestible grain
sorghum (HDGS) genotypes with modified endosperm matrices that lack the kafirin
protein body highways. HDGS genotypes are hypothesized to have several added
benefits (low energy input during gelatinization prior and higher lysine protein content
than corn), making these cultivars a suitable alternative for corn in the typical bio-
ethanol-feed supplement system. The aim of the current study was to select the best
sorghum lines from a relatively large and diverse sorghum samples that breeders are

30
currently working on for the development of new low energy input liquefaction,
saccharification and fermentation methodologies to produce ethanol. The objectives of
this research are: (1) to investigate the effect of grain sorghum protein digestibility on
the temperature and time of starch gelatinization as well as on the rate and efficiency of
enzymatic saccharification; (2) to evaluate the performance of the improved sorghum
hybrids in ethanol fermentation via simultaneous saccharification and fermentation using
dry yeast (Ethanol Red) from Fermentis and high concentration of dry solid (30%); and
(3) to identify the key factors (chemical and physical properties, flour particle size,
starch pasting property, yeast viability, enzyme and substrate concentration) affecting
ethanol yield.
MATERIALS AND METHODS
Grain Sorghum Lines Used as Substrates
Eighteen recombinant inbred lines (RILs) of grain sorghum (parent lines and
offsprings) were used in this study. These were grown and harvested from Welasco,
Texas in 2006. Two parent lines of highly digestible protein (HD) grain sorghum
(P850029 and P851171) with high lysine content were crossed with three parent lines of
wild type (WT) grain sorghum (B.Tx635, R.Tx436 and 96GCPOB124) with high grain
mold disease resistance to develop three families with four distinct RILs. The lines were
phenotyped as highly digestible (HD), medium digestible (MD) and of normal digestible
(ND) protein using the protease turbidity assay (Portillo, 2007). The resulting phenotype
group defined as one or more RILs with absorbances (after 60 min of dilution in 72%
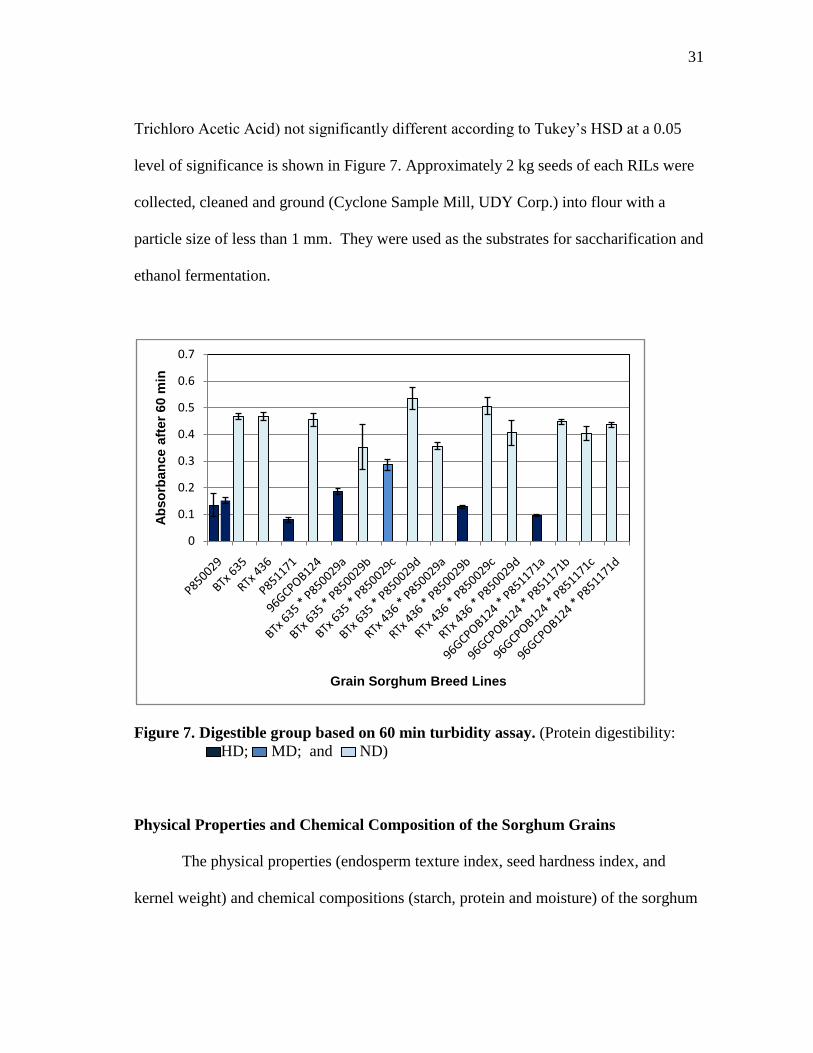
31
Trichloro Acetic Acid) not significantly different according to Tukey’s HSD at a 0.05
level of significance is shown in Figure 7. Approximately 2 kg seeds of each RILs were
collected, cleaned and ground (Cyclone Sample Mill, UDY Corp.) into flour with a
particle size of less than 1 mm. They were used as the substrates for saccharification and
ethanol fermentation.
Figure 7. Digestible group based on 60 min turbidity assay. (Protein digestibility:
HD; MD; and ND)
Physical Properties and Chemical Composition of the Sorghum Grains
The physical properties (endosperm texture index, seed hardness index, and
kernel weight) and chemical compositions (starch, protein and moisture) of the sorghum
0
0.1
0.2
0.3
0.4
0.5
0.6
0.7
Ab
so
rban
ce a
fter
60 m
in
Grain Sorghum Breed Lines

32
grains were determined by the Sorghum Breeding Laboratory at Soil and Crop Science
Department, Texas A&M University (Portillo, 2007). Endosperm texture index was
categorized as described by Rooney & Miller (1982) from 1 (flinty endosperm) to 5
(chalky endosperm) via visual examination of longitudinal half kernels while seed
hardness index was characterized using the single kernel hardness test (SKHT) (Perten
Single Kernel Characterization System SKCS 4100, Perten Instruments, Springfield IL).
The average starch, protein and moisture content of the grains were determined using
near-infrared reflectance (NIR) spectrophotometry (Perten PDA 7000 Dual Array with
Grams Software, Perten Instruments, Springfield IL). Ash analysis was conducted
according to ASTM standard E 1755-01, Standard Test Method for Ash in Biomass
(ASTM, 2001a). The moisture content of flour was determined in accordance with
Approved AACC Methods 44-15A (AACC, 2000).
Sorghum Flour Pasting Profile
The pasting properties of sorghum flours were evaluated using the Rapid-Visco-
Analyzer (RVA, Newport Scientific PTY, Ltd., Warriewood, Australia) through the
classic heat-hold-cool process. About 28 g mixture of sorghum flour (4.2 g flour d.b.)
and water was prepared and equilibrated at 50 °C temperature. The suspension was then
heated to and held at 95°C and then cooled again to 50°C. This caused the starch
granule swelling, disruption and polymer re-association. The total test time was 13 min
with viscosity and temperature readings taken every 2 sec. The peak viscosity
[maximum paste viscosity achieved in the heating stage], the trough viscosity [minimum
paste viscosity achieved after holding at the maximum temperature], the final viscosity
33
[viscosity at the end of run], the pasting temperature [starch granules begin to swell and
gelatinize due to water uptake] and the peak time [when peak viscosity was recorded]
were all measured and recorded. The breakdown and setback were calculated from the
difference between the peak and trough viscosity and the final and trough viscosity,
respectively. All runs were conducted in duplicate and average values were reported.
The flour pasting profiles were described using the different values measured.
Particle Size Distribution
The particle size distribution (PSD) of the sorghum flour samples was analyzed
in triplicate using the Malvern Instruments Mastersizer 2000 (Malvern Instruments Ltd.,
Mastersizer 2000, Worcestershire, UK). The instrument measures particle size based on
light scattering (Mie) and is able to analyze both wet and dry samples in the range of
0.02 to 2000μm. Red light is used to produce forward, side, and back scattering while a
blue light is used to produce wide angle forward and back scattering of light once it hits
the particles. Thousands of light scatter patterns collected by the instrument were used to
develop the relationship between percent volume and the equivalent spherical diameter
(ESD). The ESD was then converted to AED (Aerodynamic equivalent diameter) using
equation 1,
AED = ESD 𝜌𝑝
𝜒 (1)
where
AED = aerodynamic equivalent diameter,
ESD = equivalent spherical diameter,
ρp
= particle density (g/cm3), and
χ = shape factor

34
The particle density of the samples was measured using the AccuPyc 1330
(Micromeritics, AccuPyc 1330 Pycnometer, Norcross, GA) pycnometer by the gas
displacement method. The pycnometer releases helium of known volume into a
container of fixed volume. The difference between the two volumes represents the
volume of the particles inside the container. The mass was measured before inserting the
sample into the pycnometer. The density was then calculated using equation 2,
𝜌 =𝑚
𝑉 (2)
where
ρ = particle density of sample (g/cm3),
m = mass of sample (g), and
V = volume of material sample less open void space (cm3).
Particle size distribution is a log-normal distribution that uses mass median
diameter (MMD) as the geometric mean (calculated AED at d50%) and geometric
standard deviation (GSD) in describing how spread out are the particle size. MMD is the
particle size in which 50% of the overall particles by weight are smaller than the MMD
and 50% are larger than half of the mass (Faulkner, 2004). The GSD is calculated using
equation 3,
GSD = 𝜎𝑔 =𝑑84.1%
𝑑50%=
𝑑50%
𝑑15.9%=
𝑑84.1%
𝑑15.9% (3)
where dn% is the particle size in which n percent of the mass is contributed by particles
less than d.

35
Saccharification of Sorghum Starch Using Enzyme
The enzymatic conversion of starch to fermentable glucose units was based on
the modified NREL LAP-016 (National Renewable Energy Laboratory Analytical
Procedure, 2005). In this study, the enzymes used were alpha-amylase (SPEZYME®
XTRA) and gluco-amylase (G-ZYME®
480 Ethanol) provided by Genencor
International, Incorporated. One Alpha Amylase Unit (AAU) of bacterial -amylase
represents the amount of enzyme required to hydrolyze 10 mg starch per minute while
one Gluco-amylase Unit (GAU) is the amount of enzyme needed to release one gram of
glucose per hour from soluble starch substrates.
Two sets of incubation time and enzyme concentration were used to determine
the conversion rate and conversion efficiency of starch to glucose. For conversion rate
determination, enzyme solution of 0.2 mL of α-amylase and 0.2 ml glucoamylase each
diluted to 50 ml using sodium acetate buffer were used while 2 ml of α-amylase and 2
ml glucoamylase diluted to 25 ml were prepared for conversion efficiency analysis. The
samples were prepared in duplicate for conversion rate determination and triplicate for
the conversion efficiency analysis.
Using a tared 15 ml plastic centrifuge with a tightly fitting screw cap, 100 mg of
ground samples from each RIL was mixed with 0.2 mL 190 proof ethanol and 2 ml
dimethyl sulfoxide (DMSO). The sample mixture was vortexed vigorously to aid starch
dispersion and then incubated in a briskly boiling water bath for 5 min to gelatinize the
starch. It is then acidified with 2.9 ml sodium acetate buffer (pH 4.5 containing 11.8 ml
glacial acetic acid per liter solution) and 0.1 ml thermostable alpha-amylase solution

36
(6.38 AAU and 127.68 AAU) was added. To liquefy the starch, the mixture was then
incubated at 80 oC using VWR digital water shaking at 300 strokes per min (for 6 min
and 10 min). Another 4 ml sodium acetate buffer and 0.1 ml gluco-amylase (0.17 GAU
and 3.46 GAU) were added and then incubated at 50 oC (for 30 min and 60 min) to
saccharify the hydrolyzed starch. The samples that were tightly capped throughout the
analysis had a final volume of 9.3 ml.
Sugar Analysis
Using 2 ml Eppendorf tubes, about 1.5 ml of the saccharified aliquot was heated
for 2 min in a briskly boiling water to deactivate the enzyme and then centrifuged at
3000 rpm for 10 min. The samples were filtered through 0.22 μm membrane filter prior
to HPLC analysis. The Waters Alliance® HPLC system with 2690 Separation Modules
(integrates five 24-vial carrousel, solvent delivery system, onboard controller,
compartment for column and column heater) and Waters 2410 RI detector were used for
the analysis of glucose conversion. The Shodex SP0810 column (8.0 mm id x 300 mm)
equipped with SP-G guard column (6.0 mm id x 50 mm) were used at column
temperature of 60 oC using filtered and degassed deionized water as the eluent at 0.7
ml/min. Each sample was analyzed for 30 min and standards were run at the start,
middle and end of sample analysis. For quality assurance, 20% of the samples were
analyzed in duplicate and a blank was run every 10 sample injections.

37
Fermentation
Thirty five (35) g sorghum flour samples (equivalent to about 30 g dry mass)
were mixed with 60 mL of sterilized and deionized water in sterilized 250 ml
Erlenmeyer flask with cotton plug. The starch was gelatinized for 1 h in a boiling water
bath while shaking at 150 strokes per minute using the VWR digital shaking water bath.
First dosing of SPEZYME®
XTRA (0.02% w/w of dry substrate) was added before the
gelatinization stage of the starch to reduce the viscosity while cooking. The enzyme
solutions for liquefaction and saccharification were prepared separately by diluting 1 ml
of SPEZYME®
XTRA and 2 mL G-ZYME ®
480 Ethanol to 100 ml using sodium acetate
buffer. After cooking, the mixture was adjusted to pH 5.5 using 1 N NaOH and 1 N
H2SO4 solution. Another 5 ml of sterilized and deionized water was added to reduce the
temperature of the mixture to about 80°C before the second dosing of SPEZYME®
XTRA (0.02% w/w of dry substrate). Liquefaction at 80°C was continued in the shaking
water bath for 30 min. Before adding G-ZYME ®
480 Ethanol enzyme (0.1% w/w of dry
solid), 5 ml of sterilized and deionized water was again added to reduce the temperature
of the mixture to about 65oC. Saccharification with G-ZYME
® 480 Ethanol was done for
30 min at 60°C, after which, flasks were removed from the water bath and cooled for
another 30 min until the hydrolyzate attained 35°C.
After 30 min saccharification and cooling to room temperature, the fermentation
medium was inoculated with 2.0 mL of activated dry yeast (Ethanol Red) from
Fermentis. To activate the Ethanol Red, 5.00 g of dry yeast in 25 mL of sterilized
peptone saline water (8.5 g of NaCl and 1 g of peptone per liter) was incubated in New

38
Brunswick shaker incubator (New Brunswick Scientific Inc., Edison, NJ) at 150 rpm and
32 °C for 25 min. The activated yeast suspension had a live cell concentration of about
1.0 ×10⁹ cells/mL while the inoculated mash had a yeast cell concentration of
approximately 1.0 ×10⁷
cells/mL. Fermentation set up for each grain sample was done in
duplicate and were incubated in the rotary shaker at 150 rpm and 32°C for 72 h.
Ethanol and Yeast Viability Analysis
Using a 3 ml sterile syringe, exactly 1 ml of the sample from each fermentation
flasks was taken after 24, 48 and 72 h of yeast inoculation. The collected sample was
diluted with 9 ml sterilized deionized water in a sterilized 15 ml test tube with cap and
used for microbial and ethanol analysis.
For microbial analysis, 1 ml of the diluted sample was serially dilution in
sterilized test tube with cap and peptone saline water. Using Plate Count Agar (PCA)
containing 1 g/L glucose, 2.5 g/L yeast extract, 5 g/L tryptone, and 15 g/L agar, 100 μL
aliquot from the 10-5
dilution was immediately plated in duplicate for yeast viability
analysis. Spread plates were inverted and incubated at 35oC for 48 h. Plates having a
colony forming units (cfu) between 30 and 300 were used for the analysis.
The remaining 9 ml of the diluted sample was transferred into a15 ml plastic
centrifuge with a tightly fitting screw cap. After centrifugation at 3000 rpm for 10 min,
the supernatant was filtered through 0.22 μm membrane filter prior to HPLC analysis for
ethanol. The HPLC condition, column and detector were the same as during sugar
analysis. The fermentation efficiency was calculated from the theoretical yield of 56.72
g of ethanol produced from 100 g of dry starch assuming 1 g of starch could be

39
hydrolyzed into 1.11 g glucose, and each gram of glucose could produce 0.511 g of
ethanol.
Statistical Analysis
Eighteen recombinant inbred lines (RILs) of grain sorghum were grouped as HD
and ND for both parent lines and offsprings. Using SPSS 16, analysis of variance
(ANOVA) for individual variables was performed for each digestible group. Using the
least squares difference (LSD), the significance of variation among means of each
digestible group was determined. Pearson correlation was also used to relate pasting
parameters, particle size and physicochemical properties of the grain with glucose and
ethanol yield. The level of significance was P < 0.05 for statistical methods, except as
noted.
RESULTS AND DISCUSSION
Physical Properties and Chemical Composition of the Sorghum Grains
The average values of the physical properties and chemical composition of each
digestible group (parent and offspring sorghum grain samples) are shown in Table 4.
The analysis of variance (ANOVA) (Table 5) showed that there are significant
differences in starch content, kernel hardness and kernel texture among the digestible
groups. Least significant difference (LSD) test (Table 4) reveals that both parent and
offspring from the same digestible group were not significantly different in both
chemical and physical properties and only the starch content, kernel hardness and
endosperm texture of the HD group were significantly different from those of the ND
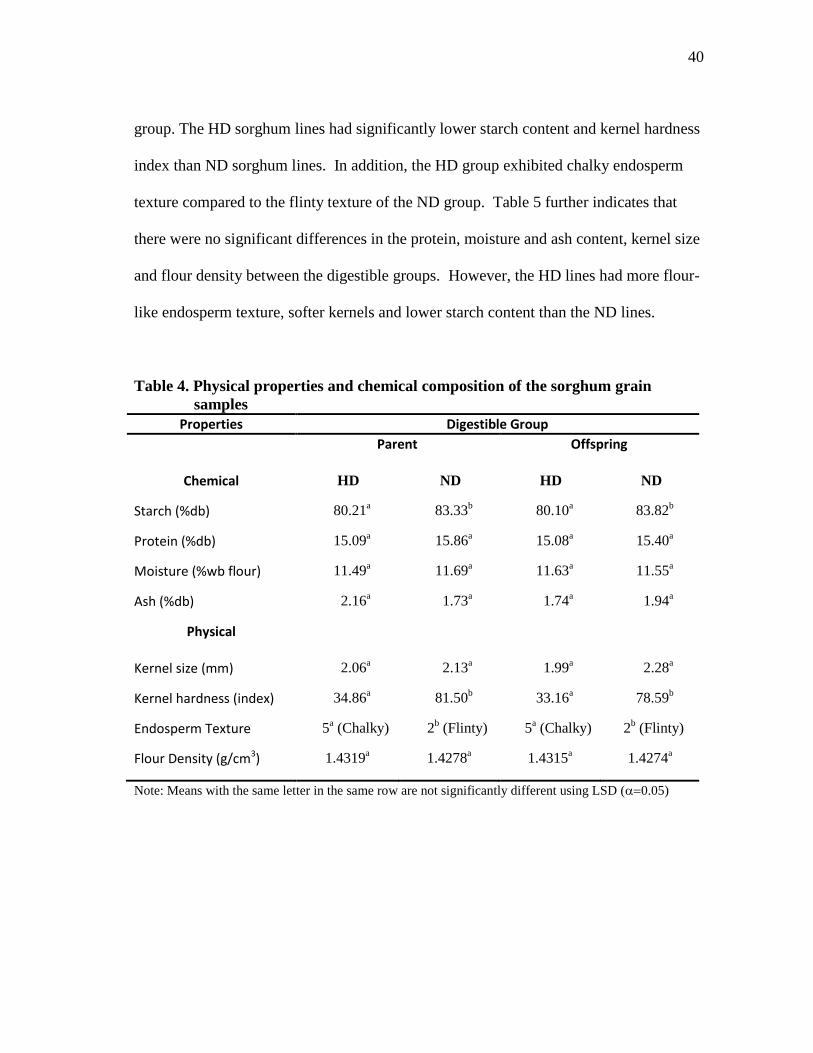
40
group. The HD sorghum lines had significantly lower starch content and kernel hardness
index than ND sorghum lines. In addition, the HD group exhibited chalky endosperm
texture compared to the flinty texture of the ND group. Table 5 further indicates that
there were no significant differences in the protein, moisture and ash content, kernel size
and flour density between the digestible groups. However, the HD lines had more flour-
like endosperm texture, softer kernels and lower starch content than the ND lines.
Table 4. Physical properties and chemical composition of the sorghum grain
samples
Properties Digestible Group
Parent Offspring
Chemical HD ND HD ND
Starch (%db) 80.21a 83.33
b 80.10
a 83.82
b
Protein (%db) 15.09a 15.86
a 15.08
a 15.40
a
Moisture (%wb flour) 11.49a 11.69
a 11.63
a 11.55
a
Ash (%db) 2.16a 1.73
a 1.74
a 1.94
a
Physical
Kernel size (mm) 2.06a
2.13a
1.99a
2.28a
Kernel hardness (index) 34.86a
81.50b
33.16a
78.59b
Endosperm Texture 5a (Chalky) 2
b (Flinty) 5
a (Chalky) 2
b (Flinty)
Flour Density (g/cm3) 1.4319a
1.4278a
1.4315a
1.4274a
Note: Means with the same letter in the same row are not significantly different using LSD (0.05)

41
Table 5. Mean squares from ANOVA of physical and chemical properties among
digestible group
Sum of
Squares
df Mean Square F Sig.
Starch (%db) 151.3797 3 50.45989 15.88834 0.00000
Protein (%db) 3.683034 3 1.227678 0.887038 0.45429
Ash (%db) 1.117074 3 0.372358 1.583905 0.20492
Endosperm Texture 68.11111 3 22.7037 408.6667 0.00000
Kernel Hardness (index) 24701.61 3 8233.869 102.4416 0.00000
Flour Moisture (%wb) 0.218217 3 0.072739 0.757655 0.52318
Kernel Size(mm) 0.244467 3 0.081489 2.811809 0.07779
Sorghum Flour Pasting Profile
The average peak viscosity, breakdown, setback, peak time and pasting
temperature of the sorghum groups measured during the 13-min heat-hold-cool process
are shown in Table 6 while representative pasting curves of several HD and ND RILs
(parents and offspring) from the 18 sorghum cultivars generated from the viscosity data
are shown in Figure 8. The temperature profile during pasting is indicated by the solid
straight line at the top of the RVA curves. While the RVA curves appeared to follow the
same pattern, there were still observed differences between HD and ND groups.
However, LSD test showed that pasting properties of both parent and offspring from the
same digestible group were not significantly different.
The ANOVA showed significant differences at 95% confidence level between the
HD and ND groups in peak time, pasting temperature, peak viscosity, trough, breakdown
and setback but not in the final viscosity (Table 7). The initial swelling temperature of
HD sorghum starches was significantly lower (77oC) than that of ND cultivars (83
oC) and
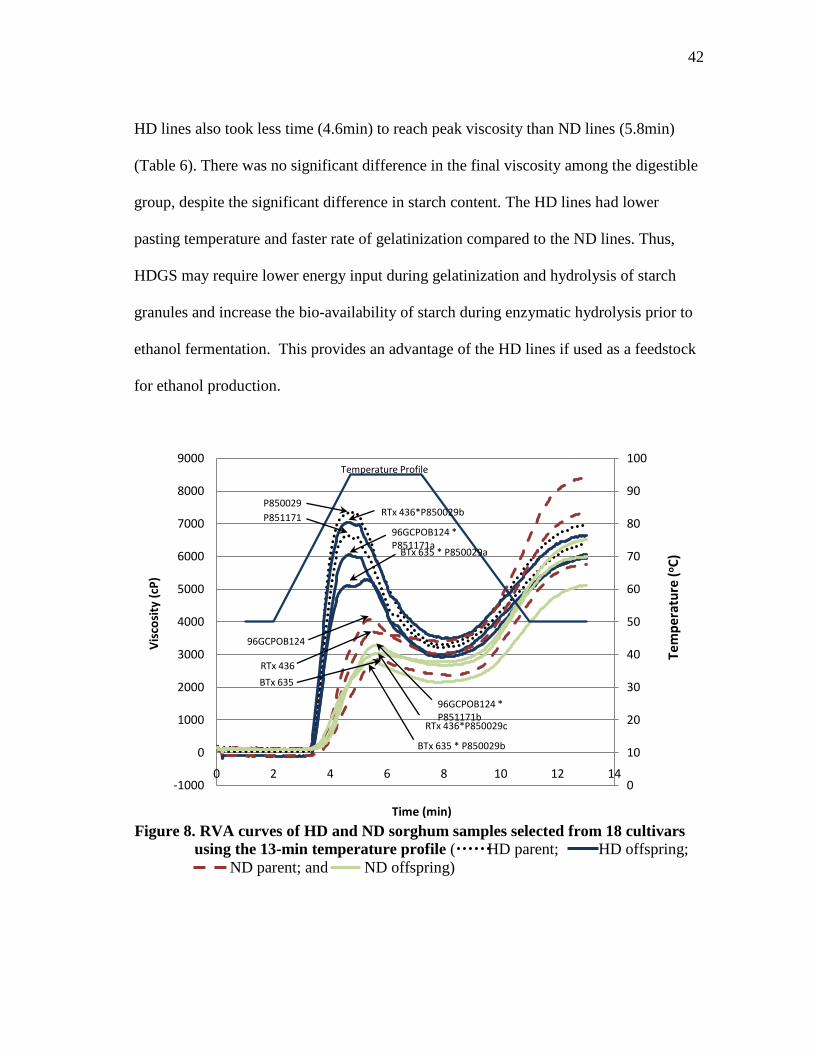
42
HD lines also took less time (4.6min) to reach peak viscosity than ND lines (5.8min)
(Table 6). There was no significant difference in the final viscosity among the digestible
group, despite the significant difference in starch content. The HD lines had lower
pasting temperature and faster rate of gelatinization compared to the ND lines. Thus,
HDGS may require lower energy input during gelatinization and hydrolysis of starch
granules and increase the bio-availability of starch during enzymatic hydrolysis prior to
ethanol fermentation. This provides an advantage of the HD lines if used as a feedstock
for ethanol production.
Figure 8. RVA curves of HD and ND sorghum samples selected from 18 cultivars
using the 13-min temperature profile ( HD parent; HD offspring;
ND parent; and ND offspring)
0
10
20
30
40
50
60
70
80
90
100
-1000
0
1000
2000
3000
4000
5000
6000
7000
8000
9000
0 2 4 6 8 10 12 14
Vis
cosi
ty (
cP)
Time (min)
Tem
per
atu
re (
oC
)
P850029
Temperature Profile
P851171RTx 436*P850029b
96GCPOB124 * P851171a
BTx 635 * P850029a
96GCPOB124
RTx 436
BTx 635
RTx 436*P850029c
96GCPOB124 * P851171b
BTx 635 * P850029b
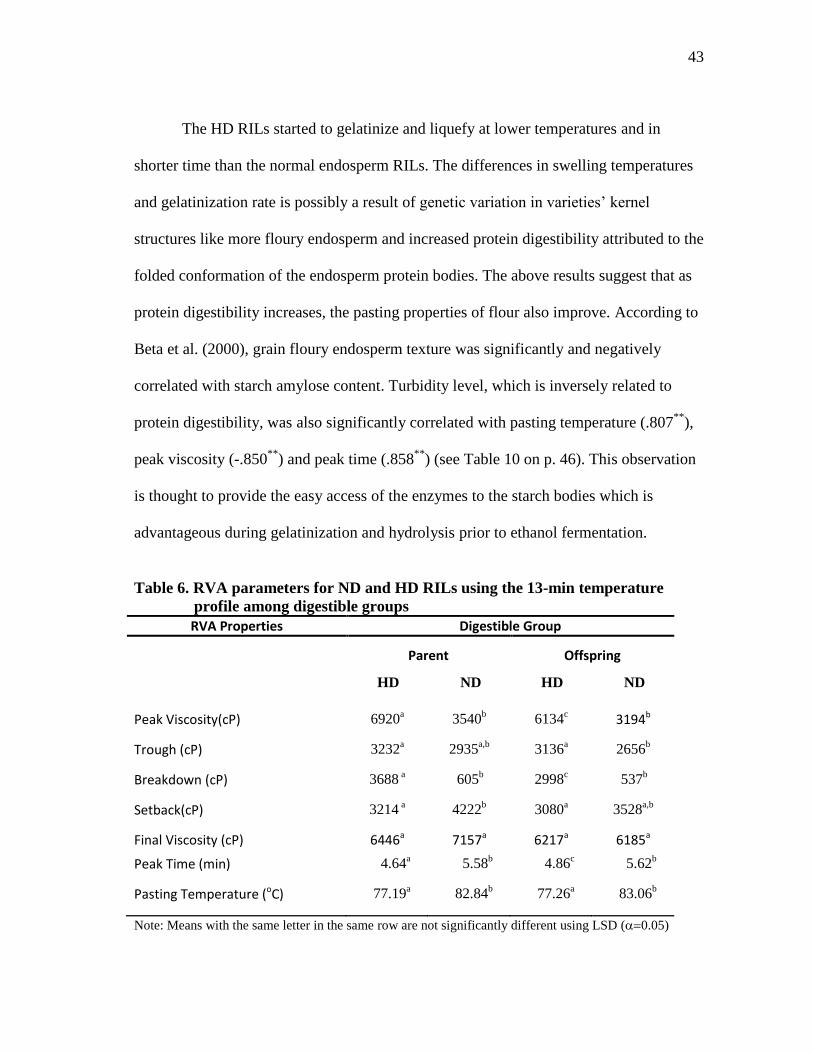
43
The HD RILs started to gelatinize and liquefy at lower temperatures and in
shorter time than the normal endosperm RILs. The differences in swelling temperatures
and gelatinization rate is possibly a result of genetic variation in varieties’ kernel
structures like more floury endosperm and increased protein digestibility attributed to the
folded conformation of the endosperm protein bodies. The above results suggest that as
protein digestibility increases, the pasting properties of flour also improve. According to
Beta et al. (2000), grain floury endosperm texture was significantly and negatively
correlated with starch amylose content. Turbidity level, which is inversely related to
protein digestibility, was also significantly correlated with pasting temperature (.807**
),
peak viscosity (-.850**
) and peak time (.858**
) (see Table 10 on p. 46). This observation
is thought to provide the easy access of the enzymes to the starch bodies which is
advantageous during gelatinization and hydrolysis prior to ethanol fermentation.
Table 6. RVA parameters for ND and HD RILs using the 13-min temperature
profile among digestible groups
RVA Properties Digestible Group
Parent Offspring
HD ND HD ND
Peak Viscosity(cP) 6920a
3540b
6134c 3194b
Trough (cP) 3232a 2935
a,b 3136
a 2656
b
Breakdown (cP) 3688 a 605
b 2998
c 537
b
Setback(cP) 3214 a 4222
b 3080
a 3528
a,b
Final Viscosity (cP) 6446a 7157a
6217a 6185a
Peak Time (min) 4.64a 5.58
b 4.86
c 5.62
b
Pasting Temperature (oC) 77.19a 82.84
b 77.26
a 83.06
b
Note: Means with the same letter in the same row are not significantly different using LSD (0.05)

44
Table 7. Mean squares from ANOVA of starch pasting properties among digestible
groups
Sum of Squares df
Mean
Square F Sig.
Peak_viscosity 8.67E+07 3 2.89E+07 107.298 0.0000
Pasting_temp 12.382 3 4.127 15.928 0.0000
Peak_time 6.062 3 2.021 74.464 0.0000
Final_viscosity 4486622.668 3 1495541 2.79 0.0560
Trough 2054084.632 3 684694.9 7.445 0.0010
Breakdown 6.37E+07 3 2.12E+07 163.079 0.0000
Setback 4678934.658 3 1559645 6.773 0.0010
Saccharification
The conversion rate and conversion efficiency of sorghum starch to glucose were
measured to evaluate its digestibility. These were done using two sets of gelatinization,
liquefaction and saccharification time (5, 6, 30 min and 5, 10, 60 min) and SPEZYME®
XTRA and G-ZYME®
480 Ethanol enzyme concentration (60 AAU with 1.7 GAU and
1270 AAU with 34.6 GAU per g of flour). The initial rate of conversion illustrates how
fast the starch was being converted to glucose using a reduced enzyme concentration and
reaction time while efficiency of conversion measures the overall accessibility and
availability of starch when complete enzymatic hydrolysis and saccharification have been
achieved.
Table 8 shows the rate and efficiency of enzymatic conversion to glucose of the
starch from the different digestible groups of sorghum. The conversion rate of the HD
lines was about 18% faster and around 15% more efficient than the ND lines under the
conditions of the experiment. This implies that the HD lines has higher starch accessibility
and digestibility during enzymatic conversion compared to ND lines.
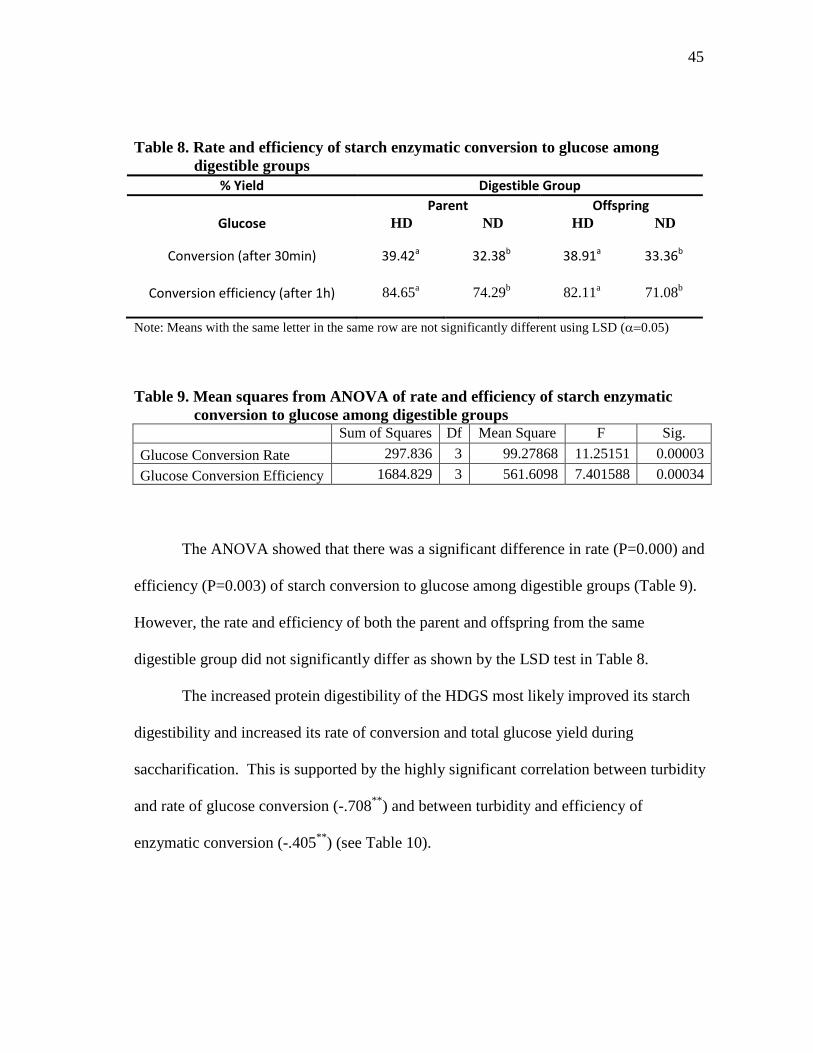
45
Table 8. Rate and efficiency of starch enzymatic conversion to glucose among
digestible groups
% Yield Digestible Group
Parent Offspring
Glucose HD ND HD ND
Conversion (after 30min) 39.42a 32.38b 38.91a 33.36b
Conversion efficiency (after 1h) 84.65a
74.29b
82.11a
71.08b
Note: Means with the same letter in the same row are not significantly different using LSD (0.05)
Table 9. Mean squares from ANOVA of rate and efficiency of starch enzymatic
conversion to glucose among digestible groups
Sum of Squares Df Mean Square F Sig.
Glucose Conversion Rate 297.836 3 99.27868 11.25151 0.00003
Glucose Conversion Efficiency 1684.829 3 561.6098 7.401588 0.00034
The ANOVA showed that there was a significant difference in rate (P=0.000) and
efficiency (P=0.003) of starch conversion to glucose among digestible groups (Table 9).
However, the rate and efficiency of both the parent and offspring from the same
digestible group did not significantly differ as shown by the LSD test in Table 8.
The increased protein digestibility of the HDGS most likely improved its starch
digestibility and increased its rate of conversion and total glucose yield during
saccharification. This is supported by the highly significant correlation between turbidity
and rate of glucose conversion (-.708**
) and between turbidity and efficiency of
enzymatic conversion (-.405**
) (see Table 10).

Table 10. Pearson correlation coefficients (r values) of sorghum starch properties, protein and starch digestibility and
ethanol yield
Peak
Viscosity
Pasting
Temperature
Peak
time
Final
viscosity
Starch
(db)
Protein
(db) Turbidity
Glucose
Conversion
Efficiency
Glucose
Conversion
Rate
Ethanol
%Yield
(24h)
Ethanol
%Yield
(48)
Ethanol
%Yield
(72)
Peak
Viscosity 1
Pasting
Temperature -.870
** 1
Peak time -.951**
.899**
1
Final
viscosity 0.163 0.16 -0.017 1
Starch (db) -.632**
.742**
.616**
.357* 1
Protein (db) -0.252 0.043 0.267 -.487**
-.502**
1
Turbidity -.850**
.807**
.858**
0.061 .589**
0.267 1
Glucose
Conversion
Efficiency .625
** -.562
** -.631
** 0.209 -.356
** -0.239 -.405
** 1
Glucose
Conversion
Rate .745
** -.634
** -.787
** 0.091 -.366
* -.455
** -.708
** .669
** 1
Ethanol
%Yield
(24h) .593
** -.688
** -.592
** -0.093 -.576
** 0.034 -.617
** 0.217 .402
* 1
Ethanol
%Yield (48) .484
** -.538
** -.412
* -0.159 -.546
** 0.129 -.550
** 0.016 .357
* .835
** 1
Ethanol
%Yield (72) .402
* -.376
* -.339
* -0.311 -.584
** .338
* -.426
** 0.108 0.317 .453
** .749
** 1
**. Correlation is significant at the 0.01 level (2-tailed).
*. Correlation is significant at the 0.05 level (2-tailed).
46

47
Ethanol Fermentation
Using 100 ml fermentation volume with 30% dry sorghum flour, the ethanol
concentration (%v/v) after 24, 48 and 72 h simultaneous saccharification and
fermentation (SSF) of 18 sorghum cultivars are shown in Figure 9. Ethanol yields were
in the range of 5.1 – 9.6 % , 9.2 – 13.1% and 11.2-13.2% (v/v) after 24, 48 and 72 h
SSF, respectively. Assuming 1 g of starch could be hydrolyzed into 1.11 g glucose and
each gram of glucose could produce 0.511 g of ethanol, the corresponding fermentation
efficiency of each variety was calculated. The % ethanol yield is normally used to
indicate the efficiency of ethanol production (Zhan et al., 2006).
Analysis of variance (ANOVA) at 95% confidence level confirms that there is a
significant difference in fermentation efficiency between digestible groups after 24 and
48 h of fermentation (P= 0.000 and P=0.0033, respectively) but not after 72 h of SSF
(P=0.1067) (Table 11). Least significant difference (LSD) test in Table 12 shows that %
ethanol yield for both parent and offspring from the same digestible group are not
significantly different throughout the 72 h of fermentation.
When HD lines were used, independent t-test at 0.05 shows that there is a
significant difference in % ethanol yield between 24 and 48 h (50 and 65% ethanol yield,
respectively) and no significant difference between 48 and 72 h (65 and 65 % ethanol
yield, respectively). However, when ND lines were utilized, significant increase in %
ethanol yield can be observed until 72 h of SSF (38, 58 and 62 % ethanol yield at 24, 48
and 72 h SSF, respectively) (see Appendix). Results only show that HD sorghum lines
have faster rate of conversion and shorter reaction time needed to achieve completion

48
than ND sorghum lines. Thus, HD lines have significantly higher % ethanol yield than
the ND lines if fermentation time will be shortened to 48 h.
Figure 9. Ethanol concentrations (%v/v) at 24, 48 and 72 h SSF using the 18
sorghum cultivars. ( HD lines and ND lines)
Table 11. Mean squares from ANOVA of % ethanol yield at 24, 48 and 72 h SSF
among digestible groups
Sum of
Squares
df Mean
Square
F Sig.
24h Fermentation 1127.83 3 375.9435 12.06638 0.00002
48h Fermentation 453.7155 3 151.2385 5.621919 0.00327
72h Fermentation 62.98735 3 20.99578 2.204339 0.10673
0.00
2.00
4.00
6.00
8.00
10.00
12.00
14.00
Eth
ano
l Co
cen
trat
ion
(%
v/v)
Grain Sorghum Varieties
24h 48h 72h
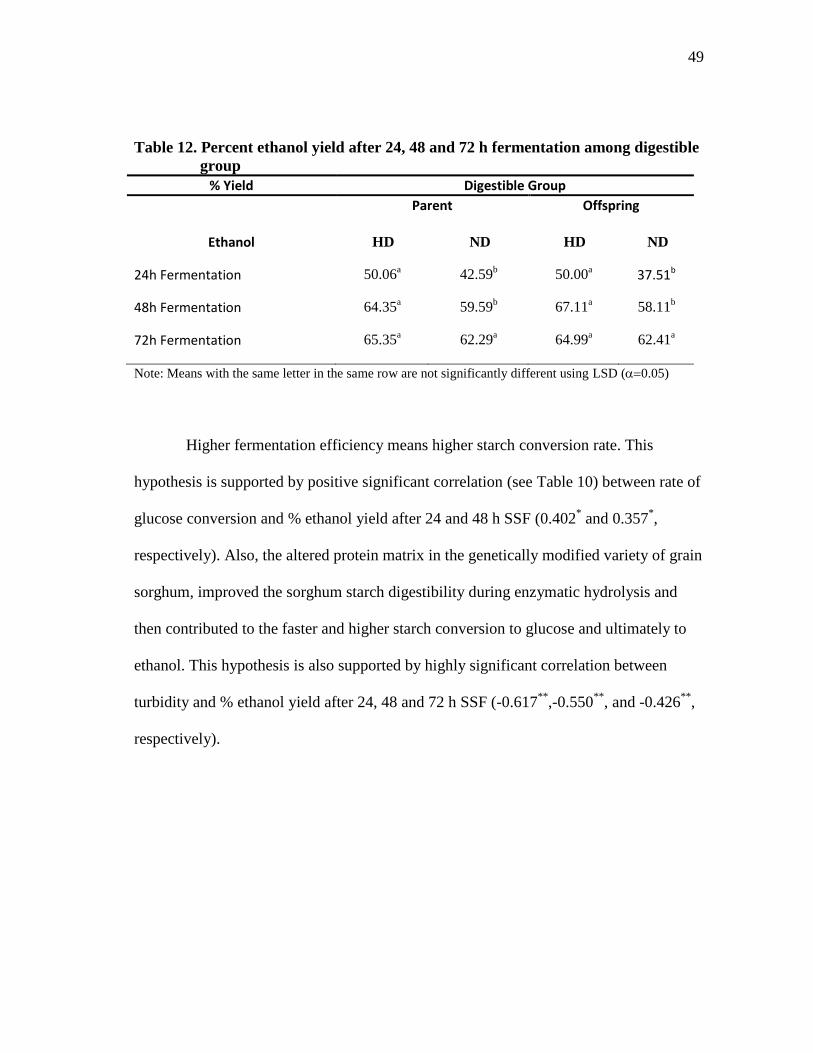
49
Table 12. Percent ethanol yield after 24, 48 and 72 h fermentation among digestible
group
% Yield Digestible Group
Parent Offspring
Ethanol HD ND HD ND
24h Fermentation 50.06a
42.59b
50.00a 37.51b
48h Fermentation 64.35a
59.59b
67.11a
58.11b
72h Fermentation 65.35a
62.29a
64.99a
62.41a
Note: Means with the same letter in the same row are not significantly different using LSD (0.05)
Higher fermentation efficiency means higher starch conversion rate. This
hypothesis is supported by positive significant correlation (see Table 10) between rate of
glucose conversion and % ethanol yield after 24 and 48 h SSF (0.402* and 0.357
*,
respectively). Also, the altered protein matrix in the genetically modified variety of grain
sorghum, improved the sorghum starch digestibility during enzymatic hydrolysis and
then contributed to the faster and higher starch conversion to glucose and ultimately to
ethanol. This hypothesis is also supported by highly significant correlation between
turbidity and % ethanol yield after 24, 48 and 72 h SSF (-0.617**
,-0.550**
, and -0.426**
,
respectively).

50
Figure 10. Comparison of ethanol concentration during 72 h SSF of HDGS, NDGS
and corn at 30% dry solid.
Ethanol production from dry milled HDGS, NDGS and corn using simultaneous
saccharification and fermentation at 30% dry solid is shown in Figure 10. Among the
three substrates, the HDGS gave the highest ethanol yield all throughout the first 48 h of
fermentation. Results suggest that HDGS starch is more digestible than corn starch and
NDGS. HD lines also have shorter time of conversion which has been completed within
48 h of fermentation and faster and higher starch conversion to glucose and ultimately to
ethanol than corn and NDGS. Since sorghum has lower demand as food, the new variety
of highly digestible grain sorghum could very well serve as a viable substitute for corn in
ethanol production.
0
2
4
6
8
10
12
14
0 10 20 30 40 50 60 70 80
Eth
ano
l Co
nce
ntr
atio
n (
%v/
v)
Fermentation Time (h)
Corn
HD RILs 1
HD RILs 2
HD RILs 3
ND RILs 1
ND RILs 2
ND RILs 3

51
Increasing the dry solid concentration from 22% to 30% (w/v) increases the
ethanol yield by almost 60% (v/v) of the original (see Table 3). This will allow
considerable saving of water, reduced distillation cost and increased ethanol production
with given plant capacity and labor cost (Bvochora et al., 2000). However, fermentation
efficiency generally decreases as substrate concentration increases (Zhan et al., 2006).
Results showed that the overall % ethanol yield decreases by almost 30% when dry solid
concentration is increased from 22% to 30% (w/v).
Since fermentation in this study was carried out in shake flasks, conditions may
not be optimal to ensure complete fermentation. In this study, microbial counts in all
fermentation were maintained with 107 cfu/ml though decrease in cell viability was
observed after 48 and 72. Stressful environment for yeast include high solute and ethanol
concentration, low pH and production of co products like acetic and lactic acid (Nichols
et al., 2008). In order to maximize the benefit of high dry solid fermentation, further
research is necessary to determine the optimum processing parameters and to improve
the utilization of starch. High gravity fermentation under SSF has its potential of limited
contamination and reduced osmotic stress to the yeast, because glucose is consumed as it
formed.
Particle Size Distribution of Flour
Mass median diameter (MMD) was used as a means of expressing and
comparing particle size on a statistical basis. The geometric standard deviation (GSD) on
the other hand was used to show how spread out are the particle sizes. Generally, it is

52
assumed that attrition grinding or hammer milling of grains will result in sigmoidal
particle size distribution (PSD) (Sahai et al., 2001). But, from the Malvern analysis,
sorghum flour that was milled under 1 mm screen opening showed that it is a bimodal
distribution (Figure11).
Figure 11. Particle size distribution of sorghum flour samples.
The proportions of each distribution which have a particle size range of 3 to 60
m and 60 to 1000 m, were calculated using the Malvern cumulative plot (Figure 12).
Independent t-test for equality of means at 95% shows that there is a significant
difference (P-value = 0.000) between HD and ND flour in the percentage of each size
range. HD flour has a significantly higher portion of 0 to 60 m (33 + 7% w/w) and
0
1
2
3
4
5
6
7
8
9
1.000 10.000 100.000 1000.000 10000.000
Mat
eri
al R
eta
ine
d o
n s
cre
en
s (%
mas
s)
EAD (micron)
101 (HD)
107 (HD)
117 (HD)
103 (HD)
110 (HD)
113 (HD)
102 (ND)
118 (ND)
104 (ND)
114 (ND)
111 (ND)
105 (ND)
112 (ND)

53
significantly lower portions of 60 to 1000 m (67 + 6% w/w) than the ND flour (18 +
7% w/w and 82 + 6% w/w, respectively).
Figure 12. Percentage (%w/w) of the bimodal distribution which has a particle size
range of 3 to 60 m and 60 to 1000 m. ( HD lines and ND lines)
The MMD and the GSD for each size range were also analyzed. LSD test in
Table 13 shows that MMD and GSD of parent and offspring from the same digestible
group are significantly different for coarse particles but not with fines. Analysis of
variance (ANOVA) at 95% confidence level confirms that there is no significant
difference in MMD among digestible groups for 3 to 60 m size range but significantly
different for 60 to 1000 m range (Table 14).
0.00
20.00
40.00
60.00
80.00
100.00
120.00
Size
Dis
trib
uti
on
(%
w/w
)
Grain Varieties
%w/w of 3-60 microns

54
The PSD of sorghum flour samples shows that HD lines has greater portion of
fine particles (about 3 to 60 m) and lesser amount of coarse particles (about 60 to 1000
m) than ND lines when hammer-milled using 1 mm screen openings. The physical
characteristics of grain, such as kernel hardness and endosperm texture, have significant
Table 13. Average MMD and GSD among digestible group
Properties Digestible Group
Parent Offspring
0 to 60 m range HD ND HD ND
MMD 15.40a 15.21
a 15.83
a 15.28
a
GSD 1.51a 1.71
b 1.64
b 1.76
c
60 to 1000 m range
MMD 226.63a 406.68
b 312.20
b 365.97
c
GSD 2.08a 2.05
b 2.29
b 2.07
c
Note: Means with the same letter in the same row are not significantly different using LSD (0.05)
Table 14. Mean squares from ANOVA average MMD and GSD among digestible
group
Sum of
Squares
df Mean Square F Sig.
MMD (from 3-60m) 1.522277 3 0.507426 0.713205 0.552066
GSD(from 3-60m) 0.295016 3 0.098339 9.950877 0.000113
MMD (from 60-
1000m) 118453.2 3 39484.42 6.853663 0.00125
GSD(from 60-1000m) 0.260656 3 0.086885 7.329964 0.000842
association with particle size distribution (0.424**
and -0.439**
) (Table 15). It could be
deduced that HD grains breaks easily than the ND because HD RILs have soft and floury
55
endosperm matrix. This is also supported by the LSD results in Table 13. HD parent has
the smallest MMD (15.40 and 226.63 for 0-60m and 60-1000m) while ND offspring
has the largest MMD (447 m). Though MMD of HD offspring is not significantly
different in with ND parent, the HD offspring has the significantly highest GSD, meaning
with most variation of particle size among the digestible groups.
Fineness of grind influences the amount of sugar formed due to variation in
surface area of the flour. If particle is too large, starch granules are not easily gelatinized,
forming fewer fermentable sugars (Naidu et al., 2000). The hypothesis that finer particles
has faster and higher glucose yield is supported by highly significant correlation between
MMD and glucose conversion efficiency (-0.742) and significant correlation between
MMD and rate of glucose conversion during saccharification (-0.524) in Table 15. It was
also reported that particle size has an effect on ethanol yield. Final ethanol concentration
can increase by 22% if corn flour grinding screen size is decreased from 5 to 0.5 mm
(Naidu et al., 2000). However, in this study, the difference in particle size of HD and ND
has no significant effect on ethanol yield. We could therefore hypothesize that variation
in particle size below 500 microns has no significant effect in ethanol yield.
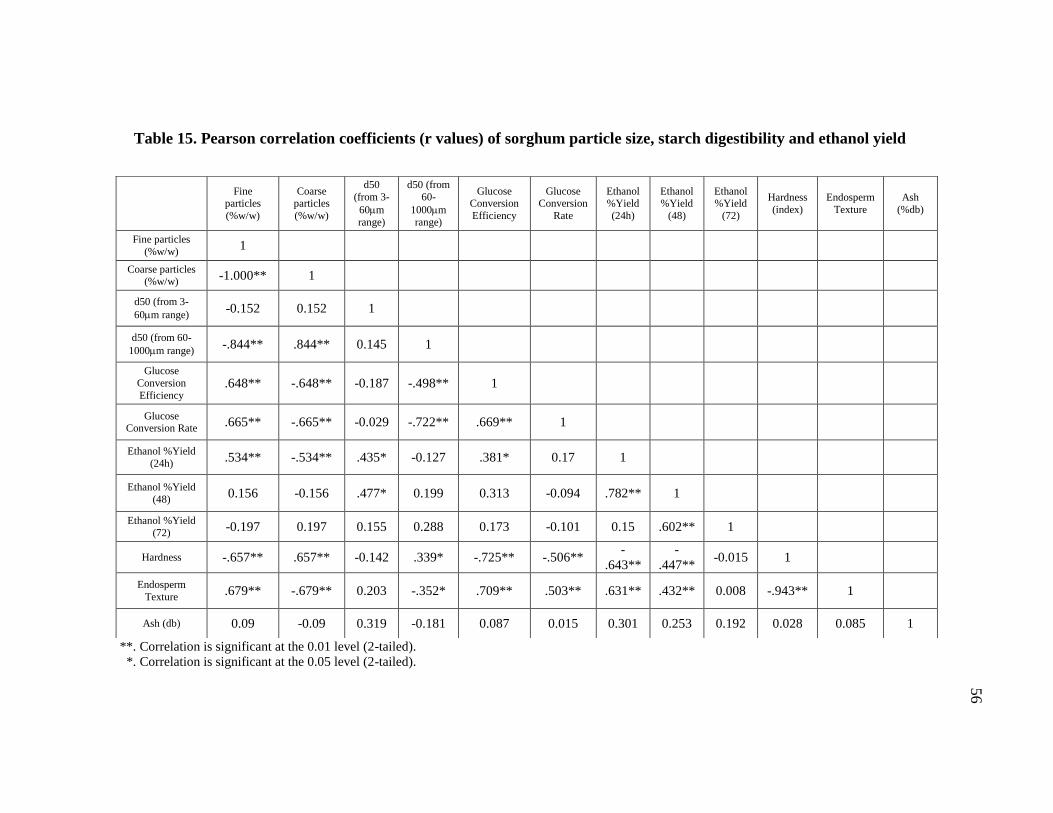
**. Correlation is significant at the 0.01 level (2-tailed).
*. Correlation is significant at the 0.05 level (2-tailed).
Fine particles
(%w/w)
Coarse particles
(%w/w)
d50
(from 3-
60m
range)
d50 (from
60-
1000m
range)
Glucose Conversion
Efficiency
Glucose Conversion
Rate
Ethanol %Yield
(24h)
Ethanol %Yield
(48)
Ethanol %Yield
(72)
Hardness
(index)
Endosperm
Texture
Ash
(%db)
Fine particles
(%w/w) 1
Coarse particles (%w/w)
-1.000** 1
d50 (from 3-
60m range) -0.152 0.152 1
d50 (from 60-
1000m range) -.844** .844** 0.145 1
Glucose
Conversion
Efficiency .648** -.648** -0.187 -.498** 1
Glucose Conversion Rate
.665** -.665** -0.029 -.722** .669** 1
Ethanol %Yield
(24h) .534** -.534** .435* -0.127 .381* 0.17 1
Ethanol %Yield
(48) 0.156 -0.156 .477* 0.199 0.313 -0.094 .782** 1
Ethanol %Yield
(72) -0.197 0.197 0.155 0.288 0.173 -0.101 0.15 .602** 1
Hardness -.657** .657** -0.142 .339* -.725** -.506** -
.643**
-
.447** -0.015 1
Endosperm
Texture .679** -.679** 0.203 -.352* .709** .503** .631** .432** 0.008 -.943** 1
Ash (db) 0.09 -0.09 0.319 -0.181 0.087 0.015 0.301 0.253 0.192 0.028 0.085 1
Table 15. Pearson correlation coefficients (r values) of sorghum particle size, starch digestibility and ethanol yield
56

57
CONCLUSION
HD lines have more flour-like endosperm texture, softer kernels and lower
starch content than the ND lines but are not significantly different in protein, moisture,
ash content, kernel size and flour density. RVA results show that HD lines have lower
pasting temperature and faster rate of gelatinization compared to ND lines, therefore it
has an advantage over ND lines if used as a feedstock for ethanol production. The
increased protein digestibility of the HDGS significantly improved its starch pasting
property and starch digestibility (increased its rate of conversion and total glucose yield
during saccharification) which further increases the ethanol yield. Results also show that
HD sorghum lines have faster rate of conversion and shorter reaction time needed to
achieve completion during fermentation than ND sorghum lines and corn.
Increasing the dry solid concentration from 22% to 30% (w/v) increases the
ethanol yield from 8% v/v to 13%v/v. This will allow considerable saving of water,
reduced distillation cost and increased ethanol production with given plant capacity and
labor cost (Bvochora et al., 2000). However, fermentation efficiency generally decreases
as substrate concentration increases (Zhan et al., 2006). Further research is necessary to
determine the optimum processing parameters to attain maximum utilization of starch
during fermentation.
Fineness of grind influences the amount of sugar formed due to variation in
surface area of the flour. The hypothesis that finer particles has faster and higher glucose
yield is supported by highly significant correlation between MMD and glucose
conversion efficiency (-0.742**
) and significant correlation between MMD and rate of

58
glucose conversion during saccharification (-0.524**
). It was also reported that particle
reduction in particle size from 5 mm to 0.5 mm size has a significant increase on ethanol
yield (Naidu et al., 2007). However, in this study, it was hypothesized that variation in
particle size below 500 microns has no longer a significant effect in ethanol yield.
Results showed that the difference in particle size of HD (156 to 339 microns) and ND
(375 to 447microns) has no significant correlation on ethanol yield.
HDGS have lower energy input required during grinding, gelatinization and
hydrolysis of starch granules. Improved protein digestibility also increased bio-
availability of starch during enzymatic hydrolysis and ethanol yield. Since sorghum has
lower demand as food, the new variety of highly digestible grain sorghum could very
well serve as a viable substitute for corn in ethanol production.
HDGS requires lower energy inputs during grinding, gelatinization and
hydrolysis of starch granules compared to NDGS. Since sorghum has lower demand as
food, this new variety of grain sorghum could be a viable supplement for corn for a
much economical production of ethanol.

59
CHAPTER IV
CONCLUSIONS
High digestible variety of grain sorghum (HDGS) yielded higher ethanol in
shorter amount of time than the low digestible grain sorghum (NDGS) and corn by
simultaneous saccharification and fermentation. The higher protein digestibility of
HDGS resulted in its higher starch digestibility which brings to a faster and higher starch
conversion to glucose and ethanol during hydrolysis and fermentation. The HDGS
likewise had the highest ethanol production almost all throughout the 72 h of
fermentation. These results suggest that the altered protein matrix in the genetically
modified variety of grain sorghum improved its protein digestibility. Consequently, it
enhanced the sorghum starch digestibility during enzymatic hydrolysis and contributed
to the faster and higher starch conversion to glucose and ultimately to ethanol.
HD lines have more flour-like endosperm texture, softer kernels and lower starch
content than the ND lines but are not significantly different in protein, moisture, ash
content, kernel size and flour density. RVA results show that HD lines have lower
pasting temperature and faster rate of gelatinization compared to ND lines, therefore it
has an advantage over ND lines if used as a feedstock for ethanol production. The
increased protein digestibility of the HDGS significantly improved its starch pasting
property and starch digestibility (increased its rate of conversion and total glucose yield
during saccharification) which further increases the ethanol yield. Results also show that
HD sorghum lines have faster rate of conversion and shorter reaction time needed to
achieve completion during fermentation than ND sorghum lines and corn.

60
Since sorghum has lower demand as food, the new variety of highly digestible
grain sorghum could very well provide a viable substitute for corn in ethanol production,
especially in areas with drier climates that won’t support corn. The purpose of the paper
is not to promote sorghum over corn: it is to document that HDGS sorghums are as good
as corn and provide an alternative to corn using the same system. Aside from being a
less expensive grain than corn, its enhanced starch digestibility may further reduce both
material and processing cost. Possible process improvements include reducing enzyme
dosages, shortening of liquefaction and fermentation times, and eliminating some of the
unit processes through very high gravity SSF to lower energy needed during
fermentation and distillation. Further cost reduction can also be achieved by optimizing
the combination of substrates, enzymes and yeast during hydrolysis and fermentation.
Moreover, using dry yeasts which are tolerant and viable at high ethanol concentration
and enzymes with higher specific activities than the current commercial enzymes could
provide more efficient starch conversion to glucose and ethanol at a shorter time.

61
REFERENCES
Aboubacar A., J.D. Axtell, L. Nduulu, and B.R. Hamaker. 2003. Turbidity assay for
rapid and efficient identification of high protein digestibility sorghum lines.
Cereal Chemistry 80(1): 40-44.
American Association of Cereal Chemists. 2000. Methods 44-15A, 46-30, and 76-13. In
Approved Methods of the AACC, 10th Ed. St. Paul, MN: AACC.
ASTM E 1755-01. 2001. Standard test method for ash in biomass. In 2001 Annual Book
of ASTM Standards, Vol. 11.05, 1252–55. West Conshohocken, PA: American
Society for Testing and Materials.
Badger, P.C. 2002. Ethanol from cellulose: A general review. In Trends in New Crops
and New Uses, 17-21. J. Janick and A. Whipkey, eds. Alexandria, VA: ASHS
Press.
Beta, T., H. Corke, L.W. Rooney and J. RN Taylor. 2000. Starch properties as affected
by sorghum grain. J. Sci. Food Agric. 81: 245-251.
Brian Curtis Energies and Research Group. 2008. US Ethanol Industry: The Next
Inflection Point. US Department of Energy (DOE). Available at:
http://www.bcurtisenergies.com/pdf/Biomass2008.pdf. Accessed October 13,
2008.
Bvochora, J.M., J.S. Read and R. Zvauya. 2000. Application of very high gravity
technology to the cofermentation of sweet stem sorghum juice and sorghum
grain. Industrial Crops and Products 11: 11-17.
Chankrashekar, A., and A.W. Kirlies. 1988. Influence of protein on starch gelatinization
in sorghum. Cereal Chemistry 65: 626-628.
Chen, R.L., M.H. Lee and K.S. Matsumoto. 1996. Selective biosensing of z-lysine flow-
injection technique using oxidase reactor. Analytical Sciences 12: 87-90.
Coble, C.G., J.M Sweeten, R.P. Egg, E.J. Soltes, W.H. Aldred and D.A. Givens. 1985.
Chapter 4: Biological conversion and fuel utilization – Fermentation for ethanol
production. In Biomass Energy: A Monograph, 113-173. E. A. Hiler and B.A.
Stout, eds. College Station, TX: Texas A&M University Press.
Dicko, M. H., H. Gruppen, A.S. Traoré, A.G.J. Voragen and W.J.H. van Berkel. 2006.
Sorghum grain as human food in Africa: Relevance of content of starch and
amylase activities. African Journal of Biotechnology 5(5): 384-395.
62
Duodu, K.G., J.R.N. Taylor, P.S. Belton, and B.R. Hamaker. 2003. Factors affecting
sorghum protein digestibility. Journal of Cereal Science 38: 117–131.
Energy Efficiency and Renewable Energy (EERE). 2007. Biomass multi-year program.
US Department of Energy (DOE). Available at:
http://www1.eere.energy.gov/biomass/pdfs/mypp_feb2009.pdf. (Accessed
August 18, 2008)
Energy Independence and Security Act of 2007. Available at:
http://www.whitehouse.gov/news/releases/2007/12/20071219-1.html. Accessed
October 28, 2008.
Energy Information Administration (EIA). 2003. A primer on gasoline prices. Available
at: http://www.eia.doe.gov/ neic/brochure/oil_gas/primer/petbro.html. Accessed
June 17, 2007.
Energy Information Administration (EIA). 2008a. International energy outlook (IEO)
2008. US Department of Energy (DOE). Available at:
http://www.eia.doe.gov/oiaf/ieo/pdf/0484(2008).pdf. (Accessed October 28,
2008)
Energy Information Administration (EIA). 2008b. United States Energy Profile. US
Department of Energy (DOE). Available at:
http://tonto.eia.doe.gov/country/country_energy_data.cfm?fips=US. Accessed
October 14, 2008.
Energy Information Administration (EIA). 2008c. Energy Consumption by Sector, 1949-
2007. US Department of Energy (DOE). Available at:
http://www.eia.doe.gov/aer/txt/ptb0201a.html. Accessed October 28, 2008.
Energy Information Administration (EIA). 2008d. Energy Basics 101. US Department of
Energy (DOE). Available at:
http://www.eia.doe.gov/basics/energybasics101.html. Accessed October 28,
2008.
Faulkner, W.B. 2004. The effect of inlet velocity and barrel diameter on cyclone
performance. MS thesis. Texas A&M University, Department of Biological and
Agricultural Engineering.
Gray, K.A., L. Zhao and M. Emptage. 2006. Bioethanol. Current Opinion in Chemical
Biology 10(2): 141-146.
63
Hamaker, B.R. 2004. Chemical and physical aspects of food and nutritional quality of
sorghum and millet. In 2004 Annual Report of INTSORMIL CRSP. Available at:
http://intsormil.org/SM2004anlrpt/2004CUTILM.pdf. (Accessed May 5, 2007)
Hamelinck, C.A., G. V. Hooijdonk and A.PC Faaij. 2005. Ethanol from lignocellulosic
biomass: Techno-economic performance in short-, middle- and long-term.
Biomass and Bioenergy 28: 384-410.
Hill, J., E. Nelson, D. Tilman, S. Polasky, and D. Tiffany. 2006. Environmental,
economic, and energetic costs and benefits of biodiesel and ethanol biofuels.
Proc. Natl. Acad. Sci. 103(30): 11206-11210.
Hoseney, R. C. 1994. Principles of cereal science and technology. In Structure of
Cereals, 2nd ed. St. Paul, MN: American Association of Cereal Chemists.
Ingledew, W.M. 1999. Alcohol production by Saccharomyces cerevisiae: A yeast
primer. In The Alcohol Textbook. 49-87, 3rd
ed. Nottingham, UK: Nottingham
University Press.
Kulp K., and J.G. Ponte. 2000. Handbook of Cereal Science and Technology. 2nd ed.
New York, NY: Marcel Dekker Inc.
Liu, R. and F. Shen. 2007. Impacts of main factors on bioethanol fermentation from stalk
juice of sweet sorghum by immobilized Saccharomyces cerevisiae (CICC 1308).
Bioresource Technology 99: 847-854.
Mertz, E. T., M. M.Hassen, C. Cairns-Whittern, A. W. Kirleis, L Tu, and Axtell, J. D.
1984. Pepsin digestibility of proteins in sorghum and other major cereals. Proc.
Natl. Acad. Sci. 81:1-2.
Mojovic, L., S. Nikolic, M. Rakin and M. Vukasinovic. 2006. Production of bioethanol
from corn hydrolyzates. Fuel 85: 1750-1755.
Naidu, K., V. Singh, D.B. Johnston, K.D. Rausch, and M.E. Tumbleson. 2007. Effects of
ground corn particle size on ethanol yield and thin stillage. Cereal Chem.
84(1):6–9.
Nichols, N.N., B.S. Dien, R.J. Bothast, and M.A. Cotta. 2006. The corn ethanol industry.
In Alcoholic Fuels. 59-78. A Minteer, S. ed. Boca Raton, FL: CRC Press.
Nichols, N.N., D.A Monceaux, B.S. Dien,and R.J. Bothast. 2008. Production of ethanol
from corn and sugarcane. In Bioenergy. 3-15. Washington, DC: ASM Press.

64
Oria, M. P., B. R. Hamaker, J. D. Axtell, and C. Huang. 2000. A highly digestible
sorghum mutant cultivar exhibits a unique folded structure of endosperm protein
bodies. Proc. Natl. Acad. Sci. 97(10): 5065-5070.
Portillo, O. R. 2007. A mycological assesment of highly digestible protein sorghum
lines. MS thesis. Texas A&M University, Department of Soil and Crop Sciences.
Rooney, W.L., J. Blumenthal, B. Bean and J.E. Mullet. 2007. Designing sorghum as a
dedicated bioenergy feedstock. Biofuels, Bioproducts and Biorefining 1: 147-
157.
Shuler, M.L., and F. Kargi. 2002. Bioprocess Engineering: Basic Concepts. 2nd ed.
Upper Saddle River, NJ: Prentice Hall International Series.
Serna-Saldivar, S. O., and L.W Rooney. 1995. Structure and chemistry of sorghum and
millets. In Sorghum and Millets Chemistry and Technology, 69-124. D. A. V.
Dendy, ed. St. Paul, MN: American Association of Cereal Chemists.
Singh,V., C. J. Batie, G.W. Aux, K.D. Rausch, and C. Miller. 2006. Dry-grind
processing of corn with endogenous liquefaction enzymes. Cereal Chem. 83(4):
317–320.
Sluiter, A., and J. Sluiter. 2005. NREL Laboratory Analytical Procedure (LAP-016):
Determination of Starch in Solid Biomass Samples by HPLC. Golden, CO:
National Renewable Energy Laboratory. Available at:
http://www.nrel.gov/biomass/ pdfs/42624.pdf. Accessed January 11, 2008.
Smith, R. 2008. Planting date: Critical decision in grain sorghum yield potential.
Southwest Farm Press. Available at: http://southwestfarmpress.com. Accessed
March 8, 2008.
Sullivan, P. 2003. Conservation Tillage. Appropriate Technology Transfer for Rural
Area Publication # CT105. Available at: http://attra.ncat.org/attra-
pub/PDF/consertill.pdf. Accessed 28 April 2008.
Taylor, JRN, L. Novellie, and NVDW Liedenberg. 1984. Sorghum protein body
composition and ultrastructure. Cereal Chem. 61: 69-73.
US Renewable Fuel Association (RFA). 2007a. Ethanol industry outlook 2007: Building
new horizons. Available at: http://www.ethanolrfa.org/objects/pdf/outlook.
Accessed October 16, 2008.
US Renewable Fuel Association (RFA). 2007b. Tales from the heartland: America’s
ethanol scrapbook. Available at:

65
http://www.ethanolrfa.org/objects/pdf/scrapbook/RFA_Scrapbook_2007.pdf.
Accessed October 16, 2008.
US Renewable Fuel Association (RFA). 2008. Ethanol industry outlook 2008: Changing
the climate. Available at:
http://www.ethanolrfa.org/objects/pdf/outlook/RFA_Outlook_2008.pdf .
Accessed October 16, 2008.
Weaver CA, B.R. Hamaker, and J.D. Axtell. 1998. Discovery of grain sorghum
germplasm with high uncooked and cooked in vitro protein digestibility. Cereal
Chem. 75: 665-670.
Zhan, X., D. Wang, X. S. Sun, S. Kim, and D. Y. C. Fung. 2003. Lactic acid production
using extrusion-cooked grain sorghum. Trans. ASAE 46(2): 589–593.
Zhan, X., D. Wang, S.R. Bean, X. Mo, X.S. Sun, and D. Boyle. 2006. Ethanol
production from supercritical-fluid-extrusion cooked sorghum. Industrial Crops
and Products 23: 304–310.
Zhang, G., and B. R. Hamaker. 1998. Low α-amylase digestibility of cooked sorghum
flours and the effect of protein. Cereal Chem. 75(5): 710-713.

66
VITA
Name: Joan Rollog Hernandez
Office Address: Biological and Agricultural Engineering Department
324B Scoates Hall MS 2117
Texas A&M University
College Station, Texas 77843-2117
E-mail Address: [email protected], [email protected]
Education: M.S. Biological and Agricultural Engineering, May 2009
Texas A&M University
College Station, Texas 77843
M.S. Chemical Engineering, March 2006
Minor in Food Science
University of the Philippines at Los Baños
College, Laguna. 4031. Philippines
B.S. Chemical Engineering (cum laude), November 2002
Minor in Sugar Technology
University of the Philippines at Los Baños
College, Laguna. 4031. Philippines
Conference Paper and Presentation:
Hernandez, J.R, F.L. Aquino and S.C. Capareda. 2007. Activated carbon production
from pyrolysis and steam activation of cotton gin trash. In the Proceedings of the
2007 Beltwide Cotton Conferences. New Orleans, LA; and Paper presented at
ASABE Meeting Presentation. Paper Number: 076084. Minneapolis, MN.
Hernandez, J.R, F.L. Aquino, S.C. Capareda and W.L Rooney. 2007. Simultaneous
saccharification and fermentation of high digestible variety of grain sorghum for
ethanol production. Paper presented at ASABE Annual International Meeting.
Paper Number: 076084. Minneapolis, MN.
Hernandez, J.R., S.C. Capareda, W.L. Rooney, O.Portilllo and D.B. Hays. 2008. Effect
of protein and starch digestibility on ethanol fermentation of dry milled varieties
of highly digestible grain sorghum. Paper presented at ASABE Annual
International Meeting. Paper Number: 084454. Providence, RI.