since the return periods for the two different
TRANSCRIPT
29
Since the return periods for the two different probabilities of exceedance are close, using
the spectral acceleration maps which were based on a probability of exceedance of 2% in
50 years to analyze this bridge for the maximum considered earthquake with a probability
of exceedance of 3% in 75 years was proved acceptable.
Table 3.5. Values of Fa as a Function of Site Class and Mapped Short-Period Spectral Acceleration
[MCEER/ATC, 2002].
Site Class Mapped Spectral Response Acceleration at Short Periods
Ss ≤ 0.25 g S
s = 0.50 g S
s = 0.75 g S
s = 1.00 g S
s ≥ 1.25 g
A 0.8 0.8 0.8 0.8 0.8
B 1 1 1 1 1
C 1.2 1.2 1.1 1 1
D 1.6 1.4 1.2 1.1 1
E 2.5 1.7 1.2 0.9 0.9
F a a a a a
Note:
a Site-specific geotechnical investigation and dynamic site response analyses must be performed.
Table 3.6. Values of Fv as a Function of Site Class and Mapped One Second Period Spectral Acceleration
[MCEER/ATC, 2002].
Site Class Mapped Spectral Response Acceleration at Short Periods
S1 ≤ 0.1 g S1 = 0.2 g S1 = 0.3 g S1 = 0.4 g S1 ≥ 0.5 g
A 0.8 0.8 0.8 0.8 0.8
B 1 1 1 1 1
C 1.7 1.6 1.5 1.4 1.3
D 2.4 2 1.8 1.6 1.5
E 3.5 3.2 2.8 2.4 2.4
F a a a a a
Note:
a Site-specific geotechnical investigation and dynamic site response analyses must be performed.
This bridge is located in Midlothian, a southern suburb of Richmond. The zip
code for Midlothian is 23113, which was input into the USGS website zip code lookup
for spectral accelerations. For this bridge, the following values were obtained:
Ss = 0.287 g
S1 = 0.0833 g
[“USGS”, 2002]
Since the soil is class B, Fa = 1.0 and Fv = 1.0

30
SDS = FaSs = (1.0)(0.287 g) = 0.287 g
SD1 = FvS1 = (1.0)(0.0833 g) = 0.0833 g
The values of FvS1 and FaSs were used to determine the Seismic Hazard Level
according to Table 3.7 of this report, which was taken from Table 3.7-1 of the new LRFD
Guidelines. When two different Seismic Hazard Levels are required by the values of FvS1
and FaSs, the higher level controls. Therefore Seismic Hazard Level II was assigned to
this bridge.
Table 3.7. Seismic Hazard Levels [MCEER/ATC, 2002].
Seismic Hazard Level Value of FvS1 Value of FaSs
I FvS1 ≤ 0.15 FaSs ≤ 0.15
II 0.15 < FvS1 ≤ 0.25 0.15 < FaSs ≤ 0.35
III 0.25 < FvS1 ≤ 0.40 0.35 < FaSs ≤ 0.60
IV 0.40 < FvS1 0.60 < FaSs
The Seismic Hazard Level was used to determine the required Seismic Design
and Analysis Procedure (SDAP) and Seismic Design Requirement (SDR) by using Table
3.8 of this report, which was taken from Table 3.7-2 of the new LRFD Guidelines.
Table 3.8. Seismic Design and Analysis Procedures (SDAP) and Seismic Design Requirements (SDR)
[MCEER/ATC, 2002].
Seismic Life Safety Operational
Hazard Level SDAP SDR SDAP SDR
I A1 1 A2 2
II A2 2 C/D/E 3
III B/C/D/E 3 C/D/E 5
IV C/D/E 4 C/D/E 6
Since Seismic Hazard Level II was assigned to this bridge and the operational
performance objective was chosen, SDAP C, D or E could be required for this bridge.
But according to section 4.4.2 of the new LRFD Guidelines, SDAP C couldn’t be used
for this bridge because this bridge had fewer than three spans. Thus SDAP D was

31
required for this bridge. The required Seismic Design Requirement (SDR) for this bridge
was SDR 3 according to Table 3.8 of this report. In the next step, the cracked section
properties of the columns and pier cap beam had to be determined because SDAP D uses
an elastic (cracked section properties) analysis.
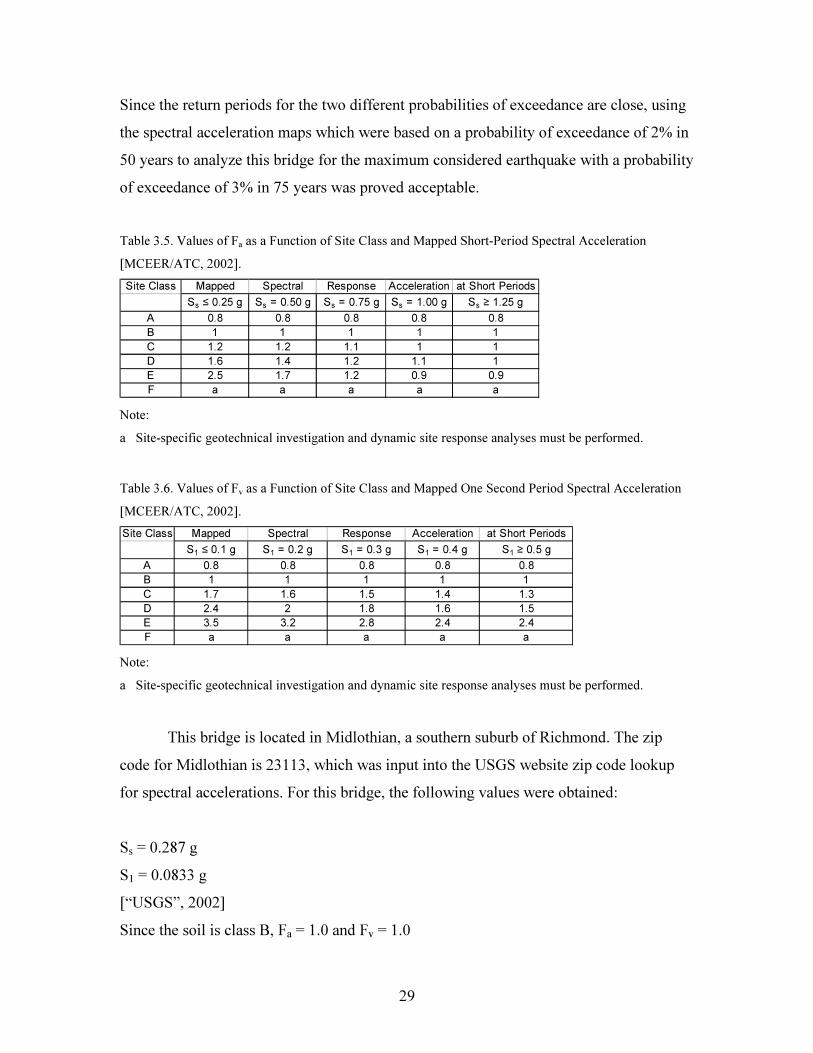
3.10. Cracked Section Properties of the Columns
The combined axial loads from the dead and live loads were used to obtain the
cracked section properties of the columns, i.e. the effective moment of inertia about the
x-axis (Iexx) and the effective moment of inertia about the y-axis (Ieyy). The relationship
between the total axial load P (computed in section 3.8) on the column and its effective
moment of inertia (Ie) is described in Figure 3.12. Thus, with a known reinforcement ratio
Ast/Ag, the effective moment of inertia Ie can be calculated by way of P/fc’Ag and Ie/Ig
[Priestley and others, 1996]. For this bridge, Ie/Ig was approximately 0.466. The
spreadsheet for this calculation is also presented in Appendix IV.
32
Figure 3.12. The relationship between axial load P on the column and its effective moment of inertia Ie
[Priestley and others, 1996]. Reprinted by permission of John Wiley & Sons, Inc.