singapore property weekly issue 176
DESCRIPTION
In this issue:- Why I’ve Not Lost Money in 13 Years –Understanding the Time Value of Money and IRR- Singapore Property News This Week- Resale Property Transactions (September 17 – September 23)TRANSCRIPT


ContributeDo you have articles and insights and articles that you’d like to share with thousands of readers interested in the Singapore property market? Send them to us at [email protected], and if they’re good enough, we’ll publish them here, on our blog and even on Yahoo! News.
AdvertiseWant to get your brand, product, service or property listing out to thousands of Singapore property investors at a very reasonable cost? Head over to www.propwise.sg/advertise/ to find out more.
CONTENTS
p2 Why I’ve Not Lost Money in 13 Years –
Understanding the Time Value of
Money and IRR
p9 Singapore Property News This Week
p16 Resale Property Transactions
(September 17 – September 23 )
Welcome to the 176th edition of the Singapore Property Weekly.
Hope you like it!
Mr. Propwise
FROM THE
EDITOR
SINGAPORE PROPERTY WEEKLY Issue 176
Page | 2Back to Contents
By Gerald Tay (guest contributor)
This post requires a basic understanding of
using a financial calculator. Explaining how to
use it is beyond the scope of this post as I
don‘t want to turn it into a bed-time lullaby if
you‘re one of those who has never touched a
financial (not scientific) calculator. It‘s
impossible to learn math by reading!
Rather, I‘ll try to explain in layman terms so
you can grasp the basics of what Internal
Rate of Return (IRR) and Time Value of
Money are, respectively, as well as why they
are essential for property investment.
Why I‘ve Not Lost Money in 13 Years –Understanding the
Time Value of Money and IRR
SINGAPORE PROPERTY WEEKLY Issue 176
Page | 3Back to Contents
Tip: Cash flows are worth more today than
they are tomorrow.
One reason why I’ve not lost money in 13
years
The Internal Rate of Return (IRR) is arguably
the most holistic measure of an investment
property‘s return potential. That said, many
investors fail to utilize this key metric, or
underestimate its utility in measuring value.
But don‘t feel relatively uninformed if you
don‘t. I took courses in Financial Analysis and
Investment in the mid-2000s. The Time Value
of Money and Internal Rate of Return (IRR)
was one of the topics covered.
I flunked my Math!
I‘ve always been a B/C Math student in
school. I received a ‗C‘ grade for ‗Additional
Mathematics‘ for my ‗O‘ levels. At 17, I
dropped out of Engineering School because I
flunked each of my Engineering Math
subjects (I prefer to write and speak rather
than fix things up anyway).
My point is – you would have been a better
math student than me. You don‘t need to be a
Math genius to understand what I‘m going to
tell you. All you need is to understand basic
principles and how to input a few numbers
into a financial calculator - and voila!
Internal Rate of Return (IRR) is an extremely
powerful valuation metric for property
investment, and have been successfully
applying it for a while. But few of those who
use the Internal Rate of Return (IRR) in the
real estate industry know how to use it as a
powerful valuation tool. A property investor
can be a real estate professional but a real
estate professional may not be a real
investor.
SINGAPORE PROPERTY WEEKLY Issue 176
Page | 4Back to Contents
In this post I will address the following:
1. Internal Rate of Return (IRR)
2. Net Present Value (NPV)
3. Modified Internal Rate of Return (MIRR)
Internal Rate of Return (IRR)
The Internal Rate of Return is the interest
rate that brings the Net Present Value of all
future cash flow to zero.
Here‘s a hypothetical example:
For every $100 you lend to a friend, he‘ll
repay you $10 per year – forever and ever!
How much do you get every year in
percentage terms? $10 divided by$100
equals10%.
This 10% is called the Rate of Return.
But be careful; this is NOT yet the Internal
Rate of Return.
This 10% rate of return tells you how quickly
you get your money back in exactly 1 year –
compared to your original $100.
It was very easy to find the rate of return of
10%.
Now….
What if your friend pays you back a different
amount every year? In some years, he pays
$20, in other years he might pay only $5. And
in some years he doesn‘t pay! And what if it‘s
not forever? What if it‘s exactly 7 years?
The rate of return is now ‗hidden‘, and is
called the Internal Rate of Return (IRR)
In layman terms: The Internal Rate of Return
is a good way of judging an investment. The
bigger the better!
SINGAPORE PROPERTY WEEKLY Issue 176
Page | 5Back to Contents
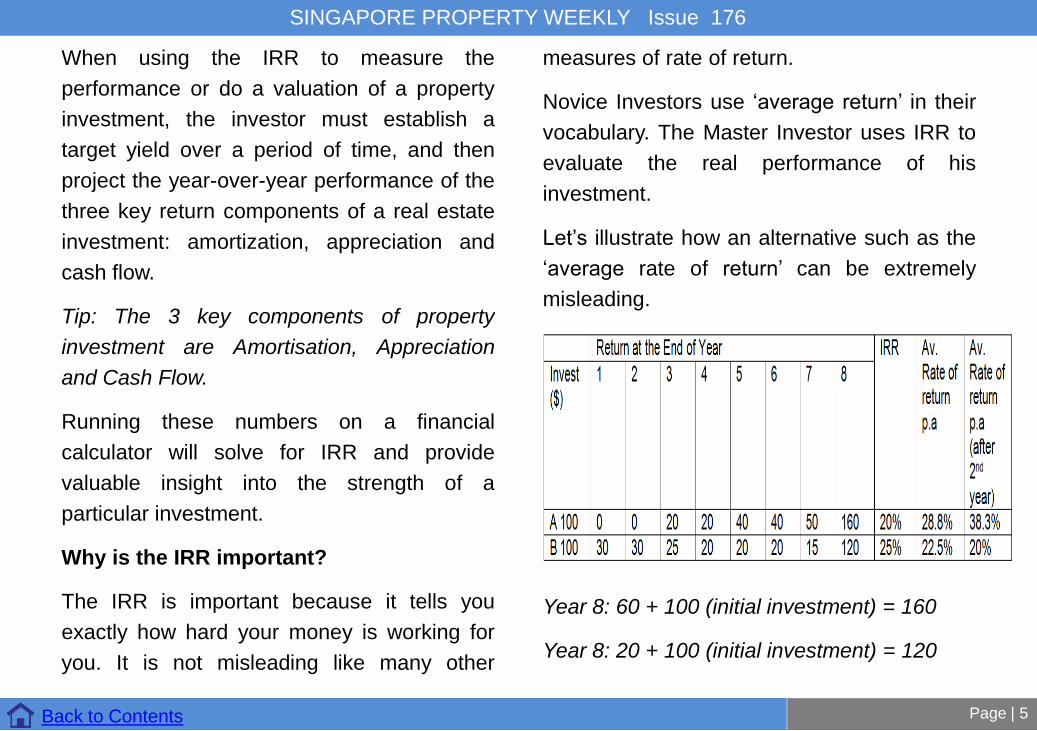
When using the IRR to measure the
performance or do a valuation of a property
investment, the investor must establish a
target yield over a period of time, and then
project the year-over-year performance of the
three key return components of a real estate
investment: amortization, appreciation and
cash flow.
Tip: The 3 key components of property
investment are Amortisation, Appreciation
and Cash Flow.
Running these numbers on a financial
calculator will solve for IRR and provide
valuable insight into the strength of a
particular investment.
Why is the IRR important?
The IRR is important because it tells you
exactly how hard your money is working for
you. It is not misleading like many other
measures of rate of return.
Novice Investors use ‗average return‘ in their
vocabulary. The Master Investor uses IRR to
evaluate the real performance of his
investment.
Let‘s illustrate how an alternative such as the
‗average rate of return‘ can be extremely
misleading.
Year 8: 60 + 100 (initial investment) = 160
Year 8: 20 + 100 (initial investment) = 120
SINGAPORE PROPERTY WEEKLY Issue 176
Page | 6Back to Contents
In Investment A, the average rate of return
p.a. over the investment period is 28.8% i.e.
(0+0+20+20+40 +40+50+60)/8.
But in Investment B, it is only 22.5%. Yet, the
Internal Rate of Return (IRR) is higher in
investment B than in A (25% versus 20%).
Funds invested are working harder in
investment B. The reason is that the bulk of
returns are received earlier.
Even more misleading is when sales
prospectuses report an average rate of return
for only part of an investment‘s life. In
investment A, some prospectuses might state
the average rate of return p.a. after the
second year is 38.3%
(20+20+40+40+50+60)/6)! This is a way of
excluding the zero cash flows from years 1
and 2 in an attempt to improve the
appearance of returns.
In an extreme example, the rate of return in
some timber plantation investments is very
high in year 25 when trees are harvested. But
there is no income in the first 24 years! An
IRR is essential to get a real perspective on
the rate of return.
Tip: In real estate investment, returns in the
early years are more important than returns in
the later years.
Be wary of published rates of returns
So, beware of investments which show high
rates of return in the later years and publish
these figures (and not IRRs) in sales
prospectuses. Always use the IRR for the
most accurate indication of returns.
The Losing Investor will say, ―I‘m still making
money in investment A even though the IRR
is lower. So why should I care about IRR?‖
SINGAPORE PROPERTY WEEKLY Issue 176
Page | 7Back to Contents
That‘s why the Losing Investor makes
‗mediocre‘ returns, while The Master Investor
makes ‗extraordinary‘ returns. The difference
here is about first having the right ‗mentality‘
to make money, and not the other way round!
This is one reason why I repeatedly
mentioned how buying off-plan properties as
investments (uncompleted/new launch) can
be an expensive gamble. The first 3 to 4
years have zero cash flows. After construction
is completed, the performance of the property
is highly questionable as too many optimistic
assumptions from the time of purchase
seldom materialise eventually.
If we measure our IRR from buying a re-sale
property instead, we‘ll easily find that our
returns are a better (or safer) bet than that of
a new property.
Tip: The IRR will tell you exactly how hard
your money is working for you, irrespective of
the pattern of income distribution over time.
No other measure of return will do this.
Concluding Comments
The IRR has been a popular metric for
evaluating investments for many years —
primarily due to the simplicity with which it
can be interpreted. However, the IRR suffers
from a couple of flaws.
The most important flaw is that it implicitly
assumes that the cash flows will be
reinvested for the life of the investment at a
rate that equals the IRR. A good project may
have an IRR that is considerably greater than
any reasonable reinvestment assumption.
Therefore, the IRR can be misleading at
times.
SINGAPORE PROPERTY WEEKLY Issue 176
Page | 8Back to Contents
The Modified Rate of Return (MIRR) and Net
Present Value (NPV)solves this problem by
using an explicit reinvestment rate (i.e. bank
deposits). We will cover these in a future
article.
By guest contributor Gerald Tay, who is the
founder and coach at CREI Academy Group
Pte Ltd, an organization dedicated to
empowering retail property investors with
smarter investing philosophy and strategies.
He is a full-time investor with over 13 years of
solid experience in building his wealth
through Property Investment and is financially
wealthy today.
SINGAPORE PROPERTY WEEKLY Issue 176
Singapore Property This Week
Page | 9Back to Contents
Residential
400 applications made for Woodlands EC
Bellewoods, which is the first executive
condominium launched this year has drew
400 applications. The condominium which is
located in Woodlands comprises of 561 units
and is expected to be sold for between $750
and $820 per square foot. Buyers would not
need to pay HDB resale levy when they
purchase a unit at Bellewoods as it is one of
the last executive condominiums in the
northern area of Singapore to be privatised.
Since January 2013, developers are required
to put their executive condominium projects
up for sale after only 15 months from the date
of award of the site. This has
moderateddevelopers‘ bids for executive
condominium sites in the Government Land
Sales programme.
(Source: Business Times)
Private residential market and HDB resale
market softens in Q3
Market experts believe that the weak holding
power of private home owners and
developers has pushed prices of private
homes and HDB resale flats down in Q3
2014. Flash estimates by the Urban
Redevelopment Authority (URA) showed that
the overall Private Residential Property Price
Index (PRPPI) has fell 0.6 per cent in Q3 this
year. This follows a 1 per cent fall in the
PRPPI in Q2 this year.
SINGAPORE PROPERTY WEEKLY Issue 176
Page | 10Back to Contents
Over the last four quarters, prices of private
homes have fallen by 3.8 per cent. On the
other hand, resale HDB prices have also
fallen due to the implementation of the
mortgage servicing ratio. Not only so, the
increase in supply of build-to-order flats has
reduced demand for resale flats. Flash
estimates from HDB showed that resale price
index has slipped by 1.6 per cent in Q3, while
resale prices have dropped by 6.8 per cent in
Q3 2014 from Q3 2013. Ong Teck Hui from
JLL does not expect the private home market
to rebound soon. URA flash estimates also
showed that prices of landed properties have
fallen 1.7 per cent in Q3. Ong believes this is
because the total debt servicing ratio has
reduced the demand for landed properties.
Eugene Lim from ERA Realty also added that
the gradual fall in prices is an effect of the
government‘s cooling measures.
(Source: Business Times)
Condo prices in August remains flat
According to flash estimates by the National
University of Singapore, resale prices of
completed private apartments and condos
have been flat in August. From July to August,
prices for the overall market and the central
region, including the financial district and
Sentosa Cove, have remained unchanged.
Yet, small apartments in the non- central
regions have increased by 0.1 per cent in
August. LumSau Kim said that the low
turnover is likely to be due to fewer
successful transactions. This is because
sellers have not adjusted their asking prices
to meet buyers‘ expectations.
SINGAPORE PROPERTY WEEKLY Issue 176
Page | 11Back to Contents
Not only so, only 318 condo units were
transacted in August. This is a fall from the
376 units that changed hands in July.
Nicholas Mak from SLP International believes
that the Hungry Ghost month has slowed
sales in August. Mak added that there were
no launched private residential projects in
August, and as such, condo sales have been
flat.
(Source: Business Times)
Sembawang EC site sold for $353 psfppr
A Sembawang executive condominium site
has been sold for $353 per square feet per
plot ratio, which is marginally higher than the
$350 psfppr that an adjacent site had fetched
in January this year. The bid was won by
Qingjian Realty. Despite the high price, the
tender had only attracted two bids. The low
participation in the tender reflects the
developers‘ sentiments in the executive
condominium market. Ong Kah Seng from
R‘ST Research believes that Qingjian Realty
may have offered a high bid price as it
believes that the government will soon lift
cooling measures on the executive
condominium market. Currently, executive
condominiums can only be released 15
months from the date of award of the site.
Also, there is a mortgage service ratio cap
that impacted residential property demand.
Nicholas Mak from SLP International predicts
that Qingjian Realty‘s breakeven cost is as
high as $740 per square foot.
(Source: Business Times)
Marina One to be launched on Oct 11 2014
M+S Pte Ltd will only be launching 150 to 200
units at the expected launch of Marina One
Residences.
SINGAPORE PROPERTY WEEKLY Issue 176
Page | 12Back to Contents
The released units are part of the first
residential block. The second residential
block, which has about 521 units, will be
released after the project‘s temporary
occupation permit has been issued. Market
experts believe this will help moderate the
supply of residential units. The mixed-used
project, which comprises 1,042 units in total,
is expected to be released on October 11.
Prices of the residential units will range from
$1,960 to $3,100 per square foot. One-
bedroom units start from 700 square feet and
are priced at $1.4 million while a two-
bedroom unit is about 1,001 square feet and
is selling for about $2 million. On the other
hand, a three-bedder is going for $3.46
million. Since the project does not come
under the qualifying certificate rules, the
developer will not be required to sell all its
units within two years of its completion.
Kemmy Tan from M+S expects the property
to fetch a rental yield of 2 to 3 per cent due to
its prime location.
(Source: Business Times)
Lake Life launches before 15-month sale-
launch rule is up
To moderate the market, developers can only
launch their executive condominium projects
15 months after the date of award of the site,
or after the completion of foundation works,
whichever is earlier. The Lake Life executive
condominium is likely to be the first executive
condominium that will be launched before the
stipulated 15 months as it is slated to be
released for sale on October 4. Vincent Ong
from Evia Real Estate said that developers
have been able to complete foundation works
within the first eight months. The Lake Life
executive condominium consists of two-
bedroom units of about 969 square feet,
SINGAPORE PROPERTY WEEKLY Issue 176
Page | 13Back to Contents
three-bedroom units from 1,033 square feet
and four-bedroom units from 1,195 square
feet. The units are expected to be priced
between $880 and $890 per square foot.
Commercial
Havelock II well received among buyers
Since its soft launch in July, about 70 per cent
of the 50 units at Havelock II have been sold
by Guthrie GTS. The 50 units sold in
Havelock II made up half of the 100 office and
retail units released by Guthrie to revamp HR
buildings acquired earlier in March 2013. Of
the 245 units in that project, 151 are retail
units and the remaining are office spaces.
Michael Leong from Guthrie said that the total
debt servicing ratio framework has slowed
sales. Office units, ranging from 312 square
feet to 2,357 square feet have been sold for
an average price of $2,228 per square feet.
On the other hand, retail units from 150
square feet to 1,335 square feet have been
sold for an average of $4,657 per square feet.
All retail units are provided with water points
and discharge outlets. Selected units will also
be provided with independent air-conditioning
systems. Last year, Guthrie had paid $282.88
million to acquire the eight-storey building.
(Source: Business Times)
DTZ: 1m sqft office space to be available
in 2015
According to DTZ, about one million square
feet of office space will be available in 2015
when current tenants move out of existing
buildings to new offices. Not only so, there
will be another 133,000 square feet of
shadow spaces released next year. This will
add on to the current 550,000 square feet of
shadow office space.
SINGAPORE PROPERTY WEEKLY Issue 176
Page | 14Back to Contents
These spaces are made available for
subletting or reassignment by tenants. Thus,
there will be a net increase of 159,000 square
feet in office supply in 2015, said DTZ. While
office rents have been projected to grow by
15 per cent by the end of this year, Lee Lay
Keng from DTZ believes that rental growth in
the CBD area will increase by a slower rate in
2015. The average gross monthly rental for
offices in Raffles Place has increased 2.7 per
cent to $10.55 per square foot from Q2 to Q3
this year. Not only so, DTZ said that
occupancy rates were higher in Q3 across the
island. This is because no new office space
was released in that quarter. Occupancy rates
have rose by 0.8 percent to 95.8 percent in
Q3 2014.
(Source: Business Times)
Tuas and Tampines industrial site on sale
Two sites at Tuas South and one at Tampines
North have been put on sale. All three sites
have been zoned for Business-2
development. The site at Tampines is 2.7 ha.
It is the largest site that has been launched in
H2 2014, under the industrial government
land sales confirmed list. It has a gross plot
ratio of 2.5 and has a lease of 30 years.
Nicholas Mak from SLP International predicts
that there will be four to seven bids for the
Tampines site. Also, he expects the top bid to
be around $70 to $82 per square foot per plot
ratio. On the other hand, Ong Kah Seng from
R‘ST Research said that the winning bid
would be around $90 to $105 per square foot
per plot ratio. Market experts expect the Tuas
site to attract lower bid prices.

SINGAPORE PROPERTY WEEKLY Issue 176
Page | 15Back to Contents
The site at Tuas South Street 9, which has a
20 year 8 month lease and a gross plot ratio
of 1.0, is expected to draw bids as high as
$65 per square foot per plot ratio, said Mak.
The other site at Tuas South Street 6 will be
released under the reserved list. It also has a
gross plot ratio of 1.0. However it has a 20
year and 4 month lease. Analysts believe that
that site will be sold for about $60 to $75 per
square foot per plot ratio.
(Source: Business Times)
SINGAPORE PROPERTY WEEKLY Issue 176
Page | 16Back to Contents
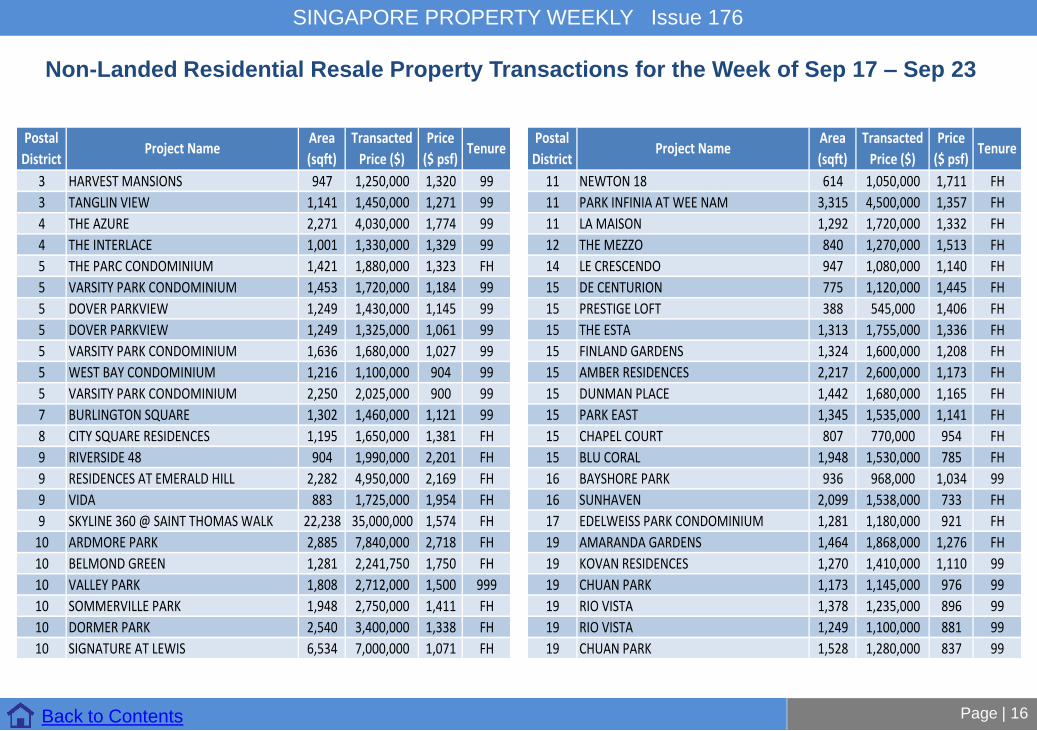
Non-Landed Residential Resale Property Transactions for the Week of Sep 17 – Sep 23
Postal
DistrictProject Name
Area
(sqft)
Transacted
Price ($)
Price
($ psf)Tenure
3 HARVEST MANSIONS 947 1,250,000 1,320 99
3 TANGLIN VIEW 1,141 1,450,000 1,271 99
4 THE AZURE 2,271 4,030,000 1,774 99
4 THE INTERLACE 1,001 1,330,000 1,329 99
5 THE PARC CONDOMINIUM 1,421 1,880,000 1,323 FH
5 VARSITY PARK CONDOMINIUM 1,453 1,720,000 1,184 99
5 DOVER PARKVIEW 1,249 1,430,000 1,145 99
5 DOVER PARKVIEW 1,249 1,325,000 1,061 99
5 VARSITY PARK CONDOMINIUM 1,636 1,680,000 1,027 99
5 WEST BAY CONDOMINIUM 1,216 1,100,000 904 99
5 VARSITY PARK CONDOMINIUM 2,250 2,025,000 900 99
7 BURLINGTON SQUARE 1,302 1,460,000 1,121 99
8 CITY SQUARE RESIDENCES 1,195 1,650,000 1,381 FH
9 RIVERSIDE 48 904 1,990,000 2,201 FH
9 RESIDENCES AT EMERALD HILL 2,282 4,950,000 2,169 FH
9 VIDA 883 1,725,000 1,954 FH
9 SKYLINE 360 @ SAINT THOMAS WALK 22,238 35,000,000 1,574 FH
10 ARDMORE PARK 2,885 7,840,000 2,718 FH
10 BELMOND GREEN 1,281 2,241,750 1,750 FH
10 VALLEY PARK 1,808 2,712,000 1,500 999
10 SOMMERVILLE PARK 1,948 2,750,000 1,411 FH
10 DORMER PARK 2,540 3,400,000 1,338 FH
10 SIGNATURE AT LEWIS 6,534 7,000,000 1,071 FH
Postal
DistrictProject Name
Area
(sqft)
Transacted
Price ($)
Price
($ psf)Tenure
11 NEWTON 18 614 1,050,000 1,711 FH
11 PARK INFINIA AT WEE NAM 3,315 4,500,000 1,357 FH
11 LA MAISON 1,292 1,720,000 1,332 FH
12 THE MEZZO 840 1,270,000 1,513 FH
14 LE CRESCENDO 947 1,080,000 1,140 FH
15 DE CENTURION 775 1,120,000 1,445 FH
15 PRESTIGE LOFT 388 545,000 1,406 FH
15 THE ESTA 1,313 1,755,000 1,336 FH
15 FINLAND GARDENS 1,324 1,600,000 1,208 FH
15 AMBER RESIDENCES 2,217 2,600,000 1,173 FH
15 DUNMAN PLACE 1,442 1,680,000 1,165 FH
15 PARK EAST 1,345 1,535,000 1,141 FH
15 CHAPEL COURT 807 770,000 954 FH
15 BLU CORAL 1,948 1,530,000 785 FH
16 BAYSHORE PARK 936 968,000 1,034 99
16 SUNHAVEN 2,099 1,538,000 733 FH
17 EDELWEISS PARK CONDOMINIUM 1,281 1,180,000 921 FH
19 AMARANDA GARDENS 1,464 1,868,000 1,276 FH
19 KOVAN RESIDENCES 1,270 1,410,000 1,110 99
19 CHUAN PARK 1,173 1,145,000 976 99
19 RIO VISTA 1,378 1,235,000 896 99
19 RIO VISTA 1,249 1,100,000 881 99
19 CHUAN PARK 1,528 1,280,000 837 99
SINGAPORE PROPERTY WEEKLY Issue 176
Page | 17Back to Contents
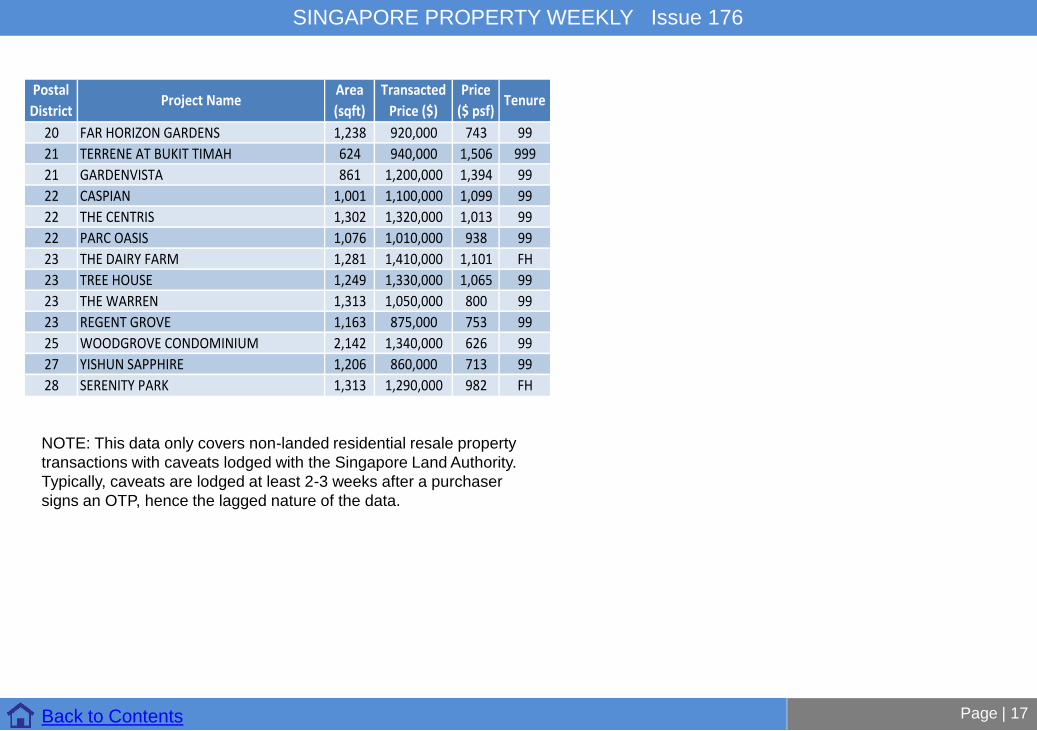
NOTE: This data only covers non-landed residential resale property
transactions with caveats lodged with the Singapore Land Authority.
Typically, caveats are lodged at least 2-3 weeks after a purchaser
signs an OTP, hence the lagged nature of the data.
Postal
DistrictProject Name
Area
(sqft)
Transacted
Price ($)
Price
($ psf)Tenure
20 FAR HORIZON GARDENS 1,238 920,000 743 99
21 TERRENE AT BUKIT TIMAH 624 940,000 1,506 999
21 GARDENVISTA 861 1,200,000 1,394 99
22 CASPIAN 1,001 1,100,000 1,099 99
22 THE CENTRIS 1,302 1,320,000 1,013 99
22 PARC OASIS 1,076 1,010,000 938 99
23 THE DAIRY FARM 1,281 1,410,000 1,101 FH
23 TREE HOUSE 1,249 1,330,000 1,065 99
23 THE WARREN 1,313 1,050,000 800 99
23 REGENT GROVE 1,163 875,000 753 99
25 WOODGROVE CONDOMINIUM 2,142 1,340,000 626 99
27 YISHUN SAPPHIRE 1,206 860,000 713 99
28 SERENITY PARK 1,313 1,290,000 982 FH