singer’s annuity and funds report · singer’s annuity and funds report october/november 2008 /2...
TRANSCRIPT

Singer’s Annuity and Funds Report October/November 2008 / 1
October/November 2008Volume 14, No. 5 Internet: http://www.singerpubs.com
Key tables in this issue
Investment income p. 3Bank News p. 5Annuities (banks) p. 6Securities brokerage p. 7Annuities (BHCs) p. 12Inv. income by region p. 18Insurance by region p. 21Insurance brokerage p. 24
Median Investment Income Gained In the 2nd Quarter
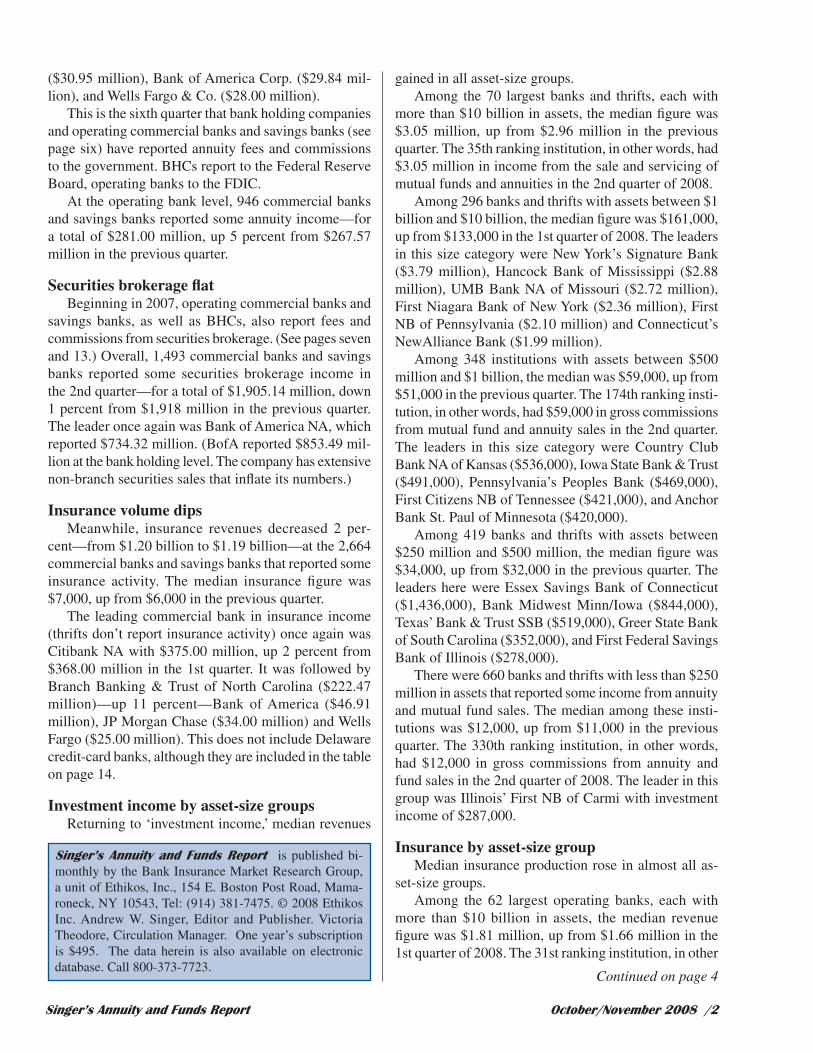
The median fi gure at 1,793 banks and thrifts that reported some investment income was $38,000, up 15 percent from $33,000 in the 1st quarter.
Median income from the sale and servicing of mutual funds and annuities (‘invest-
ment income’) gained in all asset-size groups in the second quarter—as did the overall median.
The median fi gure at 1,793 banks and thrifts that reported some investment income was $38,000, up 15 percent from $33,000 in the 1st quarter. Industry volume, on the other hand, was $1,442 million, virtually unchanged from $1,443 million in the previ-ous quarter.
Bank of America (NC) again was the leading program among operating banks and thrifts with $487.42 million in investment income, up 3 percent from $475.08 million in the 1st quarter. It was followed by Wachovia Bank (NC) ($146.00 million), Wells Fargo Bank of South Dakota ($94.00 million), Ohio’s US Bank ($51.56 million), and PNC Bank NA (PA) ($46.04 million). These fi gures come from analysis of FDIC call reports. (See page 15.)
Wachovia still tops in annuities, but fees commissions fallOnce again, Wachovia Corporation earned more commissions from annuity sales
than any U.S. bank holding company (BHC)—by a wide margin. The North Carolina bank reported $170.00 million in fees and commission from annuity sales, down from $194.00 million in the 1st quarter. (See the table on page 12 for the top 50 bank holding companies.)
Wachovia was followed by JPMorgan Chase & Co. ($97.00 million), Suntrust Banks
Singer’s Annuity and Funds Report
Median Bank Investment Income and Insurance Income: Four Recent Quarters
$34,000 $34,000 $33,000
$38,000
$7,000 $7,000 $6,000 $7,000
$0
$5,000
$10,000
$15,000
$20,000
$25,000
$30,000
$35,000
$40,000
3rd qtr. '07 4th qtr. '07 1st qtr. '08 2nd qtr. '08
Median investmentincome per bank
Median insuranceincome
Singer’s Annuity and Funds Report October/November 2008 /2
Singer’s Annuity and Funds Report is published bi-monthly by the Bank Insurance Market Research Group, a unit of Ethikos, Inc., 154 E. Boston Post Road, Mama-roneck, NY 10543, Tel: (914) 381-7475. © 2008 Ethikos Inc. Andrew W. Singer, Editor and Publisher. Victoria Theodore, Circulation Manager. One year’s subscription is $495. The data herein is also available on electronic database. Call 800-373-7723.
Continued on page 4
($30.95 million), Bank of America Corp. ($29.84 mil-lion), and Wells Fargo & Co. ($28.00 million).
This is the sixth quarter that bank holding companies and operating commercial banks and savings banks (see page six) have reported annuity fees and commissions to the government. BHCs report to the Federal Reserve Board, operating banks to the FDIC.
At the operating bank level, 946 commercial banks and savings banks reported some annuity income—for a total of $281.00 million, up 5 percent from $267.57 million in the previous quarter.
Securities brokerage fl atBeginning in 2007, operating commercial banks and
savings banks, as well as BHCs, also report fees and commissions from securities brokerage. (See pages seven and 13.) Overall, 1,493 commercial banks and savings banks reported some securities brokerage income in the 2nd quarter—for a total of $1,905.14 million, down 1 percent from $1,918 million in the previous quarter. The leader once again was Bank of America NA, which reported $734.32 million. (BofA reported $853.49 mil-lion at the bank holding level. The company has extensive non-branch securities sales that infl ate its numbers.)
Insurance volume dipsMeanwhile, insurance revenues decreased 2 per-
cent—from $1.20 billion to $1.19 billion—at the 2,664 commercial banks and savings banks that reported some insurance activity. The median insurance fi gure was $7,000, up from $6,000 in the previous quarter.
The leading commercial bank in insurance income (thrifts don’t report insurance activity) once again was Citibank NA with $375.00 million, up 2 percent from $368.00 million in the 1st quarter. It was followed by Branch Banking & Trust of North Carolina ($222.47 million)—up 11 percent—Bank of America ($46.91 million), JP Morgan Chase ($34.00 million) and Wells Fargo ($25.00 million). This does not include Delaware credit-card banks, although they are included in the table on page 14.
Investment income by asset-size groupsReturning to ‘investment income,’ median revenues
gained in all asset-size groups. Among the 70 largest banks and thrifts, each with
more than $10 billion in assets, the median fi gure was $3.05 million, up from $2.96 million in the previous quarter. The 35th ranking institution, in other words, had $3.05 million in income from the sale and servicing of mutual funds and annuities in the 2nd quarter of 2008.
Among 296 banks and thrifts with assets between $1 billion and $10 billion, the median fi gure was $161,000, up from $133,000 in the 1st quarter of 2008. The leaders in this size category were New York’s Signature Bank ($3.79 million), Hancock Bank of Mississippi ($2.88 million), UMB Bank NA of Missouri ($2.72 million), First Niagara Bank of New York ($2.36 million), First NB of Pennsylvania ($2.10 million) and Connecticut’s NewAlliance Bank ($1.99 million).
Among 348 institutions with assets between $500 million and $1 billion, the median was $59,000, up from $51,000 in the previous quarter. The 174th ranking insti-tution, in other words, had $59,000 in gross commissions from mutual fund and annuity sales in the 2nd quarter. The leaders in this size category were Country Club Bank NA of Kansas ($536,000), Iowa State Bank & Trust ($491,000), Pennsylvania’s Peoples Bank ($469,000), First Citizens NB of Tennessee ($421,000), and Anchor Bank St. Paul of Minnesota ($420,000).
Among 419 banks and thrifts with assets between $250 million and $500 million, the median fi gure was $34,000, up from $32,000 in the previous quarter. The leaders here were Essex Savings Bank of Connecticut ($1,436,000), Bank Midwest Minn/Iowa ($844,000), Texas’ Bank & Trust SSB ($519,000), Greer State Bank of South Carolina ($352,000), and First Federal Savings Bank of Illinois ($278,000).
There were 660 banks and thrifts with less than $250 million in assets that reported some income from annuity and mutual fund sales. The median among these insti-tutions was $12,000, up from $11,000 in the previous quarter. The 330th ranking institution, in other words, had $12,000 in gross commissions from annuity and fund sales in the 2nd quarter of 2008. The leader in this group was Illinois’ First NB of Carmi with investment income of $287,000.
Insurance by asset-size group Median insurance production rose in almost all as-
set-size groups.Among the 62 largest operating banks, each with
more than $10 billion in assets, the median revenue fi gure was $1.81 million, up from $1.66 million in the 1st quarter of 2008. The 31st ranking institution, in other

Singer’s Annuity and Funds Report October/November 2008 / 3
Income from Annuity and Mutual Fund Sales2nd Quarter 2008: Top 50 Bank Holding Companies
(Dollars in Millions)
“Inv. Income,” or investment income, is “income from the sale and servicing of mutual funds and annuities” as reported to the Federal Reserve Board in the 2nd quarter of 2008. DBP is deposit-base penetration, i.e., investment income/deposits. Deposits are interest-bear-ing, domestic deposits only. 553 bank holding companies reported some investment income in the quarter. See page 15 for operating banks and thrifts.
# Inv. Income Bank Holding Company State Assets Deposits DBP MF,
previous Change
1 $726.0 Wachovia Corp. NC $812,433 $355,675 0.20% $773.00 -6%2 $491.0 JPMorgan Chase & Co. NY $1,775,670 $362,150 0.14% $508.00 -3%3 $477.5 Bank of America Corp. NC $1,723,270 $496,551 0.10% $485.04 -2%4 $409.0 Citigroup Inc. NY $2,100,385 $210,719 0.19% $404.00 1%5 $349.0 Wells Fargo & Company CA $609,074 $208,502 0.17% $354.00 -1%6 $295.0 Bank of New York Mellon NY $201,344 $22,852 1.29% $291.00 1%7 $100.0 U.S. Bancorp MN $246,538 $92,844 0.11% $96.00 4%8 $51.7 National City Corp. OH $153,679 $79,842 0.06% $53.38 -3%9 $46.6 Suntrust Banks, Inc. GA $177,233 $92,856 0.05% $48.89 -5%
10 $46.5 Regions Financial Corp. AL $144,438 $67,655 0.07% $46.44 0%11 $35.5 PNC Financial Services Group PA $142,791 $61,626 0.06% $54.60 -35%12 $34.2 Keycorp OH $101,958 $50,303 0.07% $29.23 17%13 $34.2 Fifth Third Bancorp OH $114,975 $58,100 0.06% $33.72 1%14 $24.2 HSBC North America Holdings IL $461,156 $70,120 0.03% $23.27 4%15 $19.7 BB&T Corp. NC $136,465 $72,216 0.03% $18.93 4%16 $19.6 Citizens Financial Group RI $161,970 $87,500 0.02% $18.76 4%17 $16.6 M&T Bank Corp. NY $65,893 $27,685 0.06% $14.91 12%18 $15.2 City National Corp. CA $16,345 $10,855 0.14% $13.73 10%19 $14.5 Compass Bancshares, Inc. AL $61,101 $28,239 0.05% $16.57 -12%20 $14.5 Capital One Financial. VA $151,114 $78,039 0.02% $10.51 38%21 $13.7 Huntington Bancshares OH $55,310 $35,870 0.04% $13.43 2%22 $13.6 Bancwest Corp. HI $76,300 $31,995 0.04% $12.19 12%23 $9.8 Marshall & Ilsley Corp. WI $64,271 $31,355 0.03% $8.85 11%24 $8.8 First Horizon National Corp. TN $35,551 $10,633 0.08% $8.39 5%25 $7.2 TD Banknorth Inc. ME $116,845 $67,261 0.01% $3.74 93%26 $6.8 Unionbancal Corp. CA $60,594 $27,298 0.02% $5.69 20%27 $6.0 Comerica Inc. TX $66,174 $29,405 0.02% $5.99 0%28 $4.8 Colonial Bancgroup, Inc. AL $26,031 $17,089 0.03% $4.55 5%29 $4.5 Bank of Hawaii Corp. HI $10,371 $6,999 0.06% $4.64 -3%30 $4.2 First Citizens Bancshares NC $16,423 $11,780 0.04% $3.92 7%31 $3.9 Associated Banc-Corp WI $22,304 $10,777 0.04% $3.97 -2%32 $3.9 Zions Bancorporation UT $54,838 $24,278 0.02% $4.34 -10%33 $3.8 Harris Bankcorp, Inc. IL $44,435 $22,315 0.02% $3.93 -4%34 $3.8 Synovus Financial Corp. GA $34,227 $21,927 0.02% $3.03 24%35 $3.3 New York Community Bancorp NY $31,107 $12,125 0.03% $2.76 21%36 $3.1 FirstMerit Corp. OH $10,568 $6,686 0.05% $2.43 26%37 $3.0 TCF Financial Corp. MN $16,514 $7,777 0.04% $3.21 -7%38 $2.9 Hancock Holding Company MS $6,320 $4,127 0.07% $2.81 2%39 $2.8 Citizens Republic Bancorp MI $13,179 $7,491 0.04% $2.77 2%40 $2.7 Fulton Financial Corp. PA $16,058 $8,149 0.03% $3.03 -11%41 $2.4 Commerce Bancshares, Inc. MO $17,034 $11,137 0.02% $2.58 -6%42 $2.4 Cullen/Frost Bankers, Inc. TX $13,808 $6,823 0.04% $2.20 9%43 $2.4 Wesbanco, Inc. WV $5,271 $3,129 0.08% $1.11 116%44 $2.2 UMB Financial Corp. MO $8,807 $5,319 0.04% $2.09 3%45 $2.1 F.N.B. Corp. PA $8,096 $4,978 0.04% $1.52 38%46 $2.1 Bancorpsouth, Inc. MS $13,405 $8,062 0.03% $1.89 8%47 $2.0 Washington Trust Bancorp RI $2,734 $1,422 0.14% $2.06 -2%48 $2.0 NewAlliance Bancshares, Inc. CT $8,263 $3,830 0.05% $2.38 -16%49 $2.0 West Bancorporation, Inc. IA $1,369 $747 0.26% $1.94 1%50 $1.9 Bremer Financial Corp. MN $7,689 $4,299 0.04% $1.76 9%

Singer’s Annuity and Funds Report October/November 2008 /4
Income from Annuities and Mutual Funds: 2nd Quarter 2008
1st column is ‘income from the sale and servicing of mutual funds and annuities.’
words, reported $1.812 million in insurance revenues in the quarter. (Revenues here include both brokerage and underwriting revenues.)
Among the 258 banks with assets between $1 bil-lion and $10 billion, the median was $48,000, up from $39,000 in the previous quarter. The leader in this group was Massachusetts’ Eastern Bank ($12.52 million), fol-lowed by Wells Fargo Financial Bank of South Dakota ($9.07 million), Trustmark National Bank of Mississippi ($8.39 million), and National Penn Bank of Pennsylvania
($3.98 million).Among 288 banks with assets between $500 million
and $1 billion, the median was $16,000, the same as the previous quarter. The 144th ranking institution—the middle-ranking bank—had $16,000 in insurance rev-enues in the quarter. The leaders in this size category were New York’s Adirondack Trust Co. ($2,561,000), Oneida Savings Bank of New York ($2,006,000), Bank First National of Wisconsin ($1,852,000), Choice Finan-cial Group of North Dakota ($1,632,000) and Maine’s
Mutual Funds & Annuities Under Management in Bank Holding Companies: 2008 2nd Quarter (dollars in millions)
Inv.Income
# of banks
Median ($mm)
Change(Median)
Regions share 1st. Qtr. Change Top Institution
in region Top Bank
($mm)
Northeast $89 186 $0.065 -15% 6% $82 9% RBS Citizens NA (RI) $18.95 West $105 129 $0.059 30% 6% $92 14% Washington Mutual (CA) $45.74 South $752 336 $0.048 3% 51% $740 2% Bank of America (NC) $487.42
Midwest $356 879 $0.026 -4% 29% $424 -16% Wells Fargo Bank NA (SD) $94.00 Midatlantic $109 113 $0.070 -13% 5% $74 47% PNC Bank (PA) $46.04 Southwest $31 150 $0.032 8% 2% $31 -1% Guaranty Bank (TX) $7.75
Thrifts $149 289 $0.057 -8% 7% $98 51% Washington Mutual (CA) $45.74 Banks $1,293 1,504 $0.034 19% 93% $1,344 -4% Bank of America (NC) $487.42
All $1,442 1,793 $0.038 15% 100% $1,443 0%
Fund Assets under mgt. Bank Holding Company State Bank Assets Domestic
DepositsTrust Rev-enues YTD
1 $641,731 JPMorgan Chase & Co. NY $1,775,670 $362,150 $4,011.0 2 $555,787 MetLife, Inc. NY $555,787 $4,842 $0.0 3 $344,604 Bank of New York Mellon NY $201,344 $22,852 $4,059.0 4 $276,229 Bank of America Corp. NC $1,723,270 $496,551 $878.2 5 $151,306 Wells Fargo & Company CA $609,074 $208,502 $554.0 6 $120,893 Citigroup Inc. NY $2,100,385 $210,719 $830.0 7 $107,100 Wachovia Corp. NC $812,433 $355,675 $456.0 8 $90,848 U.S. Bancorp MN $246,538 $92,844 $555.0 9 $81,986 Northern Trust Corp. IL $74,807 $10,407 $1,171.9
10 $38,083 Suntrust Banks, Inc. GA $177,233 $92,856 $318.4 11 $36,839 State Street Corp. MA $146,517 $9,670 $2,821.3 12 $33,647 HSBC North America IL $461,156 $70,120 $71.7 13 $19,650 National City Corp. OH $153,679 $79,842 $126.1 14 $14,997 Keycorp OH $101,958 $50,303 $129.4 15 $13,101 Fifth Third Bancorp OH $114,975 $58,100 $90.7 16 $10,914 M&T Bank Corp. NY $65,893 $27,685 $48.1 17 $10,142 Marshall & Ilsley Corp. WI $64,271 $31,355 $123.1 18 $8,806 Wilmington Trust Corp. DE $12,318 $7,567 $155.5 19 $8,789 Bessemer Group, Inc., The NJ $1,455 $878 $148.0 20 $8,422 Unionbancal Corp. CA $60,594 $27,298 $51.7 21 $7,331 City National Corp. CA $16,345 $10,855 $76.3 22 $6,346 UMB Financial Corp. MO $8,807 $5,318.55 $64.4 23 $5,864 BB&T Corp. NC $136,465 $72,216 $78.4 24 $4,389 Bank of Hawaii Corp. HI $10,371 $6,999 $30.6 25 $4,382 PNC Financial Services PA $142,791.49 $61,625.87 $217.1

Singer’s Annuity and Funds Report October/November 2008 / 5
Wealth Management Revenues at Bank Holding Companies: 2nd Quarter 2008(All dollars in millions)
Wealth management revenues (1st column) represesent the sum of three categories: mutual fund and annuity income (4th column), which is defi ned as “income from the sale and servicing of mutual funds and annuities”; insurance brokerage income (5th column); and trust revenues (6th column), which is defi ned as income “from services rendered by the trust departments…acting in any fi duciary capacity.” Deposits (7th column) are domestic, interest-bearing deposits only. The last column is the fi rst column divided by deposits, an attempt to gauge deposit-base penetration. Data is from the Fed’s Consolidated Financial Statements for Bank Holding Companies (FR Y-9C). Among 785 bank holding companies.
Northeast Bank ($1,410,000).Among 451 banks with assets between $250 million
and $500 million, the median was $9,000, up from $8,000 the previous quarter. The leader in this size category was Iowa’s Soy Capital B&TC ($1,709,000), followed by Hoosac Bank of Massachusetts ($1,418,000) and Bank Forward of North Dakota ($1,071,000).
1,605 banks with less than $250 million in assets reported some insurance revenues—more than twice the number that reported some investment income. The median among these banks was $5,000, up from $4,000 in the previous quarter. The leading bank was Iowa’s First State Bank with $1,017,000.
Bank Brokerage and Insurance News
New Wealth Management Chief at Whitney NBWhitney National Bank (New Orleans) announced in
late October the hiring of Mark Duthu as Executive Vice President, Wealth Management.
Duthu will oversee the expansion of Whitney’s Trust, Brokerage and Investment Management resources, and its integration within Private Banking. He will report to Robert C. Baird Jr., Executive Vice President of Bank-ing Services.
Most recently, Duthu was the Regional Managing Director of Wachovia’s Trust offi ces in Alabama and Texas. Prior to Wachovia, he was the Executive Vice President of SouthTrust Bank’s Trust division, and a Senior Vice President with Bank One’s Trust and Invest-ments division.
Whitney National is a subsidiary of Whitney Hold-ing Corporation. The company reported $12.97 million in trust revenues in 2007, 70th among bank holding companies according to Who’s Who in Bank Wealth Management (2007 Edition).
Continued on page 8
Wealth Management
Revenues Bank Holding Company State
Mut. Fund & Annuity
Income
Insurance Brokerage
Income
Trust Income
Domestic Bank
deposits
Wealth Mgmt. Inc./
deposits 1 $2,548.0 JPMorgan Chase & Co. NY $491.0 $18.0 $2,039.0 $362,150 0.70%2 $2,426.7 MetLife, Inc. NY $927.6 $1,499.1 $0.0 $4,842 50.12%3 $2,340.0 Bank of New York Mellon NY $295.0 $0.0 $2,045.0 $22,852 10.24%4 $1,460.3 State Street Corp. MA $20.0 $0.0 $1,440.3 $9,670 15.10%5 $1,377.0 Franklin Resources, Inc. CA $1,344.8 $0.0 $32.2 $410 336.05%6 $1,306.0 Citigroup Inc. NY $409.0 $468.0 $429.0 $210,719 0.62%7 $1,119.0 Wells Fargo & Company CA $349.0 $488.0 $282.0 $208,502 0.54%8 $999.0 Wachovia Corp. NC $726.0 $53.0 $220.0 $355,675 0.28%9 $975.6 Bank of America Corp. NC $477.5 $63.9 $434.2 $496,551 0.20%
10 $652.7 Northern Trust Corp. IL $7.6 $0.0 $645.1 $10,407 6.27%11 $391.0 U.S. Bancorp MN $100.0 $7.0 $284.0 $92,844 0.42%12 $277.3 BB&T Corp. NC $19.7 $219.1 $38.5 $72,216 0.38%13 $208.4 Suntrust Banks, Inc. GA $46.6 $4.5 $157.3 $92,856 0.22%14 $144.3 PNC Financial Services PA $35.5 $1.0 $107.8 $61,626 0.23%15 $130.9 Regions Financial Corp. AL $46.5 $25.9 $58.5 $67,655 0.19%16 $125.5 National City Corp. OH $51.7 $10.3 $63.5 $79,842 0.16%17 $101.5 Keycorp OH $34.2 $1.8 $65.4 $50,303 0.20%18 $90.3 HSBC North America IL $24.2 $29.0 $37.2 $70,120 0.13%19 $89.6 Wilmington Trust Corp. DE $8.5 $0.2 $80.9 $7,567 1.18%20 $84.4 Fifth Third Bancorp OH $34.2 $5.5 $44.7 $58,100 0.15%21 $74.2 Bessemer Group, Inc. NJ $0.0 $0.0 $74.2 $878 8.45%22 $72.8 Marshall & Ilsley Corp. WI $9.8 $0.4 $62.6 $31,355 0.23%23 $65.1 Huntington Bancshares OH $13.7 $18.3 $33.1 $35,870 0.18%24 $58.3 Comerica Inc. TX $6.0 $2.5 $49.9 $29,405 0.20%25 $52.3 City National Corp. CA $15.2 $0.0 $37.1 $10,855 0.48%

Singer’s Annuity and Funds Report October/November 2008 /6
Annuity Commissions and Fees at Operating Commercial Banks2008 2nd Quarter (dollars in millions)
“Fees and commissions from annuity sales” as reported to the FDIC. Overall, 946 commercial banks and savings banks reported some annuity income—for a total of $281.80, up from $267.57 million in the previous quarter. There are some notable omissions from this list. Wachovia, JPMorgan Chase, Wells Fargo, and U.S. Bank NA are absent, among others. See page 12 (bank holding companies) where some of these larger institutions are represented.
Annuity fees Bank State Assets Deposits Previous
Quarter Change
1 $34.12 Bank of America NA NC $1,327,429 $642,252 $30.31 13%2 $17.23 KeyBank NA OH $98,048 $61,024 $12.88 34%3 $16.00 Citibank NA NV $1,228,445 $218,866 $24.00 -33%4 $15.16 National City Bank OH $151,165 $97,765 $13.23 15%5 $13.98 PNC Bank NA PA $128,348 $76,832 $11.95 17%6 $11.91 Branch Banking &Trust NC $132,884 $85,652 $11.54 3%7 $11.33 Fifth Third Bank OH $67,273 $32,669 $10.97 3%8 $10.94 Manufacturers & Traders NY $65,080 $35,975 $9.33 17%9 $10.49 RBS Citizens NA RI $132,051 $71,203 $9.37 12%
10 $10.33 Compass Bank AL $61,067 $36,499 $12.37 -16%11 $9.83 Bank of the West CA $63,262 $34,925 $8.71 13%12 $7.22 Regions Bank AL $139,354 $86,226 $6.05 19%13 $4.97 Union Bank of Calif. CA $60,228 $40,793 $3.85 29%14 $4.65 First Tennessee Bank TN $35,287 $15,261 $4.13 13%15 $4.15 First-Citizens B&TC NC $13,540 $11,066 $3.87 7%16 $3.58 LaSalle Bank NA IL $68,379 $29,595 $4.28 -16%17 $3.02 First Hawaiian Bank HI $13,027 $8,346 $2.72 11%18 $2.82 TD Bank NA DE $98,855 $73,236 $0.80 252%19 $2.64 New York Community Bank NY $29,007 $11,968 $2.05 29%20 $2.61 Associated Bank NA WI $22,059 $13,409 $2.80 -7%21 $2.59 Bank of Hawaii HI $10,348 $7,195 $2.26 15%22 $2.40 Bancorpsouth Bank MS $13,395 $9,732 $2.29 5%23 $2.22 TCF NB MN $16,469 $10,172 $2.27 -2%24 $2.19 FirstMerit Bank NA OH $10,550 $7,295 $2.12 3%25 $2.11 Webster Bank NA CT $17,352 $12,168 $4.00 -47%26 $2.07 Colonial Bank AL $25,987 $18,019 $2.28 -9%27 $1.92 Citizens Bank MI $12,372 $8,610 $1.34 43%28 $1.77 Hancock Bank MS $3,500 $2,779 $1.75 1%29 $1.59 Comerica Bank TX $65,961 $41,358 $1.28 24%30 $1.46 Fulton Financial Advisors PA $47 $0 $1.69 -13%31 $1.33 Susquehanna Bank PA PA $6,805 $4,470 $1.16 15%32 $1.32 IberiaBank LA $3,680 $2,795 $1.01 31%33 $1.30 First National Trust Company PA $21 $0 $0.85 53%34 $1.30 First NB of Pennsylvania PA $7,905 $5,887 $0.85 53%35 $1.28 National Penn Bank PA $9,028 $5,923 $0.97 32%36 $1.28 National Penn Inv Trust PA $10 $0 $0.97 32%37 $1.19 First Citizens B&T Co. SC $6,182 $5,199 $0.95 25%38 $1.12 NewAlliance Bank CT $8,249 $4,478 $1.65 -32%39 $1.00 Frost NB TX $13,797 $10,758 $0.95 6%40 $1.00 Wachovia Bank NA NC $670,639 $397,759 $2.00 -50%41 $0.95 Commerce Bank NA MO $15,592 $11,493 $1.22 -22%42 $0.95 Fulton Bank PA $8,566 $4,462 $0.90 5%43 $0.88 Old NB IN $7,453 $5,404 $1.14 -23%44 $0.87 Provident Bank of Maryland MD $6,166 $4,362 $0.67 30%45 $0.86 United Bank WV $4,167 $2,811 $0.71 20%46 $0.83 Apple Bank for Saving NY $7,761 $6,338 $0.60 39%47 $0.81 First Commonwealth Bank PA $6,197 $4,328 $0.47 75%48 $0.79 Wilmington Trust Co. DE $10,646 $7,784 $0.23 239%49 $0.72 Trustmark NB MS $9,181 $6,913 $0.75 -4%50 $0.72 Int’l Bank of Commerce TX $9,363 $6,061 $0.81 -12%

Singer’s Annuity and Funds Report October/November 2008 / 7
Securities Brokerage Fees and Commissions at Commercial Banks2008 2nd Quarter (dollars in millions)
Fees and commissions from securities brokerage as reported to the FDIC. Overall, 1,493 commercial banks and savings banks reported some securities brokerage income in the 2nd quarter—for a total of $1,905, down from $1,918 million in the previous quarter. See page 13 for bank holding companies.
Securities Brokerage Bank State Assets Deposits Previous
Quarter Change
1 $734.32 Bank of America NA NC $1,327,429 $642,252 $693.34 6%2 $451.00 JPMorgan Chase Bank OH $1,378,468 $461,008 $517.00 -13%3 $165.00 Wachovia Bank NA NC $670,639 $397,759 $162.00 2%4 $94.00 Wells Fargo Bank NA SD $503,327 $276,306 $96.00 -2%5 $42.00 Citibank NA NV $1,228,445 $218,866 $46.00 -9%6 $36.51 Mellon Bank NA PA $39,476 $9,044 $27.90 31%7 $22.94 PNC Bank NA PA $128,348 $76,832 $23.70 -3%8 $12.34 Fifth Third Bank OH $67,273 $32,669 $12.56 -2%9 $11.94 City NB CA $15,971 $11,923 $11.06 8%
10 $10.23 Comerica Bank TX $65,961 $41,358 $10.18 1%11 $9.91 First Tennessee Bank TN $35,287 $15,261 $14.15 -30%12 $8.47 RBS Citizens NA RI $132,051 $71,203 $9.04 -6%13 $8.03 Manufacturers & Traders NY $65,080 $35,975 $8.57 -6%14 $6.66 LaSalle Bank NA IL $68,379 $29,595 $5.89 13%15 $6.54 Branch Banking &Trust NC $132,884 $85,652 $6.14 7%16 $6.11 TD Bank NA DE $98,855 $73,236 $2.84 115%17 $5.55 Arvest Bank AR $9,895 $8,298 $5.96 -7%18 $5.55 Union Bank of Calif. CA $60,228 $40,793 $5.36 4%19 $5.52 Compass Bank AL $61,067 $36,499 $5.46 1%20 $4.73 Signature Bank NY $6,369 $4,867 $4.52 5%21 $4.65 North Shore Community B&TC IL $978 $760 $2.48 88%22 $4.39 KeyBank NA OH $98,048 $61,024 $4.25 3%23 $3.83 Commerce Bank NA MO $15,592 $11,493 $3.52 9%24 $3.18 Frost NB TX $13,797 $10,758 $3.05 4%25 $3.14 HSBC Bank USA NA DE $177,466 $82,748 $2.76 14%26 $3.11 Amegy Bank NA TX $12,136 $6,786 $3.56 -13%27 $2.67 Harris NA IL $41,592 $27,078 $2.89 -8%28 $2.65 MB Financial Bank NA IL $8,391 $6,038 $0.99 169%29 $2.40 First-Citizens B&TC NC $13,540 $11,066 $2.51 -4%30 $2.38 Bank of the West CA $63,262 $34,925 $2.35 2%31 $2.34 Carolina First Bank SC $13,938 $10,008 $1.33 77%32 $2.02 UMB Bank NA MO $7,694 $5,584 $1.98 2%33 $1.79 TIB Independent Bankersbank TX $1,812 $297 $2.31 -23%34 $1.67 Suntrust Bank GA $171,501 $114,276 $1.79 -7%35 $1.64 M&I Marshall & Ilsley Bank WI $57,686 $31,650 $1.32 24%36 $1.59 Mercantile Commercebank FL $6,036 $4,408 $1.36 16%37 $1.47 Essex Savings Bank CT $267 $188 $1.43 3%38 $1.37 Trustmark NB MS $9,181 $6,913 $1.57 -13%39 $1.28 Columbus B&TC GA $5,764 $2,815 $1.14 13%40 $1.28 Washington Trust Co. RI $2,732 $1,610 $1.24 3%41 $1.20 Pinnacle NB TN $4,099 $3,169 $1.25 -4%42 $1.19 Bac FL Bank FL $960 $592 $0.69 73%43 $1.15 United Bkr Bank MN $567 $228 $1.83 -37%44 $1.04 Bancorpsouth Bank MS $13,395 $9,732 $1.06 -2%45 $1.04 Zions First NB UT $20,195 $10,356 $0.97 8%46 $1.03 Fifth Third Bank MI $54,161 $37,390 $1.00 3%47 $1.03 Nbt Bank NA NY $5,288 $3,948 $0.83 24%48 $0.96 Hancock Bank MS $3,500 $2,779 $1.06 -9%49 $0.95 Bank of Hawaii HI $10,348 $7,195 $0.77 24%50 $0.94 First Interstate Bank MT $5,284 $4,117 $1.00 -6%

Singer’s Annuity and Funds Report October/November 2008 /8
2nd Quarter 2008 Leaders in Annuity and Mutual Fund Income at Smaller Institutions
Top Ten in income at 419 Institutions with assets between $250 million and $500 million in the 2nd quarter 2008
(all dollars in millions)
Top Ten in income at 348 Institutions with assets between $500 million and $1 billion in the 2nd Qtr. 2008 (dollars in millions)
Note: Thrifts are in italics. 1st column is ‘income from the sale and servicing of mutual funds and annuities.’ Last column is investment income/deposits.
Leaders in income at 660 Institutions with Assets less than $250 million in the 2nd Quarter 2008
(all dollars in millions)
***
Wachovia Insurance Is Part of Wells Fargo Deal
Wells Fargo’s acquisition of Wachovia Corp., approved by the Federal Reserve Board, will include Wachovia’s insurance brokerage, according to Insur-ance & Financial Advisor.
Vince Scanlon, a spokes-man for Wachovia Insurance Services, told the publication in mid October that the pending transaction includes that arm of the company, A.G. Edwards, its brokerage, and its Evergreen mutual-fund family.
“It is too early to tell [what that means in terms of chang-es],” Scanlon said. “The deal is not expected to close until the end of the fourth quarter, so we’ll look at things after that.”
Wells Fargo and Citigroup had been competing to buy Wachovia, but on October 9, Citigroup announced it dropped out of talks. Wachovia Insurance Services was not to be included in the Citigroup deal.
***
Five Banks That Stemmed The Insurance Tide
Despite a difficult year for bank insurers—and other insurance brokers—a number of banks experienced strong insurance growth in 2007.
Indeed, the 2008 Edition of Who’s Who in Bank Insurance reports that nine banks entered the ranks of the ‘top 100’ bank insurers in the U.S. for the fi rst time.
Most of the new entrants owe their inclusion because
# Inv. Inc. Bank State Assets Deposits DBP
1 $0.54 Country Club Bank NA KS $571.02 $419.74 0.13%2 $0.49 Iowa State B&TC IA $600.55 $456.26 0.11%3 $0.47 Peoples Bank PA $632.08 $552.89 0.08%4 $0.42 First Citizens NB TN $929.73 $695.94 0.06%5 $0.42 Anchor Bank Saint Paul MN $515.66 $399.59 0.11%6 $0.41 Gulf Coast B&TC LA $818.57 $715.05 0.06%7 $0.37 Monarch Bank VA $577.59 $464.51 0.08%8 $0.34 Citizens NB OH $503.84 $350.03 0.10%9 $0.34 Mutual Federal Savings IN $973.22 $674.39 0.05%10 $0.34 Northeast Bank ME $595.68 $364.71 0.09%
# Inv. Inc. Bank State Assets Deposits DBP
1 $1.44 Essex Savings Bank CT $266.61 $188.42 0.76%2 $0.84 Bank Midwest MN IA MN $487.53 $411.49 0.21%3 $0.52 Bank & Trust SSB TX $314.35 $245.02 0.21%4 $0.35 Greer State Bank SC $428.88 $275.46 0.13%5 $0.28 First Federal Savings IL $423.71 $339.59 0.08%6 $0.27 Jacksonville SB IL $294.86 $250.43 0.11%7 $0.24 United B&T MI $483.39 $406.42 0.06%8 $0.22 Progressive Bank LA $320.11 $241.45 0.09%9 $0.21 FNB Bank NA PA $342.37 $252.71 0.08%10 $0.21 Union National Cmnty PA $492.27 $372.53 0.06%
# Inv. Inc. Bank State Assets Deposits DBP
1 $0.29 First NB of Carmi IL $237.72 $215.49 0.13%2 $0.28 Equitable Bank NE $207.43 $126.95 0.22%3 $0.22 First NB Muskogee OK $139.12 $129.16 0.17%4 $0.21 Cmnty Bank Central WI WI $125.91 $102.42 0.20%5 $0.19 First State Bk St. Charles MO $191.15 $136.00 0.14%6 $0.19 Seneca FS & LA NY $132.74 $102.34 0.18%7 $0.17 Cmnty Bk of Parkersburg WV $222.27 $138.95 0.12%8 $0.15 First Bank of Owasso OK $198.40 $174.06 0.09%9 $0.15 Citizens State Bank IA $230.70 $177.04 0.08%10 $0.13 Perkins State Bank FL $177.29 $153.27 0.08%

Singer’s Annuity and Funds Report October/November 2008 / 9
of the acquisition of an insurance agency—as opposed to internal growth. (A soft insurance market has made organic growth a continuing challenge.) Notable among the newcomers were:
Central Community Corporation (TX), which operates First State Bank Central Texas. Its ranking rose the most dramatically of any bank company—from 157th to 31st—mainly on the strength of its investment in a large title insurance agency.
Gateway Financial Holdings (VA), which owns Gateway Bank & Trust. Its ranking rose from 118th to 84th. Its agency specializes in personal lines insurance, with a particular focus on coastal residences.
Star Financial Group, Inc. (IN), which owns Star Financial Bank. Its ranking rose from 108th to 88th. Star purchased a large independent agency in 2006.
Hanmi Financial Corporation (CA), which op-erates Hanmi Bank. Its ranking rose from 214th to 90th on the strength of two insurance agencies purchased in January 2007.
Salem Five Bancorp (MA), which operates Sa-lem Five Cents Savings. Its ranking rose from 159th to 97th. Salem acquired a commercial and personal lines insurance agency in 2006.
Inclusion in the top 100 ‘banks in insurance’ this year required $3.7 million in annual insurance brokerage rev-enues, down from $4.1 million last year and $3.8 million in the 2006 edition of Who’s Who in Bank Insurance.
The study is published annually in late November by the Bank Insurance Market Research Group. It presents detailed narrative and data for each of the 100 entrants. Sponsors of the 2008 Edition will include EAI Informa-tion Systems, Insuritas, Protective Life, Prudential, and Symetra Financial. It is distributed at no cost to members of the Bank Insurance & Securities Association. For non-members, the charge is $275.
***
TCF Throttles Back Its Annuities ProgramTCF Financial Corp. (Wayzata, MN) said that it will
eliminate some jobs because of cutbacks in the bank’s annuity business. It is no longer taking on annuity ac-counts, but will continue to service its current accounts. A TCF spokesman said the move will allow TCF to focus on its core services of deposits and loans “and just be a real bank,” Minnesota’s Star Tribune reported in October.
In the fi rst half of 2008, TCF, a bank pioneer in the sale of annuities through the retail branch system, reported $4.49 million in fees and commissions from annuities.
According to TCF’s annual report, annuity and mu-tual fund sales totaled $222.6 million in 2007, compared
•
•
•
•
•
with $203.7 million in 2006. The increase was credited to sales of mutual funds.
Sales of fi xed annuities declined slightly in 2007 as a result of lower interest rates, said the company.
***
Thain Will Head Wealth Management At Bank of America
John Thain, chairman and chief executive of Merrill Lynch & Co., will become president of global banking, securities and wealth management at Bank of America Corp. (BofA), the bank said in October.
Charlotte, N.C.-based BofA agreed to buy Merrill Lynch on September 15 for about $50 billion.
Thain’s banking responsibilities will include over-sight of BofA’s corporate and investment banks. Brian Moynihan will continue as president of global corporate and investment banking at BofA.
***
Hochstetler Named To Oversee Wealth Management At Univest
Univest Corporation (Souderton, PA) has named Kenneth D. Hochstetler senior executive vice president of the corporation responsible for overseeing the Wealth Management and Trust Group of Univest National Bank and Trust Co. Hochstetler also is president of Univest Insurance, Inc., and Univest Investments, Inc., titles he will continue to hold.
“Univest’s diversifi cation into nontraditional busi-nesses, including insurance and investments, has broad-ened the platform of fi nancial solutions we provide and has strengthened our company,” said William S. Aichele, chairman, president and chief executive offi cer of Univest Corporation and chairman of Univest National Bank and Trust Co., in September. “Ken has played an important role in the success of these subsidiaries, and I’m confi -dent his leadership will help us continue to outperform more traditional fi nancial institutions, particularly in this challenging economy.”
In 2007, Univest Corporation reported $5.92 million in trust revenues, 110th among bank holding companies, according to Who’s Who in Bank Wealth Management.
Univest National Bank and Trust Co. operates 33 fi nancial service centers and 12 retirement fi nancial services centers in Pennsylvania.
***
Trustco Bank Forms Insurance Agency Realizing that its customers, particularly those of its

Singer’s Annuity and Funds Report October/November 2008 /10
Investment Income/Assets2nd Quarter 2008: Bank Holding Companies
(Among BHCs with at least $1 billion in assets.All dollars in millions)
ABP is asset-base penetration (Investment income/total bank assets). Investment income is ‘in-come from the sale and servicing of mutual funds and annuities,’ primarily gross commissions, as reported to the Federal Reserve Board (Y-9C).
trust department, sometimes have more complex needs than the bank’s product offerings cover, TrustCo Bank (Glenview, NY) will begin offering life insurance products, the company said in late September.
The bank has formed a new subsidiary, Trustco Insur-ance Agency Inc., that will work with the Optimus Group LLC of Clifton Park to offer long-term care insurance, life insurance, disability income insurance and critical illness insurance to its customers.
Trustco Bank, a thrift in-stitution and a subsidiary of TrustCo Bank Corp. NY, has 115 branches in New York, New Jersey, Florida, Vermont and Massachusetts.
***
New Insurance Chief At Huntington
In September, Huntington Bancshares Inc. named Pete Dunlap president of its Hun-tington Insurance division.
A MetLife veteran, Dunlap was most recently senior vice president and national sales manager for the Huntington Investment Co. division. He replaces Michael Moore as head of the insurance unit, which sells consumer and commercial insurance cover-ages in Ohio, Pennsylvania, Michigan, Indiana and West Virginia.
In 2007, Huntington re-ported $37.75 million in insur-ance brokerage revenues, 20th among bank holding com-panies, according to Who’s Who in Bank Insurance (2008 Edition). Its ranking—only 46th in 2006—was buoyed
# ABP Bank Holding Company State Inv. Income Assets domestic
deposits
1 0.15% Bank of New York Mellon NY $295.00 $201,344 $22,852 2 0.14% West Bancorporation, Inc. IA $1.96 $1,369 $747 3 0.09% City National Corp. CA $15.16 $16,345 $10,855 4 0.09% Wachovia Corp. NC $726.00 $812,433 $355,675 5 0.07% Washington Trust Bancorp RI $2.03 $2,734 $1,422 6 0.06% Wells Fargo & Company CA $349.00 $609,074 $208,502 7 0.05% Hancock Holding Co. MS $2.88 $6,320 $4,127 8 0.05% Wesbanco, Inc. WV $2.39 $5,271 $3,129 9 0.04% Bank of Hawaii Corp. HI $4.50 $10,371 $6,999 10 0.04% QCR Holdings, Inc. IL $0.67 $1,584 $835 11 0.04% U.S. Bancorp MN $100.00 $246,538 $92,844 12 0.04% German American Bancorp IN $0.45 $1,175 $770 13 0.04% Longview Financial Corp. TX $0.39 $1,087 $843 14 0.03% National City Corp. OH $51.71 $153,679 $79,842 15 0.03% Midwestone Financial Grp. IA $0.52 $1,556 $993 16 0.03% Keycorp OH $34.23 $101,958 $50,303 17 0.03% Anchor Bancorp, Inc. MN $0.42 $1,277 $763 18 0.03% Regions Financial Corp. AL $46.53 $144,438 $67,655 19 0.03% Bancfi rst Corp. OK $1.23 $3,842 $2,351 20 0.03% Iberiabank Corp. LA $1.67 $5,324 $3,517 21 0.03% FVNB Corp. TX $0.43 $1,377 $944 22 0.03% Univest Corp. of PA PA $0.62 $2,013 $1,411 23 0.03% Fifth Third Bancorp OH $34.20 $114,975 $58,100 24 0.03% Bryn Mawr Bank Corp. PA $0.31 $1,049 $708 25 0.03% FirstMerit Corp. OH $3.05 $10,568 $6,686 26 0.03% Sandy Spring Bancorp MD $0.91 $3,164 $2,184 27 0.03% ANB Corp. TX $0.50 $1,758 $1,044 28 0.03% Wilson Bank Holding Co. TN $0.39 $1,389 $1,147 29 0.03% S. Y. Bancorp, Inc. KY $0.45 $1,596 $1,081 30 0.03% Capital City Bank Group FL $0.73 $2,638 $1,746 31 0.03% Bank of America Corp. NC $477.47 $1,723,270 $496,551 32 0.03% JPMorgan Chase & Co. NY $491.00 $1,775,670 $362,150 33 0.03% Citizens National Banc MS $0.31 $1,125 $747 34 0.03% Fremont Bancorporation CA $0.60 $2,230 $1,116 35 0.03% Trico Bancshares CA $0.53 $1,980 $1,164 36 0.03% Suntrust Banks, Inc. GA $46.57 $177,233 $92,856 37 0.03% Salem Five Bancorp MA $0.73 $2,775 $1,615 38 0.03% F.N.B. Corp. PA $2.10 $8,096 $4,978 39 0.03% Lakeland Financial Corp. IN $0.58 $2,250 $1,358 40 0.03% First Citizens Bancshares NC $4.21 $16,423 $11,780 41 0.03% Amcore Financial, Inc. IL $1.31 $5,176 $3,657 42 0.03% M&T Bank Corp. NY $16.64 $65,893 $27,685 43 0.03% Bremer Financial Corp. MN $1.93 $7,689 $4,299 44 0.02% Old National Bancorp IN $1.90 $7,602 $4,906 45 0.02% First Horizon National Corp. TN $8.84 $35,551 $10,633 46 0.02% PNC Financial Services PA $35.46 $142,791 $61,626 47 0.02% Sun Bancorp, Inc NJ $0.85 $3,425 $2,295 48 0.02% Huntington Bancshares OH $13.68 $55,310 $35,870 49 0.02% First Citizens Bancorp SC $1.61 $6,529 $4,528 50 0.02% UMB Financial Corp. MO $2.15 $8,807 $5,319

Singer’s Annuity and Funds Report October/November 2008 / 11
Insurance Income by Region: 2nd Quarter 2008(Dollars in millions)
Among commercial banks and savings banks that report to the FDIC. Note: Insurance revenues are the sum of two FDIC call report categories: “Insurance and reinsurance underwriting income” and “Income from other insurance activities,” i.e., brokerage income.
by Huntington’s July 2007 acquisition of Sky Financial, which owned a large insurance agency, Sky Insurance.
The insurance business reports to Daniel Benhase, senior executive vice president of Huntington’s Private Financial and Capital Markets group, who is also respon-sible for other specialized services offered by Huntington, including trust and brokerage.
Huntington has sold insurance since 1996. The $55 billion-asset bank holding company is based in Colum-bus, Ohio.
***
Soy Capital Bank Acquires Insurance Agency Soy Capital Bank & Trust announced in September
the acquisition of SBSi Semonis Insurance Group in Peoria, an insurance agency that specializes in employee benefi ts programs. SBSi Semonis becomes a division of J.L. Hubbard Insurance, a subsidiary of Soy Capital Bank & Trust.
Soy Capital is the bank subsidiary of SCB Bancorp, Inc. (Decatur, IL). It is one of the top insurance produc-ing small banks in the U.S. In 2007, it reported $6.31 million in insurance brokerage revenues, 71st among banking companies according to Who’s Who in Bank Insurance (2008 Edition). It has only $327 million in balance sheet assets.
Bill Shade, Soy Capital Bank & Trust board chairman, said, “Soy Capital is very fortunate to have partnered with SBSi Semonis, as they bring a high level of expertise in the employee benefi ts area. They will further strengthen the ability of Soy Capital Bank and J.L. Hubbard Insur-ance and Bonds to provide top quality fi nancial services in Central Illinois.”
SBSi Semonis Insurance Group, based in Peoria, will be located at 4530 N. University, Peoria, at the Soy Capital Bank & Trust location.
Insurance Revenues
# of banks
Avg. inc. per bank
Med. inc. per bank
Regions % of Tot.
Previ-ous Qtr. (Reg.)
Change Top Institution in region Inocme in top bank
Northeast $45.4 123 $0.37 0.013 4% $69.2 -1% Eastern Bank (MA) $12.52 West $397.9 116 $3.43 0.005 34% $410.6 8% Citibank NA (NV) $375.00 South $398.6 680 $0.59 0.010 34% $391.8 -1% BB&T (NC) $222.47
Midwest $186.1 1228 $0.15 0.006 16% $179.9 -5% JPMorgan Chase (OH) $34.00 Midatlantic $129.4 96 $1.35 0.015 11% $119.9 -2% TD Bank NA (DE) $16.64 Southwest $29.0 421 $0.07 0.007 2% $33.6 34% Frost NB (TX) $7.07
All $1,186.3 2,664 $0.45 0.007 100% $1,204.9 -2% Citibank NA $375.00
***
Bank of America: World’s Largest Wealth Manager?
Bank of America (BofA) is set to become the largest wealth management business in the world, overtaking Swiss bank UBS, following its takeover of Merrill Lynch, according to the UK-based Wealth Bulletin.
The publication noted in September that the deal also brings “BofA exposure to international wealth markets, [which] was a key driver for the deal. According to Chris-topher Wheeler of broking fi rm NCB: ‘It is clear that the big opportunity that Bank America saw with Merrill Lynch was in getting hold of their wealth management operations.’”
Merrill Lynch’s vice chairman Robert McCann is expected to run the combined operation.
***
Bank of America Cuts Insurance JobsBank of America eliminated about 400 jobs in its in-
surance divisions in October as it continued to integrate Countrywide Financial Corp.’s business into its opera-tions, according to the VenturaCountyStar.
After a review of Bank of America and Countrywide insurance groups, the fi eld agent model used by sub-sidiary Balboa Insurance Group was eliminated, said Rick Simon, BofA spokesman, cutting about 350 jobs in eight states.
The review determined that the production and sales of Countrywide’s automotive and commercial insurance was no longer part of long-term strategy, resulting in the loss of about 50 jobs. ❏

Singer’s Annuity and Funds Report October/November 2008 /12
Annuity Commissions and Fees at Bank Holding Companies2008 2nd Quarter (dollars in millions)
“Fees and commissions from annuity sales” as reported to the Federal Reserve Board. Overall, 361 bank holding companies reported some annuity income in the 2nd quarter 2008. The total was $651.90 million slightly down from $653.51 million in the 1st quarter. See page 6 for annuity fees at operating commercial and savings banks.
2nd Qtr. Annuity
FeesBank Holding Company State Assets Deposits
Annuity fees/
DepositsYTD
1 $170.00 Wachovia Corp. NC $812,433 $355,675 0.05% $364.002 $97.00 JPMorgan Chase & Co. NY $1,775,670 $362,150 0.03% $172.003 $30.95 Suntrust Banks, Inc. GA $177,233 $92,856 0.03% $63.544 $29.84 Bank of America Corp. NC $1,723,270 $496,551 0.01% $64.425 $28.00 Wells Fargo & Company CA $609,074 $208,502 0.01% $56.006 $25.00 U.S. Bancorp MN $246,538 $92,844 0.03% $48.007 $17.13 Keycorp OH $101,958 $50,303 0.03% $30.118 $17.11 HSBC North America IL $461,156 $70,120 0.02% $32.879 $16.00 Citigroup Inc. NY $2,100,385 $210,719 0.01% $40.00
10 $14.75 National City Corp. OH $153,679 $79,842 0.02% $27.5811 $14.12 PNC Financial Services PA $142,791 $61,626 0.02% $30.8912 $12.85 Bancwest Corp. HI $76,300 $31,995 0.04% $24.2813 $11.91 BB&T Corp. NC $136,465 $72,216 0.02% $23.4614 $11.33 Fifth Third Bancorp OH $114,975 $58,100 0.02% $22.3015 $10.94 M&T Bank Corp. NY $65,893 $27,685 0.04% $20.2716 $10.88 Huntington Bancshares OH $55,310 $35,870 0.03% $21.2217 $10.49 Citizens Financial Group RI $161,970 $87,500 0.01% $19.8618 $10.33 Compass Bancshares AL $61,101 $28,239 0.04% $22.7019 $7.22 Regions Financial Corp. AL $144,438 $67,655 0.01% $13.2720 $5.12 Silverton Financial Services GA $2,920 $427 1.20% $11.8221 $5.00 Bank of New York Mellon NY $201,344 $22,852 0.02% $10.0022 $4.97 Unionbancal Corp. CA $60,594 $27,298 0.02% $8.8123 $4.65 First Horizon National Corp. TN $35,551 $10,633 0.04% $8.7824 $4.21 First Citizens Bancshares NC $16,423 $11,780 0.04% $8.1325 $3.11 Marshall & Ilsley Corp. WI $64,271 $31,355 0.01% $5.6126 $2.65 NY Community Bancorp NY $31,107 $12,125 0.02% $4.7527 $2.61 Associated Banc-Corp WI $22,304 $10,777 0.02% $5.4128 $2.59 Bank of Hawaii Corp. HI $10,371 $6,999 0.04% $4.8429 $2.40 Bancorpsouth, Inc. MS $13,405 $8,062 0.03% $4.6930 $2.22 TCF Financial Corp. MN $16,514 $7,777 0.03% $4.4931 $2.19 FirstMerit Corp. OH $10,568 $6,686 0.03% $4.3132 $2.14 Colonial Bancgroup, Inc. AL $26,031 $17,089 0.01% $4.4533 $2.11 Webster Financial Corp. CT $17,495 $10,311 0.02% $6.1134 $2.00 Citizens Republic Bancorp MI $13,179 $7,491 0.03% $3.3835 $1.77 Hancock Holding Co. MS $6,320 $4,127 0.04% $3.5236 $1.66 Synovus Financial Corp. GA $34,227 $21,927 0.01% $2.9137 $1.59 TD Banknorth Inc. ME $116,845 $67,261 0.00% $2.3938 $1.59 Comerica Inc. TX $66,174 $29,405 0.01% $2.8739 $1.50 BOK Financial Corp. OK $22,476 $11,061 0.01% $3.1140 $1.46 Fulton Financial Corp. PA $16,058 $8,149 0.02% $3.1541 $1.33 Susquehanna Bancshares PA $13,505 $7,705 0.02% $2.4942 $1.32 Iberiabank Corp. LA $5,324 $3,517 0.04% $2.3443 $1.28 National Penn Bancshares PA $9,241 $5,286 0.02% $2.2544 $1.19 First Citizens Bancorp SC $6,529 $4,528 0.03% $2.1345 $1.12 NewAlliance Bancshares CT $8,263 $3,830 0.03% $2.7746 $1.00 Cullen/Frost Bankers, Inc. TX $13,808 $6,823 0.01% $1.9547 $0.95 Commerce Bancshares MO $17,034 $11,137 0.01% $2.1748 $0.93 First National of Nebraska NE $16,663 $10,830 0.01% $2.2949 $0.88 Old National Bancorp IN $7,602 $4,906 0.02% $2.0250 $0.87 Provident Bankshares MD $6,384 $3,604 0.02% $1.54

Singer’s Annuity and Funds Report October/November 2008 / 13
Commissions and Fees from Securities Brokerage at Bank Holding Companies2008 2nd Quarter (dollars in millions)
“Fees and commissions from securities brokerage” as reported to the Federal Reserve Board. Re deposit-base penetration, deposits are domestic, interest-bearing only. Overall, 485 bank holding companies have reported some securities brokerage income in the 2nd quarter 2008. The 2nd quarter total was $4,135.58 million. See page 7 for securities brokerage at operating banks.
2nd. Qtr.Securities Brokerage
Bank Holding Company State Assets Deposits Securities/Deposits YTD
1 $853.49 Bank of America Corp. NC $1,723,270 $496,551 0.17% $1,719.552 $730.00 JPMorgan Chase & Co. NY $1,775,670 $362,150 0.20% $1,508.003 $720.00 Wachovia Corp. NC $812,433 $355,675 0.20% $1,439.004 $505.00 Bank of New York Mellon NY $201,344 $22,852 2.21% $990.005 $368.00 Wells Fargo & Company CA $609,074 $208,502 0.18% $740.006 $154.61 Regions Financial Corp. AL $144,438 $67,655 0.23% $346.207 $64.51 BB&T Corp. NC $136,465 $72,216 0.09% $130.098 $52.88 HSBC North America IL $461,156 $70,120 0.08% $102.449 $44.54 National City Corp. OH $153,679 $79,842 0.06% $91.40
10 $42.81 Suntrust Banks, Inc. GA $177,233 $92,856 0.05% $82.5311 $42.00 Citigroup Inc. NY $2,100,385 $210,719 0.02% $88.0012 $40.80 Keycorp OH $101,958 $50,303 0.08% $74.3313 $25.02 PNC Financial Services PA $142,791 $61,626 0.04% $74.1114 $25.00 U.S. Bancorp MN $246,538 $92,844 0.03% $51.0015 $16.02 Santander Bancorp PR $8,831 $4,842 0.33% $33.7416 $13.40 Fifth Third Bancorp OH $114,975 $58,100 0.02% $26.9617 $11.90 City National Corp. CA $16,345 $10,855 0.11% $22.9218 $10.23 Comerica Inc. TX $66,174 $29,405 0.03% $20.4119 $9.91 First Horizon National Corp. TN $35,551 $10,633 0.09% $24.0620 $9.25 Marshall & Ilsley Corp. WI $64,271 $31,355 0.03% $18.2821 $9.10 Citizens Financial Group RI $161,970 $87,500 0.01% $18.4822 $8.03 M&T Bank Corp. NY $65,893 $27,685 0.03% $16.6123 $6.24 Boston Private Financial MA $7,206 $2,916 0.21% $7.4224 $6.02 Wintrust Financial Corp. IL $9,923 $7,073 0.09% $9.9825 $5.71 Synovus Financial Corp. GA $34,227 $21,927 0.03% $11.4426 $5.60 Arvest Bank Group, Inc. AR $9,922 $6,794 0.08% $11.6227 $5.52 Compass Bancshares, Inc. AL $61,101 $28,239 0.02% $10.9928 $5.20 Huntington Bancshares OH $55,310 $35,870 0.01% $10.4829 $4.55 Unionbancal Corp. CA $60,594 $27,298 0.02% $8.9530 $4.26 TD Banknorth Inc. ME $116,845 $67,261 0.01% $7.1031 $4.19 Zions Bancorporation UT $54,838 $24,278 0.02% $8.7832 $3.97 Harris Bankcorp, Inc. IL $44,435 $22,315 0.02% $8.0633 $3.92 Commerce Bancshares, Inc. MO $17,034 $11,137 0.04% $7.5134 $3.18 Cullen/Frost Bankers, Inc. TX $13,808 $6,823 0.05% $6.2235 $3.12 Bancwest Corp. HI $76,300 $31,995 0.01% $6.2736 $2.62 Colonial Bancgroup, Inc. AL $26,031 $17,089 0.02% $4.8237 $2.34 South Financial Group SC $13,979 $8,759 0.03% $3.6738 $2.33 First Citizens Bancshares NC $16,423 $11,780 0.02% $4.7939 $2.12 UMB Financial Corp. MO $8,807 $5,319 0.04% $4.2040 $2.10 F.N.B. Corp. PA $8,096 $4,978 0.04% $3.6241 $1.95 Oriental Financial Group Inc. PR $6,060 $1,432 0.14% $4.5142 $1.65 Washington Trust Bancorp RI $2,734 $1,422 0.12% $3.2843 $1.42 Central Bancompany MO $8,297 $4,789 0.03% $2.7144 $1.40 First National of Nebraska NE $16,663 $10,830 0.01% $2.7945 $1.37 Trustmark Corp. MS $9,315 $5,634 0.02% $2.9346 $1.22 Pinnacle Financial Partners TN $4,106 $2,708 0.05% $2.4947 $1.19 MB Financial, Inc IL $8,407 $5,139 0.02% $2.1748 $1.16 Umpqua Holdings Corp. OR $8,362 $5,104 0.02% $2.2349 $1.13 Bremer Financial Corp. MN $7,689 $4,299 0.03% $2.2450 $1.07 First Interstate Bancsystem MT $6,360 $3,892 0.03% $2.21

Singer’s Annuity and Funds Report October/November 2008 /14
The fi rst column represents the sum of two FDIC call report categories: “Insurance and reinsurance underwriting income” and “Income from other insurance activities,” i.e., brokerage income. Commercial banks and savings banks that report to the FDIC only are included here. Deposit-base penetration is total insurance revenues (brokerage and underwriting) divided by bank deposits.
Top 50 Operating Banks in Insurance Revenues: 2nd Quarter 2008(all dollars in millions; among 2,664 banks with some revenues)
2nd quarter insurace revenues
Bank State Assets Deposits DBP 1st quarter insurance revenues
Change
1 $375.00 Citibank NA NV $1,228,445 $218,866 0.17% $368.00 2%2 $222.47 Branch Banking &Trust NC $132,884 $85,652 0.26% $199.64 11%3 $66.37 FIA Card Svc NA DE $165,350 $4,625 1.44% $69.69 -5%4 $46.91 Bank of America NA NC $1,327,429 $642,252 0.01% $43.98 7%5 $34.00 JPMorgan Chase Bank OH $1,378,468 $461,008 0.01% $31.00 10%6 $25.00 Wells Fargo Bank NA SD $503,327 $276,306 0.01% $27.00 -7%7 $22.09 National City Bank OH $151,165 $97,765 0.02% $21.77 1%8 $21.56 BancorpSouth Bank MS $13,395 $9,732 0.22% $24.77 -13%9 $16.64 TD Bank NA DE $98,855 $73,236 0.02% $15.92 5%
10 $14.47 Suntrust Bank GA $171,501 $114,276 0.01% $17.74 -18%11 $14.20 Compass Bank AL $61,067 $36,499 0.04% $17.09 -17%12 $12.52 Eastern Bank MA $6,802 $4,586 0.27% $15.23 -18%13 $11.16 Associated Bank NA WI $22,059 $13,409 0.08% $11.33 -1%14 $10.09 First Tennessee Bank TN $35,287 $15,261 0.07% $11.22 -10%15 $9.29 HSBC Bank USA NA DE $177,466 $82,748 0.01% $8.77 6%16 $9.07 Wells Fargo Fincl Bank SD $5,988 $184 4.92% $9.83 -8%17 $8.39 Trustmark NB MS $9,181 $6,913 0.12% $8.26 2%18 $8.33 Manufacturers & Traders NY $65,080 $35,975 0.02% $9.07 -8%19 $7.37 Barclays Bank Delaware DE $7,670 $34 21.78% $7.12 4%20 $7.25 Bank of the West CA $63,262 $34,925 0.02% $9.26 -22%21 $7.07 Frost NB TX $13,797 $10,758 0.07% $11.17 -37%22 $5.95 Banco Popular NA FL $88 $0 na $4.82 23%23 $5.75 US Bank NA OH $242,308 $127,819 0.00% $6.01 -4%24 $5.51 Chase Bank USA NA DE $74,463 $35,842 0.02% $6.20 -11%25 $5.50 Discover Bank DE $30,502 $24,456 0.02% $6.02 -9%26 $5.00 Wachovia Bank NA NC $670,639 $397,759 0.00% $6.00 -17%27 $4.74 American Express Centur. UT $25,349 $6,949 0.07% $2.20 116%28 $4.66 Fifth Third Bank OH $67,273 $32,669 0.01% $4.10 14%29 $4.22 Bank of Hawaii HI $10,348 $7,195 0.06% $6.20 -32%30 $3.98 National Penn Bank PA $9,028 $5,923 0.07% $3.82 4%31 $3.54 First NB of Omaha NE $9,737 $7,390 0.05% $2.74 29%32 $3.50 Townebank VA $2,716 $1,991 0.18% $4.54 -23%33 $3.17 Hancock Bank MS $3,500 $2,779 0.11% $2.52 26%34 $3.09 R-G Premier Bank of PR PR $7,189 $4,399 0.07% $4.85 -36%35 $2.56 Adirondack Trust Co. NY $735 $644 0.40% $2.03 26%36 $2.48 Comerica Bank TX $65,961 $41,358 0.01% $2.70 -8%37 $2.39 Carolina First Bank SC $13,938 $10,008 0.02% $3.06 -22%38 $2.26 Valley NB NJ $12,966 $8,460 0.03% $3.37 -33%39 $2.23 Peoples Bank NA OH $1,897 $1,296 0.17% $2.93 -24%40 $2.01 Oneida Savings Bank NY $549 $428 0.47% $2.34 -14%41 $2.00 First-Citizens B&TC NC $13,540 $11,066 0.02% $2.61 -24%42 $1.94 First Bank MO $10,780 $8,871 0.02% $1.99 -3%43 $1.86 American NB Texas TX $1,756 $1,476 0.13% $2.77 -33%44 $1.85 Bank First National WI $739 $565 0.33% $2.50 -26%45 $1.82 Arvest Bank AR $9,895 $8,298 0.02% $1.44 26%46 $1.81 KeyBank NA OH $98,048 $61,024 0.00% $1.09 67%47 $1.72 Harleysville NB&TC PA $3,868 $2,870 0.06% $1.58 9%48 $1.71 Soy Capital B&TC IL $387 $288 0.59% $2.36 -27%49 $1.70 Capital One NA VA $108,520 $70,585 0.00% $1.46 17%50 $1.69 Benefi cial MSB PA $3,733 $2,657 0.06% $3.12 -46%

Singer’s Annuity and Funds Report October/November 2008 / 15
Top 100 Commerical Banks and Thrifts in Investment Income: 2nd Quarter 2008
(Among 1,793 institutions with some income from annuity or mutual fund sales; all dollars in millions)
‘Investment income’ is ‘income from the sale and servicing of mutual funds and annuities,’ as reported to the FDIC or OTS. This represents primarily gross commissions from annuity and fund sales, but it can include investment advisory fees if banks manage those funds. Banks are not included if most investment income derives from non-retail sources. DBP is deposit-base penetration—investment income/deposits.
Investment Income Bank State Assets Deposits DBP 1st
Quarter Change
1 $487.42 Bank of America NA NC $1,327,429 $642,252 0.08% $475.08 3%2 $146.00 Wachovia Bank NA NC $670,639 $397,759 0.04% $154.00 -5%3 $94.00 Wells Fargo Bank NA SD $503,327 $276,306 0.03% $95.00 -1%4 $51.56 US Bank NA OH $242,308 $127,819 0.04% $48.98 5%5 $46.04 PNC Bank NA PA $128,348 $76,832 0.06% $34.01 35%6 $45.74 Washington Mutual Bank NV $307,022 $181,867 0.03% $38.26 20%7 $34.33 KeyBank NA OH $98,048 $61,024 0.06% $29.14 18%8 $33.85 Fifth Third Bank OH $67,273 $32,669 0.10% $33.37 1%9 $19.72 Branch Banking &Trust NC $132,884 $85,652 0.02% $18.93 4%10 $18.95 RBS Citizens NA RI $132,051 $71,203 0.03% $18.42 3%11 $16.64 Manufacturers & Traders NY $65,080 $35,975 0.05% $14.91 12%12 $16.53 ING Bank, FSB DE $79,465 $67,993 0.02% $14.97 10%13 $15.16 City NB CA $15,971 $11,923 0.13% $13.73 10%14 $14.53 Compass Bank AL $61,067 $36,499 0.04% $16.57 -12%15 $14.51 Capital One NA VA $108,520 $70,585 0.02% $10.51 38%16 $13.08 Sovereign Bank PA $79,189 $47,432 0.03% $13.19 -1%17 $12.27 People’s United Bank CT $18,734 $14,501 0.08% $6.20 98%18 $9.83 Bank of the West CA $63,262 $34,925 0.03% $8.71 13%19 $9.69 Huntington NB OH $54,842 $37,148 0.03% $9.87 -2%20 $9.34 LaSalle Bank NA IL $68,379 $29,595 0.03% $9.95 -6%21 $8.84 First Tennessee Bank TN $35,287 $15,261 0.06% $8.39 5%22 $7.75 Guaranty Bank TX $15,937 $9,234 0.08% $8.56 -9%23 $7.22 Regions Bank AL $139,354 $86,226 0.01% $6.05 19%24 $6.82 Union Bank of Calif. CA $60,228 $40,793 0.02% $5.69 20%25 $5.45 Comerica Bank TX $65,961 $41,358 0.01% $5.40 1%26 $5.34 TD Bank NA DE $98,855 $73,236 0.01% $3.74 43%27 $4.68 Astoria FS & LA NY $21,599 $13,186 0.04% $2.93 60%28 $4.50 Bank of Hawaii HI $10,348 $7,195 0.06% $4.64 -3%29 $4.15 First-Citizens B&TC NC $13,540 $11,066 0.04% $3.87 7%30 $3.79 Signature Bank NY $6,369 $4,867 0.08% $3.73 1%31 $3.76 First Hawaiian Bank HI $13,027 $8,346 0.05% $3.47 8%32 $3.74 Countrywide Bank, FSB VA $116,384 $63,349 0.01% $3.25 15%33 $3.64 Mellon Bank NA PA $39,476 $9,044 0.04% $4.60 -21%34 $3.31 New York Community NY $29,007 $11,968 0.03% $2.68 23%35 $3.05 FirstMerit Bank NA OH $10,550 $7,295 0.04% $2.43 26%36 $2.98 TCF NB MN $16,469 $10,172 0.03% $3.21 -7%37 $2.88 Hancock Bank MS $3,500 $2,779 0.10% $2.81 2%38 $2.76 Amegy Bank NA TX $12,136 $6,786 0.04% $3.26 -15%39 $2.75 Associated Bank NA WI $22,059 $13,409 0.02% $2.96 -7%40 $2.72 UMB Bank NA MO $7,694 $5,584 0.05% $2.63 3%41 $2.67 Harris NA IL $41,592 $27,078 0.01% $2.89 -8%42 $2.60 Chevy Chase Bank, F.S.B. VA $14,914 $11,388 0.02% $2.72 -4%43 $2.43 Commerce Bank NA MO $15,592 $11,493 0.02% $2.58 -6%44 $2.41 Citizens Bank MI $12,372 $8,610 0.03% $2.31 4%45 $2.41 Frost NB TX $13,797 $10,758 0.02% $2.20 9%46 $2.36 First Niagara Bank NY $9,003 $6,156 0.04% $1.63 45%47 $2.10 First NB of Pennsylvania PA $7,905 $5,887 0.04% $1.52 38%48 $2.10 First National Trust Co. PA $21 $0 na $1.52 38%49 $2.05 Bancorpsouth Bank MS $13,395 $9,732 0.02% $1.89 8%50 $2.03 Fulton Financial Advisors PA $47 $0 na $2.39 -15%

Singer’s Annuity and Funds Report October/November 2008 /16
Top 100 Commerical Banks and Thrifts In Investment Income: 2nd Quarter 2008
(Among 1,793 institutions with some income from annuity or mutual fund sales; all dollars in millions)
‘Investment income’ is ‘income from the sale and servicing of mutual funds and annuities,’ as reported to the FDIC or OTS. This represents primarily gross commissions from annuity and fund sales, but it can include investment advisory fees if banks manage those funds. Banks are not included if most investment income derives from non-retail sources. DBP is deposit-base penetration—investment income/deposits.
Investment Income Bank State Assets Deposits DBP 1st
Quarter Change
51 $2.03 Colonial Bank AL $25,987 $18,019 0.01% $2.32 -12%52 $1.99 NewAlliance Bank CT $8,249 $4,478 0.04% $2.38 -16%53 $1.90 Old NB IN $7,453 $5,404 0.04% $2.24 -15%54 $1.68 Trustmark NB MS $9,181 $6,913 0.02% $2.11 -21%55 $1.67 IberiaBank LA $3,680 $2,795 0.06% $1.29 30%56 $1.65 M&I Marshall & Ilsley WI $57,686 $31,650 0.01% $1.38 19%57 $1.63 Carolina First Bank SC $13,938 $10,008 0.02% $1.16 40%58 $1.61 First Citizens B&T Co. SC $6,182 $5,199 0.03% $1.40 15%59 $1.58 Banco Popular No. America NY $12,871 $9,383 0.02% $1.66 -5%60 $1.54 Susquehanna Bank PA PA $6,805 $4,470 0.03% $1.39 11%61 $1.53 Washington Trust Co. RI $2,732 $1,610 0.10% $1.48 4%62 $1.44 Essex Savings Bank CT $267 $188 0.76% $1.44 0%63 $1.36 Sterling Savings Bank WA $12,216 $7,639 0.02% $1.23 11%64 $1.33 Fulton Bank PA $8,566 $4,462 0.03% $1.32 1%65 $1.32 Chittenden Trust Co. VT $3,452 $2,542 0.05% $0.65 103%66 $1.28 National Penn Bank PA $9,028 $5,923 0.02% $0.97 32%67 $1.24 First Commonwealth Bank PA $6,197 $4,328 0.03% $0.91 36%68 $1.23 Bancfi rst OK $3,823 $3,382 0.04% $1.26 -3%69 $1.19 MB Financial Bank NA IL $8,391 $6,038 0.02% $0.99 21%70 $1.15 Arvest Bank AR $9,895 $8,298 0.01% $1.18 -3%71 $1.13 United Bank WV $4,167 $2,811 0.04% $0.92 23%72 $1.11 AnchorBank WI $4,891 $3,380 0.03% $3.61 -69%73 $1.09 Wesbanco Bank WV $5,253 $3,657 0.03% $1.04 5%74 $1.06 American Savings Bank HI $5,585 $4,303 0.02% $1.10 -4%75 $1.05 Provident Bank MD $6,166 $4,362 0.02% $0.94 12%76 $1.01 First Federal Bank CA $7,179 $3,864 0.03% $0.46 121%77 $1.00 Glenmede TC NA PA $49 $0 na $0.98 3%78 $0.99 Privatebank & TC IL $5,794 $5,163 0.02% $1.00 -1%79 $0.97 Superior Bank AL $3,020 $2,194 0.04% $0.03 2747%80 $0.93 Central Pacifi c Bank HI $5,637 $3,934 0.02% $0.60 56%81 $0.91 Johnson Bank WI $5,091 $3,609 0.03% $1.16 -22%82 $0.91 Sandy Spring Bank MD $3,159 $2,298 0.04% $0.82 10%83 $0.89 First Interstate Bank MT $5,284 $4,117 0.02% $0.93 -5%84 $0.87 Bank of Oklahoma NA OK $16,092 $7,243 0.01% $0.92 -6%85 $0.85 Zions First NB UT $20,195 $10,356 0.01% $0.80 7%86 $0.85 Sun NB NJ $3,421 $2,801 0.03% $0.78 9%87 $0.84 Bank Midwest MN IA MN $488 $411 0.21% $0.73 16%88 $0.83 Pinnacle NB TN $4,099 $3,169 0.03% $0.58 42%89 $0.81 United Community Bank GA $8,258 $6,713 0.01% $1.09 -26%90 $0.79 Bank Mutual WI $3,550 $2,183 0.04% $0.60 31%91 $0.78 Whitney NB LA $10,999 $7,637 0.01% $0.62 26%92 $0.78 Community Bank NA NY $4,637 $3,301 0.02% $0.70 11%93 $0.76 TierOne Bank NE $3,233 $2,232 0.03% $0.74 3%94 $0.75 Chemical Bank MI $3,731 $2,887 0.03% $0.63 19%95 $0.74 Central Trust Bank MO $1,655 $912 0.08% $0.64 15%96 $0.73 Capital City Bank FL $2,632 $2,167 0.03% $0.47 57%97 $0.73 Salem Five Cents Savings MA $2,775 $1,754 0.04% $0.71 2%98 $0.70 BankUnited, FSB FL $14,200 $7,700 0.01% $2.62 -73%99 $0.70 Apple Bank for Saving NY $7,761 $6,338 0.01% $0.47 50%100 $0.67 Washington Trust Bank WA $3,943 $2,839 0.02% $0.52 28%

Singer’s Annuity and Funds Report October/November 2008 / 17
Top 50 Banks and Thrifts in Investment Income/Deposits: 2nd Quarter 2008(Among 366 institutions with more than $1 billion in assets; all dollars in millions)
DBP is deposit-base penetration—investment income/deposits. ‘Investment income’ is ‘income from the sale and servicing of mutual funds and annuities,’ as reported to the FDIC or OTS. This represents primarily gross commissions from annuity and fund sales, but it can include investment advisory fees if banks manage those funds. ABP is asset-base penetration: investment income/assets. Note: banks are not included if most investment income derives from non-retail sources.
# DBP Bank State Inv. Inc. Assets Deposits ABP
1 0.13% City NB CA $15.16 $15,971 $11,923 0.09%2 0.10% Fifth Third Bank OH $33.85 $67,273 $32,669 0.05%3 0.10% Hancock Bank MS $2.88 $3,500 $2,779 0.08%4 0.10% Washington Trust Co. RI $1.53 $2,732 $1,610 0.06%5 0.08% People’s United Bank CT $12.27 $18,734 $14,501 0.07%6 0.08% Guaranty Bank TX $7.75 $15,937 $9,234 0.05%7 0.08% Central Trust Bank MO $0.74 $1,655 $912 0.04%8 0.08% Signature Bank NY $3.79 $6,369 $4,867 0.06%9 0.08% Bank of America NA NC $487.42 $1,327,429 $642,252 0.04%10 0.06% Bank of Hawaii HI $4.50 $10,348 $7,195 0.04%11 0.06% PNC Bank NA PA $46.04 $128,348 $76,832 0.04%12 0.06% IberiaBank LA $1.67 $3,680 $2,795 0.05%13 0.06% First Tennessee Bank TN $8.84 $35,287 $15,261 0.03%14 0.06% KeyBank NA OH $34.33 $98,048 $61,024 0.04%15 0.05% Chittenden Trust Company VT $1.32 $3,452 $2,542 0.04%16 0.05% German American BC IN $0.45 $1,166 $928 0.04%17 0.05% UMB Bank NA MO $2.72 $7,694 $5,584 0.04%18 0.05% Manufacturers & Traders NY $16.64 $65,080 $35,975 0.03%19 0.05% First Hawaiian Bank HI $3.76 $13,027 $8,346 0.03%20 0.04% NewAlliance Bank CT $1.99 $8,249 $4,478 0.02%21 0.04% Superior Bank AL $0.97 $3,020 $2,194 0.03%22 0.04% Texas B&TC TX $0.39 $1,047 $906 0.04%23 0.04% FirstMerit Bank NA OH $3.05 $10,550 $7,295 0.03%24 0.04% Salem Five Cents Savings MA $0.73 $2,775 $1,754 0.03%25 0.04% Univest NB&TC PA $0.62 $1,995 $1,512 0.03%26 0.04% Amegy Bank NA TX $2.76 $12,136 $6,786 0.02%27 0.04% Bryn Mawr Trust Co. PA $0.31 $1,045 $757 0.03%28 0.04% US Bank NA OH $51.56 $242,308 $127,819 0.02%29 0.04% Mellon Bank NA PA $3.64 $39,476 $9,044 0.01%30 0.04% United Bank WV $1.13 $4,167 $2,811 0.03%31 0.04% Compass Bank AL $14.53 $61,067 $36,499 0.02%32 0.04% Sandy Spring Bank MD $0.91 $3,159 $2,298 0.03%33 0.04% First Niagara Bank NY $2.36 $9,003 $6,156 0.03%34 0.04% First-Citizens B&TC NC $4.15 $13,540 $11,066 0.03%35 0.04% Fremont Bank CA $0.60 $2,226 $1,604 0.03%36 0.04% Wachovia Bank NA NC $146.00 $670,639 $397,759 0.02%37 0.04% First Victoria NB TX $0.43 $1,375 $1,174 0.03%38 0.04% Bancfi rst OK $1.23 $3,823 $3,382 0.03%39 0.04% Bank Mutual WI $0.79 $3,549.50 $2,183 0.02%40 0.04% Citizens NB of Meridian MS $0.31 $1,124 $858 0.03%41 0.04% First NB of Pennsylvania PA $2.10 $7,905 $5,887 0.03%42 0.04% Astoria FS & LA NY $4.68 $21,599 $13,186 0.02%43 0.04% Stock Yards B&TC KY $0.45 $1,590 $1,264 0.03%44 0.04% Old NB IN $1.90 $7,453 $5,404 0.03%45 0.03% Tri Cty Bank CA $0.53 $1,979 $1,512 0.03%46 0.03% Susquehanna Bank PA PA $1.54 $6,805 $4,470 0.02%47 0.03% Dubuque B&TC IA $0.23 $1,035 $679 0.02%48 0.03% Wells Fargo Bank NA SD $94.00 $503,327 $276,306 0.02%49 0.03% First FS&LA of Charleston SC $0.64 $2,871 $1,878 0.02%50 0.03% TierOne Bank NE $0.76 $3,233 $2,232 0.02%

Singer’s Annuity and Funds Report October/November 2008 /18
Top 25 in Income from Annuities and Mutual Funds in the Northeast2nd Quarter 2008. All dollars in millions; among 188 banks and thrifts with some investment income.
Top 25 in Income from Annuities and Mutual Funds in the West2nd Quarter 2008. All dollars in millions; among 129 banks and thrifts with some investment income.
‘Inv. Income’ is ‘income from the sale and servicing of mutual funds and annuities.’ DBP is deposit-base penetration.
Inv. income Bank State Assets Deposits DBP 1st quarter Change
1 $18.95 RBS Citizens NA RI $132,051 $71,203 0.03% $18.42 3%2 $16.64 Manufacturers & Traders NY $65,080 $35,975 0.05% $14.91 12%3 $12.27 People’s United Bank CT $18,734 $14,501 0.08% $6.20 98%4 $4.68 Astoria FS & LA NY $21,599 $13,186 0.04% $2.93 60%5 $3.79 Signature Bank NY $6,369 $4,867 0.08% $3.73 1%6 $3.31 New York Community Bank NY $29,007 $11,968 0.03% $2.68 23%7 $2.36 First Niagara Bank NY $9,003 $6,156 0.04% $1.63 45%8 $1.99 NewAlliance Bank CT $8,249 $4,478 0.04% $2.38 -16%9 $1.58 Banco Popular No. America NY $12,871 $9,383 0.02% $1.66 -5%10 $1.53 Washington Trust Co. RI $2,732 $1,610 0.10% $1.48 4%11 $1.44 Essex Savings Bank CT $267 $188 0.76% $1.44 0%12 $1.32 Chittenden Trust Company VT $3,452 $2,542 0.05% $0.65 103%13 $0.85 Sun NB NJ $3,421 $2,801 0.03% $0.78 9%14 $0.78 Community Bank NA NY $4,637 $3,301 0.02% $0.70 11%15 $0.73 Salem Five Cents Savings MA $2,775 $1,754 0.04% $0.71 2%16 $0.70 Apple Bank for Saving NY $7,761 $6,338 0.01% $0.47 50%17 $0.55 Eastern Bank MA $6,802 $4,586 0.01% $0.31 75%18 $0.46 Bank Leumi USA NY $5,560 $2,891 0.02% $0.49 -6%19 $0.40 Camden NB ME $2,294 $1,415 0.03% $0.31 28%20 $0.40 Rockland Trust Co. MA $3,391 $2,479 0.02% $0.19 111%21 $0.39 Liberty Bank CT $2,778 $2,167 0.02% $0.52 -25%22 $0.38 OceanFirst Bank NJ $1,872 $1,328 0.03% $0.33 16%23 $0.34 Cape Cod Five Cents MA $1,748 $1,469 0.02% $0.31 9%24 $0.34 Northeast Bank ME $596 $365 0.09% $0.44 -22%25 $0.33 Lakeland Bank NJ $2,565 $1,964 0.02% $0.30 8%
Inv. income Bank State Assets Deposits DBP 1st quarter Change
1 $45.74 Washington Mutual Bank NV $307,022 $181,867 0.03% $38.26 20%2 $15.16 City NB CA $15,971 $11,923 0.13% $13.73 10%3 $9.83 Bank of the West CA $63,262 $34,925 0.03% $8.71 13%4 $6.82 Union Bank of Calif. CA $60,228 $40,793 0.02% $5.69 20%5 $4.50 Bank of Hawaii HI $10,348 $7,195 0.06% $4.64 -3%6 $3.76 First Hawaiian Bank HI $13,027 $8,346 0.05% $3.47 8%7 $1.36 Sterling Savings Bank WA $12,216 $7,639 0.02% $1.23 11%8 $1.06 American Savings Bank HI $5,585 $4,303 0.02% $1.10 -4%9 $1.01 First Federal Bank of CA CA $7,179 $3,864 0.03% $0.46 121%10 $0.93 Central Pacifi c Bank HI $5,637 $3,934 0.02% $0.60 56%11 $0.89 First Interstate Bank MT $5,284 $4,117 0.02% $0.93 -5%12 $0.85 Zions First NB UT $20,195 $10,356 0.01% $0.80 7%13 $0.67 Washington Trust Bank WA $3,943 $2,839 0.02% $0.52 28%14 $0.60 Fremont Bank CA $2,226 $1,604 0.04% $0.52 15%15 $0.55 Pacifi c Capital Bank CA $7,477 $4,655 0.01% $0.50 9%16 $0.55 Cathay Bank CA $10,797 $6,696 0.01% $0.57 -4%17 $0.53 First NB CO $2,554 $2,081 0.03% $0.53 -1%18 $0.53 Tri Cty Bank CA $1,979 $1,512 0.03% $0.42 25%19 $0.51 West Coast Bank OR $2,618 $2,082 0.02% $0.57 -11%20 $0.50 California NB CA $6,663 $4,571 0.01% $0.25 98%21 $0.48 United Cmrl Bank CA $12,852 $7,639 0.01% $0.26 87%22 $0.39 Bank of Colorado CO $1,776 $1,449 0.03% $0.35 13%23 $0.35 Frontier Bank WA $4,050 $3,304 0.01% $0.36 -1%24 $0.34 Premierwest Bank OR $1,487 $1,221 0.03% $0.27 26%25 $0.32 Bank of Stockton CA $1,775 $1,449 0.02% $0.62 -48%

Singer’s Annuity and Funds Report October/November 2008 / 19
Top 25 in Income from Annuities and Mutual Funds in the South 2nd Quarter 2008 (all dollars in millions; among 336 banks and thrifts with some investment income.)
Top 25 in Income from Annuities and Mutual Funds in the Midwest 2nd Quarter 2008 (all dollars in millions; among 877 banks and thrifts with some investment income.)
‘Inv. Income’ is ‘income from the sale and servicing of mutual funds and annuities.’ DBP is deposit-base penetration.
Inv. income Bank State Assets Deposits DBP 1st quarter Change
1 $487.42 Bank of America NA NC $1,327,429 $642,252 0.08% $475.08 3%2 $146.00 Wachovia Bank NA NC $670,639 $397,759 0.04% $154.00 -5%3 $19.72 Branch Banking &Trust NC $132,884 $85,652 0.02% $18.93 4%4 $14.53 Compass Bank AL $61,067 $36,499 0.04% $16.57 -12%5 $14.51 Capital One NA VA $108,520 $70,585 0.02% $10.51 38%6 $8.84 First Tennessee Bank TN $35,287 $15,261 0.06% $8.39 5%7 $7.22 Regions Bank AL $139,354 $86,226 0.01% $6.05 19%8 $4.15 First-Citizens B&TC NC $13,540 $11,066 0.04% $3.87 7%9 $3.74 Countrywide Bank, FSB VA $116,384 $63,349 0.01% $3.25 15%
10 $2.88 Hancock Bank MS $3,500 $2,779 0.10% $2.81 2%11 $2.60 Chevy Chase Bank VA $14,914 $11,388 0.02% $2.72 -4%12 $2.05 Bancorpsouth Bank MS $13,395 $9,732 0.02% $1.89 8%13 $2.03 Colonial Bank AL $25,987 $18,019 0.01% $2.32 -12%14 $1.68 Trustmark NB MS $9,181 $6,913 0.02% $2.11 -21%15 $1.67 IberiaBank LA $3,680 $2,795 0.06% $1.29 30%16 $1.63 Carolina First Bank SC $13,938 $10,008 0.02% $1.16 40%17 $1.61 First Citizens B&T Co. SC $6,182 $5,199 0.03% $1.40 15%18 $0.97 Superior Bank AL $3,020 $2,194 0.04% $0.03 2747%19 $0.83 Pinnacle NB TN $4,099 $3,169 0.03% $0.58 42%20 $0.81 United Community Bank GA $8,258 $6,713 0.01% $1.09 -26%21 $0.78 Whitney NB LA $10,999 $7,637 0.01% $0.62 26%22 $0.73 Capital City Bank FL $2,632 $2,167 0.03% $0.47 57%23 $0.70 BankUnited, FSB FL $14,200 $7,700 0.01% $2.62 -73%24 $0.65 Mercantile Commercebank FL $6,036 $4,408 0.01% na na25 $0.64 First FS&LA of Charleston SC $2,871 $1,878 0.03% $0.88 -27%
Inv. income Bank State Assets Deposits DBP 1st quarter Change
1 $94.00 Wells Fargo Bank NA SD $503,327 $276,306 0.03% $95.00 -1%2 $51.56 US Bank NA OH $242,308 $127,819 0.04% $48.98 5%3 $34.33 KeyBank NA OH $98,048 $61,024 0.06% $29.14 18%4 $33.85 Fifth Third Bank OH $67,273 $32,669 0.10% $33.37 1%5 $9.69 Huntington NB OH $54,842 $37,148 0.03% $9.87 -2%6 $9.34 LaSalle Bank NA IL $68,379 $29,595 0.03% $9.95 -6%7 $3.05 FirstMerit Bank NA OH $10,550 $7,295 0.04% $2.43 26%8 $2.98 TCF NB MN $16,469 $10,172 0.03% $3.21 -7%9 $2.75 Associated Bank NA WI $22,059 $13,409 0.02% $2.96 -7%10 $2.72 UMB Bank NA MO $7,694 $5,584 0.05% $2.63 3%11 $2.67 Harris NA IL $41,592 $27,078 0.01% $2.89 -8%12 $2.43 Commerce Bank NA MO $15,592 $11,493 0.02% $2.58 -6%13 $2.41 Citizens Bank MI $12,372 $8,610 0.03% $2.31 4%14 $1.90 Old NB IN $7,453 $5,404 0.04% $2.24 -15%15 $1.65 M&I Marshall & Ilsley WI $57,686 $31,650 0.01% $1.38 19%16 $1.19 MB Financial Bank NA IL $8,391 $6,038 0.02% $0.99 21%17 $1.13 United Bank WV $4,167 $2,811 0.04% $0.92 23%18 $1.11 AnchorBank WI $4,891 $3,380 0.03% $3.61 -69%19 $1.09 Wesbanco Bank WV $5,253 $3,657 0.03% $1.04 5%20 $0.99 Privatebank & TC IL $5,794 $5,163 0.02% $1.00 -1%21 $0.91 Johnson Bank WI $5,091 $3,609 0.03% $1.16 -22%22 $0.84 Bank Midwest MN IA MN $488 $411 0.21% $0.73 16%23 $0.79 Bank Mutual WI $3,550 $2,183 0.04% $0.60 31%24 $0.76 TierOne Bank NE $3,233 $2,232 0.03% $0.74 3%25 $0.75 Chemical Bank MI $3,731 $2,887 0.03% $0.63 19%

Singer’s Annuity and Funds Report October/November 2008 /20
Top 25 in Income from Annuities and Mutual Funds in the Midatlantic Region 2nd Quarter 2008 (all dollars in millions; among 112 banks and thrifts with some investment income.)
Top 25 in Income from Annuities and Mutual Funds in the Southwest 2nd Quarter 2008 (all dollars in millions; among 151 banks and thrifts with some investment income.)
‘Inv. Income’ is ‘income from the sale and servicing of mutual funds and annuities.’ DBP is deposit-base penetration.
Inv. income Bank State Assets Deposits DBP 1st quarter Change
1 $46.04 PNC Bank NA PA $128,348 $76,832 0.06% $34.01 35%2 $16.53 ING Bank, FSB DE $79,465 $67,993 0.02% $14.97 10%3 $13.08 Sovereign Bank PA $79,189 $47,432 0.03% $13.19 -1%4 $5.34 TD Bank NA DE $98,855 $73,236 0.01% $3.74 43%5 $3.64 Mellon Bank NA PA $39,476 $9,044 0.04% $4.60 -21%6 $2.10 First NB of Pennsylvania PA $7,905 $5,887 0.04% $1.52 38%7 $2.10 First National Trust Co. PA $21 $0 na $1.52 38%8 $2.03 Fulton Financial Advisors PA $47 $0 na $2.39 -15%9 $1.54 Susquehanna Bank PA PA $6,805 $4,470 0.03% $1.39 11%
10 $1.33 Fulton Bank PA $8,566 $4,462 0.03% $1.32 1%11 $1.28 National Penn Bank PA $9,028 $5,923 0.02% $0.97 32%12 $1.24 First Commonwealth Bank PA $6,197 $4,328 0.03% $0.91 36%13 $1.05 Provident Bank of MD MD $6,166 $4,362 0.02% $0.94 12%14 $1.00 Glenmede TC NA PA $49 $0 na $0.98 3%15 $0.91 Sandy Spring Bank MD $3,159 $2,298 0.04% $0.82 10%16 $0.63 Citizens Bank of PA PA $38,175 $24,052 0.00% $0.34 84%17 $0.62 Univest NB&TC PA $1,995 $1,512 0.04% $0.59 4%18 $0.56 Harleysville NB&TC PA $3,868 $2,870 0.02% $0.61 -8%19 $0.47 Peoples Bank PA $632 $553 0.08% $0.45 4%20 $0.40 Firstrust Savings Bank PA $2,555 $1,948 0.02% $0.53 -24%21 $0.34 Northwest Savings Bank PA $6,987 $5,498 0.01% $0.34 1%22 $0.31 Bryn Mawr Trust Co. PA $1,045 $757 0.04% $0.27 13%23 $0.24 Parkvale Savings Bank PA $1,849 $1,490 0.02% $0.17 36%24 $0.23 HSBC Bank USA NA DE $177,466 $82,748 0.00% $0.22 5%25 $0.21 FNB Bank NA PA $342 $253 0.08% $0.17 30%
Inv. income Bank State Assets Deposits DBP 1st quarter Change
1 $7.75 Guaranty Bank TX $15,937 $9,234 0.08% $8.56 -9%2 $5.45 Comerica Bank TX $65,961 $41,358 0.01% $5.40 1%3 $2.76 Amegy Bank NA TX $12,136 $6,786 0.04% $3.26 -15%4 $2.41 Frost NB TX $13,797 $10,758 0.02% $2.20 9%5 $1.23 Bancfi rst OK $3,823 $3,382 0.04% $1.26 -3%6 $1.15 Arvest Bank AR $9,895 $8,298 0.01% $1.18 -3%7 $0.87 Bank of Oklahoma NA OK $16,092 $7,243 0.01% $0.92 -6%8 $0.52 Bank & Trust SSB TX $314 $245 0.21% $0.50 3%9 $0.50 American NB TX TX $1,756 $1,476 0.03% $0.52 -4%
10 $0.43 First Victoria NB TX $1,375 $1,174 0.04% $0.48 -10%11 $0.39 Texas B&TC TX $1,047 $906 0.04% $0.40 -1%12 $0.32 Liberty Bank of AR AR $2,529 $1,885 0.02% $0.19 70%13 $0.30 Int’l Bank of Commerce TX $9,363 $6,061 0.00% $0.32 -6%14 $0.26 RCB Bank OK $1,189 $1,033 0.03% $0.20 30%15 $0.24 Sterling Bank TX $4,910 $3,691 0.01% $0.27 -12%16 $0.22 First NB of Fort Smith AR $819 $672 0.03% $0.11 102%17 $0.22 First NB Muskogee OK $139 $129 0.17% $0.12 89%18 $0.19 Quail Creek Bank NA OK $395 $347 0.05% $0.05 316%19 $0.19 First United B&TC OK $1,927 $1,576 0.01% $0.16 21%20 $0.18 City Bank TX $1,775 $1,250 0.01% $0.23 -19%21 $0.17 Republic Bank & Trust OK $320 $285 0.06% $0.12 39%22 $0.16 Alliance Bank TX $498 $437 0.04% $0.14 13%23 $0.15 Franklin Bank SSB TX $5,572 $3,723 0.00% $0.13 17%24 $0.15 MidFirst Bank OK $14,218 $6,157 0.00% $0.18 -17%25 $0.14 First Federal Bank AR $820 $638 0.02% $0.15 -11%

Singer’s Annuity and Funds Report October/November 2008 / 21
Top 25 Banks in Insurance Revenues in the West: 2nd Quarter 2008(all dollars in millions; among 118 banks with some revenues)
Top 25 Banks in Insurance Revenues in the Northeast: 2nd Quarter 2008(all dollars in millions; among 124 banks with some revenues)
Note: 2nd quarter revenues are the sum of insurance brokerage and insurance underwriting revenues. Commercial banks and savings banks that report to the FDIC only. DBP is deposit-base penetration: insurance revs/deposits.
2nd qtr. revs. Bank State Assets Deposits DBP 1st qtr. Change
1 $12.52 Eastern Bank MA $6,802 $4,586 0.27% $15.23 -18%2 $8.33 Manufacturers & Traders NY $65,080 $35,975 0.02% $9.07 -8%3 $2.56 Adirondack Trust Co. NY $735 $644 0.40% $2.03 26%4 $2.26 Valley NB NJ $12,966 $8,460 0.03% $3.37 -33%5 $2.01 Oneida Savings Bank NY $549 $428 0.47% $2.34 -14%6 $1.42 Hoosac Bank MA $379 $212 0.67% $1.91 -26%7 $1.41 Northeast Bank ME $596 $365 0.39% $1.99 -29%8 $1.40 Ulster Savings Bank NY $644 $510 0.27% $1.69 -18%9 $1.38 BankNewport RI $1,095 $781 0.18% $1.42 -3%
10 $1.28 Fairfi eld County Bank CT $1,545 $1,226 0.10% $2.23 -43%11 $1.03 Stoneham Savings Bank MA $430 $323 0.32% $0.88 17%12 $0.96 Salem Five Cents Savings MA $2,775 $1,754 0.05% $0.98 -2%13 $0.83 RBS Citizens NA RI $132,051 $71,203 0.00% $0.69 19%14 $0.81 Bank of Smithtown NY $1,522 $1,113 0.07% $1.05 -23%15 $0.65 Sussex Bank NJ $429 $356 0.18% $0.74 -12%16 $0.57 Kennebunk Savings Bank ME $764 $587 0.10% $0.60 -5%17 $0.56 Gorham Savings Bank ME $782 $490 0.11% $0.60 -7%18 $0.52 Citizens-Union Savings MA $644 $495 0.11% $0.56 -6%19 $0.51 Community Bank NA NY $4,637 $3,301 0.02% $0.45 13%20 $0.50 Glens Falls NB&TC NY $1,396 $1,062 0.05% $0.55 -9%21 $0.47 Emigrant Bank NY $11,474 $7,880 0.01% $0.36 32%22 $0.33 Banco Popular No. Am. NY $12,871 $9,383 0.00% $0.35 -5%23 $0.20 New York Community NY $29,007 $11,968 0.00% $0.20 1%24 $0.17 Community Bank Mass. MA $393 $294 0.06% $0.20 -19%25 $0.16 NBT Bank NA NY $5,288 $3,948 0.00% $0.06 174%
2nd qtr. revs. Bank State Assets Deposits DBP 1st qtr. Change
1 $375.00 Citibank NA NV $1,228,445 $218,866 0.17% $368.00 2%2 $7.25 Bank of the West CA $63,262 $34,925 0.02% $9.26 -22%3 $4.74 American Express Centurion UT $25,349 $6,949 0.07% $2.20 116%4 $4.22 Bank of Hawaii HI $10,348 $7,195 0.06% $6.20 -32%5 $1.29 Merrick BC UT $1,202 $979 0.13% $1.31 -1%6 $0.71 First Hawaiian Bank HI $13,027 $8,346 0.01% $0.56 26%7 $0.53 Rainier Pacifi c Savings WA $870 $469 0.11% $0.55 -4%8 $0.52 Eaglemark Savings Bank NV $33 $3 na $0.30 71%9 $0.35 Northrim Bank AK $1,040 $907 0.04% $0.31 15%
10 $0.30 Cashmere Valley Bank WA $942 $842 0.04% $0.24 26%11 $0.27 First Interstate Bank MT $5,284 $4,117 0.01% $0.32 -16%12 $0.25 First Bank AK $406 $357 0.07% $0.25 1%13 $0.24 Nevada State Bank NV $3,847 $3,190 0.01% $0.24 -2%14 $0.23 Bank of Guam GU $917 $668 0.03% $0.10 123%15 $0.20 First Western Trust Bank CO $289 $183 0.11% $0.19 2%16 $0.19 Hanmi Bank CA $3,839 $2,963 0.01% $0.15 27%17 $0.13 Bank of Stockton CA $1,775 $1,449 0.01% $0.15 -9%18 $0.12 Homestreet Bank WA $2,958 $1,569 0.01% $0.12 4%19 $0.10 Colorado East B&TC CO $747 $640 0.02% $0.17 -43%20 $0.09 Bank of Fairfi eld WA $130 $108 0.09% $0.09 1%21 $0.08 Finance & Thrift Co CA $119 $93 0.08% $0.10 -23%22 $0.06 United Cmrl Bank CA $12,852 $7,639 0.00% $0.06 0%23 $0.06 Libertybank OR $947 $778 0.01% $0.03 128%24 $0.05 Stockman Bank of Montan MT $1,473 $1,084 0.00% $0.02 109%25 $0.04 Amerika Samoa Bank AS $116 $84 0.05% $0.03 42%

Singer’s Annuity and Funds Report October/November 2008 /22
Top 25 Banks in Insurance Revenues in the South: 2nd Quarter 2008(all dollars in millions; among 687 banks with some revenues)
Top 25 Banks in Insurance Revenues in the Midwest: 2nd Quarter 2008(all dollars in millions; among 1,254 banks with some revenues)
Note: 2nd quarter revenues are the sum of insurance brokerage and insurance underwriting revenues. Commercial banks and savings banks that report to the FDIC only. DBP is deposit-base penetration: insurance revs/deposits.
2nd qtr. revs. Bank State Assets Deposits DBP 1st qtr. Change
1 $222.47 Branch Banking &Trust NC $132,884 $85,652 0.26% $199.64 11%2 $46.91 Bank of America NA NC $1,327,429 $642,252 0.01% $43.98 7%3 $21.56 BancorpSouth Bank MS $13,395 $9,732 0.22% $24.77 -13%4 $14.47 SunTrust Bank GA $171,501 $114,276 0.01% $17.74 -18%5 $14.20 Compass Bank AL $61,067 $36,499 0.04% $17.09 -17%6 $10.09 First Tennessee Bank TN $35,287 $15,261 0.07% $11.22 -10%7 $8.39 Trustmark NB MS $9,181 $6,913 0.12% $8.26 2%8 $5.95 Banco Popular NA FL $88 $0 na $4.82 23%9 $5.00 Wachovia Bank NA NC $670,639 $397,759 0.00% $6.00 -17%
10 $3.50 Townebank VA $2,716 $1,991 0.18% $4.54 -23%11 $3.17 Hancock Bank MS $3,500 $2,779 0.11% $2.52 26%12 $3.09 R-G Premier Bank of PR PR $7,189 $4,399 0.07% $4.85 -36%13 $2.39 Carolina First Bank SC $13,938 $10,008 0.02% $3.06 -22%14 $2.00 First-Citizens B&TC NC $13,540 $11,066 0.02% $2.61 -24%15 $1.70 Capital One NA VA $108,520 $70,585 0.00% $1.46 17%16 $1.54 Regions Bank AL $139,354 $86,226 0.00% $1.52 1%17 $1.41 Gateway B&TC NC $2,120 $1,620 0.09% $1.65 -14%18 $1.19 First State Bank TN $1,247 $1,023 0.12% $1.52 -22%19 $1.04 Cadence Bank NA MS $1,984 $1,407 0.07% $1.38 -25%20 $1.00 Banco Popular de Puerto Rico PR $26,101 $17,620 0.01% $1.00 0%21 $0.99 First America B&TC LA $687 $610 0.16% $1.32 -25%22 $0.99 Merchants & Farmers Bank MS $1,614 $1,269 0.08% $0.97 1%23 $0.93 Firstbank Puerto Rico PR $17,841.11 $10,916.28 0.01% $1.09 -15%24 $0.91 Capital One Bank USA NA VA $31,301.81 $18,331.42 0.00% $1.21 -25%25 $0.90 Renasant Bank MS $3,775.91 $2,473.83 0.04% $1.18 -24%
2nd qtr. revs. Bank State Assets Deposits DBP 1st qtr. Change
1 $34.00 JPMorgan Chase Bank OH $1,378,468 $461,008 0.01% $31.00 10%2 $25.00 Wells Fargo Bank NA SD $503,327 $276,306 0.01% $27.00 -7%3 $22.09 National City Bank OH $151,165 $97,765 0.02% $21.77 1%4 $11.16 Associated Bank NA WI $22,059 $13,409 0.08% $11.33 -1%5 $9.07 Wells Fargo Financial Bank SD $5,988 $184 4.92% $9.83 -8%6 $5.75 US Bank NA OH $242,308 $127,819 0.00% $6.01 -4%7 $4.66 Fifth Third Bank OH $67,273 $32,669 0.01% $4.10 14%8 $3.54 First NB of Omaha NE $9,737 $7,390 0.05% $2.74 29%9 $2.23 Peoples Bank NA OH $1,897 $1,296 0.17% $2.93 -24%
10 $1.94 First Bank MO $10,780 $8,871 0.02% $1.99 -3%11 $1.85 Bank First National WI $739 $565 0.33% $2.50 -26%12 $1.81 KeyBank NA OH $98,048 $61,024 0.00% $1.09 67%13 $1.71 Soy Capital B&TC IL $387 $288 0.59% $2.36 -27%14 $1.63 Choice Financial Grp ND $502 $428 0.38% $1.00 64%15 $1.28 German American BC IN $1,166 $928 0.14% $1.87 -32%16 $1.19 Star Financial Bank IN $1,690 $1,266 0.09% $1.36 -13%17 $1.17 City NB of West Virginia WV $2,461 $2,012 0.06% $1.04 12%18 $1.09 1st Source Bank IN $4,457 $3,366 0.03% $1.95 -44%19 $1.07 Bank Forward ND $451 $342 0.31% $1.26 -15%20 $1.02 First State Bank IA $217 $156 0.65% $0.85 19%21 $0.94 Irwin Union B&TC IN $5,285 $2,956 0.03% $0.99 -5%22 $0.88 Wesbanco Bank WV $5,253 $3,657 0.02% $0.69 29%23 $0.74 American Bank Ctr. ND $230 $198 0.37% $0.94 -21%24 $0.71 Dacotah Bank SD $1,460 $1,223 0.06% $0.61 16%25 $0.64 Cornerstone Bank NE $716 $641 0.10% $0.64 1%

Singer’s Annuity and Funds Report October/November 2008 / 23
Top 25 Banks in Insurance Revenues in the Southwest: 2nd Quarter 2008(all dollars in millions; among 431 banks with some commissions)
Top 25 Banks in Insurance Revenues in the Midatlantic: 2nd Quarter 2008(all dollars in millions; among 97 banks some commissions)
Note: 2nd quarter revenues are the sum of insurance brokerage and insurance underwriting revenues. Commercial banks and savings banks that report to the FDIC only. DBP is deposit-base penetration: insurance revs/deposits.
2nd qtr. revs. Bank State Assets Deposits DBP 1st qtr. Change
1 $66.37 FIA Card Svc NA DE $165,350 $4,625 1.44% $69.69 -5%2 $16.64 TD Bank NA DE $98,855 $73,236 0.02% $15.92 5%3 $9.29 HSBC Bank USA NA DE $177,466 $82,748 0.01% $8.77 6%4 $7.37 Barclays Bank Delaware DE $7,670 $34 na $7.12 4%5 $5.51 Chase Bank USA NA DE $74,463 $35,842 0.02% $6.20 -11%6 $5.50 Discover Bank DE $30,502 $24,456 0.02% $6.02 -9%7 $3.98 National Penn Bank PA $9,028 $5,923 0.07% $3.82 4%8 $1.72 Harleysville NB&TC PA $3,868 $2,870 0.06% $1.58 9%9 $1.69 Benefi cial MSB PA $3,733 $2,657 0.06% $3.12 -46%
10 $1.44 PNC Bank NA PA $128,348 $76,832 0.00% $1.66 -13%11 $1.42 S&T Bank PA $4,335 $3,115 0.05% $1.54 -7%12 $1.36 Sandy Spring Bank MD $3,159 $2,298 0.06% $2.09 -35%13 $1.29 Univest NB&TC PA $1,995 $1,512 0.09% $2.09 -38%14 $1.01 Deutsche Bank TC DE $715 $226 0.45% $1.33 -24%15 $0.68 Northwest Savings Bank PA $6,987 $5,498 0.01% $0.60 13%16 $0.58 First Commonwealth Bank PA $6,197 $4,328 0.01% $0.81 -28%17 $0.49 Jersey Shore State Bank PA $623 $438 0.11% $0.58 -16%18 $0.46 First NB of Pennsylvania PA $7,905 $5,887 0.01% $0.34 34%19 $0.27 First Savings of Perkasie PA $1,080 $666 0.04% $0.23 18%20 $0.23 Wilmington Trust Co. DE $10,646 $7,784 0.00% $0.24 -5%21 $0.19 Kishacoquillas Valley NB PA $461.51 $345.37 0.05% $0.23 -18%22 $0.16 Mellon Bank NA PA $39,476 $9,043.74 0.00% $0.22 -27%23 $0.14 Firstrust Savings Bank PA $2,555 $1,948.30 0.01% $0.16 -16%24 $0.13 First National Trust Co. PA $20.90 $0.00 na $0.06 108%25 $0.12 Provident Bank of MD MD $6,166.36 $4,362.36 0.00% $0.12 -1%
2nd qtr. revs. Bank State Assets Deposits DBP 1st qtr. Change
1 $7.07 Frost NB TX $13,797 $10,758 0.07% $11.17 -37%2 $2.48 Comerica Bank TX $65,961 $41,358 0.01% $2.70 -8%3 $1.86 American NB TX TX $1,756 $1,476 0.13% $2.77 -33%4 $1.82 Arvest Bank AR $9,895 $8,298 0.02% $1.44 26%5 $1.46 Encore Bank NA TX $1,459 $1,082 0.13% $1.73 -16%6 $1.07 Int’l Bank of Commerce TX $9,363 $6,061 0.02% $0.80 34%7 $0.97 American Bank NA TX $874 $798 0.12% $0.90 8%8 $0.79 Industry State Bank TX $235 $199 0.40% $0.83 -5%9 $0.69 Benchmark Bank TX $198 $179 0.39% $0.68 2%10 $0.67 Extraco Banks NA TX $1,096 $810 0.08% $0.89 -25%11 $0.60 City Bank TX $1,775 $1,250 0.05% $0.47 27%12 $0.59 First NB TX $224 $184 0.32% $0.56 5%13 $0.56 Liberty Bank AR $2,529 $1,885 0.03% $0.58 -4%14 $0.50 Alliance Bank TX $498 $437 0.11% $0.75 -34%15 $0.31 Bancfi rst OK $3,823 $3,382 0.01% $0.28 11%16 $0.29 Amarillo NB TX $2,520 $2,088 0.01% $0.22 32%17 $0.23 Citizens NB TX $800 $718 0.03% $0.25 -6%18 $0.23 Falcon Intl Bank TX $865 $766 0.03% $0.22 5%19 $0.19 Community Bank AR $436 $293 0.06% $0.27 -32%20 $0.18 American NB TX $362 $284 0.06% $0.16 19%21 $0.17 Republic Bank & Trust OK $320 $285 0.06% $0.17 0%22 $0.13 First Nat. B&T Elk City OK $229 $204 0.06% $0.13 2%23 $0.13 Newfi rst NB TX $332 $296 0.04% $0.11 12%24 $0.13 First Victoria NB TX $1,375 $1,174 0.01% $0.19 -32%25 $0.11 Delta Trust&Bank AR $241 $219 0.05% $0.11 -5%

Singer’s Annuity and Funds Report October/November 2008 /24
Insurance Brokerage at Bank Holding Companies:2nd Quarter 2008 (All Dollars in Millions)
First column represents insurance brokerage revenues as reported to the Federal Reserve Board. Sixth column is insurance underwriting revenues. Seventh column is insurance brokerage as a percentage of all noninterest income (fee income). The last column represents the bank company’s total balance sheet assets.
2nd. Qtr. InsuranceBrokerage
Bank Holding Company State 1st Qtr.
Ins. Brokerage
Change2nd Qtr.
Ins. Underwriting
Ins. Brokege/
Fee Income
Assets
1 $488.0 Wells Fargo & Company CA $443.0 10% $62.0 9.5% $609,074 2 $468.0 Citigroup Inc. NY $460.0 2% $518.0 10.8% $2,100,385 3 $219.1 BB&T Corp. NC $199.2 10% $17.7 27.1% $136,465 4 $63.9 Bank of America Corp. NC $65.4 -2% $108.5 0.7% $1,723,270 5 $53.0 Wachovia Corp. NC $29.0 83% $35.0 1.4% $812,433 6 $29.0 HSBC North America IL $43.1 -33% $101.8 na $461,156 7 $25.9 Regions Financial Corp. AL $29.9 -14% $1.6 3.4% $144,438 8 $21.6 BancorpSouth, Inc. MS $24.8 -13% $0.0 30.0% $13,405 9 $18.3 Huntington Bancshares OH $19.8 -8% $0.9 8.1% $55,310
10 $18.0 JPMorgan Chase & Co. NY $18.0 0% $83.0 0.2% $1,775,670 11 $14.9 TD Banknorth Inc. ME $15.9 -7% $0.0 4.9% $116,845 12 $14.2 Compass Bancshares, Inc. AL $16.9 -16% $0.0 5.7% $61,101 13 $13.0 Popular, Inc. PR $13.0 0% $0.0 7.8% $41,679 14 $12.5 Eastern Bank Corp. MA $15.2 -18% $0.0 46.4% $6,803 15 $11.2 Associated Banc-Corp WI $11.3 -1% $0.3 12.9% $22,304 16 $10.3 National City Corp. OH $10.0 3% $22.8 2.3% $153,679 17 $8.9 Old National Bancorp IN $11.6 -24% $0.4 21.5% $7,602 18 $8.4 Trustmark Corp. MS $8.3 2% $0.0 17.3% $9,315 19 $8.0 Bancwest Corp. HI $9.8 -19% $0.0 4.5% $76,300 20 $7.1 M&T Bank Corp. NY $7.9 -10% $1.3 2.7% $65,893 21 $7.1 Cullen/Frost Bankers, Inc. TX $11.2 -37% $0.0 10.3% $13,808 22 $7.0 U.S. Bancorp MN $7.0 0% $9.0 0.4% $246,538 23 $6.7 First Horizon National Corp. TN $8.0 -16% $3.4 1.7% $35,551 24 $5.5 Fifth Third Bancorp OH $6.1 -9% $5.9 0.8% $114,975 25 $5.5 Central Community Corp. TX $5.0 10% $0.0 63.7% $1,036 26 $4.8 First National of Nebraska NE $4.1 17% $0.0 3.7% $16,663 27 $4.5 Suntrust Banks, Inc. GA $4.0 11% $14.6 0.5% $177,233 28 $4.2 Bank of Hawaii Corp. HI $6.2 -32% $0.0 6.0% $10,371 29 $4.1 Cobiz Financial Inc. CO $3.6 14% $0.0 36.5% $2,548 30 $4.0 National Penn Bancshares PA $3.8 4% $0.0 14.5% $9,241 31 $4.0 Lauritzen Corp. NE $5.5 -28% $4.9 91.6% $1,443 32 $3.4 F.N.B. Corp. PA $3.1 9% $0.8 12.3% $8,096 33 $3.3 Susquehanna Bancshares PA $4.0 -18% $0.0 7.2% $13,505 34 $3.2 Hancock Holding Company MS $2.5 26% $1.1 10.0% $6,320 35 $3.1 Shore Bancshares, Inc. MD $3.5 -10% $0.0 59.9% $1,019 36 $3.1 R&G Financial Corp. PR $4.9 -36% $0.0 33.4% $7,734 37 $2.9 Tompkins Financial Corp. NY $2.8 5% $0.0 25.7% $2,705 38 $2.9 Doral Group Ltd. PR $2.4 19% $0.0 9.6% $10,361 39 $2.8 VIST Financial Corp. PA $2.7 4% $0.0 59.8% $1,189 40 $2.6 Bremer Financial Corp. MN $3.2 -19% $0.0 11.9% $7,689 41 $2.6 473 Broadway Holding. NY $2.0 26% $0.0 68.0% $735 42 $2.6 First Bancorp PR $2.7 -6% $0.0 8.7% $18,829 43 $2.5 Comerica Inc. TX $2.7 -8% $0.0 1.1% $66,174 44 $2.4 South Financial Group SC $3.1 -22% $0.0 7.9% $13,979 45 $2.3 Valley National Bancorp NJ $3.4 -33% $0.0 14.5% $12,988 46 $2.2 Peoples Bancorp Inc. OH $2.9 -24% $0.0 28.2% $1,907 47 $2.2 Santander Bancorp PR $2.3 -4% $0.0 7.2% $8,831 48 $2.1 Texas Independent Bancshs. TX $2.3 -8% $0.0 55.2% $643 49 $2.0 First Citizens Bancshares NC $2.6 -24% $0.0 2.5% $16,423 50 $1.9 First Banks, Inc. MO $2.0 -2% $0.0 8.5% $10,809