single-event effects ground testing and on-orbit rate ... · single-event effects ground testing...
TRANSCRIPT

Single-Event Effects Ground Testing and On-Orbit Rate Prediction Methods: The Past, Present and Future
Robert A. Reed, Member, IEEE, Jim Kinnison, Member, IEEE, Jim Pickel, Fellow, IEEE, Stephen Buchner, Member, IEEE, Paul W . Marshall, Member, IEEE,
Scott Kniffin, Member, IEEE, Kenneth A. LaBel, Member, IEEE
Abstract Over the past 27 years, or so, increased concern over single event effects in spacecraft systems has resulted im research, development and engineering activities centered around a better understanding of the space radiation environment, single event effects predictive methods, ground test protocols, and test facility dlevelopments. This research has led to fairly well dleveloped methods for assessing the impact of the space radiation environment on systems that contain SEE sensitive devices and the development of mitigation strategies either at the system or device level.
1. INTRODUCTION As an ion passes through a semiconductor i t generates
dectron-hole pairs, this process is known as direct ionization. The charges either recombine or propagate through a semiconductor via drift or diffusion. Because the function of active microelectronic or photonic component is governed by the controlled injection of charge into the depletion layers of p n junctions, the uncontrolled charge injection resulting from ionization can produce an array of effects on the device operation. ’These effects are known as Single-Event Effects (SEES).
SEE ground-based testing is done to characterize how ;I microelectronic device responds to a single particle r:neutron, proton or other heavy ion) interaction with the atonis that makeup the semiconductor. On-orbit rate .?redictions methods have been developed that use the ground test characterization along with the space radiation environment definition to estimate the frequency of occurrence for a specific SEE.
There is a long list of various types of SEEs
Manuscript received March 27, 2003. ‘This work was supported in part by the NASA NEPPERC Project and the Defense Threat Reduction Agency.
R.A. Reed, K.A. LaBel are with the NASA Goddard Space Flight Center, Greenbelt, MD 20771.
J. Kinnison is with JHU/Applied Physcs Lab, Laurel, MD 20723.
J. Pickel i s with PR&T, Inc., Fallbrook, CA 92028. S. Buchner is a NASA/GSFC support contractor with QSS
P.W. Marshall, is a NASA/GSFC Consultant to QSS. Inc. Inc. Seabrook, MD 20706
Seabrook, MD 20706 S. Kniffin is a NASAlGSFC support contractor with Raytheon ITSS, Greenbelt, MD 20770
(sometimes call the “single event alphabet soup”). The most studied are Single-Event Upset (SEU), Single Event Latchup (SEL), Single Event Gate Rupture (SECiR), and Single-Event Transients (SET). Another paper in this Special Issue by Paul Dodd [1 J provided a review of the physical mechanisms for SEES and gave the definition of most SEEs that occur in modern technologies, including those listed above.
In April of 1996 several authors published an IEEE Transactions on Nuclear Science Special Issue on “Single-Event Effects and the Space Radiation Environment”. That Special Issue covered topics that includes SEE rate predictions approaches, test facilities available at the time, test issues for various technologies, as well as the components of the space radiation environment that must be considered when evaluating SEEs in a device. In this paper we summarize the concerns and issues
for modern devices by providing an historical account of the early days of SEE testing and space observation, an overview of the traditional assumptions used to develop SEE test approaches, a listing of the SEE test facilities available today, a review of SEE rate prediction approaches, and finally a listing of some of the observed phenomena that sever as a reminder that the traditional methods may not be applicable to all modern day technologies.
The works referenced in this paper-and many others that have been published in the IEEE Transactions on Nuclear Science (TNS), the Proceedings of the Radiations Effects in Components and Systems (RADECS) Conference, the IEEE Nuclear and Space Radiation Effects Conference’s Radiation Effects Data Workshop record, and RADECS Radiation Effects Workshoppresent testing methodologies and rate prediction techniques that deal with the issues raised hem and that are successful in providing the data needed to develop event rate estimates for space application design.
II. SEEs CIRCA I975-I980 R.esearch on SEES in microcircuits began as most
radiation effects research does; in 1975 an anomaly occiirred on a earth orbiting spacecraft that could not readily be explained by from known phenomenon. (The
https://ntrs.nasa.gov/search.jsp?R=20030053172 2018-12-02T03:35:50+00:00Z

possibility of cosmic ray induced SEU in microcircuits was predicted by Wallmark et. a1 [ 2 ] in 1962.) The first work detailing this new phenomenon was published in a paper in 1975 by Binder, Smith and Holman of the Hughes Corporation [3]. We quoted them here:
“Anomalies in communication satellite operation have been caused by unexpected triggering of digital circuits.. . The purpose of this paper is to investigate interactions with galactic cosmic rays as an additional mechanism.”
The authors were able to show that the anomaly was due to Single Event Upsets (SEUs) in a digital flipflop circuit. They developed a rate prediction approach based on device and transistor parameters, charge collection efficiency, and the solid angle and energy spectrum of impinging cosmic rays. The calculation was within a factor of 2 of the observed rate. While this work marked the start of a new era of radiation effects, the radiation effects community largely overlooked it.
A second paper, motivated by yet another spacecraft anomaly, by Pickel and Blandford [4], was published in 1978 that details the development of a heavy ion-induce rate prediction model that utilizes the concept of describing the space radiation environment as a Linear Einergy Transfer (LET) distribution, or Heinrich ciistribution [5]. They compared their calculation of the SEU rate for a NMOS dynamic RAM to on-orbit results and found agreement to within a factor of two. The observed error rate for the system was near one error per day, significant enough result to catch the attention of many of the radiation effects experts of that time.
Another paper published in 1979 by May and Woods (61 detailed the first reported alpha particle induced SEUs. The alpha particles were emitted from trace amounts of uranium and thorium present in the packaging materials.
Also in 1979, two independent research groups uncovered the fact that the recoil products from a proton-induced nuclear spallation reaction could have sufficient LET to cause an SEU. Wyatt, McNulty, ’Toumbas, Rothwell, and Filz reported on ground test results on two types of 4k DRAMs [7]. They observed upsets occurring for protons energies ranging from 18 to 130 MeV. At the same time Guenzer, Wolicki and Allas [8] studied and reported on proton and neutron- induced effects. They observed SEUs in 16k DRAMs for neutron energies that ranged from 6.5 to 14 MeV and for 35 MeV protons.
There are veiy distinct differences in SEE testing and rate prediction approaches between SEEs induced by direct ionization from the primary particle and indirect
ionization by reaction products from a nuclear collision. Typically, effects are dominated by direct ionization for ions with Z > 1 (know i n the radiation effects community as “heavy ions”). For neutrons and protons the effects are typically dominated by indirect ionization. Because of the different mechanism involved, the methods used to determine rate predictions-and thereby different test methods-are very different.
SEUs were not the only topic of discussion in the early days of SEE. The discoveiy of heavy ion-induced SEL was first published in 1979 by Kolasinski, Blake, Anthony, Price and Smith 191. The authors reported on SEL induced in SRAMs by heavy ion nuclei.
By 1980 the combined impact of all o f these papers was significant enough to motivate researchers, project managers, and design engineers to pay attention to this new phenomenon of radiation-induced effects. Shortly after these early papers were published a sequence of symposium devoted to SEEs was held. This meeting- The !jingle Event Effects Symposium, today a biennial event-was (and still is) critical to the development of the current understanding of SEE.
It is interesting to note that the early work detailing the analysis and rate prediction approaches have proven to be veiy robust even when applied to most modem day technologies. However there are certain cases where these analyses fail to predict the device response.
111. TRADrrlONAL ASSUMPTIONS USED TO DEVELOP SEE TEST APPROACHES
A. Introduction In this section we discuss some of the assumptions
and inethods used to perform SEE testing (Section VI describes cases where these fundamental assumptions are shown to be inadequate.) First we summarize the space environment, then we discuss proton and heavy ion SEE ground testing, and finally we discuss system level testing implications.
B. SEE Space Environment The space charged particle environment responsible
for single event effects is dominated in particle count by energetic protons, with smaller contribution from heavier ions (Z>1). However, various sources generate these particles, and the characteristics of the environment vary in distinct regions of space. The environment is traditionally divided into three parts- galactic cosmic rays, particles from solar events, and particles trapped in planetary magnetospheres.
Galactic cosmic rays (GCRs) are highly energetic ions (Z?l) that arise from sources outside the solar system, and are generally considered to form a spatially

constant background modulated by the changes in the solar magnetic field during the solar cycle and by the presence of planetary magnetospheres.
Solar events produce a range of energetic ions, but the maximum energy of these particles is much lower than for GCRs. Correspondingly, the solar ion environment is significantly modified by spacecraft shielding, by planetary magnetic fields, and by phasing within the solar cycle. Also, solar events are of short duration, so the solar ion environment consists of a sequence of impulsive bursts of ions that can dramatically raise the single event effect rate for a short time.
Charged particles can be trapped in planetary magnetospheres, and spacecraft in these fields will experience single event effects at rates that strongly depend on the details of the orbit. The most important example of this environment is the Earth’s Van Allen belts; all low Earth orbiting spacecraft must take into account the presence of the trapped proton belt, including deviations from a dipole model such as the South Atlantic Anomaly (SAA). Another important example is the environment of ions such as sulfur trapped in the Jovian magentosphere.
The space environment is modified by shielding associated with the structure of the spacecraft around a device in orbit as well as the packaging of the device itself. While this effect is small for energetic cosmic rays, the spectrum of lower energy ions-such as those produced by solar events-or trapped protons is s:.gnificantly altered by the presence of material around devices, and must be included in rate prediction. Most computer codes used to estimate environments include transport of ions through an assumed thickness of material before calculating the spectrum used for rate estimation.
There has been several Nuclear and Space Radiation E:ffects Short Courses that give a detailed description of the charged particle environment [IO], [ 1 I], [ 121, [ 131. Also Janet Barth’s paper in this Special Issue [ 141 gives a good review of the space radiation environment.
C. Device Level Testing
The event rate for a given effect in space is determined by a combination of environment and device characteristics, which are assumed to be completely tescribed by the geometry of a sensitive volume and a critical charge associated with the effect in question for a given cell within a device. In most cases, a device is modeled as an array of identical thin right-rectangular parallelepiped sensitive volumes-we discuss rate prediction approaches later in this paper. Device level SEE testing helps to define some of the critical
1.) Heavy Ion SEE Testing
parameters that are used to determine the on-orbit event rate.
The fundamental assumption associated with heavy ion SEE testing is that the cross-section only depends on the “effective LET” of the incident particle, that is, the nominal LET of the particle divided by the cosine of the incident angle-where the angle is that from the normal to the die surface. Division by cosine conies from the fact that the pathlength of the ion through the sensitive volunie increases with the angle of incidence. This increased pathlength gives rise to more charge being generated in the sensitive volume.
The end result of an SEE test is a measure of the cross-section as a function of effective LET. The cross- section usually takes the form of a curve with onset of SEE at some threshold LET which then rises to an asymptotic value at higher LET. The critical charge is determined fi-om the threshold LET, while the asymptotic cross-section gives the area of the sensitive volume. When combined with the thickness of the sensitive volume-typically derived from the archkecture of the device-the parameters derived from the cross-section are sufficient to allow calculation of SEE rates for inany technologies in any given space environment where 2 > 1.
A typical test consists of a series of niono-energetic exposures for beams over a range of LETs (or effective LETs.). During each exposure, the device is placed under bias, either active or passive. Events of interest are counted for a known incident fluence, and the cross- section is given by the ratio of number of events to the effective particle fluence. (Where the effective fluence is the product of the normal incident fluence and the cosine of the angle-this correction is for the reduced effective exposure area of the die surface.) Authors of research and test data reports often omitted the word “effective”, even when the heavy ion beam is at some angle relative to the normal to the die.
Some of the early work was devoted to understanding SEU:; in static RAMS, which are the best example of many of the assumptions in SEU testing. Each RAM cell is-to first order-identical, and from an SEE perspective, the device is easily seen to be an array of identical sensitive volumes. Tests are usually perfcanied by loading a pattern in the menioiy array, exposing the device to a known fluence of charged particles at a particular LET. After the exposure, the array is interrogated to count the number of flipped bits, from which the cross-section is calculated. Since each sensitive volume is identical, the per-bit cross-section is simply the measured cross-section normalized by the number of bits in the memoiy array. A complete experiment uses many LET values to fully map the

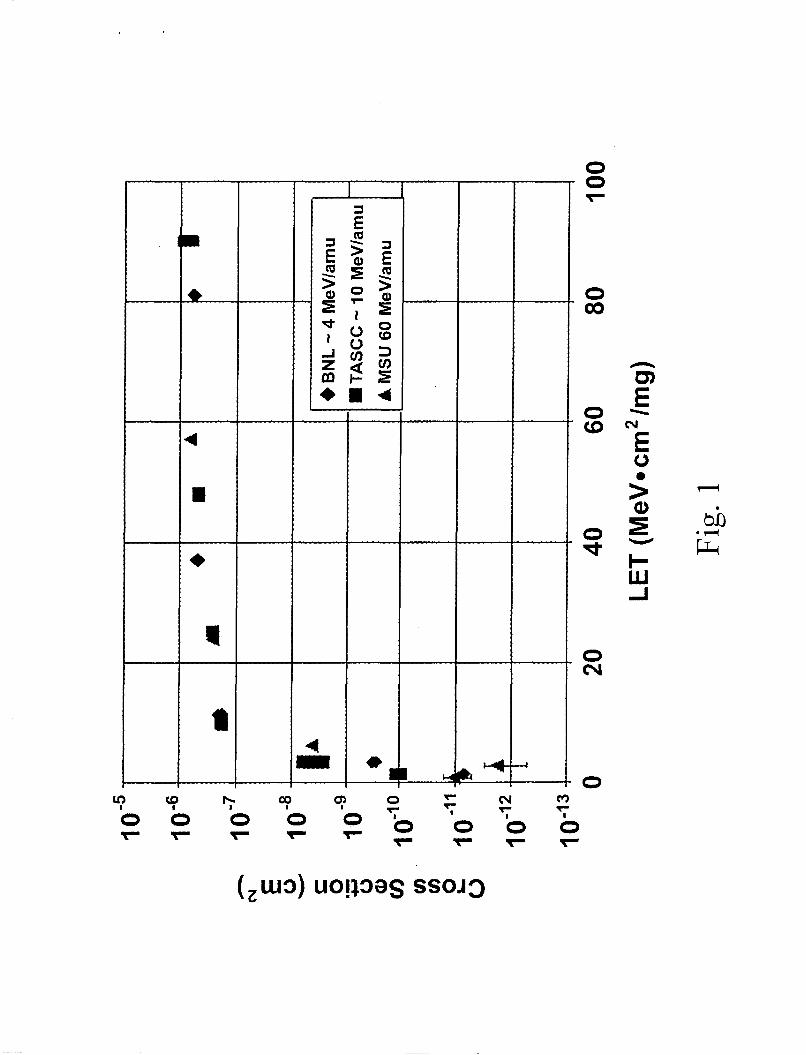
cross-section of interest. Since the number of different tieanis is limited at a test facility, some method of changing the LET of the beam-often, non-normal angles of incidence or degrader foils to change the beam e:nergy-is used to provide as many data points as needed. Fig. 1 is an example cross-section curve for a i’datra 32Kx8 SRAM.
The cross-section often depends on other factors such as temperature or electrical bias, or deviates from a strict dependence on effective LET. Even in the Eimplest cases such as SEU in static RAMS, significant deviations from the basic testing assumptions are observed. For example, if the array of identical, well- defined sensitive volumes were strictly true, the cross- section would be a step function with respect to LET. In reality, the cross-section increases with finite slope in the threshold region, followed by a knee region and a more gradual approach to the asymptotic cross-section than seen in a step function. These deviations can be due to statistical variations in the sensitive volume geometry or in the critical charge for a volume, and are significant for calculating event rates from cross-section data (see Section IV).
Another source of deviation in the shape of the cross- siection occurs when more than one sensitive volume is found in a cell, or when several different types of cells are present-each with their own characteristic sensitive volumes.
As a final example, experimenters often find discrepancies between cross-sections measured at the same effective LET with different beams at different incident angles. These discrepancies have been, in part, attributed to the deviation from the inverse cosine relationship between LET and incident angle. ’These issues have been studied in detail over the last decade, and in each case, methods for dealing with deviations have been developed [ I5 and references therein].
SEU testing can often involve other serious complications and deviations to the basic methodology outlined above. For instance, microprocessors contain many registers and latches that may or may not be active at a given time depending on the program running on the microprocessor. Therefore, the device upset cross-section strongly depends on the software used during the measurement, and the problem of actually detecting an error becomes quite coniplex. :Early on, Koga, et al, developed several different methodologies for testing microprocessor devices [ 161. These methods are based on comparison between irradiated devices and golden devices or simulated :golden devices, and are the basis for much of the microprocessor testing today. Other examples include ,3EU testing of analog-to-digital converters [ 171 where
the definition of an error is in question, and devices such as field programmable gate arrays [I81 where inadvertent rearrangement of &e circuit design while under irradiation causes complications in the operation of a device. In each example, methods for determining cros:;-sections and event rate estimates have been developed that allow conservative circuit design in spacz applications.
Effects other than upset also provide complexity beyond the basic SEU test. Latchup sensitivity in a device is a function of LET, but also of operating voltage, temperature and range of the incident particle in the device. In many devices, care must be taken to use beams with sufficient range to deposit charge in latchup sensitive volumes deep within the device, which calls into question the concept of effective LET for latchup.
Aka, in devices susceptible to gate rupture or burnout, the goal of a test is not to define the cross- section as a function of LET, but to measure susceptibility for various device parameter settings. Thes.e data allow the definition of safe operating regions for the device; when an engineer uses the device in the ‘‘safe region” the susceptibility to the effect is eliminated or greatly reduced [ 191, [20].
2.) Proton SEE Testing Energetic protons generally do not deposit enough
energy in a sensitive volume to directly cause SEES. However, approximately one in lo4 to I O 6 protons undergo nuclear reactions with. If produced in or near a sensitive volume, the residual nuclei can deposit enough energy to cause an SEE. The residuals that cause events are short-range ions that deposit most or all their energy within the sensitive volume.
Pxoton testing proceeds much like heavy ion testing in that the sample is exercised while exposed to a beam for a given fluence. Events are counted in each exposure, and the event cross-section is calculated by dividing the number of events by the fluence for the exposure (recall that the effective fluence is used for heacy ion testing). This procedure is repeated over a range of proton energies to fully characterize the cross- section as a function of energy. For the most part, exposures are done in-air.
Three issues, however, make proton testing significantly different from heavy ion testing. First, and foremost, samples experience significant total ionizing dose damage when exposed to proton beams, and the event cross-section can be different as damage accumulates. Care must be taken to plan experiments so that the device characteristics are not unduly altered duri:ng the measurements. Second, since the nuclear interaction probability does not depend on the beam

incident angle and the reaction products deposit nearly all their energy in the sensitive volume, the cross- section is assumed to only depends on the proton mergy. As a result, for proton testing, there is no equivalent concept to the effective LET used in heavy ion testing. Finally, the physical layout of proton exposure facilities and safety concerns for human experimenters adds considerable complication to experiment and equipment design.
D. Spacecraji System Impact on SEE Testing Single event effects can lead to changes in the
macroscopic behavior of a spaceflight system. For instance, changes in microprocessor code in an SRAM will, at a minimum, cause erroneous execution of the program. In the case of SEUs or SETS in a circuit, the s:ysteni event rate is generally not the sum of the individual device event rates. Instead, the system event rate is deterniined by a complex interplay of the location of a given event, the sensitivity of other devices in the circuit, and the timing of the event relative to the activity of the system. If the event rate is low, or if the interaction between devices is simple, the sum of event rates is a reasonable approximation to the system event rate. However, in a few instances, the additive approximation is inadequate, and the system as a whole must be tested.
This testing is generally performed by irradiating devices individually while operating the system; events observed at the outputs of the system are counted as with a device-level test. In some cases, a device-level test cannot be performed outside the context of a system. For example, a microprocessor test is impractical to perform at the device level. When embedded in a computer system, however, a microprocessor can be readily tested.
Devices sensitive to SEE are often used in space applications. Many mitigation techniques have been developed over the years-from error detection and correction in memories to latchup protection circuits for individual devices in a system. The combination of sensitive device and mitigation is a system that must be t.ested to verify proper operation-especially when a destructive effect is mitigated. Mitigation validation is performed by irradiating the sensitive device in a system with mitigation.
In order to be effective, system-level testing requires :special consideration. The event cross-section strongly depends on the details of the system design and function, including any software that might be executed by the system. As a result, the system tests must be as (close to the flight system as practical for reliable test :results.
From a modern-day spacecraft developer’s point of view, the overriding principle is that SEEs are a system concern and must be understood and managed at the system level. This “management” can be as simple as to select a device that does not exhibit a particular SEE or as complex as error correction and detection schemes that produce impact avoidance or system recovery when an SEE occurs. Independent of the methods used, the impzct of SEEs on the system must be understood to insure reliable spacecraft operation.
IV. SEE TESTFACILITIES
A. Introduction While each single event effect requires special test
considerations, all tests share common components. The basic SEE test consists of a sample exposed to a series of mono-energetic beams over a range of heavy ion LETs-or over a range of energies for proton tests-while being exercised in some way to look for the effect of interest. Components of any SEE test are ( 1 ) a source of beams with the required characteristics, (2) a beam monitoring and control system, (3) a mounting and positioning system to hold the sample in the beam, and (4) a system for biasing the sample and measuring its electrical behavior to detect the single event effect. In most facilities of general use in SEE testing, the facility provides the beam, beam monitoring and Icontrol, and sample mounting; the user is generally responsible for providing properly prepared samples, an electrical system to bias and monitor the sample, any interface hardware used to adapt the user’s system to the facility equipment, and equipment to provide for special test needs such as sample thermal control.
B. Heavy Ion Test Facilities There are seven major heavy ion beam facilities-
five in the United States and three in Europe-that are currently available or will be available in the near future for :SEE testing (others facilities exists, but are not considered to be major test facilities at this time). These highly capable SEE test facilities are located at laboratories used for basic physics research; generally, basic research will be higher priority at these laboratories than SEE testing. Part of the challenge in providing SEE test facilities will be to negotiate sufficient test time to meet the needs of the aerospace community while not unduly disrupting basic research at a laboratory. Each of the facilities described here produces a distinct set of beams, and is a unique set of compromises between cost, ease of use and space environment simulation fidelity.
A major consideration for determining the fidelity of a test is the energy of the beam for a given LET; higher

energy beams tend to more accurately reproduce the effects of the space environment at the expense of higher cost and greater complexity.
In 1987, the Single Event Upset Test Facility (SEUTF) was built by a consortium of US government agencies and Brookhaven National Laboratory (BNL) in response to increasing demand for SEE data for spacecraft hardware design and qualification. Since becoming operational in 1988, the SEUTF has been available to users including government, academic, and commercial institutions. The SEUTF consists of a test station attached to the east beam line of the Brookhaven Tandem Van de Graaff Facility (TVDGF), and is maintained and supported by the TVDGF [21]. The TVDGF is a low energy accelerator compared to all okher test facilities. The maximum energy for the siandard beams is on the order of a few MeV per nucleon. Downstream from the beam TVDGF control a i d measurement system, a system of five detectors is used to independently monitor the beam just prior to the SEUTF test chamber. Four of the detectors are placed evenly around the edge of the beam to measure fluence during test runs, while the fifth is mechanically inserted into the center of the beam between runs. Since the TVDGF provides low energy beams, experiments must be performed in a vacuum. The SEUTF chamber is a large vacuum chamber attached to the end of the beam- line. The main SEUTF hardware interface is a three- axis goniometer stage driven by absolute-encoded stepper motors. The stage is designed to provide iravel in all three linear dimensions as well as revolve about the beamline axis and rotate about the vertical axis of the stage to change the incident angle of the beam relative to the sample surface. The SEUTF is controlled through a custom designed software package that includes the local user beam control and monitoring as well as control of the sample positioning system and data logging for each run.
The 88-inch Cyclotron at Lawrence Berkeley National Laboratory (LBNL) has been used for single event effects testing by experimenters from the Space Science Applications Laboratory (SSAL) at the Aerospace Corporation since 1978 - the early days of tne field of study [223. In 1996, the third generation Single Event Effects Facility (SEEF) became operational as the latest facility for SEE testing at LBNL [23]. The cyclotron can develop bearns in cocktails which are mixtures of elements with constant charge-to-mass ratio. Each element will have the same energy per nucleon, and so will have different incident LET. Two standard cocktails are available at 4.5 (1 - 62 MeV-cni2/mg) and 10 MeV per nucleon (1 - 5 5 MeV-cniz/nig). Low LET ions can be added to each
cockt.liI to extend the LET range of each below I MeV- cm2/mg. Before passing to the test chamber, beams from the 88-inch Cyclotron are routed through a beam diagnostic system which is used to collimate and shutter the beam, measure beam characteristics before test runs, measlire relevant beam parameters during exposures, and allow alignment of samples with the beam. This is accornplished with a set of particle detectors and filters, and a mirror for the alignment laser. All of the elements in the: beam diagnostic system except the filter wheel are mounted on sliding stages and can be inserted or remoded from the beam via software on the SEEF control computer. The main test chamber is a large vacuum enclosure of about 1 m3 volume surrounding a 4-axis motion system on which test hardware is mounted. The Qaxis motion system provides linear travel across the beam horizontally and vertically, as well as rotation about the beam axis and about the vertical axis normal to the beam (to change the incident angle of the beam with respect to the sample surface).
The Texas A&M University (TAMU) Cyclotron Institute, jointly hnded by the State of Texas and the U.S. Department of Energy operates a K500 superconducting cyclotron to support research in nuclear physics and chemistry, as well as applied research in space science, materials science and nuclear medicine. The Cyclotron Institute has established the Radizition Effects Facility (REF) as a permanent test area, and has offered it for use by commercial, government and educational organizations to study single event effects in microelectronic and related radiation effects research [24]. The Cyclotron Institute is planning a series of upgrades which will link the previously-existing 88-inch cyclotron with the K500 cyclotron to expand the availabIe beams and increase the u:jefulness of the facility; one impact of this upgrade is that more time may be available for SEE testing [25]. A number of high energy beams have been developed by the Cyclotron Institute as “standard” beams for REF. These beams range in energy from 12.5 - 55 MeV/amu. Many of these beanis can be used without a vacuum chamber, which greatly simplifies the test equipment interface. REF provides beam monitoring and control in a manner similar to the systems used at SEUTF and SEEF. Since the beam LET can be changed with degrader foils, REF also includes a silicon transmission detec:tor that can be used to characterize the degraded beam. Two systems for hardware interface are available at REF-a target chamber system for lower energy beams and an in-air positioning system for higher energy beams. The target chamber is a cylindrical vacuum chamber 76 cni in diameter and 76 cm high. Both chambers have autoinated motion control. Target

position verification is performed with a camera co- al.igned with the beam axis and a laser that crosses the bean1 path in the center of the chamber.
The National Superconducting Cyclotron Laboratory (NSCL) at Michigan State University operates a K500 and a K1200 cyclotron for basic nuclear physics research. Over the last five years, beam time has been available on a limited basis for single event effects testing on the K1200, mainly through researchers at Goddard Space Flight Center. In 1999, construc.tioi1 began on an upgrade project that has significantly upgraded the basic physics research capability of the NSCL. The upgrade was accomplished by combining an electron cyclotron resonance source with the K500 arid KI 200 cyclotrons linked in series; and by replacing the fragment separator with a higher acceptance separator [26]. With this upgrade, NSCL can now produce heavy ion beams for all elements with energy higher than that available at all other US facilities except the Alternating Gradient SynchrotrodRelativistic Heavy Ion Collider at Brookhaven National Laboratory. As part of the NSCL upgrade, NSCL staff and NASA Goddard Space Ffight Center staff are preparing a facility at NSCL called the Single Event Effects Test Facility (SEETF). The facility consists of a beaniline and target area with associated interface, monitoring and control hardware modeled after the systems found at ciirrent test facilities. Beams with energy from 20- 200 MeV/amu will be available for ions from deuterium to uranium. The current NSCL plan is to provide 300-600 houdyear of beam time to SEE testing. User interface al. the SEETF is under development, and has been dzsigned to be similar to existing facilities as much as pxsible.
Fig. 2 plots typical heavy ion LET versus range values in silicon that are attainable at each of the facilities listed above. At several of these facilities, the LET-range values can be changed by tuning the accelerator to a specific beam energy. Degraders can also be used, but the beam energy straggle and uniformity must be verified. (The data for SEETF are the expected LET-range values.)
Cyclotron Research Centre at Louvain-la-Neuve, Belgium [27] operates three cyclotrons capable of delivering of heavy ions up to 27.5 MeV/amu. The cyclotron has two different cocktails of heavy ions used fix SEE testing. The test chamber is a 71x54~76 cni3 vacuum chamber with a multi-directional motion controller for moving the device relative to the ion beam. The dosimetry system is similar to the other heavy ion test facilities.
I'Institut de Physique Nucleaire (IPN) in Orsay, France operates a Tandem Van de Graaff that has used
extensively for SEE testing for more than 15 years [28]. The facility setup is similar to the BNL SEUTF as is the range of ions and energies. Testing is done in a vacuum. Dosimetry is similar to the other low energy SEE test facilities. The Grand Accelerateur National D'Ions Lourds
(GAKIL) is located in Caan, France [29]. A cyclotron is used to accelerate heavy ions up to 50 MeVIamu. SEE testing has been performed there for more than 7 years. The Chalk River Laboratories Tandem Accelerator
and Superconducting Cyclotron (TASCC) operated a superconducting cyclotron that was used for SEE testing until the late 1990's. The facility was closed permanently in August of 1997.
C. Proton Test Facilities There are six major proton test facilities; four US, one
European and one Canadian (others exists and are used from time to time, but are not considered to be mainstream facilities at this time). These facilities are used for SEE, total ionizing dose and displacement damage studies. Like the heavy ion SEE facilities these test facilities are located at laboratories used for the most part to carry out basic physics research or cancer therapy-again, this work is a higher priority for these laboratories.
These facilities rely on three primary dosimetry systems to determine the flux and uniformity of the beam: scintillators (usually plastic/organic), secondary electron monitors, and Faraday cups. Additionally, radiochromic films may be used to determine qualitative beam uniformity. AI1 of these facilities have test stands that allow open-air exposures (not in a vacuum). It is widely accepted that the dosimetry at these proton facilities is reasonably accurate, at least within 10%. The next few paragraphs list, in no particular order, the major facilities and gives some information about the facility.
University of California at Davis's Crocker Nuclear Lab (CNL) [30] has a isochronal cyclotron proton accelerator. It can achieve energies in the 1-68 MeV range. The cyclotron is energy tunable. The beam spot uniformity across the maximum 6 cm diameter is better than 10%. Beam dosimetry is achieved from calibrated secondary electron emission monitors, these are calibrated to a direct faraday cup measurement.
Indiana University (IU) Cyclotron Facility [3 I ] has a cyclctrodsynchrotron (cyclotron only for SEE). The energy peaks at 230 MeV (typical operation is near 200 MeV) and can be tuned. The beam spot can be up to 7cm diameter beam spot. A second beam line is currently being developed by IU and NASA Johnston

Space Center staff. The dosimetry is obtained via a faraday cup and secondary electron emission monitors.
Lawrence Berkeley National Laboratory [23] has an 88-inch cyclotron (described above). The proton energy range is 1-55 MeV tuned. The beam spot is; 4” diameter. The dosimetry is done with an ion chamber with rings for uniformity check, and radiochroniic when needed.
Texas A&M University (TAMU) [25] uses a K500 superconducting cyclotron (described above). The energy range is 8 - 70 MeV tunable. The beam spot is 1” diameter. The dosimetry used is foudfive scintillator array.
Tri-University Meson Facility (TRIUMF), located in Canada, [32] utilizes a cyclotron to accelerate protons to energies between 65-120 MeV on one beamliiie and 180-500 MeV on another beamline. A two to three inch square beam spot is available depending on the energy used. The dosimetry on low energy line is ion chambers calibrated against externally calibrated ion chamber. On the high-energy line dosimetiy is a achieved with a combination of faraday cup, plastic scintillators, and PIN diodes-all agree very closely.
Paul Scherrer Institute, located in Switzerland, Proton Accelerator Facility [33] can provide protons .with energies between 60 and 300 MeV in one facility and between 6 and 65 MeV in another. Bean1 spot is 34nim (low energy) and 9 cm (high energy) diameter. The dosimetry in the low energy facility is done using ion chambers or CsI(TI) scintillators. In the high-energy side an ion chambers, PIN diodes and plastic scintillators are used.
I-Iai-vard University has a cyclotron that has been used extensively in the past for SEE testing. However, since the early 1990’s this facility has decided to focus most of its resources on cancer treatment applications and research. Currently access to Harvard for SEE testing is ve:ry limited.
D. Other SEE Test Facilities Although broad-beam accelerators are essential for
SEE characterization, there are other approaches capable of providing information on SEEs. The limitations of broad-beam accelerator testing- including limited availability, high cost and lack of both detailed spatial and temporal informatiowhave lead to the development of alternate approaches for measuring SEE sensitivity. They include pulsed lasers, ion microbeams and 252Cf.
A pulsed laser is a well-established tool for elucidating the spatial and temporal characteristics of SEES [34], [35], [36], [37]. The basic requirement is that the laser generate short (-1 ps) pulses of light, with pulse energies greater than a nJ and photon energies
greate:: than the energy bandgap of the semiconductor. Added flexibility comes from being able to fire the laser repeatedly without damaging the device, from single shot to kilohertz rates, and to do so without the need for a vacuum. The light is typically focused to a -1 pm size spot and scanned across the device to obtain the spatial dependence of SEE sensitivity. The temporal characteristics of SEEs in dynamic circuits can be measured by synchronizing the circuit clock to the laser trigger and adding delay [38]. Although the charge generation mechanisms for ionizing particles differ fundamentally from those for ionizing photons, both experimental and theoretical investigations show that the resulting voltage transients are, in many cases, indistinguishable [39], [40]. The pulsed-laser technique does suffer from a significant limitation-the inability of the light to penetrate metal layers on the surface of a device:. This is the reason why recent reports suggesting that a pulsed laser can be used to generate curves of SEE cross-section versus LET are not promising [41]. One application of the pulsed laser that has, on occasion, proved invaluable is to ensure that both the devices selected for testing and the test equipment are functioning properly before being shipped to the accelerator facility.
A magnetically focused ion microbeam is a powerful tool for studying the basic mechanisms contributing to SEEs. The ion beam is generated by an accelerator and focused by a set of magnets to produce a beam with a diameter of -1 pm. One such facility, located at Sandia National Laboratory (SNL), generates ions with a inaxinium energy of 50 MeV. Of the ions available, those with ranges greater than I O Lni typically have LETs less than 15 MeV-cm2/mg. For testing, the devices are mounted in a vacuum chamber and the ion beam is either rastered across areas of interest or is fixed in one position. Rastering the beam permits the generation of detailed maps of the device response at specific locations around various sensitive transistors. In this way, images of both SEE sensitive areas and charge collection efficiency from specific junctions have been measured [42], [43]. Most of the SEE investigations using a microbeam have been reported by two groups-SNL in the USA and Gesellschaft h e r Schwerionenforschung (GSI) in Germany. Some of the technique’s limitations are the short range of the ions available, the necessity of using a vacuum, limited number of ion LETs, and the damage induced by the ion beam in the device being tested.
The third approach involves using the decay products from ,I radioactive source, such as 252Cf to generate SEEs i n circuits [44], [45], [46]. The source and the device: are mounted close to each other in a vacuum

chamber. The decay products fall into two energy ranges around average energies of 78 MeV and 102 MeV. Therefore, not only are the ion energies and, consequently, the ranges relatively low, the uncertainty i n energy leads to an uncertainty in both LET and range. The maximum available LET at normal incidence is 45 IvleV-cni2/mg. A major issue is the short range (-10 pni) of the ions that limits the usefulness of the technique, because devices with thick passivation layers or deep junctions cannot be tested reliably. Another issue is the radiation hazard for which stringent precautions must be taken to protect personnel. Nevertheless, for quick evaluations prior to doing accelerator testing, or for certain hardness assurance measurements, radioactive sources do offer a useful approach.
V.
A . Introduction Prediction of SEE rates involves a combination of
experimental data, assumptions about the device, and knowledge of the energetic particle environment. This section discusses how the ground test data, as described above, can be used to predict rates for SEE due to energetic particles in a space environment. We summarize the current rate prediction techniques for heavy ions and protons, interspersed with a historical glimpse of the early evolution of the concepts and approaches. Table 1 lists the key milestones for development of SEE rate prediction techniques. Much work has been done to refine the early methods in the ensuing years, and the reader is referred to the Transactions on Nuclear Science and several sets of Nuclear and Space Radiation Effects Conference (NSREC) Short Course Notes [47], [48], [49] to follow that trail. See the Short Course notes by Petersen [47] lor an excellent review of the historical evolution of the development and use of rate prediction concepts.
Single event effects are related to charge generation along the path of a primary or secondary ionizing particle, charge collection on circuit nodes, and circuit i'esponse to the charge transient. Both the total collected charge and the rate of charge collection can be important to triggering the effect. SEE rate prediction models typically use ground test data to extract information about the device sensitivity, measured in terms ofcross-section (CS) and critical charge (Qc), as a hnction of LET and/or proton energy. Testing methods have been devised to generate this information, as described in the previous sections. Once the CS versus LET or CS versus proton energy data have been experimentally acquired, there are established techniques for using the data to predict SEE rates in a
REVIEW OF SEE RATE PREDICTIONS TECHNIQUES
given space environment. The rate prediction methods do a fairly good job of predicting what is actually seen on-orbit. Of course the quality of the predictions is a function of the quality of the test data and the skill of the iiiodeler, taking into account the assumptions and limiiations of the models.
B. Heavy Ion Predictions To first order, the linear energy deposition rate
(MeV/pm) drives the effects. This allows simplification of the prediction problem through use of energy transfer (LET) spectra, as first developed by Meinrich [5]. All the ion types and distributions of energy in the space environment can be reduced to their LET, and deposited ener,gy can be estimated as LET times the chordlength through the sensitive volume. With this simplification, the problem to be solved is to identify the size of the sensitive volume, calculate the rate of ion hits and the consequent energy depositions, and determine the subset of total ion hits that cause SEE.
The SEE rate is the product of the sensitive area on the chip and the flux of ions in the environment that can cause upset when they hit the sensitive area. The threshold for the effect determines the effective flux. The problem is complicated by the angular dependence sinct: the amount of energy deposited in the sensitive volume depends on chordlength, which in turn depends on angle of incidence. The modeling problem can be approached from two directions: from a microscopic viewpoint (the chordlength approach) or from a macroscopic uewpoint (the effective flux approach). Bott approaches give similar results and are effectively equivalent if the same geometric assumptions are made. The chordlength model determines the minimum charge required for upset from cross-section versus LET test data, considers the distribution of LET in the environment, and puts a criterion on each ion interaction with a sensitive volume to select a set of ions (and associated flux) that exceed the minimum charge. The effective flux model transforms the ion flux in the space envi::onnient to an effective flux (capable of causing SEE) based on measured cross-section versus LET test data for the chip. Several rate prediction methodologies and codes are discussed in the literature, but they all fall into one of these two general categories.
1 .;I Chordlength Model The original Chordlength model was introduced by
Pickel and Blandford in 1978 [4] and developed into a computer code (CRIER) in 1980 [50]. The sensitive volume is modeled as a rectangular parallelepiped ( P I ' ) with lateral dimensions x and y and thickness z. The saturation cross-section per bit (CS,) is given by the product of x and y; conversely x and y are determined by measurement of CS,,, taking into account

the number of bits in the chip. The RPP approxiniates the depletion region beneath a p-n junction that is determined to be a sensitive volume. The ion is assumed to travel in a straight line and the path through ti-e RPP is S, determined by thickness, z, and the angle o F incidence, ?. Ion plasma track structure is ignored. Charge is also allowed to be collected along a funneling d stance, Sf, that adds to the chordlength S through the depletion region. Epitaxial layer thickness may limit charge collection by funneling. The energy deposited in the sensitive volume from an ion with LET, L, is
E = (S + Sf) L. (1)
This energy is converted to charge in accordance with the ionization energy (3.6 eV/carrier pair for silicon) and it is assumed that all charge that is generated within the charge collection length S + Sf is collected by the circuit node. It is assumed that there is a sharp threshold for upset-ion hits below a threshold LET do not cause upset, hits above the threshold cause upset. The classic RPP method utilizes an integral LET distribution and an analytic differential chordlength distribution function, f(s), and integrates over the chordlengths through the RPP. The rate is expressed as
R(Ec) = A, ?? [ Lt(S,Ec)] f(S) dS,
s,,, = (x2 + y2 + z2)"2
(2) Smin = 0
where the limits on the integral are fioni 0 to the imaxinium pathlength through the RPP, 4 is average projected area of the RPP, ? (L) is integral flux, E, is the threshold energy for generating Q,, and L,(S,E,) is the iiiinimuni LET which depends on chordlength through
where the chord length random variable S has been modified to account for charge collection by funneling and E, is defined by the critical charge. Inputs to the classic model are x, y, z, Sf and E,.
Alternative formulations that use an integral c hordlength and differential LET distribution were iiitroduced by Petersen and Shapiro in 1982 [51]. The two approaches are fundamentally equivalent. They differ in how they handle the complexities of integrating over discontinuities.
The classic RPP model assumes a step function for the cross-section versus LET curve. However, most devices exhibit a gradual rise from threshold to saturation because chip response generally is the composite of multiple types of sensitive volumes with
different thresholds and with distributions on their parameters. Petersen was the first to address this issue, suggesting that the cross-section curve be divided into several steps in order to more accurately represent it [52]. The common approach is to weight R(E) with the normalized experimental cross-section data
R = ?R(E) f(E) dE (4)
when: the integration range is from the measured threshold, &, to the measured value at saturation, Sa,, and f(E) is the cross-section versus LET curve converted to a probability density, often described by the four parameter Weibull distribution. The function R(E) is the rate at which an energy of E or greater is deposited in the sensitive volume. Moreover, f(E) may be regarded as the probability density for an event caused by deposition of E or greater. Thus the integral is the: expectation of R(E) with the probability f(E). This approach is commonly called the Integral RPP (IRPP) model.
The integral in Equation 2 is solved numerically. The original implementation was in the CRIER code [50] and a version of this code is implemented in CREME suite of codes [53], and also in commercial codes. The integral in Equation 4 is solved by dividing the data set into 21 number of bins based on LET. The data set is divided into anumber of bins based on LET and the integral in Equation 4 is also solved numerically. 2.) ESfective Flux Model
The original Effective Flux model was introduced by Binder in 1988 [54]. The method is based on consideration of the range of incident angles that can produce an SEU and the ion flux contained in that range. The model assumes an isotropic flux as a funct on of LET, F(L), incident on a thin lamina. If the threshold for upset is J+ and L > I.,, then all incident angles produce upset. If L < L,, there is a critical angle, ?c, which produces upset, where
cos(?,) = L / L,. (5)
The ion flux in the environment ? (L) can be trans::"ormed to an effective flux ? e(L) for an assumed cutoff angle ?c . The effective flux is sometimes called redistributed flux. Then the rate is calculated by
R = ?? ,(Lo dCS(L) (6)
wherl: CS(L) is the measured cross-section versus LET test data and the limits on the integral are from 0 to the maxiinum LET in the environment.

In general, the effective flux model predictions agree with the chordlength model predictions when the efl’ective flux calculation is performed allowing for the appropriate geometry. This agreement is not surprising if i:he thickness of the sensitive volume is small ( < I 0%) compared to the lateral dimensions.
3. ) Figure of Merit Approximation A Figure of Merit approximation for heavy ion SEU
was introduced by Petersen in 1983 [52] before wide distribution of codes for the more exact methods, and fu::ther refined in 1998 [55]. The Petersen approxiniation equation is
R = K CS, / L,’ (7)
where R is rate in upsetshit-day, CS, is saturation cross-section in cm2, L, is the LET at 25% of CS, in MeV-cm’/mg, and K is a constant determined by the environment. The value of K depends on device sensitivity, ranging fi-om approximately 95 for hard devices to 360 for soft devices [55]. The equation was or::ginally developed for quick device comparisons for heavy ion upset. The Figure of Merit approach has also been applied to proton-induced upset and has been studied for predicting heavy ion upset from proton data, or proton upset from heavy ion data [55].
C. Proton Predictions From the device perspective, the fundaniental upset
mechanism is the same for heavy ions and protons. The difference is whether a primary heavy ion causes upset, or a secondary ion recoil from a nuclear interaction of a proton within the device causes the upset. Rate prediction for proton nuclear-reaction-induced SEU is simplified by the isotropic nature of nuclear reaction cross-sections, which removes most of the angular dependence from the SEU mechanism. Proton upset rates are driven by nuclear reactions of the protons with the semiconductor material and determination of the recoil energy spectra is key to the solution. Rate prediction approaches have taken two general approaches: analytical calculations that consider the details of proton-induced nuclear reactions and the secondary ions, and semi-empirical approaches that rely on measured chip response to protons. The majority of pmton upset rate calculations have used the semi- empirical approach.
1 .) Bendel Model The original approach for predicting proton-induced
SEU was developed by Bendel and Petersen and came from the observation that much of the proton SEU cross-section data as a function of proton energy follows a relationship resembling the proton nuclear reaction
cross-section in silicon [56]. The general Bendel two- parameter model has the form
?,,(E)=?,,, [ I - e x p ( - o . i ~ P . ~ ) ] ~ (8)
where ?,(E) is a cross-section at energy E in units of 1 O i 2 upsets per proton/cni’ per bit, ? is the maximum upset cross-section, and
Y = (IWA)’ (E-A) (9)
where E and A are in MeV. The original formulation had both a threshold and a
limiting cross-section, but observed that a single parameter was adequate to describe the data available at the time. The Bendel parameter, A, was introduced on a semi-empirical basis as the proton incident energy threshdd for proton reactions that cause upsets. The model has more uncertainty for low energy protons
As more data became available, it became clear that the response of some modern smaller feature size devices was better modeled with the use of both threshold and cross-section parameters. An improved two-parameter Bendel model was suggested by two groups at about the same time and this is the fomi that currently has the widest acceptance [57], [58]. The two- parameter model is expressed as
~ 6 1 .
? ,,= (B/A)I4 [ 1 - exp(-0.18 (10)
where A and B are empirically determined constants unique to a device and Y is defined in Equation 9.
The parameter A is related to the apparent upset energy threshold, while the ratio (B/A) l 4 is associated with %;he saturation cross-section observed at high energies. Note that the one-parameter model has B fixed at a value of 24. The advantage of the two- parameter model is that it allows better fitting of the experimental data in the high energy regions, particularly for small geometry devices, while preserving the apparent low energy proton upset threshold.
The average upset rate for a given orbit is determined by integration of the cross-section curve defined by Equation I O over the orbit-integrated proton energy spectrum at the device. The empirical parameters are detemiined from experimental data by measuring the proton upset cross-section at one or more proton energies. With sufficient experimental data, other curve fits (e.g., Weibull) besides Equation I O can be used to calculate the rate.

Note that the proton upset rate depends on the probability of a nuclear interaction in the device and pathlength of the proton in the device is not a factor. This is in contrast to the case of heavy ion upset where the rate depends on the total energy deposition and the path-length must be taken into consideration.
VI. EXAMPLES OF BREAKDOWN OF MODELS AND TEST METHODS
A. Introduciion While the test methods and rate prediction
approached described above are very robust and have been proven time and time again to sufficiently est.iniate the observed on-orbit SEE rate (see for example [59]). These methods do have limitations-some of these limitation are discussed in [59]. In this section we summarize several observed effects that either forced researches to modify the existing test methods and/or rate prediction approaches or are current topics of ongoing research. This list is obviously not inclusive, but is broad enough to convince the reader that care must be taken whenever evaluating a new technology for applications in the space radiation environment.
13. Charge Collection by Digusion The classical upset models assume that the charge is
collected in times much shorter than device response time. In reality, charge is collected promptly (picoseconds) from high-field regions such a depletion regions and in charge funneling regions, but relatively slowly (nanoseconds to microseconds) by diffusion from low-field regions such as substrates. If the mechanism for the effect has characteristic times on the time for charge collection by diffusion, then the dower charge collection time needs to be considered. Many DRAMS and SRAMs have such long time constants. Another good example of this effect can be seen in the mechanisn~ for single event latchup (SEL) [60]. The cross-sections for upsets is radically different for diffusion dominated devices as compared to drift dominated devices. The cross-section for large LET ions is greater than the dimensions of drift regions and '[ncreases as the LET of the ions increases. Numerical ;analysis of the problem is still a field of current .-esearch.
C. Bipolar Efects in SO1 At first glance, Silicon-On-Insulator (SOI) would
.seem to be much less sensitive to upset since the pathlengths are small and the amount of charge that can be deposited by an ion is limited. However, it has been Dbserved that SO1 often upsets at unexpectedly lower LET thresholds. The reason is that there is a parasitic
bipolar amplification of the charge generated by the ion. The upset rate models can be augmented to account for this extra charge source [61].
D. Thick Sensitive Volumes The concept of effective LET is based on the fact that
the sensitive volumes are thin WPs. However, not all devices have thin sensitive volumes (some are not RPPs at all). When the heavy ion beam is rotated at some off normal angle, the ions have a pathlength distribution that is much more complicated than simple cosine law, i.e. effective LET concept is not valid in thick sensitive volumes. This is due to the ions that pass through the edge of the sensitive volume, known as edge effects. One approach to dealing with edge effects is given in [62 2nd the references therein].
E. Ion Track Structure Effects The current rate prediction models assume that the
line of charge created as the ion passes through the material is a very thin compare to the collection volume dimemsions. It has been speculated that as technology scales to smaller dimensions that the lateral spread in the line of charge due to delta rays will become important, the exact scale where this will become an issue: is highly disputed. Limited data showing a slight dependence on track structure has been presented in [63]: [64]. An extensive study on selected modern technologies using high and low energy ions with the same LET (track radius is different for ions with different energies) was presented in [65], no effect was observed for these devices.
F. Optical Data Links High-speed data links, including Optocouplers, can
be sensitive to proton induced single event effects [66], [67].. [68], [69]. In [66] the authors report that the protm-induced SET cross-section for a optical data links depend on angle of incidence of the proton beam, a result that differs from the classical view of proton testing. In that paper the angle dependence was determined to be due to direct ionization effects due to protons. A similar effect has been noted in optocouplers [67] , [63], [69]. The cross-section for these devices depends on the superposition of the cross-section due to direct ionization effects with that for indirect ionization effects. While several authors have attempted to develop on-orbit SET rate prediction approaches, there is no currently accepted rate prediction approach for this effect that is cost effective to implement. Most either require large amounts of data to be taken at various angles and proton energies or rely on computer codes that do not accurately model the effects.
Single Event Transients in Optocouplers and

G. Charge Collection in SOI For certain SO1 devices the silicon volume is the area
under the gate plus some region extending into the drain and source [70]. Also, it is possible to have charge collection fiom below the buried oxide in SO1 technologies that have very thin buried oxide layers
From this it is easy to see that the sensitive volume is not a simple RPP defined by the volume under the gate, but a complex structure that depends on variations in the buried oxide thickness, ion energy, LET and range, and other factors. There is no current rate prediction method that will accurately model this effect.
H. Proton-Induced Single Event Upsets in Sensitive Volumes with Large Aspect Ratios In [72] it was shown that the proton-induce SEU
cross-section can depend on the proton beam angle of incidence for SO1 (including SOS) devices that have sensitive volumes with one dimension that is much long t‘ian the others and have a sufficiently large critical charge. The authors also show that the angular effect bas an energy dependence. The angular effects observed experimentally to date have been described as being a result of the device response to the angle distribution of the recoil atoms produced from nuclear spallation reactions [73], [72].
Recall that one of the basic assumption for using the Bendel model (one or two parameter) is that the cross- section is independent of the proton beam angle of incidence. The Bendel approach could under predict the SEU rate, Monte-Carlo codes have been used to model this effect [73], [72], but will need fui-ther development to be useful as a rate prediction tool.
r701, WI.
YII. CONCLUSIONS Over the past 27 years, SEE rate prediction
approaches have been developed based on observed on- orbit data and ground-based research. The Cosmic Ray Research Satellite (CRRES) [74], circa 1980 (no longer active), and Microelectronics and Photonics Test Bed (MPTB) [75], circa 1998 (still active), are two major spaceflight instruments that contain SEE experiments. ’These experiments have been vital to the development of the traditional SEE rate prediction approaches, as well as other radiation effects research. However, there iue no flight data on technologies that are less than a (decade and a half old to show that there is a comprehensive understanding of how to use the existing models and test methods on current technology. Future :;paceflight opportunities, like the Living With a Star’s :Space Environment Testbed [76] are absolutely
necessary to ensure that accurate rate prediction models and test methods are being used.
The key result of the SEE research over the past three decades has been to develop fairly well defined test approaches, rate prediction methods, and test facilities that incorporates knowledge of the space radiation environment. These methods are valid for a subset of the technologies that are available to today’s spacecraft designers. Further development of each of these areas will be needed to maintain a core competency level that allows safe, reliable space systems to be launched in the future.
VIlI. ACKNO WLEDGA4ENTS WI: would like to thank Ray Ladbuiy, Tim Oldham,
Bryan Fodness, and Christain Poive y for technical discussions and review of this work. We would also like to thank Donna Cochran for support during the preparation of the paper.
IX REFERENCES [ I ] Paper published in rhis Special h u e by Paul Dodd
121 J.T. Wallmark and S.M. Mcircus. “Minimum Sire and Maximum Packing Density of Non-redundant Semiconducror Deviccs.”IRE Proc.. 50. 286 (1962)
[3] D.Binder, E.C.Smirh. and A.B.Holman. “Satellite Anomalies from IGolactic Cosmic Rays,” IEEE Trans. Nurl. Sci.. NS-22, 2675 (19751.
[4] J.C.Pickel arid J. T. Blandford, Jr.. “Cosmic Ray Induced Error:: in MOS Menioi-y Cells.” IEEE Trans. Nucl. Sci.. NS-25. 1166 (19781.
[S] W.Heinrich. “Calculation of LET Spectra of Heavy Cosmic Ray hiiclei al Various Absorber Depths.“ Rodiotiori Eflects, Vol. 34. 143 ( !977) .
161 T.C.May and M.H. Woods, ’*Alpha Porticle Induced Soft Errors in Dynamic RAM Memories.“ IEEE Trms. Elect. Dev.. 2 ( I 9 ;’9).
[?] R.C. Wyatf, P.J.McNulty. P.Tounihas. P.L Rothwell. and R.C.Filz. “Soft Errors induced by Energetic Prororis. IEEE Trans. Nucl. Sci.. NS-26. 4905 (1979).
181 C.S. Guenicr. E.A. Wolicki and R.G.Allas. “Single Event Upsel of Dynamic RAMS by Neutrons and Pro~ons, Nucl. Sci., NS-26. 5048 (1979).
[9] W.A. Kolasinski, J B. Blake, J.K. Anthony. W.E Price. and E.C. Sniirh. Sirnulorion of cosmic-ray induced sop errors and latchup in intsgrated-circuir conipitrer memories, IEEE Trans. Nucl. Sci.. NS- 26, 51187 (1979).
[IO] E.G. Stassinopoulos. “Radiation Environment of Space, ” Proc. of rhe I990 Nuclear arid Space Radiation Effects Conference Short Course, Reno, NV
[ I I ] J. Barrh. “Modeling Space Radiarion Eiivironmenrs, ’’ Proc. of rhe 1997 Nuclear and Space Radiation Effects Corlference Short Course. Siiownims. Colorado. 27 July 1997.
[ZZ] C. Dyer, ”Space Radiation Dosinierry, ’’ Proc. of the 1998 Nuclcor arid Space Rodiation Eflects Conference Short Course (11 Newporr Beach. Ca.
IEEE Trims

[ i3] the Spacecraji. E,yects Corference Short Course, Phoenix, Az
(.‘4J
[.‘5] E. L. Petersen. “Cross Section Measurements and Upset Rate Calculations. ” IEEE Trans. Nucl. Sci , NS-43. pp. 2803-2813
J. Mazur. “The Radiation Environment Inside and Outside Proc. of the 2002 Nuclear arid Space Radiation
Paperpublished in this Special Issue by Janet Barth
(i 996).
[I61 R. Koga. W. A. Kolasinski, M. T. Marra. and W. A. I fmna. “Techniques of Microprocessor Testing and SEW rate Prediction.” IKEE Trans. Nucl. Sci., NS-32. pp. 4219-4224 (1985).
[17] T. L. Tuiflinger. M V. Davey. and B. M. Mappes. ”Single Event Eflects in Analog-to-Digital Converters: Device Perfoi-mance aod S)stem Impact, : NS-41. pp. 21 87-2 I94 (I 994)
[ I s ] R. Katz, K LaBel. J. J. Wang. B. Cronquist. R. Koga. S. Fenzin, and G. Swift. “Radiation Eflects on Current Field F’rogranimable Technologies. IEEE Trans. Niicl. Sci.. NS-44. pp. 1945-1 956 (I 99 7).
/ I91 J. L. Titus. C. F. Wheatley. D. I. Burton. 1. Mouret, M Allenspach, J. Brews, R. SchrimpJ K. Galloway. and R. L. Pease. “Impact of Oxide Thickness on SEGR Failure in Vertical Power A4OSFETs: Development of a Semi-Enipirical Expression. IEEE lrans Nucl. Sci.. NS-42. pp. 1928-1934 (1995)
[20J M. Allerispach. I. Mouret. J. L. Titus, C. F. Wheatley. R. L. Pease, J. R. Brews, R. D. Schrimpj: And K. F. Galloway, “Single Event Gate Rupture in Power MOSFETs: Prediction of Breakdown 8iases and Evaluation of Oxide Thickness Dependence, ‘ I IEEE Trans. Plucl. Sci.. NS-42. pp. 1922-1927 (1995).
[2 lJ SEU Test Facility: User Guide, Tandem Van de Granfl Facility, Brookhaven Natioriol Laboratory, Upton. New York (1991).
1221 The 88-lnch Cyclotron, World Wide Web page. ~~t tp: / /u~u~w.Ib l .gov /~ i~d/~~er88/88de~cr ip t io11 . htnil. January 2002.
1231 Aerospace Single Event Eflects Testing. World Wide Web page, http://wu~u,.aero.org/seet/iridex. html and subsequent pcrges. 14 ,lugust 2001.
1241 Radiation Effects Facility - Cyclotron Institute. World Wide Web page. http://c)~clotran.tamu.edii/re~ and subsequent ptrges. 3 January 2002.
125) Cyclotron Institute. World Wide Web page. littp://cyclotron. taniu.edu/index htnil and subsequent pages. 29 October 2001.
i26J T. L. Grimm. C. C. Conipton. D. Lawtan. F. Marti, X Y Wu. m d R. C. York. “Design Study of a Single Event Effects Test Facility at the NSCL. study report provided by Robert Reed, Goddard Space ,clight Center, Greenbelt. MD. 1999.
,‘27] Cyclotron Resenrch Centre World Wide Web page. http://www, cyc. uel. ac. be/
,‘28] I’lnstitut de Physique Nucleaire. World Wide Web poge, http://ipnweb. in2p3.fi
F29J Web page. h t tp://www. gun il.,fi/
(30J Crocker Nuclear Laborato,:v, World Wide Web page. http:llcrocker.ucdavis.edu
[3 I ] Indiana Universi!~~ Cyclotron Facility, World Wide Web oage. http:llwww,iucf.indiana.edul
[32] Tri-University Meson Facility, World Wide Web page, http://~w.r~iiirnf.ca/homepage.html
Grand Accelerateur National D’loris Lourds. World Wide
[33] Paul Scherrer Institute. World Wide Web page. http://www.psi. ch/index_egroton.shtniI
(341 S. Buchner. D. Wilson, K. Kang, D. Gill, J . Mazur, W.D. Raburii. A.B. Campbell. and A.R. Knudson. ”Laser Simulation of Single Event Upsets. *’ IEEE Trans. Nucl. Sci, NS-34. pp. 1228-1233. December 1987.
[35] S.C. Moss. S.D. LaLumondiere. J.R. Scarpulla. K.P. MacWilliams. W.R Crain. and R. Koga. “Correlation of picosecond laser-induced latchup and energetic particle-induced latchup i n CMOS test striictures. iEEE Trans. Nucl. Sc.i. NS-42. p p 1948-1956. December 1995.
[36] V. Poiiget. H. Lapuyade. P, Fouillat. D. Lewis, S. Buchner, “Theowtical Investigation on an Equivalent Laser LET”, Microdectroiiics Reliability. 41 (2003). p 1513.
(371 A.M. Chugg, R. Jones, M. Moutrie. C.S. Dyer. C Sanderson and A Wraiglit. “Probing the Charge-Collection Sensitivity Profile Using a Picosecond Pulsed Laser at a Range af Wavelengths. ” IEEE Trans. Nucl. Sci.. NS-49. p p 2969-2976 (2002).
[38] R. Schneiderwind D. Krening, S. Buchner, K. Kang and T.R. Weatherford. ”Loser Confirmation of SEU Experinients in GaAs MESFET Conibinatorial Logic, I’ IEEE Trans. Niicl. Sci. NS- 39 p p . 1665-1672 (1992).
1391 D. McMorrow. T.R. Weatheflord. A.R. Knudson. L.H. Tran. J.S. Melinger and A.B. Campbell, “Single Event Dynamics of High- peformonce HBTS and GaAs MESFETS, ” IEEE Trans Nucl Sci, NS-40. pp 1858- 1866 (1993).
[40] R.L. Pease. A.L. Sternberg, Y. Boulghassoul, L. W. Massengill, S. Buchner. D. McMorrow. D.S. Walsh. G.L. Hash, S.D. LaLuwondiere and S.C. Moss. “Comparison of SETS in Bipolar Linear Circuits Generated with an Ion Microbecmi. Laser Light, arid Circu)‘t Siniulation. IEEE Trans, Nucl. Sci.. NS-49, pp 3 / 6 3 - 3 / 7 0 (2002,.
[41] Dyer and C. Sanderson. “Comparison Between SRAM SEE Cross- Secricris from Ion Beam Testing with Those Obtained Using a New Picosecond Pulsed Loser Facility, ’’ IEEE Trans. Nucl. Sci,. NS-47. p p
R. Jones, A.M Chugg. C.MS. Jones. P .H Duncan. C.S
539- 544, (2(1(10).
1421 IEEE Trans. Nucl. Sci,. NS-43 p p 687-704 ( I 996).
[43J S. Metzgsr. 1. Dreute. W. Heinrich. J. Roecher. B.E. Fischer, R. Hwboe-Sorenson. and L. Adums. ”Heavy Ion Microscopy of Single-Event Upsets in CMOS SRAM:r. I’ IEEE T r a m Nucl. Sci,. NS- 41. p p 589-592. (1994).
(441 J. T. Blandford and J.C. Pickel, “Use of cF252 to determine parameters .for SEW rate calculations.“ IEEE Trans. Nucl. Sci.. NS- 32, pp 4282-4287 (198s)).
14-51 D. Mapper. T.K. Sanderson. J.H. Stephen, J. Farren. L. Adam and R. Horboe-Sorenson, “An experimental study of the eflect of absorbers on the LET of the fission particles emitted by Cf252.“ IEEE Trans. Nucl. Sci.. NS-32. p p 4276- 4281 (1985).
1461 A. Costantine, J.W. Howard, M. Backer. R.C. Block, L.S Smith, G.A. Soli. and M C . Stauber, “A new method for using ”‘Cfin SEU:estirig.”lEEE Trans. Nucl. Sci.. NS-37. p p 1916- 1921 (1990).
1471 NSRKC Short Course, 1997.
[48] IEEE NSRECShort Course. 1993.
1491 J. C. Pickel, “Single Event U p x t Mechanisms and Predictions.” IEEE NSREC Short Course, 1983.
F. W. Sexton, “Microbeam Studies of Single-Event Effects. ’’
E. Petersen. “Single Event Analysis and Prediction.” IEEE
L.Massengill. “SEE Modeling and Prediction Technique.rl ’ I

[:io] J. C.Pickel and J. T Blandford Jr.. "Cosmic Ray Induced Errors in MOS Devices," IEEE Trans. Nucl. Sci.. NS-27. I006 ( I 980).
[ : ; I ] E.L.Petersen. PShapiro. J.H.Adanrs. Jr., E.A.Burke. "Calculation of Cosmic Ray Induced Sofi Upsets arid Scaling in VLSl Devices." IEEE Trans. Nucl. Sci.. NS-29. 2055 ( I 982).
[:i21 E.L.Petersen. J.B.LanAworrhy. and S E.Diehl. "Sup~ested S.ngle Event Upset Figure of Merit, " IEEE Trans. Nucl. Sci.,-kS-30, 4533 (1983).
[.is] Part IV," NRL Menioranhmi Report 5901 (1986).
[.i4] D.Binder. "Analytic SEU Rate Calculations Conipared to S,soce Data," IEEE Trans. Nucl. Sci., NS-35. 1570 (1988).
[.i5] Rote Calculations. " IEEE Trans. Nucl. Sei.. NS-45. 2550 (1996).
[.i6] W.L.Beridel and E.L.Petersen. "Proton Upsets in Orbit." /LEE Trans. Nucl. Sci.. NS-30.4481 (1983).
[.i7] YShimano. TGoka. XKuboyania. K.Kawachi, T.Konai. and Y Takami. "The Measuremenl and Prediction of Proton Upset, 'I IEEE Trans. Nucl. Sci.. NS-36, 2344 (1989).
[.M] W.J.Stapor, J . P. Meyers. J.B. Langworthy, and E.L. Pekwen. "Two Parameter Bendel Model Calculations for Predicting Proton Induced Upset. "IEEE Trans. Nucl. Sei.. NS-37. 1966 (1990).
[S9] in Space". IEEE Trans. Nuc. Sci.. NS-44. 2174 (1997).
[(SO] IEEE Trans. Nucl. Sci.. NS-37. 1866, (1990).
[(SI] S.E.Kerns. L. W.Massengill. D.V.Kerns, M.l..ANes. 7. W Houston, H.Lu. and L.R.Hite. "Model for CMOS/SOI Single Event Vulnerabrlrty, 'I IEEE Trans. Nucl. Sci. NS-36. 2305 (1989).
[52] L. W. Connel. P.J. MeDaniel, A.K. Prinja. and F. W. Sexton, "Modeling the heavy ion upset cross section, " IEEE Trans. Nucl. Sci.. A'S-42. pp. 73-82, ( I 995).
[53] W.J. Slapor. P.T. McDonald A R. Knudson. A.B. Canipbell, B.G. Glagola, "Charge collection in silicon f o r ions of dlflerent eoergy but same linear energy tronsfer (LET)" IEEE Trans. Nucl. Sci., NS-35. 1585, (1988).
[54] L. W. Coniiell, F.W. Sexton. P J McDaniel, A.K. Prinja. Modeling the heavy ion cro.rs-section f o r single event upset with track s n m u r e effects: the HIC-UP-TS niodel. " IEEE Trans. Nucl. Sci.. NS- 43, 2814, (1996).
[IS] P.E. Dodd. 0. Musseau. M.R. Shaneyfelt. F. W. Sexton, C. D'hose, G.L. Hash, M. Martinez. R A. Loemker. J.-L. Leroy, P.S. Winokur, 29 Inipact of ion energy on single-event upset." IEEE Trans. NucI. Sci.. NS-45. p p 2483, (1998).
(661 P. W. Marshall. C.J. Dale, M.A. Carts, and K.A. LaBel. 'Particle induced bit errors in high perforntance data links f o r scltellite data management. IEEE Trans. Nucl. Sei ... NS-41, no.6, pp.
J.H.Adams.Jr.. "Cosmic Ray El/ects on Microelectronics.
E.L.Petersen. "The SEU Figure of Merit and Proton Upset
E. L. Petersen. "Predictions and Observations of SEU Rates
A.H.Jolinston, "Latchup in CMOS.from Single Particles, 'I
1958-65, (1994).
[67] K.A. LaBel. P. W. Marshall, C.J. Marshall. M D'Ordine. M A . Carts, G. Lum, H.S. Kim, C.M. Seidleck. T. Powell, R. Abbott. J. L. Barth. and E. G. Stassinopoulos. "Proton-Induced Transients in Optocouplers: In-Flight Anondies . Ground Irradiation Test. Mitigation and Implications. * * IEEE Trans. NUC. Sci. NS-44. pp. 1885- 1892. (1997).
[68] R.A. Reed, P. W. Marshall, A.H. Johnston, J.L. Barth. C J . Marshall, K.A. LaBeI. M. D'Ordine. H.S. Kim, orid M.A. Carts. ' Emerging Optocoupler Issues with Energetic Particle-Induced
Transients and Perninnent Radiation Degradation. " IEEE Trans. Nuc. Sci.. NS-45, pp. 2833-2841, (1998)
[69] A.H. Johnston. T. Miyahara. G.M. Swift, S.M. Guertin. cind L.D. Edniorids, "Angular and Energy Dependence of Proton Upset in Optocoiipler.r."lEEE Trans. Nuc. Sci.. NS-46. pp. 1335-1341, (1999).
[70] P.E. Dodd, M.R. Shaneyfelt, K.M. Horn, D.S. Walsh, G.L. Hash, T.A. Hill, B.L. Draper, J.R. Schwank, F. W. Sexton. P.S. Winok;ir, "SEU-sensitive volunies in bulk arid SO1 SRAMs f iom jirst- principles calculations and experiments. '' IEEE Trans. Nucl. Scr. NS- 48, p p 1893-1903, (2001).
[71] J.R. Schwank, P.E. Dodd. M.R. Shaneyfelt, G. Viikelethy, B.L. Draper, T.A. Hill, D.S. Walsh. G.L. Hash, B.L. Doyle, and F.D. McDa#iiel. "Charge collection in SO1 capacitors and circuits and its elfkct on SEU hardness". IEEE Trans. Nucl. Sci.. NS-49, p p 2937 - 2947, f2002).
[72] R.A. Reed, P.W. Marshall, H. Kim, P J . McNulty. B. Fodne.ss. T Jordan, R. Reedy. C. Tabbert, M. (S.T.) Liu. W. Heikkiln, S. Buchner, R. Ladbury. arid K.A. LaBel. "Evidence for Angular Eflects in Proton-Induced Single-Event Up.rets. I ' IEEE Trans. Nuc. Sci.. NS-49. pp , 3038 -3044. (2002)
[73] R.A Reed, P.J. McNulty. arid W.G Abdel-Kader. "fmplicutions of angle of incidence in SEU testing of modern circuits." IEEE Trrms. Nucl. Sci.. NS-41. pp. 2049-2054,.( 1994).
[74] CRRE,P MEP. " IEEE Trons. Nucl. Sei.. NS-38. p p 1647-1654. (1991).
[75] see for example: A. Canipbell, S. Buchner. E. Petersen. B. Blake, J . Maiur, and C. Dyer, SEU nieasuremeril.r andpredictioris on MPTB for a large energetic solarpcirticle event." IEEE Trans. Nucl. Sci,. NS-49. p p 1340-1344. (2002).
[76] LWS SET World Side Web page: http://lws- sel.gsjr.nasa g o d
see for example: A.B. Canipbell. "SEUJlight data from the
Table I. Key Milestones in Development of SEE Rule Prediction Methods
Fig. . I , Example cross-section cttrves,for a Mutra 32Kx8 SR.1IM (circa 1998),
Fig. .?. Typical LET-range values,for the facilities listed above. Other values can be achieved by using beam energy tunes or degrading the beam energy.
Ht b -4
0 0 7
0 00
0 co
0 *
0 cv
0

LL W
3 z I- a +
LL W W v) I 7 -I m
t
LL I- 3 W v) I 7 m +
LL I- W w v> I 0 v> 7 +
h P) a, c a, c 0
CD c P) c m r 0
L
.-.I
.I
-- A
0 0 ?
0 0 00 to 0 w 0
N 0

II 0
Y