single-look sar tomography as an add-on to psi for ... · single-look sar tomography as an add-on...
TRANSCRIPT

IEEE TRANSACTIONS ON GEOSCIENCE AND REMOTE SENSING, VOL. 54, NO. 10, OCTOBER 2016 6119
Single-Look SAR Tomography as an Add-On to PSIfor Improved Deformation Analysis in Urban Areas
Muhammad Adnan Siddique, Student Member, IEEE, Urs Wegmüller, Senior Member, IEEE,Irena Hajnsek, Fellow, IEEE, and Othmar Frey, Member, IEEE
Abstract—Persistent scatterer interferometry (PSI) is in oper-ational use for spaceborne synthetic aperture radar (SAR)-baseddeformation analysis. A limitation inherently associated with PSIis that, by definition, a persistent scatterer (PS) is a single dom-inant scatterer. Therefore, pixels containing signal contributionsfrom multiple scatterers, as in the case of a layover, are typicallyrejected in the PSI processing, which in turn limits deformationretrieval. SAR tomography has the ability to resolve layovers.This paper investigates the added value that can be achievedby operationally combining SAR tomography with a PSI ap-proach toward the objective of improving deformation sampling inlayover-affected urban areas. Different tomographic phase modelsare implemented and compared as regards their suitability inresolving layovers. Single-look beamforming-based tomographicinversion and a generalized likelihood ratio test (GLRT)-based de-tection strategy are used to detect single and double scatterers. Thequantity of the detected scatterers is weighed against their qualityas defined in terms of the phase deviation between the single-lookcomplex (SLC) measurements and the tomographic model fit. Thegain in deformation sampling that can be derived with tomogra-phy relative to a PSI-based analysis is quantitatively assessed, andalongside the quality of the scatterers obtained with tomographyis compared with the quality of the PSs identified with a PSIapproach. The experiments are performed on an interferometricstack of 50 TerraSAR-X stripmap images. The results obtainedshow that, although there is a tradeoff between the quantity andthe quality of the detected scatterers, the tested SAR tomogra-phy approach leads to an improvement in deformation samplingin layover-affected areas.
Index Terms—Deformation analysis in urban areas, persistentscatterer interferometry (PSI), synthetic aperture radar (SAR)tomography.
Manuscript received December 28, 2015; revised March 21, 2016 andApril 25, 2016; accepted May 11, 2016. Date of publication July 9, 2016;date of current version August 11, 2016. This work was supported by theSwiss Space Office, State Secretariat for Education, Research, and Innovationof the Swiss Confederation (SERI/SSO) in the frame of the “Space TechnologyStudies” MdP2012 project “GAMMA software module for spaceborne SARtomography.”
M. A. Siddique is with the Chair of Earth Observation and Remote Sensing,Institute of Environmental Engineering, Swiss Federal Institute of Technology,8093 Zurich, Switzerland (e-mail: [email protected]).
U. Wegmüller is with GAMMA Remote Sensing AG, 3073 Gümligen,Switzerland (e-mail: [email protected]).
I. Hajnsek is with the Chair of Earth Observation and Remote Sensing,Institute of Environmental Engineering, Swiss Federal Institute of Technol-ogy, 8093 Zurich, Switzerland, and also with the Microwaves and RadarInstitute, German Aerospace Center, 82234 Wessling, Germany (e-mail:[email protected]).
O. Frey is with the Chair of Earth Observation and Remote Sensing,Institute of Environmental Engineering, Swiss Federal Institute of Technol-ogy, 8093 Zurich, Switzerland, and also with GAMMA Remote Sensing AG,3073 Gümligen, Switzerland (e-mail: [email protected]/[email protected]).
Color versions of one or more of the figures in this paper are available onlineat http://ieeexplore.ieee.org.
Digital Object Identifier 10.1109/TGRS.2016.2581261
I. INTRODUCTION
MULTITEMPORAL synthetic aperture radar (SAR) in-terferometric techniques are widely used to monitor
surface deformation caused by various geophysical processes(natural as well as anthropogenic), such as tectonic and volcanicactivities [1]–[3], mass movements on unstable slopes [4], [5],and mining and groundwater pumping [6]–[9]. The dynamics ofsuch processes are sampled with time series of interferometricSAR data. Differential interferometric SAR (DInSAR) [10],[11] methods exploit the temporal baselines among one or moreinterferograms to extract the phase components correlated withscatterer motion. The performance of these methods is limitedby the presence of unwanted phase components, such as theatmospheric phase screen (APS), and phase degradation causedby temporal and geometric decorrelations. Persistent scattererinterferometry (PSI) [12]–[16] is an advanced DInSAR conceptthat circumvents these limitations by observing the phase his-tories of the so-called persistent scatterers (PSs) in a relativelylarge stack of interferograms. These are single dominant point-like scatterers marked by high temporal coherence across theentire stack. Since they are less susceptible to the decorre-lation phenomena, their unknown motion parameters can bemore reliably estimated. A large quantity of PSs is generallydesired to effectively retrieve information about the observedgeophysical process.
In the context of long-term monitoring of deformation inurban areas, PSI has proven to be an invaluable tool, offer-ing millimeter-scale precision [17], [18] for extended areas ofobservation. Man-made structures, such as rooftops, railways,metallic lamp posts, and window panes, are good PS candidates(PSCs). A PSI analysis of an urban area generally reveals a siz-able number of PSs, particularly with high-resolution spotlightimages[19]. However, an inherent limitation associated with PSIis that, by definition, a PS is a single dominant scatterer withina range–azimuth resolution cell. Therefore, pixels containingbackscatter of comparable energy from multiple scatterers,which may individually exhibit point-like behavior, are re-jected. This situation arises often in layovers. Urban areas typ-ically have buildings of different heights, and layovers such asthose between the ground and the facade of a nearby building,or the rooftop of one building and the facade of a higher build-ing in proximity, occur ubiquitously. A local PSI analysis ofsuch buildings may suffer from poor deformation sampling dueto the rejection of such layovers. To overcome this limitation,a higher order analysis [20] (i.e., considering the possibility ofmore than one scatterer in a range–azimuth pixel) is required.
0196-2892 © 2016 IEEE. Personal use is permitted, but republication/redistribution requires IEEE permission.See http://www.ieee.org/publications_standards/publications/rights/index.html for more information.

6120 IEEE TRANSACTIONS ON GEOSCIENCE AND REMOTE SENSING, VOL. 54, NO. 10, OCTOBER 2016
SAR tomography [21]–[30] is a multibaseline interferometrictechnique that allows higher order modeling using both thephase and amplitude of the backscatter. It serves as a means toseparate individual scatterers in layover, which motivates its useas an add-on to PSI. While the classical use of SAR tomographyhas been the retrieval of reflectivity profile along the eleva-tion (perpendicular to the line of sight (LOS) direction), themore advanced tomographic techniques simultaneously allowmodeling the motion parameters of one or more scatterersin addition to their elevation. Notwithstanding that PSI andtomography may share the same phase models, whereas theformer can retrieve the elevation (as residual topography) andmotion parameters for a single scatterer only, the latter allowsit for multiple scatterers in a given range–azimuth pixel. Thispaper investigates the added value that can be derived by thecombined use of SAR tomographic techniques and PSI, partic-ularly toward the objective of extending deformation analysisto layover-affected areas.
A. Related Work
The early developments in SAR tomography focused onexploiting the spatial baselines of the data stack to builda synthetic aperture in the elevation, thereby extending theconventional 2-D SAR imaging to 3-D. The scatterers wereassumed stationary. The concept of differential tomography, asintroduced in [31] and [32], raised interest in using tomographictechniques for deformation analysis as well. Differential to-mography is a means to simultaneously model scatterer eleva-tion and deformation. It exploits both the spatial and temporalbaselines at the same time. The deformation is assumed tempo-rally linear. Results on real data have been presented in variousstudies [26], [33]–[38]. As reported in some PSI investigationswith X-band data, such as [17], [19], [39], and [40], scatterersin urban areas may additionally be subject to nonlinear motiondue to thermal dilation. The phase model needs to be extendedto account for the phase variations associated with nonlinearmotion. In [41] and [42], the extended phase model consid-ers the nonlinear motion as a temporally sinusoidal variationalongside the linear component. The investigations presented in[43]–[45], however, explicitly include local temperature valuesto model phase variations related to thermal dilation; the resultsare provided for single scatterers only.
Different tomographic inversion methods have been pro-posed over time. In the case that the underlying signal modelis assumed zero-mean circular Gaussian (fully developedspeckle), multilooking is typically needed to estimate the sam-ple covariance matrix and to allow for a reasonable inversionwith spectral estimators such as CAPON [37], [46] and mul-tiple signal classification (MUSIC) [47], [48]. Multilooking,however, reduces the spatial resolution in range/azimuth. Theapproach recently proposed in [49] is a multilook inversionmethod that uses a rather small degree of spatially adaptedmultilooking (averaging less than < 50 pixels) to estimate thesample covariance matrix. The method uses the principalcomponent analysis (PCA)-based interferometric stack filteringapproach given in [50]. Layovers are resolved by associatingthe eigenvectors of the estimated covariance matrix with the
different scattering mechanisms in the given (multilooked)pixel. With a slight compromise on spatial resolution, themethod offers better coverage compared with single-look to-mographic inversion. In [50], it is additionally reported thatlayover separation can be achieved without a priori phasecalibration of the stack (as required for SAR tomography) sincethe approach does not require any assumption about the struc-ture of the steering vector (for the given spatial and temporalbaselines).
In case of quasi-deterministic scatterers with stable phase(speckle-free, point-like behavior), single-look inversion meth-ods can be used. Among such methods are the standard beam-forming (BF) [26], [34], [51] and singular value decomposition(SVD)-based techniques [30], [52]. BF is a simple and robustmethod, but it is susceptible to spectral leakage and highsidelobes. The resolution in elevation is determined by theextent and distribution of the spatial baselines and is at bestlimited to the Rayleigh resolution for the theoretical case ofuniformly distributed baselines over the same extent. SVD-based techniques generally offer better sidelobe reduction andpossibly a slight super-resolution, i.e., the resolution achievedcan be slightly better than the Rayleigh limit. In the contextof super-resolution, the single-look tomographic processingintroduced in a compressive sensing (CS) signal reconstructionframework in [53] and [54] has been a significant advance.It is, however, computationally expensive. In [42], the overallcomputational expense of the framework is reduced by re-stricting the application of the CS-based reconstruction onlyto those pixels that contain closely spaced double scatterersclassified a priori. The classification process uses information-theoretic criteria (ITC), a trained support vector machine clas-sifier and estimates of scatterer elevation and deformationparameters obtained with periodogram maximization (basedon BF with amplitude-normalized single-look complex (SLC)pixel values). An alternative single-look method offering super-resolution with relatively inexpensive computation has beenrecently proposed in [28]. It suggests interpolating the spatialbaselines at virtual uniform locations, followed by tomographicinversion with MUSIC and CAPON beamforming (which alsooffer super-resolution in elevation).
Prior to tomographic inversion, a PSI analysis is typicallyneeded to isolate the APS [55] and thereby phase calibrate theinterferometric data stack. Another imperative step during to-mographic processing is the estimation of the number of point-like temporally coherent scatterers in a given range–azimuthpixel, i.e., model order selection. In [56], ITC-based modelorder selection methods have been discussed. In the caseof tomographic focusing with parametric spectral estimators,e.g., nonlinear least squares [30], [48], MUSIC, etc., modelorder selection has to be applied a priori. With nonparametricestimators, such as BF, CAPON, or the SVD-based techniques,the number of scatterers superposed in a given pixel can beestimated a posteriori by observing the “maxima” [57] in theretrieved reflectivity profile. For the identification of singledominant scatterers (i.e., PSs), a detector based on the multi-interferogram complex coherence (MICC) has been used in [58]in the context of PSI processing. The MICC-based detector usesonly the phase residuals (deviations between the differential

SIDDIQUE et al.: SINGLE-LOOK SAR TOMOGRAPHY AS ADD-ON TO PSI 6121
phases and the phase model fit) neglecting the amplitude in-formation. It has been shown in [34] that a generalized like-lihood ratio test (GLRT)-based detection of single scatterers,which implicitly incorporates BF-based tomographic focusingand hence includes both the amplitude and phase information,improves performance both in terms of higher probability of de-tection for a given level of false alarm as well as higher accuracyof estimates. A “second order” version of MICC has been usedin [20] for the detection of both single and double scatterers. Asequential use of GLRT has been theoretically developed andapplied in [38] to decide among the hypotheses that a givenpixel contains a single or double scatterer, or neither.
B. Research Gaps
Single-look SAR tomography can be combined with a PSIapproach to improve deformation sampling in urban areas.Given the fact that PSI is nowadays operationally used fordeformation analysis, a critical assessment of the utility offeredby SAR tomography is required to justify its operational use asan add-on to PSI. Different aspects of a tomographic framework(signal modeling, inversion, scatter detection, etc.) need to bereviewed in this context and its performance compared with thatof an established PSI approach using a common quality metric.The relative gain in deformation sampling with the added useof tomography, when using a typical SAR interferometric datastack (in terms of baselines, and spatial resolution), remains tobe both quantitatively and qualitatively assessed.
C. Contributions of This Paper
To fill in the aforementioned research gaps, this paper pro-vides the following main contributions.
1) Different phase models for tomography are analyzedin terms of their suitability for layover resolution andsimultaneous estimation of deformation parameters.
2) The potential gain in deformation sampling using a to-mographic approach in addition to a PSI approach isquantitatively discussed.
3) The quality of the scatterers obtained with tomographyis compared with the quality of the PSs identified witha PSI approach (using a mutually consistent measure ofquality).
D. Outline
First, we perform a PSI analysis for the selected urbanarea using the interferometric point target analysis (IPTA) [13]framework. A set of PSs is iteratively identified. The solutionobtained includes the estimates of the residual topography,linear deformation, phase-to-temperature sensitivity, and theAPS for each PS. Next, we implement BF-based tomographicinversion on the (phase calibrated) interferometric stack withthree different phase models. The inversion is applied on allpixels, including those rejected in the PSI processing whichpotentially include double scatterers. The performance of the
individual phase models, as regards the ability to resolve lay-overs, is evaluated. For the detection of single and doublescatterers, we adopt a sequential GLRT strategy as proposed in[38]. Relative to the number of PSs identified separately in thePSI processing, we quantify the gain in deformation samplingowing to layover separations achieved with tomography. As anext step, we compare the quality of the scatterers obtainedwith tomography against the quality of the PSs identified inthe PSI processing. Since a traditional PSI analysis uses onlythe phase information, we assess the quality of the PSs in termsof the residual phase, i.e., the root-mean-square (RMS) phasedeviation between the differential phases and the phase modelfit. Along similar lines, we evaluate the quality of the scatterersobtained with tomography on the basis of RMS phase deviationbetween the SLC measurements and the tomographic model fit.In this way, the quality metric used is mutually consistent and,therefore, allows for a performance comparison.
E. Additional Remarks
In case of single scatterers/PSs, it has been shown in [34]that a tomography/GLRT-based detection and estimation ap-proach offers improved quality in comparison with the classicalPSI/MICC-based approach. In this investigation, we conductan extended (empirical) quality comparison that includes thecase of double scatterers. We intend to comprehensively cross-examine the quality of the double scatterers against single scat-terers obtained with tomography/GLRT at different detectionthresholds and in turn relate it to the quality of the PSs identifiedseparately with an IPTA-based PSI processing.
SAR tomographic analysis in urban areas has often beenconducted with very high resolution (∼1 m) images acquiredin spotlight imaging mode. The higher the resolution, the moreis the tendency of the individual resolution cells towards point-like scattering. Therefore, compared with stripmap images at∼3 m resolution, spotlight images are more favorable fora PSI/tomographic analysis. Today, interferometric stacks ofhigh-resolution spotlight-mode SAR data are available only fora very limited number of urban areas. Keeping in view thislimitation, we perform this investigation on an interferometricstack comprising of stripmap images to assess the potential oftomography for a data type which is widely available and whichis, therefore, more relevant in an operational scenario.
The remainder of this paper is organized as follows.Section II describes the methods used in this investigation forPSI processing, tomographic inversion, and scatterer detection.The characteristics of the interferometric data stack used in thisinvestigation are given in Section III. Results are provided inSection IV, and a detailed discussion follows in Section V.
II. METHODS
A. PSI Processing Approach
Prior to a tomographic analysis of an interferometric datastack, a PSI solution is generally needed to extract and re-move the atmospheric phase contributions, thereby phase cal-ibrating the stack. As per the objectives of this paper, we

6122 IEEE TRANSACTIONS ON GEOSCIENCE AND REMOTE SENSING, VOL. 54, NO. 10, OCTOBER 2016
require a PSI solution to also serve as a reference againstwhich we can compare the potential value addition (in termsof quantity and quality of the deformation samples) offeredby the added use of single-look SAR tomography. In thiscontext, we performed PSI processing using the IPTA [13] tool-box which supports SAR interferometric time-series analysis.The important aspects of the PSI processing in our case areas follows.
A reference layer was chosen from the stack of SLC SARimages, and all the layers in the stack were then geocoded usinga multilooked intensity image of the reference [59], [60] andcoregistered. An initial list of PSCs was prepared on the basisof high temporal stability of the backscattering and low spectraldiversity. These two criteria act as a proxy to identify thepixels containing single point-like scatterers exhibiting long-term temporal coherence. As a next step, we generated pointdifferential interferograms for the candidates, using the (single)reference scene. It was assumed that the unwrapped differentialinterferometric phase is a sum of the phase contributions fromthe residual topography, deformation, and the atmospheric pathlength delays. Exploiting the spatial and temporal baselines,we applied a 2-D least-squares regression to obtain an initialestimate of the residual topography h and (average) lineardeformation velocity ν. We evaluated the quality of the esti-mates in terms of the RMS phase deviation σipta between thedifferential phases and the model fit. Low RMS phase deviationrepresents a better match with the phase model and henceindicates better quality. To ease computational burden of theprocessing, we curtailed the initial list of candidates using anadaptive point density reduction strategy [61]. The density ofthe candidates was reduced only in those local regions whereit was too high (by masking preferentially the candidates ofrelatively low quality in the local neighborhood).
The APS behaves as a nuisance in the regression fitting.Assuming the APS to be spatially low frequency and temporallyuncorrelated, we estimated it by spatial filtration and unwrap-ping of the phase residue in the neighborhood of the candidatesthat satisfied a quality criterion i.e., σipta below a certainpreselected threshold. The estimated APS was then subtractedfrom the differential interferograms, and the regression-basedestimation was iterated. After several iterations, the APS waswell isolated, and we obtained iteratively refined estimates ofthe residual topography and linear deformation velocity.
In case of urban areas, particularly when sensing high-rise buildings, the residual phase possibly contains a phasecomponent associated with nonlinear deformation that must bedifferentiated from the atmospheric phase. We used anotherregression-based routine that models the nonlinear deformationas thermal expansion, assuming that the phase variations dueto thermal expansion are linearly dependent on the tempera-ture changes [40]. The regression coefficient is the phase-to-temperature sensitivity, κ [40], [43], [44]. The sensitivity isa measure of the phase variations undergone by a scattererper unit change in temperature; the higher the sensitivity, themore pronounced is the thermal expansion. In this paper, weused a single temperature value for the entire scene, i.e., onetemperature per acquisition, for each layer, optimized in a waythat minimizes the residual phase in each layer [40].
Toward the end of the processing, the PSI solution obtainedon the reduced candidate list was expanded to include allthe candidates in the initial list, excluding those that failedto satisfy the quality criterion. For more details on variousinterferometric processing strategies using the IPTA toolbox,the interested readers are referred to earlier works [13], [40],[61]–[63]. Throughout the rest of this paper, the term “PSsidentified with the PSI processing” refers to the final set ofcandidates from the last iteration.
B. Tomographic Phase Models
For a given range–azimuth pixel exhibiting ideal point scat-tering from one or more targets, assuming no additive ormultiplicative noise, the mathematical model for classical SARtomography (3-D SAR) can be written as [23], [27], [30], [43],[51]
yn =
∫�s
γ(s) exp [−jϕn(s)] ds. (1)
yn is the SLC pixel value in nth layer of the coregistered andphase calibrated interferometric stack, for n = 0, 1, . . . , N − 1.γ(s) is the target reflectivity profile along the elevation s. Δsrepresents the observed elevation extent. In the case of 3-DSAR, the scatterer(s) is assumed stationary, and the interfero-metric phase is modeled as follows:
ϕn(s) = 2k�rn(s) (2)
where �rn(s) is the sensor-to-target path-length difference forthe interferometric pair
�rn(s) = rn(s)− r0(s) ≈s2
2(r0 − b
‖n
) − b⊥ns
r0 − b‖n
. (3)
The range distance from sensor n to the scatterer at elevation sis represented by rn. The orthogonal and parallel componentsof the nth spatial baseline are b⊥n and b
‖n, respectively. The
layer n = 0 is considered the reference layer. The phase modelfor 3-D SAR depends only on the sensor-to-target geometry.It suffices in case the scatterer(s) remains stationary along theentire time series. However, in the case that there is somemotion, there would be additional phase variations which mustbe accounted for in the phase model. Assuming that the motionis a temporally linear displacement in the LOS over the entiretime series, differential tomography [31], [35], [38] extends thephase model as follows:
ϕn(s, ν) = 2k [�rn(s) + νtn] (4)
where ν is the (average) linear deformation velocity of thescatterer, and tn is the temporal baseline for the nth layer. TheSLC pixel value from (2) can now be recast (as shown in [26],[33], and [41]) as
yn =
∫∫�s�ν
γ(s, ν) exp [−jϕn(s, ν)] dsdν (5)

SIDDIQUE et al.: SINGLE-LOOK SAR TOMOGRAPHY AS ADD-ON TO PSI 6123
where �ν is the range of the expected linear deformationvelocity. Different studies, such as [17], [19], [39], and [40],have shown that scatterers in urban areas may additionally besubject to nonlinear motion due to thermal expansion of thebuildings. Assuming that the LOS phase change due to ther-mal expansion of building structures is linearly dependent ontemperature changes, the tomographic phase model is furtherextended as follows:
ϕn(s, ν, κ) = 2k
[�rn(s) + νtn +
1
2kκτn
](6)
where κ is the unknown phase-to-temperature sensitivity ex-hibited by the scatterer (or rather by the underlying physicalstructure) and τn is the temperature change (with respect tothe temperature for the reference layer) for nth layer. With thisphase model, the SLC pixel value is given by the followingmultivariate integral [45]:
yn =
∫∫∫�s�ν�κ
γ(s, ν, κ) exp [−jϕn(s, ν, κ)] dsdνdκ. (7)
�κ is the range in which the phase-to-temperature sensitivityvalues of the scatterer(s) is expected. These values can berelated to the linear expansion coefficients of the materials [40].
For brevity, we label the aforementioned phase models asfollows: “P1” for the classical tomography (2), “P2” for differ-ential tomography (4), and “P3” for the extended phase model,which simultaneously models thermal expansion besides scat-terer elevation and linear deformation (6). A general mathemat-ical model for SAR tomography can be defined as follows:
yn =
∫P
γ(p) exp [−jϕn(p)] dp (8)
wherep is the unknown parameter vector for the scatterer andPrepresents the observed extent of the scatterer parameters, i.e.,the parameter space. In the case of the phase model P1, p = [s];for P2, p = [s, ν]; and for P3, p = [s, ν, κ].
C. Single-Look Tomographic Inversion: Parameter Estimationand Scatterer Detection
The estimation of the scatterer reflectivity γ(p) and thescatterer parameter vector p is an inverse problem, i.e., thetomographic model in (8) has to be inverted starting withthe SLC values (measurements). Additionally, a detection strat-egy has to be applied to ascertain whether a given pixel containsany coherent scatterers.
In urban areas, layover scenarios occur frequently. A layover-affected pixel may contain backscatter contribution from two ormore scatterers that may individually be temporally coherent.In this paper, considering that a given pixel has a maximumof two coherent scatterers, we make the following hypotheses:H0—the pixel does not represent a stable scatterer, i.e., theSLC values represent merely noise; H1—the pixel is a single
scatterer; or H2—the pixel is a double scatterer. The hypothesesare defined mathematically as follows [38]:
H0 : y = n (9)
H1 : y = γ1a(p1) + n (10)
H2 : y = γ1a(p1) + γ2a(p2) + n. (11)
y is the SLC vector, i.e.,
y = [y0 y1 · · · yN−1]T . (12)
γ represents scatterer reflectivity, and a(p) is the steeringvector; the subscripts 1 and 2 indicate the first and the secondscatterer in the pixel, respectively, with the first having moreenergy compared with the second. The general structure of thesteering vector as a function of the unknown parameter vectorp is given by
a(p) =[
1 e−jϕ1(p) · · · e−jϕN−1(p)]T
. (13)
n is the random noise vector generally considered zero-meancircular Gaussian. The structure of the phase values ϕn(p), andthe unknowns in the parameter vector p, depend on the choiceof the phase model [(2), (4), and (6)].
Different methods have been proposed over time for tomo-graphic inversion and scatterer detection, as in [26], [30], [34],[38], and [51]–[54]. In this paper, we use the reflectivity ofsingle-look BF as a merit function for the parameter estimationproblem. It can be directly associated with GLRT-based scat-terer detection strategies [34], [38]. The reflectivity estimatedwith BF as a function of the parameter vector, p is given by
γ(p) =1
NaH(p)y. (14)
BF is a nonparametric method. The presence of one or morescatterers manifests in the peaks of the estimated absolute orsquared reflectivity. Assuming the presence of at least onescatterer (i.e., either hypothesis H1 or H2 is true), we use theestimated absolute reflectivity as the objective function in thefollowing optimization:
p1 = argmaxp∈P
(|γ(p)|) . (15)
The parameters in P that globally maximize the merit functionare the estimated parameters for the first scatterer p1. It isimplicitly assumed that the steering vector for the first scattereris orthogonal to both the noise vector and the steering vectorof a second scatterer, if any. The estimated energy of the firstscatterer E1 (normalized with the total energy of the SLCvector) is as follows:
E1 =|γ(p1)|2
‖y‖2 . (16)
In the case that a second scatterer exists in the same pixel, i.e.,hypothesis H2 is true; in principle, we may look for a secondpeak of the estimated reflectivity. However, a sidelobe of thefirst scatterer can always be mistaken for a second scatterer andthus lead to false detection. An alternative way suggested by

6124 IEEE TRANSACTIONS ON GEOSCIENCE AND REMOTE SENSING, VOL. 54, NO. 10, OCTOBER 2016
[38] is to subtract the estimated backscatter of the first scattererfrom the SLC vector and search for a potential second scattererby applying inversion on the difference yc, i.e.,
yc = y − γ(p1)a(p1)
= P⊥1 y (17)
where
P⊥1 = IN − a(p1)a
H(p1)
N. (18)
IN is the identity matrix of size N . P⊥1 can be considered
the projector onto the orthogonal complement of the subspacespanned by the steering vector of the first scatterer aH(p1). Theparameters for a potential second scatterer, p2 are computed byapplying the following BF-based maximization [38]:
p2 = argmaxp∈P
⎛⎝∣∣aH(p)yc
∣∣∥∥∥P⊥1 a(p)
∥∥∥⎞⎠ . (19)
The estimated energy of the second scatterer E2,c, obtainedafter canceling the first scatterer from the SLC vector andnormalized with the energy of the difference yc, is given by
E2,c =
∣∣uHc yc
∣∣2‖yc‖2
(20)
where
uc =P⊥
1 a(p2)∥∥∥P⊥1 a(p2)
∥∥∥ . (21)
To distinguish between the three hypotheses (H0, H1, andH2), we use the sequential generalized likelihood ratio testwith cancellation (SGLRTC), as proposed in [38]. SGLRTCcompares the normalized energy of the scatterers, E1 and E2,c,against preselected thresholds, T1 and T2, respectively. The testis sequential, as it comprises of two consecutive steps. First, itis decided whether the pixel is a double scatterer or not, i.e., H2
or H2, respectively, i.e.,
E2,c
H2
≷H2
T2. (22)
If it is decided that the pixel is not a double scatterer, thenit is tested against hypothesis H1 (the pixel contains a singlescatterer) and H0, (no scatterer detected), respectively, i.e.,
E1
H1
≷H0
T1. (23)
The lower the thresholds, the more relaxed are the requirementson the minimum normalized energy to be detected as coherentscatterers. If the thresholds are too low, the energy of theclutter/noise may exceed the thresholds leading to false alarms.Similarly, a very high threshold may lead to missed detection.The choice of the thresholds can be associated with the desiredprobabilities of detection and false alarm. As suggested in [38],we keep the thresholds equal (T1 = T2) to jointly maximize
the probabilities of detection for both the single and doublescatterers for a given probability of false alarm. For further de-tails, interested readers are referred to [38] for a comprehensivediscussion and comparison of SGLRTC with other detectionstrategies.
Although the thresholds T1 and T2 can be set to attain thedesired probabilities of detection and false alarm, it remainsto be assessed whether the thresholds can be related to thequality of the parameter estimates. We consider that the qualityof the estimates is represented by the goodness of fit of thetomographic model with actual measurements (SLC values).Using the estimated parameters, we compute the estimated SLCvector yest (model fit) and observe phase deviation between theestimated and the actual SLC values in each layer. Low phasedeviations represent a better fit of the tomographic model tothe measurements. We compute the RMS phase deviation asa metric for the goodness of fit and hence as a metric for thequality of the estimates. In mathematical terms, the estimatedSLC vector yest for the single and double scatterers detectedwith SGLRTC is given by
yest =
{γ1a(p1) single scatterer
γ1a(p1) + γ2a(p2) double scatterer(24)
where γ1 and γ2 are the estimated reflectivities of the first andsecond scatterer, respectively:
γ1 = aH(p1)y (25)
γ2 = aH(p2)yc/∥∥∥P⊥
1 a(p2)∥∥∥ . (26)
The phase deviation for the nth layer, ϕresn is computed as
follows:
ϕresn = AD{�yn,�yn,est} (27)
where yn,est is the nth element of the vector yest, �(�) returnsthe phase of the complex argument between 0 and 2π, and theoperator AD{�, �} returns the absolute angle deviation betweenits arguments as follows:
AD{w1, w2} =
{d d ≤ π
2π − d d > π(28)
for d= |w1−w2|. The RMS phase deviation, σtomo is given by
σtomo =
√√√√ 1
N − 1
N∑n=1
(ϕresn )2. (29)
The quality of the estimates can also be related to the energyof the residue, i.e., the squared norm of the model mismatch‖y − yest‖2. Low residual energy would imply a better match.However, in this paper, we use phase deviations as a measureof model mismatch in order to be consistent with the qualityassessment in IPTA-based PSI processing (which ignores am-plitudes and operates only on the phases of the complex SLCvalues in the regression-based parameter estimation).

SIDDIQUE et al.: SINGLE-LOOK SAR TOMOGRAPHY AS ADD-ON TO PSI 6125
Fig. 1. Characteristics of the interferometric data stack used in this paper. (a) Distribution of the temporal baselines and the spatial baselines (orthogonalcomponent). (b) Two-dimensional point spread function in elevation–deformation plane.
III. DATA STACK
The interferometric data stack used in this paper comprises50 TerraSAR-X stripmap images acquired in repeated passesover the city of Barcelona, Spain. The images are spread overa time span of approximately 5 years, from December 2007to October 2012. The polarization mode of the images is VV.The slant range resolution δr is 1.2 m, corresponding to a chirpbandwidth of 150 MHz. The resolution in azimuth is 3.3 m. Theimages were oversampled by a factor of 2 to allow for a moreaccurate coregistration. The pixel spacing in range and azimuthis 0.455 and 1.89 m, respectively.
The distribution of both the temporal and spatial baselines ishighly nonuniform, as shown in Fig. 1(a). The total orthogonalspatial baseline i.e., the aperture in elevation B⊥, is 503.2 m.The resolution in elevation δs, had the spatial baselines beenuniformly distributed, would be
δs =λr02B⊥ = 19.2 m (30)
where λ = 3.1 cm and r0 = 622.8 km. The correspondingresolution in height would be 11.1 m, for an incidence angleof 35.3◦ for the reference layer. The resolution in deformationvelocity, assuming uniform temporal baselines, is
δν =λ
2T= 3.26 mm · yr−1 (31)
where T =1738 days is the total temporal span. Due to the non-uniformity of the baselines, the point spread function (PSF)is distorted, as shown in Fig. 1(b). For a given range bin, therange migration due to the different viewing angles in each passshould be very small compared with the range resolution range,which sets an upper limit on the observed extent of elevation�s [30]
�s δrr0B⊥ = 1485 m. (32)
Although we would expect an ambiguity in tomographic in-version with uniform baselines at an elevation of 942 m, therandomness in the distribution of the real baselines proves use-ful in alleviating the ambiguity over the entire observed extent.
IV. RESULTS
This section presents the results obtained on the interferomet-ric data stack introduced earlier. The urban area under study isDiagonal Mar, Barcelona, Spain. The average SAR backscatterimage and the corresponding Google image of the area areshown in Fig. 2. There are various man-made structures in thescene which may exhibit temporally coherent scattering. Thearea includes both layover (high-rise buildings) and nonlayoveraffected areas; therefore, it exemplifies a general urban scenariofrom an operational point of view. As the temporal span of theacquisitions in the data stack extends over many seasons, weexpect to see some nonlinear deformation (besides any possiblelinear deformation) due to the thermal expansion of the buildingstructures.
A. PSI Solution
We perform a PSI analysis of the data stack using theIPTA [13] framework. The final solution is obtained afterseveral iterations of the phase regressions for the estimationof scatterer residual height, linear deformation and the phase-to-temperature sensitivity, and the separation of the APS fromthe interferometric stack. In this paper, we used a thresholdof 1.1 rad for the RMS phase deviation σipta i.e., the setof PSCs with σipta greater than 1.1 rad were rejected in theiterative regression-based parameter estimation. Fig. 3 showsthe PSs identified in the PSI processing and the estimatedscatterer parameters (relative height, LOS deformation velocity,and phase-to-temperature sensitivity).

6126 IEEE TRANSACTIONS ON GEOSCIENCE AND REMOTE SENSING, VOL. 54, NO. 10, OCTOBER 2016
Fig. 2. Left: TerraSAR-X averaged intensity image of the observed urban area (Diagonal Mar, Barcelona, Spain). Right: Google Earth snapshot of the area.The blue pins mark the location of an example layover-affected pixel (a double scatterer containing signal returns from both the facade of the high-rise buildingas well as the rooftop of the triangular Diagonal Mar shopping center).
Fig. 3. PSI solution obtained with the IPTA framework. The colored dots are the PSs identified in the PSI processing. (Top) Estimated height, relative to WGS-84reference ellipsoid. Middle: Deformation velocity in the line-of-sight. (Bottom) Phase-to-temperature sensitivity.

SIDDIQUE et al.: SINGLE-LOOK SAR TOMOGRAPHY AS ADD-ON TO PSI 6127
Fig. 4. Reflectivity profiles obtained with tomography for an example layover-affected pixel [as marked with blue pins in Fig. 2]. Results are shown forthree different phase models: P1 (3-D SAR), P2 (differential tomography),and P3 (elevation, linear deformation, and thermal expansion are simulta-neously modeled). The elevation coordinate has been projected to vertical(relative) height.
B. Tomographic Inversions and Scatterer Detection
Prior to tomographic inversion, the interferometric stackneeds to be phase calibrated. The APS isolated in the PSIprocessing for the PSs is extrapolated to all the pixels in thescene, and subtracted from the differential interferograms toallow for single-look tomographic inversion on all pixels. Thereference layer, spatial and temporal baselines, and the refer-ence point used for the tomographic inversion are the same as inthe PSI processing. The reference temperature values used formodeling thermal expansion are as refined in the PSI processing(such that the residual phase in each layer is minimized [40]).The estimation of scatterer parameters (elevation, defor-mation velocity, and phase-to-temperature sensitivity) withBF-based tomographic inversion is otherwise independent ofthe PSI solution. The observed extents of the parameters areas follows: �s = [−50, 300] m, �ν = [−5, 5] mm/yr and�κ = [−1, 1] rad/K.
1) Layover-Affected Pixel: The blue pins in Fig. 2 markthe location of a layover-affected pixel which has not beenidentified as a PS in the PSI processing. It is expected that thepixel contains two scatterers: one situated on the facade of a tallbuilding, whereas the other on the rooftop of a nearby buildingof relatively short height. We apply tomographic inversionfor this pixel with each of the three different phase modelsdiscussed in Section II-B. The reflectivity profiles retrieved foreach phase model are shown in Fig. 4. For the case of classicalSAR tomography [phase model P1, (2)], the reflectivity profileshows the presence of a single scatterer around 20 m. Similarly,differential tomography [phase model P2, (4)] also reveals thepresence of a single scatterer. In addition to height, differen-tial tomography models temporally linear deformation. Fig. 5shows the 2-D reflectivity in the height–deformation plane.
Fig. 5. Reflectivity in the height–deformation plane obtained with phase modelP2 (differential tomography), i.e., |γ(p)| with p = [s, ν] [see (4)].
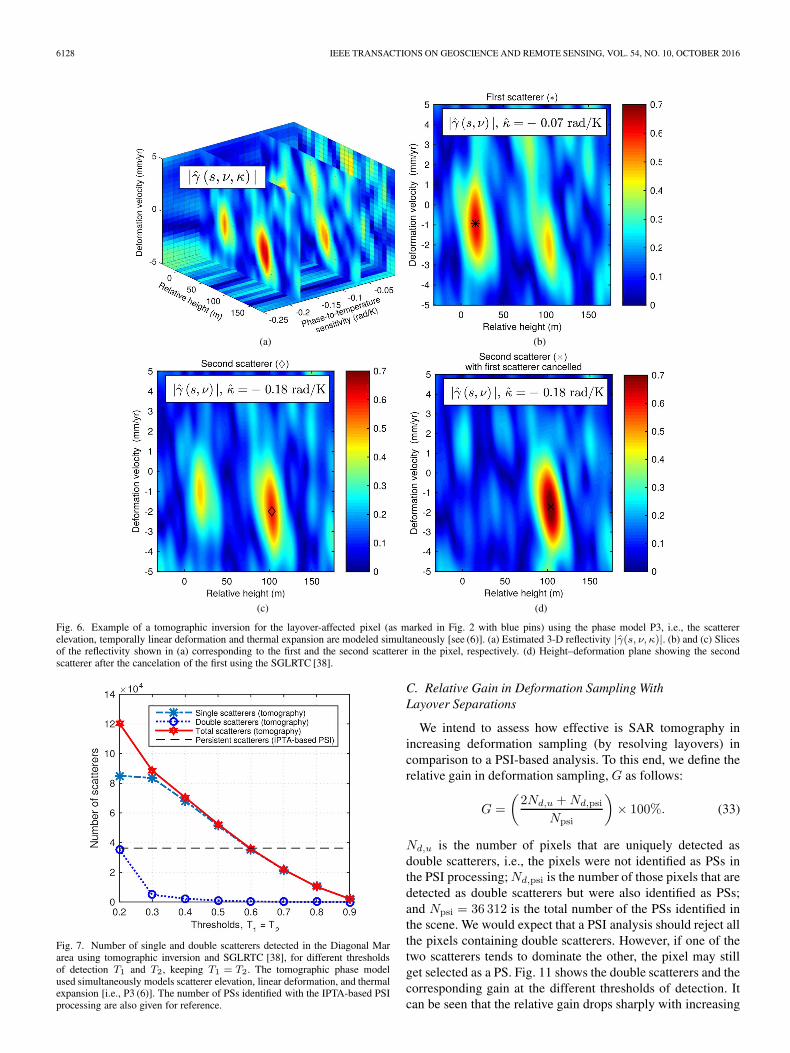
Tomographic inversion with the extended phase model [whichsimultaneously models scatterer height, linear deformation, andthermal expansion; P3, (6)], is also applied. The 3-D reflectivityspace is shown in Fig. 6. It can now be seen that the pixel isin fact a double scatterer, containing two individual scatterersof nearly comparable energy. The layover is resolved. Theestimated heights of the first and the second scatterers are nearly20 and 100 m, respectively. The estimated normalized energyfor the first scatterer is 0.6, whereas the normalized energyestimated for the second scatterer (after the cancelation of thefirst with SGLRTC) is 0.4.
2) Diagonal Mar: Tomographic inversion with the extendedphase model P3 is applied on the entire Diagonal Mar area,for all the pixels, whether identified as PS or not during thePSI processing. Single and double scatterers are detected usingthe SGLRTC-based detection strategy. The number of scatterersdetected with SGLRTC is directly influenced by the choiceof the thresholds T1 and T2. Fig. 7 shows the variation inthe number of the detected scatterers against the thresholds(while keeping T1 = T2). The lower the thresholds, the moreare the detected scatterers. However, for thresholds below 0.3,we observe a sudden jump in the number of double scatterersaccompanied by a sharp decline in the gradient for singlescatterers. For thresholds between 0.3–0.4, we have nearlytwice as many scatterers obtained with tomography than thePSs identified with PSI. For thresholds greater than 0.6, only avery few double scatterers are detected and the total number ofscatterers obtained with tomography drops below the numberof PSs. At a moderate value of 0.4 for the thresholds, Fig. 8shows the single scatterers, as well as the scatterers with higherelevation among the double scatterers (usually referred to asthe upper layer), in radar coordinates. Figs. 9 and 10 show thesingle and double scatterers, respectively, projected on GoogleEarth 3-D building models. The color coding represents theestimated parameters.
6128 IEEE TRANSACTIONS ON GEOSCIENCE AND REMOTE SENSING, VOL. 54, NO. 10, OCTOBER 2016
Fig. 6. Example of a tomographic inversion for the layover-affected pixel (as marked in Fig. 2 with blue pins) using the phase model P3, i.e., the scattererelevation, temporally linear deformation and thermal expansion are modeled simultaneously [see (6)]. (a) Estimated 3-D reflectivity |γ(s, ν, κ)|. (b) and (c) Slicesof the reflectivity shown in (a) corresponding to the first and the second scatterer in the pixel, respectively. (d) Height–deformation plane showing the secondscatterer after the cancelation of the first using the SGLRTC [38].
Fig. 7. Number of single and double scatterers detected in the Diagonal Mararea using tomographic inversion and SGLRTC [38], for different thresholdsof detection T1 and T2, keeping T1 = T2. The tomographic phase modelused simultaneously models scatterer elevation, linear deformation, and thermalexpansion [i.e., P3 (6)]. The number of PSs identified with the IPTA-based PSIprocessing are also given for reference.
C. Relative Gain in Deformation Sampling WithLayover Separations
We intend to assess how effective is SAR tomography inincreasing deformation sampling (by resolving layovers) incomparison to a PSI-based analysis. To this end, we define therelative gain in deformation sampling, G as follows:
G =
(2Nd,u +Nd,psi
Npsi
)× 100%. (33)
Nd,u is the number of pixels that are uniquely detected asdouble scatterers, i.e., the pixels were not identified as PSs inthe PSI processing; Nd,psi is the number of those pixels that aredetected as double scatterers but were also identified as PSs;and Npsi = 36 312 is the total number of the PSs identified inthe scene. We would expect that a PSI analysis should reject allthe pixels containing double scatterers. However, if one of thetwo scatterers tends to dominate the other, the pixel may stillget selected as a PS. Fig. 11 shows the double scatterers and thecorresponding gain at the different thresholds of detection. Itcan be seen that the relative gain drops sharply with increasing

SIDDIQUE et al.: SINGLE-LOOK SAR TOMOGRAPHY AS ADD-ON TO PSI 6129
Fig. 8. Single scatterers alongside upper layer double scatterers obtained with tomographic inversion and SGLRTC. Thresholds for detection T1 and T2 are set at0.4. The colors represent the estimated parameters. Top row: Relative height. Middle row: Average deformation velocity in LOS. Bottom row: Phase-to-temperaturesensitivity.
thresholds. The choice of the thresholds should consider boththe gain and the quality of the scatterers, as argued in thefollowing subsection.
D. Quality of the Estimates
The quality of the estimates obtained with IPTA-based PSIprocessing and BF-based tomographic inversion is assessed interms of the RMS phase deviations, σipta and σtomo, respec-tively. The lower the RMS phase deviation, the better is theperceived quality of the estimates.
1) PSs Identified With IPTA-Based PSI Processing: Fig. 12shows the joint and marginal distributions of the σtomo andσipta for the pixels that have been identified as the PSs inIPTA-based PSI processing. A strong correlation is clearlyvisible. The average values of the marginal distributions fortomography and PSI are 0.56 and 0.57 rad, respectively. There
are a very few pixels (< 0.01%) for which σtomo is higher than1.1 rad, which was used as the upper limit in the IPTA-basedPSI processing.
2) Single Scatterers Obtained With Tomography: Fig. 13(a)shows the distributions of the RMS phase deviation, σtomo
for the single scatterers obtained with tomography at differentthresholds. It can be seen that progressively increasing thethresholds improves the overall quality, but alongside, there isa drop in the number of the detected scatterers.
Fig. 13(b) shows the distribution of RMS phase deviation,σtomo for the single scatterers obtained with tomography inaddition to the PSs identified with the PSI processing at variousthresholds. The quality improves with increasing thresholds,but it can be seen that, on average, these scatterers exhibit alower quality than for the PSs. To ensure that at least 95%of these pixels should have σtomo below 1.1 rad, we needthresholds of 0.40 or higher.

6130 IEEE TRANSACTIONS ON GEOSCIENCE AND REMOTE SENSING, VOL. 54, NO. 10, OCTOBER 2016
Fig. 9. Single scatterers obtained with tomographic inversion and SGLRTC, and projected on Google Earth 3-D building models. The thresholds for detection T1
and T2 are set at 0.4. The colors represent the estimated parameters. (Top row) Relative height. (Middle row) Average deformation velocity in LOS. (Bottom row)Phase-to-temperature sensitivity.

SIDDIQUE et al.: SINGLE-LOOK SAR TOMOGRAPHY AS ADD-ON TO PSI 6131
Fig. 10. Double scatterers obtained with tomographic inversion and SGLRTC, and projected on Google Earth 3-D building models. The thresholds for detectionT1 and T2 are set at 0.4. The colors represent the estimated parameters. (Top row) Relative height. (Middle row) Average deformation velocity in LOS. (Bottomrow) Phase-to-temperature sensitivity.

6132 IEEE TRANSACTIONS ON GEOSCIENCE AND REMOTE SENSING, VOL. 54, NO. 10, OCTOBER 2016
Fig. 11. Top: Number of pixels detected as double scatterers in the DiagonalMar area at different thresholds of detection: Nd,psi are the double scatterersfor which the dominant (coherent) scatterer was also detected as a PS, whereasNd,u are the remaining double scatterers that were totally rejected duringthe IPTA-based PSI processing. Below: Corresponding relative gain in thedeformation sampling, G [(33)] with layover separations.
3) Double Scatterers Obtained With Tomography: Fig. 14shows the distribution of the RMS phase deviation, σtomo forthe double scatterers obtained with tomography at differentdetection thresholds. There is a tradeoff between the quality ofthe scatterers and the relative gain in deformation sampling, G(shown in Fig. 11). For T1 = T2 = 0.40, around 99% of thedetected double scatterers have σtomo less than 1.1 rad, with again of 9.8%, whereas the average σtomo is 0.66 rad.
For a pixel that is truly a double scatterer, we expect thatmodeling the second scatterer after the first should lead to animprovement in quality in terms of reduced phase deviationbetween the measurements and the model fit. To this end, wedefine the relative decrease in the RMS phase deviation �σas follows:
�σ =σtomo�H1 − σtomo�H2
σtomo�H1
(34)
where σtomo�H1 is the RMS phase deviation computed con-sidering only one scatterer in the pixel, whereas σtomo�H2 isthe RMS phase deviation when both the scatterers are modeled[refer to (24)]. Fig. 15 shows the distribution of �σ for thepixels detected as double scatterers at different thresholds.It can be seen that �σ tends to increase with increasingthresholds, implying that the quality improvement is higher athigher thresholds. Fig. 15 also shows that for a few doublescatterers, �σ is undesirably negative implying a worseningof the quality. With increasing thresholds, the percentage ofsuch pixels decreases. For the double scatterers detected atT1 = T2 = 0.4, there is 19% (on average) improvement in thequality, whereas around 2% of the double scatterers witness adecrease in quality.
E. Quantity and Quality of the Scatterers on a SingleLayover-Affected Building
Fig. 16 shows the relative gain in deformation sampling andthe RMS phase deviation, σtomo for the single and doublescatterers detected on a single layover-affected building (Hiltonhotel, as marked in the red outline). Again, we observe asharp decline in the gain, and an improvement in quality,with increasing thresholds of detection. It can also be seen(in comparison with Fig. 11) that, for the same thresholds, therelative gain in deformation sampling is higher for the case ofthe single building than for the Diagonal Mar area in general.This is naturally expected since it is the layover-affected areaswhere PSI is likely to reject candidates and tomography likelyto provide a relative gain by resolving the layovers. At T1 =T2 = 0.4, the relative gain is 31% for the single building asopposed to 9.8% for Diagonal Mar.
V. DISCUSSION
Here an itemized discussion of the results presented earlier isprovided.
A. PSI Solution
The PSs identified in the IPTA-based PSI processing, and theestimated residual height, linear deformation, and the phase-to-temperature sensitivity for each PS are shown in Fig. 3. Theresidual heights shown are relative to the WGS-84 ellipsoid.The estimated heights correspond fairly well with the actualheights of the buildings. The area is mostly stable, except forsome regions which are undergoing deformation as much as3–5 mm/yr (Forum area in the northeast). It can be seen thatfor most of the buildings, the estimated phase-to-temperaturesensitivity increases with height, implying that the upper partsof the building tend to undergo more thermal expansion. Thisseems plausible since the base of the buildings is grounded andthe upper parts are less constrained in terms of expansion. How-ever, it may not be true for all buildings. The structure of theindividual buildings would likely have a significant impact ontheir thermal expansion characteristics. In an earlier work [40],the estimated phase-to-temperature sensitivities were related tothe linear expansion coefficient of the building material.
It can be seen in Fig. 3 that the deformation samplingachieved with the PSI processing is fairly reasonable. Evenfor the layovers (high-rise buildings), the PSI solution providesdecent coverage. In case of a layover-affected pixel, quite often,only one of the superposing scatterers behaves coherently overtime, and when it tends to dominate the other scatterer(s) interms of energy, the pixel may still be well identified as aPS. In the case that the energy of the superposing scatterersis comparable and they exhibit temporal phase stability, thepixel would be rejected in the PSI processing, but tomographywould be able to individually detect them and thus provide anadded value.
B. Tomographic Inversion and Scatterer Detection
1) Layover-Affected Pixel: The results obtained with clas-sical SAR tomography [P1, (2)] and differential tomography

SIDDIQUE et al.: SINGLE-LOOK SAR TOMOGRAPHY AS ADD-ON TO PSI 6133
Fig. 12. Comparison of the RMS phase deviations separately obtained with PSI σipta and with tomography σtomo for the pixels identified as the PSs in the IPTA-based PSI processing. (a) Joint distribution of the RMS phase deviations. The color represents the joint density. (b) Marginal histograms of the RMS phase deviations.
Fig. 13. Histograms of the RMS phase deviation σtomo for (a) scatterers detected as single scatterers and (b) scatterers detected as single scatterers in additionto the PSs identified with IPTA-based PSI processing, at different thresholds (shown in different colors). The deviation bars show the interquartile range.
Fig. 14. Histograms of the RMS phase deviation σtomo for double scatterersobtained with tomography, at different detection thresholds (shown in differentcolors). The deviation bars show the interquartile range.
[P2, (4)] are reasonable in their own right but incorrect asthey lead to the false inference that the pixel contains a singledominant scatterer (the first scatterer). The layover is resolvedonly for the extended phase model [P3, (6)] when the scat-terer elevation, linear deformation, and thermal expansion aremodeled simultaneously. It implies that modeling the thermalexpansion of the scatterers, in addition to their elevation andlinear deformation, is indeed critical for effective layover sep-aration, particularly in the case of high-rise buildings. Theestimated heights of the two individual scatterers correspondfairly accurately with the actual heights of the two buildings. Inaddition, we obtain estimates of the linear deformation velocityas well as the phase-to-temperature sensitivity for each of thetwo scatterers. Considering the pixel was originally rejectedduring the PSI analysis, the layover separation provides twoadditional deformation samples. In this way, SAR tomographyprovides a value-addition to the PSI analysis by improvingdeformation analysis in layover-affected areas.

6134 IEEE TRANSACTIONS ON GEOSCIENCE AND REMOTE SENSING, VOL. 54, NO. 10, OCTOBER 2016
Fig. 15. (Top) Distribution of the relative decrease in RMS phase deviation,�σ when a second scatterer is modeled in addition to the first scatter, for thepixels detected as double scatterers at different thresholds. The boxplots (blue)enclose the interquartile range, and the center line (red) marks the median value.(Below) The percentage of double scatterers for which additionally modelingthe second scatterer led to an increase in the RMS phase deviation, possiblyrepresenting false alarms.
2) Diagonal Mar: For thresholds below 0.3, the suddenjump in the number of double scatterers alongside the sharpdecline in the gradient for single scatterers, can be explainedin terms of the decision strategy adopted in (22) and (23).The SGLRTC first decides whether a given pixel is a doublescatterer. If the threshold T2 is too low, many potential sin-gle scatterers would be falsely classified as double scatterersbefore being explicitly tested as single scatterers. Therefore,in our case, it is appropriate to choose thresholds higher than0.3. The scatterers detected at T1 = T2 = 0.4 are as shown inFigs. 8–10. It can be seen that their 3-D positions fit well to theGoogle Earth buildings models. The retrieved heights are fairlyaccurate. As with the PSI results, we observe some deformationin the Forum area. The upper parts of the buildings tend to bemore sensitive to temperature-dependent phase variations.
C. Relative Gain in Deformation Sampling WithLayover Separations
It can be seen in Fig. 11 that among the total pixels detectedas double scatterers with tomography (for thresholds greaterthan 0.4), nearly half of them have also been identified asPSs in the IPTA-based PSI processing. It clearly indicates thattomography has improved the deformation sampling not onlyby resolving those layovers which were altogether rejected inthe PSI processing but also by detecting the second scattererfor those where the first (dominant) was identified as a PS. The
Fig. 16. Quantity and quality of the scatterers obtained with tomography ona single layover-affected building. (Top) Average SAR backscatterer of theselected building (outlined in red). (Middle) Relative gain in deformationsampling compared to a PSI solution. (Bottom) The quality of the detectedsingle and double scatterers expressed in terms of RMS phase deviation,σtomo . The vertical bars and the shaded gray region represent the interquartileranges for scatterers obtained with tomography and PSI, respectively.
relative gain in deformation sampling, G [see (33)] declinessharply as the thresholds are increased due to a sharp decreasein the number of double scatterers. For thresholds between0.3–0.4, the gain varies between 22–9.8%; at 0.6, the gain isalready below 1.5%. In order to choose a suitable range forthe thresholds, such that they are neither too restrictive nor tooloose, it is imperative to consider the corresponding quality ofthe estimated parameters.
D. Quality of the Estimates
1) PSs Identified With IPTA-Based PSI Processing: Theaverage σipta for the entire set of pixels identified as PSs is0.57 rad, which is well below the upper limit of 1.1 rad set inthe IPTA processing, implying the overall good quality of theestimates obtained with PSI. For these pixels, the correspondingquality of the estimates computed with tomography is compa-rable, as indicated by the strong correlation between the σipta
and σtomo (shown in Fig. 12).

SIDDIQUE et al.: SINGLE-LOOK SAR TOMOGRAPHY AS ADD-ON TO PSI 6135
2) Single Scatterers Obtained With Tomography: It it shownin Fig. 13(a) that progressively increasing the thresholds tendsto reject the detected single scatterers of relatively lower qual-ity, whereas those with higher quality seem mostly unaffected.In this sense, the threshold T1 can be considered a proxy forthe quality of single scatterers. In order that the quality of thesescatterers is comparable with the quality of the PSs, we needthresholds greater than 0.5. However, as discussed earlier, forthresholds above 0.5, we detect very few double scatters, andthe relative gain in deformation sampling is merely 4% or less.Similarly, if we only observe the single scatterers in addition toPSs, as shown in Fig. 13(b), to match their quality with those ofthe PSs would require thresholds that are too restrictive to allowfor the detection of a reasonable number of double scatterers.
3) Double Scatterers Obtained With Tomography: Fig. 14shows the quality of the double scatterers detected at differentthresholds. As for the case of single scatterers, there is a tradeoffbetween the quality and the quantity of the double scatterers.However, it can be seen that the effect of progressively increas-ing the thresholds on the average quality is not as pronouncedas it has been for the case of single scatterers. With increasingthresholds, some pixels of relatively good quality are alsorejected. This is not unexpected since the phase residue for adouble scatterer depends on the quality of both the first and thesecond scatterer. It could be that the second scatterer suffersfrom phase noise leading to poor inversion; a high value of T2
may reject it as a double scatterer, although it may still exhibita relatively low σtomo due to a possibly good inversion ofthe first scatterer. At the same time, there is a pronouncedrelative increase in the quality by modeling the second scattererin addition to the first, as depicted by the increasing �σ withincreasing thresholds in Fig. 15. The pixels detected as doublescatterers but with �σ < 0 are possibly false alarms; the per-centage of these pixels tends to decrease with increasingthresholds.
E. Relative Gain and Quality of the Scatterers for a SingleLayover-Affected Building
In Fig. 16, we can clearly observe the tradeoff between thequantity and the quality of the scatterers for the case of a single(layover-affected) building as well. In order that the qualityof the single scatterers obtained with tomography is on a parwith the quality of the PSs identified with IPTA, we requireT1 = T2 >= 0.55, which allows in this case around 10% gainin deformation sampling relative to the PSI solution. For thresh-olds above 0.6, we have too few detections to compute thestatistics. Keeping the thresholds at 0.4 would allow as muchas 31% gain but, of course, with a compromise in quality.
VI. CONCLUSION
In this paper, we have performed a case study on the useful-ness of single-look SAR tomography as an add-on to PSI forimproving deformation analysis in urban areas using an inter-ferometric stack of 50 TerraSAR-X images of an urban localityin Barcelona, Spain. Stripmap-mode images have been used inthis paper, keeping in view their wider prevalence comparedwith higher resolution imaging modes that are normally oper-
ated for a limited number of sites. A PSI analysis is performedusing the IPTA framework, and is followed by tomographicinversion on the phase-calibrated stack employing a single-lookBF-based merit function. The phase models for classical SARtomography (3-D SAR), differential tomography, and the onefurther extended to simultaneously model thermal expansion,are compared against each other with respect to their suitabilityin resolving layovers. The results obtained confirm that mod-eling thermal expansion of the scatterers, in addition to lineardeformation and elevation, is indeed critical for effective lay-over separations, especially in the case of high-rise buildings.
The PSI solution obtained with the IPTA framework offers afairly reasonable coverage. Even in layover areas, many pixelshave been identified as PSs (where one among the superposingscatterers tends to dominate the others and exhibits long termcoherence). At the same time, there is a significant number oflayover-affected pixels along the facades of the high-rise build-ings which have been either totally rejected in the PSI process-ing, or partially rejected in the sense that a second coherent scat-terer is present but has not been individually identified as a PS(since a PS is by definition a single dominant scatterer). Tomo-graphic inversion effectively resolves these layovers and thusprevents the aforementioned rejections. Therefore, while PSIsuffices for a large-scale deformation analysis, SAR tomogra-phy proves useful in performing a small-scale analysis for localinfrastructure by increasing deformation samples in layover-affected areas.
We have used a GLRT-based hypothesis testing (follow-ing the tomographic inversion) to detect single and doublescatterers in the observed scene. The impact of the detectionthresholds on both the quantity and the quality of the detectedscatterers has also been studied, and the relative gain in defor-mation sampling with layover separations is computed at differ-ent thresholds. The quality of the detected scatterers is assessedin terms of the RMS phase deviation between the measurements(SLC values) and the tomographic model fit, which is consistentwith the way the quality of the PSs is evaluated in the IPTA-based PSI processing. The results obtained highlight a tradeoffbetween the quantity and the quality; therefore, the choice ofthe detection thresholds has to be determined as a compromisebetween the desired values of the relative gain in deformationsampling and the corresponding quality. In order that the qualityof the overall detected scatterers is comparable to the qualityof the PSs identified with the PSI processing, the detectionprocess may become too restrictive to allow for a sufficientnumber of layover separations. With a moderate compromise,we obtain a relative gain in deformation sampling of 9.8%for the Diagonal Mar area, whereas the RMS phase deviationfor 99% of the detected double scatterers and single scatterers(in addition to the PSs) is below 1.1 rad (which is set as theupper limit to allow for the acceptance of a PSC in the finalPSI solution). For the double scatterers, the relative decreasein the RMS phase deviation by modeling a second scattererin addition to the first is 19% on average. This improvementin quality clearly indicates that even in case the first scattererwas identified as a PS with a PSI approach, SAR tomographyadditionally allows detecting the second scatterer and therebyoffers an improvement in the quality.

6136 IEEE TRANSACTIONS ON GEOSCIENCE AND REMOTE SENSING, VOL. 54, NO. 10, OCTOBER 2016
REFERENCES
[1] G. Vilardo, R. Isaia, G. Ventura, P. De Martino, and C. Terranova, “InSARpermanent scatterer analysis reveals fault re-activation during inflationand deflation episodes at Campi Flegrei caldera,” Remote Sens. Environ.,vol. 114, no. 10, pp. 2373–2383, Oct. 2010.
[2] A. Hooper, P. Segall, and H. Zebker, “Persistent scatterer interferometricsynthetic aperture radar for crustal deformation analysis, with applicationto Volcán Alcedo, Galápagos,” J. Geophys. Res. Solid Earth, vol. 112,no. B7, Jul. 2007, Art. no. B07407.
[3] R. Lanari, F. Casu, M. Manzo, and P. Lundgren, “Application of theSBAS-DInSAR technique to fault creep: A case study of the Haywardfault, California,” Remote Sens. Environ., vol. 109, no. 1, pp. 20–28,Jul. 2007.
[4] S. Bianchini et al., “Multitemporal evaluation of landslide movementsand impacts on buildings in San Fratello (Italy) by means of C-Band andX-Band PSI data,” Pure Appl. Geophys., vol. 172, no. 11, pp. 3043–3065,Apr. 2014.
[5] M. Crosetto, J. A. Gili, O. Monserrat, M. Cuevas-González, J. Corominas,and D. Serral, “Interferometric SAR monitoring of the Vallcebre landslide(Spain) using corner reflectors,” Natural Hazards Earth Syst. Sci., vol. 13,no. 4, pp. 923–933, 2013.
[6] B. Yu et al., “Subsidence detection by TerraSAR-X interferometry on anetwork of natural persistent scatterers and artificial corner reflectors,”Comput. Geosci., vol. 58, pp. 126–136, Aug. 2013.
[7] G. Herrera, R. Tomàs, F. Vicente, J. Lopez-Sanchez, J. Mallorquì, andJ. Mulas, “Mapping ground movements in open pit mining areas usingdifferential SAR interferometry,” Int. J. Rock Mech. Mining Sci., vol. 47,no. 7, pp. 1114–1125, Oct. 2010.
[8] R. Tomàs, G. Herrera, J. Delgado, J. Lopez-Sanchez, J. Mallorquì, andJ. Mulas, “A ground subsidence study based on DInSAR data: Calibrationof soil parameters and subsidence prediction in Murcia City (Spain),” Eng.Geol., vol. 111, no. 1–4, pp. 19–30, Feb. 2010.
[9] T. Strozzi, U. Wegmuller, C. Werner, A. Wiesmann, and V. Spreckels,“JERS SAR interferometry for land subsidence monitoring,” IEEE Trans.Geosci. Remote Sens., vol. 41, no. 7, pp. 1702–1708, Jul. 2003.
[10] A. Gabriel, R. Goldstein, and H. Zebker, “Mapping small elevationchanges over large areas: Differential radar interferometry,” J. Geophys.Res., Solid Earth, vol. 94, no. B7, pp. 9183–9191, Jul. 1989.
[11] D. Massonnet and T. Rabaute, “Radar interferometry: Limits and poten-tial,” IEEE Trans. Geosci. Remote Sens., vol. 31, no. 2, pp. 455–464,Mar. 1993.
[12] A. Ferretti, C. Prati, and F. Rocca, “Permanent scatterers in SAR inter-ferometry,” IEEE Trans. Geosci. Remote Sens., vol. 39, no. 1, pp. 8–20,Jan. 2001.
[13] C. Werner, U. Wegmüller, T. Strozzi, and A. Wiesmann, “Interferometricpoint target analysis for deformation mapping,” in Proc. IEEE Int. Geosci.Remote Sens. Symp., 2003, pp. 4362–4364.
[14] P. Blanco-Sánchez, J. J. Mallorquí, S. Duque, and D. Monells,“The Coherent Pixels Technique (CPT): An advanced DInSAR techniquefor nonlinear deformation monitoring,” Pure Appl. Geophys., vol. 165,pp. 1167–1193, Aug. 2008.
[15] A. Hooper, H. Zebker, P. Segall, and B. Kampes, “A new method for mea-suring deformation on volcanoes and other natural terrains using InSARpersistent scatterers,” Geophys. Res. Lett., vol. 31, no. 23, Dec. 2004,Art. no. L23611.
[16] B. M. Kampes and N. Adam, “The STUN algorithm for persistentscatterer interferometry,” in Proc. FRINGE Workshop, 2006, vol. 610,pp. 1–14.
[17] M. Crosetto, O. Monserrat, R. Iglesias, and B. Crippa, “Persistent scat-terer interferometry: Potential, limits and initial C- and X-band compar-ison,” Photogramm. Eng. Remote Sens., vol. 76, no. 9, pp. 1061–1069,2010.
[18] N. Adam, A. Parizzi, M. Eineder, and M. Crosetto, “Practical persistentscatterer processing validation in the course of the Terrafirma project,”J. Appl. Geophys., vol. 69, no. 1, pp. 59–65, Sep. 2009.
[19] S. Gernhardt, N. Adam, M. Eineder, and R. Bamler, “Potential of veryhigh resolution SAR for persistent scatterer interferometry in urbanareas,” Ann. GIS, vol. 16, pp. 103–111, Aug. 2010.
[20] A. Ferretti, M. Bianchi, C. Prati, and F. Rocca, “Higher-order permanentscatterers analysis,” EURASIP J. Adv. Signal Process., vol. 2005, no. 20,pp. 3231–3242, 2005.
[21] A. Reigber and A. Moreira, “First demonstration of airborne SAR to-mography using multibaseline L-Band data,” IEEE Trans. Geosci. RemoteSens., vol. 38, no. 5, pp. 2142–2152, Sep. 2000.
[22] F. Gini, F. Lombardini, and M. Montanari, “Layover solution in multibase-line SAR interferometry,” IEEE Trans. Aerosp. Electron. Syst., vol. 38,no. 4, pp. 1344–1356, Oct. 2002.
[23] G. Fornaro, F. Serafino, and F. Soldovieri, “Three-dimensional focusingwith multipass SAR data,” IEEE Trans. Geosci. Remote Sens., vol. 41,no. 3, pp. 507–517, Mar. 2003.
[24] O. Frey and E. Meier, “3-D time-domain SAR imaging of a forest us-ing airborne multibaseline data at L-and P-bands,” IEEE Trans. Geosci.Remote Sens., vol. 49, no. 10, pp. 3660–3664, Oct. 2011.
[25] O. Frey, I. Hajnsek, U. Wegmüller, and C. Werner, “SAR tomographybased 3-D point cloud extraction of point-like scatterers in urban areas,”in Proc. IEEE Int. Geosci. Remote Sens. Symp., 2014, pp. 1313–1316.
[26] G. Fornaro, F. Lombardini, A. Pauciullo, D. Reale, and F. Viviani,“Tomographic processing of interferometric SAR data: Developments,applications, and future research perspectives,” IEEE Signal Process.Mag., vol. 31, no. 4, pp. 41–50, Jul. 2014.
[27] F. Lombardini, M. Montanari, and F. Gini, “Reflectivity estimation formultibaseline interferometric radar imaging of layover extended sources,”IEEE Trans. Signal Process., vol. 51, no. 6, pp. 1508–1519, Jun. 2003.
[28] F. Lombardini, F. Cai, and D. Pasculli, “Spaceborne 3-D SAR tomographyfor analyzing garbled urban scenarios: Single-look superresolution ad-vances and experiments,” IEEE J. Sel. Topics Appl. Earth Observ. RemoteSens., vol. 6, no. 2, pp. 960–968, Apr. 2013.
[29] X. Zhu and R. Bamler, “Superresolving SAR tomography for multidi-mensional imaging of urban areas: Compressive sensing-based TomoSARinversion,” IEEE Signal Process. Mag., vol. 31, no. 4, pp. 51–58, Jul. 2014.
[30] X. Zhu and R. Bamler, “Very high resolution spaceborne SAR tomogra-phy in urban environment,” IEEE Trans. Geosci. Remote Sens., vol. 48,no. 12, pp. 4296–4308, Dec. 2010.
[31] F. Lombardini, “Differential tomography: A new framework for SAR inter-ferometry,” IEEE Trans. Geosci. Remote Sens., vol. 43, no. 1, pp. 37–44,Jan. 2005.
[32] F. Lombardini, “Differential tomography: A new framework for SAR inter-ferometry,” in Proc. IEEE Int. Geosci. Remote Sens. Symp., 2003, vol. 2,pp. 1206–1208.
[33] G. Fornaro, F. Reale, and D. Serafino, “Four-dimensional SAR imagingfor height estimation and monitoring of single and double scatterers,”IEEE Trans. Geosci. Remote Sens., vol. 47, no. 1, pp. 224–237, Jan. 2009.
[34] A. De Maio, G. Fornaro, and A. Pauciullo, “Detection of single scatterersin multidimensional SAR imaging,” IEEE Trans. Geosci. Remote Sens.,vol. 47, no. 7, pp. 2284–2297, Jul. 2009.
[35] X. Zhu and R. Bamler, “Compressive sensing for high resolution differ-ential SAR tomography—The SL1MMER algorithm,” in Proc. IEEE Int.Geosci. Remote Sens. Symp., 2010, pp. 17–20.
[36] D. Reale, G. Fornaro, A. Pauciullo, X. Zhu, and R. Bamler, “Tomographicimaging and monitoring of buildings with very high resolution SAR data,”IEEE Geosci. Remote Sens. Lett., vol. 8, no. 4, pp. 661–665, Jul. 2011.
[37] F. Lombardini and M. Pardini, “Superresolution differential tomography:Experiments on identification of multiple scatterers in spaceborne SARdata,” IEEE Trans. Geosci. Remote Sens., vol. 50, no. 4, pp. 1117–1129,Apr. 2012.
[38] A. Pauciullo, D. Reale, A. De Maio, and G. Fornaro, “Detection of doublescatterers in SAR tomography,” IEEE Trans. Geosci. Remote Sens.,vol. 50, no. 9, pp. 3567–3586, Sep. 2012.
[39] O. Monserrat, M. Crosetto, M. Cuevas, and B. Crippa, “The thermalexpansion component of persistent scatterer interferometry observations,”IEEE Geosci. Remote Sens. Lett., vol. 8, no. 5, pp. 864–868, Sep. 2011.
[40] U. Wegmuller and C. Werner, “Mitigation of thermal expansion phase inpersistent scatterer interferometry in an urban environment,” in Proc. JointUrban Remote Sens. Event, Mar. 2015, pp. 1–4.
[41] X. Zhu and R. Bamler, “Let’s do the time warp: Multicomponent non-linear motion estimation in differential SAR tomography,” IEEE Geosci.Remote Sens. Lett., vol. 8, no. 4, pp. 735–739, Jul. 2011.
[42] Y. Wang, X. Zhu, and R. Bamler, “An efficient tomographic inversionapproach for urban mapping using meter resolution SAR image stacks,”IEEE Geosci. Remote Sens. Lett., vol. 11, no. 7, pp. 1250–1254, Jul. 2014.
[43] M. Siddique, I. Hajnsek, U. Wegmüller, and O. Frey, “Towards the in-tegration of SAR tomography and PSI for improved deformation assess-ment in urban areas,” in Proc. FRINGE Workshop, 2015, pp. 1–6.
[44] M. Siddique, I. Hajnsek, U. Wegmüller, and O. Frey, “Investigating thecombined use of differential SAR tomography and PSI for spatio-temporalinversion,” in Proc. Joint Urban Remote Sens. Event, 2015, pp. 1–4.
[45] D. Reale, G. Fornaro, and A. Pauciullo, “Extension of 4-D SAR imagingto the monitoring of thermally dilating scatterers,” IEEE Trans. Geosci.Remote Sens., vol. 51, no. 12, pp. 5296–5306, Dec. 2013.
[46] O. Frey, F. Morsdorf, and E. Meier, “Tomographic imaging of a forestedarea by airborne multi-baseline P-Band SAR,” Sensors, vol. 8, no. 9,pp. 5884–5896, Sep. 2008.
[47] O. Frey and E. Meier, “3D SAR imaging of a forest using airborneMB-SAR data at L-and P-band: Data processing and analysis,” in Proc.Euro. Conf. SAR, 2010, pp. 1–4.

SIDDIQUE et al.: SINGLE-LOOK SAR TOMOGRAPHY AS ADD-ON TO PSI 6137
[48] F. Gini and F. Lombardini, “Multibaseline cross-track SAR interferometry:A signal processing perspective,” IEEE Aerosp. Electron. Syst. Mag.,vol. 20, no. 8, pp. 71–93, Aug. 2005.
[49] G. Fornaro, A. Pauciullo, D. Reale, and S. Verde, “Multilook SAR tomog-raphy for 3-D reconstruction and monitoring of single structures appliedto COSMO-SKYMED data,” IEEE J. Sel. Topics Appl. Earth Observ.Remote Sens., vol. 7, no. 7, pp. 2776–2785, Jul. 2014.
[50] G. Fornaro, S. Verde, D. Reale, and A. Pauciullo, “CAESAR: An approachbased on covariance matrix decomposition to improve multibaseline-multitemporal interferometric SAR processing,” IEEE Trans. Geosci.Remote Sens., vol. 53, no. 4, pp. 2050–2065, Apr. 2015.
[51] O. Frey, I. Hajnsek, and U. Wegmuller, “Spaceborne SAR tomography inurban areas,” in Proc. IEEE Int. Geosci. Remote Sens. Symp., Jul. 2013,pp. 69–72.
[52] G. Fornaro, F. Lombardini, and F. Serafino, “Three-dimensional multi-pass SAR focusing: Experiments with long-term spaceborne data,” IEEETrans. Geosci. Remote Sens., vol. 43, no. 4, pp. 702–714, Apr. 2005.
[53] X. Zhu and R. Bamler, “Super-resolution power and robustness of com-pressive sensing for spectral estimation with application to spacebornetomographic SAR,” IEEE Trans. Geosci. Remote Sens., vol. 50, no. 1,pp. 247–258, Jan. 2012.
[54] X. Zhu and R. Bamler, “Tomographic SAR inversion by L1-normregularization—The compressive sensing approach,” IEEE Trans. Geosci.Remote Sens., vol. 48, no. 10, pp. 3839–3846, Oct. 2010.
[55] D. Massonnet and K. Feigl, “Radar interferometry and its application tochanges in the Earth’s surface,” Rev. Geophys., vol. 36, no. 4, pp. 441–500,Nov. 1998.
[56] F. Lombardini and F. Gini, “Model order selection in multi-baseline inter-ferometric radar systems,” EURASIP J. Adv. Signal Process., vol. 2005,pp. 3206–3219, 2005.
[57] G. Fornaro and F. Serafino, “Imaging of single and double scatterers inurban areas via SAR tomography,” IEEE Trans. Geosci. Remote Sens.,vol. 44, no. 12, pp. 3497–3505, Dec. 2006.
[58] C. Colesanti, A. Ferretti, F. Novali, C. Prati, and F. Rocca, “SAR monitor-ing of progressive and seasonal ground deformation using the permanentscatterers technique,” IEEE Trans. Geosci. Remote Sens., vol. 41, no. 7,pp. 1685–1701, Jul. 2003.
[59] U. Wegmuller, “Automated terrain corrected SAR geocoding,” in Proc.IEEE Int. Geosci. Remote Sens. Symp., 1999, vol. 3, pp. 1712–1714.
[60] O. Frey, M. Santoro, C. L. Werner, and U. Wegmuller, “DEM-based SARpixel area estimation for enhanced geocoding refinement and radiometricnormalization,” IEEE Geosci. Remote Sens. Lett., vol. 10, no. 1, pp. 48–52,Jan. 2013.
[61] U. Wegmuller, O. Frey, and C. Werner, “Point density reduction in per-sistent scatterer interferometry,” in Proc. Eur. Conf. SAR, Apr. 2012,pp. 673–676.
[62] U. Wegmuller, D. Walter, V. Spreckels, and C. Werner, “Nonuniformground motion monitoring with TerraSAR-X persistent scatterer interfer-ometry,” IEEE Trans. Geosci. Remote Sens., vol. 48, no. 2, pp. 895–904,Feb. 2010.
[63] C. Werner, U. Wegmuller, A. Wiesmann, and T. Strozzi, “Interferometricpoint target analysis with JERS-1 L-band SAR data,” in Proc. IEEE Int.Geosci. Remote Sens. Symp., Jul. 2003, vol. 7, pp. 4359–4361.
Muhammad Adnan Siddique (M’12–S’14–S’16)received the B.E. degree in electronics engineer-ing from the National University of Sciences andTechnology, Islamabad, Pakistan, in 2006 and theEuropean Master of Research in Information andCommunications Technology (MERIT) joint de-gree from the Karlsruhe Institute of Technology,Karlsruhe, Germany and Universitat Politcnica deCatalunya, Barcelona, Spain through an ErasmusMundus Scholarship. He is currently working towardthe Doctoral degree at the Chair of Earth Observation
and Remote Sensing, Swiss Federal Institute of Technology (ETH), Zurich,Switzerland.
From 2007 to 2008, he worked as a radio-frequency (RF) planning engineer.In Fall 2010, he joined the Department of Electrical Engineering, COMSATSInstitute of Information Technology, Lahore, Pakistan, as a Lecturer. His currentresearch interests include synthetic aperture radar tomographic techniques fordeformation assessment in urban areas.
Mr. Siddique received the President’s Gold Medal for securing the highestcumulative GPA in his class during his undergraduate years.
Urs Wegmüller (SM’03) received the M.S. andPh.D. degrees in physics from the University of Bern,Bern, Switzerland, in 1986 and 1990, respectively.
Between 1991 and 1992, he was with the JetPropulsion Laboratory, Pasadena, CA, USA, andbetween 1993 and 1995, with the University ofZürich, Zürich, Switzerland. In 1995, he was aFounding Member of GAMMA Remote SensingAG (GAMMA), a Swiss company active in thedevelopment of signal processing techniques andremote sensing applications. As the Chief Executive
Officer of GAMMA, he has overall responsibility for GAMMA’s activities.Currently, his main involvement is in the development of applications andthe definition and implementation of related services in land surface deforma-tion mapping, hazard mapping, land use mapping, and topographic mapping.He is/was a Principal Investigator for projects supported by the European SpaceAgency and the European Commission Framework programs.
Irena Hajnsek (A’01–M’06–SM’09–F’14) receivedthe Dipl. (Honors) degree from the Free University ofBerlin, Berlin, Germany, in 1996 and the Dr. (Hons.)degree from the Friedrich Schiller University of Jena,Jena, Germany, in 2001.
She is currently a Professor of Earth observa-tion and remote sensing with the Institute of En-vironmental Engineering, Swiss Federal Institute ofTechnology (ETH) Zurich, Zurich, Switzerland, andthe Head of the Polarimetric SAR InterferometryResearch Group, Microwaves and Radar Institute,
German Aerospace Center, Wessling, Germany. Since 2010, she has been theScience Coordinator of the German satellite mission TanDEM-X. Her mainresearch interests are in electromagnetic propagation and scattering theory,radar polarimetry, SAR and interferometric SAR data processing techniques,and environmental parameter modeling and estimation.
Dr. Hajnsek has been a member of the IEEE Geoscience and Remote Sens-ing Society Administrative Committee since 2013. She served as the TechnicalProgram Cochair of the IEEE International Symposium on Geoscience andRemote Sensing in 2012.
Othmar Frey (S’04–M’08) received the M.Sc.(Hons.) degree in geomatic engineering from theSwiss Federal Institute of Technology (ETH),Zurich, Switzerland, in 2002, and the Dr. sc. nat.(Hons.) degree in radar remote sensing from theUniversity of Zurich, Zurich, Switzerland, in 2010.
From 2002 to 2010, he was a Research Associatewith the Remote Sensing Laboratories, University ofZurich. Since January 2011, he has been with ETHZurich, as a Senior Research Fellow and Lecturer,and with GAMMA Remote Sensing AG, Gümligen,
Switzerland, as a Senior Project Scientist. He has been active in variousnational and international research projects, as a Principal Investigator (PI)and Project Manager as well as a Co-Investigator, among them, the jointindustry-academic project “GAMMA Software Module for Spaceborne SARTomography,” in the role of the PI and Project Manager. At GAMMA, he hasalso been active in the development of the Gamma software and in technicalconsulting related to SAR imaging and interferometric applications. He hasbeen a member of the Science Expert Group for ESA’s SAOCOM-CS compan-ion satellite mission since 2014. His research interests include 2-D and 3-D(tomographic) SAR focusing techniques and interferometric techniques forapplications such as 3-D forest mapping, ground deformation monitoring (persis-tent scatterer interferometry/differential tomography), and profiling the struc-ture of snowpacks, using spaceborne, airborne, and ground-based radar sensors.
Dr. Frey has been serving as the Chair of the Swiss Chapter of theIEEE Geoscience and Remote Sensing Society since 2015. He received theDistinction Award and Prize of the Faculty of Science, University of Zurich,for his Ph.D. thesis, in 2010 and the ETH medal for an outstanding M.Sc.thesis in 2002. He also received the Third Place Student Paper Award at the2010 EUSAR Conference in Aachen, Germany. He was a corecipient of theBest Paper Award at the ISPRS Workshop Laserscanning and Silvilaser 2007in Helsinki, Finland.