single molecule localisation microscopy by photoconversion
TRANSCRIPT

___________________________________________________
Single molecule localisation microscopy by
photoconversion and dynamic labelling using
DNA-binding dyes resolves chromatin
compaction in model ischemia
___________________________________________________
Dissertation
zur Erlangung des akademischen Grades
Doctor rerum naturalium (Dr. rer. nat)
im Fachbereich Biologie
eingereicht an der
Johannes-Gutenberg Universitat Mainz
Aleksander Szczurek
Geb. am 31. October 1989 in Krakau, Polen
Mainz, 20. December 2016,


1
Content
1. Abstract ...................................................................................................................................... 4
2. Zusammenfassung ..................................................................................................................... 5
3. Introduction................................................................................................................................ 7
3.1 Fluorescence emissionas a consequence of transition between electronic states .................... 7
3.2 Fluorescence microscopy, diffraction limit, and resolution ................................................... 10
3.3 Localisation of a single point-like light emitter ..................................................................... 11
3.4 Introduction to single molecule localisation microscopy ...................................................... 13
3.5 Switching mechanism in direct STORM and design of imaging media ................................ 16
3.6 Design of an imaging environment for fluorophorephotoswitching based on non-emitting
state formation ............................................................................................................................. 18
3.7 Fluorescent DNA-binding dyes ............................................................................................. 20
3.8 DNAimaging with super-resolution microscopy ................................................................... 24
3.9 Photoconversion of benzimidazole-based DNA dyes and Vybrant Violet ............................ 25
3.10 Review on chromatin organisation in the cell nucleus ........................................................ 27
3.11 Microscopic methods to investigate chromatin organisation ............................................... 31
3.11.1 Electron microscopy ..................................................................................................... 31
3.11.2 Fluorescence microscopy image analysis ..................................................................... 31
3.11.3 Kinetics of DNase I chromatin digestion ...................................................................... 31
3.11.4 Fluorescence recovery after photobleaching (FRAP) of chromatin associated proteins
................................................................................................................................................. 31
3.11.5 Fluorescence life time imaging of histone proteins ...................................................... 32
3.11.6 Fluorescence correlation spectroscopy ......................................................................... 32
3.12Introduction to ischemia ....................................................................................................... 32
3.12.1 Ischemic disease ........................................................................................................... 32
3.12.2 Specification of an injury in myocardial infarction ...................................................... 33
3.12.3 Reperfusionfollowing a myocardial infarction ............................................................. 34
3.12.4 Epigenetic contribution to ischemia-reperfusion in myocardial infarction .................. 34
4. Objectives of the work presented in the thesis......................................................................... 35
5. Materials and Methods ............................................................................................................ 36
5.1 Cell culture ............................................................................................................................ 36
5.2 Oxygen and Nutrient Deprivation (OND) protocol for ischemia model ............................... 36
5.3 Immunofluorescent staining protocols................................................................................... 37
5.4 Confocal microscopy ............................................................................................................. 37
5.5 Fluorescence recovery after photobleaching (FRAP) ............................................................ 38
5.6 DNase I digestion susceptibility assay................................................................................... 39
2
5.7 Super-resolution single molecule localisation microscopy (SMLM) ..................................... 39
5.7.1 SMLM sample preparation .............................................................................................. 39
5.7.2 Measurements .................................................................................................................. 40
5.7.3 Data analysis and visualisation ........................................................................................ 41
6. Results ...................................................................................................................................... 43
6.1 Publication 1 ........................................................................................................................... 45
6.2 Publication 2 ........................................................................................................................... 47
6.3 Publication 3 ........................................................................................................................... 49
6.4 Publication 4 ........................................................................................................................... 51
6.5 Chromatin structure in OND can be affected ......................................................................... 53
6.5.1 Histone dynamics in OND can be affected by inhibition of specific enzymes ............... 53
6.5.2 fBALM of cells treated with inhibitors of polyamine synthesis and histone deacetylation
.................................................................................................................................................. 55
7. Discussion ................................................................................................................................. 56
7.1 Methodological advancement of chromatin imaging using single molecule localisation
microscopy ................................................................................................................................... 56
7.1.1 SMLM using photoconversion of Hoechst and VybrantViolet dyes to their green-
emitting forms .......................................................................................................................... 56
7.1.2DNA structure fluctuation assisted binding activated localisation microscopy (fBALM)
.................................................................................................................................................. 58
7.2 Chromatin labelling strategies for super-resolution single molecule localisation microscopy
...................................................................................................................................................... 61
7.3 Chromatin at super-resolution and compatibility of the results with existent data on
chromatin structure ....................................................................................................................... 63
7.4 Ischemia induces DNA compaction within minutes .............................................................. 68
7.5 Dynamic chromatin structure in reperfusion .......................................................................... 70
7.6 Model of DNA compaction in ischemia ................................................................................. 70
7.7 Hypothetical role of chromatin compaction in ischemia ........................................................ 73
7.8 Potential chromatin condensation in starvation and in tumour............................................... 74
7.9 Potential experimental issues.................................................................................................. 75
8. Conclusions .............................................................................................................................. 76
9. References ................................................................................................................................ 77
10. Associated publications ........................................................................................................ 89
11. Appendix I: abbreviations .................................................................................................... 90
12. Eidesstattliche Erklärung ...................................................................................................... 92

3

4
1. Abstract
Single molecule localisation microscopy (SMLM) is a method based on switching and subsequent
nanometre-precision localisation of isolated fluorophore signals for super-resolution fluorescence
microscopy. Thus far, this method has been successfully applied to imaging of various cellular
structures including e.g. cytoskeleton, mitochondria, neuronal axons and many others, revealing
manifold previously unknown cellulardetails. Strikingly, SMLM was applied to the DNA study
only to a minor degree. Whereas a higher order DNA (chromatin) organisation in the cell nucleus
still remainspuzzling, previous studies using SMLM focusedrather on imaging of isolated DNA
molecules in vitro.
In this work novel solutions for super-resolution DNA imaging in eukaryotic cell nuclei were
developed utilising SMLM principles. First approach relies on UV-induced photoconversion of
DNA-binding Hoechst and DAPI dyes. By applying low intensity near-UV light a stochastic
photoconversion of DNA-bound dyes occurs and single molecule signals can be discriminated
based on spectral properties. Second approach utilises a previously developed dynamic DNA
labelling (Binding Activated Localisation Microscopy) with directly binding dyes that upon
transient association with the DNA become fluorescent. In turn, while dynamically dissociated are
non-fluorescent. In this study different aspects of DNA chemistry andDNA-binding werestudied to
enhance understanding of BALM mechanism and to facilitate applicationextensionto the nuclei of
mammals and rodents. Both methods led to 3 – 5 fold improvement in resolution as compared to a
conventional fluorescence imaging.
Chromatin, a complex of DNA and proteins, is known to directly respond and adapt to changes in
environmental conditions just as temperature, ionic strength and many others. Currently among
diseases involving such environmental balance disruptions, ischemia, a blood
insufficiency,is1st(cardiovascular disease) and 2
nd(stroke) cause of death worldwide according to
the World Health Organisation.Knowing that epigenetic landscape in ischemia undergoes a
massive remodelling e.g. involving a general deacetylation of chromatin, we anticipated that
chromatin structure undergoes a change. We tested this hypothesis using aforementioned
superresolution microscopy methodology. This approach revealed previously unknown chromatin
condensation towards a nuclear periphery. In support we found that ischemic chromatin bore a
decreased DNase Idigestion susceptibility and decreased linker histone H1dynamics. We
hypothesise that thesource of chromatin condensation are polyamines and divalent cations
otherwise complexed with ATP. Upon ATP depletion in ischemia they would relocate to the cell
nucleus and bind to negatively charged DNA inducing its compaction.
The results presented in this dissertation have an impact on better understanding and interpretation
of previous studies on ischemiaand may help to design a future therapy based on a novel aspect.
The super-resolution methodologymay prove useful for studying effects of other environmental
factorse.g. oxidative stress or to investigate chromatin texture in cancerous cells to assess their
malignancy.

5
2. Zusammenfassung
Single Molecule Localization Mikroskopie (SMLM) basiert auf der Methode einzelne Fluorophore
an- und auszuschalten und sie so nanometergenau zu lokalisieren. Diese Methode wurde bereits zur
Untersuchung verschiedener biologischer Strukturen, wie z.B. dem Zytoskelett, Mitochondrien und
neuronaler Axone verwendet und deckte bisher unbekannte molekulare Details auf. Obwohl die
Organisation der DNA im Zellkern uns nach wie vor Rätsel aufgibt, wurde die DNA mittels
SMLM nur wenig untersucht – überwiegend wurden isolierte DNA-Moleküle in vitro analysiert,
nachdem sie mit DNA-bindenden Farbstoffen versetzt wurden.
In der vorliegenden Arbeit wurden SMLM-Prinzipien angewendet, um neue Ansätze für
hochauflösende Aufnahmen der DNA in eukaryotischen Zellkernen zu erarbeiten. In dieser Studie
wurden zwei Ansätze verfolgt, die auf verschiedenen physikalischen Prinzipien beruhen. Der erste
Ansatz basiert auf UV-induzierter Photokonversion der DNA-Farbstoffe Hoechst und DAPI, die
beide an die kleine Furche der DNA binden. Bestrahlt man die gefärbte DNA mit Licht von
geringer Intensität nahe dem UV-Spektrum, findet eine stochastische Photokonvertierung des
gebundendenen Farbstoffs statt und Signale einzelner Moleküle können mittels ihrer speziellen
spektralen Eigenschaften unterschieden werden. Der zweite Ansatz macht sich eine bereits
entwickelte Technik zu Nutze, bei der dynamisch bindende DNA-Farbstoffe verwendet werden,
die nur im vorübergehenden gebundenen Zustand fluoreszieren. Diese Methode wird
bindungsaktivierte Lokalisationsmikroskopie (BALM) genannt und wurde bisher noch nicht in
eukaryotischen Zellkernen angewendet. In der vorliegenden Arbeit wurden verschiedene Aspekte
der DNA-Chemie und Bindungsverhalten untersucht, um die zu Grunde liegenden Mechanismen
von BALM aufzuklären und eine erweiterte Anwedung von BALM auf Strukturen des Chromatin
im Zellkern zu vereinfachen. Beide Ansätze bewirkten eine verbesserte Auflösung in der
Größenordnung 3 – 5, verglichen mit konventioneller Fluoreszenzmikroskopie der DNA.
Das Chromatin ist ein Komplex bestehend aus DNA und Proteinen und ist in der Lage, direkt auf
Veränderungen der Umwelt reagiert, wie z.B. die Temperatur oder den Salzgehalt und sich den
veränderten Bedingungen anpassen kann. Eine Ischämie bewirkt durch mangelnde Blutversorgung
eine Änderung des Milieus und ist laut der Weltgesundheitsorganisation Todesursache Nummer
eins und zwei und verantwortlich für 30% aller Todefälle weltweit.
Es wurde gezeigt, dass sich die epigenetische Landkarte während einer Ischämie massiv verändert
und u.a. zu einer generellen Deacetylierung des Chromatins führt. Demnach ist es naheliegend
anzunehmen, dass sich auch die Struktur des Chromatins unter diesen Umständen verändert. Um
die Struktur der DNA während einer Ischämie in kultivierten Zellen näher zu untersuchen, wurde
eine Methode zur Hochauflösungsmikroskopie entwickelt. Dieser Mikroskopieansatz zeigte eine
bisher noch nicht beschriebene Kondensation des Chromatins an der nukleären Peripherie. Ein
verminderter Verdau durch das Enzym DNase I und die Abnahme der Mobilität des
Verbindungshistons H1 unterstützten diese Beobachtung. Wir stellten die Hypothese auf, dass der
Grund für die Kondensierung des Chromatins Polyamine sind. Diese zweifach geladene Kationen
sind unter normalen Umständen and ATP gebunden. Wird ATP nun während der Ischämie
abgebaut, werden die freien Polyamine von der negativ geladenen DNA im Zellkern angezogen
und ihre Bindung induziert das Verklumpen der DNA.
Die Ergebnisse dieser Arbeit tragen zum besseren Verständnis und zur Interpretation
vorangehender molekularer Studien über Ischämie bei und basierend auf den beschriebenen

6
Konsequenzen können neuartige Therapien entwickelt werden. Die Methode der
Hochauflösungsmikroskopie für DNA-Farbstoffe kann weiterhin verwendet werden, um den Effekt
anderer Umweltfaktoren, ähnlich dem oxidativen Stress, zu analysieren oder die Struktur des
Chromatins in Krebszellen zu untersuchen, um ihre Malignität zu bestimmen.

7
3. Introduction
In order to introduce a reader to the subject of chromatin super-resolution microscopy the
introduction has been conceived as follows. First, a physicochemical concept of fluorescence is
introduced. In the next step a reader is guided through the basics of conventional fluorescence
microscopy andits resolution constraints. This is accompanied by single fluorescentobject
localisation in space. Subsequently, reader is acquainted with photochemistry of single fluorophore
switching between its non- and fluorescent states and the utility of this approach for achieving
enhanced resolution. In the next steps, physical properties of DNA-binding fluorescent dyes of
various binding modes are described together with their contemporary applications to super-
resolution microscopy. As these molecules will be utilised to study chromatin throughout this
work, in the following section an available knowledge on DNA and chromatin arrangement on
various organisational levels is reviewed. This includes “beads-on-string” model, topologically
associated chromatin domains and chromosome territories. Finally, an epigenetic background on
chromatin biology in ischemic disease is highlighted with a particular emphasis on myocardial
infarction as a main subject of the study.
3.1 Fluorescence emissionas a consequence of transition between electronic
states
Fluorescent molecules (also termed fluorophores) that will be a subject to the discussion in this
section bear typically aromatic structure ample with conjugated planar,linear,orring system of
double covalent bonds between carbon atoms (2valence electrons per bond). Here, I introduce the
basic principles underlying light absorption and fluorescence emission.
The electron (e-) has a mass of 1/1836 of a mass of a proton and its position within chemical
molecule cannot be estimated with an infinite precision(Heisenberg, 1927). As a solution to this
issue a mathematical function has been proposed to approximate probability to find an electron in
any specific location around the atom nucleus. This function is often termed as a molecular orbital,
and as will become clear in few moments, describes features crucial for a description ofa chemical
bond formation and an assembly of a fluorescent molecule.
In aromatic, conjugated systems such as fluorophores, one electron pair forms relatively strongσ-
bond between carbon atoms (see benzene as an example, Fig. 1B). Creation of a secondanda third
bond (e.g. π-bond) is also possible, but proceeds differently from the first one as each electron in
the atom is described by a different molecular orbital and resides in a different quantum state. This
complexity results invaryingproperties of electron pair involved in π-bond formation leading to so-
called electron delocalisation. In conjugated systems just as fluorescent molecules, this electron
delocalisation results ina formation of a common electronic cloud above and below the aromatic
plane (Fig. 1B). This electronic conjunctionconstitutes basis for light absorption as delocalised
electrons may absorb light of lower energy, equal to energy difference between highest occupied
molecular orbital (HOMO) and lowest unoccupied molecular orbital (LUMO).This energy
difference is smaller for delocalised electrons within π–bonds than for electrons in σ-bonds, and
therefore visible light is of sufficient energy to induce this transition. Consequently, light
absorption constitutes an inherent capability of conjugated atomic systems as fluorophores(Sauer et
al., 2011).

8
In order to quantitatively describe the ability of a fluorescent molecule to absorb light extinction
coefficient ε has been introduced. According to the Beer-Lamberts law,absorbance A can be
expressed by the following simple equation:
𝐴 = εcl
where c corresponds to the concentration of a fluorescent probe and l stands for light path‟slength
through the solution of the substance under investigation. Knowing the latter two, one is able to
measure the absorbance and consequently further estimate the extinction coefficient of any
substance. In biological research fluorescent compounds of higher extinction coefficient are
desireddue to their ability to provide higher photon output as a result of an increased
absorbtivity,altogether leading to a betterdetection sensitivity.
Once a fluorophore molecule underwent an excitation it bears higher energy that is stored in its
electronic state. Thereafter, an internal conversion occurs (transitions from excited vibrational
singlet states Sn (for n > 1) to lowest exited singlet state S1) with a coincident heat dissipation. As a
result of this process the electronic state loses a part of the energy that was originally absorbed and
consequently fluorescent photon emitted will have a lower energy; therefore, emission wavelengths
are longerthan the absorbed exciting wavelengths.
The fluorescence is not a sole mechanism of de-excitation to the ground state S0 and many other
processes should be taken into account. Among them are: solvent relaxation slightly decreasing the
energy of S1 state and dynamic (collisions) as well as static quenching via excited state interaction
with other compounds present in the environment. These effects on fluorescent properties is easily
measurable as it directly influences the energy gap between the excited S1 state and a ground S0
state what is commonly reflected in the alteration to the fluorescence emission spectrum
(Lakowicz, 2006; Sauer et al., 2011).
Consequently, in order to investigate effects of other de-excitation processes another quantitative
measure has been introduced tocharacterise quantitatively fluorophore ability to fluoresce. This
normalised measure is termedas quantum yield and is equal to how many times a photon emission
may occur per single absorption event. Anotherwords, it tells how susceptible a fluorophore in
excited state is to other de-excitation processes than fluorescence. Among most pronounced ones
are aforementioned quenching, solvent relaxation, or fluorescence resonance energy transfer
(FRET). The design of novel fluorescent probes thus aims at elevating the quantum yield at a value
near1.0.

9
Figure 1.Hybridisation of molecular orbitals in a carbon atom and chemical bond formation in
fluorescent probes.A) An example for an electron configuration of carbon in its ground state (C) and
in its excited state (C*) where 4 e- reside in a valence shell (each arrow represents 1 electron). Carbon
excitation is promoted as it enables formation of more bonds leading to a decrease in total energy of the
system.In the excited statean electronoriginating from 2s level underwent transient to 2p level giving a
rise to 4 unpaired electrons constituting grounds for bond formation in methane (CH4). Here,
hybridisation results in formation of a tetrahedric sp3 configuration. In turn, for ethene (CH2=CH2)
hybridisation of a carbon atom proceeds differently, i.e. is valid only for one e- from 2s level and for
two e- from 2p level that together contribute to 2p
2 configuration. As a result anelectron distribution in
space becomes planar and a single σ bond involving 2 e- may be generatedbetween two carbon atoms in
ethene (B, top image). The rest of 2p2 orbitals forms sigma bonds with hydrogen atoms (for clarity not
shown). A remaining third e- from 2pz level (intact orbital) constitutes basis for a π bond located above
and below the shortest distance spacing both carbon nuclei in ethene. In case of aromatic benzene ring
(B, bottom image), due to sp2 hybridisation and generation of 6 π-bonds, a delocalised cloud of
electrons above and below a ring-plane is brought about (yellow). Such conjugated electronic
configuration is typical for fluorescent molecules and is responsible for their ability to absorb exciting
light. Pictures in (B) adapted from www.iapp.de

10
3.2 Fluorescence microscopy, diffraction limit, and resolution
This type of a light microscopy commonly used in cell biology takes advantage of fluorescence
properties of an object, namely the light emission from the sample instead of using light reflection
or absorption to study sample‟s structural features. Fluorescence microscopy is superior in terms of
a contrast and specificity of labelling as compared to e.g. transmitted light or differential contrast
microscopy, although several implementations have to be done in order to exploit it at its best.
Typically, all fluorescence microscopes are equipped with 3 crucial components. First among them
is a special light source, e.g. a mercury lamp emitting light at broad range of wavelengths (Fig.
2A). A specific excitation range is selected by filtering out any excessive part of a source spectrum
that does not suit fluorophore excitation maximum. This is done by insertion of an excitation filter.
Before the exciting light arrives at the objective lens directly pointing at the sample to be imaged,
the exciting light has to be reflected by a dichroic mirror (Fig. 2B). This mirror together with
perpendicular configuration of a light source and objective lens ensures that the emitted fluorescent
light of longer wavelengths will pass through and will be collected by a highly sensitive detector
(perpendicular to the light source). Additionally a fluorescence emission filter is used to prevent
the detector from unwanted illumination light. This turns out to be useful also in case when more
than one fluorophore present in a sample undergoes excitation with selected part of the light source
spectrum. Technically speaking, theseaccessories are implemented to the fluorescent microscope
often using cubes containing excitation filter, dichroic mirror, and fluorescence filterintegrated at
once (Fig. 2B).
Figure 2.A) Mercury lamp spectrum with visible peaks (image obtained from cair-research.co.uk).B) A
typical integrated filter cube with arrows indicating direction of light travel from the light source, after
reflection by dichroic mirror towards an objective lens. After exciting fluorophores in a sample,
fluorescent photons are transmitted through the dichroic mirror and arrive at the detector(image
obtained from olympus.micro.com, altered).
Any optical microscopy, including its fluorescence-based derivative, suffers from a so called
diffraction limit. Diffraction constitutes an innate feature of waves including electromagnetic ones

11
just as light.In the context of resolution limit diffraction was first described by Ernst Abbe in
1873(Abbe, 1873):
𝑑 =𝜆
2𝑛𝑠𝑖𝑛(𝛼)
In this formula a resolution limit dor the minimal width of a resolvable structural feature is
proportional to the wavelength λ collected for imaging and inversely proportional to refractive
index n and the sine of an angle α corresponding to half angle of the acceptance cone of the light
detectable by an objective lens (α characterises a sphere fragment). This equation determines the
image obtained with an optical microscope. Therefore, an image of any point source of light (just
as a fluorescent probe) will be convolved with so-called point spread function (PSF) of a
microscope commonly termed as Airypattern (Fig. 3A). Depending on a fluorescence wavelength
λ, PSF diameter increases linearly with a reasonable approximation. Since fluorescent light most
often belongs to the visible part of a spectrum (~400 – 650 nm) the resolution limit amounts to
minimum ≥200 nm.
Figure 3. Diffraction limit of a fluorescent microscope.A) Theoretical point spread function ofa
fluorescence microscope. Height corresponds to signal intensity (I) distributed over 2D space (x,
y). B) Resolution limit depicted. Two infinitely small fluorescence sources (1 and 2) appear as
Airy patterns. The (Rayleigh) diffraction limit ddefines the shortest distance between two point
light sources at which they are still resolved (image credit: zeiss-campus.magnet.fsu.edu).
3.3 Localisation of a single point-like light emitter
Localisation of a single light emitter has proven to be useful in such studies as single particle
tracking (SPT) or single molecule localisation microscopy (SMLM, for details see next section).
Consequently, localisation precision was necessary to be investigated as it reflects the precision of
the measured features just as e.g. speed of molecular migration and diffusion (for SPT) or image
resolution (in SMLM).
As mentioned in the previous section the resolution of a microscope is limited due to the
diffraction of the light. Accordingly, fluorescing objects, evenif smaller than a diffraction limit,
will always be convolved with a point spread function determining their minimal size in the
fluorescent image to ~250-600 nm in a diameter depending on the fluorescence wavelength(Fig.
12
4D, left). In spite of the resolution limit that cannot be easily overcome without sophisticated
equipment implementations (Hell and Wichmann, 1994; Gustafsson, 2000), these objects can be
localised in space with a nanometre accuracy.
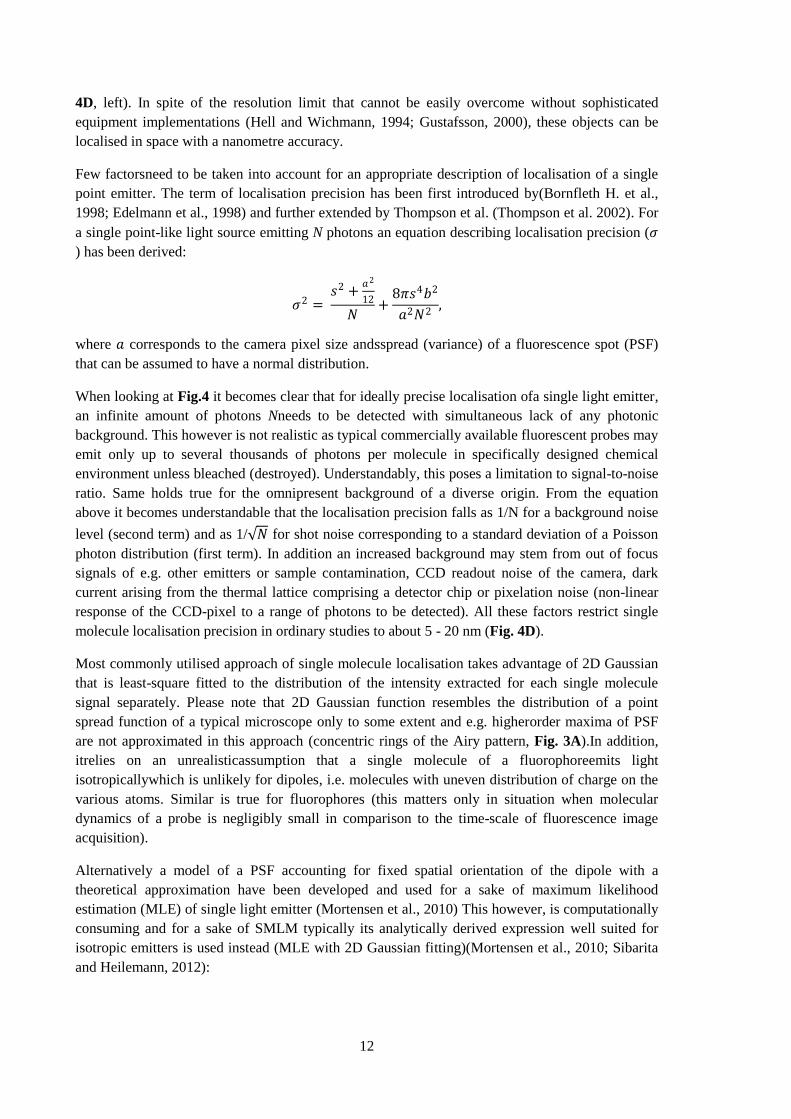
Few factorsneed to be taken into account for an appropriate description of localisation of a single
point emitter. The term of localisation precision has been first introduced by(Bornfleth H. et al.,
1998; Edelmann et al., 1998) and further extended by Thompson et al. (Thompson et al. 2002). For
a single point-like light source emitting N photons an equation describing localisation precision (𝜎
) has been derived:
𝜎2 = 𝑠2 +
𝑎2
12
𝑁+
8𝜋𝑠4𝑏2
𝑎2𝑁2,
where 𝑎 corresponds to the camera pixel size andsspread (variance) of a fluorescence spot (PSF)
that can be assumed to have a normal distribution.
When looking at Fig.4 it becomes clear that for ideally precise localisation ofa single light emitter,
an infinite amount of photons Nneeds to be detected with simultaneous lack of any photonic
background. This however is not realistic as typical commercially available fluorescent probes may
emit only up to several thousands of photons per molecule in specifically designed chemical
environment unless bleached (destroyed). Understandably, this poses a limitation to signal-to-noise
ratio. Same holds true for the omnipresent background of a diverse origin. From the equation
above it becomes understandable that the localisation precision falls as 1/N for a background noise
level (second term) and as 1/ 𝑁 for shot noise corresponding to a standard deviation of a Poisson
photon distribution (first term). In addition an increased background may stem from out of focus
signals of e.g. other emitters or sample contamination, CCD readout noise of the camera, dark
current arising from the thermal lattice comprising a detector chip or pixelation noise (non-linear
response of the CCD-pixel to a range of photons to be detected). All these factors restrict single
molecule localisation precision in ordinary studies to about 5 - 20 nm (Fig. 4D).
Most commonly utilised approach of single molecule localisation takes advantage of 2D Gaussian
that is least-square fitted to the distribution of the intensity extracted for each single molecule
signal separately. Please note that 2D Gaussian function resembles the distribution of a point
spread function of a typical microscope only to some extent and e.g. higherorder maxima of PSF
are not approximated in this approach (concentric rings of the Airy pattern, Fig. 3A).In addition,
itrelies on an unrealisticassumption that a single molecule of a fluorophoreemits light
isotropicallywhich is unlikely for dipoles, i.e. molecules with uneven distribution of charge on the
various atoms. Similar is true for fluorophores (this matters only in situation when molecular
dynamics of a probe is negligibly small in comparison to the time-scale of fluorescence image
acquisition).
Alternatively a model of a PSF accounting for fixed spatial orientation of the dipole with a
theoretical approximation have been developed and used for a sake of maximum likelihood
estimation (MLE) of single light emitter (Mortensen et al., 2010) This however, is computationally
consuming and for a sake of SMLM typically its analytically derived expression well suited for
isotropic emitters is used instead (MLE with 2D Gaussian fitting)(Mortensen et al., 2010; Sibarita
and Heilemann, 2012):

13
𝜎2 =𝛥2
𝑁 1 + 4𝜏 +
2𝜏
1 + 4𝜏 ,
where𝛥 = 𝑠 +𝑎2
12and𝜏 = 2𝜋𝛥2b/Na2.
Figure 4. Localisation of a single point-like light emitter in space.A)Theoretical calculation of
localisation precision depending on a number of photons obtained from a single emitter with constant
background levels of 0 to 10 photons. Localisation precision is expressed in normalised point spread
function full width at half maximum units. High background level hampers precise localisation of an
object. B) Experimental measurements of localisation precision of 30 nm fluorescent beads with
corresponding number of photons emitted (empty circles) as compared to theoretical prediction (solid
line) and computer generated images (dashed line). C) Examples of diffraction-limited confocal images
of fluorescent beads from (C) with a respective number of photons acquired. The number of photons
acquired per bead influences the signal-to-noise ratio and localisation precision.D) An alternative
method of localisation precision estimation. A localisation of a single light emitter is measured multiple
times and 𝜎 is estimated from the normal distribution of measured values. Red cross designates mean
position of the emitter.A-C adapted from(Thompson et al., 2002), D adapted from (Deschout et al.,
2014).
3.4 Introduction to single molecule localisation microscopy
As mentioned in previous section, the resolution limit of a fluorescence microscope hampers
observation of objects smaller than ~250 nm. This issue posesa great constraint on its practicalityin
the molecular biological research as most biological machineries and protein interactions operate at
the level of few nanometres. For instance a single nucleosome has a size of ~10 nm whereas a

14
cross section through a microtubule (cytoskeleton) is ~25 nm only.Noteworthy, these structures are
from 1 to 2 orders of magnitude smaller than wavelength range of a visible light available for
detection.
In order to overcome these limitations and enable real study of biological nano-structure, a whole
family of methods has been developed including: structured illumination (SIM)(Heintzmann and
Cremer, 1999; Gustafsson, 2000), stimulated emission depletion (STED)(Hell and Wichmann,
1994)and single molecule localisation microscopy (SMLM). In the following dissertation we shall
focus in detail on the last one.
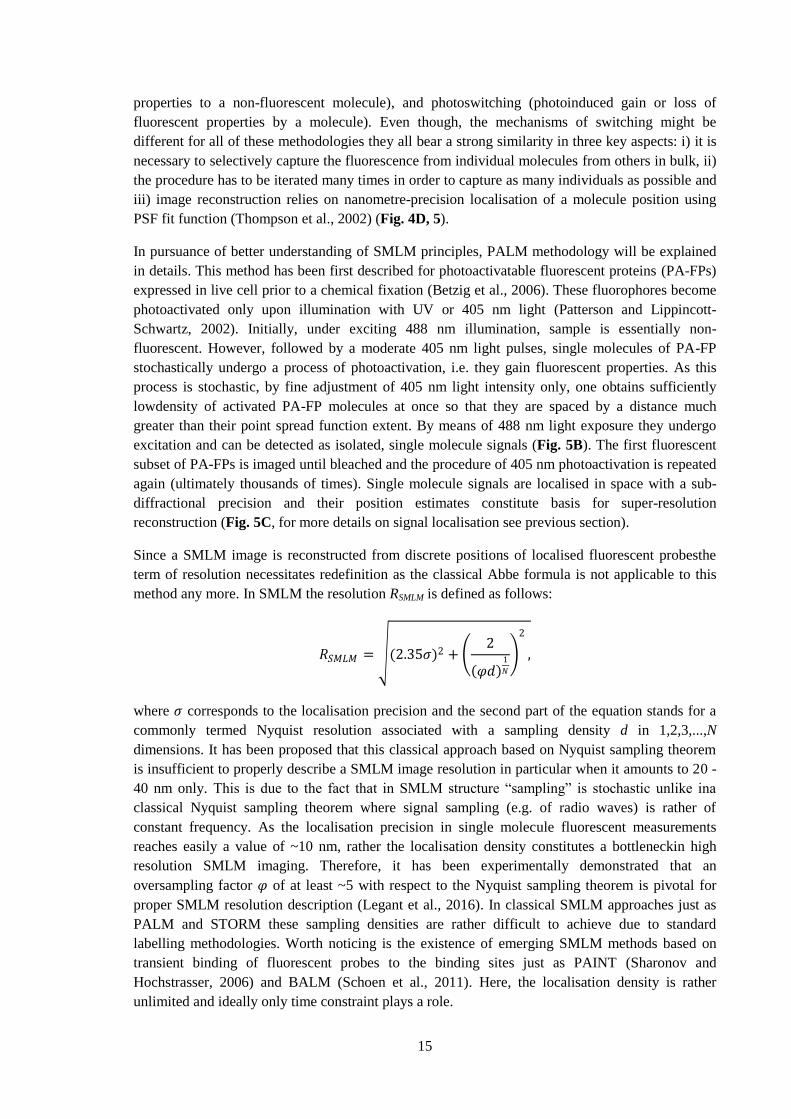
Figure 5. Concept of single molecule localisation microscopy. A) Conventional widefield image of
a fluorescently labelled structure. Fluorescence is switched off and subsequently only few molecules are
switched on at once with simultaneous image acquisition. Sophisticated software localises their position
in space (indicated with yellow dots). This operation is repeated thousands of times unless a sufficient
amount of single molecule signals is acquired (B). Based on localised positions a super-resolution
reconstruction is generated (C). B-C comprises a common workflow for all of the single molecule
localisation-based microscopy methodologies. Note that this method does not overcome the diffraction
limit in a classical sense but rather extracts an information on fine details by separating individual
positions convolved with a diffraction-limited point spread function of a microscope.
Even though the first theoretical concepts for SMLM have been developed already in early 90s of
last century (reviewed in (Cremer and Masters, 2013)) it took almost a decade to develop a suitable
experimental implementation for a single molecule localisation at high densities (average nearest-
neighbour distance << λ/2). In 2006 two novel independent approaches emerged, termed
photoactivated localisation microscopy (PALM) using fluorescent proteins (Betzig et al., 2006;
Hess et al., 2006) and stochastic optical reconstruction microscopy (STORM) utilising synthetic
dyes(Rust et al., 2006). Since then many more have been developed among which the most
important ones are: point accumulation for imaging in nanoscale topography (PAINT) (Sharonov
and Hochstrasser, 2006), ground state depletion microscopy (GSDIM) (Fölling et al., 2008), direct
stochastic optical reconstruction microscopy (dSTORM) (Heilemann et al., 2008), Spectral
precision distance microscopy with physically modified fluorophores (SPDMphymod) (Reymann et
al., 2008), binding activated localisation microscopy (BALM) (Schoen et al., 2011) and many
others.
The key to the single molecule microscopy is a controllable fluorescence switching mechanism.
There are three primary mechanismsindicated as useful in SMLM: photoconversion (photoinduced
shift in excitation and/or emission spectrum), photoactivation (photoinduced gain of fluorescent
15
properties to a non-fluorescent molecule), and photoswitching (photoinduced gain or loss of
fluorescent properties by a molecule). Even though, the mechanisms of switching might be
different for all of these methodologies they all bear a strong similarity in three key aspects: i) it is
necessary to selectively capture the fluorescence from individual molecules from others in bulk, ii)
the procedure has to be iterated many times in order to capture as many individuals as possible and
iii) image reconstruction relies on nanometre-precision localisation of a molecule position using
PSF fit function (Thompson et al., 2002) (Fig. 4D, 5).
In pursuance of better understanding of SMLM principles, PALM methodology will be explained
in details. This method has been first described for photoactivatable fluorescent proteins (PA-FPs)
expressed in live cell prior to a chemical fixation (Betzig et al., 2006). These fluorophores become
photoactivated only upon illumination with UV or 405 nm light (Patterson and Lippincott-
Schwartz, 2002). Initially, under exciting 488 nm illumination, sample is essentially non-
fluorescent. However, followed by a moderate 405 nm light pulses, single molecules of PA-FP
stochastically undergo a process of photoactivation, i.e. they gain fluorescent properties. As this
process is stochastic, by fine adjustment of 405 nm light intensity only, one obtains sufficiently
lowdensity of activated PA-FP molecules at once so that they are spaced by a distance much
greater than their point spread function extent. By means of 488 nm light exposure they undergo
excitation and can be detected as isolated, single molecule signals (Fig. 5B). The first fluorescent
subset of PA-FPs is imaged until bleached and the procedure of 405 nm photoactivation is repeated
again (ultimately thousands of times). Single molecule signals are localised in space with a sub-
diffractional precision and their position estimates constitute basis for super-resolution
reconstruction (Fig. 5C, for more details on signal localisation see previous section).
Since a SMLM image is reconstructed from discrete positions of localised fluorescent probesthe
term of resolution necessitates redefinition as the classical Abbe formula is not applicable to this
method any more. In SMLM the resolution RSMLM is defined as follows:
𝑅𝑆𝑀𝐿𝑀 = (2.35𝜎)2 + 2
𝜑𝑑 1
𝑁
2
,
where 𝜎 corresponds to the localisation precision and the second part of the equation stands for a
commonly termed Nyquist resolution associated with a sampling density d in 1,2,3,...,N
dimensions. It has been proposed that this classical approach based on Nyquist sampling theorem
is insufficient to properly describe a SMLM image resolution in particular when it amounts to 20 -
40 nm only. This is due to the fact that in SMLM structure “sampling” is stochastic unlike ina
classical Nyquist sampling theorem where signal sampling (e.g. of radio waves) is rather of
constant frequency. As the localisation precision in single molecule fluorescent measurements
reaches easily a value of ~10 nm, rather the localisation density constitutes a bottleneckin high
resolution SMLM imaging. Therefore, it has been experimentally demonstrated that an
oversampling factor 𝜑 of at least ~5 with respect to the Nyquist sampling theorem is pivotal for
proper SMLM resolution description (Legant et al., 2016). In classical SMLM approaches just as
PALM and STORM these sampling densities are rather difficult to achieve due to standard
labelling methodologies. Worth noticing is the existence of emerging SMLM methods based on
transient binding of fluorescent probes to the binding sites just as PAINT (Sharonov and
Hochstrasser, 2006) and BALM (Schoen et al., 2011). Here, the localisation density is rather
unlimited and ideally only time constraint plays a role.
16
3.5 Switching mechanism in direct STORM and design of imaging media
In order to accurately localise single fluorescent probes the aforementioned optical isolation has to
be provided. In other words, fluorescing molecules with overlapping light diffraction Airy patterns
have to be switched off in vast majority of the cases so that only very few of them at oncemaintain
their fluorescing capability. This manoeuvre enables their separation and localisation in space. The
following section elaborates on the most feasible and most commonly applied methods of
controlling the switching properties of single molecules of fluorophores.
An original single molecule fluorescence switching approach utilising excitation light and
additional switching wavelength was further simplified and named direct stochastic optical
reconstruction microscopy (dSTORM) - here the excitation wavelength alone is sufficient for
exciting the fluorescent probes as well as to stochastically switch between them in order to localise
them individually (Heilemann et al., 2005, 2008). Such switching occurs under high intensity
exciting illumination and in a presence of specific environmental conditions; namely, specific
compounds interacting with the excited fluorophore are responsible for induction of its transition to
a non-emitting or more often to a non-absorbing state.
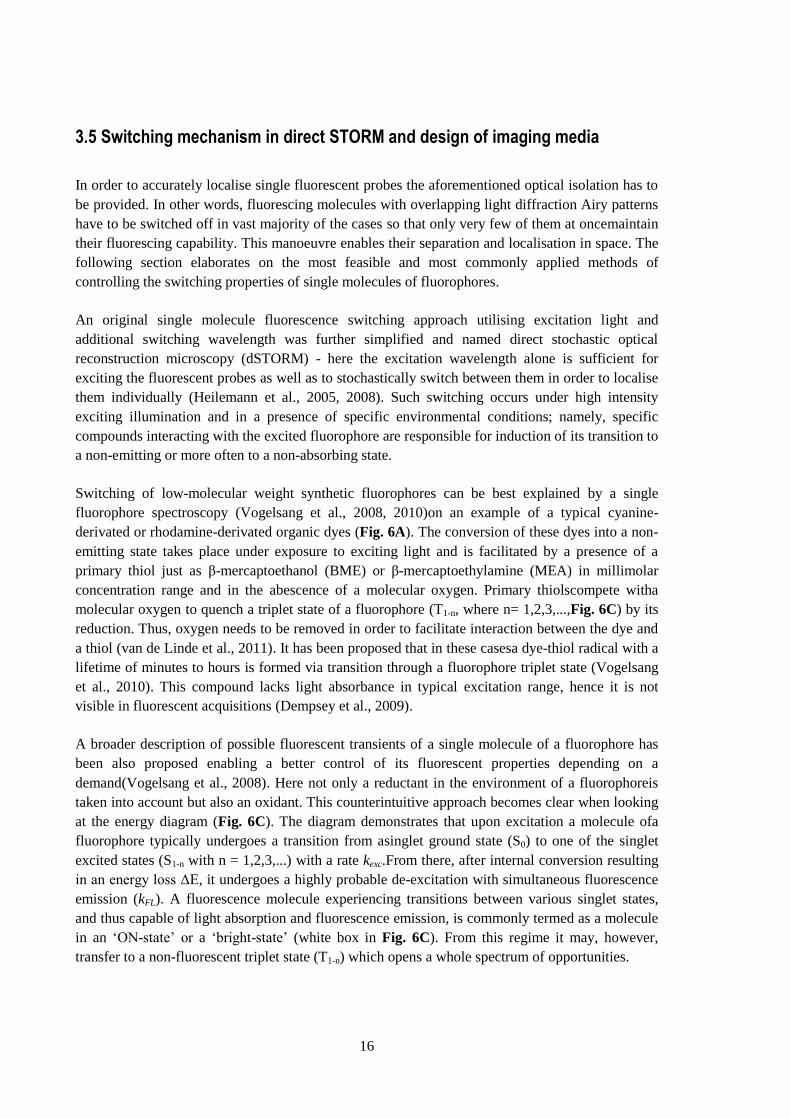
Switching of low-molecular weight synthetic fluorophores can be best explained by a single
fluorophore spectroscopy (Vogelsang et al., 2008, 2010)on an example of a typical cyanine-
derivated or rhodamine-derivated organic dyes (Fig. 6A). The conversion of these dyes into a non-
emitting state takes place under exposure to exciting light and is facilitated by a presence of a
primary thiol just as β-mercaptoethanol (BME) or β-mercaptoethylamine (MEA) in millimolar
concentration range and in the abescence of a molecular oxygen. Primary thiolscompete witha
molecular oxygen to quench a triplet state of a fluorophore (T1-n, where n= 1,2,3,...,Fig. 6C) by its
reduction. Thus, oxygen needs to be removed in order to facilitate interaction between the dye and
a thiol (van de Linde et al., 2011). It has been proposed that in these casesa dye-thiol radical with a
lifetime of minutes to hours is formed via transition through a fluorophore triplet state (Vogelsang
et al., 2010). This compound lacks light absorbance in typical excitation range, hence it is not
visible in fluorescent acquisitions (Dempsey et al., 2009).
A broader description of possible fluorescent transients of a single molecule of a fluorophore has
been also proposed enabling a better control of its fluorescent properties depending on a
demand(Vogelsang et al., 2008). Here not only a reductant in the environment of a fluorophoreis
taken into account but also an oxidant. This counterintuitive approach becomes clear when looking
at the energy diagram (Fig. 6C). The diagram demonstrates that upon excitation a molecule ofa
fluorophore typically undergoes a transition from asinglet ground state (S0) to one of the singlet
excited states (S1-n with n = 1,2,3,...) with a rate kexc.From there, after internal conversion resulting
in an energy loss ΔE, it undergoes a highly probable de-excitation with simultaneous fluorescence
emission (kFL). A fluorescence molecule experiencing transitions between various singlet states,
and thus capable of light absorption and fluorescence emission, is commonly termed as a molecule
in an „ON-state‟ or a „bright-state‟ (white box in Fig. 6C). From this regime it may, however,
transfer to a non-fluorescent triplet state (T1-n) which opens a whole spectrum of opportunities.

17
In the presence of a reducing agent (just as ascorbic acid) and/or an oxidant (e.g. methyl viologen)
a fluorophore molecule currently residing in a triplet state may further undergo an electron transfer
resulting in formation of radicals lacking any fluorescence emission ability („OFF-state‟, „dark-
state‟, grey frame in Fig. 6C). What becomes apparent for a reader here is that by a simple
alteration of reductant/oxidant concentrations one may manipulate switching properties ofa
fluorescence probe while exposed to the exciting light(Vogelsang et al., 2008). As already
mentioned before, molecular oxygen serves as a triplet state quencher, hence, removal of oxygen is
necessary to keep the triplet state abundant and promote further radical formation (T1→F.+
or
T1→F.- transitions).
In the presence of an oxidant or a reductant alone (aforementioned primary thiols like MEA are
reductants), formation of a fluorophore radical is facilitated. Under the exposure to the exciting
light, arapidlyincreasing number of molecules undergoes moderately probable S1 → T1-n transition
followed by a transition to one of radical states. Worth mentioning here is the fact that both T1-n
and radical states are rather long lived (seconds to minutes) as compared to a singlet excited state
(lifetime of few nanoseconds) and an increasing number of molecules will sustaina retention in
these states while constantly illuminated with high excitation intensity. This, if only well adjusted
in the fluorescence microscopy measurements, typically results in observation of isolated single
fluorophore molecules occupying the „bright-state‟ regime with a concurrent retention of vast
majority of molecules in the „dark-state‟ regime. Additionally, under continuous light-exposure,
fluorophore molecules may become reactivated from the „dark-states‟ spontaneously or with a help
of a UV-excitation, both leading to radical decay (Dempsey et al., 2009). This is desired in single
molecule localisation microscopy where optical isolation and continuous turn-over between states
is a key to the resolution enhancement (see Fig. 5).
In contrast, assuming the goal of the fluorescence experiment is to rather suppress any „dark-states‟
and facilitate high fluorescence emission, an alternative approach can be adopted. Here in order to
suppress the triplet and radical state formation („dark-states‟), oxygen removal and high
concentration of both reductant and oxidant has to be applied at once. This way radical states will
be formed very frequently, though they will be only very short-lived as an oxidant and reductant
will immediately serve as a reciprocal radical scavenger (F.+
→ S0 and F.- → S0 transitions). This
procedure results in a highest photon emission rate per time unit, useful for e.g. single molecule
studies just as single molecule tracking or single molecule stepwise photobleaching (Froeh et al.,
2015).
Lastly, an alternative approach for a „dark-state‟ formation utilises phosphine (TCEP) to feasibly
generate a covalent adduct even in the absence of the exciting light (Vaughan et al., 2013). In both
of aforementioned cases additional 405 nm light of very low intensity (Dempsey et al., 2009) can
be used for light-induced abstraction of the adduct or optionally oxygen reperfusion can be applied
(van de Linde et al., 2011), both to recover fluorescent properties of a fluorescent molecule. It has
been also demonstrated that by fine adjustment of the intensity of excitation or
photoswitchingnear-UV light one can control the kinetics of formation and disintegration of non-
emitting state. This is of high significance in single molecule localisation microscopy as by
manipulating the light intensity of these excitations one can control the amount and frequency of
single molecule signals appearing during an acquisition (van de Linde et al., 2011).

18
3.6 Design of an imaging environment for fluorophorephotoswitching based on
non-emitting state formation
From the previous paragraph it becomes clear that to control various transients of a fluorophore is a
key to single molecule localisation microscopy.One deduces a core assumption set for successful
SMLM: i) necessity of formation of a very abundant non-fluorescent „dark-state‟ with concomitant
maintenance of very few individuals at the moment in a short-lived „bright-state‟, ii) possibility of
circulation between two states with a rate that suits the measurement time-scale and equipment
capabilities.
In classical photoswitching experiments (Dempsey et al., 2009; Heilemann et al., 2005, 2008;
Vogelsang et al., 2008) these requirements are usually controlled by a chemical environment
surrounding the molecule, and technically speaking, the imaging cocktail needs to be thoroughly
designed in order to fulfil SMLM requirements for the fluorescent label chosen. Following aspects
have to be regarded as relevant:
Molecular oxygen dissolved in a solvent (O2) facilitates fluorophore photobleaching
(irreversible loss of fluorescence properties) (Bernas et al., 2004)and also serves asa
quencher of a triplet state bridging formation of a stable long-lived radical „dark-states‟. To
overcome these deleterious effects, oxygen can be removed by means of a commonly used
enzymatic oxygen scavenging system: a mixture of glucose oxidase, catalase, and glucose.
The first catalyses incorporation of the oxygen to the glucose with a concomitant
generation of a hydrogen peroxide immediately disintegrated by catalase. As a side effect
D-glucono-1.5-lactone is formed and rapidly hydrolised to a gluconic acid inevitably
leading to a drop in environmental pH (pKa ~ 3.7). Thus, it has been proposed to replace
glucose oxidase with pyranose oxidase known for analogous oxygen-scavenging properties
and pH preservation(Sari et al., 2012; Swoboda et al., 2012).
Choice of a switching reagent should be justified by experimental trials and is usually dye
and agent specific (MEA, BME, phosphine (TCEP), trolox (TX), ascorbic acid (AA) with
methyl viologen (MV) etc.). Typical concentrations used fall in millimolar range.
However, since the agent concentration has an effect on transient probability (e.g. radical
formation), it needs to be experimentally adjusted as well.As an example, low
concentration of a primary thiol (reducing agent)may lead to an insufficient abundance of a
T1 → F.-transient (Fig. 6C), hampering spatial isolation of single fluorophore signals in a
bulk fluorescencemicroscopy acquisition.

19
Figure6.A) Chemical structures of cyanine and rhodamine fluorescent probes. Most of commercially
available fluorophores from Alexa and Atto families are derived from them.‟R‟ corresponds to a
chemical substitutes.B) Model of light induced formation of the dark (non-emitting) state in a presence
of a primary thiol (RS-). Under light exposure the dye undergoes a reduction and a non-fluorescent dye-
thiol adduct is formed. It may recover to a previous state either spontaneously or by exposure to
additional near-UV illumination. In the latter the backwards reaction is accelerated proportionally to the
UV-light intensity. Adapted from(Dempsey et al., 2009). C) Jabłoński energy diagram for a fluorescent
probe useful for SMLM. Black arrows designate transitions between corresponding states. White box
corresponds to a „bright-state‟ of a fluorophore capable of excitation and fluorescence emission whereas
grey box signifies the non-fluorescent „dark-states‟ of a fluorophore. Under the exposure to light a
molecule of a fluorophore undergoes an excitation. Here, it may emit fluorescence (S1→S0 transient) or
optionally, with a limited probability, it may further transfer to one of the triplet states (T1-n). Triplet
state might be effectively quenched by a molecular oxygen (T1→S0 transition) or optionally, in the
presence of a reducing or an oxidising agent (e.g. ascorbic acid and methyl viologen respectively), it
may continue the transient to a long-lived radical „dark-state‟.For clarity, a sequence of fluorescent
images of a single „blinking‟ molecule of anAlexa 647 fluorophore acquired every 25 ms are
shown(right-bottom). For simplicity, an irreversibly photobleached state and non-radiative S1
deexcitation processes just as energy transfer, quenching, and solvent relaxationhave been neglected in
the graph.Please note that radical „dark-states‟ prevent from irreversible photobleaching of a
fluorophore as here it is not susceptible to a light absorption that may lead to a photolysis or reactive
oxygen species formation. For more details see (Vogelsang et al., 2008).

20
pH of the fluorophore‟s environment has been demonstrated to have an effect on
fluorescent properties of fluorophores and hence should be carefully adjusted. It has been
shown for Alexa 647 (cyanine-derivative) that in pH around 5 single fluorophore
molecules emit fluorescence for longer, with higher integrated number of photons probably
due to a decreased probability to interact with a switching agent (Olivier et al., 2013). Low
pH (<6.5), hence, may constitute an issue when optical isolation of single fluorophores is
required, whereas higher pH (~8) may be of choice when fast SMLM measurements are
desired.
Solvent used for fluorescent measurement may have an effect on fluorophore excited state
deexcitation via direct interaction. It has been demonstrated that e.g. replacement of water
with heavy water (D2O) suppresses formation of transient hydrogen bonds between a
fluorophore and a surrounding water, effectively increasing the quantum efficiency of a
fluorescent probe (Klehs et al., 2014). In addition another factor that should be controlled
is the viscosity of a buffer. For instance, glycerol is known to enhance fluorescent lifetime
of a DNA binding PicoGreen ~180 fold as compared to water (Dragan et al., 2010). Thus,
simple, partial or almost total replacement of water with glycerol might be expected to
improve brightness of the fluorescent probes crucial for single molecule detection.
3.7 Fluorescent DNA-binding dyes
In optical microscopy, chromatin, a protein complex with DNA, yields poor contrast in standard
transmitted light mode or even when differential interference microscopy applied. Hence, the
necessity to label the DNA with fluorescent probes. In fluorescence microscopy, in order to do soin
vitro or in situ in fixed samples, a number of dyes with nucleic acid affinity has been developed.
These compounds, further abbreviated as DNA dyes, are typically positively charged promoting
their close interaction with negatively charged nucleic acids (phosphate groups constituting nucleic
acid backbone are responsible for negative total net of nucleic acids). Electrostatic attraction
however is not a sole mechanism of interaction and is insufficient for a tight binding to the DNA
(please see further paragraphs for more information). In the following section the complexities of
these interactions will be covered. This will enable the reader to better understand the purpose and
the coverage of the work performed for the sake of this dissertation.
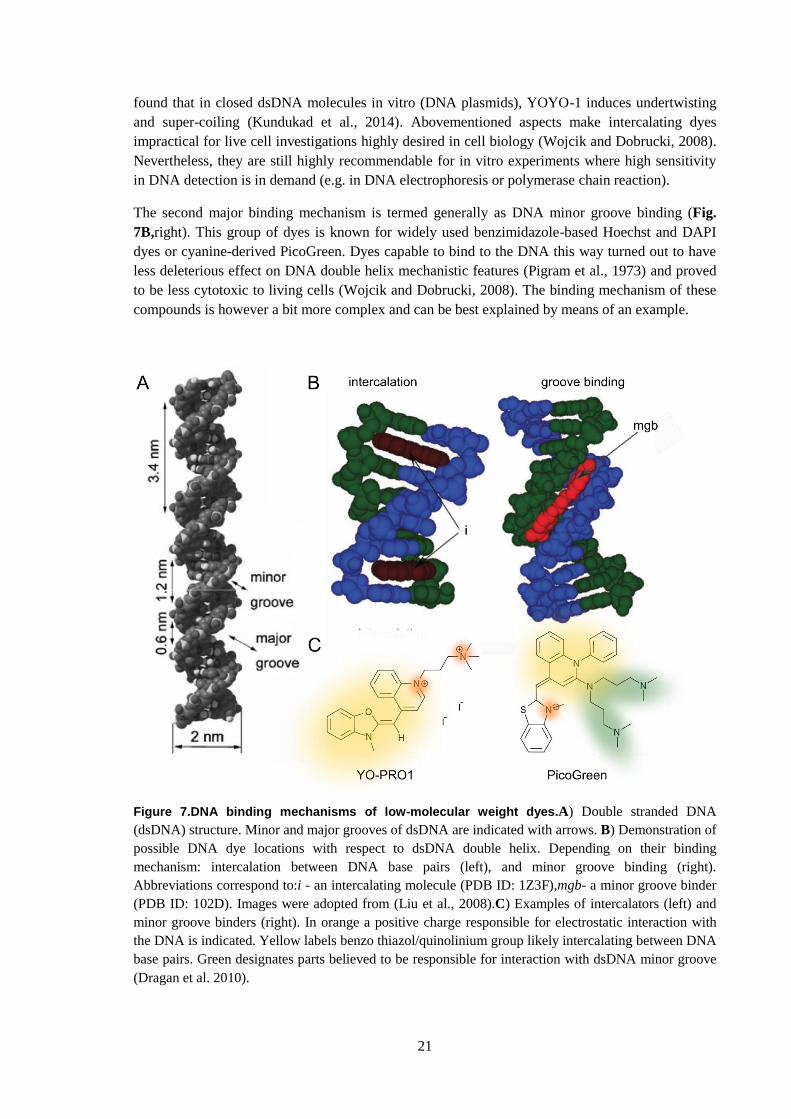
The first type of binding mechanism is DNA intercalation (Fig. 7B, left). The term “intercalation”
was first introduced by L. Lerman to describe the insertion of planar aromatic compounds between
DNA base pairs of double stranded DNA(Lerman, 1961). Among the most commonly used
intercalators in fluorescence microscopy are ethidium bromide, acridine orange, and cyanine based
YOYO-1, TOTO-1 (bis-intercalators), YO-PRO-1 (mono-intercalator). Besides their outstanding
fluorogenic properties (Table 1) they are known to have an effect on mechanistic nature of the
dsDNA (Günther et al., 2010; Kundukad et al., 2014). For instance, a DNA dye YOYO-1, widely
used in single DNA molecule biophysical studies (Reisner et al., 2010), in spite of having no effect
on DNA persistence length (measure of a stiffness of a polymer), it induces an increase of up to
38% in DNA contour length (maximal physical extension of a polymer) at full saturation of 1 dye
molecule per 4 DNA base pairs. This means that a single YOYO-1 molecule extends the DNA by
approximately 0.5 nm (Kundukad et al., 2014). Using atomic force microscopy it has been also
21
found that in closed dsDNA molecules in vitro (DNA plasmids), YOYO-1 induces undertwisting
and super-coiling (Kundukad et al., 2014). Abovementioned aspects make intercalating dyes
impractical for live cell investigations highly desired in cell biology (Wojcik and Dobrucki, 2008).
Nevertheless, they are still highly recommendable for in vitro experiments where high sensitivity
in DNA detection is in demand (e.g. in DNA electrophoresis or polymerase chain reaction).
The second major binding mechanism is termed generally as DNA minor groove binding (Fig.
7B,right). This group of dyes is known for widely used benzimidazole-based Hoechst and DAPI
dyes or cyanine-derived PicoGreen. Dyes capable to bind to the DNA this way turned out to have
less deleterious effect on DNA double helix mechanistic features (Pigram et al., 1973) and proved
to be less cytotoxic to living cells (Wojcik and Dobrucki, 2008). The binding mechanism of these
compounds is however a bit more complex and can be best explained by means of an example.
Figure 7.DNA binding mechanisms of low-molecular weight dyes.A) Double stranded DNA
(dsDNA) structure. Minor and major grooves of dsDNA are indicated with arrows. B) Demonstration of
possible DNA dye locations with respect to dsDNA double helix. Depending on their binding
mechanism: intercalation between DNA base pairs (left), and minor groove binding (right).
Abbreviations correspond to:i - an intercalating molecule (PDB ID: 1Z3F),mgb- a minor groove binder
(PDB ID: 102D). Images were adopted from (Liu et al., 2008).C) Examples of intercalators (left) and
minor groove binders (right). In orange a positive charge responsible for electrostatic interaction with
the DNA is indicated. Yellow labels benzo thiazol/quinolinium group likely intercalating between DNA
base pairs. Green designates parts believed to be responsible for interaction with dsDNA minor groove
(Dragan et al. 2010).

22
Studies on PicoGreen dsDNA binding in an increasing salt concentrations revealed decreasing
association strength as judged on fluorescence signal intensity. Such an effect is typically
attributable to electrostatic interactions (Dragan et al. 2010). For instance it has been demonstrated
that NaCl concentration of 100 mM escalatesPicoGreen dissociation constant ~10 fold.This means
that most of the interaction forces that remain in this case are not electrostatic-related(Dragan et al.,
2010). Therefore, one of the mechanisms of interaction of this molecule with dsDNA is purely
electrostatic. The rest of the interaction with a DNA minor groove is likely shared among two
aminopropyl groups having similar structure to AT-hooks known to have alone a DNA-affinity at
the minor groove (indicated in green in Fig. 7C, left)(Dragan et al. 2003). Nonetheless, it is hard to
encounter a pure interaction with the DNA minor groove. In case of the PicoGreen, its aromatic
groups (yellow in Fig. 7C, left) are anticipated to intercalate to some extent between DNA base
pairs. Therefore, this interaction mechanism is rather a mixture of minor groove insertion and
intercalation.
DNA-binding dyes are essentially non-fluorescent in a solution (except a few cases such as e.g.
DRAQ5 or DAPI, Table 1). However, upon binding (irrespective of the binding mechanism) DNA
dyes experience great increase in their brightness, often exceeding even 103 fold. This increase in
quantum efficiency provides an extreme contrast demanded in e.g. optical microscopy imaging.
But what are the physical bases for this phenomenon? In order to explain this fluorescent
enhancement it is best to review in detail an example of well studied PicoGreen - a cyanine-derived
DNA dye (for details see previous paragraph). Fluorescent lifetime measurements of PicoGreen in
a watery buffer revealed its value to amount ~4 ps, however, upon binding its value reaches ~4 ns
(1000x fold increase). In order to decipher the underlying mechanism of quantum efficiency
increase it is important to separately target different aspects of physical interactions of the dye with
its environment. For instance, it hasbeen observed that alteration to the viscosity of environment
increases fluorescent lifetime of this DNA dye by ~180 fold in the absence of DNA(Dragan et al.,
2010). Such change of the fluorescence lifetime uponincreased viscosity constitutes a typical
hallmark of affected intramolecular dynamic fluctuations of a molecule investigated.Therefore, the
PicoGreen undergoes excited state energy dissipation while in a solvent, and as a consequenceits
dramatically low quantum efficiency can be attributed to this process.In contrast, intramolecular
dynamics is abolished while molecule of this DNA-binding dye is immobilised to the dsDNA,
leading to a very high quantum efficiency and high probability of fluorescence emission.
23
Extinction coefficient at
exc. max. [cm
-1M
-1]
dsDNA binding constant
[M-1
]
Quantum efficiency
while bound to dsDNA
Peak absorption/
emission with dsDNA
[nm]
Fluorescence enhancement and binding mechanism
Hoechst 33258
47,000 106-10
7
(Drobyshev et al., 1999)
0.42 (Cosa et al., 2001)
349/466 (Cosa et al.,
2001)
13x, mgb (Cosa et al.,
2001)
DAPI 27,000 105-10
6
(Manzini et al., 1985)
0.34 (Cosa et al., 2001)
358/456 (Cosa et al.,
2001)
18x, mgb (Cosa et al.,
2001)
YOYO-1 98,900 (Benvin et al.,
2008)
1010
-1012
(Glazer and Rye, 1992)
0.38 458/489(Rye et al., 1992)
<1,000x (Cosa et al., 2001; Rye et al., 1992), i
YO-PRO-1 52,000(Benvin et al., 2008)
105-10
6
(Glazer and Rye, 1992;
Joseph et al., 1998)
0.44 475/486(Rye et al., 1992)
700x (Rye et al.,
1992), i
PicoGreen 70,000 5x10⁹
(Dragan et al., 2010)
0.5 498/528(Cosa et al., 2001)
1,070x (Cosa et al., 2001), mgb, i(Dragan et al., 2010)
Ethidium bromide
~6,000 ~105
(Alonso et al., 2006;
Vardevanyan et al., 2003)
0.35 (Cosa et al., 2001)
520/610 (Rye et al.,
1992)
35x (Rye et al.,
1992), i
SybrGreen 70,000(Dragan et al., 2012)
107
(Dragan et al., 2012)
0.42 (Dragan et al., 2012)
~500/525 >1000x, mgb(Dragan et al., 2012)
DRAQ5 20,949 (Smith et al., 2000)
– 0.004 (Njoh et al.,
2006)
646/681 (Smith et al.,
2000)
~1x (Njoh et al.,
2006), i (Smith et al.,
2000)
Sytox Orange
79,000 (Yan et al.,
2005)
108
(Yan et al., 2005)
0.9 (Yan et al.,
2005)
543/575 (Yan et al.,
2005)
~450x (Yan et
al., 2000), i, (Yan et al.,
2005)
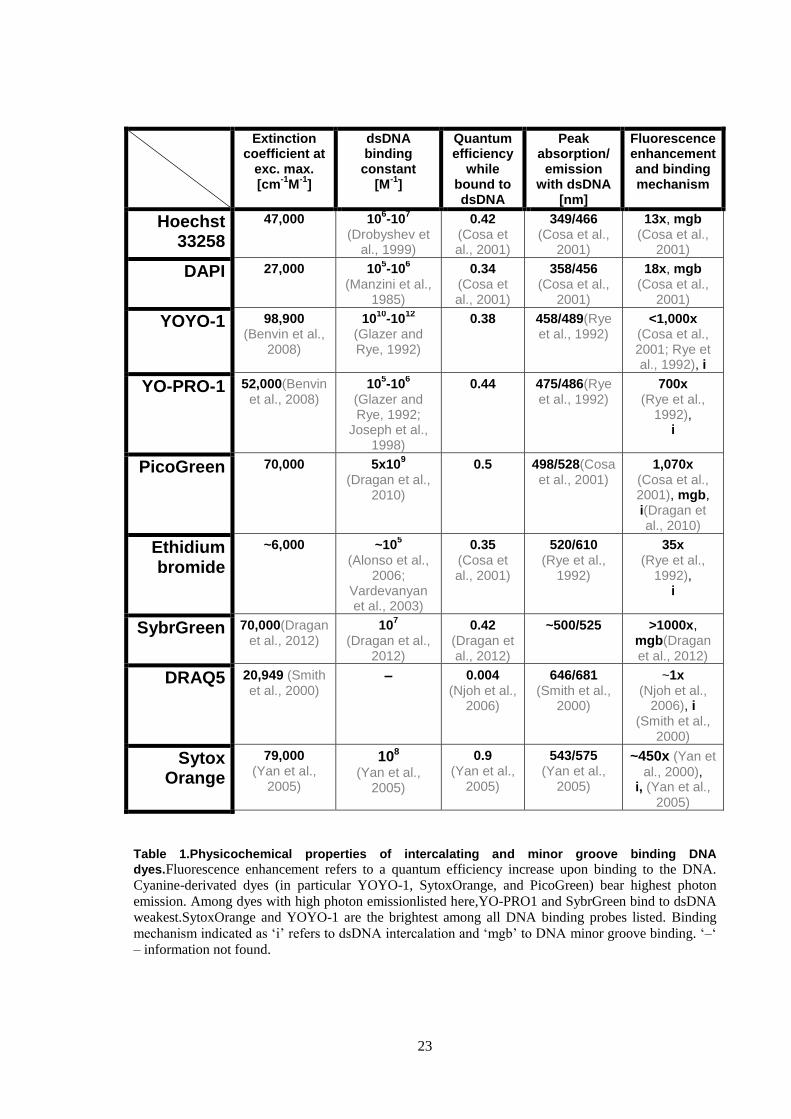
Table 1.Physicochemical properties of intercalating and minor groove binding DNA
dyes.Fluorescence enhancement refers to a quantum efficiency increase upon binding to the DNA.
Cyanine-derivated dyes (in particular YOYO-1, SytoxOrange, and PicoGreen) bear highest photon
emission. Among dyes with high photon emissionlisted here,YO-PRO1 and SybrGreen bind to dsDNA
weakest.SytoxOrange and YOYO-1 are the brightest among all DNA binding probes listed. Binding
mechanism indicated as „i‟ refers to dsDNA intercalation and „mgb‟ to DNA minor groove binding. „–„
– information not found.

24
3.8 DNAimaging with super-resolution microscopy
Since the very beginning of the super resolution microscopy, an imaging of the DNA constituted
one of the key challenges (Rust et al., 2006)and the direct DNA labelling has been some solution to
this problem at least to a moderate extent.
One of the first attempts comprised structured illumination microscopy (SIM) of the DNA labelled
with DAPI minor groove binder (Schermelleh et al., 2008). The choice of DAPI was justified due
to its spectral properties. In SIM the resolution enhancement is usually ~2x full width at half
maximum of a point spread function of the wavelength emitted (λem). For DAPI λem is
approximately 450 nm (blue) i.e. visible light of a shortest detectable wavelengths. This gives the
highest achievable resolution of ~110 nm laterally (x, y) and ~300 nm axially (z) and has been
successfully applied to imaging of a rodent and mammalian cell nuclei(Schermelleh et al., 2008).
In spite of common image artefacts in SIM (Sahl et al., 2016), thanks to its versatility and ease of
application, it soon emerged as a main tool for studying DNA/chromatin architecture in the cell
nucleus (Markaki et al., 2010; Popken et al., 2014, 2015).
Figure 8.SMLM of directly binding DNA dyes.A) Fixed, mitotic chicken cells labelled with SYTO-13,
widefield (top) and SMLM image (down). Image from (Flors, 2011). B) SMLM image of live U2OS
cell stained with Picogreen. Adopted from (Benke and Manley, 2012). C) SMLM image of an isolated
λ-phage DNA stained with YOYO-1 (Flors, 2010). D) Binding activated SMLM of fixed E. Coli
bacteria using transient PicoGreen association, left super-resolution image, right conventional
reconstruction. Adapted from (Schoen et al., 2011).
In parallel to SIM, stimulated emission and depletion (STED) microscopy has been first applied to
the DNA study. Here the isolated and stretched λ-phage DNA was stained with YOYO-1 and
exposed to two wavelengths: exciting and depleting. As a result, a resolution in the order of 50 nm
has been achieved (Persson et al., 2011). Few years later STED microscopy was again applied to
the subject of DNA imaging (Lukinavičius et al., 2015). This time living cells were labelled using

25
specifically designed DNA probe based on Hoechst backbone (Si-R Hoechst). Although, the
authors claim the resolution in the order of 80 nm, they are unable to present an image of an entire
cell nucleus. STED microscopy typically does not perform well on structured 3D samples due to a
difficulty to maintain reciprocally aligned focussed light beams as the light refraction index varies
throughout a sample‟s structure. Any follow-up study and application of this method to DNA
imaging is presently missing.
Currently, a growing number of technical solutions has been put forward in a field of single
molecule localisation microscopy of DNA. First studies involved imaging of isolated λ-phage
DNA labelled with cyanine-derived dsDNA intercalators such as YOYO-1, YO-PRO-1 or TOTO-3
(Flors, 2010, 2011; Flors et al., 2009). In case of these studies the DNA was pre-stained and
embedded in an imaging buffer devoid of oxygen containing 50 – 100 mM β-mercaptoethylamine
(MEA). It has been postulated that this compound facilitates a photoinduced reduction of a dye
leading to a formation of a reversible, non-emitting dark state(this term was introduced in the
section 3.5)(Flors, 2010). These protocols were applied to imaging of isolated DNA (Fig. 8C) and
cell nuclei (Fig. 8A). In case of the latter, with a moderate success due to limited single molecule
localisation density reducing structural details in an image.The other research focused on live cell
SMLM using a cyanine-derived minor-groove binder PicoGreen in a presence of 1 mM ascorbic
acid (AA) and in the absence of oxygen (Benke and Manley, 2012) (Fig. 8B). The authors inferred
that by using reducing (here AA) and oxidative agent (supposedly intracellular reactive oxygen
species) both with an appropriate proportion, PicoGreen‟s fluorescence switching occurs as was
previously demonstrated for other synthetic cyanine- and rhodamine- derived dyes (Vogelsang et
al., 2008) (for more details see section 3.6 and Fig. 7).
One of the very interesting approaches involving single molecule localisation termed Binding
Activated Localisation Microscopy (BALM), relies on a transient binding of YOYO-1 and
PicoGreen to the DNA in a specially designed buffer containing milimolar concentrations of
methyl viologen and ascorbic acid with simultaneous oxygen deprivation (Schoen et al., 2011).
Such chemical environment provided an increased dynamics of association and dissociation of
DNA-binding dyes with/from dsDNA in isolated λ-phage DNA and in bacteria (Fig. 8D). The dye
concentration was carefully adjusted so that only very few isolated dye molecules are bound to the
DNA and fluoresce at the same time. Concurrently, the rest is not detectable as the emission rate of
a DNA dye in a solvent is negligible (for details see section 3.7).In BALM the dye molecules
associate with dsDNA only for few milliseconds enabling the detection of up to 2,000 photons per
molecule and its precise localisation. This approach turned out to provide an excellent resolution of
10 – 20 nm for isolated DNA fibres. Interestingly however, BALM has not been applied to
imaging of the nuclei yet.
Currently the switching mechanisms and dynamic binding in aforementioned methods have not
been described in sufficient detail. Better understanding of switching properties of the DNA dyes
as well as development of new DNA imaging techniques is presently highly demanded in the cell
biology (see next section).
3.9 Photoconversion of benzimidazole-based DNA dyes and Vybrant Violet
Photoconversion is a process known best for photoconvertible fluorescent proteins e.g. mEos and
Kaede (reviewed in (Shcherbakova et al., 2014)).Under the exposure to a specific light a molecule
of a fluorescent probe changes its spectral properties.For instance, it might experience a change to

26
the excitation or emission spectrum or both at once. Most often a red-shift towards longer
excitation and emission wavelengths occurs as a repercussion of a photoinduced cleavage in a
structure of a fluorescent protein chromophore. Until recently the phenomenon of photoconversion
was not known for any of the DNA-binding dyes.
Figure 9. Confocal studies of the photoconversion of benzimidazole DNA dyes.A) Column 1 and 2
from the left present Hoechst 33258 and DAPI fluorescence once bound to cellular DNA. Blue
fluorescence excited with 405 nm laser light presented in blue, faint green fluorescence excitable with
458 nm laser light presented in green. Column 3 demonstrates a spectral change to Hoechst (upper row)
and DAPI (lower row) after exposure to UV light; here the green fluorescence originating from the cell
nuclei becomes stronger suggesting that photoconversion occurred. Concomitantly, the fluorescence of
a standard blue-emitting form undergoes strong reduction (not shown). B) Respective fluorescence
spectra of UV-excited/blue emitting and blue-excited/green emitting forms of Hoechst (upper row) and
DAPI (lower row) in a presence of a cellular DNA. Images from (Żurek-Biesiada et al., 2013).
Contemporary studies demonstrate that benzimidazole based dyes just as Hoechst 33258, Hoechst
33342, DAPI and VybrantDyeCycleViolet undergo a process of photoconversion upon
illumination with UV or 405 nm laser light (Żurek-Biesiada et al., 2014, 2013). Mass spectrometry
studies revealed that under such circumstances DAPI and Hoechst 33258 undergo additional
protonation (Żurek-Biesiada et al., 2014). Whereas under standard conditions their excitation and
emission maxima amount to around 360 nm and 460 nm respectively (see Table 1), after UV
irradiation they become easily excitable with light from 458 – 488 nm range with their emission
maxima shifted to 505 nm (DAPI) and 530 nm (Hoechst)(Fig. 9A, B). This has been indicated
particularly hazardous in case of conventional fluorescence imaging of DNA labelled using these
dyes together with other green emitting label just as GFP as both emission spectra would
significantly overlap (Webster et al., 2013). Nevertheless, both DNA-binding dye‟s spectral forms,

27
can be easily separated using an appropriate filter set. Interestingly, any usefulness of these
properties and similarity in behaviour to photoactivated localisation microscopy probes yet has not
been recognised.
3.10 Review on chromatin organisation in the cell nucleus
The DNA is a polymer composed of a basic unit known as a nucleotide. There are four types of
nucleotides depending on their composition. Typically they comprise phosphate, deoxyribose and
either cytosine, guanine, adenosine, or thymine. One of the greatest breakthroughs in biology that
revolutionised the world was the discovery of how do they form a polymer and transfer biological
information brought to the world by Watson and Crick in 1953(Watson and Crick, 1953).This
discovery alone, did not, however, explain how theDNA having a length of approximately ~2 m
can folditself in order to fit into a cell nucleus of a diameter 5 order of magnitude smaller. In order
for this to happen, formation of chromatin, a complex of DNA and proteins, is necessary. The
DNA is wrapped around histone protein octamers termed nucleosomes, having on average 146
base pairs (bp), with a linker DNA ranging from 10 to 50 bp(Fig. 10A)(Jiang and Pugh, 2009). The
linker part of the DNA is known to be a location to H1 histone dynamically supporting and
determiningthis basic structure(Misteli et al., 2000). All together, this well established chromatin
model assumes the existence of so called „beads on the string‟ explaining chromatin organisation
and initial length reduction at the level below 11 nm.
However, in spite of a great deal of an effort invested, the precise higher order spatial organisation
of the chromatin is still a subject to an ongoing debate (Maeshima et al., 2010; Cremer et al. 2015).
After mitosis condensed chromosomes undergo partial decondensation and align to the freshly
formed nuclear periphery. Surprisingly, they do not mix with eachother but rather form distinct
chromosome territories and typically maintain their radial position in the nucleus throughout a cell
cycle(Fig. 10B)(Cremer and Cremer, 2001; Gao et al., 2016).Nonetheless, the chromatin
architecture on a length-scale between a chromatin fibre and chromosome territory remains elusive
(10 - 200 nm). Currently the most persuasive models have been derived using chromosome
conformation capture methods (3C, 4C, 5C, and Hi-C, for example see (Dixon et al., 2012)). These
methods rely on formaldehyde fixation of the chromatin in situ and together with a massive
parallel sequencing revealDNA sequence-specific contact probability throughout a genome with a
resolution of ~1 kb(Rao et al., 2014). Using this technology the existence of small self-interacting
chromatin domains, denoted as “topologically associated chromatin domains” (TADs) was
discovered(Dixon et al., 2012). TADs are genomic regions that undergo a high frequency of local
contacts while interacting infrequently with sequences within adjacent TADs. Their size ranges
from kilo- to mega- base-pairs (Dixon et al., 2012; Fraser et al., 2015) and they are believed to
constitute a basic higher order chromatin organisation unit above the level of individual
nucleosomes, e.g. in DNA replication (Pope et al., 2014).
Although, the existence of TADs and even so called “meta-TAD” arrays (Fraser et al., 2015) seems
to be broadly accepted, their internal structure and mechanism of formation are now in the spot
light. Currently, a variety of novel methodological approaches are aiming to unravel the basic
information on TAD organisation. For instance, classical chromosome conformation capture
methods rely on the proximity ligation via e.g. formaldehyde cross-linking of chromatin stretches
occupying same neighbourhood.

28
Figure 10. DNA arrangement at different organisational levels.A) An electron microscopy picture
presentingthe basic chromatin unit – nucleosome, comprising DNA and histone proteins. So called
“beads on a string” are indicated with arrows (image credit: (Olins and Olins, 2003)).B) A proof of
concept experiment revealing the existence of chromosome territories in a chicken fibroblast.(a) Image
of a DAPI- and (b) chromosome PAINT- stained metaphase spread by a combinatorial labelling with
oestradiol, digoxigenin and biotin followed by a secondary labelling with three fluorescent labels: Cy3,
FITC and Cy5 (source: (Cremer and Cremer, 2001)).C) A demonstration of changes in chromatin
architecture throughout the time-course of myelopoiesis (from left to right)(Hübner et al., 2015).
Chromatin structure changes as the cell commits to a specific function.
Other group of methods involving parallel massive sequencing, termed chromatin interaction
analysis by pair-tag sequencing (ChIA-PET), was designed to detect genome wide interactions
mediated by specific protein factors(Fullwood and Ruan, 2009). In a recent study ChIA-PET was
applied to investigate CCCTC-binding factor (CTCF) and cohesin, i.e. proteins believed to tangle
chromatin fibres and regulate loop formation (Tang et al., 2015). Thanks to an increased
sequencing resolution of ChIA-PET reaching even 100bp (as compared with~few kb for HiC), it
has been revealed that CTCF and cohesin, in 99% of cases, co-occupy same genomic loci that in
addition correlate with a positioning of RNA Pol II factor responsible for gene transcription (Tang
et al., 2015). Interestingly, previously it has been found that CTCF correlates with TAD boundaries
(Rao et al., 2014). These evidences lead to a conclusion that chromatin loops are tangled with
CTCF/cohesin at TAD boundaries where also RNA Pol II is enriched to serve transcription of
active genes. Lately, it has been also hypothesised based on polymer simulations that an underlying
principle of TAD formation is a dynamic loop extrusion(Fudenberg et al., 2016). Also
experimental and modelling evidences are available suggesting that transient intra-chromatin
interactions bridged by polycomb proteins lead to an increase in chromatin compaction in
Drosophilacells (Boettiger et al., 2016).

29
Table 2.Occupancy of protein factors in active and inactive nuclear compartments. Proteins transiently
not associated with chromatin are believed to diffuse throughout the interchromatin compartment. For
further details and depiction see Fig. 11A.
In line with biochemical studies, based on microscopic evidences, a new general model of
chromatin organisation at the level of 100 – 1000 nm has been put forward (Cremer et al.,
2015)(Fig. 11A). This model of the cell nucleus is based on two functionally distinct active and
inactive nuclear compartments (ANC and INC, respectively). The ANC is built up of
transcriptionally active peripheral part of chromatin domain clusters (CDCs) whose core comprises
transcriptionally inactive, condensed chromatin of the INC. CDCs occupy roughly 50% of the total
nuclear volume and are surrounded by interchromatin compartment (IC) providing a physical
connection to the nuclear pores at the nuclear periphery. This major compartmentalisation of the
nucleus leads to heterogeneity in local molecule concentration, crowding effects, and phase
separation (Pederson, 2014;Hancock & Jeon, 2014; Woringer, Darzacq, & Izeddin, 2014).
Presently it is understood that the local environment determined by e.g. chromatin compaction
state, the epigenetic landscape, or the distance to other neighbouring chromosomal all a critical role
in regulation of both, individual genes as well as the entire cell fate (Fig. 10C)(Cremer et al., 2015;
Ma et al., 2015). Thus, necessity to develop novel investigation methodologies, including
microscopy, to visualise the internal structure of TADs, their dynamic nature and mechanism of
formation, is highly desired.
Table 2 Active Nuclear Compartment (ANC)
Inactive Nuclear Compartment (INC)
factors
Transcriptionally competent
chromatin And chromatin loops
Transcription factors, RNA Pol II CTCF, cohesin
Active histone marks: H3K9ac, H3K4me3
Replication factors (e.g. PCNA)
Compacted part of CDCs Repressive histone marks like
H3K9me3, H3K27me3 DNA methylation
Heterochromatic proteins, HP1
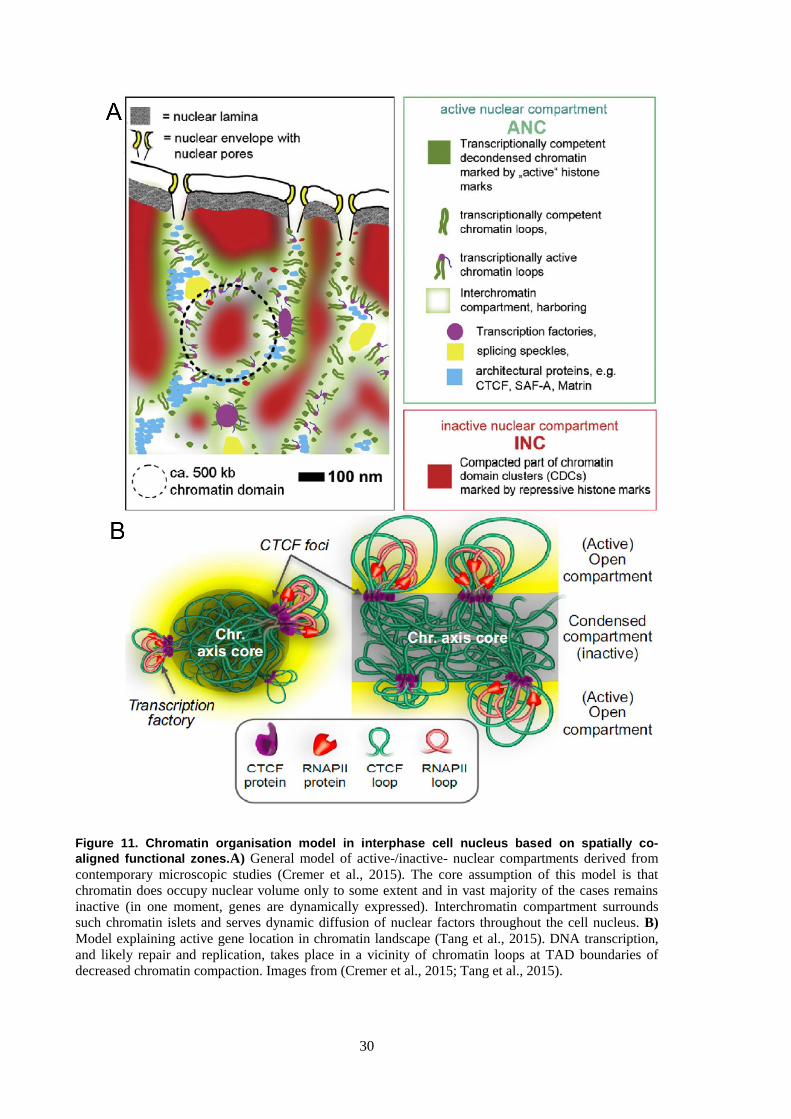
30
Figure 11. Chromatin organisation model in interphase cell nucleus based on spatially co-
aligned functional zones.A) General model of active-/inactive- nuclear compartments derived from
contemporary microscopic studies (Cremer et al., 2015). The core assumption of this model is that
chromatin does occupy nuclear volume only to some extent and in vast majority of the cases remains
inactive (in one moment, genes are dynamically expressed). Interchromatin compartment surrounds
such chromatin islets and serves dynamic diffusion of nuclear factors throughout the cell nucleus. B)
Model explaining active gene location in chromatin landscape (Tang et al., 2015). DNA transcription,
and likely repair and replication, takes place in a vicinity of chromatin loops at TAD boundaries of
decreased chromatin compaction. Images from (Cremer et al., 2015; Tang et al., 2015).

31
3.11 Microscopic methods to investigate chromatin organisation
In the following section I will briefly introduce several microscopy approaches commonly used to
study the chromatin organisation.
3.11.1 Electron microscopy
Transmission electron microscopy (TEM) serves a gold standard for investigations of chromatin
structure.It relies usually on few hundred nanometre-thick sections of a cell material.Typically
Osmium ammine B is used to enhance chromatin contrast in electron density images. A very
elegant example of TEM application to cell nuclei sections constitute cells undergoing
myelopoiesis presented in Fig. 10C. In this case TEM revealed chromatin rearrangement of the
chromatin from its initially diffused state to the dense layer at the nuclear periphery (Hübner et al.,
2015).
3.11.2 Fluorescence microscopy image analysis
This simplest approach relies on fluorescent chromatin labelling, either via DNA binding dyes or
histone proteins with e.g. GFP. Confocal microscopy is used to acquire high resolution images (ca.
250 nm resolution) and various image analysis tools can be applied e.g. based on dense cluster
edge detection (Irianto et al., 2014) or on chromatin density classes distribution analysis (Popken et
al., 2015). In addition through studying the distribution of chromatin associated proteins one can
infer on chromatin state;following was demonstrated e.g. with a change to the distribution of
histone H1 (Wojcik and Dobrucki, 2008) or redistribution of DNA-binding replication clamp
(Trembecka-Lucas and Dobrucki, 2012). Examples are numerous.
3.11.3 Kinetics of DNase I chromatin digestion
Deoxyribonuclease I (DNase I) is a non-specific nuclease that cleaves DNA and releases di-, tri-
and oligo- nucleotide products. Its molecular weight amounts to ~30 kDa. Thus it is plausible to
assume that its penetration through chromatin will be rather limited (Bancaud et al., 2009). These
two features of this enzyme have been decisive for its application in biochemical studies involving
massive parallel sequencing (Boyle et al., 2008) as well as in microscopy of chromatin in situ in
fixed cells with DNA labelled using a DNA-binding dye (Irianto et al., 2013). In case of the latter,
DNase I of appropriately low concentration is added to the cells and DNA-bound dye signal is
collected over time using a fluorescence microscope. Kinetics of the fluorescence signal decrease
over time reflects chromatin compaction state; the more inclined the fluorescence decay is, the
smaller compaction of chromatin can be expected.
3.11.4 Fluorescence recovery after photobleaching (FRAP) of chromatin associated
proteins
FRAP is a technique based on fluorescence confocal microscopy platform. First, focused laser
beam of high intensity is used to irreversibly bleach a small region of interest (ROI) of a
fluorescently labelled sample of living cells (e.g. GFP). Subsequently, the signal intensity within
ROI is monitored over a period of seconds to several minutes. If the molecule labelled is mobile
and freely travel through the structure, fluorescence recovery within ROI will be very rapid and
complete(as compared to the ROIs signal intensity prior the laser bleaching). However, if the
molecule is immobile, e.g. at least permanently bound or trapped within a complex structure, the
fluorescence recovery will proceed over a very long period of time and may be not fully
accomplished. This versatile and fast technique was suggested to yield wealth of quantitative
information on chromatin structure organisation in living cells with typically histone H3, H2B, H1

32
proteins and chromatin proteins just as HP1 or PCNA, all labelled using fluorescent
proteins(Brown et al., 2006; Wojcik and Dobrucki, 2008;Trembecka-Lucas et al., 2013).
3.11.5 Fluorescence life time imaging of histone proteins
Fluorescence lifetime is a time needed for the number of excited fluorescence molecules to decay
to 1/e of initial population number. Fluorescence lifetime can be affected by various factors
including e.g. Foerster energy resonance transfer (FRET). Consequently measurement of
fluorescence lifetime may serve to indirectly measure FRET. FRET relies on excited state energy
transfer from a “donor” fluorophore to an“acceptor” fluorophore of another type in a proximity
<10nm. Importantly an emission spectra of the first one needs to overlap with absorption spectra of
the latter. This scheme was used to co-label the chromatin of living cells with genetically encoded
histone H2B-EGFP, serving as a FRET donor, and H2B-mCherry as an acceptor (Llères et al.,
2009). While chromatin is relaxed, these two species are randomly distributed along a chromatin
fibre and FRET is unlikely to have a high efficiency. However, upon chromatin condensation,
chromatin fibre undergoes compaction bringing two H2B species closer and, if only to the distance
smaller than 10 nm, facilitating FRET. As a result fluorescence lifetime of a donor (H2B-EGFP)
detectable with an appropriately equipped confocal microscope, undergoes a decrease.
3.11.6 Fluorescence correlation spectroscopy
The other useful biophysical tool to study the chromatin structure is called fluorescence correlation
spectroscopy (abbreviated as FCS). It is based on a confocal microscopy platform and relies on
measurements of fluorescence fluctuations over time collected from a diffraction limited spot
where the excitation light is currently focused. Signal variation over time contains an information
on the diffusing fluorescent probe that happened to localise to the excitation focus at the moment.
Up to date FCS has been applied to a number of chromatin studies in living cells. For instance, it
was used to study linker histone (H1-GFP) dynamics across a cell nucleus and revealed existence
of subclasses of varied mobility (Bernas et al., 2014). The other elegant FCS-based study took
advantage of a multi-scale fluorescence cross-correlation spectroscopy using line illuminating
confocal microscope. In this study the authors demonstrated a varied mobility of inert GFP
monomers (GFP1), trimers (GFP3) and pentamers (GFP5) expressed intracellularlyin human U2OS
cells(Baum et al., 2014).This study revealed that the chromatin constitutes a size-dependent barrier
to intracellular factors and that this feature can be modulated using drugs such as trichostatin A.
3.12Introduction to ischemia
3.12.1 Ischemic disease
Blood is a fluid connective tissue and its fundamental role is to deliver nutrients and oxygen to
other tissues of a body with simultaneous scavenging of metabolic by-products just as carbon
dioxide or urea. Local tissueblood insufficiency, also termed as ischemia, leads to oxygen and
nutrient deprivation and as a consequence may even result in death of an organism depending on
type of affectedtissue. According to World Health Organisation ischemia is currently a leading
cause of human death. Strikingly, its treatment strategy for all types of tissues remains still very
deficient.

33
3.12.2 Specification of an injury in myocardial infarction
Among tissues that manifest the greatest treatment difficulties and most severe repercussions after
ischemia, noteworthy,are the brain and the heart muscle (myocardium). Diseases associated with
these two are called cerebrovascular accident (stroke) and myocardial infarction (heart attack)
respectively. In most cases ischemia-related diseases develop as a result of a blood artery occlusion
due to a retention of a so-called atherosclerotic plaques. In coronary heart disease (CHD, a most
common among myocardial infarction) thisrelates to the blockade of coronary arteries responsible
for blood delivery to the heart muscle.
An increased concentration of apolipoprotein B (a low-density lipoprotein, LDL) can be already a
cause of atherosclerotic plaque formation leading to CHD. More often, however, the disease
originates from multiple sources among which the most prevalent include smoking, diabetes
mellitus, genetic background,andsex (predominance for males)(Bentzon et al., 2014). Noteworthy,
individuals with very low LDL levels generally do not develop atherosclerosis irrespectively of the
other factors(Steinberg et al., 2008). An initial disease mechanism brought about by LDL may
involve other casual effects in later stages of the disease progression:macrophage foam cell
formation, inflammatory cell recruitment, calcification, lipopoprotein recruitment, and thrombosis
(thrombocyte deposits formation). Once a plaque detaches from the artery wall, it may block a
lumen of smaller vessels therefore limiting the blood flow to the respective part of a muscle
leading to e.g. myocardial infarction as a consequence of ischemia.
Myocardium is very susceptible to ischemia due to its profound oxygen and nutrient demand
typical for metabolically active tissues. In the absence of oxygen an oxidative phosphorylation is
terminated leading to mitochondrial membrane depolarisation, ATP depletion,and subsequently
causes a myocard contraction halt(Hausenloy and Yellon, 2013). In the absence of oxygen, cellular
metabolism switches to anaerobic glycolysis resulting in pH decrease due to lactate accumulation
and in parallel Ca2+
overload as a consequence of losing a balance between action of various
intracellular ion pumps(Hausenloy and Yellon, 2013). If ischemia prolonged, all these effects
inevitably lead to cell death and impossibility to rapidly restore the contraction capability of
constantly operating heart muscle.
While the concentration of oxygen in the air amounts to 21.1% (160 mmHg) in organs, it reaches a
value several times smaller depending on oxygen consumption, e.g. only 3.8% (29 mmHg) in a
muscle(Carreau et al., 2011). Upon blood insufficiency the level of oxygen becomes lower than
aforementioned physiological concentration (hypoxia) and general hypoxic stress response is fired.
This involves translocation of cytoplasmic HIF1α (hypoxia inducible factor) transcription factor to
the cell nucleus followed by dimerisation with constitutively expressed nuclear HIF1β. Under
normoxic conditions HIF-1α is hydroxylated on proline 402 and/or proline 564 residues by Prolyl
hydroxylase domain that necessitates inter alia O2 as a substrate. This modification facilitates HIF-
1α ubiquitination and degradation by a proteosome (this in total involves the action of several
factors). Under hypoxia this oxygen-dependent process is believed to be disabledthus increasing
HIF1α stability and abundance of functionally active HIF-1 transcription factor (for review see
(Semenza, 2009)). HIF-1 serves as an activator of genes involved in erythropoiesis (red blood cells
formation), angiogenesis (blood vessel development), glucose transport, andglycolytic enzymes.
All have a priority in expression over the other genes involving the active ATP consumption.

34
3.12.3 Reperfusionfollowing a myocardial infarction
Despite all processes involved in ischemic injury and active response to decreased oxygen level
also the moment of blood restitution (reperfusion) needs to be taken into account in a therapy
design as it may independently lead to death of cells that survived preceding ischemia.Hence, e.g.
myocardial infarction should always be discussed in the context of ischemia-reperfusion
(IR)events.
It has been shown that reperfusion alone may bear responsibility for up to 50% of the total
myocardial infarct size (Yellon and Hausenloy, 2007), hence, it constitutes an important target for
IR therapy. After an abrupt restoration of native conditions, the cell experiences detrimental effects
of oxidative burstleading to e.g. lipid and protein peroxidation (Hausenloy and Yellon,
2013).Succinate has been identified as a metabolite likely driving ROS production during
reperfusion (Chouchani et al., 2014).Furthermore, during reperfusion physiological pH in the
muscle tissue undergoes a rapid restoration what has an effect on mitochondrial permeability
transition pore (MPTP) opening(Lemasters et al., 1996). This in turn results in hypercontracture for
first few minutes of reperfusion due to Ca2+
flux. Interestingly, in animal ischemic heart model,
reperfusion with acidic buffers decreased infarct size (Qian et al., 1997).In addition, reperfusion of
some tissue regions is impaired due to vessel obstruction as cardiomyocyte swell and capillary
compression by endothelial cells. Currently there is no method available to treat the latter;
however, a number of ideas to decrease the effect of reperfusion are existent.
3.12.4 Epigenetic contribution to ischemia-reperfusion in myocardial infarction
Hypoxia is known to activate specific histone modifications at gene promoters but in several
instances was also shown to alter a global epigenetic landscape. Moreover, molecular oxygen is
necessary for functioning of Jumonji dioxygenase domains crucial for operational status of histone
demethylation. This in turn, is reflected in global increase in methylation of H3K4, H3K9, H3K27,
and H3K36 histone residues (Shmakova et al., 2014). Moderate hypoxia is also known to decrease
H3K9 acetylation and increase H3K9 dimethylation (Chen et al., 2006).
Interestingly, not only hypoxia but also reperfusion has a pronounced effect on epigenetic
landscape alteration in myocardium. It has been reported that distinct genes experience changes in
histone modifications (Webster et al., 2013). Also, an addition of histone deacetylase inhibitors just
as trichostatin (TSA) at the onset of reperfusion has been proven to minimise infarct size by half
and limit the induction of HIF1 (Granger et al., 2008). This altogether provides an
incomprehensible picture of epigenetic component involved in IR pointing to a putative alteration
to chromatin structure.

35
4. Objectives of the work presented in the thesis
In this work the following aims were indicated as crucial:
1) Advance single molecule localisation microscopy of the DNA. Test previously established
methods anddevelop new techniques based on single molecule imaging of the DNA dyes
directly binding to the chromatin of eukaryotic cells by:
applying a phenomenon of DNA-binding Hoechst,DAPI, and VybrantViolet UV-
induced photoconversion to their green-fluorescent-emitting forms
investigating the mechanism of binding activated localisation microscopy (BALM)
of DNA dyesvia studying various chemical conditions affecting the chemistry of
the dyes, their interaction with the double stranded DNA as well as manipulate
stability of DNA double-helix. Overarching goal here is to further extend BALM
to imaging eukaryotic cell nuclei.
2) Challenge the validation of inactive-/active- nuclear compartment model of chromatin
organisation by means of newly developed DNA super-resolution imaging methods (point
1).
3) Apply imaging techniques developed in point 1 to investigate the effect of an environment
mimicking conditions of blood insufficiency on the chromatin structure in a mouse
myocardiac cell model. Ascertain an effect of various compounds indicated as clinically
promising on ischemic chromatin architecture.
The aims have been achieved in a series of 4 scientific publications that are included in the results
section (not chronologically). In the Section 11 all associated publications are listed.

36
5. Materials and Methods
5.1 Cell culture
For experiments on ischemia HL-1 cardiac muscle cell line was used: the first cardiac cell line able
to maintain its differentiated phenotype over the serial passages(Claycomb et al., 1998). Among
the features that HL-1 line retains are: the gene expression profile similar to that of adult atrial
myocytes, the ability to contract in a cell culture, the distribution of the cardiac-specific markers
just as desmin, sarcomeric myosin, and atrial nutriuretic factor, and confirmed existence of
myofibrils in the cytoplasm (Claycomb et al., 1998). These cells are a kind gift from Prof. William
Claycomb, LSU New Orleans School of Medicine, USA. HL-1 cells were cultured on tissue plates
coated with 0.002% gelatine and 0.005mg/ml fibronectin (F-1141, Sigma-Aldrich) and in 37oC /
5% CO2 / 95% humidity in a Claycomb culture medium (51800C, Sigma-Aldrich) supplemented
with 10% fetal bovine serum (FBS, F2442, Sigma-Aldrich), 2 mM L-glutamine (17-605E, Lonza)
and 0.1 mM norepinephrine. Cells were passaged every 3 days once full confluency reached.
In order to influence chromatin structure while HL-1 cells in oxygen and nutrient deprivied
conditions (OND), following pretreatments were used: i) 5 µM trichostatin A (HDAC inhibition)
for 1h and ii) 100 or 200 µM difluoromethylornithine (ornithine decarboxylase inhibitor) for 48h,
both prior to OND treatment.
To investigate DNA staining for super-resolution microscopy we used HeLa cervical cancer cells
and VERO-B4African green monkey kidney fibroblast cultured in following media: Dulbecco‟s
Modified Eagle‟s Medium (BE12-614F, Sigma-Aldrich) with phenol red (first) and RPMI w/o
phenol red (32404-014, Gibco, latter), both supplemented with 10% FBS and 100 U/ml penicillin
and 0.1 mg/ml streptomycin (Gibco). For cell passage 0.25% trypsin-EDTA (25200-056,
Lifetechnologies, UK) was used. For HeLa cells stably transfected with H2B-mCherry (kindly
provided by IMB-Mainz Core Facility Microscopy) and H1.1-GFP (obtained from Dr. Mirosław
Zarębski, Jagiellonian University, Kraków) same culture conditions were used as for regular HeLa
cells.
Hodgkin‟s lymphoma cell line HDLM-2 was prepared for microscopy as previously reported with
few modifications (Righolt et al., 2014). After formaldehyde fixation cells were attached on poly-
L-lysine coated coverslips, permeabilised with 0.1% TX-100 for 10 min, RNase treated in 37oC
overnight same as mentioned above. These cells were provided by Prof. Sabine Mai, University of
Manitoba, Canada and Prof. Dr. Hans Knecht, Universite de Sherbrooke, Quebeck, Canada.
Neuroblastoma Neu-2a (ATCC® CL-131™) cells (obtained from Dr. V. Tiwari, IMB Mainz,
Germany) were cultured in 37oC and high humidity in Dulbecco‟s modified Eagle medium
supplemented with L-glutamine (Gibco), nonessential amino acids (11140050, Thermofisher), and
10% FBS (Gibco, Germany) and penicillin and streptomycin.
5.2 Oxygen and Nutrient Deprivation (OND) protocol for ischemia model
Living HL-1 cells were washed twice with phosphate-buffered saline (PBS, BE17-512F/12, Lonza)
and placed in a hypoxia chamber (Whitley Hypoxystation H35) providing a following atmospheric
conditions: 1 % O2,5% CO2, 94 % N2 at 37 °C and 70–85 % humidity. In order to simulate the
ischemic environment, cells were incubated in a medium containing 115 mM NaCl, 12 mM KCl,

37
1.2 mM MgCl2, 2 mM CaCl2, 25 mM HEPES (H3375, Sigma-Aldrich) and 5 mM 2-Deoxy-D-
glucose (D8375, Sigma-Aldrich), all pre-equilibrated to 1 % O2 for ~1h in hypoxia station
(inspired by a recipe of (Vivar et al., 2012)). OND treatment lasted for 1 hour and was followed by
a wash with PBS and return to the Claycomb medium under normoxic conditions. This continued
for 0 (OND), 5, 15, 60 and 240 minutes following OND. Such an abrupt recovery was designed to
mimic reperfusion after the ischemic event cessation as would happen in a medical treatment. Non-
recovered OND-treated cells were harvested and fixed in a hypoxic atmosphere. Untreated cells
were kept under normal culture conditions until fixation.
5.3 Immunofluorescent staining protocols
Cells were grown on gelatine / fibronetctin coated cover-slips inserted in six-well plates (2 ml of
Claycomb or OND buffer was used). Cells were then washed twice with PBS, fixed in 1 ml ice
cold methanol (8388.5, Carl Roth) for 10 min, washed with PBS and permeabilised with 1 ml PBS
containing 0.3% Triton X-100 (T8787, Sigma-Aldrich) and 0.3% Tween-20 (P1379, Sigma
Aldrich) for 10 minutes at room temperature (RT). This was followed by 1h incubation with 1 ml
blocking buffer containing 5% bovine serum albumin (BSA) and 0.1% Tween-20, all in PBS, RT.
Cells were then incubated with anti-H3 (ab1791, Abcam, 1 μg/ml), anti-H3K14ac (5275s, Cell
Signalling, 1:500), anti-Lamin B1 (ab16048, Abcam, 1 μg/ml) antibodies overnight at 4 °C in 500
μl blocking buffer. Subsequently, samples were washed three times with 1 ml PBS containing
0.1% Tween-20 and incubated with Alexa 488 (A-11034, Invitrogen) or Alexa 647(A-21245,
Invitrogen) conjugated secondary antibody (2 μg/ml) for 1 h in 1 mlPBS containing 0.1% Tween-
20. Then, samples were washed trice using the same buffer.
5.4 Confocal microscopy
For fluorescence intensity measurements of dye DNA-association and DNA-unbinding over time
in an entire cell nuclei we used an inverted Leica SP5 Confocal microscope equipped with 63x/1.4
NA objective lens and a Hybrid detector suited for photon counting (Leica Microsystems,
Germany). The 488 nm line of an argon laser was used for excitation and fluorescence of DNA
bound YOYO-1, YOPRO-1, and PicoGreen (all purchased from Lifetechnologies except
PicoGreen which was a kind gift from Prof. Sabine Mai, Cancer Care Manitoba, Winnipeg,
Canada) detected in the 490 - 560 nm emission range; 512 x 512 pixel images from 5 - 6 fields of
view. The pixel size, object plane equivalent corresponded to 303 nm. Measurements were
performed on 3.7% formaldehyde fixed (for 10 min) and 0.5% Triton X-100 (10 min) treated HeLa
cells grown on 500 μl μ-slide 8-well chambers with a microscopic-glass bottom (IBIDI, Germany).
All cells were treated with 0.5 U/ml RNase A and 20 U/ml RNase T1 (AM2286, Ambion, USA) in
37oC overnight to diminish DNA non-related signal. For dye dissociation studies cells were stained
with 12 nM YOYO-1 for 1h, 1:10,000 PicoGreen for 40 min, or 30 nM YO-PRO-1 for 40 min
(500 μl volume). Cells were washed with PBS overnight to ensure lack of freely diffusing dye in
the solution that could potentially bind to the chromatin due to e.g.possible enhanced chromatin
permeability. For dye association studies, an initial 'background' image was acquired in 250 μl of
PBS (Gibco) and this was followed by the addition of 250 μl of 2x concentrated dye solution.
Images were acquired every 2 min. For the dye dissociation assay we used the same method with
few exceptions: for studies on pH dependence, an initial image was performed in 100 μl distilled

38
water that wasthereafter replaced with a buffer of a given pH; these images were acquired every 4
min for 30 min.
To investigate achange to the overall chromatin structure inflicted by different SMLM-imaging
media (Publication 3)we used 3D confocal microscopy followed by deconvolution (SVI 3D
Huygens Deconvolution & Analysis Software, Scientific Volume Imaging B.V., Hilversum,
Netherlands). HeLa cells were grown as indicated above on 8-well slides, incubated for 12 min
with 10 μM 5-ethynyl-2‟-deoxyuridine (EdU), and fixed with 3.7% formaldehyde followed by
0.5% TX-100. “Click-it” Alexa 555 fluorophore conjugation was performed according to
manufacturer's instructions (Lifetechnologies). This approach enables the 3D imaging of
chromatin-bound reference points before and after a hypothetical structural change inflicted by an
imaging buffer. Confocal images were acquired with a voxel size of 60 nm in an object plane and
with a z-stepof 130 nm. Next, using ImageJ plugin 3D Foci Picker calculating centres of
fluorescence gravity maxima were found to identify the exact 3D position of these foci. Each data
stack was separately evaluated and visually inspected for the quality of maxima hits. Further, the
resulting list of foci coordinates was used to calculate nearest neighbour distances in MATLAB
(Mathworks). 5 cells were evaluated per condition before and after subjecting them to the acidic
treatment including following conditions: (i) 20 min of treatment with a buffer of pH=3.6, (ii) 4h
incubation with 0.5 mg/ml glucose oxidase (GOX, G2133, Sigma-Aldrich), 40 µg/ml catalase
(CAT, 850187, Sigma-Aldrich) and10 % (w/v) glucose prepared freshly, (iii) 20 min treatment
with same GOX/CAT buffer prepared 7h before. In order to quantitatively express a change to
chromatin structure we subtracted the mean value after treatment from the respective mean value
of the same cell prior to the treatment. The outcome of a negative value reflects shrinking whereas
the positive outcome reflects nuclear structure expansion. Nuclear volumein these 3D CLSM
images was calculated by determination of a convex-hull using foci 3D coordinates in MATLAB.
In order to calculate the change in the cell nuclear volume (Δ) a following formula was used: Δ=1-
Vbefore/Vafter, where V corresponds to the estimated volume.
5.5 Fluorescence recovery after photobleaching (FRAP)
In order to infer on chromatin dynamics in live cells, FRAP experiments on H2B-mCherry and
H1.1-GFP histones stably expressed in HeLa cervical cancer cells were performed (for other
details on this methodology see section 3.11.4). Cells seeded at low confluency of ~15% were
subjected to the OND and embedded in 200 µl of either OND buffer or original culture medium in
case of untreated cells. Subsequently, coverslips were fixed to the glass slide with a cavity and
sealed using a Picodent Twinsil fixative (1300 1000, Picodent) preventing from any further
oxygenation. FRAP measurements were performed in 37oC for no longer than 1h 15min and this
time was strictly monitored.
For mCherry FRAP acquisitions following settings were used: bleaching was carried out by one
256 x 256 pixel scan in 2 x 2 µm2 ROI with 80% of 561 nm laser line, after bleaching images were
acquired every 0.328 s with a resolution of 256 x 256 pixels (pixel size corresponding to 96.5 nm)
with an excitation of 6% of 561 nm laser line, mCherry emission was collected between 602 – 711
nm and measured in 2 x 2 µm2 ROI.
For GFP FRAP acquisitions following settings were used: point bleaching was carried out by
parking the focused 488 nm laser line for 100 ms (80 % power), after bleaching images were
acquired every 1 s with a resolution of 256 x 256 pixels (pixel size corresponding to 96.5 nm) with

39
an excitation of 13% of 488 nm laser line, mCherry emission was collected between 500 – 591 nm
and measured in 1.5 µm in diameter circular ROI.
Three images were acquired prior bleaching. More than 10 cells were measured for each group.
FRAP data processing was carried out as previously described in (Trembecka-Lucas et al., 2013)
with a following modification: every individual measurement was further processed using ImageJ
plugin StackReg, http://bigwww.epfl.ch/thevenaz/stackreg/(P. Thévenaz, U.E. Ruttimann, 1998).
Rigid body function was used to correct for cell movement during the measurement with respect to
the first frame. Curves were averaged and presented with a standard deviation as an error
estimator.
5.6 DNase I digestion susceptibility assay
HL-1 cells were seeded in 8-well µ-slide (IBIDI) at the density of 0.01x10⁶ per well and grown for
two days. They were then fixed using 4% PFA (16005, Sigma-Aldrich) on ice for 15 min,
permeabilised with 0.3% TX-100 for 10min and 30 min stained using 5 µM DNA binding dye
DRAQ5 (ab108410, eBioScience). Samples were mounted on to the confocal microscope stage
(see section 5.4). Each well contained 250 µl respective DNase buffer and twice concentrated
DNase I solution was added (M0303S, New England Biolabs, final solution 5 U/ml). Fluorescent
signal of DRAQ5 was monitored over time with following parameters: 7% 633 nm HeNe laser
excitation, fluorescent collection using HyD detector between 643 and 749 nm, 512 x 512 images
were acquired with 600 Hz scanner speed, 2AU confocal pinhole width, pictures were taken every
4min. Fluorescent decays were analysed using ImageJ plugin Time Series Analyzer
(https://imagej.nih.gov/ij/plugins/time-series.html). Fluorescent decays from separate cells in the
field of view were averaged and presented with standard deviation.
5.7 Super-resolution single molecule localisation microscopy (SMLM)
5.7.1 SMLM sample preparation
In all cases the cells were grown on 20 x 20 x 0.017 mm3
microscopy coverslips. After 8 min
fixation with 4% formaldehyde and following permeabilisation using 1% Triton X-100 (5
minutes), the VERO-B4 cells were washed with PBS and incubated with a 1 ml 0.2 mg/ml, 37oC
RNase A for at least 1h. Next, the cells on cover-slips were stained for 30 min with 1 ml water
solution of Vybrant®DyeCycle™ Violet (VdcV, V35003, LifeTechnologies) at the concentration
range 10 nM - 5 µM. Subsequently, they were washed with PBS and embedded in an imaging
buffer containing 90% glycerol (G5516, Sigma-Aldrich), 10% (w/v) glucose (G0350500, Sigma
Aldrich), and0.5 mg/mlglucose oxidase (GOX) and 40 µg/ml catalase (CAT). Similar procedure
was used for Hoechst 33342, Hoechst 33258, and DAPI staining in HeLa cells;concentrations used
were as follows: 0.1 µg/ml, 0.2 µg/ml, and 0.1 µM, respectively. For chromosome spreads a
mitotic block on HeLa cells was carried out with 126 µM vinblastine for 4 h followed by a wash
with medium. Next, the medium containing mitotic cells was collected and spinned down (150 g, 5
min). The cell pellet was resuspended in 5 ml 75 mM KCl water solution for 10 min and
subsequently, we added 5 ml fixative (3: 1 glacial acetic acid: methanol) and centrifuged them
again (150 g, 5 min). Finally, the cells were re-suspended in ice cold fixative. This step was
repeated at least 4 times. Such cell suspension with 6 ng/ml Hoechst 33258 was dropped on a

40
cover-slip in horizontal position and air-dried until the fixative evaporated. DNA fibre analysis was
attempted utilising a previously published protocol of (Schwab and Niedzwiedz, 2011).
For DNA strucuture fluctuation assisted BALM (fBALM) cells were stained with 12 nM YOYO-1
(1ml) for ~1h followed by an extensive wash. PBS based imaging buffer was used and contained
0.5 mg/ml glucose oxidase, 40 µg/ml catalase and 10% (w/v) glucose with an initial pH=7.6
decreasing over time down to pH~3.7. As a control we used an enzymatic oxygen scavenging
system that maintains a stable pH even over a period of several hours (Swoboda et al., 2012). It is
based on 5 U/ml glucose pyranose, 57 µg/ml catalase, and 10% (w/v) glucose. A cover-slip was
embedded in ~25 - 30 µl of the same imaging buffer and fixed to the glass slide using a Picodent
Twinsil cement. For this study we chose methanol-based fixation, as previously the DNA was
reported to be slightly more resistant to denaturation while formaldehyde used (Traganos et al.,
1975).
For super-resolution imaging of replicated DNA HL-1 cells were treated for 10 min with 10 µM
EdU and fixed with 3.7% formaldehyde. Then,conjugation by means of the “click-it” reaction with
Alexa 488 was performed according to the protocol of the manufacturer (Life Technologies).
Measurements were carried out in glycerol-based ProlongGold (Lifetechnologies) as a mounting
medium, as in our hands this medium reduces the extent of multiple blinking and increases Alexa
488 photoncount. Immunofluorescence against histone H3(Alexa 647) was performed same as
described in previous section (section5.3). In this case, an imaging buffer based on PBS, GOX, and
CAT was used, and contained 50 mM MEA as a switching agent known to induce a formation of a
non-fluorescent long-lived radical state under exposure to an exciting light (Dempsey et al., 2009;
Vogelsang et al., 2008).
5.7.2 Measurements
Super-resolution experiments were performed on a custom built widefield microscope described in
detail in supplementary materials toPublication 1. Briefly, the microscope was equipped with air-
cooled 12 bit CCD camera (SensiCam QE, PCO imaging) and a 63x, 1.4 NA oil immersed
objective. Pixel size object plane equivalentcorresponded to 102 nm. A 491 nm diode laser was
used for excitation (Calypso 05 series, Cobolt, Sweden) with an intensity in the sample plane of 1 -
2 kW/cm2. This was achieved through a collimation ofa laser beam. For Hoechst and DAPI an
additional 405 nm illumination (~2 W/cm2) was used to accelerate photoconversion to the green-
emitting form.Fluorescence of Hoechst, VybrantViolet, and YOYO-1 was captured after passing
through a 525/50 nm bandpass filter (Chroma Technology Corp.) and through 630(90) filter (FF01-
630/92, Semrock) for Hoechst dyes only. 20,000 - 30,000 frames with an integration time of 20 ms
(YOYO-1), 65 ms (Hoechst, DAPI), and 50 ms (VybrantViolet) were acquired and converted into
16-bit .tiff stacks. For conventional image of imaged structure, typically three images prior to a
SMLM acquisition were acquired and averaged for a better quality. For EdU-Alexa 488 labelled
cells, 3,000 - 5,000 frames with 50 ms camera integration time were acquired. For H3-Alexa 647
and Lamin B1-Alexa 647, 25,000 frames with 25 ms camera integration time were acquired; ~2
kW/cm2 647 nm diode laser intensity was used for excitation (LuxX, Omicron, Germany).
41
5.7.3 Data analysis and visualisation
In order to reconstruct single molecule localisation images we used fastSPDM updated MATLAB-
based software (https://code.iri.uni-frankfurt.de/trac/microscopy) (Gruell et al., 2011). We found
that it performs better on noisy data with conceivable out-of-focus background and such a situation
is usually encountered while SMLM of 3D intact cell nuclei is performed. Individual molecule
signals of peak intensity exceeding 3x noise standard deviation were analysed (here a simplified
Poisson noise distribution was assumed as a CCD camerawas used). Single molecule signals
appearing in subsequent frames were merged if they were localised closer than 2x the average
localisation precision (yielding 95.4% confidence assuming Gaussian localisation precision
distribution). In order to eliminate overlapping signals and strong out-of-focus signals, both
affecting adversely the final image resolution (Burgert et al., 2015), approximately 30% of single
molecule localisations were removed based on their (large) point spread function width. Drift
correction was implemented via a cross-correlation analysis between intermediate reconstructions
from typically 1,000 frame samples. After interpolation of discrete values, the list of single
molecule x and y positions was altered according to the frame index. As a result of correction, the
standard deviation of less than 5 nm between sample images was obtainable for DNA-density
images.
The structural resolution in the SMLM images as either estimated using a formulae by (Legant et
al., 2016) introduced in a section 3.4 or by a Fourier ring correlation (FRC) analysis using a
custom written MATLAB program similar to the method described in (Banterle et al., 2013;
Nieuwenhuizen et al., 2013). Single molecule localisation list was randomly split into halves and
Fourier analysis was carried out for each separately. The correlation between their Fourier images
was performed within concentric rings radially expanding from the 0th frequency. A 1/7
experimental cut-off was used to read out the FRC resolution from the intersection with FRC
polynomial fit (25th order).
Chromatin density distribution analysis in our super-resolution images of DNA was done by
binning the single molecule localisation data in a 60 x 60 nm2 grid using a hist3 MATLAB
function. Histograms of the number of single molecules per square bin and their cumulative
probability were calculated using Origin 8.6 software (OriginLab). We found that grid size of 20 to
100 nm yielded very similar results. For signal intensity periodicity in super-resolution images
signal was measured using a line-intensity profiles followed by and autocorrelation analysis
usingautocorr MATLAB function.
Images of VybrantViolet and Hoechst were visualised using a gaussian blur with an average
localisation precision (Vybrant) or respective localisation precision (Hoechst). However, gaussian
rendering of SMLM data may lead to 1.41 loss in image resolution (Baddeley et al., 2010). In order
to account for this downside, afollowing Matlab routine was implemented: it generates “Wigner-
Seitz cells” for the DNA localisation map where “cell‟s” signal intensity depends inversely on its
area.Next, a random jittering of single molecule coordinates by 100 times within the respective
localisation precision is carried out. Finally, all these images are jointly plotted in a final averaged
reconstruction with a pixel size corresponding to 5 nm. This procedure slightly smoothens the
image and hence helps to perceive structures. It is similar to a triangulation concept utilising rather
triangles than Wigner-Seitz “cells”, it is not prone to generation of artefacts, and maintains linear
proportion between image intensity and localisation density (Baddeley et al., 2010).

42

43
6. Results
The following section contains a series of publications published during the time-course of this
work (not all that were published). First three comprise a general information on super-resolution
DNA methodology development utilising the phenomenon of DNA-bound label photoconversion
(Publications 1 - 2) as well as through studying the interaction of DNA-binding (intercalating)
dyes with the DNA subject to structure instability in a presence of denaturing conditions
(Publication 3). Publication 4 elaborates on the effects of transient ischemia on chromatin
architecture in mouse myocardiac HL-1 cells studied using aforementioned methodology as well as
by a multiple other approaches. For a full list of publications of mine see Section 11, Associated
publications.

44

45
6.1 Publication 1
Single molecule localization microscopy of the distribution of
chromatin using Hoechst and DAPI fluorescent probes
Szczurek, Aleksander T.*, Prakash, Kirti*, Lee, Hyun-Keun*, Żurek-Biesiada, Dominika J., Best,
Gerrit, Hagmann, Martin, Dobrucki, Jurek W., Cremer, Christoph, Birk, Udo
(*equal contribution)
Nucleus, 2014, Volume 5, Issue 4, DOI:10.4161/nucl.29564
Abstract:
Several approaches have been described to fluorescently label and image DNA and chromatin in
situ on the single-molecule level. These superresolution microscopy techniques are based on
detecting optically isolated, fluorescently tagged anti-histone antibodies, fluorescently labeled
DNA precursor analogues, or fluorescent dyes bound to DNA. Presently they suffer from various
drawbacks such as low labeling efficiency or interference with DNA structure. In this report, we
demonstrate that DNA minor groove binding dyes, such as Hoechst 33258, Hoechst 33342, and
DAPI, can be effectively employed in single molecule localization microscopy (SMLM) with high
optical and structural resolution. Upon illumination with low intensity 405 nm light, a small
subpopulation of these molecules stochastically undergoes photoconversion from the original blue-
emitting form to a green-emitting form. Using a 491 nm laser excitation, fluorescence of these
green-emitting, optically isolated molecules was registered until "bleached". This procedure
facilitated substantially the optical isolation and localization of large numbers of individual dye
molecules bound to DNA in situ, in nuclei of fixed mammalian cells, or in mitotic chromosomes,
and enabled the reconstruction of high-quality DNA density maps. We anticipate that this approach
will provide new insights into DNA replication, DNA repair, gene transcription, and other nuclear
processes.

46

47
6.2 Publication 2
Localization microscopy of DNA in situ using Vybrant®DyeCycle™
Violet fluorescent probe: A new approach to study nuclear
nanostructure at single molecule resolution.
Żurek-Biesiada, Dominika, Szczurek, Aleksander T., Prakash, Kirti, Mohana, Giriram K., Lee,
Hyun-Keun, Roignant, Jean-Yves, Birk, Udo J., Dobrucki, Jurek W., Cremer, Christoph
Experimental Cell Research, Volume 343, Issue 2, Pages 97-106, 2016,
DOI: 10.1016/j.yexcr.2015.08.020
Abstract:
Higher order chromatin structure is not only required to compact and spatially arrange long
chromatids within a nucleus, but have also important functional roles, including control of gene
expression and DNA processing. However, studies of chromatin nanostructures cannot be
performed using conventional widefield and confocal microscopy because of the limited optical
resolution. Various methods of superresolution microscopy have been described to overcome this
difficulty, like structured illumination and single molecule localization microscopy. We report here
that the standard DNA dye Vybrant®DyeCycle™ Violet can be used to provide single molecule
localization microscopy (SMLM) images of DNA in nuclei of fixed mammalian cells. This SMLM
method enabled optical isolation and localization of large numbers of DNA-bound molecules,
usually in excess of 106 signals in one cell nucleus. The technique yielded high-quality images of
nuclear DNA density, revealing subdiffraction chromatin structures of the size in the order of
100nm; the interchromatin compartment was visualized at unprecedented optical resolution. The
approach offers several advantages over previously described high resolution DNA imaging
methods, including high specificity, an ability to record images using a single wavelength
excitation, and a higher density of single molecule signals than reported in previous SMLM
studies. The method is compatible with DNA/multicolor SMLM imaging which employs simple
staining methods suited also for conventional optical microscopy.

48

49
6.3 Publication 3
Imaging chromatin nanostructure with binding activated localisation
microscopy using DNA structure fluctuations.
Szczurek, Aleksander T., Klewes, Ludger, Xing, Jun, Gourram, Amine, Birk, Udo, Knecht, Hans,
Dobrucki, Jurek W., Mai, Sabine, Cremer, Christoph
Nucleic Acids Research, Accepted Manuscript, December, 2016
Abstract:
Advanced light microscopy is an important tool for nanostructure analysis of chromatin. In this
report we present a general concept for Single Molecule Localisation Microscopy (SMLM) super-
resolved imaging of DNA-binding dyes based on modifying the properties of DNA and the dye. By
careful adjustment of the chemical environment leading to local, reversible DNA melting and
hybridization, control over the fluorescence signal of the DNA-binding dye molecules can be
introduced. We postulate a transient binding as the basis for our variation of binding-activated
localisation microscopy (BALM). We demonstrate that several intercalating and minor-groove
binding DNA dyes can be used to register (optically isolate) only a few DNA-binding dye signals
at a time. To highlight this DNA single-to-double stranded structure fluctuation-assisted BALM
(fBALM), we applied it to measure, for the first time, nanoscale differences in nuclear architecture
in model ischemia with an anticipated structural resolution of approximately 50 nm. Our data
suggest that this approach may open an avenue for the enhanced microscopic analysis of chromatin
nano-architecture and hence the microscopic analysis of nuclear structure aberrations occurring in
various pathological conditions. It may also become possible to analyse nuclear nanostructure
differences in different cell types, stages of development, or environmental stress conditions.

50

51
6.4 Publication 4
A transient ischemic environment induces reversible compaction of
chromatin.
Kirmes, Ina*, Szczurek, Aleksander T.*, Prakash, Kirti, Charapitsa, Iryna, Heiser, Christina,
Musheev, Michael, Schock, Florian, Fornalczyk, Karolina, Ma, Dongyu, Birk, Udo, Cremer,
Christoph, Reid, George, (* equal contribution)
Genome Biology, 2015, Volume 16, Issue 1, Pages 246
DOI: 10.1186/s13059-015-0802-2
Abstract:
BACKGROUND: Cells detect and adapt to hypoxic and nutritional stress through immediate
transcriptional, translational and metabolic responses. The environmental effects of ischemia on
chromatin nanostructure were investigated using single molecule localization microscopy of DNA
binding dyes and of acetylated histones, by the sensitivity of chromatin to digestion with DNAseI,
and by fluorescence recovery after photobleaching (FRAP) of core and linker histones. RESULTS:
Short-term oxygen and nutrient deprivation of the cardiomyocyte cell line HL-1 induces a
previously undescribed chromatin architecture, consisting of large, chromatin-sparse voids
interspersed between DNA-dense hollow helicoid structures 40-700 nm in dimension. The
chromatin compaction is reversible, and upon restitution of normoxia and nutrients, chromatin
transiently adopts a more open structure than in untreated cells. The compacted state of chromatin
reduces transcription, while the open chromatin structure induced upon recovery provokes a
transitory increase in transcription. Digestion of chromatin with DNAseI confirms that oxygen and
nutrient deprivation induces compaction of chromatin. Chromatin compaction is associated with
depletion of ATP and redistribution of the polyamine pool into the nucleus. FRAP demonstrates
that core histones are not displaced from compacted chromatin; however, the mobility of linker
histone H1 is considerably reduced, to an extent that far exceeds the difference in histone H1
mobility between heterochromatin and euchromatin. CONCLUSIONS: These studies exemplify
the dynamic capacity of chromatin architecture to physically respond to environmental conditions,
directly link cellular energy status to chromatin compaction and provide insight into the effect
ischemia has on the nuclear architecture of cells.

52

53
6.5 Chromatin structure in OND can be affected
6.5.1 Histone dynamics in OND can be affected by inhibition of specific enzymes
In order to test the putative involvement of polyamines in chromatin compaction revealed by
super-resolution microscopy of the DNA (Publications3-4), a following experimental design was
conceived.
Ornithine decarboxylase (ODC) is an enzyme involved in polyamine metabolism; it catalyses
decarboxylation of a product of urea cycle named ornithine to form putrescine (the shortest among
polyamines). ODC inhibition can be performed using an ornithine analogue
difluoromethylornithine (DFMO)(Raul, 2007): leading to an immediate decrease in putrescine and,
after few hours, to a decrease in intracellular concentration of other polyamines just as sperimidine.
Thus, we decided to treat HeLa cells stably expressing H1.1-GFP histone to study the effect of this
inhibitor on chromatin dynamics using fluorescence recovery after photobleaching (FRAP).
Figure 12A demonstrates that the cells in OND suffer from decreased H1.1-GFP mobility as
compared with untreated cells (in line with the results in Publication 4). Interestingly, DFMO
treatment for 48h prior tothe OND treatment partially recovers the original mobile behaviour of
histone H1.1-GFP and fully restores an immobile fraction in OND cells (final signal level for olive
and orange curves). Whereas with FRAP the differences are clear, theconfocal microscopyimages
alone are rather hard to interpret and provide very illusive hint to this chromatin change (data not
shown).
Figure 12. Inhibition of specific nuclear enzymes influences histone H1.1-GFP mobility in OND as
revealed by FRAP analysis.Fluorescence recovery curves are presented. A) HeLa cells stably
transfected with H1.1-GFP histone were subject to 48h 100 µM ornithine decarboxylase inhibitor
difluoromethylornithine (DFMO) treatment and then to oxygen and nutrient deprivation protocol for 1h
in the absence (orange) and presence (olive) of DFMO. For comparison fluorescence recovery curves
for OND alone (red), untreated (black), and untreated with DFMO (grey) are presented.B) Fluorescence
recovery curves for the cells subject to 1h treatment with 5 µM trichostatin A (TSA) inhibiting histone
deacetylases prior to OND (orange), 1h prior and during OND (olive), OND (red), untreated (black),
and the cells treated with TSA for 1h without OND (grey). Error bars, correspond to a standard
deviation, more than 10 measurements per curve were carried out. FI – fluorescence intensity.
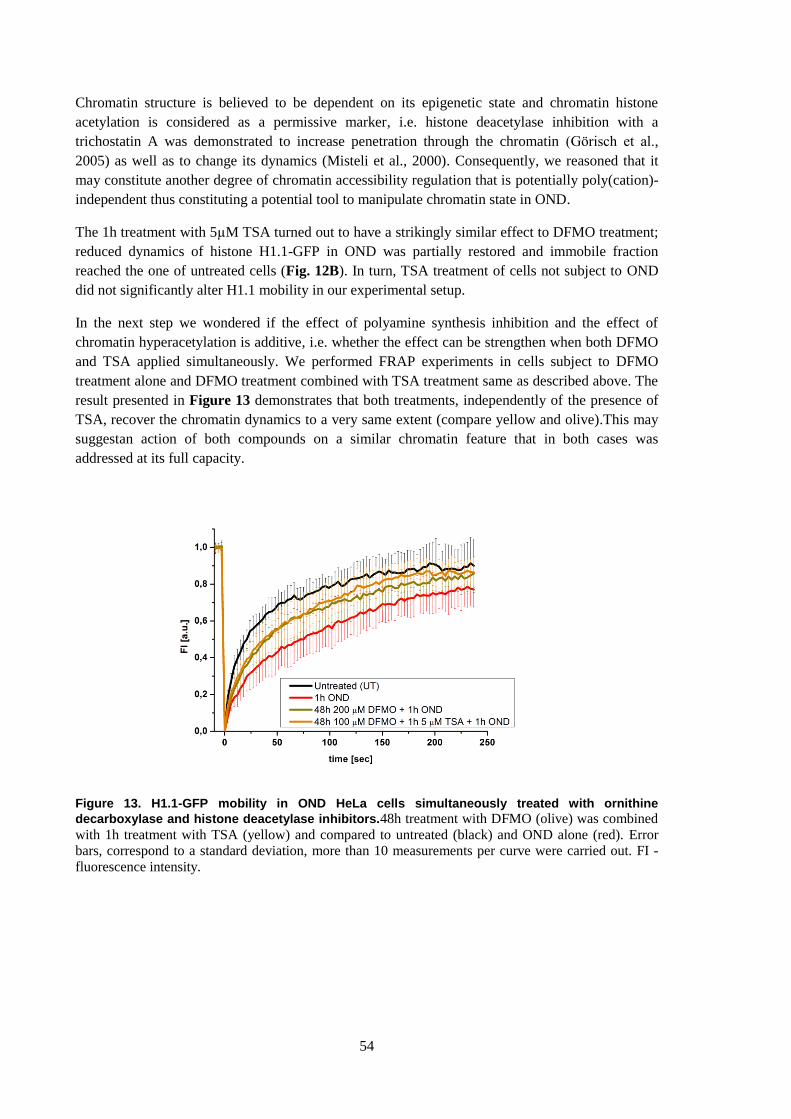
54
Chromatin structure is believed to be dependent on its epigenetic state and chromatin histone
acetylation is considered as a permissive marker, i.e. histone deacetylase inhibition with a
trichostatin A was demonstrated to increase penetration through the chromatin (Görisch et al.,
2005) as well as to change its dynamics (Misteli et al., 2000). Consequently, we reasoned that it
may constitute another degree of chromatin accessibility regulation that is potentially poly(cation)-
independent thus constituting a potential tool to manipulate chromatin state in OND.
The 1h treatment with 5µM TSA turned out to have a strikingly similar effect to DFMO treatment;
reduced dynamics of histone H1.1-GFP in OND was partially restored and immobile fraction
reached the one of untreated cells (Fig. 12B). In turn, TSA treatment of cells not subject to OND
did not significantly alter H1.1 mobility in our experimental setup.
In the next step we wondered if the effect of polyamine synthesis inhibition and the effect of
chromatin hyperacetylation is additive, i.e. whether the effect can be strengthen when both DFMO
and TSA applied simultaneously. We performed FRAP experiments in cells subject to DFMO
treatment alone and DFMO treatment combined with TSA treatment same as described above. The
result presented in Figure 13 demonstrates that both treatments, independently of the presence of
TSA, recover the chromatin dynamics to a very same extent (compare yellow and olive).This may
suggestan action of both compounds on a similar chromatin feature that in both cases was
addressed at its full capacity.
Figure 13. H1.1-GFP mobility in OND HeLa cells simultaneously treated with ornithine
decarboxylase and histone deacetylase inhibitors.48h treatment with DFMO (olive) was combined
with 1h treatment with TSA (yellow) and compared to untreated (black) and OND alone (red). Error
bars, correspond to a standard deviation, more than 10 measurements per curve were carried out. FI -
fluorescence intensity.

55
6.5.2 fBALM of cells treated with inhibitors of polyamine synthesis and histone
deacetylation
FRAP experiments on H1.1-GFP provided feasibly quantitative information and helped in
revealing a potentially preventive role of TSA and DFMO from OND-induced chromatin
compaction. Nevertheless, histone H1.1 is only one of numerous proteins associated with
chromatin and in principle its dynamic movement throughout the chromatin might be assumed to
undergo an alteration upon change to the underlying chromatin structure (density). Therefore, we
decided to investigate the latter by applying DNA structure fluctuation assisted binding activated
localisation microscopy (fBALM) developed in the time-course of this work.
As expected, using fBALM high resolution imaging, chromatin condensation in OND became
clearly seen; whereas untreated cells appear to have a sponge-like structure, the interchromatin
compartment upon OND undergoes an expansion and integration (Fig. 14). In turn, in OND cells
treated with TSA and DFMO, still the lion‟s share of chromatin remains in its compacted state.
Although hard to judge, the overall impression suggests a slightly decreased compaction state.
Confocal microscopy and cytometric analysis of immuno-labelled H3K14ac and H3K9ac
confirmed hyperacetylated state of chromatin incells treated with OND and TSA (data not shown).
Figure 14. DNA structure fluctuation assisted binding activated localisation microscopy of HL-1
cells.The cells were a subject to oxygen and nutrient deprivation (OND) combined with 1h 5 µM
trichostatin A (TSA) or 48h 100 µM difluoromethylornithine (DFMO) treatment. fBALM images
demonstrate typical cell phenotypes. Scale bar corresponds to 2 µm.

56
7. Discussion
7.1 Methodological advancement of chromatin imaging using single molecule
localisation microscopy
In this work two novel approaches to visualise chromatin at enhanced resolution were presented.
Both rely onusage of directly binding DNA-dyes, single molecule fluorophore localisation, and
non-classical mechanisms of fluorescence photoswitching involving no formation of a radical state
of a fluorophore(Dempsey et al., 2009; Heilemann et al., 2008; Vogelsang et al., 2008; Dempsey et
al., 2009). Both of these methodological advancements contribute substantially to broadening the
knowledge on novel mechanisms of photoswitching and extend the application range of single
molecule localisation microscopy to cell nucleus.
7.1.1 SMLM using photoconversion of Hoechst and VybrantViolet dyes to their
green-emitting forms
From the methodological point of view this technique (Publications 1 and 2) bears a strong
resemblance to photoactivated localisation microscopy (PALM)(Betzig et al., 2006)typically
relying on photoactivatable or photoconvertible fluorescent proteins (FPs). In this approach,
however, FPs were not used but instead low molecular weight dyes from (bis)benzimidazole
family were chosen. Typical methodological scheme is based on light-induced (say
“photoconverting” wavelength 1) conversion of very few, single molecules of a fluorophore to a
distinct spectral state excitable witha separate wavelength(say “exciting” wavelength 2)and
fluorescing in a distinct part of the spectrum. This way, by simultaneous or sequential illumination
with wavelengths 1 and 2 along with insertion of an appropriate emission filter, one separates these
few isolated signals of photoconverted form that can be localised in space using SMLM principles
(for details see section 3.4).
In the approach presented in this work cellular DNA was labelled with DAPI or Hoechst dyes and
subsequently exposed to a very low 405 nm illumination (Ip~ W/cm2, “photoconverting”) together
with high intensity 491 nm illumination (Ie~ kW/cm2, “exciting”). Whereas these dyes typically
emit in blue range of the visible spectrum(approx. 450 – 500 nm), here the fluorescence was
detected between 500 – 600 nm. This enabled spectral isolation of single fluorescing molecules of
the green-emitting forms of these DNA-bound dyes. Constant “photoconverting” 405 nm
illumination would enable continual replenishment of the green-emitting form that upon high
“exciting” 491 nm illumination would fluoresce and subsequently undergo irreversible
photobleaching (for further details seePublication 1).This technique was further simplified by
using a VybrantViolet dye that would undergo aspontaneous photoconversionupon illumination
with high intensity 491 nm light (seePublication 2).
Although, this approach was successfully applied to super-resolution imaging of cell nuclei as well
as pachytene chromosomes (Prakash et al., 2015) with a resolution below 100 nm, one needs to be
aware of two major limitations: (i) relatively high fluorescent background during the single
molecule acquisition and (ii) rather faint single molecule Hoechst or VybrantViolet signals.
The first issue likely stems from the fact that 405 nm illumination excites also a native standard
form that has a broad emission spectrum substantially overlapping with emission spectrum of the

57
green-emitting form (See Publication 1 for more details). In addition epi-illumination used here
results in excitation of the entire nuclear volume further increasing a background level. Approaches
to decrease the fluorescent background and improve signal-to-noise ratio in measurements of 3D
structures are existent and arethoroughly discussed in a following section 7.1.2. In case of
photoconvertible DNA dyes, one idea is to decrease the staining concentration and simultaneously
the number of signals appearing per measurement frame at the expense of a measurement time.
This is rather impractical as this way the measurement time may exceed a practical range. Further
study on the mechanism of photoconversion may however improve its efficiency and potentially
maintain a decent single molecule signal number per frame despite of low DNA dye concentration
used.
Low photon number emitted from single photoconvertible DNA dye molecules may be a result of
only a moderate fluorescence extinction coefficient in particular low for DAPI (see Table. 1,
section 3.6 for details). This notion was reflected in SMLM images where DAPI signals were
indeed the dimmest. These coefficient values however relate to the original, standard forms of
these dyes and not the photoconverted ones. Nevertheless, Hoechst and DAPI dyes are known to
have an increased quantum yield in low pH (Cosa et al., 2001) which simultaneously induces
conversion to the green emitting form (Żurek-Biesiada et al., 2013, 2014) yielding a potential
solution to the second issue.Although, this may elevate background originating from the standard
forms. This has not been tested in this study.
Worth noticing is a remarkable role of glycerol in successful SMLM of photoconvertible DNA
dyes (see supplementary materials toPublication 1). Importantly, it has been already used
previously in DNA-dye study to account for extremely low quantum yield of PicoGreen in a
solution (Dragan et al., 2010). Authors suggested a contribution of intramolecular dynamics to
energy dissipation of the excited state of PicoGreen. It experiences 1070x quantum yield increase
upon DNA binding and interestingly, for Hoechst and DAPI these values amount to only 13x and
18x respectively (see Table 1, section 3.6) suggesting either that these dyes have already a high
quantum efficiency while in a solution (in fact it amounts to as much as~0.019, (Cosa et al., 2001))
or optionally that DNA alone does not protect Hoechst and DAPI well from non-radiative de-
excitation. The latter speculation is supported by the fact that SMLM of DNA-bound Hoechst
33258 in glycerol alone gave 5x higher density of single molecule localisations than PBS (see
supplementary materials toPublication 1). An addition of oxygen scavenging system to glycerol
resulted in further 200x improvement.
Our preliminary experiments with single DNA fibres stained with Hoechst 33258 (data not shown)
yielded rather poor linear localisation density suggesting that photoconversion constitutes rather
relatively rare process and, as it is UV-induced, its efficacy is likely reduced by competing
photobleaching of a standard form. Although disadvantageous in single DNA fibre analysis due to
low specificity, this feature is quite useful to image overall DNA distribution in the cell nuclei as a
single DNA-binding dye molecule can be discriminated from thousands to millions of others in this
complex 3D arrangement. Fourier ring correlation analysis demonstrated that this group of nuclear
chromatin imaging methods yields a resolution below 100 nm which constitutes roughly 2.5 fold
improvement as compared with conventional fluorescence microscopy methods. Nevertheless, due
to aforementioned issues with background and low brightness of Hoechst and VybrantViolet, an
extension to 3D imaging e.g. based on astigmatism (Huang et al., 2008) seems unrealistic.

58
7.1.2DNA structure fluctuation assisted binding activated localisation microscopy
(fBALM)
In this work a previous binding activated localisation microscopy (of isolated and bacterial DNA
(Schoen et al., 2011)) was adapted for the first time to a nuclear chromatin imaging
(seePublication 3). This fBALM methodology relies on moderate nuclear membrane
permeabilisation followed by DNA-binding dye (YOYO-1) delivery inside the cell nucleus prior to
a single molecule localisation measurement (for scheme see Fig. 15). Once cells are labelled, the
pH is gradually decreased over couple of hours to slowly introduce instability to the dsDNA. This
takes place with simultaneous maintenanceof native chromatin configuration. In this experimental
setup pH eventually reaches a value of ~3.7, i.e. value that introduces reversible conformational
changes to the dsDNA via ionisation of the bases (Courtois et al., 1968;Zimmer et al., 1968) but is
moderate enough not to destroy irreversibly the DNA through depurination. This is performed in
low ionic strength environment known to make the DNA structure more susceptible to changes
(Sorokin et al., 1986). Due to a thus introduced instability of the double stranded DNA, the DNA
intercalating dye can emit fluorescence from a local DNA sequence transiently as long as it is
stable (note that dyeemission in the absence of a double stranded DNA is strongly reduced(Cosa et
al., 2001)). Importantly, despite of nuclear membrane permeabilisation, the DNA-binding dye once
dissociated from the DNA does not leave the cell nucleus immediately but rather undergoes
retention in the complex nuclear structure for several hours. This limited YOYO-1
diffusionensures its sufficiently high concentration in a local vicinity of a nuclear DNA as it
undergoes a transient between “denatured” and “renatured”(native) state (Fig. 15B). Transient
stabilisation of the DNA in a presence of DNA-binding dye results in repetitive photon emission
from a single binding site that appears in an image as a bright spot (even~2000 photons detected
per signal on average)(Schoen et al., 2011). Photon emission continues until molecule
photobleaches or DNA binding site occupied with a dye molecule undergoes denaturation again
inevitably leading to a fluorescence emission halt e.g. via dye release (YOYO-1 is non-fluorescent
in a solution, see Table 1 in section 3.7). In support of at least partial dye release from the DNA is
the occurance of commondye penetration artefacts, i.e. a preference for localising dye signals at the
nuclear periphery (Publication 3, supplementary information).
To summarise, in low ionic strength environment with pH~3.7 the DNA spontaneously undergoes
re-/de-naturation and binding sites become available locally throughout the time-course of the
measurement. This enables sampling of numerous binding sites and forms basis for a versatile
super-resolutionmicroscopy based on isolated signal localisation in the cell nucleus (termed by us
fBALM). Note, that in this approach the primary role is played not by a chemical modification of a
fluorescent probe leading to a non-emitting state formation, but rather by stochastic availability of
binding sites due to the DNA nature in these specific chemical conditions. Nevertheless, YOYO-1
is known to have at least 4 protonation sites that in low pH may contribute to its conformation
change as well as may influence DNA binding mechanism. In addition, molecule protonation is
known to be responsible for a change in fluorescence emission for other DNA-binding probes such
as Hoechst (Żurek-Biesiada et al., 2013, 2014). We anticipate that such a variety of effects may
also play a role infBALM.
In order to further improve super-resolution microscopy of the cell nucleus based on fBALM the
following issues are necessary to be addressed: brightness of DNA-binding dyes, i.e. number of
photons emitted per binding event (a result of susceptibility to absorption and quantum efficiency),
fluorescent background during the measurement, dye diffusion, and density of single molecule
localisations.

59
The number of photons per binding eventcan be addressed by further improvement to the imaging
media recipe.This could be done by decreasing an effect of non-fluorescent de-excitation processes
as well asof dark states unrelated to the dynamic labelling. It has been demonstrated for a
carbocyanine-derivated PicoGreen that metal enhanced fluorescence effect may constitute a very
promising approach to increase quantum efficiency of DNA-binding dyes (Dragan et al., 2012;
Geddes and Lakowicz, 2002). Potentially this could be tested in SMLM approach advanced in this
work. Additionally, it has been demonstrated for cyanine-derived dyes just as Cy3, Cy5 and Cy7
that heavy water (D2O) increases their quantum efficiency and number of photons emitted per
single molecule signal in dSTORM super-resolution microscopy by a factor of up to ~2(Klehs et
al., 2014). This may lead to an increase in localisation precision by a factor of up to 1.4 when
aqueous solution based on D2O used. Lastly, the photon count per single molecule of the
transiently bound DNA dye, theoretically, could be increased by co-staining with a second dye of a
different binding mechanism and distinct spectral properties facilitating FRET. This, if only
imaging conditions just as pH thoroughly adjusted, so that one type of a dye, e.g. YOYO-1,
transiently binds in the presence of permanently bound Hoechst 33258, would lead to promotion of
YOYO-1 fluorescence to a greater extent. This is, however, purely speculative.These aspects listed
above were however not covered in the time-course of this study.
Although the fBALM labelling scheme presented here (Fig. 15A) helps to reduce DNA dye
penetration artefacts as the DNA-binding dye is available in every part of a nucleus, there is still a
room for an improvement (Publication 3). For instance, reversible nuclear membrane
permeabilisation for the sake of DNA introduction to the nucleus would be desired: in such
circumstances the DNA-binding dye would be uniformly dissolved inside the cell nucleus and
would not leave from a pre-labelled cell. Nevertheless, as of now we are not familiar with such
permeabilisation strategy for fixed cells. We anticipate that other ways of introducing the dye to
the nuclei than ones based on permeabilisation should be successful as well (e.g. electroporation
followed by cell fixation).
Further search for fBALM-applicable fluorophores, or ideally a chemical synthesis of specially
designed probes, are highly welcome and constitute a future of this approach. In such case dyes of
extremely high diffusion rates or very slow ones are highly welcome to either (i) undergo retention
inside the nucleus or (ii) penetrate rapidly the cell nucleus when provided externally during the
measurement. In case of the first group, definitely other bis-intercalating carbocyanine DNA-
binding dyes can be taken into an account. In case of the latter, a promising approach is to check
on cell nucleus penetration for a variety of DNA-binding probes of smaller weight than the ones
used in this study. Certainly e.g. SybrGreen would constitute a good candidate. Its only difference,
as compared withquite rapidly-diffusing PicoGreen, is a lack of one of dimethyloamino-groups
with equally high fluorogenic properties (Dragan et al., 2012). Among other candidates here one
should also mention DRAQ5 (molecular mass is even smaller and penetrates through live cell
membranes). Moreover, in the time-course of this study we also found that SytoxOrange
(monomeric cyanine DNA intercalator with highest quantum efficiency and extinction coefficient
among DNA dyes commercially available(see Table 1, section 3.7 for details) performs
comparably well to YOYO-1 using a fBALM methodology.
Recently, similar attempts have been pursued to realise DNA imaging in single molecule
localisation microscopy. For example, the dynamic labelling has been realised with specially
designed Hoechst-JF646 that upon transient binding to the DNA can be imaged using point
accumulation for imaging in nanoscale topography (PAINT) (Legant et al., 2016). In this approach
fluorescent probe is composed of the DNA-binding Hoechst-backbone and conjugated rhodamine-

60
derived dyeJF646. While in a solution it diffuses fast and is not well visible due to lower quantum
efficacy and signal motion blur, upon binding its photon emission can be accumulated over
hundreds of milliseconds from the location of a DNA-binding site well enough to provide single
molecule isolation and to pursue SMLM. In combination with light sheet illumination (see next
paragraphs for a discussion) even a 3D imaging of entire cell nuclei becomes possible.
Nevertheless, due to an insufficient experimental details provided (no information on imaging
environment or mechanism underlying transient association) this technique is less accessible than
fBALM approach developed in this work.
Figure 15. Outline of DNA structure fluctuation assisted BALM (fBALM) developed in this
work.A)Fixed and permeabilised cells are first stained with YOYO-1 DNA-binding dye. This is
followed by extensive washing. Subsequently, using an enzymatic oxygen scavenging system (glucose
oxidase), pH is gradually decreased to a value of ~3.7. Once these conditions are reached the DNA-
binding dye dissociates from the DNA but remains still trapped in the cell nucleus. B) The DNA is
unstable in the conditions provided and local spontaneous renaturation (to dsDNA) and denaturation (to
e.g. ssDNA) dynamically proceeds over time (t1, t2,...,tN) enabling YOYO-1 transient fluorescence
emission (depicted in red). This picture is somewhat simplified; note that YOYO-1 in a presence of
ssDNA is also fluorescent to some degree (Cosa et al., 2001). In addition, both ssDNA and dsDNA
undergo ionisation in low pH (Sorokin et al., 1986; Zimmer et al., 1968) further introducing a
conformational change and likely affecting YOYO-1 DNA-binding as well as fluorescence emission.
Therefore, designation „ssDNA‟ in (B) refers to a variety of different denatured states rather than to
ssDNA solely. Upon local stochastic stabilisationof dsDNA, single YOYO-1 becomes fluorescent,
emits light, and thus can be localised in space using SMLM principles (shades of grey correspond to a
fluorescent signal from a single binding site occupied with a DNA-binding YOYO-1).

61
WhilefBALM was proven here to be successful enough to image the chromatin in cell nuclei, the
use of epi-illumination did not prevent from considerable fluorescent background. This
phenomenon originates from the fact that in epi-illumination the entire volume of the cell nucleus
(being a 3D structure) is illuminated and thus fluoresces. Such fluorescent background affects the
effective localisation precision (see Fig. 4 for more details), and hence the resolution. This problem
can be solved by application of light sheet or lattice sheet illumination perpendicularly oriented to
the direction of fluorescence collection. This advantage has been lately applied in other SMLM
studies of the cell nucleus (Zhao et al., 2014; Legant et al., 2016). Furthermore, this approach
would not only decrease the fluorescent background in fBALM but also would improve the dye
availability within the volume imaged (only slice illuminated instead of entire nucleus). In such
case dye molecules thattransiently bind to the DNA above and below illuminated volumewould not
be a subject to irreversible photobleaching. This would also maintain YOYO-1 supply for longer
measurements to capture greater number of signal localisations leading to an increase in their
density in a final reconstruction (for an importance of single molecule density see section 3.4). It is
reasonable to anticipate that such approach would enable more uniform penetration of YOYO-1 to
the volume exclusively exposed to the exciting light (here a flat sheet through a nucleus). In
addition, in such low-background circumstances, 3D fBALM based on astigmatism becomes
manageable(Legant et al., 2016). Thus, we anticipate that using a light sheet illumination, the
resolution can be further enhanced possibly down to 30 nm (x, y) and ~70 nm (z) range, with better
uniformity throughout an image, eventually outperforming the capabilities of fBALM at its present
state.
7.2 Chromatin labelling strategies for super-resolution single molecule
localisation microscopy
The ideal chromatin labelling strategy for super-resolution studies should rely on following
important principles: (i) needs to be asdirect as possible and (ii)should not be DNA sequence-
specific or chromatin protein-specific, (iii) would not interfere with chromatin structure, (iv) has to
be very sensitive as structures anticipated are rather small, (v) in case patients‟ samples are desired
for investigation, a labelling strategy necessitatesno treatment prior to fixation (e.g. introduction of
genetically encoded histone proteins is not an option), and lastly (vi) fluorescent properties have to
be feasibly controllable.
Most of abovementioned requirements are well fulfilled by DNA binding dyes studied in this
dissertation. Besides however other strategies are also present including: long-term DNA base
analogue incorporation to the entire genomic DNA, followed by click-it reaction with
photoswitchable fluorescent probes(Zessin et al., 2012), and antibody histone labelling (Ricci et
al., 2015), or genetically encoded fluorescent proteins conjugated to the chromatin associated
proteins (Markaki et al., 2010; Cremer et al., 2011; Ricci et al., 2015).
A big advantage of the approach utilising DNA base analogue incorporation is a direct labelling of
the DNA of chromatin and possibility to introduce feasibly controllable fluorescent probes (e.g.
Alexa 647). In turn, this approach is inapplicable to the human samples due to high toxicity of such
treatment (Zhao et al., 2013), additionally triggering e.g. DNA damage signalling likely affecting
local chromatin structure prior fixation(Burgess et al., 2014). Moreover, one can expect sequence
specificity of such labelling as only one type of nucleotide is substituted.
62
In case of antibody histone labelling, again the ease to introduce favourite fluorescent probe is
advantageous. On the other hand, it is expected that antibodies encounter a serious accessibility
issues. While the size of an IgG molecule amounts to ~150 kDa, experiments with fluorescently
labelled dextran of size of 25 kDa and more, injected to the nuclei of living cells, revealed signal
depletion in DNA-rich zones suggesting limited chromatin penetration(Bancaud et al., 2009).In
support, in our hands anti-histone antibody labelling failed in observation of condensed chromatin
in ischemia (for further details see Section 7.4) In addition, once antibody recognises a histone
protein, it locates a fluorescent label away from the target leading to a steric localisation error in
the order of ~20 nm(Ries et al., 2012). Needless to say that histones occupy the DNA only every
146 bp + 10 to 50 bp (nucleosome + linker DNA) and in some circumstances the DNA is rather
depleted of them (e.g. DNA repair, transcription, replication sites). Altogether, this chromatin
labelling approach is a subject to strong limitationsin SMLM reaching a resolution of even 40 nm.
It has been proposed that this method of chromatin labelling can be improved by replacing
antibodies with nanobodies having smaller size (13 kDa), and effectively bringing a label closer to
the target(Kaplan and Ewers, 2015; Ricci et al., 2015). Nonetheless, we demonstrate that limited
anti-histone immuno-labelling can serve as a method to investigate chromatin compaction (for
details see methodology developed inPublication 4).
In comparison to these methods highlighting the chromatin distribution in fluorescence microscopy
using immunolabelling of chromatin-associated proteins, DNA-binding dyes have a molecular
weight 100 to 200 times smaller than an antibody molecule, can label the DNA directly even every
3.2 bp (Günther et al., 2010), and are a subject to diffusion and penetration related constraints to
much smaller extent (Bancaud et al., 2009).On the other hand, from the photophysics point of
view, fluorescence switching for DNA dyes is still poorly understood, and explored thus far to a
minor degree in only several research articles (Flors et al., 2009; Flors, 2010). Interestingly,
dynamic labelling of the DNA with DNA-binding dyes, same as in BALM, opens a new avenue of
opportunities to image chromatin at super-resolution as most binding mechanisms and NMR
structures of DNA-dye complexes are well characterised (for example see (Dragan et al., 2010) and
Table 1).
In DNA structure fluctuation assisted BALM presented in this work we took advantage of this
wealth of available knowledge, consequently enabling imaging the chromatin in cell nuclei at so
far unprecedented structural resolution. This DNA imaging approach, however, may suffer from a
certain sequence bias as an underlying mechanism relies on transient localDNA denaturation ↔
renaturation transition. It is commonly acknowledged that DNA denaturation is sequence
specific(Reisner et al., 2010), and that AT sequences (containing only 2 hydrogen bonds as
opposed to GC having 3) are more prone to denaturation(Hermann and Fredericq, 1977). Thus, we
reason that they may be overrepresented in fBALM.Interestingly, in previously published studies
on BALM of isolated λ–phage DNA with YOYO-1 and in a presence of 10mM ascorbic acid (for
relevant details seePublication 3), single molecule localisation density alonga DNA fibre appeared
to be homogenous, suggesting only a minor sequence specificity in these settings. Similarly, a
potential sequence-bias might hold true for photoconverting DNA-binding dyes presented in this
work; Hoechst dyes (and likely its derivative VybrantViolet) are known to have a certain
specificity to AT-rich sequences (Weisblum and Haenssler, 1974). In spite of these few potential
limitations, DNA-binding dyes are superior to other chromatin labelling strategies for single
molecule localisation microscopy.

63
7.3 Chromatin at super-resolution and compatibility of the results with existent
data on chromatin structure
Model of functional nuclear organisation based on co-aligned active and inactive nuclear
compartments (recently reviewed in (Cremer et al., 2015)) assumes great variability in nuclear
chromatin density; nearly no chromatin can be found in the interchromatin compartment and high
chromatin concentration can be found in gene-rich chromatin dense clusters. This basic notion that
chromatin occupies the nuclear volume only partially could be confirmed by both DNA imaging
methods developed in this study. For instance, fBALM revealed that DNA-associated signal may
vary by more than two orders of magnitude with essentially no DNA-associated signal within
interchromatin compartment. This also prompts us to reconsider a classical, old-fashioned model of
nuclear chromatin, assuming low DNA density euchromatin and high DNA density
heterochromatin – a model derived from diffraction limited fluorescence microscopy images of
DNA. The results presented in this work demonstrate that this initial observation is rather a result
of insufficient structural resolution, and that underlying nuclear organisation is way more complex
(Fig. 16A). DNA structure fluctuation binding activated localisation microscopy (x,y resolution of
~50 nm, z resolution ~550 nm) revealed that DNA distribution in the nucleus is heterogeneousand
occupies roughly 50% of the nuclear volume. It comprises various forms of domain-like structures,
350 - 500 nm in diameter, interconnected with each other via narrow chromatin bridges of ~50 -
200 nm thickness (Fig. 16A, dashed circle and square). In our 2D fBALM images it appears that
each “domain” may be connected with 3 – 4 others; in reality this number however might turn out
to be greater if studied in 3D. Interestingly, in parallel,single molecule localisation microscopy has
been used to study well defined, distinct, epigenetic domains after fluorescent in situ hybridisation
(FISH)(Boettiger et al., 2016). Strikingly, in this case super-resolution SMLM unravelled that
chromatin domains of specific epigenetic signatures,different from neighbouring sequences (as
assessed with massive parallel sequencing studies following ChIP), bear very similar structure to
“domains” revealed in the study using fBALM (compare Fig. 16A andB). Namely,chromatin
domains seem to be composed of a globular core branching and narrowing in several directions.
Recently, similar has been demonstrated using computer simulation of polymer and Hi-C data
(Gavrilov et al., 2016); also here chromatin domains were revealed to be spaced by thin and
accessible fibre like “bridges”.
Thus, we hypothesise here that chromatin is indeed organised in spatially resolvable 100 – 1000 kb
“domains”, constituting a basic regulatory units. The boundaries of these topologically associated
domains were previously demonstrated to strongly correlate with replicating domains (Pope et al.,
2014)(see Fig. 16D) and are enriched in chromatin-looping proteins and RNA Polymerase II (Tang
et al., 2015). Hence, we anticipate them to physically localise to the boundaries of domains
outlined in this work with the help of super-resolution microscopy. In support of this claim, our
preliminary data on dual-colour SMLM of photoconvertible DNA dye in combination with
immunofluroescently labelled H3K14ac suggests that this marker of gene regulatory elements
including in- and active promoters (Karmodiya et al., 2012), is preferentially deposited to the
boundary of DNA domains (Fig. 16D). Altogether, domain boundary is likely serving DNA
information processing similarly as in previously proposed perichromatin concept assuming an
existence of a thin layer of decondesed, transcriptionally active chromatin at the boundary of
condensed chromatin (Cremer et al., 2015).
The piece of evidenceoutlined in the previous paragraph envisages chromatin organisation at a
submicron level however at nanometre length scale the arrangement of chromatin fibres remains

64
unclear. As of now, none of the SMLM super-resolution techniques, including the ones developed
in this study, enabled visualisation of chromatin loops. Their size can be approximated to few tens
of nanometres only and, in order to pin point such small structures in a complex dense nucleus, a
better contrast is highly desired (potentially achievable with e.g. light sheet illumination or
appropriate astigmatism). Lately, it has been hypothesised that accessibility to a chromatin fibre is
fine-regulated by so called “nucleosome clutches”; 2 – 8 nucleosome discrete assemblies
interspersed with nucleosome depleted DNA (Ricci et al., 2015). Due to their small size, they
could dynamically influence (e.g. via opening up) the local sequence read out by various factors.
Interestingly, in our fBALM studies on ischemia, where chromatin condenses to a great extent (for
more details see Section 7.4)providing an increased contrast, we found fibre-like structures
protruding from and linking DNA domains containing periodically appearing DNA-signal clusters.
These clusters are spaced by 65 – 80 nm and have ~50 nm in diameter. A single nucleosome has a
diameter of ~11 nm and theoretically, while convolved with fBALM localisation precision of 20
nm, should appear in our images as a 30 nm spot. Clusters revealed by fBALM had 30 – 55 nm
suggesting potential number of nucleosomes amounting to 2 – 8, depending on their reciprocal
orientation withrespect to the imaging plane. Worth noticing here is the fact that theoretically
YOYO-1 may have up to ~60 binding sites per nucleosome (Günther et al., 2010). In light of this
information, these considerations seem plausible. Please note however, that in the fBALM the
localisation precision amounts to ~20 nm and the theoretical resolution based on a normal
distribution of measured light source would give 20 x 2.35 = 47 nm thus being very close to a
cluster size (for extended discussion see supp. materials to Publication 3).
We took freedom to speculate even further and noticed that in fBALM images usually any
chromatin domain is consolidated to 2 or more others (Fig. 16A, e.g. dashed circle). Chromosomal
DNA is a single linear molecule and chromosomes are known to occupy distinct parts of the cell
nucleus (Cremer and Cremer, 2001). In case of only 2 domains contacting each other, the
chromatin fibre would first fold into one and then continue to form another one (as depicted in Fig.
17A, D1→D2→D3). In such case the chromatin fibre forms one domain after another in a manner
similar to a pearl-necklace. Such arrangement has been recently demonstrated using high
resolution microscopy combined with FISH labelling of HoxD gene cluster flanked by two TADs
(Fabre et al., 2015). In our fBALM images, however, we found that number of connections may
apparently exceed even 4. The question of utmost importance arises here: in what manner is the
DNA molecule arranged in these circumstances? Of relevance here is the fact that, different remote
DNA sequences termed as enhancers and silencers may influence distal gene activity up to 1000 kb
up- or down-stream within a DNA molecule (Shlyueva et al., 2014). Perhaps, additional (more than
2) neighbouring domains come from strong interaction between distal genomic loci Dn as depicted
inFig. 17A. Here the “necklace” of domains would bend towards itself to serve enhancers and/or
silencers to the chromatin domain D2 (Fig. 17A, DNA stretch indicated in cyan). Another idea
explaining more than 2 neighbouring domains may assume that the chromatin fibre, after formation
of one domain (e.g. D2 in Fig. 17B), continues towards the next one (D3) but subsequently travels
back again to the previous one (D2→D3→D2) either serving there enhancers /silencers or
contributing further to its structure build-up. In support of this hypothetical configuration of
regulatory elements is the fact that their marker, H3K14ac (Karmodiya et al., 2012), localises
primarily to boundaries of chromatin domains as revealed in this study (Fig. 16D, Publication 4).
In such case the reciprocal position of chromatin domains could be anticipated to be regulated not
only by their linear sequence proximity but also the abundance of distal regulatory elements within
other domains necessitating a physical interaction. In addition, it has been previously shown that

65
HoxD locus is regulated by enhancers originating from two flanking TADs 100 – 200 kb up- and
down-stream (Montavon et al., 2011).

66
(for figure description seethe next page)
67
Figure 16. Single molecule localisation microscopy in eukaryotic cell nucleus suggests a model
of chromatin organisation.In this figure contemporary SMLM results in the cell nucleus are
compared. A) DNA structure fluctuation assisted binding activated localisation microscopy (fBALM) of
DNA in mouse HL-1 cell nucleus demonstrates that chromatin is organised in a “sponge-like” manner:
heterogeneity of DNA associated signal exceeds two orders of magnitude. Dashed circle and square
demonstrate two domain-like structures at different compaction levels (Publication 3). Note that the
fBALM image covers < 600 nm thick focal volume thus structures at various depth may overlap due to
a projection to a 2D image.B) Super-resolution SMLM images of fluorescently labelled chromatin
domains (Boettiger et al., 2016). Maximal projections of 3D SMLM data are shown. Distinct chromatin
domains (~250 – 400 kb) were characterised by different occupancy of following histone marks:
enrichment in H3K4me2 (termed active), lack of H3 modifications (inactive), and H3K27me3
enrichment (denoted as repressed). Subsequently, in situ hybridisation was carried out against these
specific genomic loci using probes of length indicated in the picture. Image scale same as in (A) for
better comparison. Note striking similarity between active domain and domain indicated ina circle in
(A) and inactive domain and domain in square in (A). C) Super-resolution SMLM image of chromatin
in primary human fibroblast labelled with anti-H2B and anti-H3 primary antibody followed by
secondary antibody labelling (Ricci et al., 2015). In line with fBALM in (A) the chromatin appears to
be arranged in a structure resembling a“sponge”. Chromatin free regions of size up to 700 nm are
clearly seen in an inset (red square, same scale as in A and B).D) Replicating cells incubated with DNA
base analogue EdU (50 µM) for 5 and 35 min, followed by click-it reaction to couple Alexa fluorophore
(image credit to(Zessin et al., 2012)). Short-term incubation with EdU results in small foci, whereasin
the cells incubated with EdU for longer than 10 – 15 min, thedomain-like structures become apparent
(compare 35 min EdU incubation with A, B, and C). Scale bar corresponds to 2 µm. We hypothesise
that chromatin in S-phase undergoes a sequential replication at the boundaries of a specific TAD
currentlyinitiated for a duplication: the longer the EdU incubation proceeds, the more chromatin in a
vicinity of replication forks becomes labelled, ultimately resulting in labelling of entire chromatin
domains for longer incubation times.E) Active H3K14ac (gene regulatory element marker (Karmodiya
et al., 2012)) imaged at enhanced resolution together with chromatin (photoconversion of directly
binding DNA dye Vybrant Violet). H3K14ac localises to the boundary of dense chromatin clusters.
These fine details cannot be seen in diffraction-limited, conventional fluorescent microscopy image
(bottom, right). F) Chromatin domain organisation model based on available single molecule
localisation microscopy data andinferred based on available next generation sequencing data.
Chromatin distribution as well as location of H3K14ac was revealed in this work. Location to the TAD
boundary of chromatin tangle-proteins just as CTCF and cohesin was revealed previously using ChiA-
PET (Tang et al., 2015). Replication domain boundaries have been demonstrated previously to perfectly
correlate to TAD boundaries (Pope et al., 2014).We hypothesise that chromatin domains (likely TADs)
are possiblyresolvable with the super-resolution SMLM fBALM approach.
Both models presented in Fig. 17A and B) would be further supported by an observation that
domains of distinct epigenetic landscape, independently of their compaction state, were shown to
physically overlap only marginally (Boettiger et al., 2016). Nevertheless, the divagations
elaborated here have as of now a purely speculative character. We anticipate that in future, a
combination of FISH super-resolution visualisation, chromosome conformation capture studies,
chromatin immunoprecipitation, and fBALM super-resolution chromatin imaging may unravel the
real domain arrangement. For instance a recommendable approach would involve genome-wide
TAD identification followed by its specific labelling combined with total DNA labelling, both
imaged at super-resolution. First successful attempts has been already published (Wang et al.,
2016).

68
Figure 17. Hypothetical model of DNA arrangement in chromatin domains of a single
chromosome.Compare to Fig. 16A demonstrating super-resolution images of chromatin.A)Linear
domain organisation model. Black patch corresponds to a hypothetical domain D2. In grey chromatin
imaged with super-resolution microscopy, e.g. fBALM. The same DNA molecule, distal locus (Dn,
cyan), may form a neighbouring domain that serves enhancers or silencers controlling transcription in
D2 domain, thus appearing in images as a contacting domain Dn. Such interaction usually does not
exceed 1000 kb what would correspond to several chromatin domains/ TADs (Boettiger et al. 2016). B)
Single DNA molecule (in blue) may form many chromatin domains that are not arranged linearly but
instead may additionally interact with others in proximity (e.g. D2 and D4). This model potentially
explains why enhancer/silencer sequences can lie only less than ~1 Mb away from the regulated
sequence (length corresponding to ~1 – 5 domains assuming their size of several hundreds of kb
(Boettiger et al., 2016)). Arrows depict DNA orientation, e.g. 5‟→3‟. White dashed lines separate
chromatin domains. In both cases nucleosomal chromatin organisation was omitted for a sake of clarity.
7.4 Ischemia induces DNA compaction within minutes
In this work it is demonstrated using single molecule localisation of the DNA-binding dyes, that
the nuclear architecture of immortal cardiomyocytes undergoes a compaction under experimental
conditions (publication 4). DNA-dye photoconversion-based as well as DNA structure fluctuation
assisted binding activated localisation microscopy revealed that chromatin compaction in this cell
type may take place already in several minutes and similarly, is reversible already after minutes of
reperfusion with regular, properly oxygenated medium containing all vital nutrients. The extent of
compaction indicates that chromatin undergoes a phase transition: OND induces formation of
previously unknown subnuclear configuration consisting of discrete atoll-like structures as well as
rarely occurring chromatin double-layer at the nuclear boundary together with concomitant
expansion of interchromatin (DNA-free) compartment by 250% as compared to the state before
OND treatment. Hence, the DNA distribution in the cell nucleus changes significantly and this was
captured with a dedicated quantitative analyses based on quantifying local densities or nearest
neighbour analysis of DNA associated signals. Microscopic notion was further reinforced by a
complementary super-resolution technique that does not rely on fluorophore photoswitching
known as structured illumination microscopy(Heintzmann and Cremer, 1999; Gustafsson, 2000).
Noteworthy, these changes to chromatin distribution take place with a simultaneouspreservation of
nuclear volumeand shape (estimated by 3D confocal microscopy) as well as unaltered lamin A

69
mesh (as studied with SMLM, Publication 4) known to be responsible fora maintenance ofnuclear
architecture at the nuclear periphery(Burke and Stewart, 2013).
Alternative analytical procedures have been employed to confirm the discovery made with novel
super-resolution DNA imaging methods developed in this work. The chromatin in OND-subjected
cells bore an increased DNase I-digestion susceptibility as revealed by time-course digestion assay
with DRAQ5-labelled DNA. DNase I is a protein whose mass amounts to 39 kDa (approx. twice
more than H1 molecule) and it can be anticipated that it does not penetrate throughout dense
structuresthus serving as a molecular “probe” for DNA accessibility within nuclear chromatin.
Fluorescence recovery after photobleaching experiments on histone H1.1-GFP revealed its
decreased mobility in live HeLa cells already after 10 min of OND-treatment. This histone variant
is not a part of a nucleosome and is known to be rather not permanently bound to the chromatin as
in case of core histones H2A, H2B, H3, and H4; on the contrary its dynamic interaction with the
DNA is anticipated to regulate higher order chromatin structure(Corona et al., 2007; Wojcik and
Dobrucki, 2008). In case of the OND, decreased fluorescence recovery in FRAP experiments with
H1.1-GFP might be either a result of compacted chromatin (in such case H1.1-GFP molecules need
more time to exchange in hardly accessible compacted chromatin regions) or a partial cause
ofchromatin condensation via e.g. H1 phosphorylation affecting its interaction with
chromatin(Zheng et al., 2010). The latter, however, has not been addressed in this work.
Change to the chromatin compaction status in OND has been further confirmed in cardiomyocyte
cell line using light side-scattering in a flow cytometer typically providing an information about
cellular granularity. This methodology was previously employed for chromatin condensation
assessment(Smirnov et al., 1988)
Interestingly, it has been observed that immunolabelling of core histone H3 was significantly
reduced in OND by 4.5 times as estimated using SMLM via comparison of densities of single
molecule localisations. We attribute this difference to a decreased accessibility of antibody
molecules to histones buried deeply in condensed chromatin. In support with this statement we
failed to detect a decrease in H3 level using western blot analysis (data not shown). Also,
previously it was suggested that histones may be expelled to the blood during cerebral stroke
(Geiger et al., 2006; R. Chen, Kang, Fan, & Tang, 2014), however this was not observed in our
experimental setup (validated with westernblot of culture medium, data not shown).These notions
potentially suggest that previously reported increased histone levels in blood might have been
rather a result of immunological reaction to inflammation known to accompany ischemic event (Jin
et al., 2010).
On the other hand, previously published experiments with fluorescently labelled dextran of varying
size (25 kDa and greater) injected into living cells revealed signal depletion in dense chromatin
zones (Bancaud et al., 2009). In comparison, a typical IgG antibody molecule used for
immunofluorescent labelling bears a molecular weight of ~150 kDa. In this study we also report on
reduced DNA digestion by DNase I. This nuclease have a size several times smaller than an IgG
molecule (39 kDa only) andcommonly serve as a “compaction-probe” in e.g. next-generation
DNase I hypersensitive sites sequencing (Boyle et al., 2008). Consequently, we anticipate that anti
H3 histone immunofluorescent labelling should be used carefully in super-resolution SMLM
investigation of chromatin structure as reduced penetration of antibodies likely leads to labelling
artefacts.

70
In these studies we investigated also H3 histone modifications and found a massive reduction of
different “active” histone marks including pan-acetylated H3, H3K9ac, H3K14ac, H3K27ac,
H3K4me3 with only minor reduction in “inactive” marks just as H3K9me3, H3K27me3, all
studied with flow cytometry after immunofluorescence labelling. This behaviour has been,
however, further confirmed with western blot analysisproving only minor antibody penetration
artefacts in case of these histone modifications (experiments performed by Ina Kirmes). The
opposite was found for unmodified H3 antibody staining that was reduced in contrast to
westernblot contradicting this notion (H3 level unchanged). H3 histone is believed to be modified
on its N-terminal “tail” exposed to the environment ~3 nm away from the nucleosome and, hence,
it can be anticipated that modifications are more accessible to an antibody recognition. This would
explain differences in results of immunofluorescence and Westernblot analyses between
unmodified H3 and H3 modified on its tail. This knowledge prompts us also to hypothesise that
anti-H3 staining can serve as a method to estimate chromatin condensation.
7.5 Dynamic chromatin structure in reperfusion
Aforementioned results from multiple-approaches suggest that chromatin undergoes a strong
compaction during OND.Consequently, upon cessation of ischemic conditions, the nuclear
structure of cardiomyocytes undergoes a rapid relaxation within minutes and reaches original status
after approx. 60 min. In line with the results obtained with super-resolution microscopy, it has been
found using immunofluorescent staining and Westernblot analysis that already after 10 min of
reperfusion following OND treatment, active histone marks undergo upregulation as compared to
the levels in OND (data not shown).
Moreover, several hours after a release from OND, chromatin adopts a more open configuration, as
compared with untreated cells, likely being a consequence of epigenetic reprogramming of cells.
This observation was further confirmed by a transcriptome analysis using next generation mRNA
sequencing of myocardial infarction mouse tissues. These experiments revealed a considerable
gene upregulation after 2, 4, and 24h (experiments performed by Ina Kirmes, not shown) which as
a consequence may induce chromatin decondensation to increase accessibility of transcription
factors to manifold genes necessary in reperfusion. To further strengthen this argument, we found
that not only the number of genes undergo upregulation but also a total transcription rate increases
by 40% already during 1h of reperfusion as shown using bromouridine incorporation assay
followed by mass-spectrometry quantification.
7.6 Model of DNA compaction in ischemia
The results obtained in this study help to outline a model of action. OND leads to 10 fold ATP
level reduction due to respiratory chain halt both as a result of hypoxia and insufficiency of
nutrients. ATP occurs in cells predominantly as a complex with Mg2+
and as a consequence of ATP
reduction in intracellular ATP levels, Mg2+
availability increases(Murphy et al., 1989). This might
promote chromatin compaction as positively charged ions would easily relocate to the cell nucleus
and bind to negatively charged DNA (depicted in Fig. 18). In fact, an increase to externally
supplied Mg2+
in cell culture medium has been demonstrated before to provoke chromatin
compaction as studied with fluorescent lifetime imaging of histones conjugated with fluorescent
proteins (Visvanathan et al., 2013). The same would be applicable to naturally occurring,

71
intracellular polycationic spermidine and spermine innately complexed with ATP. Their liberation
would lead to further chromatin compaction in case of OND. Along this line of argumentation it
has been previously demonstrated that their addition to the cell culture in a presence of detergent
permeabilised membranes has an effect analogous to the one inflicted by divalent cations, i.e.
induce chromatin compaction(Visvanathan et al., 2013). In addition, according to our confocal
microscopy experiments and anti-polyamine immunofluorescence labelling their nuclear signal is
stronger in OND than in untreated cells (Publication 4). ATP-driven liberation of (poly)cations is
further supported by our experiments on hypoxia and hypoglycemia applied to the cells for 1h
separately. In both cases chromatin condensation occurred. Altogether, this suggests the model of
“dormant”/“passive” chromatin availability regulation by means of ATP level change: in OND
cells sense and respond to nutrient availability via (poly)cation liberation leading to chromatin
condensation and transcription cessation.Such“passive” transcription halt would be more cost-
effective than e.g. active enzymatic or epigenetic regulation of this process additionally consuming
ATP.
In order to further validate this model, cells were treated with 2-difluoromethylornithine inhibitor
(DFMO) – an inhibitor of polyamine biosynthesis interfering with ornithine decarboxylase. As
long as fBALM super-resolution DNA imaging experiments together with DNA density
distribution analysis have not been able to demonstrate convincingly an effect on OND-chromatin
structure (Fig. 14), FRAP experiments on H1.1-GFP expressing HeLa cells revealed clearly that
linker histone dynamics in OND increases while cells are pre-treated for 48h with DFMO prior to
OND, reaching a level similar but still not fully recovered as compared with untreated cells (Fig.
12).Importantly, this treatment restored also mobile fraction of H1.1-GFP despite of OND
treatment. This experiment further reinforces the validity of aforementioned model assuming an
involvement of polyamines known already for long to interact with the DNA (reviewed in
(Matthews, 1993)).

72
Figure 18. Model of chromatin compaction in ischemia.Upon adenosine triphosphate (ATP)
depletion, (poly)cationic compounds undergo a release from this complex and relocate to the cell
nucleus where they encounter negatively charged DNA. We hypothesise that such electrostatic
interactions form basis for chromatin compaction and transcription halt as a negative chromatin charge
is neutralised.
Noteworthy, chromatin of cells subject to ischemic treatment bears a decreased capability to
associate with DNA dyes (Publications 3, 4). This result suggests either a reduced penetration of
the DNA dye to the dense chromatin clusters or optionally highlights the lack of DNA-dye-binding
sites due to polyamine and Mg2+
pre-occupation. Consequently, this would neutralise negative
charge of the DNA and diminish the strength of electrostatic interaction between a DNA-binding
dye and DNA (Dragan et al., 2010).
Question of utmost importance arises; whether this “passive” mechanism based on divalent cation
and polyamine translocation to the nucleus is a sole instrument of chromatin compaction status
control in ischemia. In order to address this point we set out to perform experiments in the same
configuration as outlined above, i.e. fBALM DNA imaging and H1.1-GFP FRAP but for
hyperacetylated chromatin after 1h treatment using trichostatin A – histone deacetylase (HDAC)
class I and IIinhibitor, known to increase histone acetylation levels (Vanhaecke et al.,
2004).Treatment with TSA in the context of ischemia has been previously reported as potentially
therapeutically relevant for myocardial ischemia-reperfusion(Granger et al., 2008). Also HDAC
pan-inhibition was formerly shown to have a positive effect in animal model of cerebral ischemia
(Schweizer et al., 2013). In line with these observations, specific knockdown of HDAC3 and
HDAC6 promotes survival in cortical neurons in a model ischemia involving both, oxygen and
nutrient deprivation(Chen et al., 2012). In turn, thefBALM results have not revealed significant
influence of TSA on decompaction of condensed chromatin. Whereas, super-resolution method
failed to detect small differences, perhaps due to insufficiently precise analysis method, H1.1-GFP
FRAP enabled discerning significant differences after 1h TSA pre-treatment of cells subject to
OND. In this case H1.1-GFP mobility undergoes a partial restoration suggesting that
hyperacetylated chromatin in OND has different physical properties from the one in OND
alone.Our Western Blot and flow cytometry analysis combined with immunolabelling revealed
indeed increased H3K14ac and H3K27ac levels for OND with TSA as compared with OND alone
(experiments performed by Christina Heiser, not shown).
If (poly)cationic model of chromatin compaction is valid, it means that it is possible to affect
chromatin condensation in an additional way even if it is already complexed with polyamines and
Mg2+
, for instance using deacetylase inhibitors as demonstrated here.This is in line with previous
findings that hyperacetylation of interphasic chromatin using TSA leads to an increase in
chromatin accessibility (Görisch et al., 2005) and to an increase in mobility of chromatin
associated proteins (Misteli et al., 2000).
Of importance here, however, is the fact that spermidine (a type of polyamine) can be acetylated by
histone acetyltransferase that acetylates histone H4. This spermidine modification can alter its
interaction with the DNA(Cullis et al., 1982). It has been even hypothesised that histone and
spermine acetylation occurs in the same region of chromatin synergistically assisting in
transcription (Matthews, 1993). Thus, any disruption of acetylation↔deacetylation balance in the
cell nucleus is expected to have a profound effect on the chromatin organisation and functionality
73
in multitude of ways. Further studies are necessary to properly describe this multi-dimensional
feature of chromatin structure.
7.7 Hypothetical role of chromatin compaction in ischemia
Polyamine are known to have a diverse role in cell differentiation, apoptosis, cell growth (Zhao et
al., 2007). Thus, upon their depletion and potential translocation to the chromatin one might expect
impairment in all of these processes at least as long as ischemia continues and shortly after. In line
with the argument of necessity of constant polyamine availability, it has been found that in
ischemia/reperfusion ornithine decarboxylase (ODC) and spermidine/spermine N1-
acetyltransferase (SSAT) activities were upregulated.This suggests a “counteraction” as the
activity upregulation for polyamine synthesis enzymes occurred with simultaneous decrease in
myocardiac polyamine pool(Zhao et al., 2007). Hence, it was reasoned to exogenously administer
1 mM spermine prior to ischemia and compensate for the deficit. Interestingly, this reduced
myocyte necrosis and apoptosis as well as promoted the recovery of cardiac function after ischemia
in rat heart (Zhao et al., 2007). In this case supplementation of spermine to the heart had a positive
effect however the authors did not explain how polyactionic compound could penetrate through a
cell membrane. Furthermore, this issue is a subject to an ongoing debate on polyamine transport
system, reviewed in (Nowotarski et al., 2013). Nevertheless, if this happened, in light of our
discovery, it would either lead to prolonged DNA condensation or replacement of cytoplasmatic
pool of spermine or both simultaneously, having rather a protective effect as intracellular
environment balance restoration would proceed slower. Another words, prolonged chromatin
condensation would prevent from rapidly growing energy demand in context of chromatin
transcription reactivation and associated dangerous oxidative stress at the onset of reperfusion. In
addition to this hypothesis it has been demonstrated that polyamines may serve as free radical
scavengers (Ha et al., 1998). Thus once complexed with DNA they could serve as its protectant.
Furthermore, our H1.1-GFP FRAP experiments suggest that inhibition of ODC for 48h prior to
ischemic event (OND) helped to decrease the chromatin condensation (section 6.5.1). One could
expect a decrease in spermine levels, however, an utmost care needs to be taken in interpretation of
this result as the real polyamine levels have not been quantified by us in this case due to technical
difficulties. Interestingly, results in other research groups suggested that the treatment with the
same ODC inhibitor prolong life span of Drosophila subject to hypoxia (Vigne and Frelin, 2008).In
case of our results in cell culture, however, 48h pre-treatment needs to be considered as quite long
thus potentially also having an effect on cell cycle distribution leading to e.g. overrepresentation of
measurements in cells in one particular sub-phase. This effect has not been tested though.
Similarly, a trichostatin A (TSA) treatment has been shown to decrease the infarct size in mouse
ischemia model (Granger et al., 2008). In turn, in our hands TSA administration 1h prior to or
during OND seemingly resulted in chromatin compaction to a lesser degree than in OND
conditions alone (as revealed by H1.1-GFP FRAP). Based on the positive effects of TSA on
viability reported in the literature one may infer that chromatin condensation is an undesirable
phenomenon during ischemia and any potential therapy should focus on its prevention.
Nevertheless, this process seems to be much more complex and still more work has to be done in
order to situate (poly)cationic-induced chromatin condensation in novel strategies of stroke and
heart attack treatment.

74
To summarise, two abovementioned examples seem to contradict each other:(i) addition of
polyamines to the ischemic rat heart (Zhao et al., 2007)and (ii) reduction of polyamines by their
synthase inhibition in hypoxic Drosophila(Vigne and Frelin, 2008)both led to a positive outcome.
This altogether may suggest that cell and tissue viability is not dependent on polyamine-induced
chromatin condensation alone but rather on the dynamics of this process and on dynamics of
decondensation at the onset of reperfusion. In particular the speed of latter can be assumed to
modulate a pace of transcription restoration and simultaneous energy demand decrease in short
time after normoglycemia and normoxia restoration. While massive DNA transcription re-
established fast (in our studies in < 1h of reperfusion), mitochondria are a subject to considerable
stress associated with e.g. colossaloxidative damage inflicted at once in reperfusion. However, if
oxidative damage burst distributed over longer period of time, it could be more bearable for a
cell.This could be investigated in future using lipid peroxidation fluorescence-based kits specific to
mitochondria (MitoPerOx).
7.8 Potential chromatin condensation in starvation and in tumour
Chromatin condensation upon oxygen and nutrient deprivation studied in this work may prove to
be important in various different contexts besides ischemic diseases. For example, our results are
also of relevance in investigations of starvation-induced effects on resistance against various
factors. Short term starvation in a cell culture as well as in mice model has been proposed as a
method to increase protection of normal cells against chemotherapy and oxidative stress.This
methodology has been termed starvation dependent differential stress-resistance(Raffaghello et al.,
2008). For instance, primary rat glial cells had an increased survival rate against hydrogen peroxide
or cyclophosphamide treatment when additionally pretreated for 24h with a low-glucose media. On
the contrary rat glioma, human glioma, and human neuroblastoma starvation did not change their
relatively poor resistance to both types of treatment (Raffaghello et al., 2008). Additionally, very
similar effect against etoposide have been discovered in mouse model after inoculation of tumour
cells; mice subject to starvation prior to treatment had a prolonged lifespan whereas cancerous cells
would not. Settlingpotential chromatin condensation to this broader context seems to be of
importance in data interpretation.
Besides, it is widely accepted that advanced solid tumours, regularlysuffer from local ischemia and
hypoxia, due to reduced angiogenesis and high nutrient consumption rate(Carreau et al., 2011;Weis
and Cheresh, 2011). Thus, understandably,chromatin condensation may occur there similarly as
discovered in this study using a cell ischemic model. Pursuing investigations in this direction may
help in better characterisation and understanding of a tumour development.For instance, it has been
previously hypothesised that chronic hypoxia in tumour may lead to selection of cancer cells of
stronger malignant phenotype (Carreau et al., 2011). Furthermore, ischemic tumour cells may be a
subject to a local inflammationtriggering pro-angiogenesis signalling (reviewed extensively
in(Weis and Cheresh, 2011)). Affecting potential chromatin condensation of these cancerous cells
could result in an increased harshness of oxidative stress effects or would constitute an interesting
approach to investigatedevelopment rate of new vessels, crucial for further cancer growth and
metastasis.Moreover, it is known that chromatin compaction has a preventive role protecting from
ionising radiation (Takata et al., 2013) and tumour hypoxia negatively impacts radiotherapy
(Moeller et al., 2007). Thus, plausible to hypothesise that potential chromatin condensation in
tumour suffering from ischemia could be targeted in order to optimise its radiation
therapy.Consequently, we anticipate that hypothetical chromatin condensation in solid tumours,

75
even though not proven directly yet, may contribute to a better understanding of a cancer
functioning and may constitute a promising aspectto further boostexistinganti-cancer therapies.
The role of ischemia in tumour functioning is one important aspect. On the other hand, knowing
deleterious effect of IR event, one would wonder how an artificial ischemic treatment could be
employed to treat a cancer. Indeed, it has been previously recommended that ischemic treatment of
a tumourcan constitute a very promising approach when combined with high-glucose reperfusion
(Duan and Yang, 2012). This way, the ischemic event followed by reperfusion would induce stark
oxidative stress interfering with tumour viability (Duan and Yang, 2012). The effectiveness of such
ischemia, and in particular subsequent reperfusion in tumour treatment, has already been
successfully recognised in experimental settings mimicking an anti-cancer therapy proving a robust
contribution of oxidative stress in tumour suppression(Parkins et al., 1995). Regulation of putative
chromatin condensation discovered in this work may turn out to be helpful in further optimisation
of this treatment methodology.
In light of our discoveries it is important to mind a potential chromatin condensation in these
circumstances and its putative protective role against oxidative stress, anti-cancer drugs, or rapid
metabolism triggering.One can imagine that starvation-induced condensed chromatin is better
protected against reactive oxygen species (ROS) of relatively short lifetime or DNA-binding
cancer drugs (e.g. daunomycin (Wójcik et al., 2013)). In support of this claim, as revealed in this
study, the condensed chromatin is rather transcriptionally inactive, decreasing cell energy demand
and metabolism while nutrients unavailable, consequently preventing from ineffective energy
production via anaerobic respiration.
7.9 Potential experimental issues
One last question remains unanswered in this work: is the chromatin organisation affected in a
living organism suffering from ischemia? This has not been successfully investigated due to
particular technical difficulties of microscopic approaches adopted. Anyhow, there is a
fundamental difference between tissue culture model and a living organism: in case of the first the
oxygen level has been artificially decreased from its basal level in well oxygenated culture
mediumin flat culture plate to 1% but in reality full oxygenation in tissue is not realistic and
spansrather between 4 - 8% only(Carreau et al., 2011). This means that the severity and abruptness
of ischemia-induced changes in a cardiac muscle might be different than in thecell culture model
used in this work. In turn, oxygenation levels in tumours may be even 10x lower than in healthy
tissue. These values amount to 160 mmHg in the air, 100 mmHg in arterial blood, 29 mmHg in the
healthy muscle and down to <2.5 – 13 mmHg in tumour (Carreau et al., 2011) meaning that
oxygen level may drop in affected tissue as low as 0.2%. Likely similar values can be expected in
metabolically active restless myocardium subjected to an artery occlusion. Importantly, it is
interesting to know if chromatin condensation is e.g. proportional to decreased oxygen and nutrient
concentration levels (ischemia severity) or chromatin condensation proceeds in a binary manner
i.e. is triggered once total ATP pool is fully depleted. Future studies targeting different ischemic
preparation protocols should be performed in this direction to broaden our understanding on how
chromatin undergoes a regulation in the “passive” mode put forward in this work.

76
8. Conclusions
Labelling constitutes currently one of the major obstacles preventing from real super-
resolution fluorescent microscopy. In particular, chromatin labelling for super-resolution
studies of eukaryotic cell nuclei necessitates an extreme care and existing methods suffer
from major limitations
Single molecule localisation microscopy of the chromatin in cell nuclei of mammals and
mice using directly binding DNA dyes is feasible and was realised via:
- Photoconversion of DNA-bound benzimidazole and VybrantViolet dyes enabling a
structural resolution < 100 nm.
- Transient fluorescence emission fromDNA-binding probes in a presence of nuclear
DNA undergoing structure fluctuations in decreased pH. This method is further termed
DNA structure fluctuation assisted binding activated localisation microscopy
(fBALM) and constitutes a methodological advancement of previously existing
BALM. This involved unravelling the mechanism of action and helped to extend
application range to eukaryotic cell nuclei. fBALM yielded a structural resolution of
approx. 50 nm.
Super-resolution microscopy study presented in this work suggests a domain-like,
hierarchical organisation of chromatin and in line with active-/inactive- nuclear
compartment model, confirms existence of DNA-depleted regions in eukaryotic cell
nuclei.
Novel super-resolution methodologies developed in this work reveal so far unknown
chromatin compaction induced by an ischemic treatment.
The process of chromatin condensationprovoked by ischemia potentially depends on
poly(cationic) compounds naturally associated with ATP. Upon ATP depletion in
prolonged ischemia, they likely relocate and bind to negatively charged nuclear DNA
inducing chromatin condensation.
Dynamics of chromatin compaction and its decompaction could be targeted in order to
neutralise deleterious effects of ischemia-reperfusion in such diseasesas cerebral stroke and
myocardial infarction. This could potentially be realised via poly(cation) scavenger
administration or interference with their synthesis.
We recognise this so far unreported chromatin condensation upon ischemic treatment as
relevant to other eventsinvolving ischemia just ascerebral stroke, tumour
development,tumour angiogenesis and metastasis.
77
9. References
Abbe, E., 1873. Beiträge zur Theorie des Mikroskops und der mikroskopischen Wahrnehmung.
Alonso, A., Almendral, M.J., Curto, Y., Criado, J.J., Rodriguez, E., Manzano, J.L., 2006. Determination of
the DNA-binding characteristics of ethidium bromide, proflavine, and cisplatin by flow injection
analysis: Usefulness in studies on antitumor drugs. Anal. Biochem. 355, 157–164.
doi:10.1016/j.ab.2006.06.004
Baddeley, D., Cannell, M.B., Soeller, C., 2010. Visualization of localization microscopy data. Microsc.
Microanal. 16, 64–72. doi:10.1017/S143192760999122X
Bancaud, A., Huet, S., Daigle, N., Mozziconacci, J., Beaudouin, J., Ellenberg, J., 2009. Molecular crowding
affects diffusion and binding of nuclear proteins in heterochromatin and reveals the fractal organization
of chromatin. EMBO J. 28, 3785–98. doi:10.1038/emboj.2009.340
Banterle, N., Bui, K.H., Lemke, E.A., Beck, M., 2013. Fourier ring correlation as a resolution criterion for
super-resolution microscopy. J. Struct. Biol. 183, 363–7. doi:10.1016/j.jsb.2013.05.004
Baum, M., Erdel, F., Wachsmuth, M., Rippe, K., 2014. Retrieving the intracellular topology from multi-scale
protein mobility mapping in living cells. Nat. Commun. 5, 4494. doi:10.1038/ncomms5494
Benke, A., Manley, S., 2012. Live-Cell dSTORM of Cellular DNA Based on Direct DNA Labeling.
ChemBioChem 13, 298–301. doi:10.1002/cbic.201100679
Bentzon, J.F., Otsuka, F., Virmani, R., Falk, E., 2014. Mechanisms of plaque formation and rupture. Circ.
Res. 114, 1852–1866. doi:10.1161/CIRCRESAHA.114.302721
Benvin, A.L., Creeger, Y., Fisher, G.W., Ballou, B., Alan, S., Armitage, B. a, 2008. NIH Public Access 129,
2025–2034. doi:10.1021/ja066354t.Fluorescent
Bernas, T., Zarebski, M., Cook, P.R., Dobrucki, J.W., 2004. Minimizing photobleaching during confocal
microscopy of fluorescent probes bound to chromatin: role of anoxia and photon flux. J. Microsc. 215,
281–96. doi:10.1111/j.0022-2720.2004.01377.x
Betzig, E., Patterson, G.H., Sougrat, R., Lindwasser, O.W., Olenych, S., Bonifacino, J.S., Davidson, M.W.,
Lippincott-Schwartz, J., Hess, H.F., 2006. Imaging intracellular fluorescent proteins at nanometer
resolution. Science 313, 1642–5. doi:10.1126/science.1127344
Boettiger, A.N., Bintu, B., Moffitt, J.R., Wang, S., Beliveau, B.J., Fudenberg, G., Imakaev, M., Mirny, L.A.,
Wu, C., Zhuang, X., 2016. Chromatin Folding for Different Epigenetic States. Nature 1–15.
doi:10.1038/nature16496
Bornfleth H., Satzler K., Eils R., Cremer C., 1998. High-precision distance measurements and volume-
conserving segmentation of objects near and below the resolution limit in three-dimensional confocal
fluorescence microscopy. J. Microsc. 189, 118–136. doi:10.1046/j.1365-2818.1998.00276.x
Boyle, A.P., Davis, S., Shulha, H.P., Meltzer, P., Margulies, E.H., Weng, Z., Furey, T.S., Crawford, G.E.,
2008. High-Resolution Mapping and Characterization of Open Chromatin across the Genome. Cell
132, 311–322. doi:10.1016/j.cell.2007.12.014
Brown, D.T., Izard, T., Misteli, T., 2006. Mapping the interaction surface of linker histone H1(0) with the
nucleosome of native chromatin in vivo. Nat. Struct. Mol. Biol. 13, 250–255. doi:10.1038/nsmb1050
Burgert, A., Letschert, S., Doose, S., Sauer, M., 2015. Artifacts in single-molecule localization microscopy.
Histochem. Cell Biol. 144, 123–31. doi:10.1007/s00418-015-1340-4
Burgess, R.C., Burman, B., Kruhlak, M.J., Misteli, T., 2014. Activation of DNA Damage Response
Signaling by Condensed Chromatin. Cell Rep. 9, 1703–1718. doi:10.1016/j.celrep.2014.10.060
Burke, B., Stewart, C.L., 2013. The nuclear lamins: flexibility in function. Nat Rev Mol Cell Biol 14, 13–24.

78
Carreau, A., Hafny-Rahbi, B. El, Matejuk, A., Grillon, C., Kieda, C., 2011. Why is the partial oxygen
pressure of human tissues a crucial parameter? Small molecules and hypoxia. J. Cell. Mol. Med. 15,
1239–1253. doi:10.1111/j.1582-4934.2011.01258.x
Chen, H., Yan, Y., Davidson, T.L., Shinkai, Y., Costa, M., 2006. Hypoxic stress induces dimethylated
histone H3 lysine 9 through histone methyltransferase G9a in mammalian cells. Cancer Res. 66, 9009–
16. doi:10.1158/0008-5472.CAN-06-0101
Chen, R., Kang, R., Fan, X.-G., Tang, D., 2014. Release and activity of histone in diseases. Cell Death Dis.
5, e1370. doi:10.1038/cddis.2014.337
Chen, Y.-T., Zang, X.-F., Pan, J., Zhu, X.-L., Chen, F., Chen, Z.-B., Xu, Y., 2012. Expression patterns of
histone deacetylases in experimental stroke and potential targets for neuroprotection. Clin. Exp.
Pharmacol. Physiol. 39, 751–8. doi:10.1111/j.1440-1681.2012.05729.x
Chouchani, E.T., Pell, V.R., Gaude, E., Aksentijević, D., Sundier, S.Y., Robb, E.L., Logan, A., Nadtochiy,
S.M., Ord, E.N.J., Smith, A.C., Eyassu, F., Shirley, R., Hu, C., Dare, A.J., James, A.M., Rogatti, S.,
Hartley, R.C., Eaton, S., Costa, A.S.H., Brookes, P.S., Davidson, S.M., Duchen, M.R., Saeb-Parsy, K.,
Shattock, M.J., Robinson, A.J., Work, L.M., Frezza, C., Krieg, T., Murphy, M.P., 2014. Ischaemic
accumulation of succinate controls reperfusion injury through mitochondrial ROS. Nature 515, 431–
435. doi:10.1038/nature13909
Claycomb, W.C., Lanson, N.A., Stallworth, B.S., Egeland, D.B., Delcarpio, J.B., Bahinski, A., Izzo, N.J.,
1998. HL-1 cells: a cardiac muscle cell line that contracts and retains phenotypic characteristics of the
adult cardiomyocyte. Proc. Natl. Acad. Sci. U. S. A. 95, 2979–2984. doi:10.1073/pnas.95.6.2979
Corona, D.F. V, Siriaco, G., Armstrong, J.A., Snarskaya, N., McClymont, S.A., Scott, M.P., Tamkun, J.W.,
2007. ISWI Regulates Higher-Order Chromatin Structure and Histone H1 Assembly In Vivo. PLoS
Biol 5, e232.
Cosa, G., Focsaneanu, K.S., McLean, J.R., McNamee, J.P., Scaiano, J.C., 2001. Photophysical properties of
fluorescent DNA-dyes bound to single- and double-stranded DNA in aqueous buffered solution.
Photochem. Photobiol. 73, 585–99.
Courtois, Y., Fromageot, P., Guschlbauer, W., 1968. Protonated polynucleotide structures. 3. An optical
rotatory dispersion study of the protonation of DNA. Eur. J. Biochem. 6, 493–501.
Cremer, C., Kaufmann, R., Gunkel, M., Pres, S., Weiland, Y., Müller, P., Ruckelshausen, T., Lemmer, P.,
Geiger, F., Degenhard, S., Wege, C., Lemmermann, N. a W., Holtappels, R., Strickfaden, H.,
Hausmann, M., 2011. Superresolution imaging of biological nanostructures by spectral precision
distance microscopy. Biotechnol. J. 6, 1037–51. doi:10.1002/biot.201100031
Cremer, C., Masters, B.R., 2013. Resolution enhancement techniques in microscopy. Eur. Phys. J. H 38,
281–344. doi:10.1140/epjh/e2012-20060-1
Cremer, T., Cremer, C., 2001. Chromosome territories, nuclear architecture and gene regulation in
mammalian cells. Nat. Rev. Genet. 2, 292–301. doi:10.1038/35066075
Cremer, T., Cremer, M., Hübner, B., Strickfaden, H., Smeets, D., Popken, J., Sterr, M., Markaki, Y., Rippe,
K., Cremer, C., 2015. The 4D nucleome: Evidence for a dynamic nuclear landscape based on co-
aligned active and inactive nuclear compartments. FEBS Lett. 589, 2931–2943.
doi:10.1016/j.febslet.2015.05.037
Cullis, P.M., Wolfenden, R., Cousens, L.S., Alberts, B.M., 1982. Inhibition of histone acetylation by N-[2-
(S-coenzyme A)acetyl] spermidine amide, a multisubstrate analog. J. Biol. Chem. 257, 12165–12169.
Dempsey, G.T., Bates, M., Kowtoniuk, W.E., Liu, D.R., Tsien, R.Y., Zhuang, X., 2009. Photoswitching
mechanism of cyanine dyes. J. Am. Chem. Soc. 131, 18192–3. doi:10.1021/ja904588g
Deschout, H., Cella Zanacchi, F., Mlodzianoski, M., Diaspro, A., Bewersdorf, J., Hess, S.T., Braeckmans,
K., 2014. Precisely and accurately localizing single emitters in fluorescence microscopy. Nat. Methods
11, 253–66. doi:10.1038/nmeth.2843

79
Dixon, J.R., Selvaraj, S., Yue, F., Kim, A., Li, Y., Shen, Y., Hu, M., Liu, J.S., Ren, B., 2012. Topological
domains in mammalian genomes identified by analysis of chromatin interactions. Nature 485, 376–
380. doi:10.1038/nature11082
Dragan, A.I., Casas-Finet, J.R., Bishop, E.S., Strouse, R.J., Schenerman, M.A., Geddes, C.D., 2010.
Characterization of PicoGreen interaction with dsDNA and the origin of its fluorescence enhancement
upon binding. Biophys. J. 99, 3010–3019. doi:10.1016/j.bpj.2010.09.012
Dragan, A.I., Pavlovic, R., McGivney, J.B., Casas-Finet, J.R., Bishop, E.S., Strouse, R.J., Schenerman,
M.A., Geddes, C.D., 2012. SYBR Green I: Fluorescence properties and interaction with DNA. J.
Fluoresc. 22, 1189–1199. doi:10.1007/s10895-012-1059-8
Drobyshev, A.L., Zasedatelev, A.S., Yershov, G.M., Mirzabekov, A.D., 1999. Massive parallel analysis of
DNA-Hoechst 33258 binding specificity with a generic oligodeoxyribonucleotide microchip. Nucleic
Acids Res. 27, 4100–4105. doi:10.1093/nar/27.20.4100
Duan, Q., Yang, T., 2012. Ischaemia reperfusion may be a new approach in cancer interventional therapy. J.
Med. Hypotheses Ideas 6, 50–52. doi:10.1016/j.jmhi.2012.03.003
Edelmann, P., Esa, A., Bomfleth, H., Heintzmann, R., Hausmann, M., Cremer, C., 1998. Correlation of
chromatic shifts and focal depth in Spectral Precision Distance Microscopy measured by Micro Axial
Tomography., in: Conference on Optical Biopsies and Microscopic Techniques III. Stockholm, pp. 89–
95.
Fabre, P.J., Benke, A., Joye, E., Nguyen Huynh, T.H., Manley, S., Duboule, D., 2015. Nanoscale spatial
organization of the HoxD gene cluster in distinct transcriptional states. Proc. Natl. Acad. Sci. U. S. A.
112, 13964–9. doi:10.1073/pnas.1517972112
Flors, C., 2011. DNA and chromatin imaging with super-resolution fluorescence microscopy based on
single-molecule localization. Biopolymers 95, 290–7. doi:10.1002/bip.21574
Flors, C., 2010. Photoswitching of monomeric and dimeric DNA-intercalating cyanine dyes for super-
resolution microscopy applications. Photochem. Photobiol. Sci. 9, 643–8. doi:10.1039/b9pp00119k
Flors, C., Ravarani, C.N.J., Dryden, D.T.F., 2009. Super-resolution imaging of DNA labelled with
intercalating dyes. Chemphyschem 10, 2201–4. doi:10.1002/cphc.200900384
Fölling, J., Bossi, M., Bock, H., Medda, R., Wurm, C.A., Hein, B., Jakobs, S., Eggeling, C., Hell, S.W.,
2008. Fluorescence nanoscopy by ground-state depletion and single-molecule return 5, 943–945.
doi:10.1038/NMETH.1257
Fraser, J., Ferrai, C., Chiariello, A.M., Schueler, M., Rito, T., Laudanno, G., Barbieri, M., Moore, B.L.,
Kraemer, D.C., Aitken, S., Xie, S.Q., Morris, K.J., Itoh, M., Kawaji, H., Jaeger, I., Hayashizaki, Y.,
Carninci, P., Forrest, A.R., Dostie, J., Pombo, A., Nicodemi, M., 2015. Hierarchical folding and
reorganization of chromosomes are linked to transcriptional changes in cellular differentiation. Mol
Syst Biol 11, 1–14. doi:10.15252/msb
Fudenberg, G., Imakaev, M., Lu, C., Goloborodko, A., Abdennur, N., Mirny, L.A., 2016. Formation of
Chromosomal Domains by Loop Extrusion. Cell Rep. 15, 2038–49. doi:10.1016/j.celrep.2016.04.085
Fullwood, M.J., Ruan, Y., 2009. ChIP-based methods for the identification of long-range chromatin
interactions. J. Cell. Biochem. 107, 30–39. doi:10.1002/jcb.22116
Gao, J., Yang, X., Djekidel, M.N., Wang, Y., Xi, P., Zhang, M.Q., 2016. Developing bioimaging and
quantitative methods to study 3D genome. Quant. Biol. 4, 129–147. doi:10.1007/s40484-016-0065-2
Gavrilov, A.A., Shevelyov, Y.Y., Ulianov, S. V., Khrameeva, E.E., Kos, P., Chertovich, A., Razin, S. V.,
2016. Unraveling the mechanisms of chromatin fibril packaging. Nucleus 7, 319–24.
doi:10.1080/19491034.2016.1190896
Geddes, C.D., Lakowicz, J.R., 2002. Metal-Enhanced Fluorescence. J. Fluoresc. 12, 121–129.
doi:10.1023/A:1016875709579
80
Geiger, S., Holdenrieder, S., Stieber, P., Hamann, G.F., Bruening, R., Ma, J., Nagel, D., Seidel, D., 2006.
Nucleosomes in serum of patients with early cerebral stroke. Cerebrovasc. Dis. 21, 32–37.
doi:10.1159/000089591
Glazer, A.N., Rye, H.S., 1992. Stable dye-DNA intercalation complexes as reagents for high-sensitivity
fluorescence detection. Nature 359, 859–61. doi:10.1038/359859a0
Görisch, S.M., Wachsmuth, M., Tóth, K.F., Lichter, P., Rippe, K., 2005. Histone acetylation increases
chromatin accessibility. J. Cell Sci. 118, 5825–5834. doi:10.1242/jcs.02689
Granger, A., Abdullah, I., Huebner, F., Stout, A., Wang, T., Huebner, T., Epstein, J. a, Gruber, P.J., 2008.
Histone deacetylase inhibition reduces myocardial ischemia-reperfusion injury in mice. FASEB J. 22,
3549–60. doi:10.1096/fj.08-108548
Gruell, F., Kirchgessner, M., Kaufmann, R., Hausmann, M., Kebschull, U., 2011. Accelerating Image
Analysis for Localization Microscopy with FPGAs, in: 2011 21st International Conference on Field
Programmable Logic and Applications. IEEE, pp. 1–5. doi:10.1109/FPL.2011.11
Günther, K., Mertig, M., Seidel, R., 2010. Mechanical and structural properties of YOYO-1 complexed
DNA. Nucleic Acids Res. 38, 6526–6532. doi:10.1093/nar/gkq434
Gustafsson, M.G.L., 2000. Surpassing the lateral resolution limit by a factor of two using structured
illumination microscopy. J. Microsc. 198, 82–87. doi:10.1046/j.1365-2818.2000.00710.x
Ha, H.C., Sirisoma, N.S., Kuppusamy, P., Zweier, J.L., Woster, P.M., Casero, R.A.J., 1998. The natural
polyamine spermine functions directly as a free radical scavenger. Proc. Natl. Acad. Sci. U. S. A. 95,
11140–11145.
Hancock, R., Jeon, K.W., 2014. Preface, in: Biology, R.H. and K.W.J.B.T.-I.R. of C. and M. (Ed.), New
Models of the Cell Nucleus: Crowding, Entropic Forces, Phase Separation, and Fractals. Academic
Press, p. xiii. doi:http://dx.doi.org/10.1016/B978-0-12-800046-5.10000-1
Hausenloy, D., Yellon, D., 2013. Myocardial ischemia-reperfusion injury: a neglected therapeutic target. J
Clin Invest 123, 92–100. doi:10.1172/JCI62874.92
Heilemann, M., Margeat, E., Kasper, R., Sauer, M., Tinnefeld, P., 2005. Carbocyanine dyes as efficient
reversible single-molecule optical switch. J. Am. Chem. Soc. 127, 3801–3806. doi:10.1021/ja044686x
Heilemann, M., van de Linde, S., Schüttpelz, M., Kasper, R., Seefeldt, B., Mukherjee, A., Tinnefeld, P.,
Sauer, M., 2008. Subdiffraction-resolution fluorescence imaging with conventional fluorescent probes.
Angew. Chem. Int. Ed. Engl. 47, 6172–6. doi:10.1002/anie.200802376
Heintzmann, R., Cremer, C.G., 1999. Laterally modulated excitation microscopy: improvement of resolution
by using a diffraction grating. pp. 185–196.
Heisenberg, W., 1927. Über den anschaulichen Inhalt der quantentheoretischen Kinematik und Mechanik.
Zeitschrift für Phys. 43, 172–198. doi:10.1007/BF01397280
Hell, S.W., Wichmann, J., 1994. Breaking the diffraction resolution limit by stimulated emission: stimulated-
emission-depletion fluorescence microscopy. Opt. Lett. 19, 780–782.
Hermann, P., Fredericq, E., 1977. The role of the AT pairs in the acid denaturation of DNA. Nucleic Acids
Res. 4, 2939–2947. doi:10.1093/nar/4.8.2939
Hess, S.T., Girirajan, T.P.K., Mason, M.D., 2006. Ultra-high resolution imaging by fluorescence
photoactivation localization microscopy. Biophys. J. 91, 4258–72. doi:10.1529/biophysj.106.091116
Huang, B., Wang, W., Bates, M., Zhuang, X., 2008. Three-dimensional super-resolution imaging by
stochastic optical reconstruction microscopy. Science 319, 810–3. doi:10.1126/science.1153529
Hübner, B., Lomiento, M., Mammoli, F., Illner, D., Markaki, Y., Ferrari, S., Cremer, M., Cremer, T., 2015.
Remodeling of nuclear landscapes during human myelopoietic cell differentiation maintains co-aligned
active and inactive nuclear compartments. Epigenetics Chromatin 8, 47. doi:10.1186/s13072-015-

81
0038-0
Irianto, J., Lee, D.A., Knight, M.M., 2014. Quantification of chromatin condensation level by image
processing. Med. Eng. Phys. 36, 412–417. doi:10.1016/j.medengphy.2013.09.006
Irianto, J., Swift, J., Martins, R.P., McPhail, G.D., Knight, M.M., Discher, D.E., Lee, D.A., 2013. Osmotic
challenge drives rapid and reversible chromatin condensation in chondrocytes. Biophys. J. 104, 759–
769. doi:10.1016/j.bpj.2013.01.006
Jiang, C., Pugh, B.F., 2009. Nucleosome positioning and gene regulation: advances through genomics. Nat.
Rev. Genet. 10, 161–72. doi:10.1038/nrg2522
Jin, R., Yang, G., Li, G., 2010. Inflammatory mechanisms in ischemic stroke: role of inflammatory cells. J.
Leukoc. Biol. 87, 779–789. doi:10.1189/jlb.1109766
Joseph, M.J., Taylor, J.C., McGown, L.B., Pitner, J.B., Linn, C.P., 1998. Spectroscopic studies of YO and
YOYO fluorescent dyes in a thrombin-binding DNA ligand. Biospectroscopy 2, 173–183.
doi:10.1002/(SICI)1520-6343(1996)2:3<173::AID-BSPY4>3.0.CO;2-9
Kaplan, C., Ewers, H., 2015. Optimized sample preparation for single-molecule localization-based
superresolution microscopy in yeast. Nat. Protoc. 10, 1007–21. doi:10.1038/nprot.2015.060
Karmodiya, K., Krebs, A.R., Oulad-Abdelghani, M., Kimura, H., Tora, L., 2012. H3K9 and H3K14
acetylation co-occur at many gene regulatory elements, while H3K14ac marks a subset of inactive
inducible promoters in mouse embryonic stem cells. BMC Genomics 13, 1–18. doi:10.1186/1471-
2164-13-424
Klehs, K., Spahn, C., Endesfelder, U., Lee, S.F., Fuerstenberg, A., Heilemann, M., 2014. Increasing the
brightness of cyanine fluorophores for single-molecule and superresolution imaging. ChemPhysChem
15, 637–641. doi:10.1002/cphc.201300874
Kundukad, B., Yan, J., Doyle, P.S., 2014. Effect of YOYO-1 on the mechanical properties of DNA. Soft
Matter 9721–9728. doi:10.1039/c4sm02025a
Lakowicz, J.R., 2006. Principles of Fluorescence Spectroscopy, Principles of fluorescence spectroscopy,
Springer, New York, USA, 3rd edn, 2006. Springer US, Boston, MA. doi:10.1007/978-0-387-46312-4
Legant, W.R., Shao, L., Grimm, J.B., Brown, T.A., Milkie, D.E., Avants, B.B., Lavis, L.D., Betzig, E., 2016.
High-density three-dimensional localization microscopy across large volumes. Nat. Methods 1–9.
doi:10.1038/nmeth.3797
Lemasters, J.J., Bond, J.M., Chacon, E., Harper, I.S., Kaplan, S.H., Ohata, H., Trollinger, D.R., Herman, B.,
Cascio, W.E., 1996. The pH paradox in ischemia-reperfusion injury to cardiac myocytes. EXS 76, 99–
114.
Lerman, L.S., 1961. Structural considerations in the interaction of DNA and acridines. J. Mol. Biol. 3, 18–
30.
Liu, X., Diao, H., Nishi, N., 2008. Applied chemistry of natural DNA. Chem. Soc. Rev. 37, 2745–2757.
doi:10.1039/b801433g
Llères, D., James, J., Swift, S., Norman, D.G., Lamond, A.I., 2009. Quantitative analysis of chromatin
compaction in living cells using FLIM-FRET. J. Cell Biol. 187, 481–96. doi:10.1083/jcb.200907029
Lukinavičius, G., Blaukopf, C., Pershagen, E., Schena, A., Reymond, L., Derivery, E., Gonzalez-Gaitan, M.,
D‟Este, E., Hell, S.W., Gerlich, D.W., Johnsson, K., 2015. SiR-Hoechst is a far-red DNA stain for live-
cell nanoscopy. Nat. Commun. 6, 8497. doi:10.1038/ncomms9497
Ma, Y., Kanakousaki, K., Buttitta, L., 2015. How the cell cycle impacts chromatin architecture and
influences cell fate. Front. Genet. 5, 1–18. doi:10.3389/fgene.2015.00019
Maeshima, K., Hihara, S., Eltsov, M., 2010. Chromatin structure: Does the 30-nm fibre exist in vivo? Curr.
Opin. Cell Biol. 22, 291–297. doi:10.1016/j.ceb.2010.03.001

82
Manzini, G., Xodo, L., Barcellona, M.L., Quadrifoglio, F., 1985. Interaction of DAPI with double-stranded
ribonucleic acids. Nucleic Acids Res. 13, 8955–8967. doi:10.1093/nar/13.24.8955
Markaki, Y., Gunkel, M., Schermelleh, L., Beichmanis, S., Neumann, J., Heidemann, M., Leonhardt, H.,
Eick, D., Cremer, C., Cremer, T., 2010. Functional nuclear organization of transcription and DNA
replication: a topographical marriage between chromatin domains and the interchromatin compartment.
Cold Spring Harb. Symp. Quant. Biol. 75, 475–92. doi:10.1101/sqb.2010.75.042
Matthews, H.R., 1993. Polyamines, chromatin structure and transcription. Bioessays 15, 561–6.
doi:10.1002/bies.950150811
Misteli, T., Gunjan, a, Hock, R., Bustin, M., Brown, D.T., 2000. Dynamic binding of histone H1 to
chromatin in living cells. Nature 408, 877–881. doi:10.1038/35048610
Moeller, B.J., Richardson, R.A., Dewhirst, M.W., 2007. Hypoxia and radiotherapy: Opportunities for
improved outcomes in cancer treatment. Cancer Metastasis Rev. 26, 241–248. doi:10.1007/s10555-
007-9056-0
Montavon, T., Soshnikova, N., Mascrez, B., Joye, E., Thevenet, L., Splinter, E., de Laat, W., Spitz, F.,
Duboule, D., 2011. A regulatory archipelago controls Hox genes transcription in digits. Cell 147,
1132–45. doi:10.1016/j.cell.2011.10.023
Mortensen, K.I., Churchman, L.S., Spudich, J.A., Flyvbjerg, H., 2010. Optimized localization analysis for
single-molecule tracking and super-resolution microscopy. Nat. Methods 7, 377–81.
doi:10.1038/nmeth.1447
Murphy, E., Steenbergen, C., Levy, L.A., Raju, B., London, R.E., 1989. Cytosolic free magnesium levels in
ischemic rat heart. J. Biol. Chem. 264, 5622–7.
Nieuwenhuizen, R.P.J., Lidke, K. a, Bates, M., Puig, D.L., Grünwald, D., Stallinga, S., Rieger, B., 2013.
Measuring image resolution in optical nanoscopy. Nat. Methods 10, 557–62. doi:10.1038/nmeth.2448
Njoh, K.L., Patterson, L.H., Zloh, M., Wiltshire, M., Fisher, J., Chappell, S., Ameer-Beg, S., Bai, Y.,
Matthews, D., Errington, R.J., Smith, P.J., 2006. Spectral analysis of the DNA targeting
bisalkylaminoanthraquinone DRAQ5 in intact living cells. Cytom. Part A 69, 805–814.
doi:10.1002/cyto.a.20308
Nowotarski, S.L., Woster, P.M., Casero, R.A., 2013. Polyamines and cancer: implications for chemotherapy
and chemoprevention. Expert Rev. Mol. Med. 15, e3. doi:10.1017/erm.2013.3
Olins, D.E., Olins, A.L., 2003. Chromatin history: our view from the bridge. Nat. Rev. Mol. Cell Biol. 4,
809–14. doi:10.1038/nrm1225
Olivier, N., Keller, D., Gönczy, P., Manley, S., 2013. Resolution doubling in 3D-STORM imaging through
improved buffers. PLoS One 8, e69004. doi:10.1371/journal.pone.0069004
P. Thévenaz, U.E. Ruttimann, M.U., 1998. A Pyramid Approach to Subpixel Registration Based on
Intensity. IEEE Trans. Image Process. 7, 27–41.
Parkins, C.S., Dennis, M.F., Stratford, M.R., Hill, S. a, Chaplin, D.J., 1995. Ischemia reperfusion injury in
tumors: the role of oxygen radicals and nitric oxide. Cancer Res. 55, 6026–9.
Patterson, G.H., Lippincott-Schwartz, J., 2002. A photoactivatable GFP for selective photolabeling of
proteins and cells. Science 297, 1873–7. doi:10.1126/science.1074952
Pederson, T., 2014. Chapter One - The Nuclear Physique, in: Biology, R.H. and K.W.J.B.T.-I.R. of C. and
M. (Ed.), New Models of the Cell Nucleus: Crowding, Entropic Forces, Phase Separation, and Fractals.
Academic Press, pp. 1–13. doi:http://dx.doi.org/10.1016/B978-0-12-800046-5.00001-1
Persson, F., Bingen, P., Staudt, T., Engelhardt, J., Tegenfeldt, J.O., Hell, S.W., 2011. Fluorescence
nanoscopy of single DNA molecules by using stimulated emission depletion (STED). Angew. Chem.
Int. Ed. Engl. 50, 5581–3. doi:10.1002/anie.201100371

83
Pigram, W.J., Fuller, W., Davies, M.E., 1973. Unwinding the DNA helix by intercalation. J. Mol. Biol. 80,
361–365. doi:http://dx.doi.org/10.1016/0022-2836(73)90178-2
Pope, B.D., Ryba, T., Dileep, V., Yue, F., Wu, W., Denas, O., Vera, D.L., Wang, Y., Hansen, R.S., Canfield,
T.K., Thurman, R.E., Cheng, Y., Gülsoy, G., Dennis, J.H., Snyder, M.P., Stamatoyannopoulos, J.A.,
Taylor, J., Hardison, R.C., Kahveci, T., Ren, B., Gilbert, D.M., 2014. Topologically associating
domains are stable units of replication-timing regulation. Nature 515, 402–405.
doi:10.1038/nature13986
Popken, J., Brero, A., Koehler, D., Schmid, V.J., Strauss, A., Wuensch, A., Guengoer, T., Graf, A., Krebs,
S., Blum, H., Zakhartchenko, V., Wolf, E., Cremer, T., 2014. Reprogramming of fibroblast nuclei in
cloned bovine embryos involves major structural remodeling with both striking similarities and
differences to nuclear phenotypes of in vitro fertilized embryos. Nucleus 5, 555–89.
doi:10.4161/19491034.2014.979712
Popken, J., Graf, A., Krebs, S., Blum, H., Schmid, V.J., Strauss, A., Guengoer, T., Zakhartchenko, V., Wolf,
E., Cremer, T., 2015. Remodeling of the nuclear envelope and lamina during bovine preimplantation
development and its functional implications. PLoS One 10, 1–22. doi:10.1371/journal.pone.0124619
Prakash, K., Fournier, D., Redl, S., Best, G., Borsos, M., Tiwari, V.K., Tachibana-Konwalski, K., Ketting,
R.F., Parekh, S.H., Cremer, C., Birk, U.J., 2015. Superresolution imaging reveals structurally distinct
periodic patterns of chromatin along pachytene chromosomes. Proc. Natl. Acad. Sci. U. S. A. 112,
14635–40. doi:10.1073/pnas.1516928112
Qian, T., Nieminen, A.L., Herman, B., Lemasters, J.J., 1997. Mitochondrial permeability transition in pH-
dependent reperfusion injury to rat hepatocytes. Am. J. Physiol. 273, C1783–92.
Raffaghello, L., Lee, C., Safdie, F.M., Wei, M., Madia, F., Bianchi, G., Longo, V.D., 2008. Starvation-
dependent differential stress resistance protects normal but not cancer cells against high-dose
chemotherapy. Proc. Natl. Acad. Sci. 105, 8215–8220. doi:10.1073/pnas.0708100105
Rao, S.S.P., Huntley, M.H., Durand, N.C., Stamenova, E.K., Bochkov, I.D., Robinson, J.T., Sanborn, A.L.,
Machol, I., Omer, A.D., Lander, E.S., Aiden, E.L., 2014. A 3D map of the human genome at kilobase
resolution reveals principles of chromatin looping. Cell 159, 1665–1680.
doi:10.1016/j.cell.2014.11.021
Raul, F., 2007. Revival of 2-(difluoromethyl)ornithine (DFMO), an inhibitor of polyamine biosynthesis, as a
cancer chemopreventive agent. Biochem. Soc. Trans. 35, 353–5. doi:10.1042/BST0350353
Reisner, W., Larsen, N.B., Silahtaroglu, A., Kristensen, A., Tommerup, N., Tegenfeldt, J.O., Flyvbjerg, H.,
2010. Single-molecule denaturation mapping of DNA in nanofluidic channels. Proc. Natl. Acad. Sci.
107, 13294–13299. doi:10.1073/pnas.1007081107
Reymann, J., Baddeley, D., Gunkel, M., Lemmer, P., Stadter, W., Jegou, T., Rippe, K., Cremer, C., Birk, U.,
2008. High-precision structural analysis of subnuclear complexes in fixed and live cells via spatially
modulated illumination (SMI) microscopy. Chromosome Res. 16, 367–82. doi:10.1007/s10577-008-
1238-2
Ricci, M.A., Manzo, C., García-Parajo, M.F., Lakadamyali, M., Cosma, M.P., 2015. Chromatin Fibers Are
Formed by Heterogeneous Groups of Nucleosomes In Vivo. Cell 160, 1145–1158.
doi:10.1016/j.cell.2015.01.054
Ries, J., Kaplan, C., Platonova, E., Eghlidi, H., Ewers, H., 2012. A simple, versatile method for GFP-based
super-resolution microscopy via nanobodies. Nat. Methods 9, 582–584. doi:10.1038/nmeth.1991
Righolt, C.H., Guffei, A., Knecht, H., Young, I.T., Stallinga, S., van Vliet, L.J., Mai, S., 2014. Differences in
nuclear DNA organization between lymphocytes, Hodgkin and Reed-Sternberg cells revealed by
structured illumination microscopy. J. Cell. Biochem. 115, 1441–8. doi:10.1002/jcb.24800
Rust, M.J., Bates, M., Zhuang, X., 2006. Sub-diffraction-limit imaging by stochastic optical reconstruction
microscopy (STORM). Nat. Methods 3, 793–5. doi:10.1038/nmeth929

84
Rye, H.S., Yue, S., Wemmer, D.E., Quesada, M. a, Haugland, R.P., Mathies, R. a, Giazer, A.N., 1992. bis-
intercalating asymmetric cyanine dyes : properties and applications CO-. Nucleic Acids Res. 20, 2803–
2812.
Sahl, S.J., Balzarotti, F., Keller-Findeisen, J., Leutenegger, M., Westphal, V., Egner, A., Lavoie-Cardinal, F.,
Chmyrov, A., Grotjohann, T., Jakobs, S., 2016. Comment on “Extended-resolution structured
illumination imaging of endocytic and cytoskeletal dynamics.” Science (80-. ). 352, 527.
Sari, N., Antepli, E., Nartop, D., Yetim, N.K., 2012. Polystyrene Attached Pt(IV)–Azomethine, Synthesis
and Immobilization of Glucose Oxidase Enzyme. Int. J. Mol. Sci. 13, 11870–11880.
doi:10.3390/ijms130911870
Sauer, M., Hofkens, J., Enderlein, J., 2011. Handbook of Fluorescence Spectroscopy and Imaging, Handbook
of Fluorescence Spectroscopy and Imaging. Wiley-VCH Verlag GmbH & Co. KGaA, Weinheim,
Germany. doi:10.1002/9783527633500
Schermelleh, L., Carlton, P.M., Haase, S., Shao, L., Winoto, L., Kner, P., Burke, B., Cardoso, M.C., Agard,
D. a, Gustafsson, M.G.L., Leonhardt, H., Sedat, J.W., 2008. Subdiffraction multicolor imaging of the
nuclear periphery with 3D structured illumination microscopy. Science 320, 1332–6.
doi:10.1126/science.1156947
Schoen, I., Ries, J., Klotzsch, E., Ewers, H., Vogel, V., 2011. Binding-Activated Localization Microscopy of
DNA Structures. Nano Lett. 11, 4008–4011. doi:10.1021/nl2025954
Schwab, R.A.V., Niedzwiedz, W., 2011. Visualization of DNA Replication in the Vertebrate Model System
DT40 using the DNA Fiber Technique. J. Vis. Exp. e3255. doi:10.3791/3255
Schweizer, S., Meisel, A., Marschenz, S., 2013. Epigenetic mechanisms in cerebral ischemia. J. Cereb.
Blood Flow Metab. 33, 1335–1346. doi:10.1038/jcbfm.2013.93
Semenza, G., 2009. Regulation of Oxygen Homeostasis by Hypoxia-Inducible Factor 1. Physiol 24, 97–106.
doi:doi:10.1152/physiol.00045.2008
Sharonov, A., Hochstrasser, R.M., 2006. Wide-field subdiffraction imaging by accumulated binding of
diffusing probes. Proc. Natl. Acad. Sci. U. S. A. 103, 18911–18916. doi:10.1073/pnas.0609643104
Shcherbakova, D.M., Sengupta, P., Lippincott-Schwartz, J., Verkhusha, V. V, 2014. Photocontrollable
Fluorescent Proteins for Superresolution Imaging. Annu. Rev. Biophys. 43, 303–329.
doi:10.1146/annurev-biophys-051013-022836
Shlyueva, D., Stampfel, G., Stark, A., 2014. Transcriptional enhancers: from properties to genome-wide
predictions. Nat. Rev. Genet. 15, 272–86. doi:10.1038/nrg3682
Shmakova, A., Batie, M., Druker, J., Rocha, S., 2014. Chromatin and oxygen sensing in the context of JmjC
histone demethylases. Biochem. J. 462, 385–395. doi:10.1042/BJ20140754
Sibarita, J., Heilemann, M., 2012. Targeting, resolving and quantifying cellular structures by single-molecule
localization microscopy. EMBO Rep. 13, 1043–1045. doi:10.1038/embor.2012.177
Smirnov, I. V, Dimitrov, S.I., Makarov, V.L., 1988. NaCl-induced chromatin condensation. Application of
static light scattering at 90 degrees and stopped flow technique. J. Biomol. Struct. Dyn. 5, 1127–1134.
doi:10.1080/07391102.1988.10506453
Smith, P.J., Blunt, N., Wiltshire, M., Hoy, T., Teesdale-Spittle, P., Craven, M.R., Watson, J. V., Brad Amos,
W., Errington, R.J., Patterson, L.H., 2000. Characteristics of a novel deep red/infrared fluorescent cell-
permeant DNA probe, DRAQ5, in intact human cells analyzed by flow cytometry, confocal and
multiphoton microscopy. Cytometry 40, 280–291. doi:10.1002/1097-0320(20000801)40:4<280::AID-
CYTO4>3.0.CO;2-7
Sorokin, V.A., Gladchenko, G.O., Valeev, V.A., 1986. DNA protonation at low ionic strength of solution.
Die Makromol. Chemie 187, 1053–1063. doi:10.1002/macp.1986.021870502

85
Steinberg, D., Glass, C.K., Witztum, J.L., 2008. Evidence mandating earlier and more aggressive treatment
of hypercholesterolemia. Circulation 118, 672–677. doi:10.1161/CIRCULATIONAHA.107.753152
Swoboda, M., Henig, J., Cheng, H.M., Brugger, D., Haltrich, D., Plumeré, N., Schlierf, M., 2012. Enzymatic
oxygen scavenging for photostability without ph drop in single-molecule experiments. ACS Nano 6,
6364–6369. doi:10.1021/nn301895c
Takata, H., Hanafusa, T., Mori, T., Shimura, M., Iida, Y., Ishikawa, K., Yoshikawa, K., Yoshikawa, Y.,
Maeshima, K., 2013. Chromatin Compaction Protects Genomic DNA from Radiation Damage. PLoS
One 8, 1–11. doi:10.1371/journal.pone.0075622
Tang, Z., Luo, O.J., Li, X., Zheng, M., Zhu, J.J., Szalaj, P., Trzaskoma, P., Magalska, A., Wlodarczyk, J.,
Ruszczycki, B., Michalski, P., Piecuch, E., Wang, P., Wang, D., Tian, S.Z., Penrad-Mobayed, M.,
Sachs, L.M., Ruan, X., Wei, C.L., Liu, E.T., Wilczynski, G.M., Plewczynski, D., Li, G., Ruan, Y.,
2015. CTCF-Mediated Human 3D Genome Architecture Reveals Chromatin Topology for
Transcription. Cell 163, 1611–1627. doi:10.1016/j.cell.2015.11.024
Thompson, R.E., Larson, D.R., Webb, W.W., 2002. Precise nanometer localization analysis for individual
fluorescent probes. Biophys. J. 82, 2775–83. doi:10.1016/S0006-3495(02)75618-X
Traganos, F., Darzynkiewicz, Z., Sharpless, T., Melamed, M.R., 1975. Denaturation of deoxyribonucleic
acid in situ effect of formaldehyde. J. Histochem. Cytochem. 23, 431–8.
Trembecka-Lucas, D.O., Dobrucki, J.W., 2012. A heterochromatin protein 1 (HP1) dimer and a proliferating
cell nuclear antigen (PCNA) protein interact in vivo and are parts of a multiprotein complex involved
in DNA replication and DNA repair. Cell Cycle 11, 2170–5. doi:10.4161/cc.20673
Trembecka-Lucas, D.O., Szczurek, A.T., Dobrucki, J.W., 2013. Dynamics of the HP1β-PCNA-containing
complexes in DNA replication and repair. Nucleus 4, 74–82. doi:10.4161/nucl.23683
van de Linde, S., Krstić, I., Prisner, T., Doose, S., Heilemann, M., Sauer, M., 2011. Photoinduced formation
of reversible dye radicals and their impact on super-resolution imaging. Photochem. Photobiol. Sci. 10,
499–506. doi:10.1039/c0pp00317d
Vanhaecke, T., Papeleu, P., Elaut, G., Rogiers, V., 2004. Trichostatin A-like hydroxamate histone
deacetylase inhibitors as therapeutic agents: toxicological point of view. Curr. Med. Chem. 11, 1629–
43.
Vardevanyan, P.O., Antonyan, a P., Parsadanyan, M. a, Davtyan, H.G., Karapetyan, a T., 2003. The binding
of ethidium bromide with DNA: interaction with single- and double-stranded structures. Exp. Mol.
Med. 35, 527–533. doi:10.1038/emm.2003.68
Vaughan, J.C., Dempsey, G.T., Sun, E., Zhuang, X., 2013. Phosphine quenching of cyanine dyes as a
versatile tool for fluorescence microscopy. J. Am. Chem. Soc. 135, 1197–200. doi:10.1021/ja3105279
Vigne, P., Frelin, C., 2008. The role of polyamines in protein-dependent hypoxic tolerance of Drosophila.
BMC Physiol. 8, 22. doi:10.1186/1472-6793-8-22
Visvanathan, A., Ahmed, K., Even-Faitelson, L., Lleres, D., Bazett-Jones, D.P., Lamond, A.I., 2013.
Modulation of Higher Order Chromatin Conformation in Mammalian Cell Nuclei Can Be Mediated by
Polyamines and Divalent Cations. PLoS One 8. doi:10.1371/journal.pone.0067689
Vivar, R., Humeres, C., Varela, M., Ayala, P., Guzman, N., Olmedo, I., Catalan, M., Boza, P., Munoz, C.,
Diaz Araya, G., 2012. Cardiac fibroblast death by ischemia/reperfusion is partially inhibited by IGF-1
through both PI3K/Akt and MEK-ERK pathways. Exp. Mol. Pathol. 93, 1–7.
doi:10.1016/j.yexmp.2012.01.010
Vogelsang, J., Kasper, R., Steinhauer, C., Person, B., Heilemann, M., Sauer, M., Tinnefeld, P., 2008. A
reducing and oxidizing system minimizes photobleaching and blinking of fluorescent dyes. Angew.
Chemie - Int. Ed. 47, 5465–5469. doi:10.1002/anie.200801518
Vogelsang, J., Steinhauer, C., Forthmann, C., Stein, I.H., Person-Skegro, B., Cordes, T., Tinnefeld, P., 2010.

86
Make them blink: probes for super-resolution microscopy. Chemphyschem 11, 2475–90.
doi:10.1002/cphc.201000189
Wang, S., Su, J.-H., Beliveau, B.J., Bintu, B., Moffitt, J.R., Wu, C. -t., Zhuang, X., 2016. Spatial
organization of chromatin domains and compartments in single chromosomes. Science (80-. ). 353,
598–602. doi:10.1126/science.aaf8084
Watson, J.D., Crick, F.H.C., 1953. Molecular Structure of Nucleic Acids: A Structure for Deoxyribose
Nucleic Acid. Nature 171, 737–738. doi:10.1038/171737a0
Webster, A.L.H., Yan, M.S.-C., Marsden, P.A., 2013. Epigenetics and cardiovascular disease. Can. J.
Cardiol. 29, 46–57. doi:10.1016/j.cjca.2012.10.023
Weis, S.M., Cheresh, D.A., 2011. Tumor angiogenesis: molecular pathways and therapeutic targets. Nat.
Med. 17, 1359–1370. doi:10.1038/nm.2537
Weisblum, B., Haenssler, E., 1974. Fluorometric properties of the bibenzimidazole derivative Hoechst
33258, a fluorescent probe specific for AT concentration in chromosomal DNA. Chromosoma 46,
255–60.
Wojcik, K., Dobrucki, J.W., 2008. Interaction of a DNA intercalator DRAQ5, and a minor groove binder
SYTO17, with chromatin in live cells - influence on chromatin organization and histone-DNA
interactions. Cytometry. A 73, 555–62. doi:10.1002/cyto.a.20573
Wójcik, K., Zarębski, M., Cossarizza, A., Dobrucki, J.W., 2013. Daunomycin, an antitumor DNA
intercalator, influences histone-DNA interactions. Cancer Biol. Ther. 14, 823–32.
doi:10.4161/cbt.25328
Woringer, M., Darzacq, X., Izeddin, I., 2014. Geometry of the nucleus: A perspective on gene expression
regulation. Curr. Opin. Chem. Biol. 20, 112–119. doi:10.1016/j.cbpa.2014.05.009
Yan, X., Habbersett, R.C., Yoshida, T.M., Nolan, J.P., Jett, J.H., Marrone, B.L., 2005. Probing the kinetics
of SYTOX Orange stain binding to double-stranded DNA with implications for DNA analysis. Anal.
Chem. 77, 3554–3562. doi:10.1021/ac050306u
Yan, X.M., Habbersett, R.C., Cordek, J.M., Nolan, J.P., Yoshida, T.M., Jett, J.H., Marrone, B.L., 2000.
Development of a mechanism-based, DNA staining protocol using SYTOX orange nucleic acid stain
and DNA fragment sizing flow cytometry. Anal Biochem 286, 138–148. doi:DOI
10.1006/abio.2000.4789
Yellon, D.M., Hausenloy, D.J., 2007. Myocardial Reperfusion Injury. N. Engl. J. Med. 357, 1121–1135.
doi:10.1056/NEJMra071667
Zessin, P.J.M., Finan, K., Heilemann, M., 2012. Super-resolution fluorescence imaging of chromosomal
DNA. J. Struct. Biol. 177, 344–8. doi:10.1016/j.jsb.2011.12.015
Zhao, H., Halicka, H.D., Li, J., Biela, E., Berniak, K., Dobrucki, J., Darzynkiewicz, Z., 2013. DNA damage
signaling, impairment of cell cycle progression, and apoptosis triggered by 5-ethynyl-2‟-deoxyuridine
incorporated into DNA. Cytometry. A 83, 979–88. doi:10.1002/cyto.a.22396
Zhao, Y.J., Xu, C.Q., Zhang, W.H., Zhang, L., Bian, S.L., Huang, Q., Sun, H.L., Li, Q.F., Zhang, Y. qiao,
Tian, Y., Wang, R., Yang, B.F., Li, W.M., 2007. Role of polyamines in myocardial
ischemia/reperfusion injury and their interactions with nitric oxide. Eur. J. Pharmacol. 562, 236–246.
doi:10.1016/j.ejphar.2007.01.096
Zhao, Z.W., Roy, R., Gebhardt, J.C.M., Suter, D.M., Chapman, A.R., Xie, X.S., 2014. Spatial organization
of RNA polymerase II inside a mammalian cell nucleus revealed by reflected light-sheet
superresolution microscopy. Proc. Natl. Acad. Sci. U. S. A. 111, 681–6. doi:10.1073/pnas.1318496111
Zheng, Y., John, S., Pesavento, J.J., Schultz-Norton, J.R., Schiltz, R.L., Baek, S., Nardulli, A.M., Hager,
G.L., Kelleher, N.L., Mizzen, C.A., 2010. Histone H1 phosphorylation is associated with transcription
by RNA polymerases I and II. J. Cell Biol. 189, 407–415. doi:10.1083/jcb.201001148

87
Zimmer, C., Luck, G., Venner, H., Fric, J., 1968. Studies on the conformation of protonated DNA.
Biopolymers 6, 563–574. doi:10.1002/bip.1968.360060410
Żurek-Biesiada, D., Kędracka-Krok, S., Dobrucki, J.W., 2013. UV-activated conversion of Hoechst 33258,
DAPI, and Vybrant DyeCycle fluorescent dyes into blue-excited, green-emitting protonated forms.
Cytometry. A 83, 441–51. doi:10.1002/cyto.a.22260
Żurek-Biesiada, D., Waligórski, P., Dobrucki, J.W., 2014. UV-induced Spectral Shift and Protonation of
DNA Fluorescent Dye Hoechst 33258. J. Fluoresc. doi:10.1007/s10895-014-1468-y

88

89
10. Associated publications
In the following, the publications related to this work released between September 2013 and
December 2016 (P1 – P6), accepted articles (P7),and submitted manuscripts (P8) are listed:
[P-8] [submitted] MM. Kordon, AT Szczurek, K Berniak, O Szelest, K Solarczyk, M Tworzydło,
S Wachsmann-Hogiu, A Vaahtokari, C Cremer, JW Dobrucki: A distinct PML-like nuclear
body juxtapositions the DNA repair protein XRCC1 to sites of single-strand breaks in
replication foci.
[P-7] [Accepted manuscript] AT Szczurek, L Klewes, J Xing, A. Gourrame, J Dobrucki, S Mai, C
Cremer: Imaging chromatin with binding activated localisation microscopy using DNA
structure fluctuations. Nucleic Acids Research, December 2016
[P-6] AT Szczurek, J Xing, U Birk, C Cremer: Single Molecule Localization Microscopy of
Mammalian Cell Nuclei, Frontiers in Genetics, vol. 7/114, June 2016, doi:
10.3389/fgene.2016.00114
[P-5] A Pierzyńska-Mach, AT Szczurek, F Cella Zanacchi, F Pennacchietti, J Drukała, A Diaspro,
C Cremer, Z Darzynkiewicz, JW Dobrucki: Subnuclear localization, rates and effectiveness
of UVC-induced unscheduled DNA synthesis visualized by fluorescence widefield, confocal
and super-resolution microscopy. Cell cycle, 04/2016; 15(8):1156-1167.
DOI:10.1080/15384101.2016.1158377
[P-4] D Żurek-Biesiada, AT Szczurek, K Prakash, G Best, GK Mohana, H-K Lee, J-Y Roignant,
JW Dobrucki, Christoph Cremer, Udo Birk: Quantitative Super-Resolution Localization
microscopy of DNA in situ using Vybrant® DyeCycle™ Violet Fluorescent Probe. Data in
Brief 01/2016; 7. DOI:10.1016/j.dib.2016.01.041
[P-3] I Kirmes+, AT Szczurek
+, K Prakash, I Charapitsa, C Heiser, M Musheev, F Schock, K
Fornalczyk, D Ma, U Birk, C Cremer, G Reid: A transient ischemic environment induces
reversible compaction of chromatin. Genome Biology 11/2015;DOI:10.1186/s13059-015-
0802-2 (+equal contribution)
[P-2] D Żurek-Biesiada, AT Szczurek, K Prakash, GK Mohana, H-K Lee, J-Y Roignant, U Birk,
JW Dobrucki, C Cremer: Localization microscopy of DNA in situ using Vybrant(®)
DyeCycle™ Violet fluorescent probe: A new approach to study nuclear nanostructure at
single molecule resolution. Experimental Cell Research
09/2015;DOI:10.1016/j.yexcr.2015.08.020
[P-1] AT Szczurek+, K Prakash
+, H-K Lee
+, D Zurek-Biesiada, G Best, M Hagmann, JW
Dobrucki, C Cremer, U Birk: Single molecule localization microscopy of the distribution of
chromatin using Hoechst and DAPI fluorescent probes. Nucleus, 06/2014; 5(4).
DOI:10.4161/nucl.29564 (+equal contribution)

90
11. Appendix I: abbreviations
2D – two dimensional
3D – three dimensional
A – adenine
AA – ascorbic acid
Alexa – commercial fluorescent probe
ANC – active nuclear compartment
ATP – adenosine triphosphate
a.u. – arbitrary units
BALM – binding activated localisation microsocpy
BME – β-mercapthoethanol
BrU – bromouridine
bp – basepair
BSA – bovine serum albumin
C – cytosine
CAT – catalase
CCD – charge coupled device
CDC – chromatin dense cluster
CHD – coronary heart disease
ChIA-PET – chromatin interaction analysis by pair-tag sequencing
ChIP-seq – chromatin immunoprecipitation DNA sequencing
CTCF – CCCTC-binding factor
Da – dalton
DAPI - 4',6-diamidyno-2-fenyloindol
DFMO – difluoromethylornithine
DMEM – Dulbecco‟s Modified Eagle‟s Medium
DNA – deoxyribonucleic acid
dSTORM – direct stochastic optical reconstruction microscopy
EDTA – ethylendiaminetetraacetic
EdU – 5-ethynyl-2‟-deoxyuridine
FACS – fluorescence activated cell sorting
fBALM – DNA structure fluctuation assisted binding activated localisation microscopy
FBS – fetal bovine serum
FISH – fluorescence in situ hybridisation
FLIM – fluorescence lifetime imaging
FP – fluorescent protein
FRAP – fluorescence recovery after photobleaching
FRET – Foerster resonance energy transfer
g – gravitational acceleration
G – guanine
GFP – green fluorescent protein
GOX – glucose oxidase
GP – glucose pyranose
GSDIM – ground state depletion microscopy followed by individual molecule return
H1 – histone H1
H2A – histone H2A

91
H3 – histone H3
H4 – histone H4
HAT – histone acetyltransferase
HCl – hydrochloric acid
HEPES – 4-(2-hydroxyethyl)-1-piperazineethanesulfonic acid
HDAC – histone deacetylase
Hoechst – 4-[5-(4-methyl-1-piperazinyl)[2,5'-bi-1H-benzimidazol]-2'-yl]-, trihydrochloride
HOMO – highest occupied molecular orbital
INC – inactive nuclear compartment
IR – ischemia-reperfusion
LDL – low density lipoprotein
LUMO – lowest unoccupied molecular orbital
MEA – β-mercapthoethylamine, cysteamine
mCherry – monomeric Cherry, fluorescent protein
MLE – maximum likelihood estimation
MV – methyl viologen
NA – numerical aperture
nm – nanometre
NMR – nuclear magnetic resonance
ODC – ornithine decarboxylase
PA-FP – photoactivatable fluorescent protein
PAINT – point accumulation for imaging in nanoscale topography
PALM – photoactivated localisation microscopy
PBS – phosphate buffered saline
PicoGreen – commercial name for monomeric DNA dye
Pol II – RNA polymerase II
PSF – point spread function
ROI – region of interest
SIM – structured illumination microscopy
SMLM – single molecule localisation microscopy
SPDM – spectral precision distance microscopy
SPT – single particle tracking
STED – stimulated emission depletion microscopy
STORM – stochastic optical reconstruction microscopy
Redox – reduction-oxidation
RNA – ribonucleic acid
RT – room temperature
T – thymidine
TAD – topologically associated domain
TCEP – tris(2-carboxyethyl)phosphine
TOTO-1 – thiazole orange dimer
TSA – trichostatin A
TX – trolox
UT – untreated
YO-PRO-1 – oxazole yellow
YOYO-1 – {1,1'-(4,4,8,8-tetramethyl-4,8-diazaundecamethylene)bis[4-[(3-methylbenzo-1,3-
oxazol-2-yl)methylidene]-l,4-dihydroquinolinium] tetraiodide}

92
12. Eidesstattliche Erklärung
Hiermit versichere ich, Aleksander Szczurek, geboren am 31.10.1989 in Krakau, die vorliegende
Dissertation „Single molecule localisation microscopy by photoconversion and dynamic labelling
using DNA-binding dyes resolves chromatin compaction in model ischemia“ selbstständig und
ausschließlich unter Verwendung der angegebenen Quellen und Hilfsmittel verfasst zu haben.
Mainz, den 20. Dezember 2016
Aleksander Szczurek