singtel investor day: mobile business overview · pdf fileforward looking statements -...
TRANSCRIPT
SingTel Investor Day:Mobile Business Overview
Michael Smith
Managing Director, Consumer
11 July 2011
2Forward looking statements - important note
The following presentation may contain forward looking statements by the management of SingTel Group relating
to financial trends for future periods, compared to the results for previous periods.
Some of the statements contained in this presentation that are not historical facts are statements of future expectations
with respect to the financial conditions, results of operations and businesses, and related plans and objectives. Forward
looking information is based on management's current views and assumptions including, but not limited to, prevailing
economic and market conditions. These statements involve known and unknown risks and uncertainties that could cause
actual results, performance or events to differ materially from those in the statements as originally made. Such
statements are not, and should not be construed as a representation as to future performance of SingTel Group.
In particular, such targets should not be regarded as a forecast or projection of future performance of SingTel Group.
It should be noted that the actual performance of SingTel Group may vary significantly from such targets.

3
1 Market overview
3 Future opportunities & strategy
2 FY11 performance
Today

4
1 Market overview
3 Future opportunities & strategy
2 FY11 performance
Today
5
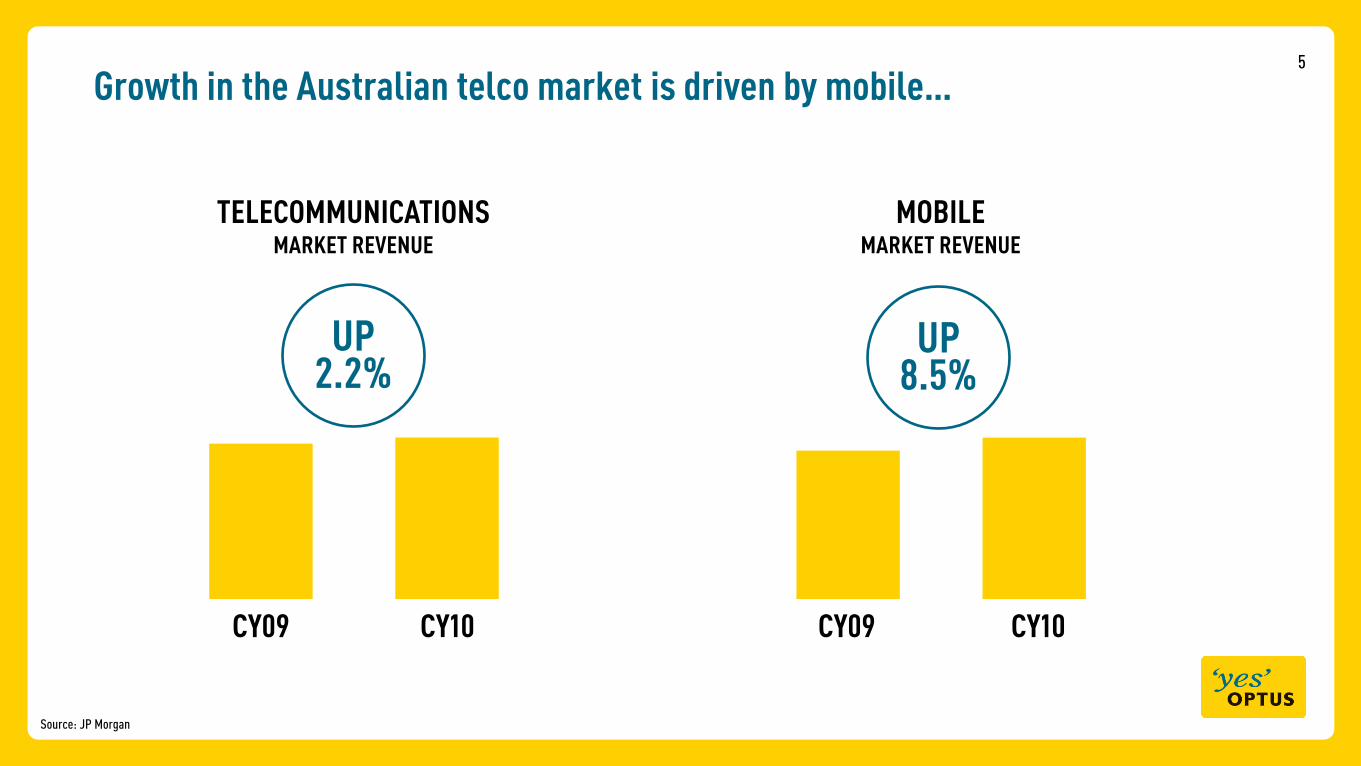
Source: JP Morgan
Growth in the Australian telco market is driven by mobile…
TELECOMMUNICATIONSMARKET REVENUE
MOBILEMARKET REVENUE
CY10CY09CY10CY09
UP2.2%
UP8.5%

6
Source: Merrill Lynch
YOY Mobile Subscriber Growth - CY10
2.7%
5.2%
9.8%
15.0% 15.0%
21.3%23.4%
27.9%
USAAustraliaGermanySpain Italy UK France Singapore
YOY Data Revenue Growth - CY10
-4.8%
0.5%
2.6%
4.4% 4.4%
6.0% 6.2%
9.8%
UK
USAFranceSpainItalyGermany AustraliaSingapore
…underpinned by leading subscriber and strong data revenue growth amongst world’s developed economies
7
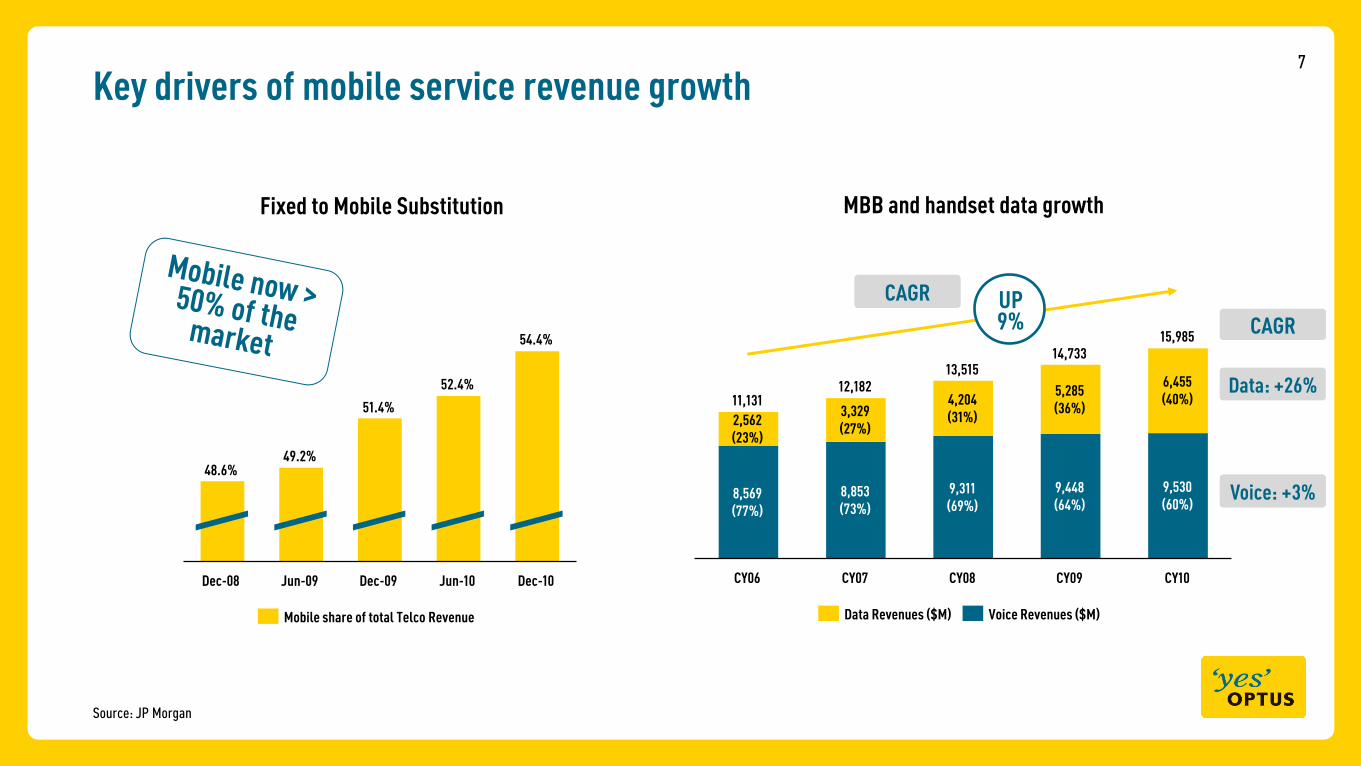
Key drivers of mobile service revenue growth
Source: JP Morgan
52.4%
Dec-10Dec-08
48.6%
Jun-09 Dec-09 Jun-10
54.4%
49.2%
51.4%
Mobile share of total Telco Revenue
Fixed to Mobile Substitution
CY10
15,985
9,530(60%)
6,455(40%)
CY09
14,733
9,448(64%)
5,285(36%)
CY08
13,515
9,311(69%)
4,204(31%)
CY07
12,182
8,853(73%)
3,329(27%)
CY06
11,131
8,569(77%)
2,562(23%)
Voice Revenues ($M)Data Revenues ($M)
Data: +26%
Voice: +3%
MBB and handset data growth
UP9% CAGR
CAGR
8
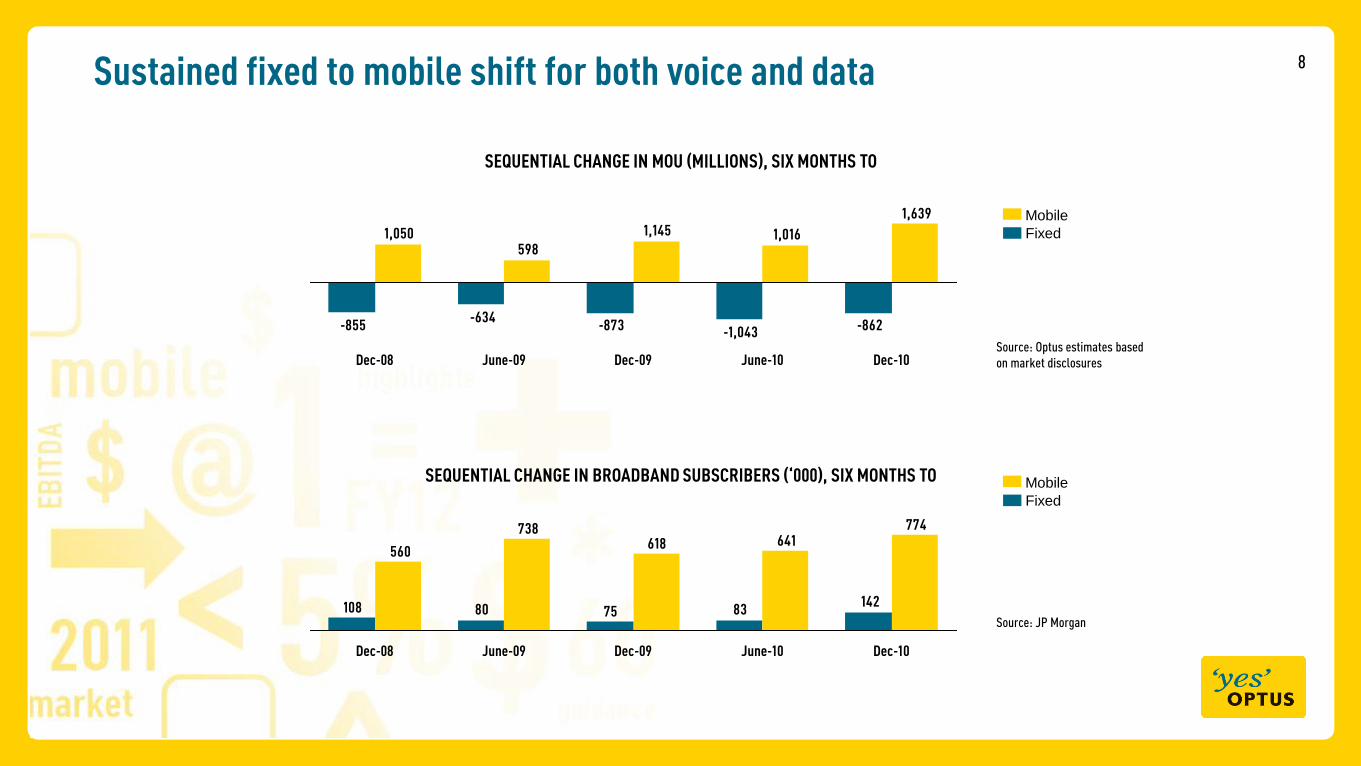
Source: Optus estimates based
on market disclosures
142837580108
774641618
738
560
Dec-10June-10Dec-09June-09Dec-08
SEQUENTIAL CHANGE IN MOU (MILLIONS), SIX MONTHS TO
SEQUENTIAL CHANGE IN BROADBAND SUBSCRIBERS (‘000), SIX MONTHS TO
Fixed
Mobile
Sustained fixed to mobile shift for both voice and data
Source: JP Morgan
-862-1,043-873-634
-855
1,639
1,0161,145
5981,050
Dec-10June-10Dec-09June-09Dec-08
Fixed
Mobile
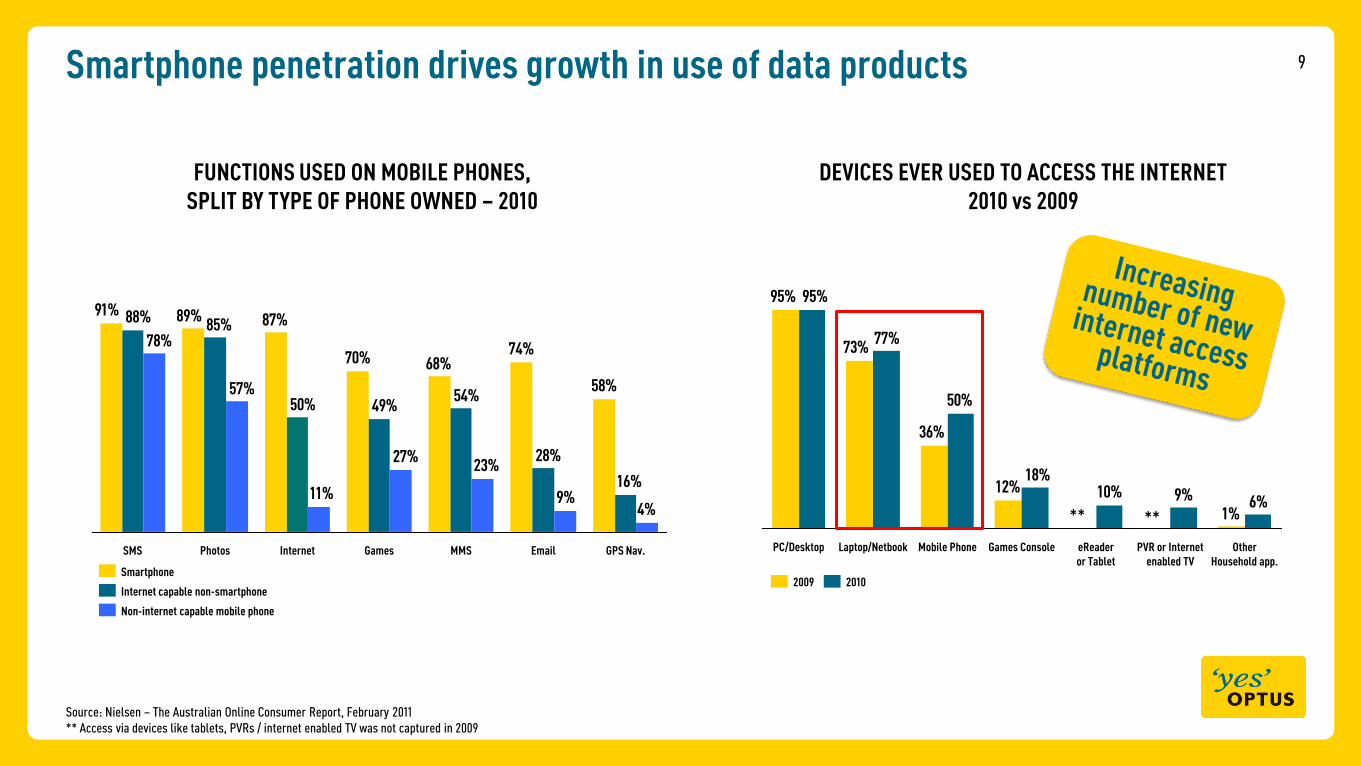
9Smartphone penetration drives growth in use of data products
58%
74%68%70%
87%89%91%
16%
28%
54%49%50%
85%88%
4%9%
23%27%
11%
57%
78%
InternetPhotosSMS GPS Nav.EmailMMSGames
Non-internet capable mobile phone
Internet capable non-smartphone
Smartphone
1%
12%
36%
73%
95%
6%9%10%18%
50%
77%
95%
Mobile Phone Games ConsoleLaptop/NetbookPC/Desktop Other Household app.
PVR or Internet enabled TV
eReader or Tablet
20102009
DEVICES EVER USED TO ACCESS THE INTERNET 2010 vs 2009
FUNCTIONS USED ON MOBILE PHONES, SPLIT BY TYPE OF PHONE OWNED – 2010
Source: Nielsen – The Australian Online Consumer Report, February 2011
** Access via devices like tablets, PVRs / internet enabled TV was not captured in 2009
****

10
Consumer Confidence
However various headwinds are emerging
CAGR: -3%
Dec-10Jun-10Dec-09Jun-09Dec-08
A$/Minute (Mob industry minutes / Pre+Post revenue, ex WBB)
* A$350, + unlimited on-net calls
Westpac Consumer Confidence Index - June 2011
364
555
10388
-18
74
Mar-11Dec-10
VHA
Optus
Telstra
Source: Company disclosures, Optus analysis
** VHA branded net adds
Mobile net adds for the quarter („000)
“Investment in the resources sector is picking up strongly… and the outlook remains very positive... In other areas, cautious behaviour by households … are having a noticeable dampening effect.”
Statement by Glenn Stevens, Governor RBA: Monetary Policy Decision (5 July 2011)
Pricing PressureCompetitive Aggression
**
**
Increase in plan inclusions
$25
0
$35
0 $45
0
Included value (A$)
Consumer
7.81
7.44
7.678.12
OCTOBER 2009
A$49
Mar-10
A$49
Mar-10A$49
Mar-11
A$45
Mar-11
Unl
imit
ed c
alls
, tex
ts &
soci
al n
etw
ork
*

11
1 Market overview
3 Future opportunities & strategy
2 FY11 performance
Today
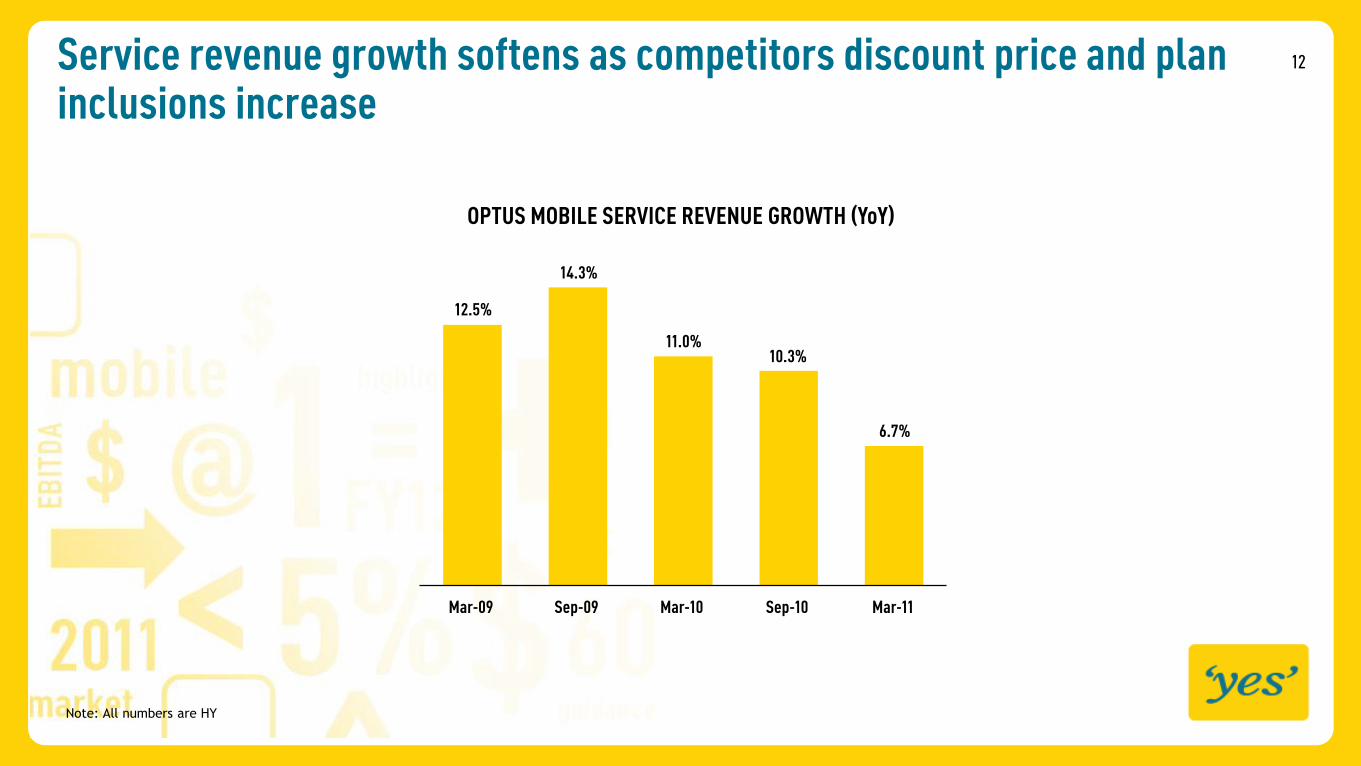
12
12.5%
14.3%
11.0%10.3%
6.7%
Mar-11Sep-10Mar-10Sep-09Mar-09
OPTUS MOBILE SERVICE REVENUE GROWTH (YoY)
Service revenue growth softens as competitors discount price and plan inclusions increase
Note: All numbers are HY
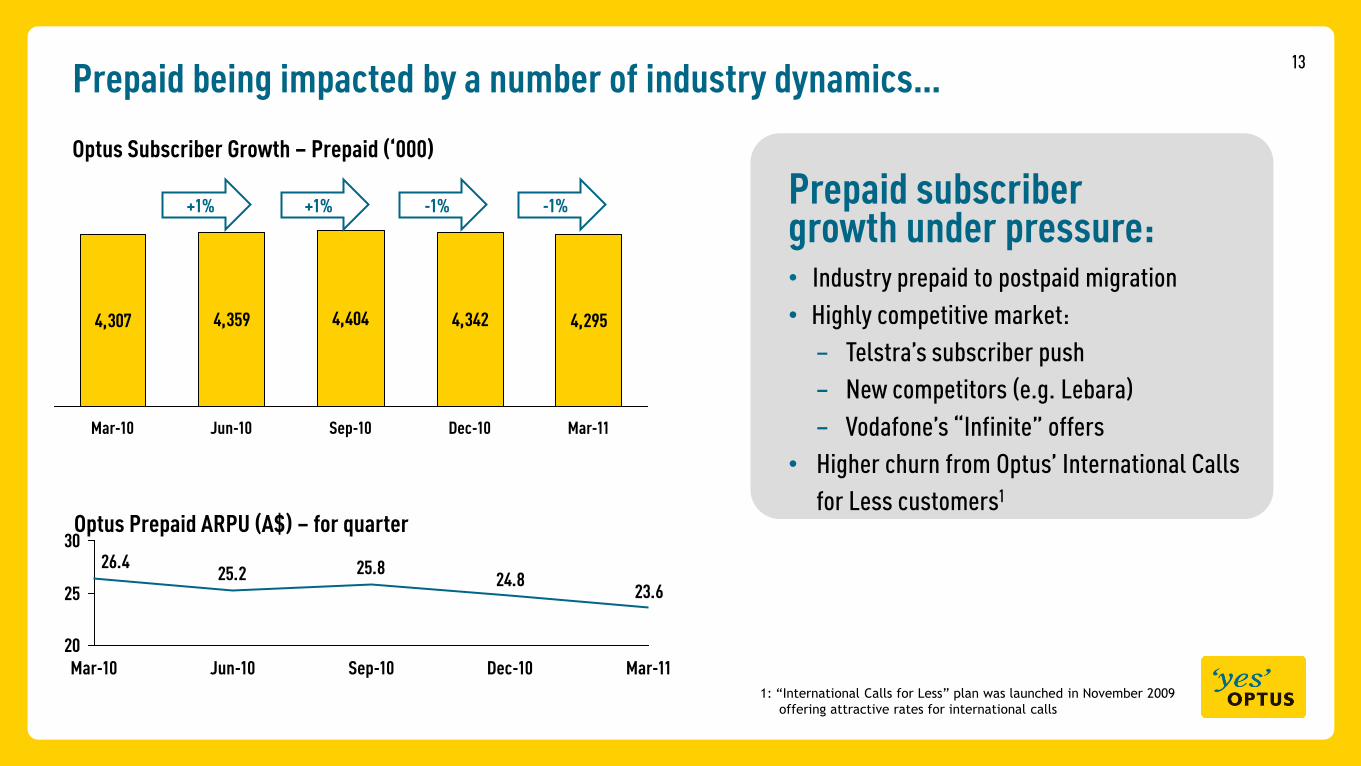
13
Prepaid being impacted by a number of industry dynamics…
4,307 4,359 4,404 4,342 4,295
Mar-10 Sep-10Jun-10 Mar-11Dec-10
Optus Subscriber Growth – Prepaid (‘000)
Prepaid subscriber growth under pressure:• Industry prepaid to postpaid migration
• Highly competitive market:
– Telstra‟s subscriber push
– New competitors (e.g. Lebara)
– Vodafone‟s “Infinite” offers
• Higher churn from Optus‟ International Calls
for Less customers1
+1% +1% -1% -1%
24.825.825.2
26.4
23.6
20
25
30
Dec-10 Mar-11Sep-10Jun-10Mar-10
Optus Prepaid ARPU (A$) – for quarter
1: “International Calls for Less” plan was launched in November 2009
offering attractive rates for international calls
14
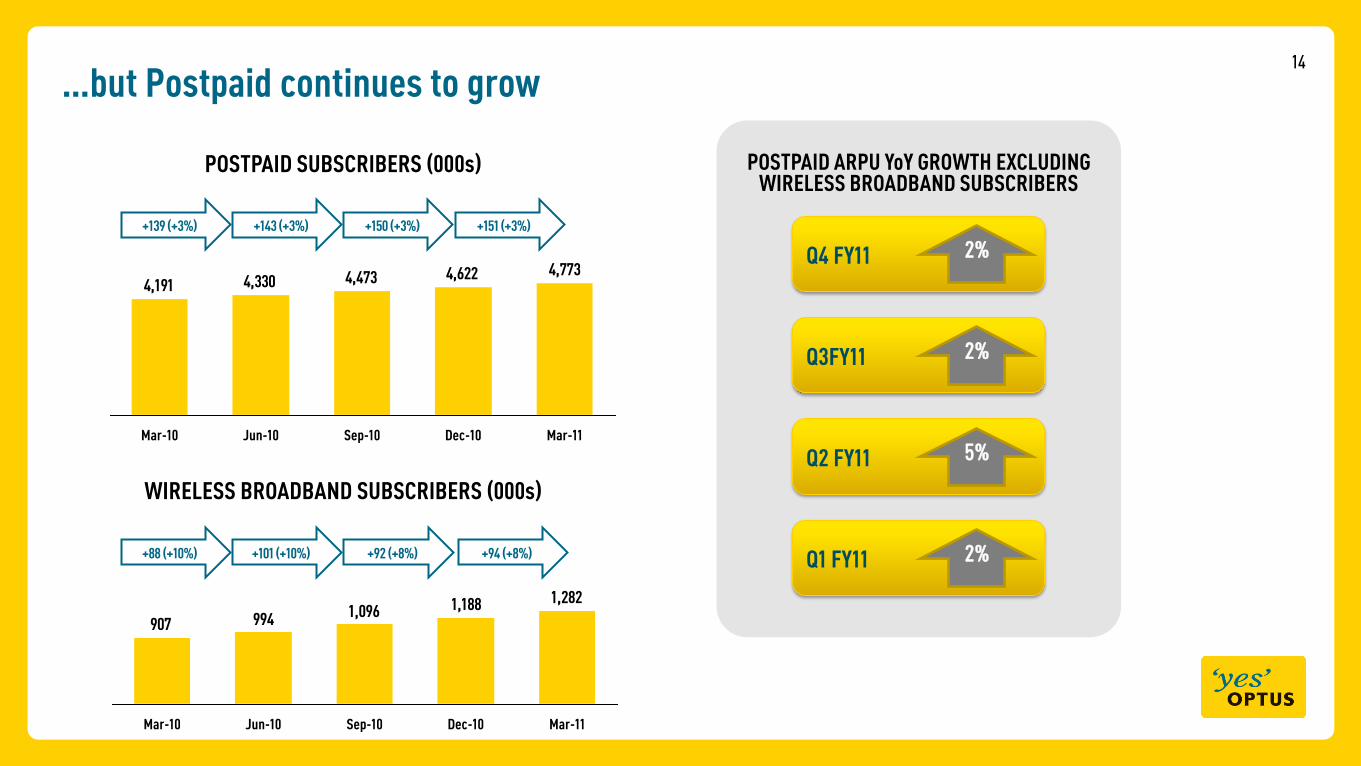
…but Postpaid continues to grow
POSTPAID SUBSCRIBERS (000s)
+139 (+3%) +143 (+3%) +150 (+3%) +151 (+3%)
WIRELESS BROADBAND SUBSCRIBERS (000s)
4,7734,6224,4734,3304,191
Mar-11Dec-10Sep-10Jun-10Mar-10
+88 (+10%) +101 (+10%) +92 (+8%) +94 (+8%)
POSTPAID ARPU YoY GROWTH EXCLUDING WIRELESS BROADBAND SUBSCRIBERS
Q1 FY11 2%
Q2 FY11 5%
Q3FY11 2%
Q4 FY11 2%
1,2821,1881,096994907
Mar-11Dec-10Sep-10Jun-10Mar-10

15Smartphone penetration and innovative data services driving data growth
OPTUS DATA SHARE OF SERVICE REVENUE
3%
5%
9% 13%18%
2011
40%
23%
2010
36%
23%
2009
33%
24%
2008
28%
23%
2007
24%
20%
SMS % of Service Rev
Non SMS Data % of Service Rev
Note: All numbers are FY end
389,000 live streams of the 2010 FIFA World Cup matches
79% increase in Australian Open Tennis live streaming
Google Apps Partnership
Helping SMBs manage
their communications
Unlimited mobile access, within Australia, to these sites
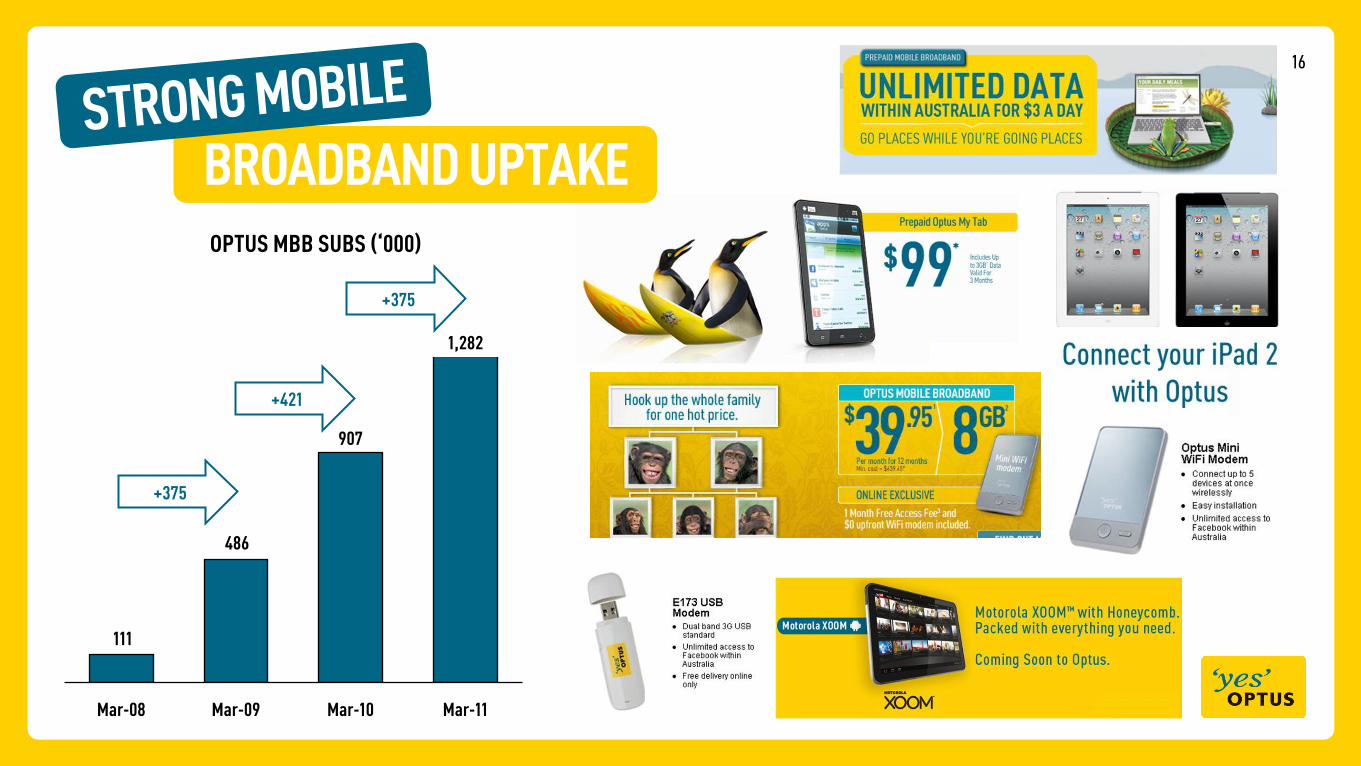
16
OPTUS MBB SUBS (‘000)
111
486
907
1,282
Mar-11Mar-10Mar-09Mar-08
+375
+421
+375
BROADBAND UPTAKE
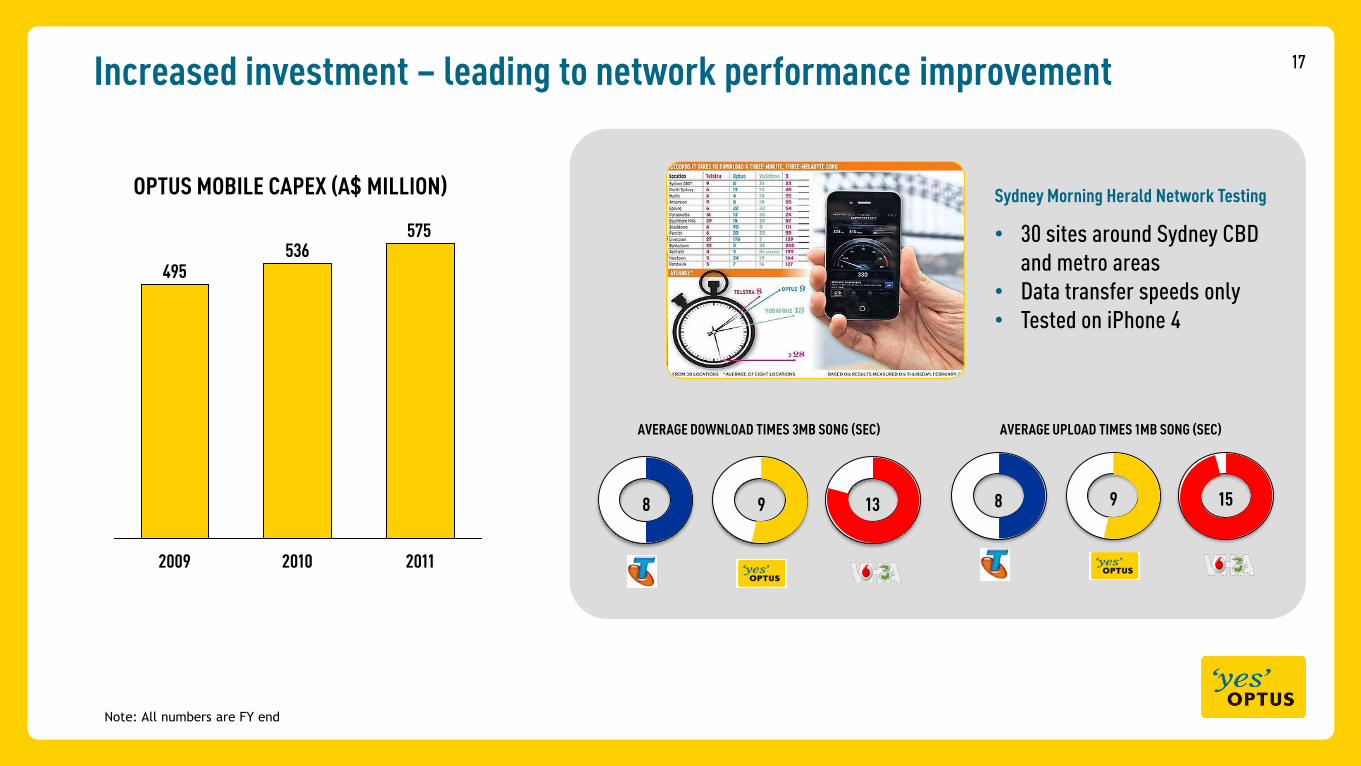
17
8 9 13
AVERAGE DOWNLOAD TIMES 3MB SONG (SEC)
OPTUS MOBILE CAPEX (A$ MILLION)
575536
495
201120102009
Note: All numbers are FY end
8 9 15
AVERAGE UPLOAD TIMES 1MB SONG (SEC)
Sydney Morning Herald Network Testing
• 30 sites around Sydney CBD
and metro areas
• Data transfer speeds only
• Tested on iPhone 4
Increased investment – leading to network performance improvement
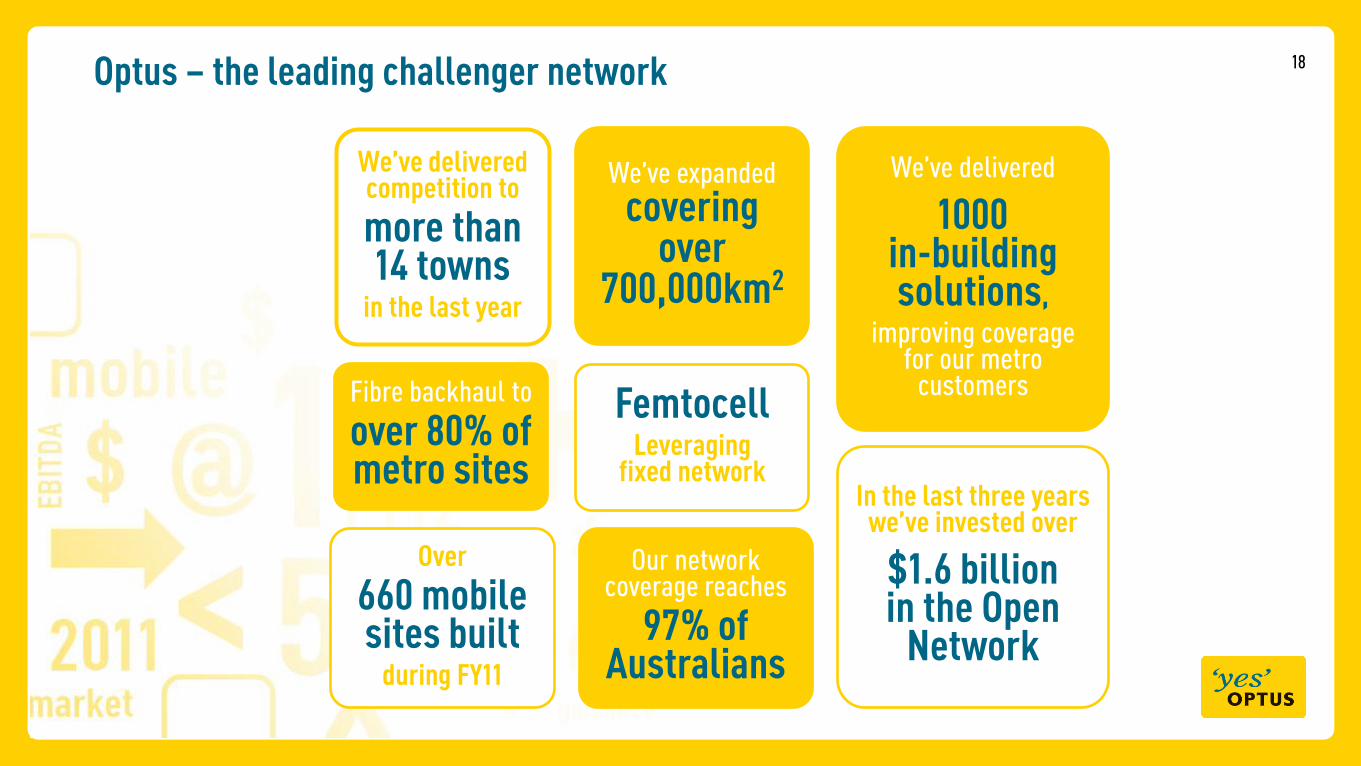
18
We’ve delivered competition to
more than 14 towns
in the last year
Our network coverage reaches
97% of Australians
We‟ve expanded
covering over
700,000km2
Fibre backhaul to
over 80% of metro sites
We‟ve delivered
1000 in-building solutions,
improving coverage for our metro
customers
Over
660 mobile sites built
during FY11
In the last three years we’ve invested over
$1.6 billion in the Open
Network
FemtocellLeveraging
fixed network
Optus – the leading challenger network

19The Customer Experience program continues to deliver improvements for our Mobile Customers
Reduction in number
of technical enquiries
− through a simplified activation
process in Mobile Billing and
General enquiries
Faster delivery of online
orders for mobile handsets 50%
Reduction in early tenure
churn in Post Paid Mobile
30%
25%
Outperforming our major competitor in key CE metrics
+5%
+4%
+7%
Activation
Billing
Customer Service

20
1 Market overview
3
2 FY11 performance
Today
Future opportunities & strategy

21
Driving a breakthrough in Customer Experience
Driving a Customer-centric attitude
Fix vital service experience
Design for Lifetime ValueProduct is the Network
Understand the CustomerLink Customer
Experience to ValueClosed Loop Feedback
We are resolving the key
Customer pain points.
We will continue to invest
in systems and our people to
exceed customer expectations.
We will continue to invest in our network
and will work to close our customers‟
perception gap of our performance.
We will empower our people to drive continuous
improvement by ensuring Customer
feedback is achieved on a timely basis.
We will drive loyalty through our
acquisition, retention and
rewarding of our Customers
We will link Customer
Experience to performance.
We will breakout in customer experience
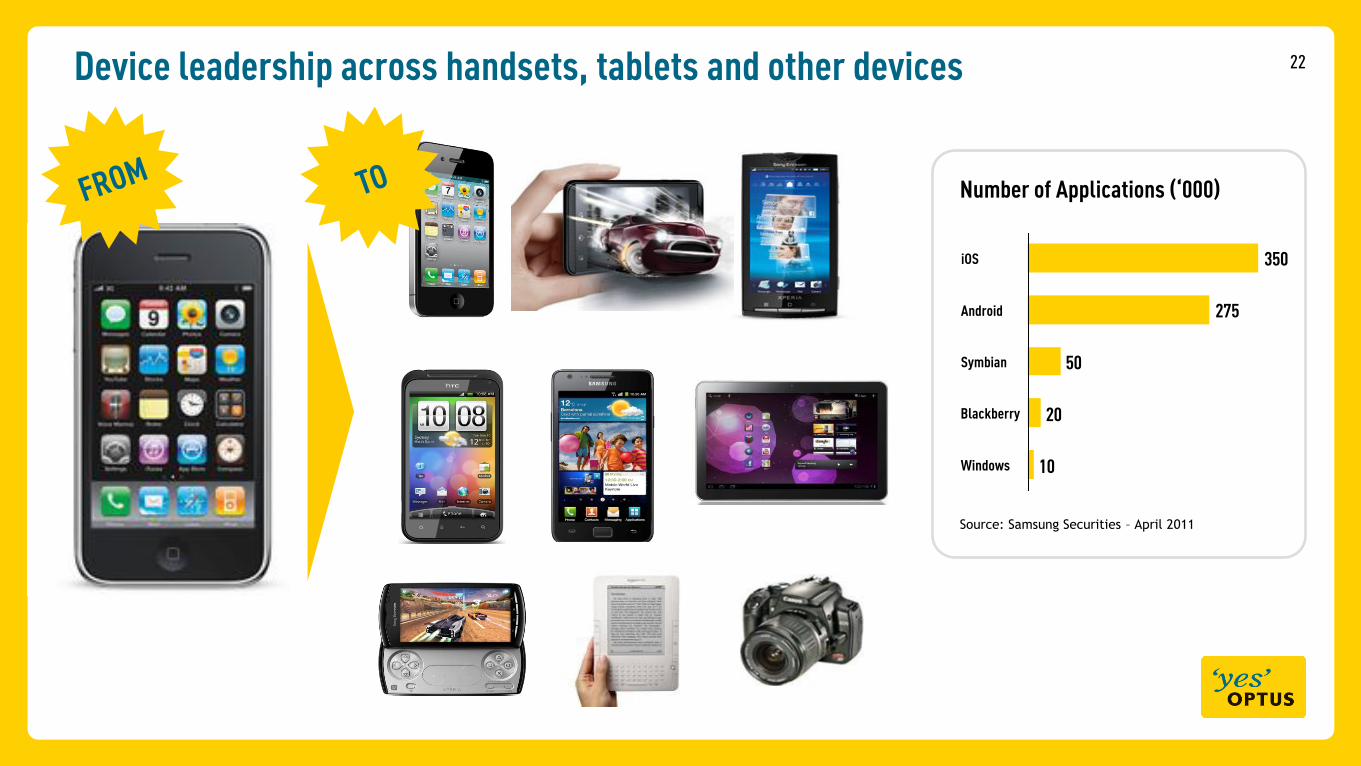
22Device leadership across handsets, tablets and other devices
Number of Applications (‘000)
Source: Samsung Securities – April 2011
10
20
50
275
350iOS
Windows
Blackberry
Android
Symbian

23Deliver relevant and personalised digital services to our customers
Lead in online digital experience with products and VAS of
RELEVANCE
Optus Smart Safe
• secured data
• accessible on any device
• easily shared with friends and family
Google Apps Partnership
• helping small medium businesses manage their communications
• range of integrated business tools
• accessible via a single web portal on a range of devices
• dedicated IT helpdesk offering up to 24/7 support
Optus Smart Safe Optus Call BuddyOptus Now
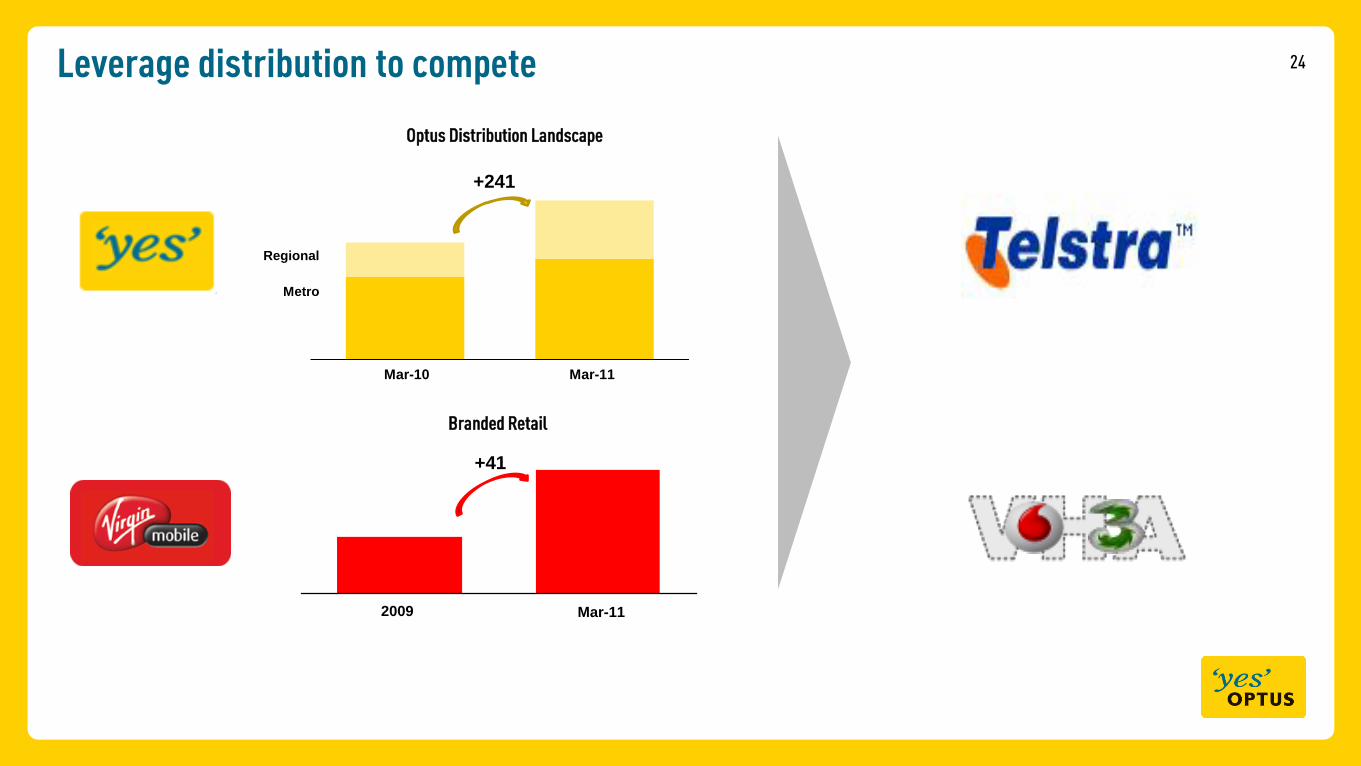
24Leverage distribution to compete
Mar-112009
Branded Retail
Consumer
7.81
7.44
7.678.12
OCTOBER 2009
Metro
Regional
Mar-11Mar-10
+241
Optus Distribution Landscape
+41
25
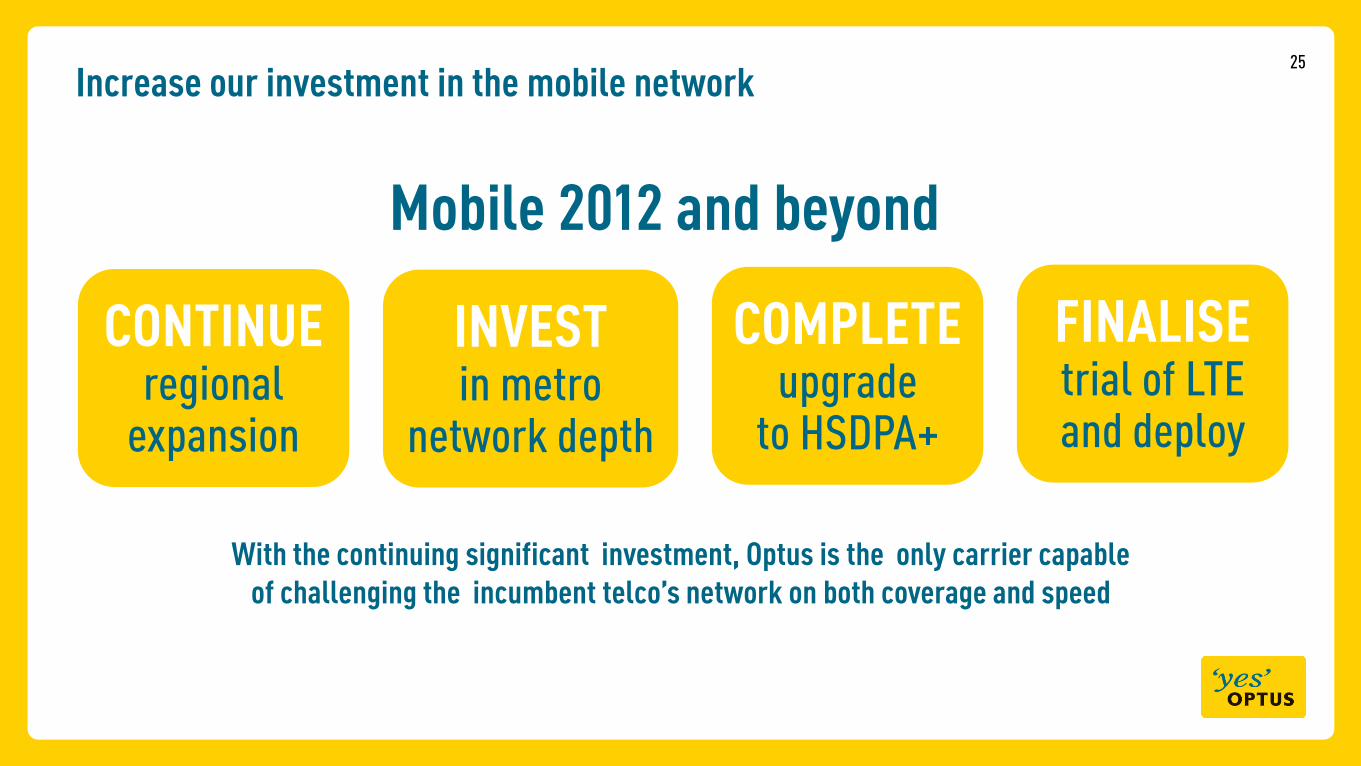
FINALISEtrial of LTE and deploy
COMPLETEupgrade
to HSDPA+
CONTINUEregional
expansion
INVESTin metro
network depth
Mobile 2012 and beyond
Increase our investment in the mobile network
With the continuing significant investment, Optus is the only carrier capable of challenging the incumbent telco’s network on both coverage and speed

26
Video: Network

SingTel Investor Day:Mobile Business Overview
Michael Smith
Managing Director, Consumer
11 July 2011