sir 2021-5048: strandlines from large floods on the
TRANSCRIPT

Strandlines from Large Floods on the Colorado River in Grand Canyon National Park, Arizona
Scientific Investigations Report 2021–5048
U.S. Department of the InteriorU.S. Geological Survey

Cover: U.S. Geological Survey hydrologist surveying a driftwood strandline along the Colorado River in Grand Canyon National Park, Arizona.

Strandlines from Large Floods on the Colorado River in Grand Canyon National Park, Arizona
By Thomas A. Sabol, Ronald E. Griffiths, David J. Topping, Erich R. Mueller, Robert B. Tusso, and Joseph E. Hazel, Jr.
Scientific Investigations Report 2021–5048
U.S. Department of the InteriorU.S. Geological Survey

For more information on the USGS—the Federal source for science about the Earth, its natural and living resources, natural hazards, and the environment—visit https://www.usgs.gov or call 1–888–ASK–USGS.
For an overview of USGS information products, including maps, imagery, and publications, visit https://store.usgs.gov.
Any use of trade, firm, or product names is for descriptive purposes only and does not imply endorsement by the U.S. Government.
Although this information product, for the most part, is in the public domain, it also may contain copyrighted materials as noted in the text. Permission to reproduce copyrighted items must be secured from the copyright owner.
Suggested citation:Sabol, T.A., Griffiths, R.E., Topping, D.J., Mueller, E.R., Tusso, R.B., and Hazel, J.E., Jr., 2021, Strandlines from large floods on the Colorado River in Grand Canyon National Park, Arizona: U.S. Geological Survey Scientific Investigations Report 2021-5048, 41 p., https://doi.org/10.3133/sir20215048.
Associated data for this publication:Sabol, T.A., Griffiths, R.E., Topping, D.J., Mueller, E.R., Tusso, R.B., and Hazel, J.E., Jr., 2021, Surveyed peak-stage elevations, coordinates, and indicator data of strandlines from large floods on the Colorado River in Grand Canyon National Park, Arizona: U.S. Geological Survey Data Release, https://doi.org/10.5066/P9GIQ9ZN.
ISSN 2328-0328 (online)
U.S. Geological Survey, Reston, Virginia: 2021First release: August 2021Revised: September 2021

iii
ContentsAbstract ...........................................................................................................................................................1Introduction.....................................................................................................................................................1Purpose and Scope .......................................................................................................................................1Peak-Stage Indicators: Types and Preservation ......................................................................................2Study Area.......................................................................................................................................................2Expected Strandline Occurrence Based on Gaging Record ..................................................................3Methods...........................................................................................................................................................4
Field Survey............................................................................................................................................4Historical Photography ........................................................................................................................4Strandline Classification ......................................................................................................................5Longitudinal Profiles and Slopes of Strandlines .............................................................................6Stage-Discharge Relations .................................................................................................................6Comparison of Stage-Discharge Relations with a Predictive Numerical Model .......................6
Results .............................................................................................................................................................6Peak-stage Indicator Strandline Classification ...............................................................................6
The Flood of 1884 (210,000 ft3/s) .................................................................................................8The Flood of 1921 (170,000 ft3/s) ...............................................................................................10The Floods of 1957 (125,000 ft3/s) and 1958 (108,000 ft3/s) ....................................................10The Flood of 1983 (97,000 ft3/s) .................................................................................................10
Longitudinal Profiles and Slopes of Strandlines ............................................................................11Stage-Discharge Relations ........................................................................................................................14
Strandline Elevations Relative to a Local Datum ...........................................................................14Comparison of Stage-Discharge Relations with a Predictive Numerical Model .....................16
Discussion .....................................................................................................................................................17Strandline Classification: Multiple Sources of Evidence .............................................................17Stage-Discharge Relations and River Width .................................................................................20Evaluation of Predicted Flood Stages from a Numerical Model .................................................21
Conclusions...................................................................................................................................................21References Cited..........................................................................................................................................22Appendix 1. Peak-Stage Indicator Data Collected Downstream from the Colorado River
Near Grand Canyon, Arizona, Gaging Station ...........................................................................25Appendix 2. Comparison of Stage-Discharge Relations Generated from the Strandlines
with Those Generated by the Model of Magirl and Others (2008) .........................................39

iv
Figures 1. Map of the Colorado River study area ......................................................................................2 2. Graph showing the instantaneous discharge record of the Colorado River at the
Lees Ferry, Arizona, gaging station at river mile 0 ..................................................................3 3. Photographs showing type examples of peak-stage indicators found along the
Colorado River in Grand Canyon National Park, Arizona .......................................................5 4. Photograph and cross section showing strandlines at river mile 74.0 in Grand
Canyon National Park, Arizona ...................................................................................................7 5. Cropped version of photograph taken by Robert Brewster Stanton in 1890 looking
downstream at the Palisades Creek area at river mile 66.0–66.4 .........................................8 6. Photographs showing weathering of driftwood that was likely emplaced by flood of
1884 and flood of 1921 ..................................................................................................................9 7. Photograph showing the likely strandlines from 1958, 1957, and 1921 ..............................10 8. Longitudinal profiles of the 8,000 cubic feet per second reference stage and
surveyed peak-stage indicators segregated into the five primary strandlines from the 1884, 1921, 1957, 1958, and 1983 floods ....................................................................11
9. Longitudinal profiles of strandlines in four shorter reaches showing linear regressions ..................................................................................................................................12
10. Plots showing example comparisons between stage-discharge relations based on surveyed peak-stage indicators and stage-discharge relations predicted by the numerical model of Magirl and others ....................................................................................17
11. Photographs showing driftwood near river mile 83.4 on the Colorado River ...................18 12. Photographs looking downstream at the cobble bar below Tanner Rapid .......................18 13. Photographs showing driftwood at the base of the dune circled in figure 12 .................19 14. Plan view photographs of select reaches of the Colorado River where the number
of classified peak-stage indicators allows estimates of the lateral extent of flood inundation ..........................................................................................................................20
15. Graph showing examples of stage-discharge relations that illustrate the range of calculated discharges for a given stage ................................................................................21
Tables 1. Percentage of peak-stage indicators comprising each of the five primary strandlines ..9 2. Calculated strandline slopes for selected reaches of the Colorado River in
Grand Canyon National Park, Arizona .....................................................................................13 3. Stage-discharge relations developed for short reaches from surveyed peak-stage
indicators and the orthometric elevation of the 8,000 cubic feet per second reference stage ...........................................................................................................................14
4. Strandline elevations relative to the 8,000 cubic feet per second reference stage for ten reaches of the Colorado River in Grand Canyon National Park, Arizona ............16

v
Conversion Factors
U.S. customary units to International System of Units
Multiply By To obtain
Length
inch (in.) 2.54 centimeter (cm)inch (in.) 25.4 millimeter (mm)foot (ft) 0.3048 meter (m)mile (mi) 1.609 kilometer (km)
Flow rate
cubic foot per second (ft3/s) 0.02832 cubic meter per second (m3/s)
DatumVertical coordinate information is referenced to the North American Vertical Datum of 1988 (NAVD 88).
Horizontal coordinate information is referenced to the North American Datum of 1983 (NAD 83).
Abbreviations
ESRI Environmental Systems Research InstituteGCMRC Grand Canyon Monitoring and Research Center GCNP Grand Canyon National Park GPS global positioning systemHFEs high-flow experimentsNAD83 North American Datum of 1983NAVD88 North American Vertical Datum of 1988RM river mileUSGS U.S. Geological Survey

vi

Strandlines from Large Floods on the Colorado River in Grand Canyon National Park, Arizona
By Thomas A. Sabol,1 Ronald E. Griffiths,1 David J. Topping,1 Erich R. Mueller,1 Robert B. Tusso,1 and Joseph E. Hazel, Jr.2
AbstractStrandlines of peak-stage indicators (such as driftwood
logs, woody debris, and trash) provide valuable data for understanding the maximum stage and extent of inundation during floods. A series of seven strandlines have been preserved along the Colorado River in Grand Canyon National Park, Arizona, USA. A survey and analysis of these strandlines was completed from the Colorado River at Lees Ferry, Ariz., gaging station to the Colorado River near Grand Canyon, Ariz., gaging station. Owing to the longitudinally discontinuous nature of the strandlines, several lines of evidence were used to determine the year of the flood associated with each strandline segment. This evidence included strandline relative vertical position, degree of peak-stage indicator weathering, datable trash drift, and map-view location. The seven distinct strandlines identified were deposited during floods with the following peak discharges (in cubic feet per second [ft3/s]) at the Colorado River at Lees Ferry, Ariz., gaging station (year of flood in parentheses): 210,000 ft3/s (1884), 170,000 ft3/s (1921), 125,000 ft3/s (1957), 108,000 ft3/s (1958), 97,000 ft3/s (1983), 52,500 ft3/s (1986), and 45,000 ft3/s (multiple events between 1996 and 2012). Stage-discharge relations were developed in areas where all, or most of the strandlines were present, and were compared to predicted stage-discharge relations from a one-dimensional flow model. River width exerted a strong control on these relations, with much greater stage change occurring for a given discharge change in narrower bedrock-dominated reaches than in wider reaches with more extensive channel-margin alluvium. This comprehensive dataset allows for the verification of model-predicted flood stage along the Colorado River in Grand Canyon National Park.
IntroductionLarge floods play a dominant role in determining river
morphology (Leopold and others, 1964). Documentation of the effects of large floods on river morphology requires knowing the peak stage of these floods over long river reaches. Although it is possible to use standard hydraulic models to calculate peak flood stage over long reaches, large biases and (or) errors are likely in water-surface profiles modeled without sufficient
1U.S. Geological Survey.2Northern Arizona University.
measurements of peak stage to constrain bed roughness (for example, Chow, 1959; Dalrymple and Benson, 1967; O’Connor and Webb, 1988; Baker, 2000; Magirl and others, 2008). The purpose of this report is to document the locations and elevations of strandlines that record the peak stages of large historical floods over long reaches of the Colorado River in Grand Canyon National Park (GCNP), Arizona.
Prior to the construction of Glen Canyon Dam, large floods were relatively common and played a dominant role in the geomorphic evolution of the Colorado River in Grand Canyon (Howard and Dolan, 1981; Carothers and Brown, 1991). Large floods scoured sand from the riverbed and built eddy sandbars and other high-elevation flood deposits (Howard and Dolan, 1981; Schmidt, 1990; Schmidt and Graf, 1990; Topping and others, 2000a, b). In addition, these large floods reduced the severity of rapids at tributary mouths through the downstream transport of large boulders (Howard and Dolan, 1981; Kieffer, 1985; Webb and others, 1989, 1999). Operation of the dam has flattened the annual hydrograph by greatly increasing baseflows and removing large floods (Topping and others, 2003). After the closure of the dam in March 1963, the only flood with a peak discharge similar to the annual pre-dam flood occurred in 1983 when the dam spillways were used, although smaller dam-released floods have occurred since 1983. After initial tests of the concept in 1996, 2004, and 2008, artificial controlled floods (now known as high-flow experiments [HFEs]) for the purpose of rebuilding eddy sandbars became part of standard dam operations in 2012 (U.S. Department of the Interior, 2011, 2016), and since 2012, HFEs were conducted in 2013, 2014, 2016, and 2018.
Purpose and ScopeUnderstanding the effects of dam operations in the con-
text of pre-dam floods requires knowing the peak-stage inun-dation levels that occur during these smaller post-dam floods, the larger post-dam 1983 flood, and the still larger pre-dam floods. The data and interpretations presented in this report add to the body of literature on the inundation levels of floods on the Colorado River in Grand Canyon. Peak-stage indicators in short reaches of the Colorado River in GCNP have been reported and analyzed by Hereford (1984, 1996), Hereford and others (1993, 1996, 1998, 2000), O’Connor and others (1994), Webb and others (2002), Topping and others (2003), Draut and others (2005), and Magirl and others (2008). This

2 Strandlines from Large Floods on the Colorado River in Grand Canyon National Park, Arizona
current report provides the first comprehensive accounting of strandline-forming peak-stage indicators over a long (that is, 87-mile-long) segment of the Colorado River in GCNP.
Peak-Stage Indicators: Types and Preservation
Several types of strandline-forming peak-stage indicators (Partridge and Baker, 1987; Baker, 1987; Webb and Rathburn, 1988) were identified and surveyed in the field: large drift-wood logs, milled lumber, woody-debris piles, and trash (mainly aluminum cans and glass bottles). Preservation of these peak-stage indicators in multiple distinct strandlines requires two conditions. The first of these conditions is that adequate detritus must be present along the banks or floating on the water surface during the rising limb of a flood. Detritus deposited along the banks during the rising limb is then pushed to higher elevations by the rising flood water so that the detritus collects to ultimately form a strandline at the elevation of peak stage (Koenig and others, 2016). Although
these strandlines are typically distinct, some scatter of material to elevations below these lines occurs. As a flood recedes, some of the floating detritus adjacent to the bank may “sag” to slightly lower elevations such that, after the flood, woody- and trash-debris mats drape the landscape. In this case, the peak flood stage is associated with the highest elevation of these mats. The second condition for preservation of peak-stage indicators in multiple distinct strandlines is that the largest flood is not the most recent, otherwise the strandlines from the previous smaller floods would be erased by this more-recent larger flood. As described in this report, this second condition is satisfied on the Colorado River in GCNP such that seven distinct strandlines are preserved for floods spanning the period from 1884 through 2012.
Study AreaThis investigation was conducted on the Colorado River
in GCNP (fig.1), a bedrock-controlled river with a char-acteristic rapid-pool geomorphology (Howard and Dolan, 1981). Although peak-stage indicators from large floods
men20-3155_fig01
−114° −113° −112° −111°
37°
36°
0 20 40 60 MILES
0 20 40 60 KILOMETERS
EXPLANATION
USGS gaging station
GCMRC river mile
Grand Canyon National Park
Base from 1:100,000 scale U.S. Geological Survey National Hydrography DatasetUniversal Transverse Mercator zone 12 northNorth American Datum of 1983
50
USGS09404200
USGS09404200
USGS09402500
USGS09380000
225
275
175
150
100
75200
25
50125
Lees Ferry
LakeMead
LakePowell
GLEN CANYONDAM
CANYON
MA
RB
LE
CANYON
GRAND
Little Colorado River
Havasu Creek
Colo
rado River
Paria River
Kan
ab C
ree k
250
0
UTAHARIZONA
NE
VAD
A
NEVADAUTAH
ARIZONA
Maparea
Figure 1. Map of the Colorado River study area. The study area encompasses reaches of the Colorado River in Marble and Grand Canyons beginning near river mile 0 at the U.S. Geological Survey (USGS) Colorado River at Lees Ferry, Arizona, gaging station (09380000), and terminating downstream near RM 225, at the USGS Colorado River above Diamond Creek near Peach Springs, Ariz., gaging station (09404200). GCMRC, Grand Canyon Monitoring and Research Center.
Expected Strandline Occurrence Based on Gaging Record 3
may be preserved anywhere on the channel margins, the main environments where peak-stage indicators collect to form distinct strandlines are fan-eddy complexes (Schmidt and Graf, 1990) and large higher-elevation cobble bars. Strandlines in fan-eddy complexes are typically preserved in two areas: the zone of flow constriction on the upstream part of a tributary debris fan, and along the bank in the lateral recirculation eddy downstream of the constriction. Strandlines will slope down toward the downstream (that is, down-canyon) direction in all environments except on the margins of lateral recirculation eddies where, because the water along the bank upstream from the eddy reattachment point is flowing in the up-canyon direction, strandlines will slope toward the upstream (that is, up-canyon) direction.
By the convention established by the 1923 Birdseye expedition (Birdseye, 1924), longitudinal locations along the Colorado River in GCNP are referenced to a river-mile (RM) system beginning with RM 0 at the Colorado River at Lees Ferry, Ariz., 09380000 gaging station (fig. 1). This river-mile system was revised by the U.S. Geological Survey (USGS) Grand Canyon Monitoring and Research Center (GCMRC) in 2006 (U.S. Geological Survey, 2006). This revision, in addition to commonly used place names (Belknap and Evans, 1969; Stevens, 1983), are used for geographic reference herein. Marble Canyon extends from Lees Ferry
(RM 0) downstream to the mouth of the Little Colorado River, located near RM 61.9; Grand Canyon extends from the mouth of the Little Colorado River (RM 61.9) downstream to the Grand Wash Cliffs near RM 277. The terms “left bank” and “right bank” designate direction from the centerline of the Colorado River for an observer facing downstream (Rantz and others, 1982). Strandline data from the 87-mile-long river segment between the Colorado River at Lees Ferry, Ariz., 09380000 (RM 0) and Colorado River near Grand Canyon, Ariz., 09402500 (RM 87) gaging stations are presented in the main part of this report. The locations of strandline-forming peak-stage indicators for three short river reaches between RM 87 and the Colorado River above Diamond Creek near Peach Springs, Ariz., 09404200 (RM 225) gaging stations are presented in appendix 1.
Expected Strandline Occurrence Based on Gaging Record
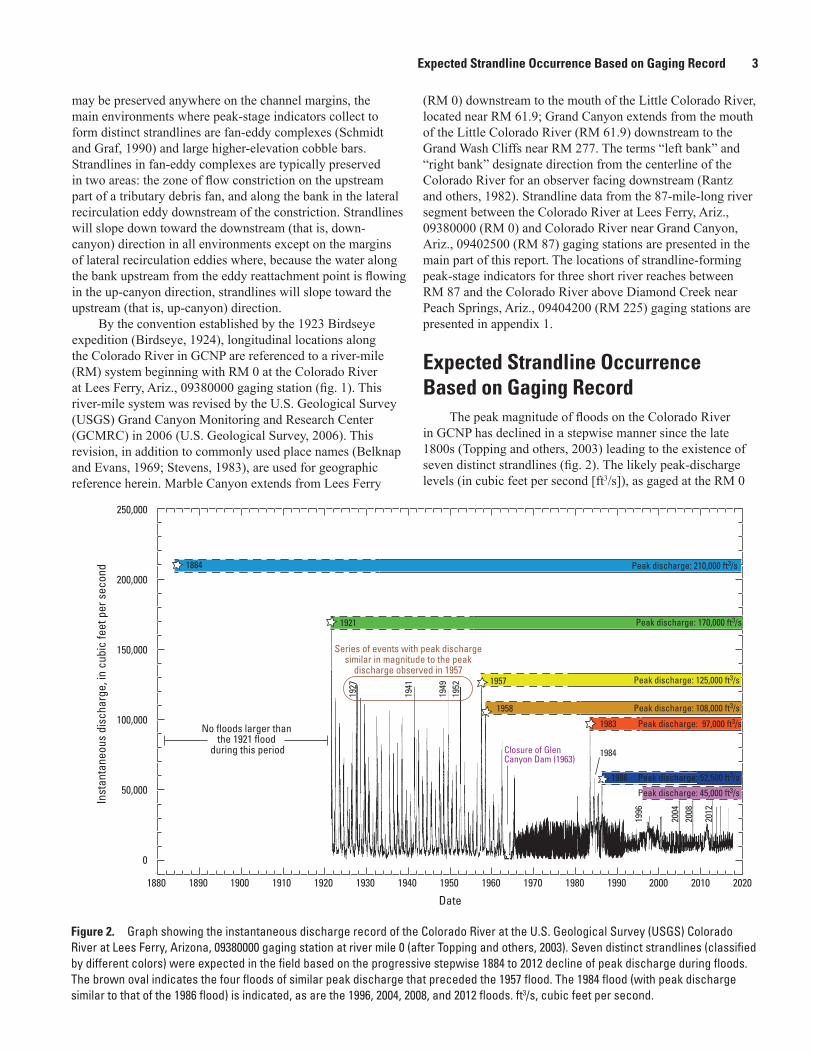
The peak magnitude of floods on the Colorado River in GCNP has declined in a stepwise manner since the late 1800s (Topping and others, 2003) leading to the existence of seven distinct strandlines (fig. 2). The likely peak-discharge levels (in cubic feet per second [ft3/s]), as gaged at the RM 0
men20-3155_fig02
Inst
anta
neou
s di
scha
rge,
in c
ubic
feet
per
sec
ond
Date
0
50,000
100,000
150,000
200,000
250,000
1900 19101880 1890 1920 1930 1940 1950 1960 1970 1980 1990 2000 2010 2020
No floods larger thanthe 1921 flood
during this period Closure of GlenCanyon Dam (1963)
Series of events with peak dischargesimilar in magnitude to the peak
discharge observed in 1957
1984
2004
20
08
2012
1996
Peak discharge: 210,000 ft3/s 1884
Peak discharge: 170,000 ft3/s1921
Peak discharge: 125,000 ft3/s 1957
Peak discharge: 108,000 ft3/s 1958
Peak discharge: 45,000 ft3/s
1986 Peak discharge: 52,500 ft3/s
1983 Peak discharge: 97,000 ft3/s
1927
1941
1952
1949
Figure 2. Graph showing the instantaneous discharge record of the Colorado River at the U.S. Geological Survey (USGS) Colorado River at Lees Ferry, Arizona, 09380000 gaging station at river mile 0 (after Topping and others, 2003). Seven distinct strandlines (classified by different colors) were expected in the field based on the progressive stepwise 1884 to 2012 decline of peak discharge during floods. The brown oval indicates the four floods of similar peak discharge that preceded the 1957 flood. The 1984 flood (with peak discharge similar to that of the 1986 flood) is indicated, as are the 1996, 2004, 2008, and 2012 floods. ft3/s, cubic feet per second.

4 Strandlines from Large Floods on the Colorado River in Grand Canyon National Park, Arizona
gaging station, and the most-recent year of occurrence (in parentheses) of the floods that produced these strandlines are: 210,000 ft3/s (1884), 170,000 ft3/s (1921), 125,000 ft3/s (1957), 108,000 ft3/s (1958), 97,000 ft3/s (1983), 52,500 ft3/s (1986), and 45,000 ft3/s (2012). In addition to the results of Topping and others (2003), peak-streamflow data from gaging stations on the Colorado River downstream from our study area (U.S. Geological Survey, 2020a, b) indicate that no floods larger than the 1921 flood have occurred since 1884. Continuous gaging of the Colorado River has occurred since May 8, 1921, at the Colorado River at Lees Ferry, Ariz., gaging station and since November 12, 1922, at the Colorado River near Grand Canyon, Ariz., gaging station (Topping and others, 2003; instantaneous discharge data at https://www.gcmrc.gov/discharge_qw_sediment/), thus removing all uncertainty about the post-1921 flood history of this river in our study area.
Floods of similar peak discharge will produce strandlines that are amalgamations of the peak-stage indicators deposited during these floods. More than seven floods likely formed the seven strandlines expected in our study area because multiple floods attained the peak discharges of 125,000 ft3/s—last reached in 1957, 52,500 ft3/s—last reached in 1986, and 45,000 ft3/s—last reached in 2012. Peak discharges of the pre-dam floods during 1927, 1941, 1949, and 1952 were all similar to the 125,000 ft3/s peak discharge of the 1957 flood (fig. 2). Thus, the driftwood, woody debris, and trash deposited at peak stage during these earlier floods and the 1957 flood probably comprise an amalgamated strandline that we reference as simply the “1957” strandline. Similarly, large post-dam floods during 1984 and 1986 comprise an amalgamated strandline, as do the 1996, 2004, 2008, and 2012 HFEs released from the dam to rebuild sandbars (Webb and others, 1999; Topping and others, 2010; Melis, 2011; U.S. Department of the Interior, 2011). Although the peak discharge of the 1984 flood (58,200 ft3/s) was slightly larger than the peak discharge of the 1986 flood (52,500 ft3/s) at RM 0 at the Colorado River at Lees Ferry, Ariz., gaging station, the peak of the 1984 flood lasted only a few hours and attenuated to 47,500 ft3/s by RM 87 at the Colorado River near Grand Canyon, Ariz., gaging station. Thus, the peak discharges of the 1984 and 1986 floods were similar through much of the study area, likely forming an amalgamated strandline that we refer to as the “1986” strandline. Owing to the similar peak discharge of the 1996, 2004, 2008, and 2012 HFEs (42,000 to 45,000 ft3/s), peak-stage indicators deposited during these four floods were similarly expected to comprise an amalgamated “1996–2012” strandline.
Methods
Field Survey
Coordinates of peak-stage indicators were measured using a survey-grade total-station theodolite during five separate field surveys conducted in 2004, 2009, 2011, 2012,
and 2013 (Sabol and others, 2021). These data provide a comprehensive survey of peak-stage indicators along the Colorado River corridor between RM 0 and RM 87 (fig. 1). In 2008, the locations of peak-stage indicators in three short reaches downstream from RM 87 were measured using a handheld global positioning system (GPS) unit (appendix 1). Total-station measurements were made using an established network of survey control that references the 2011 realization of North American Datum of 1983 (NAD83) (NAD83, 2011; Kaplinski and others, 2017). The measurements were projected into the State Plane Coordinate System of 1983, Arizona central zone (Federal Information Processing Standard zone 0202). Vertical positions are provided in both NAD83 ellipsoid heights and in North American Vertical Datum of 1988 (NAVD88) orthometric elevations modeled from GEOID12b.
Identifying and accurately measuring the original locations of peak-stage indicators decades after deposition requires an understanding of how the indicators were emplaced and how they have degraded or moved over time. Selecting the precise location to collect a surveyed data point is a function of the type of peak-stage indicator present; selection of the surveyed location affects the quality of the peak-stage data measured at a given site (Koenig and others, 2016). The approaches used for collecting survey data for each type of peak-stage indicator (fig. 3) are as follows:
• Driftwood logs and milled lumber: Interpretation of large driftwood deposits is potentially complicated. In settings where abundant driftwood forms a well-defined strandline, survey points were collected where each individual log came to rest and is in contact with the highest point on the land surface.
• Woody-debris pile: Survey points documenting debris-pile elevations were collected at or near the top of the debris pile. Organic detritus is often deposited as large mats that vary in thickness and drape the topography of the underlying land surface. Woody-debris pile herein refers to accumulations of small logs, branches, and other small organic detritus.
• Trash: Trash drift deposited in the strandlines was surveyed where it made contact with the land surface. Most items of trash were associated with other peak-stage indicators and were used to help assign ages to the strandlines. Trash drift consisted of cans, glass bottles, nails in milled lumber, and plastic. Hunt and Mabey (1966) pioneered using trash to date historical floods; their trash dating methods are described in detail in Hunt (1959, 1975) and were utilized and (or) refined to place age constraints on strandlines by Hereford (1993), Hereford and others (1993, 1998, 2000), House and Baker (2001), and House and others (2002).

Methods 5
men20-3155_fig03
A B
C
Figure 3. Photographs showing type examples of peak-stage indicators found along the Colorado River in Grand Canyon National Park, Arizona. Shown are (A) driftwood logs, (B) a woody-debris pile, and (C) trash.
Historical Photography
Historical photographs are a resource for detecting change over time (Webb, 1996). Many of the photographs taken along the Colorado River during an 1889–1890 expedition by Robert Brewster Stanton (Webb, 1996) showed sand deposits and driftwood from the 210,000 ft3/s 1884 flood. Because no floods larger than the 1884 flood occurred on the Colorado River in our study area between 1884 and 1890 (Topping and others, 2003; U.S. Geological Survey, 2020b), these photographed deposits and driftwood are likely from the 1884 flood. The positions of driftwood and the maximum elevation of the highest-elevation clean sand (likely deposited during the 1884 flood) in these photographs were therefore used in the field to aid in determining the elevation of the peak stage of the 1884 flood.
Strandline Classification
A total of 1,812 peak-stage indicators were surveyed and analyzed during this study. Survey data were compiled in ArcMap 10.3.1. The survey point associated with the location of each peak-stage indicator was assigned a RM position,
to the nearest 0.01 mile, by projecting the surveyed point to the river centerline using a spatial join analysis in ArcMap. The relative vertical positions of the peak-stage indicators were used to initially classify the peak-stage indicators into the seven strandlines suggested by the flood history in figure 2. In addition to the surveyed coordinates, airborne imagery (Durning and others, 2016; Davis, 2012) was also used to help classify strandlines. The surveyed locations of the datable trash drift were then used to refine the assignment of the peak-stage indicators into these seven strandlines.
The elevations of peak-stage indicators relative to the local reference datum, that is, the reference stage at a discharge of 8,000 ft3/s, was used to confirm strandline assignments. The longitudinal profile of the 8,000 ft3/s reference stage was developed by Magirl and others (2005, 2008) and has an absolute vertical error estimated to be less than 0.3 meters (m). In areas where strandlines from each of the five largest peak-discharge inundation levels (that is, the strandlines assigned to the 1884, 1921, 1957, 1958, and 1983 floods) were well defined, an elevation relation was developed for each strandline using the 8,000 ft3/s reference stage as a datum. These relations were used to help inform strandline assignments in river segments where peak-stage-indicator data

6 Strandlines from Large Floods on the Colorado River in Grand Canyon National Park, Arizona
were sparse, or the sequence of strandlines was incomplete. The locations, elevations, and assigned strandlines (that is, 1884, 1921, 1957, 1958, 1983, 1986, and 1996–2012) of all peak-stage indicators are presented in Sabol and others (2021). Peak-stage indicators that could not be clearly assigned to one of these strandlines are also included in Sabol and others (2021) but were removed from the analyses herein.
Longitudinal Profiles and Slopes of Strandlines A longitudinal profile over the entire river segment from
RM 0 through RM 87 was developed for each strandline using the surveyed elevation from the peak-stage indicators and associated centerline RM. To highlight more subtle changes in water-surface slope, longitudinal profiles were also created over shorter reaches. Where the density of data allowed, water-surface slopes were calculated.
Stage-Discharge RelationsStage-discharge relations were derived at discrete locations
by fitting 2nd order polynomials to the surveyed elevation data and the discharge value assigned to the strandlines. These relations were generally developed at locations where strand-lines from all five of the largest floods (that is, the 1884, 1921, 1957, 1958, and 1983 floods) were present within a 0.1-mile longitudinal distance, and the longitudinal variation in channel geometry was negligible. In a few cases, stage-discharge relations were also developed for areas of interest, where data from fewer than five strandlines were present. To allow for the comparison between stage-discharge relations, the datum of all relations was set equal to 0 feet at the 8,000 ft3/s reference stage, as determined by Magirl and others (2005, 2008).
Comparison of Stage-Discharge Relations with a Predictive Numerical Model
Magirl and others (2008) developed a predictive one-dimensional numerical model that simulated stages for discharges from 8,000 ft3/s to 210,000 ft3/s. Because of a lack of continuous bathymetric data when the model was developed, the Magirl and others (2008) model used a synthetic bathymetry generated using a constant Manning’s n roughness such that the predicted stage at a discharge of 8,000 ft3/s would match the measured stage at this discharge. We evaluated the predicted stage-discharge output from the Magirl and others (2008) hydraulic model using the stage-discharge relations developed from the strandlines. Stages for discharges of 210,000 ft3/s, 170,000 ft3/s, 125,000 ft3/s, 108,000 ft3/s, 97,000 ft3/s, and
45,000 ft3/s from the Magirl and others (2008) model were thus interpolated for comparison to the same locations where we developed these stage-discharge relations (appendix 2).
Results
Peak-stage Indicator Strandline Classification
As expected on the basis of the 1884-present flood history in our study area, the surveyed peak-stage indicators defined five strandlines above the likely peak stage of the 52,500 ft3/s 1986 flood (fig. 2). An example of these five “primary” strandlines in a photograph and cross section at RM 74.0 are shown in figure 4. These strandlines are at similar relative elevations as those surveyed by Draut and others (2005) upstream at Palisades Creek (herein referred to as Palisades) at RM 66.0–66.4 (Sabol and others, 2021). On the basis of the flood history provided in Topping and others (2003), Draut and others (2005) assigned these strandlines, from highest to lowest elevation, to the: 210,000 ft3/s 1884 flood, 170,000 ft3/s 1921 flood, 125,000 ft3/s 1957 flood, 108,000 ft3/s 1958 flood, and 97,000 ft3/s 1983 flood. Additional support for their interpretation is provided by a photograph taken of the Palisades area by Robert Brewster Stanton in 1890 (fig. 5), which showed relatively fresh sand from the likely 1884 flood extending to near the location of the Draut and others’ (2005) interpreted 1884 driftwood strandline. Thus, as justified in the “Expected Strandline Occurrence Based on Gaging Record” section above and consistent with Draut and others (2005), we assigned these five primary strandlines in our study area to the peaks of the 1884, 1921, 1957, 1958, and 1983 floods (fig. 2, fig. 4). The lower-elevation 1986 and 1996–2012 strandlines are not considered to be primary strandlines, as these strandlines generally included less driftwood and were not surveyed with the same consistency as the primary strandlines. Importantly, we found no driftwood at elevations higher than the likely 1884 strandline. Given that driftwood would be expected to last as long as several hundred years in the semi-arid climate in our study area (Webb, 1996), this key observation suggests strongly that no floods during the last several hundred years were larger than the 210,000 ft3/s 1884 flood. Although there is evidence of a single, much larger ~300,000 ft3/s flood in the Colorado River ~1,200 to 1,600 years ago (O’Connor and others, 1994; Topping and others, 2003), deposits from this singular event are old enough that no driftwood would still be preserved. Thus, it is unlikely that floods larger than the 1884 flood occurred in our study area during the earlier 1800s.

Results 7
men20-3155_fig04
A
210,000 ft3/s170,000 ft3/s125,000 ft3/s108,000 ft3/s
97,000 ft3/s
Distance from the center of the river, in feet
Elev
atio
n, in
feet
2,595
2,600
2,605
2,610
2,615
2,620
2,625
2,630
2,635
0 50 100 150 200 250 300 350
B
Water surface elevationof 2,599.15 ft at 8,000 ft3/s
2,624.46 ft at 210,000 ft3/s
2,621.47 ft at 170,000 ft3/s
2,616.35 ft at 125,000 ft3/s
2,610.95 ft at 97,000 ft3/s
2,612.52 ft at 108,000 ft3/s Land su
rface
Figure 4. Photograph (A) and cross section (B) showing strandlines at river mile 74.0 in Grand Canyon National Park, Arizona. Photograph (A) was taken on the left bank of the river at river mile 74.0 looking upstream toward Unkar Creek Rapid, Arizona. Highlighted in the photograph are five distinct strandlines of peak-stage indicators and their associated peak discharge in cubic feet per second (ft3/s). An idealized cross section (B), viewed upstream and perpendicular to the river centerline at the location of photograph (A), shows the elevation of each strandline (in feet [ft]) and the likely peak discharge associated with the flood that deposited each strandline. Elevation is orthometric elevation.

8 Strandlines from Large Floods on the Colorado River in Grand Canyon National Park, Arizona
men20-3155_fig05
B
A
Figure 5. Cropped version of photograph taken by Robert Brewster Stanton in 1890 looking downstream at the Palisades Creek area at river mile 66.0–66.4 (Robert Brewster Stanton, 57-RS-385, courtesy of The National Archives). A, Palisades Creek area. Dashed line in (B) indicates approximate position of 1884 driftwood strandline surveyed as part of the study of Draut and others (2005). Hereford and others (1993) and Hereford (1996) also used this photograph to infer the inundation extent of the 1884 flood in this reach. The river is flowing from right to left in the photograph.
The Flood of 1884 (210,000 ft3/s)The 210,000 ft3/s peak discharge of the 1884 flood was
the highest discharge observed by western settlers to pass the present location of the Colorado River at Lees Ferry, Ariz., gaging station (Topping and others, 2003). Peak-stage
indicators associated with the 1884 flood accounted for only 7.6 percent of all peak-stage indicators in the primary strandlines (table 1; Sabol and others, 2021). Driftwood and debris deposited in this strandline are typically partially buried in fan sediments and display a high degree of deterioration and disintegration (fig. 6A). Thus, the

Results 9
Table 1. Percentage of peak-stage indicators comprising each of the five primary strandlines.
[ft3/s, cubic feet per second]
Year Peak flood discharge Percent of peak-stage indicators Number of peak-stage indicators
1884 210,000 ft3/s 7.6 122
1921 170,000 ft3/s 16.0 258
1957 125,000 ft3/s 29.0 467
1958 108,000 ft3/s 23.9 385
1983 97,000 ft3/s 23.4 376
Total = 1,608
men20-3155_fig06
BA
Figure 6. Photographs showing weathering of driftwood that was likely emplaced by (A) the 210,000 cubic feet per second (ft3/s) flood of 1884, and (B) the 170,000 ft3/s flood of 1921. The degree of driftwood deterioration shown in these photographs is common for 1884 and 1921 peak-stage indicators. As shown in (A), driftwood in the likely 1884 strandline is commonly partially buried in fan sediments. Photographs were taken on the left bank of the Colorado River looking upstream near (A) river mile 66.3 and (B) river mile 66.6, in the Palisades area.
weathering of these deposits over the last ~130 years is the likely cause for the relative sparsity of peak-stage indicators from this event. Although western settlers were beginning to inhabit the Colorado River basin upstream from Grand
Canyon by 1884, we found no trash in the likely 1884 strandline. The interpreted 1884 strandline was typically 3–5 feet higher in elevation than the likely 1921 strandline, depending on local river width.

10 Strandlines from Large Floods on the Colorado River in Grand Canyon National Park, Arizona
The Flood of 1921 (170,000 ft3/s)The 170,000 ft3/s flood of 1921 is the first flood
documented by a USGS gaging station (manually read staff gage installed on May 8, 1921) at Lees Ferry, Ariz., and is also the highest magnitude flood directly recorded by the USGS at that location (Topping and others, 2003). Peak-stage indicators associated with the 1921 flood accounted for 16.0 percent of all peak-stage indicators in the five primary strandlines (table 1; Sabol and others, 2021). Driftwood and organic detritus in the 1921 strandline display a high degree of weathering (fig. 6B), similar to the driftwood and debris in the sometimes-present, higher-elevation, 1884 strandline. In many places, peak-stage indicators from 1921 defined the uppermost strandline and were generally 3–5 feet higher in elevation than the 1957 strandline.
The Floods of 1957 (125,000 ft3/s) and 1958 (108,000 ft3/s)
The 125,000 ft3/s flood of 1957 and the 108,000 ft3/s flood of 1958 were the last two large floods that occurred in
the Colorado River before the 1963 closure of Glen Canyon Dam. Despite the difference in peak discharge between the two events, the peak-stage indicators emplaced by these flood peaks are described together because of their similarities in composition and location. Peak-stage indicators associated with the 1957 and 1958 floods account for respectively 29.0 percent and 23.9 percent of all peak-stage indicators surveyed among the five primary strandlines (table 1; Sabol and others, 2021). Most of the longer continuous driftwood strandlines that exceeded ~100 m in length were composed of wood from the 1957 and 1958 events (fig. 7). Peak-stage indicators from 1958 were typically ~3 feet lower in elevation than the 1957 strandline, and typically ~1.5 feet higher than the 1983 strandline.
The Flood of 1983 (97,000 ft3/s)The 97,000 ft3/s flood of 1983 is the post-dam flood of
record of the Colorado River downstream of Glen Canyon Dam. Peak-stage indicators associated with the 1983 flood account for 23.4 percent of all peak-stage indicators surveyed among the five primary strandlines (table 1; Sabol and others, 2021).
men20-3155_fig07
170,000 ft3/s
125,000 ft3/s108,000 ft3/s
Figure 7. Photograph showing the likely strandlines from 1958, 1957, and 1921. This photograph was taken on the left bank of the Colorado River looking upstream between river miles 76.0 and 76.3. Surveyor is standing on a large structural 12 by 12 inch beam that was likely emplaced by the 1958 flood (highlighted by the orange line). Driftwood strandlines from the likely 1957 (yellow line) and 1921 (green line) floods are at progressively higher elevations to the surveyor’s left (to the right in the photograph). Peak flood discharge is given in cubic feet per second (ft3/s).

Results 11
Longitudinal Profiles and Slopes of Strandlines
Longitudinal profiles were developed for the 8,000 ft3/s reference stage, and the five primary strandlines constructed from the surveyed peak-stage indicators over RM 0 through 87 (fig. 8). Longitudinal profiles were also generated for shorter reaches, including slopes calculated, at 20 locations throughout the study area. The shorter profiles ranged from 0.1 mile to several miles in length, depending on the density
of peak-stage indicators and river morphology (fig. 9, table 2). Peak-stage indicators likely from the 125,000 ft3/s flood of 1957 and the 97,000 ft3/s flood of 1983 are present in all of the shorter profiles. 95 percent of the shorter profiles contain peak-stage indicators likely from the 108,000 ft3/s flood of 1958, 85 percent of the shorter profiles contain peak-stage indicators likely from the 170,000 ft3/s flood of 1921, and only 35 percent of the shorter profiles contain peak-stage indicators likely from the from the 210,000 ft3/s flood of 1884.
men20-3155_fig08
2,400
2,500
2,600
2,700
2,800
2,900
3,000
3,100
3,200
0 10 20 30 40 50 60 70 80 90 100
Elev
atio
n, in
feet
Centerline distance from Lees Ferry gage, in miles
3,0503,0603,0703,0803,0903,1003,1103,1203,1303,1403,150
−1 0 1 2 3 4 5 6 7 8 9
2,420
2,440
2,460
2,480
2,500
2,520
2,540
2,560
80 82 84 86 88 90
8,000 ft3/s water-surface elevation
Peak-stage indicator, 125,000 ft3/s
Peak-stage indicator, 108,000 ft3/s
Peak-stage indicator, 210,000 ft3/s
Peak-stage indicator, 170,000 ft3/sPeak-stage indicator, 97,000 ft3/s
Peak-stage indicator, 52,500 ft3/s
Peak-stage indicator, 45,000 ft3/s
EXPLANATION
a Data from Topping and others (2003) and U.S. Geological Survey gaging station USGS 09380000 Colorado River at Lees Ferry, Arizona
b Data from Topping and others (2003) and U.S. Geological Survey gaging station USGS 09402500 Colorado River near Grand Canyon, Arizona
b
a
Figure 8. Longitudinal profiles of the 8,000 cubic feet per second (ft3/s) reference stage and surveyed peak-stage indicators segregated into the five primary strandlines from the 210,000 ft3/s—1884, 170,000 ft3/s—1921, 125,000 ft3/s—1957, 108,000 ft3/s—1958, and 97,000 ft3/s—1983 floods, and also segregated into the strandlines from the 52,500 ft3/s—1986, and 45,000 ft3/s—1996–2012 floods. Also shown (in the ovals in the expanded-scale boxes) for comparison are the peak stages of these floods from the stage-discharge relations at the Colorado River at Lees Ferry, Arizona, 09380000 and the Colorado River near Grand Canyon, Ariz., 09402500 gaging stations.

12 Strandlines from Large Floods on the Colorado River in Grand Canyon National Park, Arizona
men20-3155_fig09
8,000 ft3/s water-surface elevation
Peak-stage indicator, 125,000 ft3/sPeak-stage indicator, 108,000 ft3/s
Peak-stage indicator, 210,000 ft3/sPeak-stage indicator, 170,000 ft3/s
Peak-stage indicator, 97,000 ft3/sPeak-stage indicator, 52,500 ft3/sPeak-stage indicator, 45,000 ft3/s
EXPLANATION
Centerline distance from Lees Ferry gage, in miles
Elev
atio
n, in
feet
Elev
atio
n, in
feet
2,680
2,685
2,690
2,695
2,700
2,705
2,710
2,715
2,720
2,795
2,800
2,805
2,810
2,815
2,820
2,825
2,830
2,835
2,840
2,845
2,850
2,855
2,860
2,865
2,900
2,910
2,920
2,930
2,940
2,950
2,960
2,970
2,980
2,990
3,000
3,010
3,020
3,030
3,040
3,040
3,050
3,060
3,070
3,080
3,090
3,100
3,110
3,120
65.9 66 66.1 66.2 66.3 66.445 46 47 48 49 50 51
20 21 22 23 24 25 26 2711.4 11.45 11.5 11.55 11.6 11.65 11.7
D. River mile 66.0–66.4, PalisadesC. River mile 46.0–50.2, above Fifty Mile
B. River mile 20.7–26.5, Supai and Redwall GorgeA. River mile 11.4–11.7, below Soap Creek Rapid
Figure 9. Longitudinal profiles of strandlines in four shorter reaches (A-D) showing linear regressions. Peak-stage indicators are segregated into the same five primary strandlines, two lesser strandlines, and the 8,000 cubic feet per second (ft3/s) reference stage depicted in figure 8. Table 3 presents the full list of slopes generated from longitudinal profiles regressed in the shorter reaches. Profiles in A and D slope up-canyon because the strandlines were deposited upstream from the reattachment point in lateral recirculation eddies, where the water near the bank was flowing in the up-canyon direction. Elevations are orthometric elevations.

Results 13
Table 2. Calculated strandline slopes for selected reaches of the Colorado River in Grand Canyon National Park, Arizona.
[Assigned years of floods are shown in the header above the discharges associated with each strandline. Negative slopes slope in the down-canyon direction. River reaches are indicated by river mile. Abbreviations: ft3/s, cubic feet per second; —, insufficient data for analysis, 2 or fewer data points]
River reach start
River reach end
Reach name1884,
210,000 ft3/s
1921, 170,000
ft3/s
1957, 125,000 ft3/s
1958, 108,000 ft3/s
1983, 97,000 ft3/s
1986, 52,500 ft3/s
1996, 45,000 ft3/s
2012, 8,000 ft3/s
3.30 7.90 River mile 3.3 to Badger — — −0.0002a −0.0003a −0.0004 — — −0.0001
8.00 8.20 Below Badger — −0.0074 0 — −0.0081 0.0012 −0.0035 −0.0073
11.40 11.60 Below Soap Creek 0.015 0.0092 0.008 0.0087 0.0041 0.0029 0.0068 −0.0081
20.75 26.50 Supai and Redwall Gorge −0.0027 −0.0026 −0.0023 −0.0031 −0.0023 −0.0022 −0.0017 −0.0023
30.00 33.00 Redwall Gorge — −0.0010 −0.0010 −0.0008a −0.0009 — −0.0027 −0.0011
43.40 45.80 Above Eminance to Willy Taylor — −0.0014 −0.0017 −0.0014 −0.0013 — −0.0007 −0.0016
46.00 50.20 Lower Marble Canyon −0.0004 −0.0006 −0.0008 −0.0008 −0.0008 — −0.0009 −0.0007
51.00 52.30Lower Marble
Canyon to above Little Nankoweap
0.003 — −0.0012 −0.0015a −0.0015 — — −0.0006
52.30 54.00 Nankoweap −0.0035a −0.0028a −0.0025a −0.0025 −0.0028 — −0.0100 −0.0027
58.40 61.50
Lower Marble Canyon to above Little Colorado River
— −0.0007 −0.0006 −0.0007 −0.0009 0.0003 −0.0009 −0.0010
62.00 66.00 Little Colorado River to Lava Chuar — −0.0011 −0.0011 −0.0014 −0.0011 — −0.0015 −0.0013
66.00 66.40 Palisades 0.0004 0.0007 0.0008 0.0011 0.0004 — — −0.0005
66.50 69.00 Below Palisades to Tanner — −0.0012 −0.0020 −0.0021 −0.0020 — −0.0018 −0.0016
69.00 69.80 Below Tanner — −0.0002 0.0003 −0.0006 −0.0017 — — −0.0024
70.00 71.00 Below Basalt — −0.0033 −0.0031 −0.0033 −0.0018 — −0.0028 −0.0023
72.00 72.90 Above Unkar — −0.0045a −0.0001 −0.0001a 0.0014 0 0.0034 −0.0004
73.80 75.70 Below Unkar −0.0010 −0.0012 −0.0009 −0.0008 −0.0008 — — −0.0004
75.80 76.15 Nevills − upper — −0.0030 −0.0012 −0.0023 −0.0023 — — −0.0060
76.20 76.30 Nevills − lower — −0.0001 0.0014 0.0094 0.0039 — 0.0031 −0.0032
77.30 77.60 Hance — — −0.0061a −0.0007a −0.0007 — — −0.0054aSlope generated with only 1 data point on either the upstream or downstream end of the profile line.
14 Strandlines from Large Floods on the Colorado River in Grand Canyon National Park, Arizona
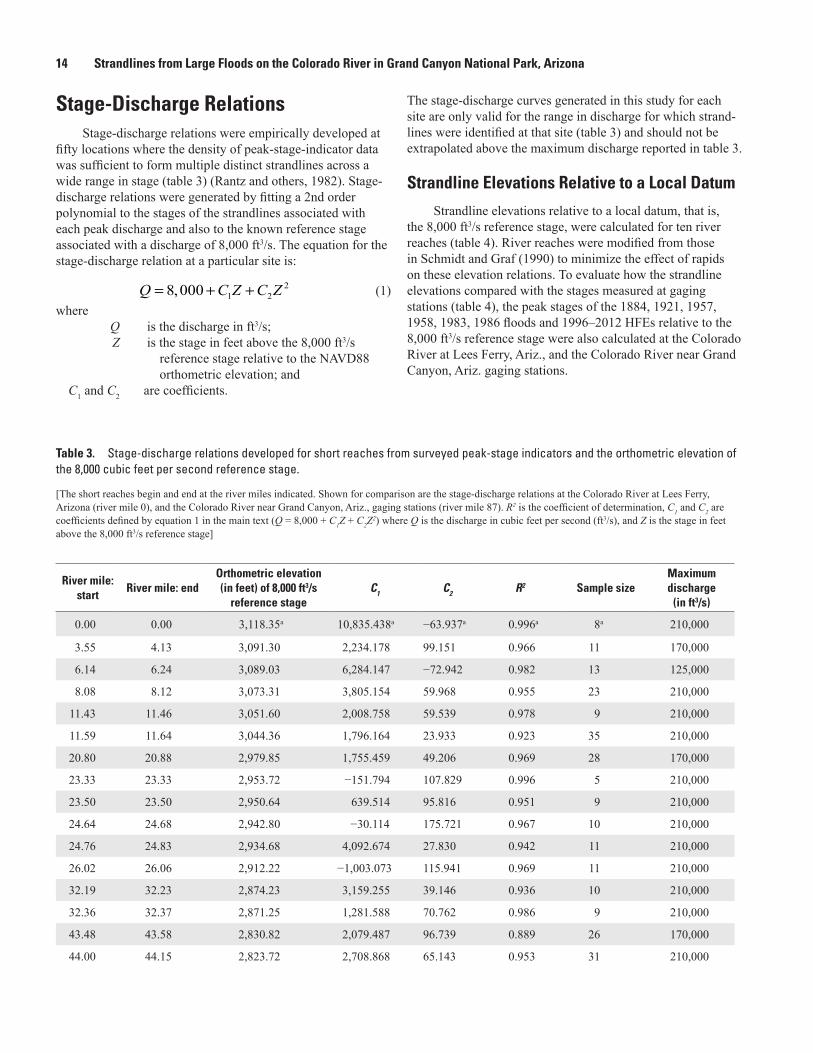
Stage-Discharge RelationsStage-discharge relations were empirically developed at
fifty locations where the density of peak-stage-indicator data was sufficient to form multiple distinct strandlines across a wide range in stage (table 3) (Rantz and others, 1982). Stage-discharge relations were generated by fitting a 2nd order polynomial to the stages of the strandlines associated with each peak discharge and also to the known reference stage associated with a discharge of 8,000 ft3/s. The equation for the stage-discharge relation at a particular site is:
(1)where Q is the discharge in ft3/s; Z is the stage in feet above the 8,000 ft3/s
reference stage relative to the NAVD88 orthometric elevation; and
C1 and C2 are coefficients.
21 28,000Q C Z C Z= + +
The stage-discharge curves generated in this study for each site are only valid for the range in discharge for which strand-lines were identified at that site (table 3) and should not be extrapolated above the maximum discharge reported in table 3.
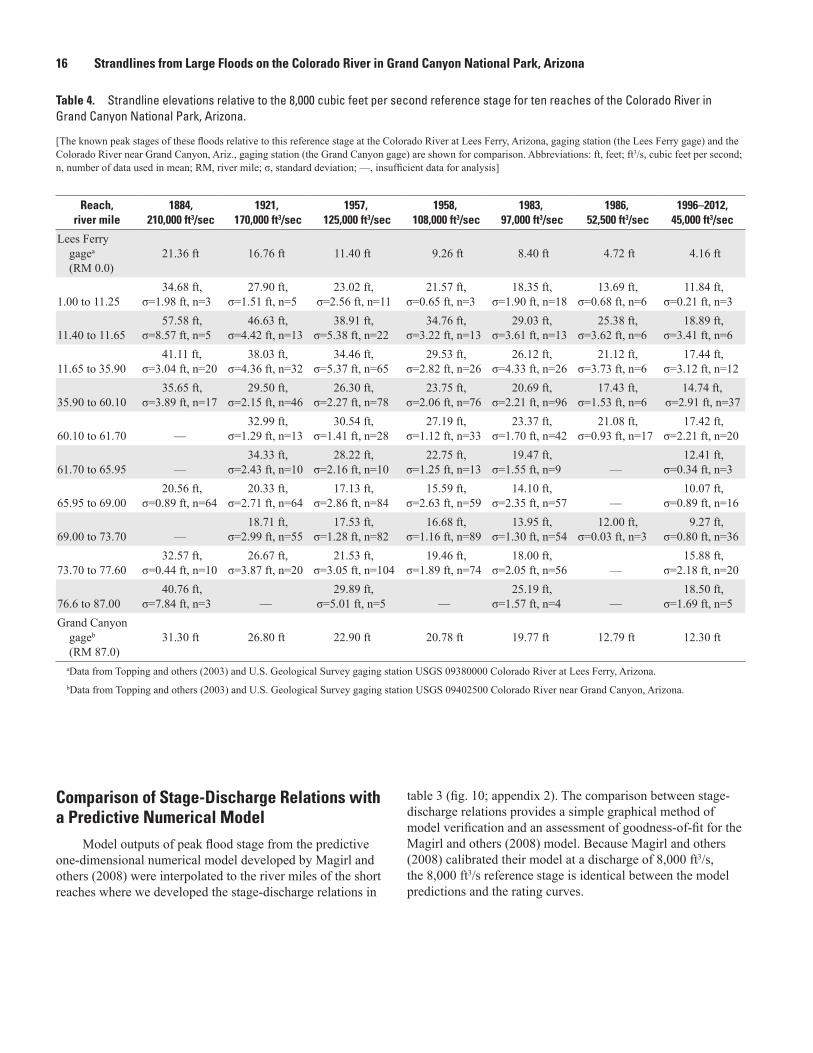
Strandline Elevations Relative to a Local Datum
Strandline elevations relative to a local datum, that is, the 8,000 ft3/s reference stage, were calculated for ten river reaches (table 4). River reaches were modified from those in Schmidt and Graf (1990) to minimize the effect of rapids on these elevation relations. To evaluate how the strandline elevations compared with the stages measured at gaging stations (table 4), the peak stages of the 1884, 1921, 1957, 1958, 1983, 1986 floods and 1996–2012 HFEs relative to the 8,000 ft3/s reference stage were also calculated at the Colorado River at Lees Ferry, Ariz., and the Colorado River near Grand Canyon, Ariz. gaging stations.
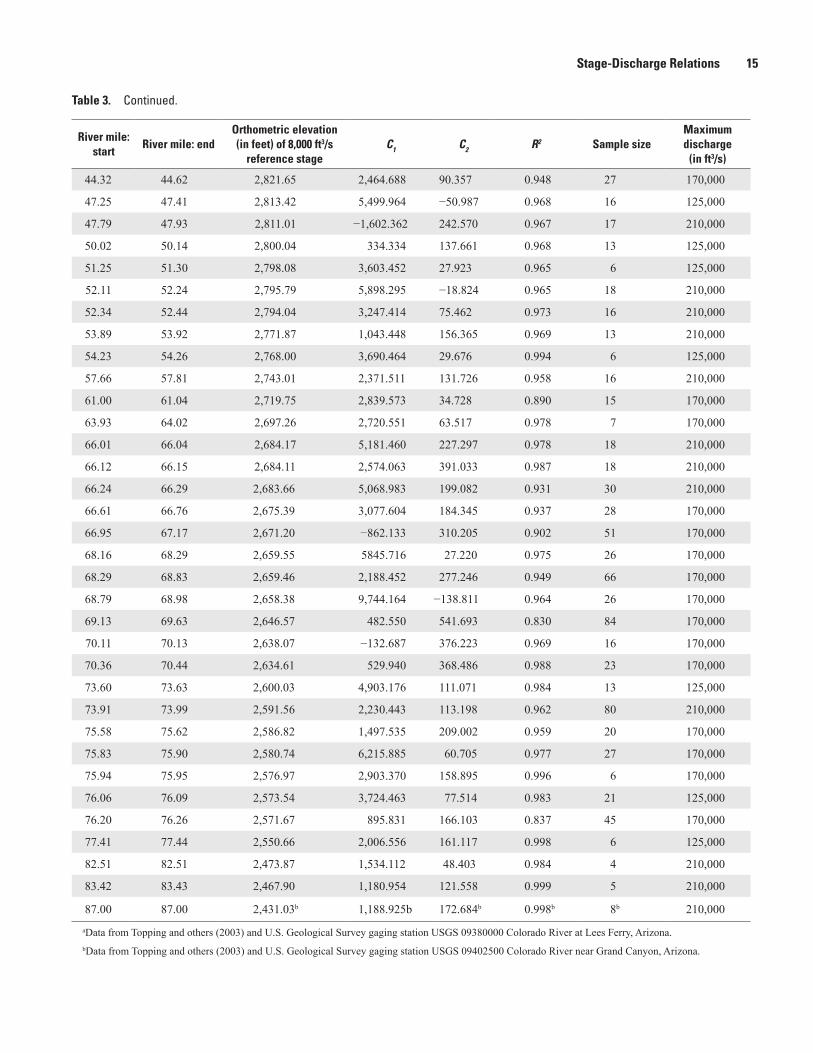
Table 3. Stage-discharge relations developed for short reaches from surveyed peak-stage indicators and the orthometric elevation of the 8,000 cubic feet per second reference stage.
[The short reaches begin and end at the river miles indicated. Shown for comparison are the stage-discharge relations at the Colorado River at Lees Ferry, Arizona (river mile 0), and the Colorado River near Grand Canyon, Ariz., gaging stations (river mile 87). R2 is the coefficient of determination, C1 and C2 are coefficients defined by equation 1 in the main text (Q = 8,000 + C1Z + C2Z
2) where Q is the discharge in cubic feet per second (ft3/s), and Z is the stage in feet above the 8,000 ft3/s reference stage]
River mile: start
River mile: endOrthometric elevation (in feet) of 8,000 ft3/s
reference stageC1 C2 R2 Sample size
Maximum discharge
(in ft3/s)
0.00 0.00 3,118.35a 10,835.438a −63.937a 0.996a 8a 210,000
3.55 4.13 3,091.30 2,234.178 99.151 0.966 11 170,000
6.14 6.24 3,089.03 6,284.147 −72.942 0.982 13 125,000
8.08 8.12 3,073.31 3,805.154 59.968 0.955 23 210,000
11.43 11.46 3,051.60 2,008.758 59.539 0.978 9 210,000
11.59 11.64 3,044.36 1,796.164 23.933 0.923 35 210,000
20.80 20.88 2,979.85 1,755.459 49.206 0.969 28 170,000
23.33 23.33 2,953.72 −151.794 107.829 0.996 5 210,000
23.50 23.50 2,950.64 639.514 95.816 0.951 9 210,000
24.64 24.68 2,942.80 −30.114 175.721 0.967 10 210,000
24.76 24.83 2,934.68 4,092.674 27.830 0.942 11 210,000
26.02 26.06 2,912.22 −1,003.073 115.941 0.969 11 210,000
32.19 32.23 2,874.23 3,159.255 39.146 0.936 10 210,000
32.36 32.37 2,871.25 1,281.588 70.762 0.986 9 210,000
43.48 43.58 2,830.82 2,079.487 96.739 0.889 26 170,000
44.00 44.15 2,823.72 2,708.868 65.143 0.953 31 210,000
Stage-Discharge Relations 15
Table 3. Continued.
River mile: start
River mile: endOrthometric elevation (in feet) of 8,000 ft3/s
reference stageC1 C2 R2 Sample size
Maximum discharge
(in ft3/s)
44.32 44.62 2,821.65 2,464.688 90.357 0.948 27 170,000
47.25 47.41 2,813.42 5,499.964 −50.987 0.968 16 125,000
47.79 47.93 2,811.01 −1,602.362 242.570 0.967 17 210,000
50.02 50.14 2,800.04 334.334 137.661 0.968 13 125,000
51.25 51.30 2,798.08 3,603.452 27.923 0.965 6 125,000
52.11 52.24 2,795.79 5,898.295 −18.824 0.965 18 210,000
52.34 52.44 2,794.04 3,247.414 75.462 0.973 16 210,000
53.89 53.92 2,771.87 1,043.448 156.365 0.969 13 210,000
54.23 54.26 2,768.00 3,690.464 29.676 0.994 6 125,000
57.66 57.81 2,743.01 2,371.511 131.726 0.958 16 210,000
61.00 61.04 2,719.75 2,839.573 34.728 0.890 15 170,000
63.93 64.02 2,697.26 2,720.551 63.517 0.978 7 170,000
66.01 66.04 2,684.17 5,181.460 227.297 0.978 18 210,000
66.12 66.15 2,684.11 2,574.063 391.033 0.987 18 210,000
66.24 66.29 2,683.66 5,068.983 199.082 0.931 30 210,000
66.61 66.76 2,675.39 3,077.604 184.345 0.937 28 170,000
66.95 67.17 2,671.20 −862.133 310.205 0.902 51 170,000
68.16 68.29 2,659.55 5845.716 27.220 0.975 26 170,000
68.29 68.83 2,659.46 2,188.452 277.246 0.949 66 170,000
68.79 68.98 2,658.38 9,744.164 −138.811 0.964 26 170,000
69.13 69.63 2,646.57 482.550 541.693 0.830 84 170,000
70.11 70.13 2,638.07 −132.687 376.223 0.969 16 170,000
70.36 70.44 2,634.61 529.940 368.486 0.988 23 170,000
73.60 73.63 2,600.03 4,903.176 111.071 0.984 13 125,000
73.91 73.99 2,591.56 2,230.443 113.198 0.962 80 210,000
75.58 75.62 2,586.82 1,497.535 209.002 0.959 20 170,000
75.83 75.90 2,580.74 6,215.885 60.705 0.977 27 170,000
75.94 75.95 2,576.97 2,903.370 158.895 0.996 6 170,000
76.06 76.09 2,573.54 3,724.463 77.514 0.983 21 125,000
76.20 76.26 2,571.67 895.831 166.103 0.837 45 170,000
77.41 77.44 2,550.66 2,006.556 161.117 0.998 6 125,000
82.51 82.51 2,473.87 1,534.112 48.403 0.984 4 210,000
83.42 83.43 2,467.90 1,180.954 121.558 0.999 5 210,000
87.00 87.00 2,431.03b 1,188.925b 172.684b 0.998b 8b 210,000aData from Topping and others (2003) and U.S. Geological Survey gaging station USGS 09380000 Colorado River at Lees Ferry, Arizona.bData from Topping and others (2003) and U.S. Geological Survey gaging station USGS 09402500 Colorado River near Grand Canyon, Arizona.
16 Strandlines from Large Floods on the Colorado River in Grand Canyon National Park, Arizona
Table 4. Strandline elevations relative to the 8,000 cubic feet per second reference stage for ten reaches of the Colorado River in Grand Canyon National Park, Arizona.
[The known peak stages of these floods relative to this reference stage at the Colorado River at Lees Ferry, Arizona, gaging station (the Lees Ferry gage) and the Colorado River near Grand Canyon, Ariz., gaging station (the Grand Canyon gage) are shown for comparison. Abbreviations: ft, feet; ft3/s, cubic feet per second; n, number of data used in mean; RM, river mile; σ, standard deviation; —, insufficient data for analysis]
Reach, river mile
1884, 210,000 ft3/sec
1921, 170,000 ft3/sec
1957, 125,000 ft3/sec
1958, 108,000 ft3/sec
1983, 97,000 ft3/sec
1986, 52,500 ft3/sec
1996–2012, 45,000 ft3/sec
Lees Ferry gagea (RM 0.0)
21.36 ft 16.76 ft 11.40 ft 9.26 ft 8.40 ft 4.72 ft 4.16 ft
1.00 to 11.2534.68 ft,
σ=1.98 ft, n=327.90 ft,
σ=1.51 ft, n=523.02 ft,
σ=2.56 ft, n=1121.57 ft,
σ=0.65 ft, n=318.35 ft,
σ=1.90 ft, n=1813.69 ft,
σ=0.68 ft, n=611.84 ft,
σ=0.21 ft, n=3
11.40 to 11.6557.58 ft,
σ=8.57 ft, n=546.63 ft,
σ=4.42 ft, n=1338.91 ft,
σ=5.38 ft, n=2234.76 ft,
σ=3.22 ft, n=1329.03 ft,
σ=3.61 ft, n=1325.38 ft,
σ=3.62 ft, n=618.89 ft,
σ=3.41 ft, n=6
11.65 to 35.9041.11 ft,
σ=3.04 ft, n=2038.03 ft,
σ=4.36 ft, n=3234.46 ft,
σ=5.37 ft, n=6529.53 ft,
σ=2.82 ft, n=2626.12 ft,
σ=4.33 ft, n=2621.12 ft,
σ=3.73 ft, n=617.44 ft,
σ=3.12 ft, n=12
35.90 to 60.1035.65 ft,
σ=3.89 ft, n=1729.50 ft,
σ=2.15 ft, n=4626.30 ft,
σ=2.27 ft, n=7823.75 ft,
σ=2.06 ft, n=7620.69 ft,
σ=2.21 ft, n=9617.43 ft,
σ=1.53 ft, n=614.74 ft,
σ=2.91 ft, n=37
60.10 to 61.70 —32.99 ft,
σ=1.29 ft, n=1330.54 ft,
σ=1.41 ft, n=2827.19 ft,
σ=1.12 ft, n=3323.37 ft,
σ=1.70 ft, n=4221.08 ft,
σ=0.93 ft, n=1717.42 ft,
σ=2.21 ft, n=20
61.70 to 65.95 —34.33 ft,
σ=2.43 ft, n=1028.22 ft,
σ=2.16 ft, n=1022.75 ft,
σ=1.25 ft, n=1319.47 ft,
σ=1.55 ft, n=9 —12.41 ft,
σ=0.34 ft, n=3
65.95 to 69.0020.56 ft,
σ=0.89 ft, n=6420.33 ft,
σ=2.71 ft, n=6417.13 ft,
σ=2.86 ft, n=8415.59 ft,
σ=2.63 ft, n=5914.10 ft,
σ=2.35 ft, n=57 —10.07 ft,
σ=0.89 ft, n=16
69.00 to 73.70 —18.71 ft,
σ=2.99 ft, n=5517.53 ft,
σ=1.28 ft, n=8216.68 ft,
σ=1.16 ft, n=8913.95 ft,
σ=1.30 ft, n=5412.00 ft,
σ=0.03 ft, n=39.27 ft,
σ=0.80 ft, n=36
73.70 to 77.6032.57 ft,
σ=0.44 ft, n=1026.67 ft,
σ=3.87 ft, n=2021.53 ft,
σ=3.05 ft, n=10419.46 ft,
σ=1.89 ft, n=7418.00 ft,
σ=2.05 ft, n=56 —15.88 ft,
σ=2.18 ft, n=20
76.6 to 87.0040.76 ft,
σ=7.84 ft, n=3 —29.89 ft,
σ=5.01 ft, n=5 —25.19 ft,
σ=1.57 ft, n=4 —18.50 ft,
σ=1.69 ft, n=5Grand Canyon
gageb (RM 87.0)
31.30 ft 26.80 ft 22.90 ft 20.78 ft 19.77 ft 12.79 ft 12.30 ft
aData from Topping and others (2003) and U.S. Geological Survey gaging station USGS 09380000 Colorado River at Lees Ferry, Arizona.bData from Topping and others (2003) and U.S. Geological Survey gaging station USGS 09402500 Colorado River near Grand Canyon, Arizona.
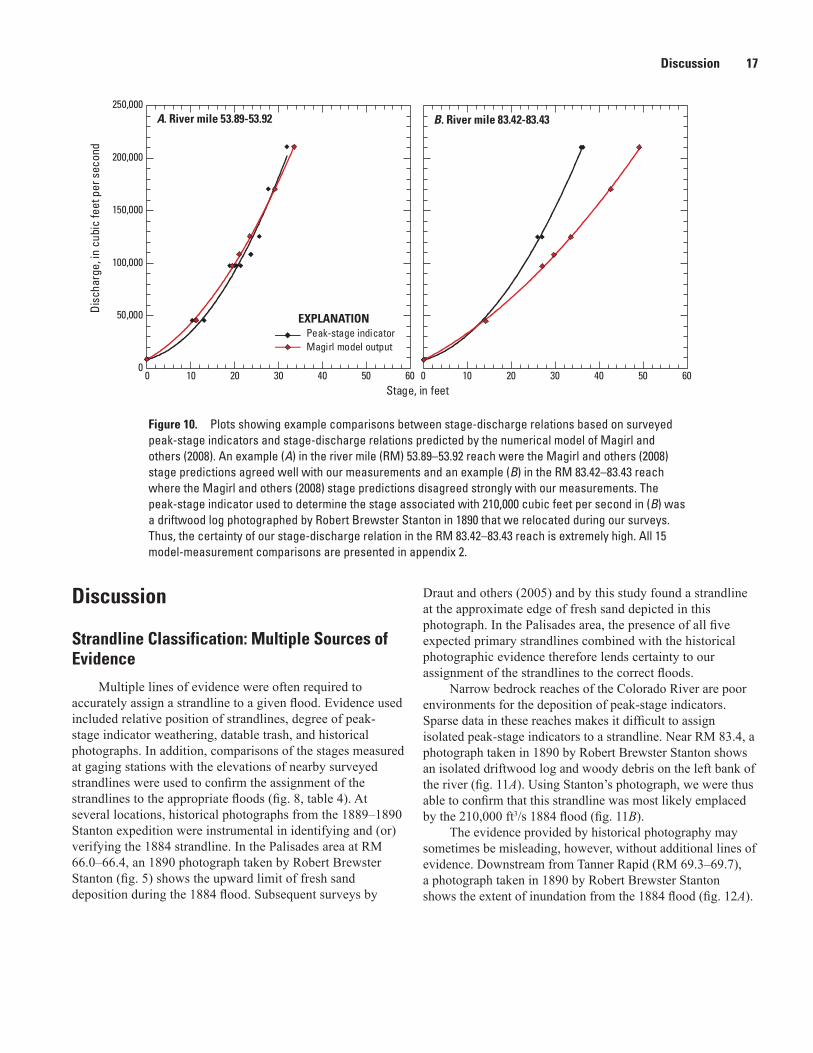
Comparison of Stage-Discharge Relations with a Predictive Numerical Model
Model outputs of peak flood stage from the predictive one-dimensional numerical model developed by Magirl and others (2008) were interpolated to the river miles of the short reaches where we developed the stage-discharge relations in
table 3 (fig. 10; appendix 2). The comparison between stage-discharge relations provides a simple graphical method of model verification and an assessment of goodness-of-fit for the Magirl and others (2008) model. Because Magirl and others (2008) calibrated their model at a discharge of 8,000 ft3/s, the 8,000 ft3/s reference stage is identical between the model predictions and the rating curves.
Discussion 17
men20-3155_fig10
0
50,000
100,000
150,000
200,000
250,000
0 10 20 30 40 50 60
A. River mile 53.89-53.92
Dis
char
ge, i
n cu
bic
feet
per
sec
ond
Stage, in feet
Peak-stage indicatorMagirl model output
EXPLANATION
0 10 20 30 40 50 60
B. River mile 83.42-83.43
Figure 10. Plots showing example comparisons between stage-discharge relations based on surveyed peak-stage indicators and stage-discharge relations predicted by the numerical model of Magirl and others (2008). An example (A) in the river mile (RM) 53.89–53.92 reach were the Magirl and others (2008) stage predictions agreed well with our measurements and an example (B) in the RM 83.42–83.43 reach where the Magirl and others (2008) stage predictions disagreed strongly with our measurements. The peak-stage indicator used to determine the stage associated with 210,000 cubic feet per second in (B) was a driftwood log photographed by Robert Brewster Stanton in 1890 that we relocated during our surveys. Thus, the certainty of our stage-discharge relation in the RM 83.42–83.43 reach is extremely high. All 15 model-measurement comparisons are presented in appendix 2.
Discussion
Strandline Classification: Multiple Sources of Evidence
Multiple lines of evidence were often required to accurately assign a strandline to a given flood. Evidence used included relative position of strandlines, degree of peak-stage indicator weathering, datable trash, and historical photographs. In addition, comparisons of the stages measured at gaging stations with the elevations of nearby surveyed strandlines were used to confirm the assignment of the strandlines to the appropriate floods (fig. 8, table 4). At several locations, historical photographs from the 1889–1890 Stanton expedition were instrumental in identifying and (or) verifying the 1884 strandline. In the Palisades area at RM 66.0–66.4, an 1890 photograph taken by Robert Brewster Stanton (fig. 5) shows the upward limit of fresh sand deposition during the 1884 flood. Subsequent surveys by
Draut and others (2005) and by this study found a strandline at the approximate edge of fresh sand depicted in this photograph. In the Palisades area, the presence of all five expected primary strandlines combined with the historical photographic evidence therefore lends certainty to our assignment of the strandlines to the correct floods.
Narrow bedrock reaches of the Colorado River are poor environments for the deposition of peak-stage indicators. Sparse data in these reaches makes it difficult to assign isolated peak-stage indicators to a strandline. Near RM 83.4, a photograph taken in 1890 by Robert Brewster Stanton shows an isolated driftwood log and woody debris on the left bank of the river (fig. 11A). Using Stanton’s photograph, we were thus able to confirm that this strandline was most likely emplaced by the 210,000 ft3/s 1884 flood (fig. 11B).
The evidence provided by historical photography may sometimes be misleading, however, without additional lines of evidence. Downstream from Tanner Rapid (RM 69.3–69.7), a photograph taken in 1890 by Robert Brewster Stanton shows the extent of inundation from the 1884 flood (fig. 12A).

18 Strandlines from Large Floods on the Colorado River in Grand Canyon National Park, Arizona
men20-3155_fig11
A
B
Figure 11. Photographs showing driftwood near river mile 83.4 on the Colorado River. A, Photograph taken by Robert Brewster Stanton on February 7, 1890, near river mile 83.4 showing the recently deposited driftwood log (circled in red) and woody debris (Robert Brewster Stanton, 57-RS-433, courtesy of The National Archives). B, Repeat photograph taken by U.S. Geological Survey scientists in 2011 showing the same, now weathered, driftwood log (circled in red); in the intervening 102 years, the woody debris seen in (A) has weathered away.
men20-3155_fig12
B
A
Figure 12. Photographs looking downstream at the cobble bar (river mile 69.3–69.7) below Tanner Rapid. Photograph (A) was taken January 23, 1890, showing the area that was submerged and scoured during the 1884 flood (Robert Brewster Stanton, 57-RS-391, courtesy of The National Archives). It appears (A) that the entire area was submerged, shown in yellow dash, except for the “highest vegetated dune,” circled in red. B, U.S. Geological survey photograph of the same bar taken by J. Bernard on February 8, 1991. Photograph shows the same “highest vegetated dune,” circled in red.
Stanton’s photograph shows that all but the highest vegetated dune on the cobble bar was covered with the fresh sand deposited by the 1884 flood. Surveys conducted during our study, as well as aerial imagery used during mapping and analysis, document that the highest of four strandlines found at this location were found just below the base of this dune (fig. 12, fig. 13A, fig. 14A). Thus, the photographic evidence seemingly suggests that the highest strandline was deposited
at this location by the 1884 flood. However, a round-head nail was present in driftwood in the surveyed strandline (fig. 13C); round-head wire nails supplanted square-head cut nails as the dominant nail in the United States around 1890 (Nelson, 1968; Wells, 1998). These combined lines of evidence (historical photograph plus human artifact) indicate that the highest strandline at RM 69.3–69.7 was not deposited by the 210,000 ft3/s flood of 1884, but rather by the 170,000 ft3/s

Discussion 19
men20-3155_fig13
A
B
C
Figure 13. Photographs showing driftwood at the base of the dune circled in figure 12. A, Photograph looking downstream near river mile 69.3 toward the “highest vegetated dune” (circled in fig. 12). B–C, Photographs showing driftwood at the base of this dune, which was likely emplaced by the 1921 flood. Red ellipse in (A) shows the location of one of the highest pieces of driftwood on the flank of the dune. Close-up photographs of this log (A) are shown in (B) and (C), where a round-head nail is protruding from the wood (highlighted by the blue circle).

20 Strandlines from Large Floods on the Colorado River in Grand Canyon National Park, Arizona
men20-3155_fig14
69.6
69.5
69.4
69.369.2
69.1
23.6
23.5
23.4
23.3
B. RM 23.50A. RM 69.15–69.59
0 500 FEET
0 100 METERS
0 500 FEET
0 100 METERS
N N
EXPLANATION
23.6
Peak-stage indicator 1884, 210,000 ft3/s
Peak-stage indicator 1921, 170,000 ft3/s
Peak-stage indicator 1957, 125,000 ft3/s
Peak-stage indicator 1958, 108,000 ft3/s
Peak-stage indicator 1983, 97,000 ft3/s
Peak-stage indicator 1996–2012, 45,000 ft3/s
Centerline of river, mile marker
Outline of “highest vegetated dune”
Figure 14. Plan view photographs (A, B) of select reaches of the Colorado River where the number of classified peak-stage indicators allows estimates of the lateral extent of flood inundation. The “highest vegetated dune” referenced in figures 12 and 13 is circled in red in (A). Some peak-stage indicators deposited during the 1957 and 1958 floods in (A) were deposited in an eddy behind the locations of the higher 1921 strandline; these floods did not overtop this bar. River flow is from top to bottom in both panels. Aerial imagery was acquired during May 25–30, 2013. ft3/s, cubic feet per second; RM, river mile.
flood of 1921. Thus, even though the 1890 photograph strongly suggests the location where a strandline from the 1884 should exist, no peak-stage indicators from the 1884 flood were apparently deposited at this location.
Photographs taken by Robert Brewster Stanton down-stream from the main part of our study area, that is, down-stream from the Colorado River near Grand Canyon, Ariz., gaging station, also proved useful in identifying the elevation of the peak stage of the 1884 flood. For example, a photograph taken at the Mohawk Canyon study site at RM 171.9 showed the upward limit of fresh sand likely deposited during the 1884 flood (figs. 1.1–1.5 in appendix 1). This photograph proved to be essential in identifying the highest driftwood strandline at this location as a deposit of the 1884 flood.
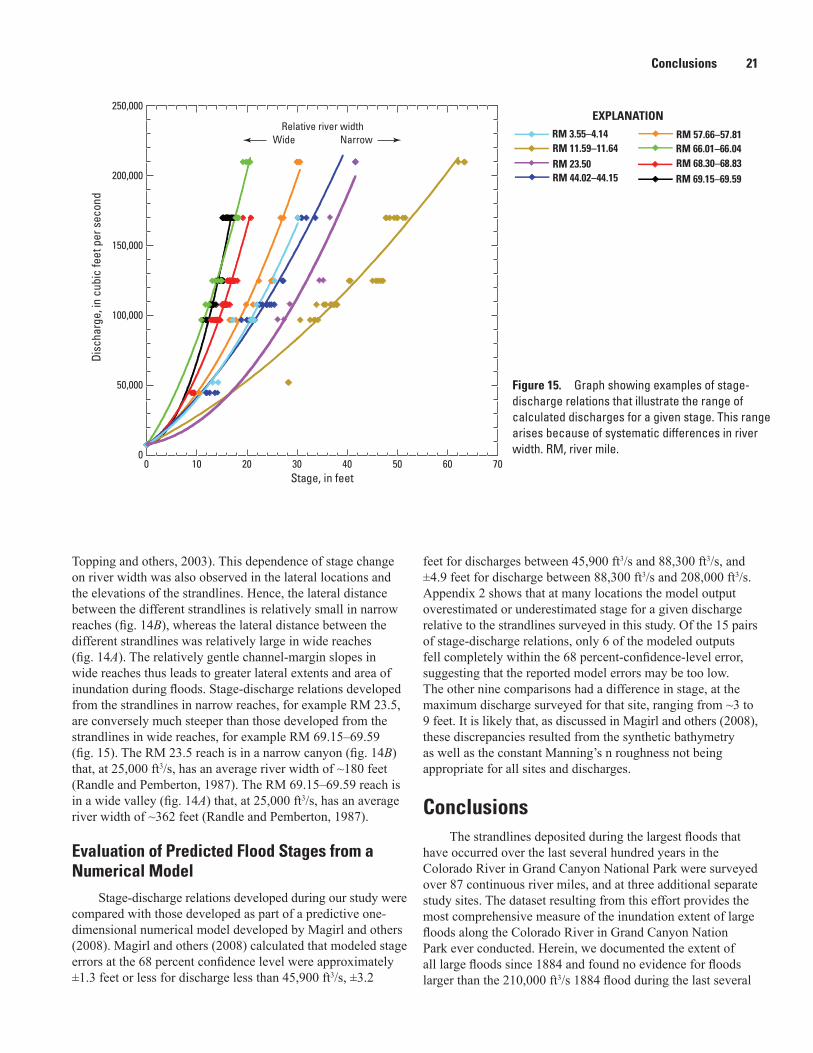
Stage-Discharge Relations and River Width
Stage-discharge relations developed from the strandlines exhibit a wide range in discharge for a given stage, with this range arising from differences in river width (figs. 14, 15, table 4). Less stage change is associated with the same discharge change in wider reaches than in narrower reaches because narrow reaches have steeper channel-margin slopes. For example, in the wide reach at the Colorado River at Lees Ferry, Ariz., gaging station, the stage change between a discharge of 8,000 ft3/s and 100,000 ft3/s is only ~10 feet. Conversely, in the narrow reach at the Colorado River near Grand Canyon, Ariz., gaging station, the stage change between a discharge of 8,000 ft3/s and 100,000 ft3/s is ~21 feet (after
Conclusions 21
men20-3155_fig15
EXPLANATION
RM 69.15–69.59RM 68.30–68.83RM 66.01–66.04RM 57.66–57.81
RM 44.02–44.15
RM 11.59–11.64RM 3.55–4.14
RM 23.50
0
50,000
100,000
150,000
200,000
250,000
0 10 20 30 40 50 60 70Stage, in feet
Relative river widthWide Narrow
Disc
harg
e, in
cub
ic fe
et p
er s
econ
d
Figure 15. Graph showing examples of stage-discharge relations that illustrate the range of calculated discharges for a given stage. This range arises because of systematic differences in river width. RM, river mile.
Topping and others, 2003). This dependence of stage change on river width was also observed in the lateral locations and the elevations of the strandlines. Hence, the lateral distance between the different strandlines is relatively small in narrow reaches (fig. 14B), whereas the lateral distance between the different strandlines was relatively large in wide reaches (fig. 14A). The relatively gentle channel-margin slopes in wide reaches thus leads to greater lateral extents and area of inundation during floods. Stage-discharge relations developed from the strandlines in narrow reaches, for example RM 23.5, are conversely much steeper than those developed from the strandlines in wide reaches, for example RM 69.15–69.59 (fig. 15). The RM 23.5 reach is in a narrow canyon (fig. 14B) that, at 25,000 ft3/s, has an average river width of ~180 feet (Randle and Pemberton, 1987). The RM 69.15–69.59 reach is in a wide valley (fig. 14A) that, at 25,000 ft3/s, has an average river width of ~362 feet (Randle and Pemberton, 1987).
Evaluation of Predicted Flood Stages from a Numerical Model
Stage-discharge relations developed during our study were compared with those developed as part of a predictive one-dimensional numerical model developed by Magirl and others (2008). Magirl and others (2008) calculated that modeled stage errors at the 68 percent confidence level were approximately ±1.3 feet or less for discharge less than 45,900 ft3/s, ±3.2
feet for discharges between 45,900 ft3/s and 88,300 ft3/s, and ±4.9 feet for discharge between 88,300 ft3/s and 208,000 ft3/s. Appendix 2 shows that at many locations the model output overestimated or underestimated stage for a given discharge relative to the strandlines surveyed in this study. Of the 15 pairs of stage-discharge relations, only 6 of the modeled outputs fell completely within the 68 percent-confidence-level error, suggesting that the reported model errors may be too low. The other nine comparisons had a difference in stage, at the maximum discharge surveyed for that site, ranging from ~3 to 9 feet. It is likely that, as discussed in Magirl and others (2008), these discrepancies resulted from the synthetic bathymetry as well as the constant Manning’s n roughness not being appropriate for all sites and discharges.
Conclusions The strandlines deposited during the largest floods that
have occurred over the last several hundred years in the Colorado River in Grand Canyon National Park were surveyed over 87 continuous river miles, and at three additional separate study sites. The dataset resulting from this effort provides the most comprehensive measure of the inundation extent of large floods along the Colorado River in Grand Canyon Nation Park ever conducted. Herein, we documented the extent of all large floods since 1884 and found no evidence for floods larger than the 210,000 ft3/s 1884 flood during the last several

22 Strandlines from Large Floods on the Colorado River in Grand Canyon National Park, Arizona
hundred years. Seven distinct strandlines associated with the 210,000 ft3/s, 170,000 ft3/s, 125,000 ft3/s, 108,000 ft3/s, 97,000 ft3/s, 52,500 ft3/s, and 45,000 ft3/s flood stages are preserved along the Colorado River in Marble and Grand Canyons. These peak discharges last occurred in this river segment during floods in 1884, 1921, 1957, 1958, 1983, 1986, and 2012, respectively. Our dataset thus provides a complete peak-flood stage record from the late 19th century through the present, spanning the ~140-year period before and after the construction of Glen Canyon Dam. This comprehensive dataset will, in general, provide a valuable resource for future investigations of the effects of floods on the Colorado River in Grand Canyon National Park, and specifically will allow for the verification of model-predicted flood stages. Because the peak-stage indicators that comprise strandlines are a finite and degrading resource (owing to weathering, hillslope processes, human disturbance, and future floods), these efforts should be regarded as time sensitive and not postponed in other rivers if similar detailed flood information is desired.
References CitedBaker, V.R., 1987, Paleoflood hydrology and extraordinary
flood events: Journal of Hydrology, v. 96, p. 79–99, https://doi.org/10.1016/0022-1694(87)90145-4.
Baker, V.R., 2000, Paleoflood hydrology and the estimation of extreme floods, in Wohl, E.E., ed., Inland flood hazards—Human, riparian, and aquatic communities: Cambridge University Press, p. 359–377.
Belknap, B., and Evans, L.B., 1969, Belknap’s waterproof Grand Canyon river guide: Evergreen, Colorado, Westwater Books, 96 p.
Birdseye, C.H., 1924, Plan and profile of Colorado River from Lees Ferry, Arizona, to Black Canyon, Arizona–Nevada, and Virgin River, Nevada: U.S. Geological Survey topographic maps, 21 sheets, scale 1:31,680.
Carothers, S.W., Brown, B.T., 1991, The Colorado River through Grand Canyon: Natural History and Human Change, University of Arizona Press, 235 p.
Chow, V.T., 1959, Open-Channel Hydraulics: New York, McGraw-Hill, Inc.
Dalrymple, T., and Benson, M.A., 1967, Measurement of peak discharge by the slope-area method: U.S. Geological Survey Techniques of Water-Resources Investigations, book 3, chap. A2, 12 p., http://pubs.usgs.gov/twri/twri3-a2/.
Davis, P.A., 2012, Airborne digital-image data for monitoring the Colorado River corridor below Glen Canyon Dam, Arizona, 2009—Image-mosaic production and comparison with 2002 and 2005 image mosaics: U.S. Geological Survey Open-File Report 2012-1139, 82 p., https://doi.org/10.3133/ofr20121139.
Draut, A.E., Rubin, D.M., Dierker, J.L., Fairley, H.C., Griffiths, R.E., Hazel, J.E., Jr., Hunter, R.E., Kohl, K., Leap, L.M., Nials, F.L., Topping, D.J., and Yeatts, M., 2005, Sedimentology and stratigraphy of the Palisades, Lower Comanche, and Arroyo Grande areas of the Colorado River corridor, Grand Canyon, Arizona: U.S. Geological Survey Scientific Investigations Report 2005-5072, 68 p., https://doi.org/10.3133/sir20055072.
Durning, L.E., Sankey, J.B., Davis, P.A., and Sankey, T.T., 2016, Four-band image mosaic of the Colorado River corridor downstream of Glen Canyon Dam in Arizona, derived from the May 2013 airborne image acquisition: U.S. Geological Survey Data Series 1027, https://doi.org/10.3133/ds1027.
Hereford, R., 1984, Driftwood in Stanton’s Cave—The case for temporary damming of the Colorado River at Nankoweap Creek in Marble Canyon, Grand Canyon National Park, Arizona, in Euler, R.C., ed., The archaeology, geology, and paleobiology of Stanton’s Cave, Grand Canyon National Park, Arizona: Grand Canyon, Arizona, Grand Canyon Natural History Association Monograph no. 6, p. 99–106.
Hereford, R., 1993, Entrenchment and widening of the upper San Pedro River, Arizona: Geological Society of America Special Paper 282, 46 p., https://doi.org/10.1130/SPE282-p1.
Hereford, R., 1996, Map showing surficial geology and geomorphology of the Palisades Creek archaeological area, Grand Canyon National Park, Arizona: U.S. Geological Survey Miscellaneous Investigations Series Map I-2449, scale 1:2,000, https://doi.org/10.3133/i2449.
Hereford, R., Burke, K.J., and Thompson, K.S., 1998, Map showing Quaternary geology and geomorphology of the Nankoweap Rapids Area, Marble Canyon, Arizona: U.S. Geological Survey Miscellaneous Investigations Series Map I-2608, scale 1:2,000, https://doi.org/10.3133/i2608.
Hereford, R., Burke, K.J., and Thompson, K.S., 2000, Map showing Quaternary geology and geomorphology of the Granite Park area, Grand Canyon, Arizona: U.S. Geological Survey Miscellaneous Investigations Series Map I-2662, scale 1:2,000, https://doi.org/10.3133/i2662.
Hereford, R., Fairley, H.C., Thompson, K.S., and Balsom, J.R., 1993, Surficial geology, geomorphology, and erosion of archeological sites along the Colorado River, eastern Grand Canyon, Grand Canyon National Park, Arizona: U.S. Geological Survey Open-File Report 93-517, 46 p., 4 pls., https://doi.org/10.3133/ofr93517.
Hereford, R., Thompson, K.S., Burke, K.J., and Fairley, H.C., 1996, Tributary debris fans and the late Holocene alluvial chronology of the Colorado River, eastern Grand Canyon, Arizona: Geological Society of America Bulletin, v. 108, p. 3–19, https://doi.org/10.1130/0016-7606(1996)108<0003:TDFATL>2.3.CO;2.

References Cited 23
House, P.K., and Baker, V.R., 2001, Paleohydrology of flash floods in small desert watersheds in western Arizona: Water Resources Research, v. 37, p. 1825–1839, https://doi.org/10.1029/2000WR900408.
House, P.K., Pearthree, P.A., and Klawon, J.E., 2002, Historical flood and paleoflood chronology of the Lower Verde River, Arizona—Stratigraphic evidence and related uncertainties, in House, P.K., Webb, R.H., Baker, V.R., and Levish, D.R., eds., Ancient floods, modern hazards—Principles and applications of paleoflood hydrology: Washington, D.C., American Geophysical Union, Water Science and Application Series, v. 5, p. 267–293, https://doi.org/10.1029/WS005p0267.
Hunt, C.B., 1959, Dating mining camps with tin cans and bottles: Geotimes, v. 3, no. 8, p. 8–34.
Hunt, C.B., 1975, Death Valley —Geology, ecology, archaeology: Berkeley, California, University of California Press, 234 p.
Hunt, C.B., and Mabey, D.R., 1966, Stratigraphy and structure, Death Valley, California: U.S. Geological Survey Professional Paper 494-A, 162 p., 3 pls., https://doi.org/10.3133/pp494A.
Howard, A., and Dolan, R., 1981, Geomorphology of the Colorado River in the Grand Canyon: Journal of Geology, v. 89, p. 269–298, https://doi.org/10.1086/628592.
Kaplinski, M., Hazel, J.E., Jr., Grams, P.E., Kohl, K., Buscombe, D.D., and Tusso, R.B., 2017, Channel mapping river miles 29–62 of the Colorado River in Grand Canyon National Park, Arizona, May 2009: U.S. Geological: Survey Open-File Report 2017-1030, 35 p., https://doi.org/10.3133/ofr20171030.
Kieffer, S.W., 1985, The 1983 hydraulic jump in Crystal Rapid—Implications for river-running and geomorphic evolution in the Grand Canyon: Journal of Geology, v. 93, n. 4, p. 385–406, https://doi.org/10.1086/628962.
Koenig, T.A., Bruce, J.L., O’Connor, J.E., McGee, B.D., Holmes, R.R., Hollins, Ryan, Forbes, B.T., Kohn, M.S., Schellekens, M.F., Martin, Z.W., and Peppler, M.C., 2016, Identifying and preserving high-water mark data: U.S. Geological Survey Techniques and Methods, book 3, chap. A24, 47 p., https://doi.org/10.3133/tm3A24.
Leopold, L.B., Wolman, M.G., and Miller, J.P., 1964, Fluvial processes in geomorphology: San Francisco, California, W.H. Freeman and Company, 544 p.
Magirl, C.S., Webb, R.H., and Griffiths, P.G., 2005, Changes in the water surface profile of the Colorado River in Grand Canyon, Arizona, between 1923 and 2000: Water Resources Research, v. 41, 10 p., https://doi.org/10.1029/2003WR002519.
Magirl, C. S., Breedlove, M. J., Webb, R. H., Griffiths, P. G., 2008, Modeling water-surface elevations and virtual shorelines for the Colorado River in Grand Canyon, Arizona: U.S. Geological Survey Scientific Investigations Report 2008–5075, 32 p., https://doi.org/10.3133/sir20085075.
Melis, T.S., ed., 2011, Effects of three high-flow experiments on the Colorado River ecosystem downstream from Glen Canyon Dam, Arizona: U.S. Geological Survey Circular 1366, 147 p., https://doi.org/10.3133/cir1366.
Nelson, L.H., 1968, Nail chronology as an aid to dating old buildings: American Association for State and Local History Technical Leaflet 48, Nashville, Tennessee, accessed July 1, 2020 at http://npshistory.com/publications/nail-chronology.pdf.
O’Connor, J.E., Ely, L.L., Wohl, E.E., Stevens, L.E., Melis, T.S., Kale, V.S., and Baker, V.R., 1994, A 4500-year record of large floods on the Colorado River in the Grand Canyon, Arizona: Journal of Geology, v. 102, p. 1–9, https://doi.org/10.1086/629644.
O’Connor, J.E. and Webb, R.H., 1988, Hydraulic modeling for paleoflood analysis, in Baker, V.R. Kochel, R.C., and Patton, P.C., eds., Flood geomorphology: New York, Wiley, p. 393–402.
Partridge, J. B., and Baker, V. R., 1987, Paleoflood hydrology of the Salt River, central Arizona: Earth Surface Processes and Landforms, v. 12, p. 109–125, https://doi.org/10.1002/esp.3290120202.
Randle, T.J., and Pemberton, E.L., 1987, Results and analysis of STARS (Sediment Transport and River Simulation model) modeling efforts of the Colorado River in Grand Canyon—Final report: Bureau of Reclamation, Glen Canyon Environmental Studies, 182 p.
Rantz, S.E., and others, 1982, Measurement and computation of streamflow—Volume 1—Measurement of stage and discharge: U.S. Geological Survey Water-Supply Paper 2175, 313 p., https://doi.org/10.3133/wsp2175.
Sabol, T.A., Griffiths, R.E., Topping, D.J., Mueller, E.R., Tusso, R.B., and Hazel, J.E., Jr., 2021, Surveyed peak-stage elevations, coordinates, and indicator data of strandlines from large floods on the Colorado River in Grand Canyon National Park, Arizona: U.S. Geological Survey Data Release, https://doi.org/10.5066/P9GIQ9ZN.
Schmidt, J.C., 1990, Recirculating flow and sedimentation in the Colorado River in Grand Canyon, Arizona: Journal of Geology, v. 98, p. 709–724, https://doi.org/10.1086/629435.
Schmidt, J.C. and Graf, J.B., 1990, Aggradation and degradation of alluvial sand deposits, 1965 to 1986, Colorado River, Grand Canyon National Park, Arizona, U.S. Geological Survey Professional Paper 1493, 74 p., https://doi.org/10.3133/pp1493.

24 Strandlines from Large Floods on the Colorado River in Grand Canyon National Park, Arizona
Stevens, L., 1983, The Colorado River in Grand Canyon: Flagstaff, Arizona, Red Lake Books, 115 p.
Topping, D.J., Rubin, D.M., and Vierra, L.E., Jr., 2000a, Colorado River sediment transport 1—Natural sediment supply limitation and the influence of Glen Canyon Dam: Water Resources Research, v. 36, p. 515–542, https://doi.org/10.1029/1999WR900285.
Topping, D.J., Rubin, D.M., Nelson, J.M., Kinzel, III, P.J., and Corson, I.C., 2000b, Colorado River sediment transport 2—Systematic bed-elevation and grain-size effects of sand supply limitation: Water Resources Research, v. 36, p. 543–570, https://doi.org/10.1029/1999WR900286.
Topping, D.J., Schmidt, J.C., and Vierra, L.E., Jr., 2003, Computation and analysis of the instantaneous-discharge record for the Colorado River at Lees Ferry, Arizona—May 8, 1921, through September 30, 2000: U.S. Geological Survey Professional Paper 1677, 118 p., https://doi.org/10.3133/pp1677.
Topping, D.J., Rubin, D.M., Grams, P.E., Griffiths, R.E., Sabol, T.A., Voichick, N., Tusso, R.B., Vanaman, K.M., and McDonald, R.R., 2010, Sediment transport during three controlled-flood experiments on the Colorado River downstream from Glen Canyon Dam, with implications for eddy-sandbar deposition in Grand Canyon National Park: U.S. Geological Survey Open-File Report 2010-1128, 111 p, https://doi.org/10.3133/ofr20101128.
Toulouse, J.H., 1971, Bottle makers and their marks: Caldwell, New Jersey, The Blackburn Press, 624 p.
U.S. Department of the Interior, 2011, Environmental assessment development and implementation of a protocol for high-flow experimental releases from Glen Canyon Dam, Arizona, 2011–2020: U.S. Department of the Interior, Bureau of Reclamation, Upper Colorado Region, 546 p., 5 chap., plus 8 app., accessed February 10, 2021, at https://www.usbr.gov/uc/envdocs/ea/gc/HFEProtocol/.
U.S. Department of the Interior, 2016, Glen Canyon Dam long-term experimental and management plan final environmental impact statement: U.S. Department of the Interior, Bureau of Reclamation, Upper Colorado Region, National Park Service, Intermountain Region, 8 chap., plus 17 app., accessed April 6, 2021, at http://ltempeis.anl.gov/documents/final-eis/.
U.S. Geological Survey, 2006, Colorado mileage system [Spatial database, GIS.BASE_GCMRC_TenthMile] 1st rev. ed.:Grand Canyon Monitoring and Research Center, accessed February 24, 2020, at http://www.gcmrc.gov/products/ims.
U.S. Geological Survey, 2020a, USGS 09429690 Colorado River above the Gila River near Yuma, Arizona, in USGS water data for the Nation: U.S. Geological Survey National Water Information System database, accessed February 24, 2020, at https://doi.org/10.5066/F7P55KJN. [Site information directly accessible at https://nwis.waterdata.usgs.gov/nwis/peak?site_no=09429690&agency_cd=USGS&format=html.]
U.S. Geological Survey, 2020b, USGS 09521000 Colorado River near Yuma, Arizona, in USGS water data for the Nation: U.S. Geological Survey National Water Information System Database, accessed February 24, 2020, at https://doi.org/10.5066/F7P55KJN. [Site information directly accessible at https://nwis.waterdata.usgs.gov/nwis/peak?site_no=09521000&agency_cd=USGS&format=html.]
Webb, R.H., 1996, Grand Canyon, a century of change, rephotography of the 1889–1890 Stanton expedition: Tucson, University of Arizona Press, 290 p.
Webb, R.H., Melis, T.S., and Valdez, R.A., 2002, Observations of environmental change in Grand Canyon, Arizona: U.S. Geological Survey Water-Resources Investigations Report 02-4080, 33 p., https://doi.org/10.3133/wri02408.
Webb, R.H., and Rathburn, S.L., 1988, Paleoflood hydrologic research in the southwestern United States, in Arid lands—Hydrology, scour, and water quality: Washington, D.C., National Research Council, Transportation Research Board, Record 1201, p. 9–21, accessed February 10, 2021, at http://archive.li.suu.edu/docs/ms130/AR/webb1.pdf.
Webb, R.H., Pringle, P.T. and Rink, G.R., 1989, Debris flows from tributaries of the Colorado River, Grand Canyon National Park, Arizona: U.S. Geological Survey Professional Paper 1492, 39 p.
Webb, R.H., Schmidt, J.C., Marzolf, G.R., and Valdez, R.A., eds., 1999, The 1996 controlled flood in Grand Canyon: Washington, D.C., American Geophysical Union, Geophysical Monograph 110.
Wells, T., 1998, Nail chronology—The use of technically derived features: Historical Archeology, v. 32, no. 2, p. 78–99, https://doi.org/10.1007/BF03374252.

Appendix 1. Peak-Stage Indicator Data 25
Appendix 1. Peak-Stage Indicator Data Collected Downstream from the Colorado River Near Grand Canyon, Arizona, Gaging Station
This appendix contains measurements of the locations of driftwood and trash deposited in strandlines along the Colorado River downstream from the Colorado River near Grand Canyon, Arizona, 09402500 gaging station (tables 1.1–1.3). These measurements were made by David Topping using a Garmin handheld “GPS II Plus” unit during May 2003, January–February 2008, and September 2008 at three study sites located on river left at Fossil Rapid (river mile [RM] ~125.5), river left at the mouth of Mohawk Canyon (RM ~171.9), and on the island at 209 Mile Rapid (RM ~209.4). Christopher Magirl helped make these measurements during January-February 2008. Subsequent to the acquisition of the global positioning system measurements in the field, the locations of those driftwood deposits visible in aerial photographs were adjusted where necessary using orthorectified imagery in Google Earth. These adjustments were typically less than several meters, with the locations of many deposits needing no adjustment. However, because the smaller driftwood deposits were not visible in the Google Earth imagery, and therefore their exact locations could not be confirmed, the uncertainty in the reported
locations of most of the driftwood and trash deposits in this appendix should be considered to be at least several meters. The driftwood and trash deposits measured at these study sites form distinct strandlines that record the extent of peak stage from as much as seven floods—interpreted to be the 1884, 1921, 1957, and 1958 pre-dam floods, the 1983 post-dam flood of record, and the 1996 or 2004 high-flow experiments (HFEs; all data were collected before the 2012 HFE). The largest of these floods (that is, the 1884 flood) likely completely overtopped the island at the 209 Mile Rapid study site (Magirl and others, 2008); consequently, no strandline from the 1884 flood was identified at the 209 Mile Rapid study site. Although the model of Magirl and others (2008) suggests that the 1921 flood also completely overtopped this island, highly decayed driftwood logs deposited at a stage higher than the likely peak stage of the 1957 flood were found on the island at the 209 Mile Rapid study site. Though these higher-elevation driftwood logs were likely deposited during the 1921 flood, it is not certain that these logs were deposited at peak stage during the 1921 flood because they do not form a coherent strandline.
Table 1.1. Fossil Rapid Study Site Survey Data.
[m, meter; NAD83, North American Datum of 1983]
Pointnumber
Measurement date
Interpreted year of flood
Latitude (NAD83)
Longitude (NAD83)
Notes
1 1/31/2008 1884 36.27179 −112.52518 Driftwood log (fig. 1.1)2 1/31/2008 1884 36.27145 −112.52538 Driftwood log 3 1/31/2008 1958 36.27106 −112.52538 Driftwood log 4 1/31/2008 1958 36.27109 −112.52532 Driftwood log 5 1/31/2008 1958 36.27113 −112.52523 Driftwood log 6 1/31/2008 1958 36.27120 −112.52514 Driftwood log 7 1/31/2008 1958 36.27127 −112.52512 Driftwood logs and woody debris 8 1/31/2008 1957 36.27136 −112.52519 Driftwood log 9 1/31/2008 1921 36.27143 −112.52530 Driftwood log ~0.5 m higher than likely 1957 strandline and ~1 m
lower than possible 1921 strandline10 1/31/2008 1957 36.27132 −112.52496 Driftwood milled lumber with round-head nails (fig. 1.2) and logs11 1/31/2008 1958 36.27127 −112.52473 Driftwood log 12 1/31/2008 1958 36.27126 −112.52462 Large driftwood log (figs. 1.3, 1.4)13 1/31/2008 1983 36.27110 −112.52445 Tamarisk driftwood deposit below elevation of large driftwood log at
point 1214 1/31/2008 1957 36.27157 −112.52474 Driftwood log overhanging Fossil Creek cutbank (fig. 1.4)15 1/31/2008 1957 36.27205 −112.52399 Continuation of likely 1957 strandline from point 1416 1/31/2008 1983 36.27100 −112.52469 Continuation of likely 1983 strandline from point 1317 1/31/2008 1983 36.27093 −112.52513 Continuation of likely 1983 strandline from point 1618 1/31/2008 1983 36.27085 −112.52542 Continuation of likely 1983 strandline from point 17
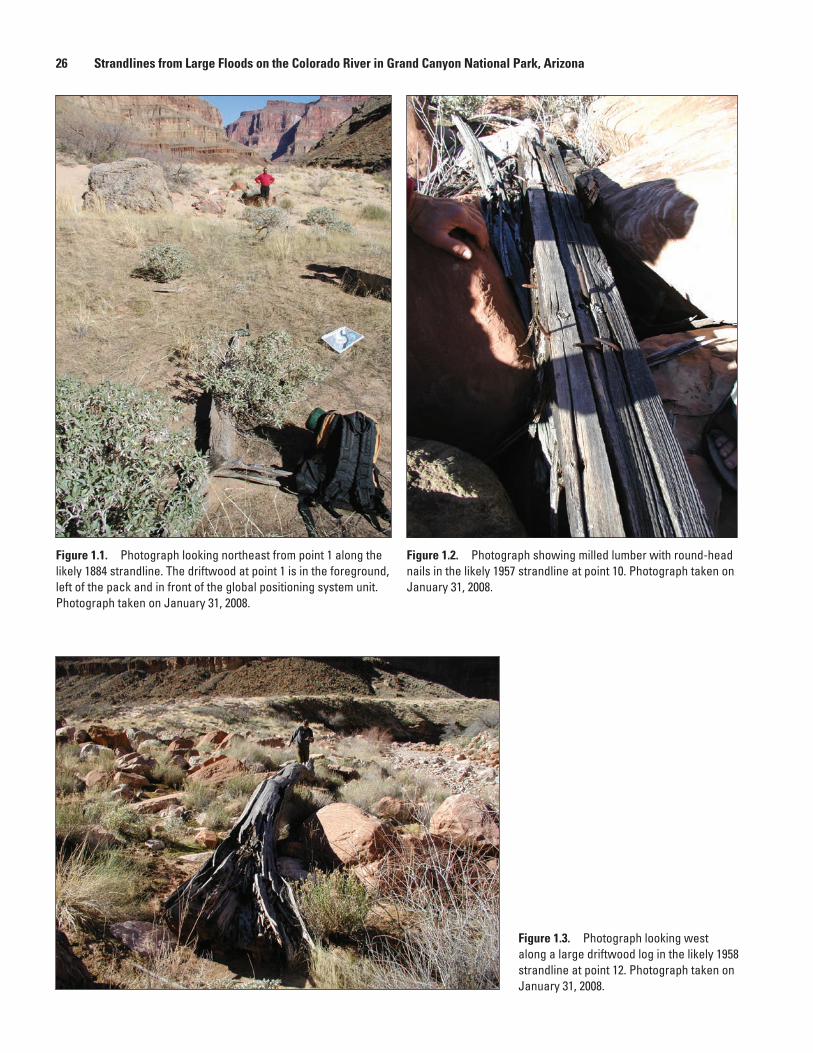
26 Strandlines from Large Floods on the Colorado River in Grand Canyon National Park, Arizona
Figure 1.1. Photograph looking northeast from point 1 along the likely 1884 strandline. The driftwood at point 1 is in the foreground, left of the pack and in front of the global positioning system unit. Photograph taken on January 31, 2008.
Figure 1.2. Photograph showing milled lumber with round-head nails in the likely 1957 strandline at point 10. Photograph taken on January 31, 2008.
Figure 1.3. Photograph looking west along a large driftwood log in the likely 1958 strandline at point 12. Photograph taken on January 31, 2008.

Appendix 1. Peak-Stage Indicator Data 27
Figure 1.4. Photograph looking northwest across Fossil Creek to driftwood in the likely 1957 strandline at point 14. Two people are standing next to this log for scale. The large driftwood log is the likely 1958 strandline at point 12 (fig. 1.3) in left foreground. Photograph taken on January 31, 2008.
Table 1.2. Mohawk Canyon Study Site Survey Data.
[Abbreviations: m, meter; NAD83, North American Datum of 1983]
Point Number
Measurement Date
Interpreted Year of Flood
Latitude (NAD83)
Longitude (NAD83)
Notes
19 9/2/2008 1884 36.23370 −112.96566 Driftwood log (figs. 1.5, 1.6)20 2/2/2008 1921 36.23355 −112.96661 Driftwood log21 2/2/2008 1884 36.23339 −112.96698 Driftwood railroad tie; top of tie flush with ground surface (fig. 1.7)22 2/2/2008 1884 36.23341 −112.96710 Driftwood with minor milled lumber; round-head nail in out-of-place
building structure at this location23 2/2/2008 1921 36.23367 −112.96692 Driftwood logs on bench below likely 1884 driftwood 24 2/2/2008 1957 36.23375 −112.96649 U-staples in milled-lumber driftwood (fig. 1.8)25 2/2/2008 1958 36.23397 −112.96657 Driftwood logs26 2/2/2008 1957 36.23410 −112.96686 Driftwood strandline near likely eddy separation point during peak of
1957 flood27 2/2/2008 1957 36.23406 −112.96693 Driftwood log28 2/2/2008 1921? 36.23396 −112.96708 Driftwood log29 2/2/2008 1957 36.23407 −112.96719 Driftwood log30 2/2/2008 1957 36.23412 −112.96735 Driftwood log31 2/2/2008 1957 36.23413 −112.96763 Driftwood log32 2/2/2008 1957 36.23420 −112.96783 Driftwood log33 2/2/2008 1957? 36.23422 −112.96741 Driftwood logs slightly lower than likely1957 strandline but higher
than likely 1958 strandline34 2/2/2008 1958 36.23438 −112.96728 Driftwood log35 2/2/2008 1958 36.23438 −112.96784 Driftwood log36 2/2/2008 1996 36.23453 −112.96779 East end of “double” driftwood strandline from likely 1996 and 1983
floods (fig. 1.9)37 2/2/2008 1996 36.23428 −112.96825 Driftwood log38 2/2/2008 1996 36.23447 −112.96652 Driftwood log
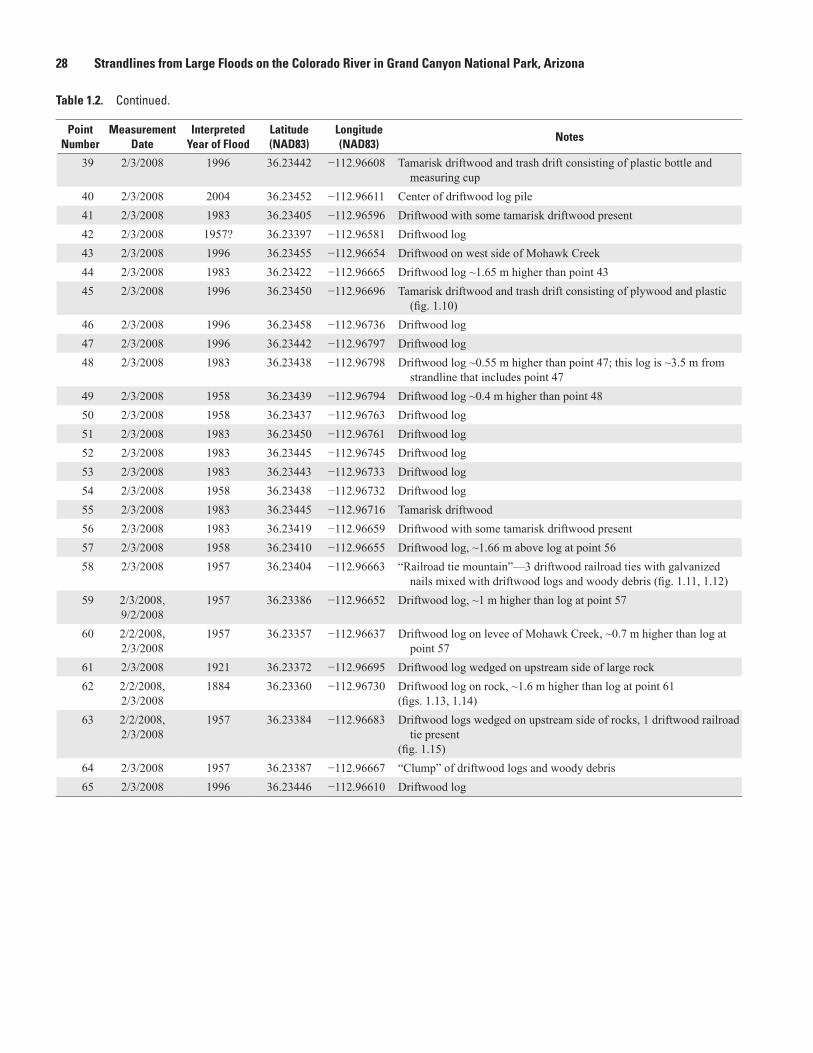
28 Strandlines from Large Floods on the Colorado River in Grand Canyon National Park, Arizona
Table 1.2. Continued.
Point Number
Measurement Date
Interpreted Year of Flood
Latitude (NAD83)
Longitude (NAD83)
Notes
39 2/3/2008 1996 36.23442 −112.96608 Tamarisk driftwood and trash drift consisting of plastic bottle and measuring cup
40 2/3/2008 2004 36.23452 −112.96611 Center of driftwood log pile 41 2/3/2008 1983 36.23405 −112.96596 Driftwood with some tamarisk driftwood present42 2/3/2008 1957? 36.23397 −112.96581 Driftwood log43 2/3/2008 1996 36.23455 −112.96654 Driftwood on west side of Mohawk Creek44 2/3/2008 1983 36.23422 −112.96665 Driftwood log ~1.65 m higher than point 4345 2/3/2008 1996 36.23450 −112.96696 Tamarisk driftwood and trash drift consisting of plywood and plastic
(fig. 1.10)46 2/3/2008 1996 36.23458 −112.96736 Driftwood log47 2/3/2008 1996 36.23442 −112.96797 Driftwood log48 2/3/2008 1983 36.23438 −112.96798 Driftwood log ~0.55 m higher than point 47; this log is ~3.5 m from
strandline that includes point 4749 2/3/2008 1958 36.23439 −112.96794 Driftwood log ~0.4 m higher than point 4850 2/3/2008 1958 36.23437 −112.96763 Driftwood log51 2/3/2008 1983 36.23450 −112.96761 Driftwood log52 2/3/2008 1983 36.23445 −112.96745 Driftwood log53 2/3/2008 1983 36.23443 −112.96733 Driftwood log54 2/3/2008 1958 36.23438 −112.96732 Driftwood log55 2/3/2008 1983 36.23445 −112.96716 Tamarisk driftwood56 2/3/2008 1983 36.23419 −112.96659 Driftwood with some tamarisk driftwood present57 2/3/2008 1958 36.23410 −112.96655 Driftwood log, ~1.66 m above log at point 5658 2/3/2008 1957 36.23404 −112.96663 “Railroad tie mountain”—3 driftwood railroad ties with galvanized
nails mixed with driftwood logs and woody debris (fig. 1.11, 1.12)59 2/3/2008,
9/2/20081957 36.23386 −112.96652 Driftwood log, ~1 m higher than log at point 57
60 2/2/2008,2/3/2008
1957 36.23357 −112.96637 Driftwood log on levee of Mohawk Creek, ~0.7 m higher than log at point 57
61 2/3/2008 1921 36.23372 −112.96695 Driftwood log wedged on upstream side of large rock62 2/2/2008,
2/3/20081884 36.23360 −112.96730 Driftwood log on rock, ~1.6 m higher than log at point 61
(figs. 1.13, 1.14)63 2/2/2008,
2/3/20081957 36.23384 −112.96683 Driftwood logs wedged on upstream side of rocks, 1 driftwood railroad
tie present(fig. 1.15)
64 2/3/2008 1957 36.23387 −112.96667 “Clump” of driftwood logs and woody debris65 2/3/2008 1996 36.23446 −112.96610 Driftwood log

Figure 1.5. Photograph looking upstream from the mouth of Mohawk Canyon on February 26, 1890, six years after the 1884 flood (Robert Brewster Stanton, image number 57-RS-613, courtesy of The National Archives). We interpreted the indicated likely peak stage of the 1884 flood on the basis of the upward limit of “fresh” sand deposits in this photograph. This elevation was traced in the field downstream to the partially buried driftwood log at point 19 and across Mohawk Creek to the location of the buried driftwood railroad tie at point 21.
Appendix 1. Peak-Stage Indicator Data 29
Figure 1.5. Photograph looking upstream from the mouth of Mohawk Canyon on February 26, 1890, six years after the 1884 flood (Robert Brewster Stanton, image number 57-RS-613, courtesy of The National Archives). We interpreted the indicated likely peak stage of the 1884 flood on the basis of the upward limit of “fresh” sand deposits in this photograph. This elevation was traced in the field downstream to the partially buried driftwood log at point 19 and across Mohawk Creek to the location of the buried driftwood railroad tie at point 21.
Figure 1.6. Photograph looking west showing a partially buried driftwood log in the likely 1884 strandline at point 19. The elevation of this log is similar to the elevation of the likely peak stage of the 1884 strandline indicated in figure 1.5. Photograph taken on February 3, 2008.
Figure 1.7. Photograph looking east showing a buried driftwood railroad tie in the likely 1884 strandline at point 21. The top of the tie is flush with the ground surface. A global positioning system unit is on the tie. The other driftwood and woody debris in the lower left was deposited at a similar elevation to the railroad tie. Photograph taken on February 2, 2008.

30 Strandlines from Large Floods on the Colorado River in Grand Canyon National Park, Arizona
Figure 1.8. Photograph showing U-staples in milled-lumber driftwood in the likely 1957 strandline at point 24. Photograph taken on February 2, 2008.
Figure 1.9. Photograph looking southwest along the likely 1996 strandline near point 36 showing the likely 1996 and 1983 double strandline. A U.S. Geological Survey scientist is standing on the likely 1983 strandline near point 48. Photograph taken on February 2, 2008.
Figure 1.9. Photograph looking southwest along the likely 1996 strandline near point 36 showing the likely 1996 and 1983 double strandline. A U.S. Geological Survey scientist is standing on the likely 1983 strandline near point 48. Photograph taken on February 2, 2008.
Figure 1.10. Photograph showing tamarisk driftwood and trash drift consisting of plywood and plastic in the likely 1996 strandline at point 45. Photograph taken on February 3, 2008.
Figure 1.11. Photograph looking west at “Railroad tie mountain” showing the likely 1957 strandline at point 58. Photograph taken on February 3, 2008.
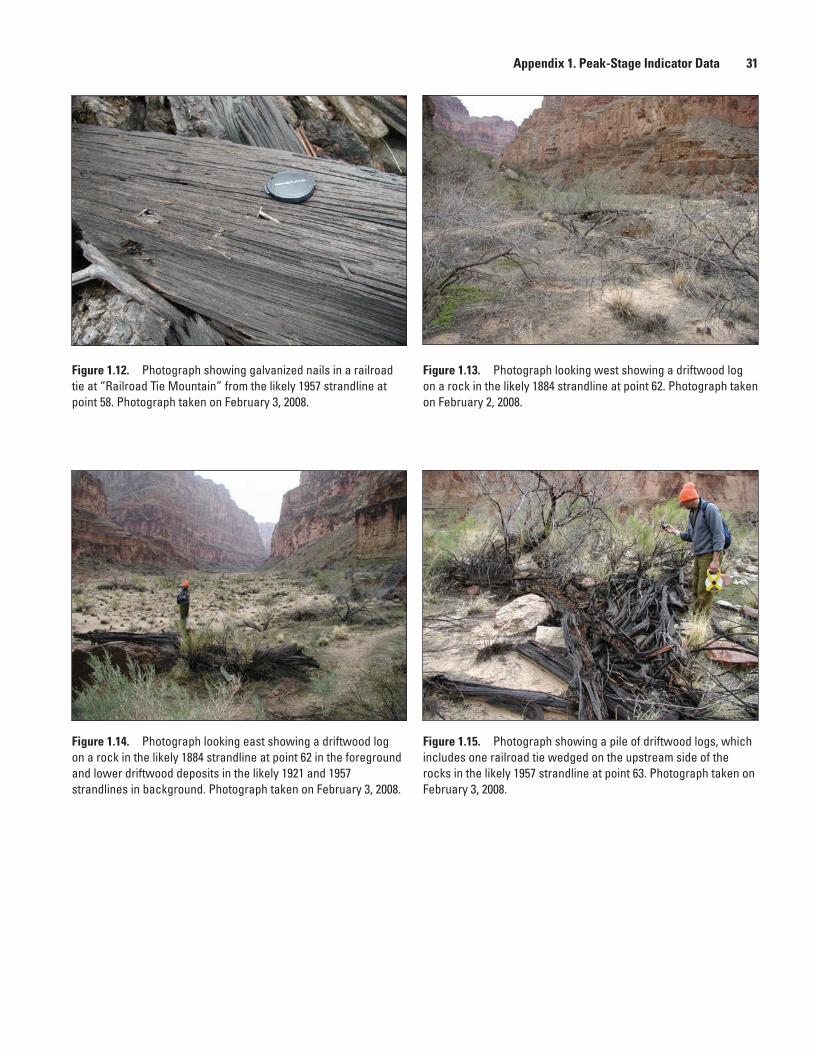
Appendix 1. Peak-Stage Indicator Data 31
Figure 1.12. Photograph showing galvanized nails in a railroad tie at “Railroad Tie Mountain” from the likely 1957 strandline at point 58. Photograph taken on February 3, 2008.
Figure 1.13. Photograph looking west showing a driftwood log on a rock in the likely 1884 strandline at point 62. Photograph taken on February 2, 2008.
Figure 1.14. Photograph looking east showing a driftwood log on a rock in the likely 1884 strandline at point 62 in the foreground and lower driftwood deposits in the likely 1921 and 1957 strandlines in background. Photograph taken on February 3, 2008.
Figure 1.15. Photograph showing a pile of driftwood logs, which includes one railroad tie wedged on the upstream side of the rocks in the likely 1957 strandline at point 63. Photograph taken on February 3, 2008.
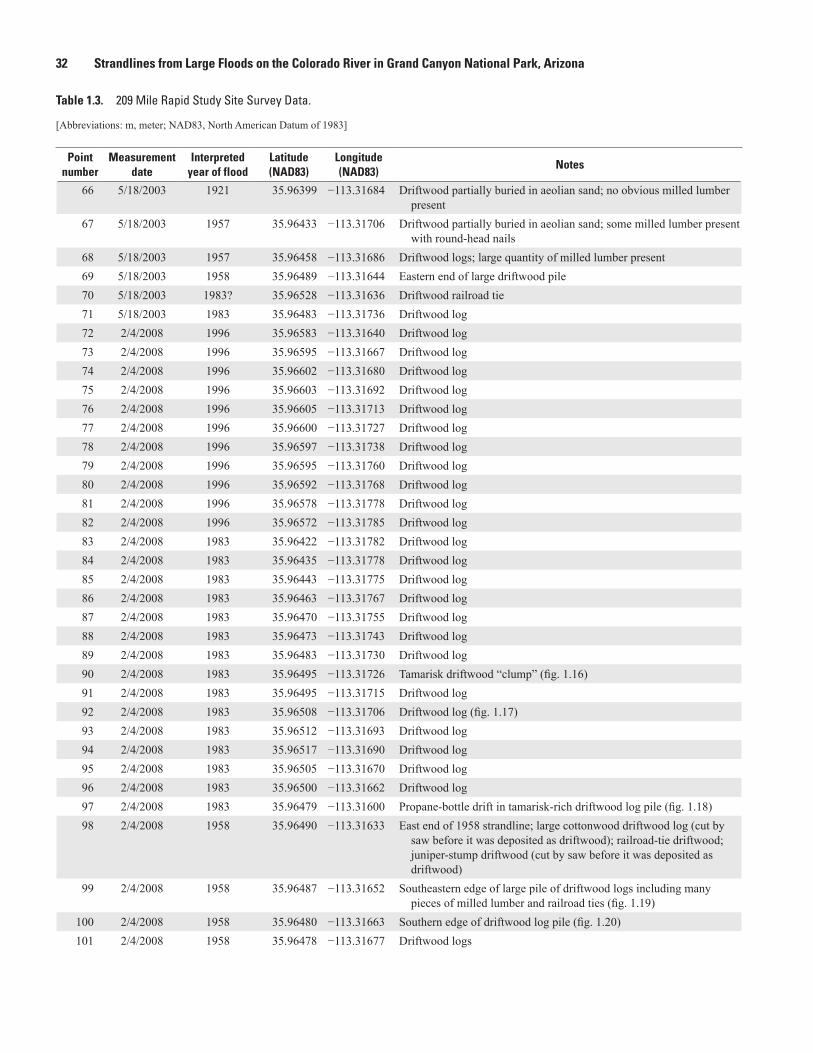
32 Strandlines from Large Floods on the Colorado River in Grand Canyon National Park, Arizona
Table 1.3. 209 Mile Rapid Study Site Survey Data.
[Abbreviations: m, meter; NAD83, North American Datum of 1983]
Point number
Measurement date
Interpreted year of flood
Latitude (NAD83)
Longitude (NAD83)
Notes
66 5/18/2003 1921 35.96399 −113.31684 Driftwood partially buried in aeolian sand; no obvious milled lumber present
67 5/18/2003 1957 35.96433 −113.31706 Driftwood partially buried in aeolian sand; some milled lumber present with round-head nails
68 5/18/2003 1957 35.96458 −113.31686 Driftwood logs; large quantity of milled lumber present69 5/18/2003 1958 35.96489 −113.31644 Eastern end of large driftwood pile 70 5/18/2003 1983? 35.96528 −113.31636 Driftwood railroad tie71 5/18/2003 1983 35.96483 −113.31736 Driftwood log72 2/4/2008 1996 35.96583 −113.31640 Driftwood log73 2/4/2008 1996 35.96595 −113.31667 Driftwood log74 2/4/2008 1996 35.96602 −113.31680 Driftwood log75 2/4/2008 1996 35.96603 −113.31692 Driftwood log76 2/4/2008 1996 35.96605 −113.31713 Driftwood log77 2/4/2008 1996 35.96600 −113.31727 Driftwood log78 2/4/2008 1996 35.96597 −113.31738 Driftwood log79 2/4/2008 1996 35.96595 −113.31760 Driftwood log80 2/4/2008 1996 35.96592 −113.31768 Driftwood log81 2/4/2008 1996 35.96578 −113.31778 Driftwood log82 2/4/2008 1996 35.96572 −113.31785 Driftwood log83 2/4/2008 1983 35.96422 −113.31782 Driftwood log84 2/4/2008 1983 35.96435 −113.31778 Driftwood log85 2/4/2008 1983 35.96443 −113.31775 Driftwood log86 2/4/2008 1983 35.96463 −113.31767 Driftwood log87 2/4/2008 1983 35.96470 −113.31755 Driftwood log88 2/4/2008 1983 35.96473 −113.31743 Driftwood log89 2/4/2008 1983 35.96483 −113.31730 Driftwood log90 2/4/2008 1983 35.96495 −113.31726 Tamarisk driftwood “clump” (fig. 1.16)91 2/4/2008 1983 35.96495 −113.31715 Driftwood log92 2/4/2008 1983 35.96508 −113.31706 Driftwood log (fig. 1.17)93 2/4/2008 1983 35.96512 −113.31693 Driftwood log94 2/4/2008 1983 35.96517 −113.31690 Driftwood log95 2/4/2008 1983 35.96505 −113.31670 Driftwood log96 2/4/2008 1983 35.96500 −113.31662 Driftwood log97 2/4/2008 1983 35.96479 −113.31600 Propane-bottle drift in tamarisk-rich driftwood log pile (fig. 1.18)98 2/4/2008 1958 35.96490 −113.31633 East end of 1958 strandline; large cottonwood driftwood log (cut by
saw before it was deposited as driftwood); railroad-tie driftwood; juniper-stump driftwood (cut by saw before it was deposited as driftwood)
99 2/4/2008 1958 35.96487 −113.31652 Southeastern edge of large pile of driftwood logs including many pieces of milled lumber and railroad ties (fig. 1.19)
100 2/4/2008 1958 35.96480 −113.31663 Southern edge of driftwood log pile (fig. 1.20)101 2/4/2008 1958 35.96478 −113.31677 Driftwood logs

Appendix 1. Peak-Stage Indicator Data 33
Table 1.3. Continued.
Point number
Measurement date
Interpreted year of flood
Latitude (NAD83)
Longitude (NAD83)
Notes
102 2/4/2008 1958 35.96487 −113.31689 Southwestern edge of driftwood log pile 103 5/18/2003,
2/4/20081958 35.96480 −113.31692 Hollow driftwood log in which many cans and glass bottles were
placed by boaters. These bottles were presumably deposited near here during large floods and the subsequently moved a short distance to this log. Bottles include: green glass “gum turpentine” bottle with 1939 copyright, and glass bottles with 1946 and 1947 dates on the heels of these bottles (figs. 1.21, 1.22)
104 2/4/2008 1958 35.96494 −113.31700 Driftwood logs south of large driftwood pile (fig. 1.23)105 2/4/2008 1958 35.96480 −113.31721 Driftwood logs106 2/4/2008 1958 35.96463 −113.31731 Driftwood log107 2/4/2008 1958 35.96450 −113.31744 Railroad-tie driftwood; can with bullet hole in strandline near here
(fig. 1.24)108 2/4/2008 1958 35.96425 −113.31752 Driftwood log109 2/4/2008 1958 35.96380 −113.31767 Driftwood logs at western end of likely 1958 strandline (fig. 1.25)110 2/4/2008 1957 35.96327 −113.31728 Driftwood log at western end of likely 1957 strandline111 2/4/2008 1957 35.96347 −113.31718 Driftwood log112 2/4/2008 1957 35.96355 −113.31720 Partially buried driftwood logs and metal-can drift (figs. 1.26, 1.27)113 2/4/2008 1957 35.96372 −113.31725 Driftwood log114 2/4/2008 1957 35.96387 −113.31737 Driftwood log115 2/4/2008 1957 35.96408 −113.31738 Driftwood log116 2/4/2008 1957 35.96427 −113.31729 Driftwood logs117 2/4/2008 1957 35.96428 −113.31712 Southern edge of driftwood log pile located to southwest of “largest
driftwood log pile” at next few points118 2/4/2008 1957 35.96450 −113.31692 Long driftwood log at southwestern margin of largest driftwood log
pile on island119 2/4/2008 1957 35.96453 −113.31678 Southern edge of largest driftwood log pile on island120 2/4/2008 1957 35.96460 −113.31667 Southern edge of largest driftwood pile on island; driftwood log pile
contains numerous milled lumber and railroad ties (fig. 1.28); pile deposited on upstream margin of flat sandy bench containing partially buried, highly decayed likely older driftwood (fig. 1.29); 1940s-1950s Owens-Illinois “Duraglas” glass bottle present in pile (fig. 1.30)
121 2/4/2008 1957 35.96462 −113.31653 Southeastern edge of largest driftwood log pile on island122 2/4/2008 1957 35.96450 −113.31643 Western edge of driftwood log pile to the southeast of the
aforementioned “largest driftwood pile”123 2/4/2008 1957 35.96444 −113.31631 Driftwood logs124 2/4/2008 1957 35.96430 −113.31623 Driftwood logs at eastern end of likely 1957 strandline125 2/4/2008 1921 35.96396 −113.31688 15 m-long highly decayed partially buried driftwood log
(fig. 1.31)126 2/4/2008 1921 35.96388 −113.31664 Highly decayed partially buried driftwood log 127 2/4/2008 1921 35.96337 −113.31678 15 m-long partially buried, highly decayed driftwood log (fig. 1.32)128 2/4/2008 1921 35.96332 −113.31658 Small, 1-m-long driftwood log 129 2/4/2008 1957 35.96300 −113.31661 Group of 4 driftwood logs at south end of island 130 2/4/2008 1957 35.96468 −113.31658 Driftwood logs including partially buried Anchor-Hocking L-876 3-1/8
ounce. ink-well bottle with cork top —cork top connected via metal wire to cloth applicator (figs. 1.33, 1.34); plywood driftwood present in strandline near this bottle

34 Strandlines from Large Floods on the Colorado River in Grand Canyon National Park, Arizona
Figure 1.16. Photograph showing a tamarisk driftwood “clump” in the likely 1983 strandline at point 90. Photograph taken on February 4, 2008.
Figure 1.17. Photograph looking east showing the likely 1983 strandline from point 92. Photograph taken on February 4, 2008.
Figure 1.17. Photograph looking east showing the likely 1983 strandline from point 92. Photograph taken on February 4, 2008.
Figure 1.18. Photograph showing a propane bottle drift deposited within a tamarisk-rich driftwood pile in the likely 1983 strandline at point 97. Photograph taken on February 4, 2008.
Figure 1.19. Photograph looking west from point 99 showing a large pile of driftwood logs in the likely 1958 strandline. Pieces of milled lumber and railroad ties are present within this pile. Photograph taken on February 4, 2008.

Appendix 1. Peak-Stage Indicator Data 35
Figure 1.20. Photograph looking south from point 100 showing driftwood logs in the likely 1957 strandline. This part of the likely 1957 strandline slopes downward into the east secondary channel of the Colorado River around this island. Photograph taken on February 4, 2008.
Figure 1.21. Photograph showing cans and bottles in the hollow driftwood log at point 103. Although this driftwood log was likely deposited during the 1958 flood, the bottles were likely collected and moved by boaters from other parts of the 1958 strandline and the nearby 1957 strandline. The green “gum turpentine” bottle has 1939 copyright on bottle label, other bottles have 1946 and 1947 dates on heels. The green turpentine bottle was gone when this log was revisited in 2008. Photograph taken on March 18, 2003.
Figure 1.22. Photograph looking west along the hollow driftwood log shown in figure 1.21. Some cans and bottles are still present. Note rusty spike in log in foreground. Photograph taken on February 4, 2008.

36 Strandlines from Large Floods on the Colorado River in Grand Canyon National Park, Arizona
Figure 1.23. Photograph looking east showing a large driftwood pile in the likely 1958 strandline north of point 104; point 104 is just out of field of view on right side of photograph. This pile contains milled lumber and railroad ties. Photograph taken on February 4, 2008.
Figure 1.24. Photograph showing driftwood and can with a bullet hole in the likely 1958 strandline at point 107. Photograph taken on February 4, 2008.
Figure 1.24. Photograph showing driftwood and can with a bullet hole in the likely 1958 strandline at point 107. Photograph taken on February 4, 2008.
Figure 1.25. Photograph looking southwest from point 109 showing driftwood logs in the western end of the likely 1958 strandline. Photograph taken on February 4, 2008.
Figure 1.26. Photograph showing a can drift at point 112 in the likely 1957 strandline. Photograph taken on February 4, 2008.
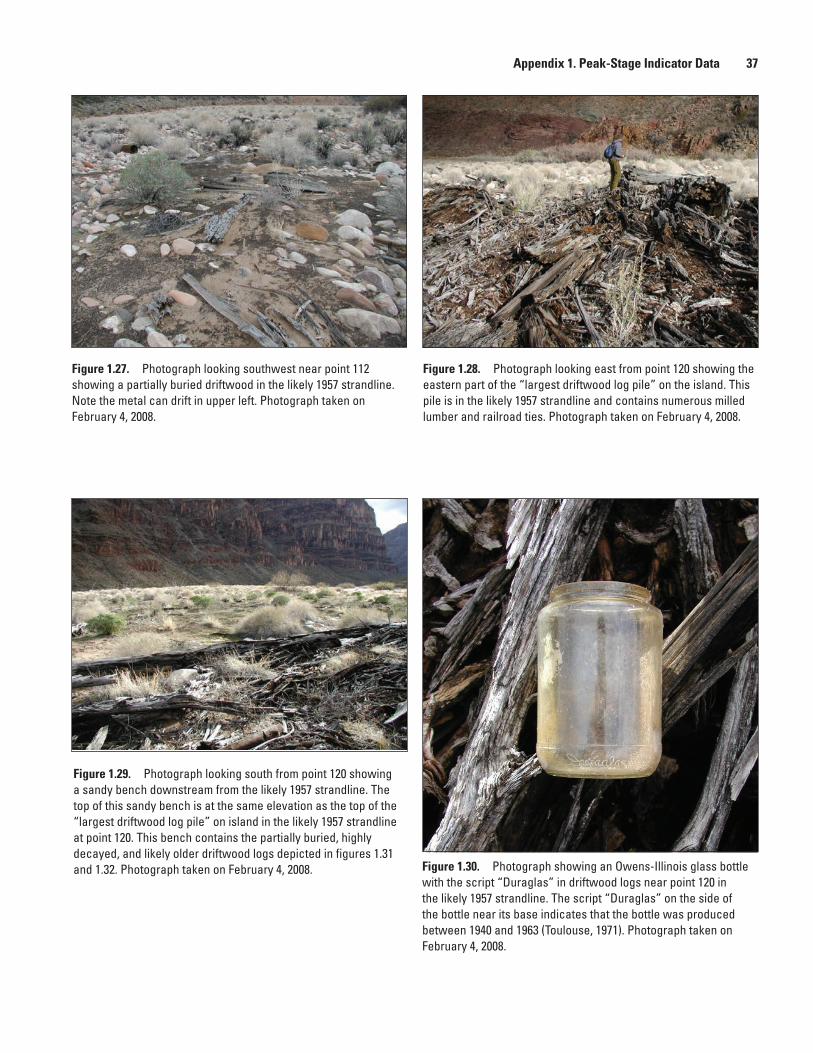
Appendix 1. Peak-Stage Indicator Data 37
Figure 1.27. Photograph looking southwest near point 112 showing a partially buried driftwood in the likely 1957 strandline. Note the metal can drift in upper left. Photograph taken on February 4, 2008.
Figure 1.28. Photograph looking east from point 120 showing the eastern part of the “largest driftwood log pile” on the island. This pile is in the likely 1957 strandline and contains numerous milled lumber and railroad ties. Photograph taken on February 4, 2008.
Figure 1.29. Photograph looking south from point 120 showing a sandy bench downstream from the likely 1957 strandline. The top of this sandy bench is at the same elevation as the top of the “largest driftwood log pile” on island in the likely 1957 strandline at point 120. This bench contains the partially buried, highly decayed, and likely older driftwood logs depicted in figures 1.31 and 1.32. Photograph taken on February 4, 2008. Figure 1.30. Photograph showing an Owens-Illinois glass bottle
with the script “Duraglas” in driftwood logs near point 120 in the likely 1957 strandline. The script “Duraglas” on the side of the bottle near its base indicates that the bottle was produced between 1940 and 1963 (Toulouse, 1971). Photograph taken on February 4, 2008.

38 Strandlines from Large Floods on the Colorado River in Grand Canyon National Park, Arizona
Figure 1.31. Photograph showing a 15-meter-long, partially buried, and highly decayed driftwood log in the likely 1921 strandline at point 125. Photograph taken on February 4, 2008.
Figure 1.32. Photograph showing a 15-meter-long, partially buried, and highly decayed driftwood log in the likely 1921 strandline at point 127. Photograph taken on February 4, 2008.
Figure 1.32. Photograph showing a 15-meter-long, partially buried, and highly decayed driftwood log in the likely 1921 strandline at point 127. Photograph taken on February 4, 2008.
Figure 1.33. Photograph showing driftwood logs and a partially buried Anchor-Hocking L-876 3-1/8 ounce ink-well bottle with a cork top in the likely 1957 strandline at point 130. Photograph taken on February 4, 2008.
Figure 1.34. Photograph showing a side view of the Anchor-Hocking L-876 3-1/8 ounce ink-well bottle in figure 1.33. The cork top attached via a metal wire to a cloth applicator visible inside the bottle. The heel of the bottle has a number 3 to the left of the Anchor-Hocking symbol and the number 5 to the right of this symbol. Photograph taken on February 4, 2008.

Appendix 2. Comparison of Stage-Discharge Relations 39
Appendix 2. Comparison of Stage-Discharge Relations Generated from the Strandlines with Those Generated by the Model of Magirl and Others (2008)
The reported stages in the model-measurement comparisons in this appendix are relative to the reference stage associated with a discharge of 8,000 cubic feet per second (ft3/s). The strandline-generated stage-discharge relations generated in these plots are provided in table 3 in the main text.
0
50,000
100,000
150,000
200,000
250,000River mile 3.55–4.13 River mile 8.08–8.12
0
50,000
100,000
150,000
200,000
250,000River mile 11.43–11.46
Dis
char
ge, i
n cu
bic
feet
per
sec
ond
River mile 11.59–11.64
0 10 20 30 40 50 60Stage, in feet
0 10 20 30 40 50 60
Magirl model output RM 3.5Peak-stage indicator
Magirl model output RM 4.2
EXPLANATION
Peak-stage indicatorMagirl model output
EXPLANATION
Peak-stage indicatorMagirl model output
EXPLANATION
Peak-stage indicatorMagirl model output
EXPLANATION
men20-3155_fig03.01
Figure 2.1. Plots showing comparisons between stage-discharge relations based on surveyed peak-stage indicators and stage-discharge relations predicted by the numerical model of Magirl and others (2008). RM, river mile.

40 Strandlines from Large Floods on the Colorado River in Grand Canyon National Park, Arizona
0
50,000
100,000
150,000
200,000
250,000River mile 44.32–44.62 River mile 53.89–53.92
0
50,000
100,000
150,000
200,000
250,000River mile 63.93–64.02
Dis
char
ge, i
n cu
bic
feet
per
sec
ond
River mile 68.29–68.83
0 10 20 30 40 50 60Stage, in feet
0 10 20 30 40 50 60
0
50,000
100,000
150,000
200,000
250,000River mile 23.33 River mile 32.19–32.23
Magirl model output RM 44.33Peak-stage indicator
Magirl model output RM 44.62
EXPLANATION
Peak-stage indicatorMagirl model output
EXPLANATION
Peak-stage indicatorMagirl model output
EXPLANATION
Peak-stage indicatorMagirl model output
EXPLANATION
Peak-stage indicatorMagirl model output
EXPLANATIONPeak-stage indicatorMagirl model output
EXPLANATION
men20-3155_fig03.02
Figure 2.1. Continued.

Appendix 2. Comparison of Stage-Discharge Relations 41
0
50,000
100,000
150,000
200,000
250,000River mile 75.83–75.90 River mile 77.41–77.44
Dis
char
ge, i
n cu
bic
feet
per
sec
ond
Stage, in feet
0 10 20 30 40 50 60
0
50,000
100,000
150,000
200,000
250,000River mile 70.36–70.44 River mile 73.91–73.99
Stage, in feet
Peak-stage indicatorMagirl model output
EXPLANATIONPeak-stage indicatorMagirl model output
EXPLANATION
Peak-stage indicatorMagirl model output
EXPLANATIONPeak-stage indicatorMagirl model output
EXPLANATION
men20-3155_fig03.03
0 10 20 30 40 50 60
River mile 83.42-83.43
0
50,000
100,000
150,000
200,000
250,000
Peak-stage indicatorMagirl model output
EXPLANATION
Figure 2.1. Continued.
Appendix 2. Comparison of Stage-Discharge Relations


Moffett Field Publishing Service Center, California Manuscript approved for publication May 12, 2021 Edited by John Mark Brigham Layout and design by Kimber Petersen Illustration support by JoJo Mangano

Sabol and others—Strandlines from
Large Floods on the Colorado River in Grand Canyon N
ational Park, Arizona—
Scientific Investigations Report 2021–5048
ISSN 2328-0328 (online)https://doi.org/10.3133/sir20215048