site characterization by seismic interferometry method · in conventional reflection seismology....
TRANSCRIPT
Geotechnical and Geophysical Site Characterization – Huang & Mayne (eds)© 2008 Taylor & Francis Group, London, ISBN 978-0-415-46936-4
Site characterization by seismic interferometry method
T. Matsuoka & K. OnishiDepartment of Civil and Earth Resources Engineering, Kyoto University
K. ShiraishiJapan Petroleum Exploration Co., Ltd
T. AizawaSuncoh Consultants, Co., Ltd
ABSTRACT: Seismic interferometry is a new signal processing technique for generating Green’s function byapplying cross-correlation operations to observed seismic data at different receiver locations. This method canbe applied to imaging subsurface structures with observing underground noise in natural or in social life. Wecarried out a field survey using Digi-pulse, air-knocker hit, and a truck running vibrations in tunnel. A surveyline with 96 receivers was located on the top of hill just above the tunnel. Obtained subsurface images are clearenough to identify subsurface structures. Our experimental results strongly support applicability of the seismicinterferometry to subsurface imaging from the passive data of the noise by social activities. The interferometricimaging will be useful in site characterization for applications in civil engineering, environment, and disasterpreventions.
1 INSTRUCTION
Reflection seismology has been widely applied toinvestigate subsurface structures not only in the oil andgas industry but also for the purpose of civil engineer-ing, environmental and disaster prevention (McCannet al., 1997, Brouwer & Helbig, 1998). These canbe called the site characterization using seismic sur-vey. However, this method requires artificial explosivesources such as dynamite on the ground surface inorder to produce the elastic waves which propagateunderground and return the geological information tothe surface.A great deal of research has been attemptedin order to develop appropriate artificial sources for thedata acquisition environments.
In this paper a methodology of reflection seismol-ogy without using artificial sources is proposed with afield example. Including small shakes that cannot befelt by humans, underground motions occur almostdaily due to the activity of earthquakes and volca-noes. The idea of using these underground motionsas sources for reflection seismology can be realizedusing the theory of seismic interferometry (Lobkis,and Weaver, 2001, Wapenaar, 2003, Wapenaar, andFokkema, 2006, Shiraishi, et al., 2007).
In the theory of seismic interferometry, the Green’sfunction of the seismic wave propagation between
two receiver positions can be reconstructed by tak-ing the cross-correlation of observed records at thesetwo different places. This basic theorem suggests thatwe can synthesize reflection seismic data betweentwo positions on the ground surface through thecross-correlation of transmitted seismic data froman underground seismic source which is observed atthese two places. In this case there are no restrictionsregarding the cause of these seismic vibrations. Gen-eral relations between the reflection and transmissionresponse were studied by Claerbout (1968) for the one-dimensional case and by Wapenaar et al. (2004) for thethree-dimensional case.
In this study, we try to image the subsurface struc-tures from the aftershocks observed at theTottori-seibuearthquake in Japan. We observed 22 aftershocks with255 receivers along the road. Then pseudo shot datawere synthesized at each receiver location. Conven-tional data processing was applied to the synthesizedseismic data and finally a seismic section was obtainedwith which we could interpret subsurface structures.In conclusion, this technique is easily applied to otherseismological events and it is useful for geophysicalsurveys using the continuous monitoring system. Thismethodology will become more important for disasterprevention and Earth science in the future. Under theground, there always exist various kinds of vibrations
891

Figure 1. Conceptual diagrams of seismic interferometry.
generated by social life, such as the running of trains,subways, or cars and civil constructions and factoriesin addition to natural noises such as earthquakes orvolcanic activities. We adopt the “Seismic interferom-etry” to obtain the reflection responses. The methodintends to image the subsurface geological structureusing the noise as a transmission wave field observedon the surface and to simulate the pseudo shot recordsas many as the number of the receivers correspondingto data of reflection seismic survey.
2 SEISMIC INTERFEROMETRY
The relationship between the transmission responseand the reflection response in the one dimensional mul-tilayer structure was developed by Claerbout (1968),and this idea was extended to the three dimensionalcase by Wapenaar (2003). Once the seismic wavefields from buried sources are observed at two placesA and B on the surface of ground, we can simulatethe pseudo reflection wave field which correspondsto the recorded seismogram at B of the source gener-ated at A (Fig. 1). The expression of the relationshipof the transmission response T and the reflectionresponse R due to a source at xi is as follows(Wapenaar 2003).
Where T (xA, xi, t) and T (xB, xi, t) are the transmis-sion wave fields at points A and B from the subsurfacesource point xi respectively. R(xA, xB, t) is the reflec-tion wave field corresponding to the receiver at xA andthe source is placed at xB. The symbol ∗ denotes con-volution. Using this relationship, the reflection wavefield can be simulated by the cross-correlation of bothtransmission wave fields. The first term of left-handside of equation (1) is causal part and the second termis the non-causal part. The second term of the right-hand side of equation (1) expresses the summationof the correlation results for each source in case thattwo or more buried sources exist. When there existrandom vibration in the subsurface, the relationshipbetween the reflection responses and the transmission
Figure 2. Two layers model with concave structure fornumerical simulation.
responses can be expressed as follows (Wapenaar,2003).
This Eq. (2) is similar to Eq. (1), however, cross-correlation appears only once between observed trans-mission responses Tobs(xA, t) andTobs(xB,t). When wepassively observe underground wavefield for the seis-mic interferometry, it is necessary to acquire the dataas long as possible in order to improved signal to noiseratio.
In equation (1) and (2), the combination ofreceivers, xA and xB can be exchanged. It means that wecan simulate the shot records at each receiver positionas many as the number of receivers deployed on a sur-vey line, which are correspondent to the shot recordsin conventional reflection seismology. This is a greatadvantage of this method. After we obtain the sim-ulated shot records, we can process them accordingto the data processing in the conventional reflectionseismology.
3 NUMERICAL SIMULATION
We show here some numerical examples to simulateshot records by cross-correlation from transmissionrecords due to moving impulsive sources and ran-dom vibration in the ground. We use a model witha simple concave (syncline) structure, whose velocityis 1,500 m/s in an upper layer and 2,500 m/s in a lowerlayer (Fig. 2). 71 receivers are located on the surfacefrom x = 2,600 m to x = 5,400 m with 40 m spacing. Insimulation of moving sources, Ricker wavelet (25 Hz)is used as source wavelet at each source position;201 shots with 30 m interval between x = 1,000 mand x = 7,000 m, at z = 500 m in depth. In simula-tion of random vibration, band-limited random noiseis generated at each source position.
Then, we simulate shot records by cross-correlationfrom the observed transmission records. For the mov-ing impulsive sources, we obtain the simulated shotrecord by summing the all cross-correlation resultsof each transmission record. For the random vibra-tion observation, we use 30-minute data. Figure 3shows the simulated shot records calculated by cross-correlation from moving impulsive sources (a), andrandom vibration (b), and true reflection response (c)
892
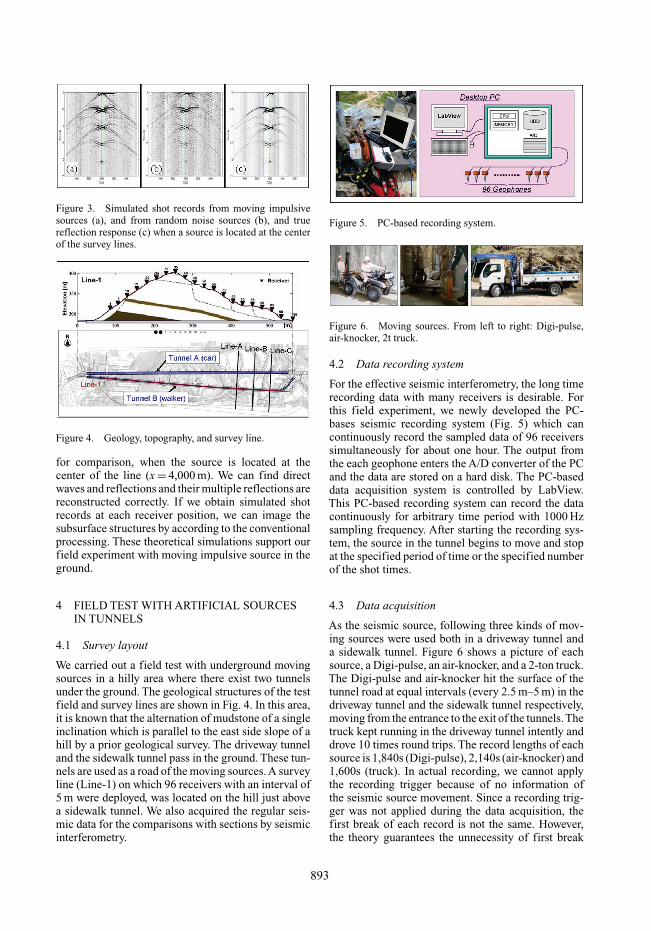
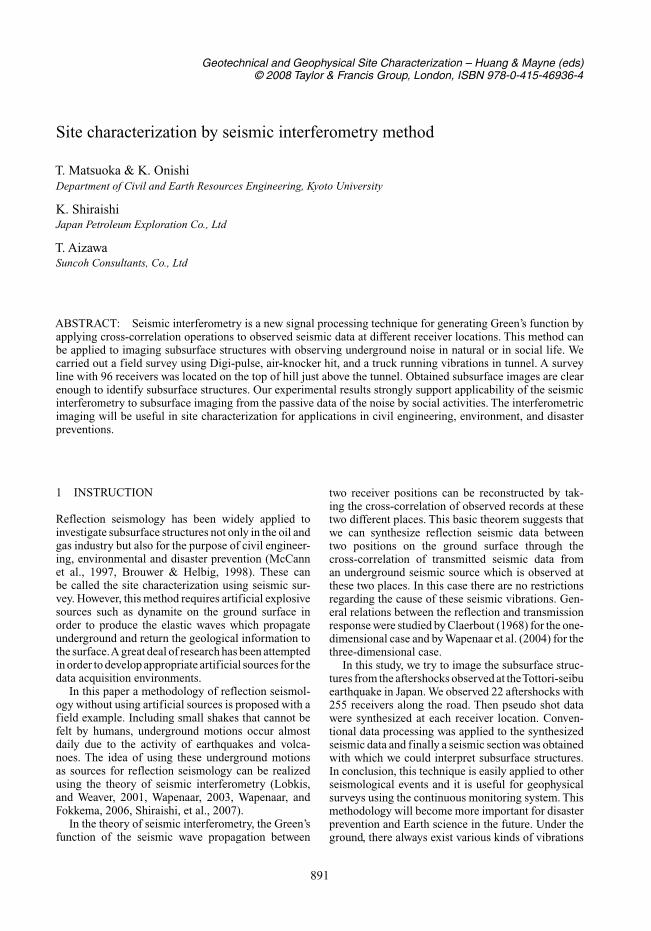
Figure 3. Simulated shot records from moving impulsivesources (a), and from random noise sources (b), and truereflection response (c) when a source is located at the centerof the survey lines.
Figure 4. Geology, topography, and survey line.
for comparison, when the source is located at thecenter of the line (x = 4,000 m). We can find directwaves and reflections and their multiple reflections arereconstructed correctly. If we obtain simulated shotrecords at each receiver position, we can image thesubsurface structures by according to the conventionalprocessing. These theoretical simulations support ourfield experiment with moving impulsive source in theground.
4 FIELD TEST WITH ARTIFICIAL SOURCESIN TUNNELS
4.1 Survey layout
We carried out a field test with underground movingsources in a hilly area where there exist two tunnelsunder the ground. The geological structures of the testfield and survey lines are shown in Fig. 4. In this area,it is known that the alternation of mudstone of a singleinclination which is parallel to the east side slope of ahill by a prior geological survey. The driveway tunneland the sidewalk tunnel pass in the ground. These tun-nels are used as a road of the moving sources. A surveyline (Line-1) on which 96 receivers with an interval of5 m were deployed, was located on the hill just abovea sidewalk tunnel. We also acquired the regular seis-mic data for the comparisons with sections by seismicinterferometry.
Figure 5. PC-based recording system.
Figure 6. Moving sources. From left to right: Digi-pulse,air-knocker, 2t truck.
4.2 Data recording system
For the effective seismic interferometry, the long timerecording data with many receivers is desirable. Forthis field experiment, we newly developed the PC-bases seismic recording system (Fig. 5) which cancontinuously record the sampled data of 96 receiverssimultaneously for about one hour. The output fromthe each geophone enters the A/D converter of the PCand the data are stored on a hard disk. The PC-baseddata acquisition system is controlled by LabView.This PC-based recording system can record the datacontinuously for arbitrary time period with 1000 Hzsampling frequency. After starting the recording sys-tem, the source in the tunnel begins to move and stopat the specified period of time or the specified numberof the shot times.
4.3 Data acquisition
As the seismic source, following three kinds of mov-ing sources were used both in a driveway tunnel anda sidewalk tunnel. Figure 6 shows a picture of eachsource, a Digi-pulse, an air-knocker, and a 2-ton truck.The Digi-pulse and air-knocker hit the surface of thetunnel road at equal intervals (every 2.5 m–5 m) in thedriveway tunnel and the sidewalk tunnel respectively,moving from the entrance to the exit of the tunnels.Thetruck kept running in the driveway tunnel intently anddrove 10 times round trips. The record lengths of eachsource is 1,840s (Digi-pulse), 2,140s (air-knocker) and1,600s (truck). In actual recording, we cannot applythe recording trigger because of no information ofthe seismic source movement. Since a recording trig-ger was not applied during the data acquisition, thefirst break of each record is not the same. However,the theory guarantees the unnecessity of first break
893
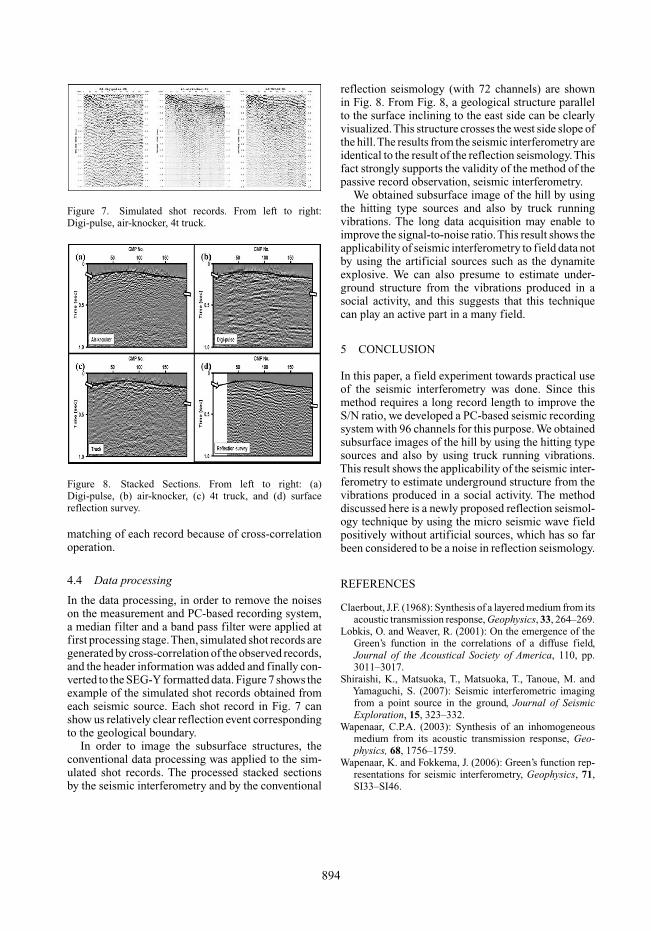
Figure 7. Simulated shot records. From left to right:Digi-pulse, air-knocker, 4t truck.
Figure 8. Stacked Sections. From left to right: (a)Digi-pulse, (b) air-knocker, (c) 4t truck, and (d) surfacereflection survey.
matching of each record because of cross-correlationoperation.
4.4 Data processing
In the data processing, in order to remove the noiseson the measurement and PC-based recording system,a median filter and a band pass filter were applied atfirst processing stage.Then, simulated shot records aregenerated by cross-correlation of the observed records,and the header information was added and finally con-verted to the SEG-Y formatted data. Figure 7 shows theexample of the simulated shot records obtained fromeach seismic source. Each shot record in Fig. 7 canshow us relatively clear reflection event correspondingto the geological boundary.
In order to image the subsurface structures, theconventional data processing was applied to the sim-ulated shot records. The processed stacked sectionsby the seismic interferometry and by the conventional
reflection seismology (with 72 channels) are shownin Fig. 8. From Fig. 8, a geological structure parallelto the surface inclining to the east side can be clearlyvisualized.This structure crosses the west side slope ofthe hill.The results from the seismic interferometry areidentical to the result of the reflection seismology.Thisfact strongly supports the validity of the method of thepassive record observation, seismic interferometry.
We obtained subsurface image of the hill by usingthe hitting type sources and also by truck runningvibrations. The long data acquisition may enable toimprove the signal-to-noise ratio.This result shows theapplicability of seismic interferometry to field data notby using the artificial sources such as the dynamiteexplosive. We can also presume to estimate under-ground structure from the vibrations produced in asocial activity, and this suggests that this techniquecan play an active part in a many field.
5 CONCLUSION
In this paper, a field experiment towards practical useof the seismic interferometry was done. Since thismethod requires a long record length to improve theS/N ratio, we developed a PC-based seismic recordingsystem with 96 channels for this purpose. We obtainedsubsurface images of the hill by using the hitting typesources and also by using truck running vibrations.This result shows the applicability of the seismic inter-ferometry to estimate underground structure from thevibrations produced in a social activity. The methoddiscussed here is a newly proposed reflection seismol-ogy technique by using the micro seismic wave fieldpositively without artificial sources, which has so farbeen considered to be a noise in reflection seismology.
REFERENCES
Claerbout, J.F. (1968): Synthesis of a layered medium from itsacoustic transmission response, Geophysics, 33, 264–269.
Lobkis, O. and Weaver, R. (2001): On the emergence of theGreen’s function in the correlations of a diffuse field,Journal of the Acoustical Society of America, 110, pp.3011–3017.
Shiraishi, K., Matsuoka, T., Matsuoka, T., Tanoue, M. andYamaguchi, S. (2007): Seismic interferometric imagingfrom a point source in the ground, Journal of SeismicExploration, 15, 323–332.
Wapenaar, C.P.A. (2003): Synthesis of an inhomogeneousmedium from its acoustic transmission response, Geo-physics, 68, 1756–1759.
Wapenaar, K. and Fokkema, J. (2006): Green’s function rep-resentations for seismic interferometry, Geophysics, 71,SI33–SI46.
894