siting wind power v 112 - pspb.org
TRANSCRIPT
Siting Wind Power Lesson Plan 1
Siting Wind Power: Wind Power Curves & Community Considerations (Lesson Plan) (Assessing the Feasibility of Wind Power for Pennsylvania)
Suggested Grade Level 9-12 Overview This lesson allows students to analyze and understand a variety of curves that describe the power extracted from the wind by a variety of commercially produced wind turbines. Students will then join construction manager, Ed DeJarnette on-site at the Bear Creek Wind Farm, near Wilkes-Barre, PA, to talk shop about the details of siting and constructing a large-scale wind farm. Students will investigate the major factors influencing wind farm siting such as: wind speed, direction and turbulence; state and federal incentives and turbine design. Students will utilize site specific topographic maps and political boundary data to evaluate and make recommendations to their class and community about potential sites for future wind development. The suggested time required for the entire lesson sequence is four to five (4-5) 50-minute class periods.
Standard Statements: 3.2.10 C Apply the elements of scientific inquiry to solve problems. 3.4.10 B Analyze energy sources and transfers of heat. 3.5.12 C Analyze atmospheric energy transfers.
3.8.10 A Analyze the relationship between societal demands and scientific and technological enterprises. 3.8.10 B Analyze how human ingenuity and technological resources satisfy specific human needs and improve the quality of life. 4.2.10 A Explain that renewable and nonrenewable resources supply energy and materials. 4.2.12 B Analyze factors affecting the availability of renewable and nonrenewable resources. 4.8.10 B Analyze the relationship between the use of natural resources and sustaining our society. 4.8.10 C Analyze how human activities may cause changes in an ecosystem.
Content Objectives Students will know that
1. Wind is an important form of energy because it is clean, safe and perpetually renewable.
2. Important variables in how much power we can extract from the wind are its speed, direction, turbulence.
3. There are geographic, social and economic constraints affecting the placement and viability of wind farms.
Process Objectives Students will be able to
1. Describe how wind is generated by the uneven solar heating of the earth.
Siting Wind Power Lesson Plan 2
2. Analyze the transformations of energy involved in electricity generation by wind machines.
3. Discuss how the electricity created by wind is delivered to the power grid. 4. Analyze a wind power curve. 5. Compare a variety of wind turbines based on their power output. 6. Assess the feasibility of using wind energy as a resource in the geographic region
of the students’ learning community.
Assessment Strategies 1. Evidence of student understanding based on completion of written handout
materials and participation in classroom discussions. 2. Evaluation of student recommendations for local siting of a wind farm.
Materials Part 1:
• Teacher computer with internet connectivity • Projection equipment • Websites:
o Google Earth http://earth.google.com/
o Wind Speed and Power Maps: http://www.awstruewind.com/inner/windmaps/Pennsylvania.htm http://www.eere.energy.gov/windandhydro/windpoweringamerica/
• Pennsylvania map (could be electronic via Google Earth or another mapping software)
• Student Handouts • Clipboards or writing surfaces for student groups • Readings for homework
o AWEA: Wind Power Outlook 2005 (http://www.awea.org/pubs/documents/Outlook 2005.pdf)
o “Bumper Crop Holds Up Wind Farm” from: (http://www.timesleader.com/mld/thetimesleader/2006/01/10/business/13589597.htm)
Part 2: • Teacher computer with internet connectivity • Projection equipment • Bear Creek video sequences 1 & 2 (see Multimedia Resources) • Student Handouts • PowerPoint presentations reorganized to suit your needs as lecture notes
o Powerinthewind.ppt o Siting Activities.ppt (optional)
Part 3: • Teacher computer with internet connectivity • Projection equipment • Bear Creek video sequence 3 (see Multimedia Resources)

Siting Wind Power Lesson Plan 3
• Student Handouts • Student computers with internet connectivity • Website for Wind Siting Master Resources (PDF document from the American
Wind Energy Association http://www.awea.org/pubs/factsheets/Resources&References-April2005.pdf)
Multimedia Resources Bear Creek Wind Farm Video Sequences (QuickTime movies):
• Sequence 1: Specifications & Construction 1. Foundation [0:45] 2. Building the Road [0:30] 3. Bringing in Parts [0:43] 4. Specs and Process [1:10] 5. Blade onto Tower [0:54] 6. Environmental Concerns [1:23]
• Sequence 2: Capacity Factor & Power Output 1. Topography [0:48] 2. Turbine Production [1:01] 3. Turbine Type and Specs [0:33] 4. Power Grid [0:49]
• Sequence 3: Community Concerns 1. Private vs. Public Land [2:01] 2. Owners [0:26]
PowerPoint presentations:
• Powerinthewind.ppt • Siting Activities.ppt (optional) • Kidwindbasicwind.ppt
Procedures Part 1: What’s Up with Wind in Pennsylvania? (30 minutes, Homework)
1. Before students begin comparing the power outputs of commercial wind turbines, share the Beaufort scale (example on page 1 of the student handout) with students and allow them to quickly go outdoors and make some observations about the current wind conditions using the scale.
2. Return students to the classroom to share and confirm students’ ideas about how wind is generated.
3. Assign reading of the American Wind Energy Association’s publication, “Wind Power Outlook 2005” and a public commentary on the Bear Creek Wind Farm and discussion questions on page 2 of the student handout for homework (see Materials for web sites).

Siting Wind Power Lesson Plan 4
Part 2: Wind Power Curves (1, 50 min Class Period) 1. Before giving a short lecture on wind power curves and capacity factor, review
the recent homework assignment and discussion questions. 2. Allow students to assist you in finding the Bear Creek site just south of Wilkes-
Barre, PA. (Google Earth is a great free resource to utilize, http://earth.google.com/) in order to provide the geographic context for video of an interview and tour of Bear Creek with the site’s former Construction Manager, Mr. Ed DeJarnette.
3. Share the first two video sequences of the Bear Creek Wind Farm tour with the class (approximately 10 minutes, in 10 segments). [A variation could be to allow students to view the QuickTime movies in small groups, but this would require internet connectivity and student computers].
4. Focus students on the construction of the wind turbine and the factors that could affect its ability to produce power and give a short lecture on the basics of the wind power curve (see Teacher Notes for Part 2) and how it is useful in making siting decisions for wind turbines.
5. Allow students to work collaboratively to analyze some wind power curves and answer questions in Part 2 of the Student Handout .
Part 3: Siting a Wind Farm: Feasibility for All? (3, 50-minute Class Periods)
1. Share Bear Creek video sequence 3 (approximately 2-1/2 minutes) with students. 2. Gather students’ thoughts on the video and introduce the task of evaluating local
wind resources to make a recommendation about the feasibility of siting a wind farm near their school.
3. Allow students to get into assessment teams of 3 to 4 students. They will use the student handout as a “getting-started” guide for their wind resource assessments.
4. Depending upon student needs, you will be involved on an “as needed” basis to facilitate data collection strategies for student teams’ wind resource assessment.
5. Allot students a full class period each to evaluate potential sites, collect data, and present their recommendations to their classmates.
Credit: Michael Milligan and DOE/NR Extensions (1 or 2, 50-minute Class Periods)
1. Generate your own wind power curves using small wind turbines that your students construct. Resources and lessons on building table-top wind turbines can be found at: http://www.kidwind.org/materials/buildingwindmills.html.
2. Present your siting recommendations to a local governing body like your town council as a sustainable energy alternative.
Acknowledgments Many of the materials and photographs included in the background section and part 2 of the student handout have been adapted from the lesson, “Wind Power Curves” with written permissions from the Kidwind Project, 2093 Sargent Avenue, Saint Paul, MN 55105 http://www.kidwind.org Kidwind’s production of this document (12/05 Version 1.0) was supported in part by the National Renewable Energy Laboratory through subcontract LEE-5-55877-01.
Siting Wind Power Teacher Notes 1
Siting Wind Power: Wind Power Curves & Community Considerations (Teacher Notes) (Assessing the Feasibility of Wind Power for Pennsylvania)
Notes on Part 1 A Beaufort scale is included on the next page that may be copied onto transparency film to be used as an overhead, or the electronic version may be found at: http://www.mountwashington.org/discovery/arcade/wind/beaufort.html. Students have a copy on page 1 of the student handout. Notes on Part 2 The power curves section of this lesson comes recommended by the designer at KidWind for students who have had a significant introduction to wind energy. The ideal circumstance would be after they have built and tested their own small wind turbines and done some power output testing. See KidWind Blade Design Lesson (www.kidwind.org) to get an idea about constructing your own turbines and running some experiments like this. The following section helps to describe the purpose of the wind power curve activity and was accessed from the American Wind Energy Association’s website: http://www.awea.org.
How Does A Wind Turbine's Energy Production Differ from Its Power Production?1
While wind turbines are most commonly classified by their rated power at a certain rated wind speed, annual energy output is actually a more important measure for evaluating a wind turbine's value at a given site.
Energy = Power x Time
This means that the amount of time a wind turbine produces a given power output is just as important as the level of power output itself. And wind turbine operators don't get paid for producing a large amount of power for a few minutes (except in rare circumstances.) They get paid by the number of kilowatt-hours (kWh) their turbines produce in a given time period.
The best crude indication of a wind turbine's energy production capabilities is its rotor diameter--which determines its swept area, also called the capture area. A wind turbine may have an impressive "rated power" of 100 kW, but if its rotor diameter is so small that it can't capture that power until the wind speed reaches 40 mph (18 m/s), the wind turbine won't rack up enough time at high power output to produce a reasonable annual energy output.
1 American Wind Energy Association. http://www.awea.org/faq/basicen.html, accessed 8 July 2005.
Siting Wind Power Teacher Notes 2
Expected energy output per year can be reliably calculated when the wind turbine's capacity factor at a given average annual wind speed is known. The capacity factor is simply the wind turbine's actual energy output for the year divided by the energy output if the machine operated at its rated power output for the entire year. A reasonable capacity factor would be 0.25 to 0.30. A very good capacity factor would be 0.40.
NOTE: Capacity factor is very sensitive to the average wind speed. When using the capacity factor to calculate estimated annual energy output, it is extremely important to know the capacity factor at the average wind speed of the intended site.
Lacking a calculated capacity factor, the machine's power curve can actually provide a crude indication of the annual energy output of any wind turbine. Using the power curve, one can find the predicted power output at the average wind speed at the wind turbine site. By calculating the percentage of the rated power (RP) produced at the average wind speed, one can arrive at a rough capacity factor (RCF) for the wind turbine at that site. And by multiplying the rated power output by the rough capacity factor by the number of hours in a year, (8,760), a very crude annual energy production can be estimated. For example, for a 100 kW turbine producing 20 kW at an average wind speed of 15 mph, the calculation would be:
100 kW (RP) x .20 (RCF) = 20 kW x 8760 hours = 175,200 kWh
Actually, because of the effect of the cubic power law, the annual energy output will probably be somewhat higher than this figure at most windy sites. This is determined by the wind power distribution, which shows the percentage of time the wind blows at various wind speeds over the course of an average year. Lacking precise data on a given site, there are two common wind distributions used to make energy calculations for wind turbines: the Weibull distribution and a variant of the Weibull called the Rayleigh distribution that is thought to be more accurate at sites with high average wind speeds.
Wind Power Curves in a Nutshell This is a quick look at the basics behind a wind power output curve. For a deeper analysis you can examine some of the documents in the resource section and take a peek at the PowerPoint presentation put together by Walt Musial, a senior engineer.
Wind power curves describe how much power a particular wind turbine can extract from the wind at a variety of different wind speeds and regimes. While these curves have a similar shape, they are specific to a particular turbine and offer insights when choosing a wind turbine for a individual location.
Siting Wind Power Teacher Notes 3
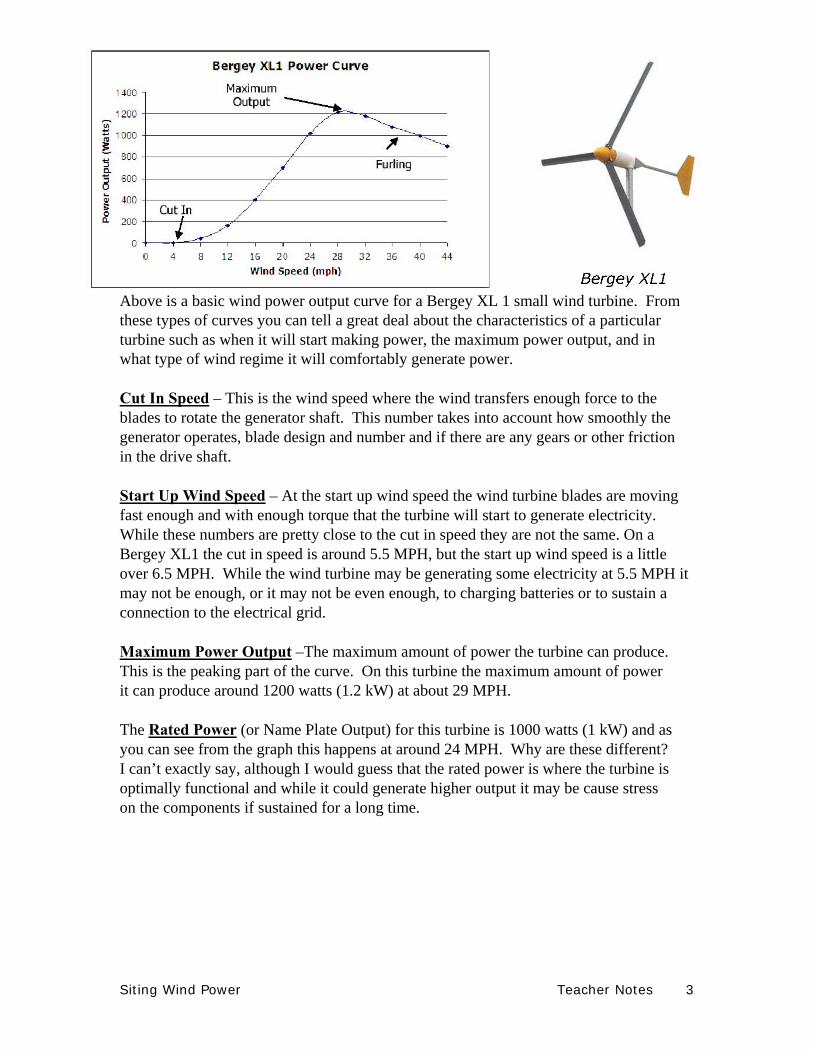
Above is a basic wind power output curve for a Bergey XL 1 small wind turbine. From these types of curves you can tell a great deal about the characteristics of a particular turbine such as when it will start making power, the maximum power output, and in what type of wind regime it will comfortably generate power.
Cut In Speed – This is the wind speed where the wind transfers enough force to the blades to rotate the generator shaft. This number takes into account how smoothly the generator operates, blade design and number and if there are any gears or other friction in the drive shaft.
Start Up Wind Speed – At the start up wind speed the wind turbine blades are moving fast enough and with enough torque that the turbine will start to generate electricity. While these numbers are pretty close to the cut in speed they are not the same. On a Bergey XL1 the cut in speed is around 5.5 MPH, but the start up wind speed is a little over 6.5 MPH. While the wind turbine may be generating some electricity at 5.5 MPH it may not be enough, or it may not be even enough, to charging batteries or to sustain a connection to the electrical grid.
Maximum Power Output –The maximum amount of power the turbine can produce. This is the peaking part of the curve. On this turbine the maximum amount of power it can produce around 1200 watts (1.2 kW) at about 29 MPH.
The Rated Power (or Name Plate Output) for this turbine is 1000 watts (1 kW) and as you can see from the graph this happens at around 24 MPH. Why are these different? I can’t exactly say, although I would guess that the rated power is where the turbine is optimally functional and while it could generate higher output it may be cause stress on the components if sustained for a long time.
Siting Wind Power Teacher Notes 4
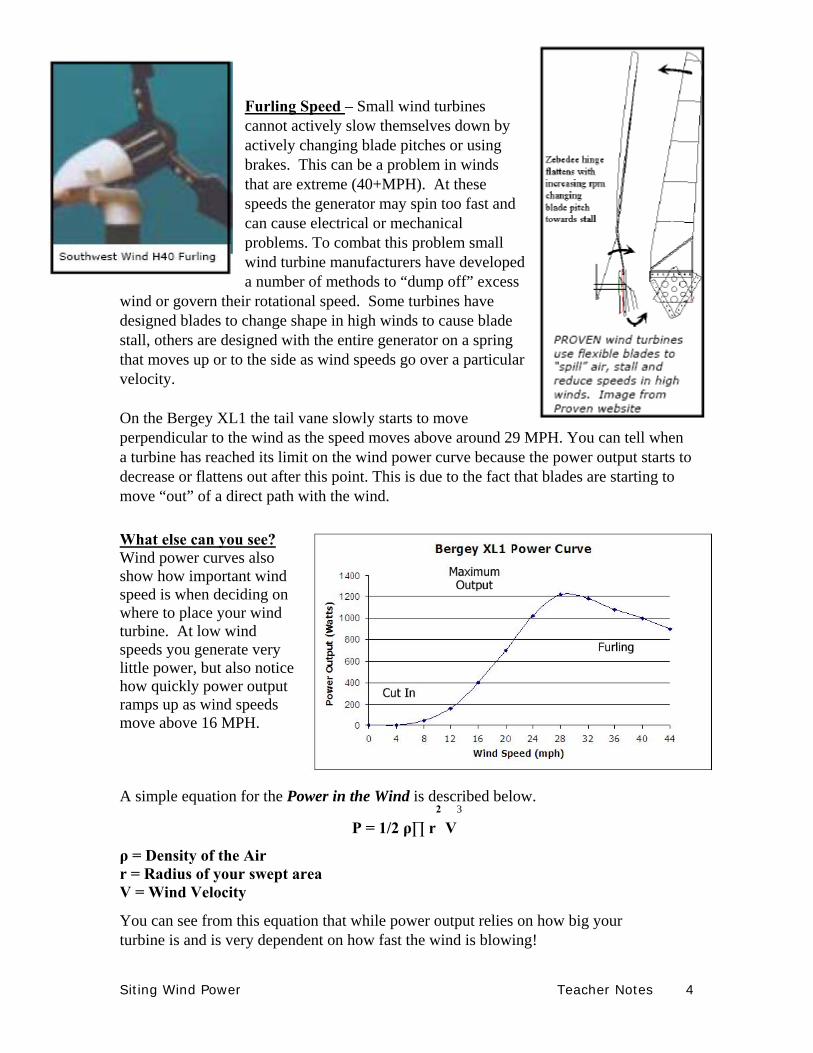
Furling Speed – Small wind turbines cannot actively slow themselves down by actively changing blade pitches or using brakes. This can be a problem in winds that are extreme (40+MPH). At these speeds the generator may spin too fast and can cause electrical or mechanical problems. To combat this problem small wind turbine manufacturers have developed a number of methods to “dump off” excess
wind or govern their rotational speed. Some turbines have designed blades to change shape in high winds to cause blade stall, others are designed with the entire generator on a spring that moves up or to the side as wind speeds go over a particular velocity.
On the Bergey XL1 the tail vane slowly starts to move perpendicular to the wind as the speed moves above around 29 MPH. You can tell when a turbine has reached its limit on the wind power curve because the power output starts to decrease or flattens out after this point. This is due to the fact that blades are starting to move “out” of a direct path with the wind. What else can you see? Wind power curves also show how important wind speed is when deciding on where to place your wind turbine. At low wind speeds you generate very little power, but also notice how quickly power output ramps up as wind speeds move above 16 MPH. A simple equation for the Power in the Wind is described below.
P = 1/2 ρ∏ r2
V3
ρ = Density of the Air r = Radius of your swept area V = Wind Velocity
You can see from this equation that while power output relies on how big your turbine is and is very dependent on how fast the wind is blowing!
Siting Wind Power Teacher Notes 5
You may have heard that if you double your wind speed your power output will increases eight times as much. The simple math below, and the wind power curve also show that this is true. Due to this incredible increase in power by increasing wind speed you can see why people like to site wind turbines in the windiest locations possible.
23 = 8 4
3 = 64
On the curve above the Bergey XL1 makes around 50 watts at 8MPH. At 16MPH it is generating around 400 watts (8x as much power with a 2x the wind speed!)
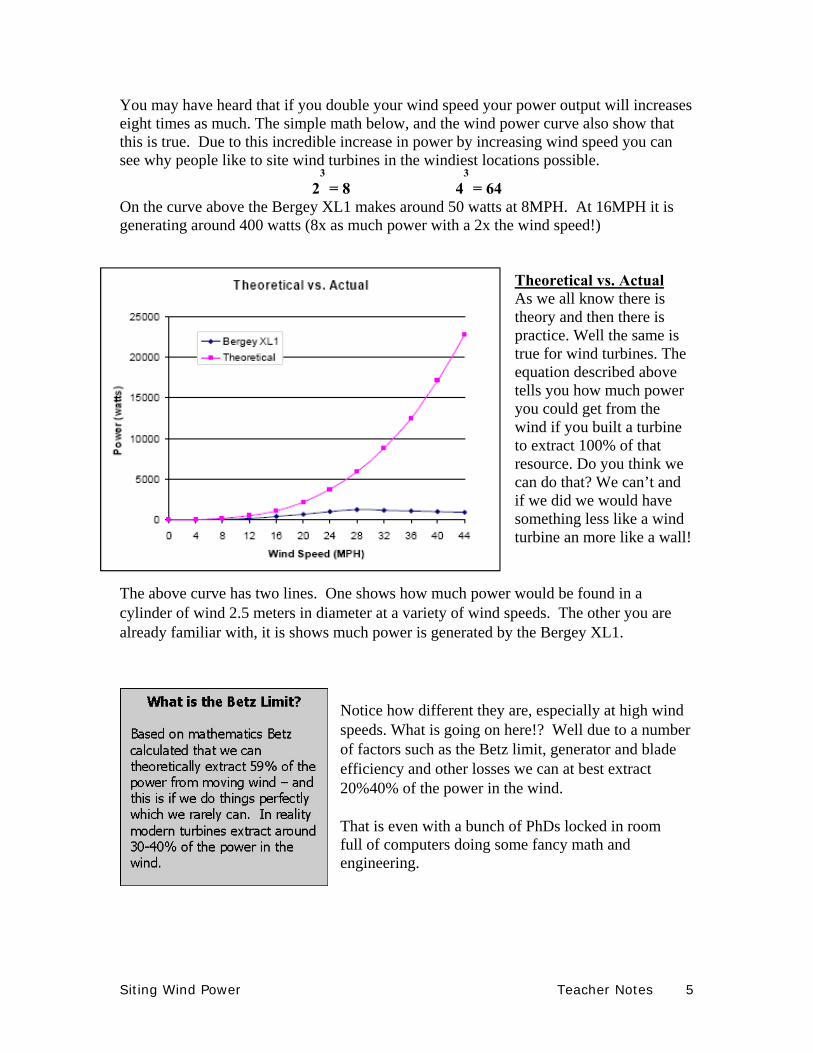
Theoretical vs. Actual As we all know there is theory and then there is practice. Well the same is true for wind turbines. The equation described above tells you how much power you could get from the wind if you built a turbine to extract 100% of that resource. Do you think we can do that? We can’t and if we did we would have something less like a wind turbine an more like a wall!
The above curve has two lines. One shows how much power would be found in a cylinder of wind 2.5 meters in diameter at a variety of wind speeds. The other you are already familiar with, it is shows much power is generated by the Bergey XL1.
Notice how different they are, especially at high wind speeds. What is going on here!? Well due to a number of factors such as the Betz limit, generator and blade efficiency and other losses we can at best extract 20%40% of the power in the wind.
That is even with a bunch of PhDs locked in room full of computers doing some fancy math and engineering.

Siting Wind Power Teacher Notes 6
Wind Power Curve Lesson Extensions If you have already built or are planning to build and test you own small wind turbines you can generate your own wind power curves and see if they look similar to a commercially made wind power curve.
You need to record a variety of different voltage and amperage readings for a variety of wind speeds and plot on this data on a graph. The graph to the right was generated by a 5th grade student named Kathryn who built and tested a pretty astounding small wind turbine.
“My project was to find if different rotors make a difference and if so which rotors worked best. I used airplane propellers mounted backwards. I compared several pitches of two blade props, one three blade prop, and one blade from a desk fan. I used a hobby motor from Radio Shack for the generator. We tested it by mounting it out in front of my dad's car.” You’ll notice right away that Kathryn’s curves do not look like the ones we have analyzed. This is due to the fact that she was using a hobby motor and even though she tested in some pretty high winds we probably have not reached peak RPM. Her curves are starting to flatten out and maybe if she went up to 60 or 70 MPH we would see changes…but then on the other hand we might start to see structural failures in other parts of the turbine!
Siting Wind Power Teacher Notes 7
Part 2: Wind Power Curve Answer Key
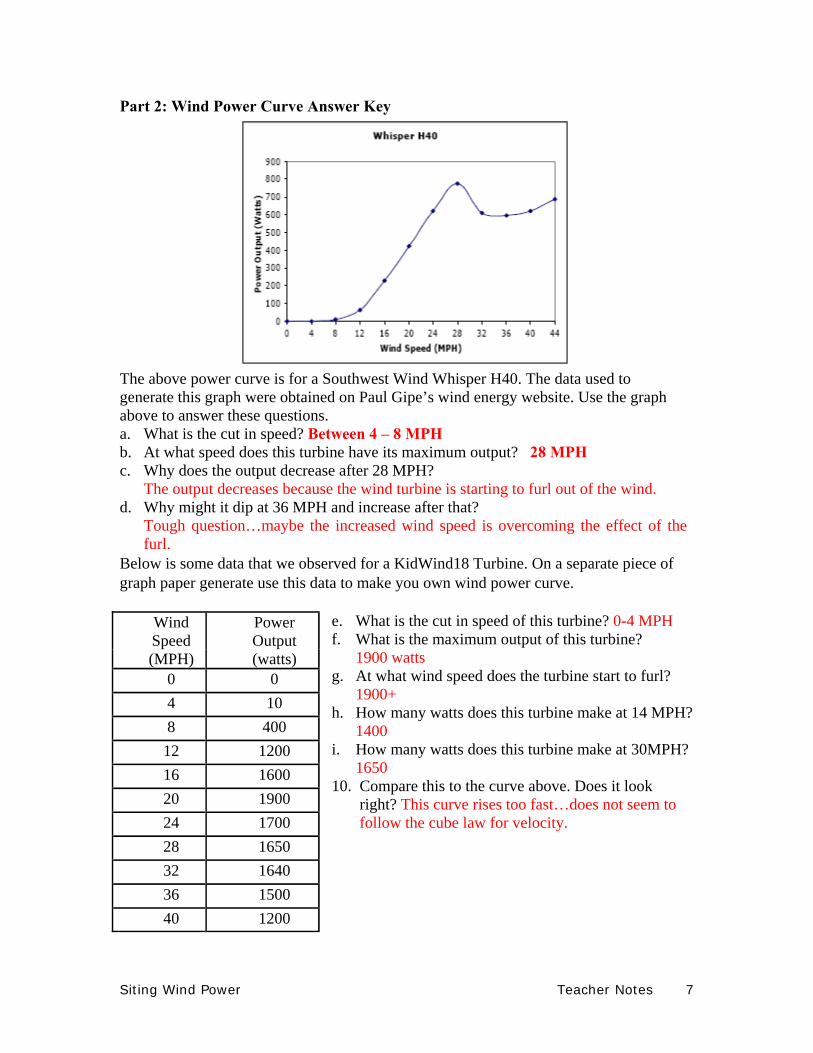
The above power curve is for a Southwest Wind Whisper H40. The data used to generate this graph were obtained on Paul Gipe’s wind energy website. Use the graph above to answer these questions. a. What is the cut in speed? Between 4 – 8 MPH b. At what speed does this turbine have its maximum output? 28 MPH c. Why does the output decrease after 28 MPH?
The output decreases because the wind turbine is starting to furl out of the wind. d. Why might it dip at 36 MPH and increase after that?
Tough question…maybe the increased wind speed is overcoming the effect of the furl.
Below is some data that we observed for a KidWind18 Turbine. On a separate piece of graph paper generate use this data to make you own wind power curve.
e. What is the cut in speed of this turbine? 0-4 MPH f. What is the maximum output of this turbine? 1900 watts g. At what wind speed does the turbine start to furl? 1900+ h. How many watts does this turbine make at 14 MPH?
1400 i. How many watts does this turbine make at 30MPH? 1650 10. Compare this to the curve above. Does it look right? This curve rises too fast…does not seem to follow the cube law for velocity.
Wind Speed
Power Output
(MPH) (watts) 0 0 4 10 8 400 12 1200 16 1600 20 1900 24 1700 28 1650 32 1640 36 1500 40 1200
Siting Wind Power Teacher Notes 8
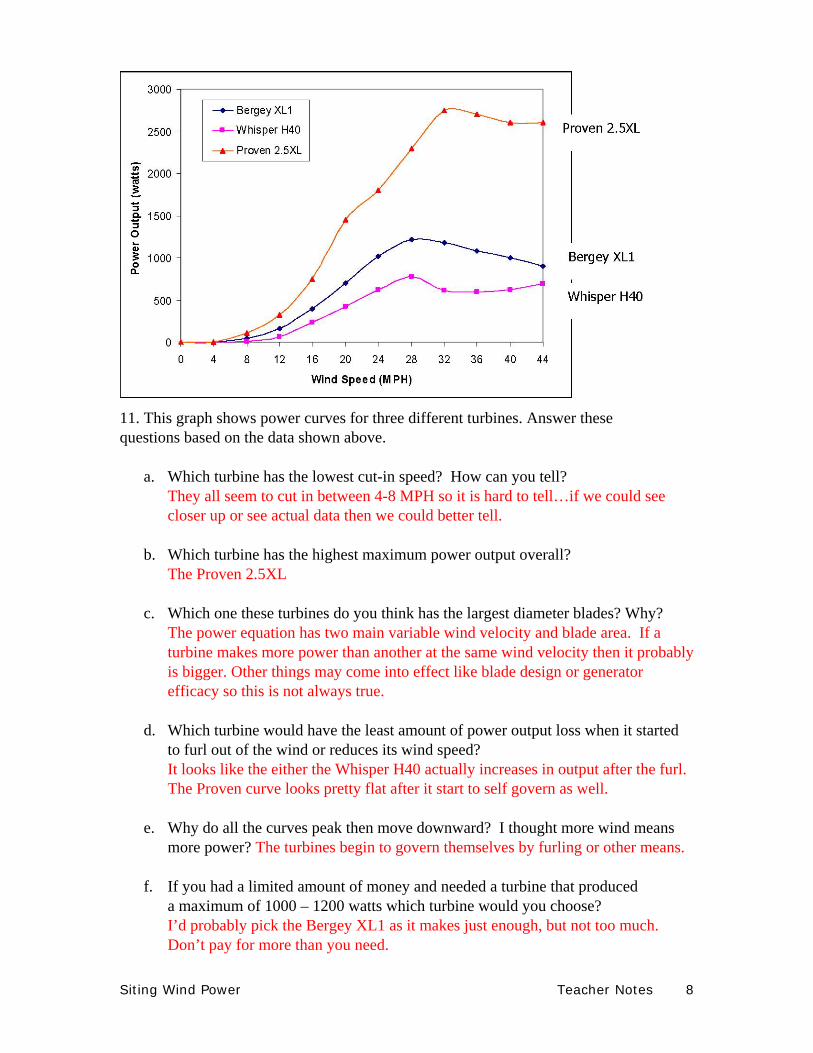
11. This graph shows power curves for three different turbines. Answer these questions based on the data shown above.
a. Which turbine has the lowest cut-in speed? How can you tell? They all seem to cut in between 4-8 MPH so it is hard to tell…if we could see
closer up or see actual data then we could better tell.
b. Which turbine has the highest maximum power output overall? The Proven 2.5XL
c. Which one these turbines do you think has the largest diameter blades? Why? The power equation has two main variable wind velocity and blade area. If a
turbine makes more power than another at the same wind velocity then it probably is bigger. Other things may come into effect like blade design or generator efficacy so this is not always true.
d. Which turbine would have the least amount of power output loss when it started to furl out of the wind or reduces its wind speed?
It looks like the either the Whisper H40 actually increases in output after the furl. The Proven curve looks pretty flat after it start to self govern as well.
e. Why do all the curves peak then move downward? I thought more wind means more power? The turbines begin to govern themselves by furling or other means.
f. If you had a limited amount of money and needed a turbine that produced a maximum of 1000 – 1200 watts which turbine would you choose?
I’d probably pick the Bergey XL1 as it makes just enough, but not too much. Don’t pay for more than you need.

Siting Wind Power Teacher Notes 9
Notes on Part 3
There are a number of factors that go into siting large wind farms and small wind turbines. Some major factors include:
• Wind Speed • Wind Direction • Wind Turbulence • Proximity to Power Lines, Houses and Load • Type of Turbine • State and Federal Incentives • Local Zoning Codes & Ordinances
The following PowerPoint presentations are great resources available as multimedia objects to build a lecture that suits the needs of your students.
o KidWind Basic Wind o Power in the Wind o Siting Activities

Siting Wind Power Teacher Notes 10
Source: http://www.mountwashington.org/discovery/arcade/wind/beaufort.htm

Siting Wind Power Teacher Notes 11
Additional Resources Websites: • http://www.kidwind.org/materials/Lessons/curves/powercurves.html • http://www.windpower.org/en/tour/wres/pwr.htm More information on analyzing wind power curves. Detailed with a number of tips at looking at the data. • http://www.windpower.org/en/tour/wres/pwr.htm More information on analyzing wind power curves. Detailed with a number of tips at looking at the data. • http://www.inl.gov/wind/software/ Software and power curve files for excel for a number of turbine manufacturers. (Neat data for HS students). Glossary: • http://www.horizonwind.com/forteacherskidsconsumers.asp?id=8 Turbine Manufacturer Data:
(These links have been compiled by the designer at KidWind and will take you to some specification sheets from a variety of small turbine manufacturers. You can examine their output curves and read more about the characteristics of small wind turbines.) Some major manufacturers of small and large wind turbines include: • Bergey Windpower http://www.bergey.com/ • Southwest Windpower http://www.windenergy.com/ • Proven Windpower http://www.provenenergy.co.uk/ • GE Windpower http://www.gepower.com/businesses/ge_wind_energy/en/index.htm • Vestas http://www.vestas.com/uk/Home/index.asp • Suzlon http://www.suzlon.com/ • Gamesa (The turbines featured in the Bear Creek videos are manufactured by this company). http://www.gamesa.es/gamesa/index.html
These are some direct links to specification sheets from KidWind: http://www.kidwind.org/pdfiles/XL1.Spec.pdf http://www.kidwind.org/pdfiles/Excel.Spec.Frt.pdf http://www.kidwind.org/pdfiles/proven.pdf http://www.windenergy.com/PRODUCTS/whisperh40.html
Siting Wind Power Student Handout 1
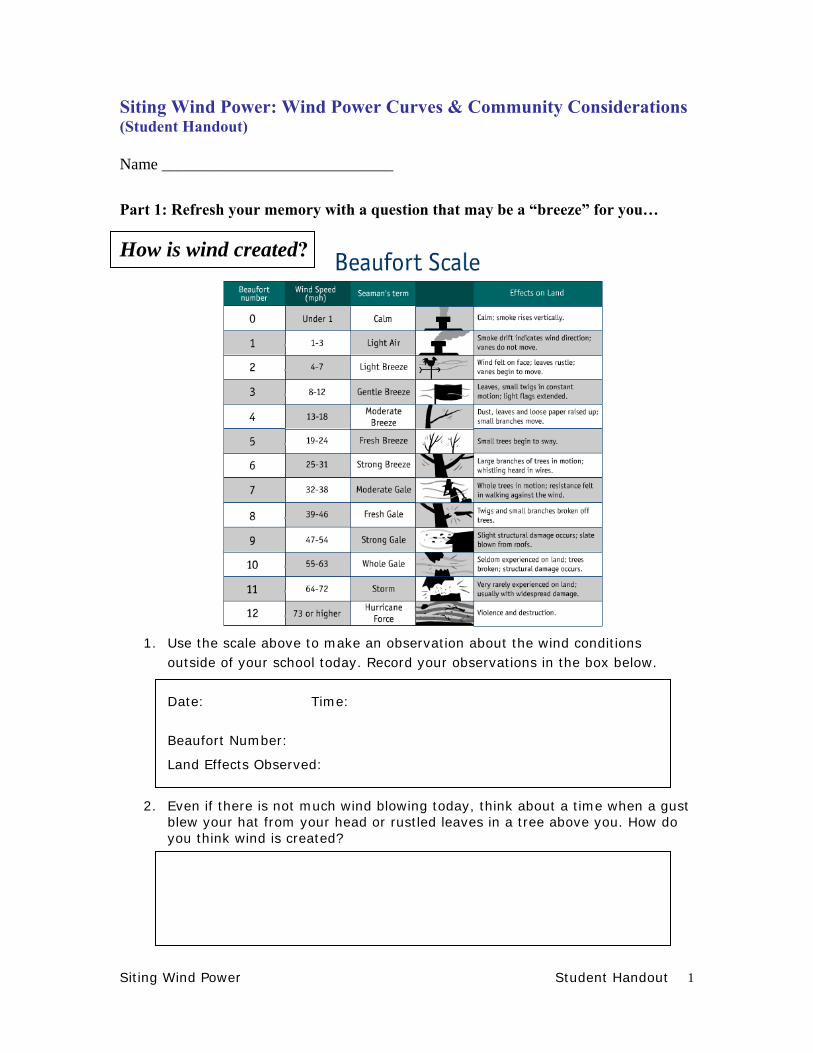
Siting Wind Power: Wind Power Curves & Community Considerations (Student Handout) Name _____________________________
Part 1: Refresh your memory with a question that may be a “breeze” for you… How is wind created?
1. Use the scale above to make an observation about the wind conditions
outside of your school today. Record your observations in the box below.
Date: Time:
Beaufort Number:
Land Effects Observed:
2. Even if there is not much wind blowing today, think about a time when a gust blew your hat from your head or rustled leaves in a tree above you. How do you think wind is created?

Siting Wind Power Student Handout 2
Name _____________________________ On your own… Please read the American Wind Energy Outlook 2005 and Times Leader articles and be prepared to discuss the following questions.
1. What do the articles tell us about the near future for the wind industry?
2. What are some specific constraints or conditions that affect the
growth of wind energy?
3. What do you think the wind energy potential is for Pennsylvania? 3. Explain why you believe it is favorable or unfavorable.

Siting Wind Power Student Handout 3
Many of the materials and photographs included in this section of the handout have been adapted from the lesson, “Wind Power Curves” with written permissions from the Kidwind Project, 2093 Sargent Avenue, Saint Paul, MN 55105 http://www.kidwind.org Kidwind’s production of this document (12/05 Version 1.0) was supported in part by the National Renewable Energy Laboratory through subcontract LEE-5-55877-01. Part 2: Wind Power Curve Analysis The wind power curve to the right is for a Southwest Wind Whisper H40. The data used to generate this graph were obtained on Paul Gipe’s wind energy website. Use the graph to answer these questions. 1. What is the cut in speed? _______________ 2. At what speed does this turbine have its maximum output? _______________ 3. Why does the output decrease after 28 MPH? 4. Why might it dip at 36 MPH and increase after that?

Siting Wind Power Student Handout 4
KidWind18 Turbine Data
Use a separate piece of graph paper or and electronic spreadsheet to create a graph of this data and make your own wind power curve. 5. What is the cut in speed of this turbine? 6. What is the maximum output of this turbine? 7. At what wind speed does the turbine start to furl? 8. How many watts does this turbine make at 14 MPH? 9. How many watts does this turbine make at 30 MPH? 10. Compare this to the curve on page 3. Does it look right?
Wind Speed Power Output (MPH) (watts)
0 0
4 10
8 400
12 1200
16 1600
20 1900
24 1700
28 1650
32 1640
36 1500
40 1200

Siting Wind Power Student Handout 5
Proven 2.5XL
Bergey XL1
Whisper
H40
11. The graph above shows power curves for three different turbines. Answer the questions below based on the data shown above. a) Which turbine has the lowest cut-in speed? How can you tell?
b) Which turbine has the highest maximum power output overall?
c) Which one these turbines do you think has the largest diameter blades? Why?
d) Which turbine would have the least amount of power output loss when it started to furl out of the wind or reduces its wind speed?
e) Why do all the curves peak then move downward? (Doesn’t more wind mean more power? hmmm…)
f) If you had a limited amount of money and needed a turbine that produced a maximum of 1000 – 1200 watts which turbine would you choose?

Siting Wind Power Student Handout 6
Part 3: Siting a Wind Farm Work with your team to use what you have learned. Use the many resources at your fingertips via the Internet and any additional public records that you may find useful in preparing a wind resource site assessment and recommendation for a wind turbine installment to produce electricity for your school. Be prepared to make a statement to your audience that is supported by evidence gathered from answering and investigating the following list of guiding questions. 1. What kinds of things do you need to assess to site a wind turbine?
• Data Collection & Analysis What data do you need to have to make your decision? (Does is matter which way the wind blows? What about wind shear? What does the terrain look like? etc.) • Account for Local Population Opinions Whose opinion matters? Is the site you are considering on public or private land? • Visual Simulations Should you visualize the wind turbine/farm? • Cost/Benefit Analysis & State Incentives
Does Pennsylvania offer any incentives to help you install your wind turbine/farm? How close are you to the electrical grid?
• Turbine Specifications Which turbine is the best choice for your site? Why do you think so? • Permitting Is there a permitting process associated with siting your wind turbine(s)? If so, what permits are required?
2. Please do apply what you have learned “close to home.” Take a look at some
topographic and political boundary maps to find out where wind power would work as a resource for your community. A list of sources of information is included on the next page to help you get started.

Siting Wind Power Student Handout 7
Resources to get started… For a wind resource map for Pennsylvania:
• http://www.eere.energy.gov/windandhydro/windpoweringamerica/maps_template.asp?stateab=pa
The Pennsylvania Department of Environmental Protection’s link on Wind Energy
• http://www.dep.state.pa.us/dep/deputate/pollprev/energy/wind/default.htm
The Danish Wind Industry homepage has an amazing number of resources on siting a wind turbine that are searchable by topic. Check it out!
• http://www.windpower.org/composite-85.htm
Turbine Manufacturer Data: These links have been compiled by the designer at KidWind and will take you to some specification sheets from a variety of small turbine manufacturers. You can examine their output curves and read more about the characteristics of small wind turbines. Some major manufacturers of small and large wind turbines include: • Bergey Windpower http://www.bergey.com/ • Southwest Windpower http://www.windenergy.com/ • Proven Windpower http://www.provenenergy.co.uk/ • GE Windpower http://www.gepower.com/businesses/ge_wind_energy/en/index.htm • Vestas http://www.vestas.com/uk/Home/index.asp • Suzlon http://www.suzlon.com/ • Gamesa (The turbines featured in the Bear Creek videos are manufactured by this company). http://www.gamesa.es/gamesa/index.htm Mapping Tools:
• TopoZone http://www.topozone.com/
• Google Earth http://www.googleearth.com