sitronix annual report 2018
TRANSCRIPT

Printed on May 15, 2019Taiwan Stock Exchange Market Observation Post System: http://mops.twse.com.tw
Sitronix Annual Report 2018
TSE:8016

Spokesrman:
Name:De Yun Zhou
Title:Stragetic investment senior Director
Tel:+886-3-5526500
Fax:+886-3-5526501
email:[email protected]
Acting Spokesrman:
Name:Ting Fang Mao
Title:Acting Spokesrman
Tel:+886-3-5526500
Fax:+886-3-5526501
Headquarter and Taipei Office:
Headquarter:11F-1, No. 5, Taiyuan 1st St., Jhubei City Hsinchu County 302, Taiwan
Tel:+886-3-5526500
Taipei Office:6F., No. 608, Ruiguang Rd., Neihu Dist., Taipei City 114, Taiwan
Tel:+886-2-26591276
Transfer Agent:
Company: Stock-Affairs Agency Department of Taishin International Bank
Address:B1, No.96, Sec.1, Jianguo N. Rd., Taipei City
Tel:+886-2-25048125
Fax:+886-2-25154900
Website:http://www.taishinbank.com.tw
Auditor:
Company:Deloitte & Touche
Auditors:Cheng Chih Lin、Yu Feng Huang
Address:6F, No. 2, Prosperity Rd. I, Hsinchu Science Park, Taiwan, R.O.C
Tel:+886-3- 5780899
Fax:+886-3- 5772218
Website:http://www.deloitte.com.tw
Name of overseas securities dealers and methods to inquire into overseas securities:
Not Applicable
Company website:http://www.sitronix.com.tw

Table of Contents of the Annual Report
I. Letter to Shareholders………………………………….. 1
II. Company Profile…………………………………………. 3
III. Corporate Governance Report
1. Organization System……………………………………………………… 7 2. Directors, Supervisors, General Manager, Deputy GeneralManagers,
Assistant General Managers, Departments and Branches Officer Information……………………………………………………..................
9
3. Remuneration paid to Directors, Supervisors, General Manager, and Deputy General Managers for the Most Recent Fiscal Year…………. 15
4. Corporate Governance Status……………………………………………. 19 5. Accountant Professional Fee……………………………………………… 50 6. Replacement of Accountant………………………………………………. 51
7. The Employment of the Company’s Chairman, General Manager, Financial or Accounting Manager with the Firm of the Auditing CPA or Its Affiliated Businesses in the Most Recent Fiscal Year……………….
51
8. The Status of Changes that Directors, Supervisors and Shareholders Holding More Than 10 percent of Outstanding Shares Had Transferred and Pledged Their Shares during the Most Recent Fiscal Year and up to the Annual Report’s Publishing Date…………………………………..
51
9. Information about the top 10 Shareholders who are InterestedParties or the Spouse, or Relatives within the Second Degree of Kinship………… 53
10. The Number of Shares of the Same Investee Enterprise held by the Company, Directors, Supervisors of the Company, and the Entities directly or indirectly Controlled by the Company, Calculate the Consolidated Shareholding Percentage of the above categories…….
54
IV.Fundraising Status 1. Source of Share Capital Status…………………………………………… 55 2. Corporate Bonds Status…………………………………………………… 63 3. Preferred Shares Status…………………………………………………… 63 4. Overseas Depositary Receipts Status…………………………………… 63 5. Employee Stock Options Status…………………………………………... 63 6. New Restricted Employee Shares Status………………………………... 64 7. Issuance of New Shares for Merger or Acquisition of Another
Companies’ Shares Status………………………………………………… 67
8. The Capital Application Plan and Implementation Status……………… 67
V. Operations Summary

1. Business Content……………………………………………………………. 68 2. Summary of Market and Production/Sales……………………………….. 82 3. Employees……………………………………………………………………. 89 4. Information on Environmental Protection Expenditures…………………. 90 5. Labor Relations………………………………………………………………. 90 6. Important Contracts………………………………………………………….. 92
VI. Financial Summary
1. Condensed Balance Sheet and Statement of Comprehensive Income for the Most Recent 5 Fiscal Years………………………………………… 93
2. Financial Analysis for the Most Recent 5 Fiscal Years…………………… 97
3. The Audit Committee’s Review Report of the Financial Report for the Most Recent Fiscal Year…………………………………………………….. 100
4. Consolidated Financial Statements of the Most Recent Year with Independent Auditors’ Report and Notes……………………………..… 101
5. Parent Company Only Financial Statement of the Most Recent Year with Independent Auditors’ Report and Notes……………………...…….. 101
6. If the Company and Its Affiliated Enterprises has Experienced Financial Difficulties within the Most Recent Fiscal Year up to the Printing Date of the Annual Report, it shall Note the Effect on the Company's Financial Status………………………………………………………………………….
101
VII. Review and Analysis of Financial Condition and Financial Performance and Risk Issues
1. Review and Analysis of Financial Condition……………………………… 102 2. Review and Analysis of Financial Performance………………………….. 103 3. Review and Analysis of Cash Flow………………………………………… 104 4. The Effect upon Financial Operations of Any Major Capital
Expenditures during the Most Recent Fiscal Year……………………….. 104
5. The Company's Reinvestment Policy for the Most Recent Fiscal Year, the Main Reasons for the Profits/Losses Generated thereby, the Plan for Improving Re-investment Profitability, and Investment Plans for the Coming Year………………………………………………………………….
105
6. Risk Issues and its Assessment……………………………………………. 105 7. Other Important Matters…………………………………………………….. 109
VIII.Special Items 1. Information Related to the Company's Affiliates…………………………. 110
2. Where the Company Has Carried out a Private Placement of Securities During the Most Recent Fiscal Year up to the Date of Publication of the Annual Report………………………………………………………………...
116

3. Holding or Disposal of Shares in the Company by the Company's Subsidiaries During the Most Recent Fiscal Year up to the Date of Publication of the Annual Report………………………………………..
116
4. Other Matters that Require Additional Description……………………. 116 5. During the Most Recent Fiscal Year up to the Date of Publication of the
Annual Report, Matters Might Materially Affect Shareholders' Equity or the Price of the Company's Securities Listed in Article 36, Paragraph 3, Subparagraph 2 of the Securities and Exchange Act………………….
116

1
I. Letter to Shareholders Dear Shareholders,
1. Operating Results for 2018
(1) The Implementation of the Business Plan
In 2018, the consolidated revenue of Sitronix Technology Corporation (the “Company”) was approximately NT$10.33 billion, and the consolidated operating margin was NT$2.87 billion. The consolidated net profit after tax was NT$1.014 billion, and the after-tax earnings per share was NT$7.03. In addition to the smooth growth of mobile phone products, many other product lines have also achieved a breakthrough performance, and we hope that in the future, with the continuous efforts of all colleagues and the support of shareholders, we will continue to perform at ourpeak.
(2) The Implementation of the Budget
The company did not disclose financial forecasting in 2018, so there is no need to disclose the budget implementation.
(3) The Analysis of Profitability
Year Analytical Items 2018(Note 2) 2017(Note 2)
Return on assets(%) 13.26% 12.42% Return on equity(%) 19.87% 17.79%
Ratio to paid-up capital(%)
Operating profit 86.71% 70.82% Pre-tax net profit 93.32% 82.00%
Net profit ratio(%) 9.81% 9.44% Earnings per share(NT$)(Note 1) 7.03 7.32
Note 1. Calculated by the weighted average number of shares outstanding during the period.
Note 2. Consolidated financial information applying IFRS.
(4) Research and Development Work
While successfully consolidating the leadership position in feature phone Display Driver ICs (DDI), the Company hasalso dedicated itseffortsto expanding the variety of smart phone DDIs. In addition, the Company also continues to strengthen the development of non-mobile DDI products for Automotive and Industrial DDI, Touch Controller, Ambient Light SensorICs, Proximity Sensor and MEMS Sensors, which will be expected to grow in the future.

2
2. A Summary of the Business Plan for 2019
The Company will continue our strategies of product differentiation and diversification in 2019.
As far as product diversification is concerned, the Company is engaged in various types of DDI markets such as Feature Phone, Smart Phone, Automotive, Industrial products, etc., and also is engaged innon-DDI products such as MCUs, Power Management ICs, Light Sensor ICs and MEMS Sensors.
As for product differentiation, the Company continues to research and innovate, and upholds the principle of innovating and providing competitive and differentiated products for our customers.
3. The Company's Future Development Strategy
In the future, in addition to continuing to strengthen R&D and Sales Capabilities and our strategies of product differentiation and diversification, the Company will be also focus on improving our design to reduce costs and maintain good gross profit margins. Besides, the Company will also continue to strengthen measures to control expenses and increase profitability. As a whole, the Company will continue to grow steadily, enabling our shareholders, customers and employees to share fruitful operating results. Finally, Thanks to all shareholders for your long-term support and care again.
4. The Effect of the External Competitive Environment, Legal Environment, and Overall Business Environment.
In order to strengthen its grasp of the external competitive environment, the legal environment and the overall business environment, the company focuses on corporate governance and corporate responsibility, and complies with the Green Environmental Protection Act.
Thanks to all shareholders for your support and care, the Company will work harder to create the greatest operating results for all shareholders.
I wish you all good health and happiness.
Sitronix Technology Corporation Chairman Vincent Mao

3
II. Company Profile 1. Company Profile
1. Date of Incorporation: July 9, 1992
2. History of Company:
1992 Guanlin Technology was incorporated in Taipei, and the capital was NT$5 million. 1993 Established the microcontroller software design team. 1994 The Company arranged a cash injection of NT$ 5 million. 1995 Established a computer accessories software design team. 1996 Established a consumer electronics software R&D team. 1997 The Company arranged a cash injection of NT$ 10 million. 1998 The Company arranged a cash injection of NT$ 50 million.
Guanlin Technology officially changed its name to "Sitronix Electronics" and transformed into an ICs design company
Established a consumer IC design team and set up a System on a Chip (SOC) Business Unit.
Sitronix passed the Encouragement for the “Important Technology Enterprise” investing project by Industrial Development Bureau (IDB), MOEA.
1999 Sitronix fully transformed into an ICs design company. Launched a SOC-based consumer IC product. Established the Liquid Crystal Drive (LCD) Business Unit. The Company arranged a cash injection of NT$ 110 million.
2000 Mr. Chen-Chang Hsu, the representative of WINTEK Corporation, served as the chairman of the Company.
Sitronix’s public offering approved by the Securities and Futures Commission, Ministry of Finance.
Launched electronic dictionary applied IC and LCD Driver for OA. 2001 Successfully developed the Chinese fonts LCD Driver and LCD Driver for PDA.
Sitronix passed the Encouragement for the”New Strategic Important Industry” investing project by IDB, MOEA.
2002 The first LCD Driver for mobile phones is mass-produced and shipped. Launched a new generation platform for electronic dictionary. Launched a HIFAS series of LCD drivers. Sitronix arranged a cash injection of NT$ 35 million.
Sitronix’s listing and transacting on the Emerging Stock Market under code R246approved by Over the Counter.
2003 Sitronix obtained a Letter of Opinion by Technology Enterprise Commission of IDB on
“Successfully Developed Product/Technology with Market Potential by a Technology Company”.
Sitronix’s Reinvestment in Mainland China approved by Investment Board, Ministry of Economic Affairs.
Launched the LCD Driver for color mobile phones.
Sitronix officially listed on the Taiwan Stock Exchange (TWSE) by Technology Sector Stock under code 8016 on December 25, 2003.
2004 Invested Indirectly in Sitronix Technology (Shenzhen) LLC to engage in development,
sales and after-sales service of computer hardware / software product, and provide its related technical consulting services.
Successfully developed the TFT-LCDdriver chips for mobile phones. Successfully launched the high-end electronic dictionary chipset. The CSTN Driver IC for mobile phones began mass production and delivery.

4
2005 Reinvested in Sida Technology Corporation and held 55% of its shares. Completed a new generation architecture platform for electronic dictionary. Established the technology of hardware and software for music player. Completed the research and development of the educational toy product line. Completed LCD drivers for the HIFAS architecture. Introduced the TFT Mobile Driver to mass production. Built the technical capabilities of the Large Panel Driver. 2006 Reinvested in Sifa Technology Corporation and held 25% of its shares. Passed SGS ISO-9001 international quality certification. Completed DSP hardware and software development for voice. Built the software and hardware platform for 32-bit CPU. Introduced the HIFAS Color STN driver to mass production. Built the technology for LCD Driver for automobile. Introduced the Mobile&Monitor TFT Driver to mass production. Built the R & D technology for LCD TV Driver.
2007 Awarded as one of the top 50 global IC design suppliers in 2007 by IC Insights’ Strategic Reviews Database at the first time.
Arranged a cash injection by private placement for the issuance of 3,500,000 ordinary shares, successfully introduced strategic partners.
The monthly performance broke through NT$600 million at the first time. Built an 8-bit and 32-bit digital photo frame system.
USB interface single-chip for wafer reader is obtained international certification and introduced to mass production.
Introduced the Green Driver MSTN/CSTN to mass production and built the R & D technology for Green Driver TFT.
Introduced the LCD Driver for automotive to mass production.
Completed the new technology of Crosstalk compensation circuit and introduced to mass production.
Introduced the Monitor TFT Driver to mass production. Completed the verification of 8 bit Source Driver for LCD TV. Completed the verification of 400 Channels Gate Driver for LCD monitor.
Completed the verification of 1200 Channels Source with 480/600 Channels Gate for AV monitor.
2008 Built a multi-functional personal karaoke player. Introduced the Palette Driver to mass production. Developed the E-Paper driver chip. Introduced LCD driver IC for CABC & Dot Inversion TFT mobile phone.
Started the mass production of 6 bits 642/720 Channels Source Driver/400 Channels Gate Driver for LCD monitor.
Completed the verification of 6 bits 960 Channels Source Driver/8 bits Source Driver for LCD monitor.
Started the mass production of 1200 Channels Source Driver and 600 Channels Gate
Driver for low-price Notebook panel. Completed the verification of 480 Channels Gate Driver.
2009 Started the mass production of small-size TFT LCD driver single-chip built-in capacitor technology.
Started the mass production of small-size TFT LCD driver single-chip built-in backlight power-saving technology.
Developed the TFT LCD drive single chip Green Driver technology for mobile phones.

5
2009 Started the mass production of mini-LVDS / RSDS 6 bits 960 channels COF source driver for LCD monitor.
Completed the verification of mini-LVDS 6 bits 1026 channels COF source driver for LCD monitor.
Completed the verification of mini-LVDS 768 channels COG source driver for Notebook panel.
Started the mass production of 2 Channels protection IC for game console power adapter.
Completed the verification of 4 Channels / 3 Channels protection IC for switching power supply.
Started the mass production of source driver with 1200 Channels built-in timing controller (Timing Controller) for digital photo frame panel.
Multimedia e-Card. 2010 A new generation of multi-function control chip and processing platform. Portable music singing solution. Voice sound controlled platform. The 32-bit processor applied in the learning machine market solution. A new generation of 32-bit processor chips. The controller chips for Apple accessories product. Expanded the driver chips built-in capacitor products for mobile phones. Built the drive chip technology for small-size, HD resolution without capacitor. Developed the Small-size driver chip of circuit for reducing memory unit.
Built the high-speed single-channel interface driving chips technology for mobile phones.
Started the mass production of mini-LVDS 768 channels COG source driver for Notebook panel.
Completed the verification of 4 960ch gate driver supporting dual gate architecture for medium-size panel.
Completed the verification of source drive with 1200 channels built-in timing controller (Timing Controller) for automotive panel.
Started the mass production of mini-LVDS 6 bits 1026 channels COF source driver for LCD monitor.
Started the mass production of Source/Gate driver for industrial panel. 2011 Expanded the TFT LCD single-chip driver built-in capacitor products for mobile phone. Expanded the TFT LCD single-chip driver built-in capacitor products for mobile phone.
Built the TFT LCD, HD resolution drive chip technology without capacitor for mobile phone.
Built the high-speed single-channel interface driving chips technology for mobile phones.
Introduced the new STN Driver IC for customer testing, and successfully introduced to mass production at the end of the year.
Completely developed the TN Driver COG IC, and introduced it to the market for promotion.
Developed medium-sized TFT 800*480 resolution 2 chip solution, high pin count gate
driver, built-in timing generation circuit, supporting 1024*768 resolution driver IC and arbitrary resolution timing generation circuit.
Developed the driver IC built-in timing generation circuits, real 8-bit driver ICs and temperature compensation circuits for automotive TFT panel.
Started the mass production of Multi-finger touch solution for tablet. Passed the certification of Win7 10-finger touch Logo. Built the Single-layer ITO touch sensing technology.
Started the mass production of a new generation of five-finger touch single chip for smart phones.
Launched a multi-finger touch single chip designed specifically for tablet. Completed the support of OGS (One Glass Solution) multi-finger touch technology.

6
Built the multi-touch technology that could resistant to high noise of power adapters.
2012 Built the drive chip technology for small-size, TFT LCD, HD resolution without capacitor.
Developed the driver chip with built-in timing generation circuit and power circuit.
Developed the control chip for 3D glasses.
Mono-STN Green Driver external power system.
Developed the1024*600 resolution 2Chip solution.
2013 Built the driver ICs with high-speed interface, high-speed SRAM, Line buffer technology for TFT LCDs mobile phones.
HD720(800*1280) For LTPS LCD Driver.
Built the driver chip technology without capacitor for small-size, TFT LCD, function phones
Developed the ES of PND 480x272 0C driver IC.
Researched and developed the STN DRIVER NEW BOOST SYSTEM WITH ZERO CAPS.
2014 2/4 direction gesture control proximity sensor.
Small sensor hole proximity sensor.
320*240 resolution STN display driver chip for industrial control measurement.
480*272 resolution color TFTdisplay driver chip for Smart Home Product.
HVGA(480*320) Zero Cap a_Si TFT LCD driver IC.
HD720(1280*800) a_Si TFT LCD driver IC.
WVGA Burst Out DC/DC Convertor for Zero Cap Driver IC.
MIPI with 1.5G pbs Lane Speed.
Touch IP for TDDI (Touch + display driver) Integrated IC.
2015 320*240 STN with LVDS display driver chip for industrial control measurement.
800*480 STN display driver chip for industrial control measurement.
1.5 m/m small-sensor-hole proximity sensors.
1920*720 1440-channel TFT display driver chip for Automotive Center Stack / Instrument Cluster.
2016 Announced to launch the HD720 Zero capacitance version.
Announced to launch the FHD Zero capacitance version.
2017 Started the mass production of automotive touch controller IC.
Launched the upgraded version of the invisible proximity sensors.
2018 Launched the low power consumption industrial control DDI product.
Launched the Micro-size proximity sensor and P-Sensors.

7
III. Corporate Governance Report 1. Organization System (1) Chart of Organization Structure (December 31, 2018)
(2) The Tasks of its Principal Divisions
Chairman and CEO
Audit Room
1. Establish the company's business policy, major strategies and draft the operating goals. plan and executing the strategy investment and cooperation.
2.Implement and manage the internal audit and improve the performance of management.
Finance and Accounting Management
1. Comprehensively allocate financial funds, establish and maintain the relevant accounting business.
2. Handling the affairs of shareholders' meeting related matters and the processing of securities matters.
System Service 1. Responsible for the automation of the company's operating
system and the delivery management of electronic messages.
Human Resource and
Administration
1. Perform the planning and development of the human resource and welfare matters of employee.
2. Comprehensively handle the general administrate affairs, procurement, insurance and property management.
Legal and Intellectual property
Manage the legal affairs and intellectual property rights' related affairs.
Home Automation Designing and contract manufacturing the related products of smart socket, smart switch and home automation.
Strategic Marketing
1. The strategic survey, feasibility evaluation of applied technology and its implementation.
2. The strategic survey, feasibility evaluation of technical team and its implementation.
3. Evaluation and promotion of the Industry-Academia Cooperation Project
4.Managing the Institutional investors and Media Relationship.

8
Integrated Marketing of Product
1. Promotion of new product market. 2.Strategic research and market analysis of product market 3. Cross-industry analysis and planning research. 4. Strategic research of product integrating promotion.
Sales
1. Responsible for product sales and services, domestic and international marketing development and marketing plans.
2. Responsible for analysis and management of customer claims. Development of application software of the related products and its functional verification.
3. Management of the delivery reply, delivery reminder and customer service.
Manufacturing Engineer
1. Planning and execution of product development engineering activities.
2. Planning and implementation of mass production and product delivery.
3. Monitoring and improvement of product and supplier quality. 4. Planning and implementation of product cost improvement.
Display Business Group
1. Responsible for specifications planning, product development, market information collection, production and its customer support for the display driver product.
2.Responsible for specifications planning, product development, market information collection, production and its customer support for the touch control product.
3. Development of application software of the related products and its functional verification.
4. Development and maintenance of the product system verification tools and methods.
5. IC layout graphics and its data archive and data backup. 6. Develop core tools of various circuit architectures, software and
hardware related to the preceding project and its maintenance.
R & D Center
1. Responsible for specifications planning, product development, market information collection, production and its customer support for the automotive electronics product.
2. Responsible for specifications planning, product development, market information collection, production and its customer support for the sound effect product.
3. Development of application software of the related products and its functional verification.
4. Development and maintenance of the product system verification tools and methods.
5. IC layout graphics and its data archive and data backup. 6. Develop core tools of various circuit architectures, software and
hardware related to the preceding project and its maintenance.

9
2. Information on the Company's Directors, Supervisors, General Manager, Deputy General Managers, Assistant General Managers, and the Supervisors of all the Company's Divisions and Branch Units
(1) Information on the Company's Directors and Supervisors April 28, 2019 Unit: Share; %
Title Nationality Name Gender
Date on which
current position was
assumed
Term Commencement date of the first term
Shareholding from date on which current position was assumed
Shareholding Currently
Shareholding by spouses, minor
children
Shareholding through nominees Principal work experience and academic
qualifications Positions held concurrently in the company and/or
in any other company
Directors, Supervisors Who are Spouse or Within Two Degrees of Kingship
Shares % Shares % Shares % Shares % Title Name Relationship
Chairman Republic of China
Vincent Mao (Note 1) Male 2018.06.27 3 years 1992.07.09 633,039 0.53% 646,719 0.54% 71,243 0.06% - -
EMBA,Taiwan University Institute of Microelectronics, Cheng Kung University General Manager, Sitronix Technology Corp. Market Planning, United Microelectronics Corp.
Chairman & CEO, Sitronix Technology Corp. Chairman, Sitronix Technology(Belize) Corp. Chairman,Sitronix Technology (Mauritius) Corp. Chairman,Sitronix Holding International Limited. Director, mCore Technology Corp. Director, Sensortek Technology Corp. Chairman & CEO, Forcelead Technology Corp. Director, Infinno Technology Corp. Chairman, Sitronix Investment Corp. Director,Sync-Tech System Corp. Director, Silicon Power Computer & Communications Inc. Independent Director, Compal Broadband Networks Inc.
- - -
Director Republic of China Wen Bin Lin Male 2018.06.27 3 years 1999.01.05 2,200,000 1.83% 2,200,000 1.83% 1,100,000 0.91% - - Electronics,Taipei Tech - - - -
Director Republic of China
I Hsi Cheng (Note 2) Male 2018.06.27 3 years 1999.01.05 373,140 0.31% 381,690 0.32% 189,617 0.16% - -
Department of Electronics Engineering, NCTU Deputy Manager,Design Department, Novatek Microelectronics Corp.
CRO, Sitronix Technology Corp. Chairman, mCore Technology Corp. - - -
Director
Republic of China
Silicon Power Computer & Communications Inc.
- 2018.06.27 3 years 2014.06.11 3,000,000 2.49% 3,000,000 2.50% - - - - - - - - -
Republic of China
Representative: Hui Ming Chen Male 2018.06.27 3 years 2014.06.11 20 0.00% 20 0.00% 20 0.00% - -
MBA, University of Central Oklahoma(U.S.) Assistant General Manager, SalesDivision, Transcend Information, Inc.
Chairman & CEO, Silicon Power Computer & Communications Inc. Chairman, Silicon Power Computer&Communications Netherlands B.V Chairman,Silicon Power Computer&Communications USA Inc. Chairman,Silicon Power Computer&CommunicationsHK Ltd. Director,Wang Xin Investment Corp. Director, Silicon Power Investment Co., Ltd. Supervisor, Silicon Power Japan Co., Ltd.
- - -
Note 1:Chairman Vincent Mao held 800,000 shares under trust with discretion reserved, the shareholding ratio is 0.67%. Note 2: Director I Hsi Cheng held 1,200,000 shares under trust with discretion reserved, the shareholding ratio is 1%.

10
April 28, 2019 Unit: Share; %
Title Nationality Name Gender
Date on which
current position was
assumed
Term Commencement date of the first
term
Shareholding from date on which current position was assumed
Shareholding Currently
Shareholding by spouses, minor
children
Shareholding through nominees Principal work experience and academic
qualifications Positions held concurrently in the company and/or
in any other company
Directors, Supervisors Who are Spouse or
Within Two Degrees of Kingship
Shares % Shares % Shares % Shares % Title Name Relationship
Director Republic of China
Sheng Su Lee
(Note 3) Male 2018.06.27 3 years 2015.06.22 259,821 0.22% 259,821 0.22% - - - -
Institute of Microelectronics of Cheng Kung University General Manager, Sitronix Technology Corp.
Deputy CEO, Silicon Power Computer & Communications Inc. Chairman and CEO, Sensortek Technology Corp. Director, Silicon Power Investment CO.,LTD
- - -
Director Republic of China
Yan Chiang Fan Male 2018.06.27 3 years 2000.03.10 938,424 0.78% 967,424 0.80% 2,423 0.00% - -
Yu Da High School of Commerce and Home Economics President, Shin Hwa Group
None - - -
Independent Director
Republic of China
Cheng Chieh Dai Male 2018.06.27 3 years 2010.06.10 1,019 0.00% 1,019 0.00% 17,669 0.01% - -
Institute of Electrical Engineering, State University of New York at Stony Brook Department of Electrical Engineering, Cheng Kung University Deputy General Manager, Accusys, Inc. Business Manager, Elitegroup Computer Systems Inc.
General Manager,Accuvision Technology Inc. Director, Accuvision Technology Inc. Independent Director, NEXCOM International Co., Ltd. Director, STL Technology Ltd.
- - -
Independent Director
Republic of China
Chieh Sheng Hsiao
Male 2018.06.27 3 years 2018.06.27 70,330 0.06% 54,330 0.05% 26,185 0.02% - - Institute of Microelectronics, Cheng Kung Market Planning, United Microelectronics Corp.
General Manager, IC PLUS Corp.
Independent Director
Republic of China Yu Nu Lin Female 2018.06.27 3 years 2018.06.27 0 0.00% 0 0.00% - - - -
EMBA, Taiwan University Department of Accounting, Chengchi University Sales Deputy Manager Taiwan Securities Co., Ltd. Intermediate auditor, KPMG Taiwan Passing the Accounting Entrance Exam.
Financial Deputy General Manager,Chin-Poon Industrial Co., Ltd.
Note 3. Director Sheng Su Lee held 591,874 shares under trust with discretion reserved, the shareholding ratio is 0.49%.

11
(2) Major Shareholders is Institutional Shareholders
Names of the Institutional
Shareholders 10 Largest Institutional Shareholders
Holding Percentage
of Each
Silicon Power Computer &
Communications Inc.
Wang Xin Investment Corp. 6.72%
Sitronix Technology Corp. 6.53%
Guang Sheng Technology Co.,Ltd. 3.80%
Pei Jung Yuan 1.51%
Trust Property Account Entrusted by Hui Ming Chen in Mega International Commercial Bank 1.50%
Shao Li Huang 1.28%
Shu Qing Ou 1.18%
Hui Ming Chen 1.15%
Jian Xian Technology Co.,Ltd. 1.14%
Jin Hong Zheng 1.01%
Note. The shareholding information of Silicon Power Computer & Communications Inc. up to April 22, 2019.
(3) Where Major Shareholders is Institutional Shareholders and its Major Shareholders
Names of the Major Shareholders 10 Largest Shareholders Holding Percentage
Wang Xin Investment Corp. Hui Ming Chen 99.7%
Xin Xin Yang 0.3%
Sitronix Technology Corp. Please refer to the shareholder Information on the top ten -
Guang Sheng Technology Co.,Ltd.
Li Li Su 30%
Sheng Su Lee 30%
Rui Huan Lee 40%
Jian,Xian Technology Co.,Ltd.
Shu Nuan,Hou 15%
Xi Bin Lee 15%
Shao Hui Lee 35%
Rou Wei Lee 35%

12
(4)Whether the Directors and Supervisors Has 5 or More Years of Work Experience and Professional Qualifications, and Meets the Following Requirements:
April 28, 2019
Conditions Name
5 or More Years of Work
Experience and Professional Qualifications
(Note 1)
Meets the Independence(Note 2)
Number of Other Public Companies in Which is
Concurrently Serving as
an Independent
Director 1 2 3 1 2 3 4 5 6 7 8 9 10
Chairman Vincent Mao
1
Director Wen Bin Lin
0
Director I Hsi Cheng
0
Director-Silicon Power Computer & Communications Inc. Representative Hui Ming Chen
0
Director
Sheng Su Lee 0
Director Yan Chiang Fan
0
Independent Director Cheng Chieh Dai
1
Independent Director Chieh Sheng Hsiao
0
Independent Director Yu Nu Lin
0
Note 1. Where the director or supervisor meets the following professional qualification, please tick the corresponding boxes below codes. (1) A lecturer or higher in a department of commerce, law, finance, accounting, orother
academic department related to necessary for the business of the company, in a public or private junior college, college, or university;
(2) A judge, public prosecutor, attorney, certified public accountant, or other professional or technical specialist who has passed a national examination and been awarded a certificate in a profession necessary for the business of the company.
(3) Have work experience in the area of commerce, law, finance, or accounting, or otherwise necessary for the business of the company.
Note2. Where the director or supervisor meets the following conditions during the two years prior to the position being assumed or during the term of office, please tick the corresponding boxes below codes. (1) Not an employee of the Company or any of its affiliates.

13
(2) Not a director or supervisor of the Company or any of its affiliates. Not applicable in cases where the person is an independent director of the Company, its parent company, or any subsidiary in which the Company holds, directly or indirectly, more than 50% of the voting shares.
(3) Not a natural-person shareholder who holds shares, together with those held by the person’s spouse, minor children, or held by the person under others’ names, in an aggregate amount of 1% or more of the total number of outstanding shares of the Company or ranking in the top 10 in holdings.
(4) Not a spouse, relative within the second degree of kinship, or lineal relative within the third degree of kinship, of any of the persons in the preceding three subparagraphs.
(5) Not a director, supervisor, or employee of a corporate shareholder who directly holds 5% or more of the total number of outstanding shares of the Company or who holds shares ranking in the top five holdings.
(6) Not a director, supervisor, officer, or shareholder holding 5% or more of the shares, of a specified company or institution which has a financial or business relationship with the Company.
(7) Not a professional individual who is an owner, partner, director, supervisor, or officer of a sole proprietorship, partnership, company, or institution that provides commercial, legal, financial, accounting services or consultation to the Company or to any affiliate of the Company, or a spouse thereof. These restrictions do not apply to any member of the remuneration committee who exercises powers pursuant to Article 7 of the "Regulations Governing the Appointment and Exercise of Powers by the Remuneration Committee of a Company Whose Stock is Listed on the Taiwan Stock Exchange, TWSE or Traded on the Taipei Exchange, TPEx".
(8) Not having a marital relationship, or a relative within the second degree of kinship to any other director of the Company.
(9) Not been a person of any conditions as defined in Article 30 of the Company Act. (10) Not a governmental, institutional shareholders or its representative as defined in
Article 27 of the Company Act.

14
(5)Information on the General Manager, Deputy General Managers, Assistant General Managers, and the Chiefs of all the Company's Divisions and Branch Units April 28, 2019 Unit: Share ; %
Title Nationality Name Gender Date on which current position was assumed
Shareholding Currently Shareholding by spouses, minor children
Shareholding through nominees Principal work experience and academic
qualifications Positions held concurrently in the company
and/or in any other company
Manager Who are Spouse or Within Two Degrees of
Kingship
Shares % Shares % Shares % Title Name Relationship
Chairman & CEO Republic of China Vincent Mao (Note 1) Male 2003.04.28 646,719 0.54% 71,243 0.06% 0 0.00%
EMBA, Taiwan University
Institute of Microelectronics, Cheng Kung
University
General Manager, Sitronix Technology Corp.
Market Planning, United Microelectronics Corp.
Chairman, Sitronix Technology(Belize) Corp. Chairman,Sitronix Technology (Mauritius) Corp. Chairman,Sitronix Holding International Limited. Director, mCore Technology Corp. Director, Sensortek Technology Corp. Chairman & CEO, Forcelead Technology Corp. Director, Infinno Technology Corp. Chairman, Sitronix Investment Corp. Director,Sync-Tech System Corp. Director, Silicon Power Computer & Communications Inc. Independent Director, Compal Broadband Networks Inc.
None None None
General Manager Republic of China Wei Wang Male 2013.03.13 151,867 0.13% 0 0.00% 0 0.00%
Department of Electronic, Chung Yuan
Christian University
Market Division Deputy General Manager,
Holtek Semiconductor Inc.
Director, mCore Technology Corp.
Director, Forcelead Technology Corp.
Representative,Sitronix
Technology(Shenzhen) Co., Ltd.
None None None
CRO Republic of China I Hsi Cheng (Note 2) Male 2004.04.01 381,690 0.32% 189,617 0.16% 0 0.00%
Department of Electronics Engineering, NCTU
Deputy Manager,Design Department, Novatek
Microelectronics Corp.
Chairman, mCore Technology Corp. None None None
CRO Republic of China Chun Sheng Lin (Note 3) Male 2005.02.01 112,062 0.09% 86,546 0.07% 0 0.00% Department of Electronic, Feng Chia University
Executive Manager, R & D Division ,EPSON Director, Infinno Technology Corp. None None None
Deputy General Manager Republic of China Meng Huang Liu Male 2013.03.13 643 0.00% 0 0.00% 0 0.00%
Ph. D., Institute of Microelectronics, Cheng
Kung University
Senior Assistant General Manager, Analog
Design Division, Sentelic Corporation
Deputy Manager, , Macronix International Co.,
Ltd
Director, Sensortek Technology Corp.
Director,Sync-Tech System Corp. None None None
Chief of Financial Division Republic of China Shu Fang Xu Female 2014.07.01 35,336 0.03% 0 0.00% 0 0.00% Department of Accounting, Soochow University
Director, Sitronix Investment Corp.
Supervisor,Sync-Tech System Corp.
Supervisor, Infinno Technology Corp.
Supervisor, mCore Technology Corp.
None None None
Chief of Accounting Republic of China Shu Fang Xu Female 2011.10.26 35,336 0.03% 0 0.00% 0 0.00% Department of Accounting, Soochow University
Director, Sitronix Investment Corp.
Supervisor,Sync-Tech System Corp.
Supervisor, Infinno Technology Corp.
Supervisor, mCore Technology Corp.
None None None
Note 1: Chairman Vincent Mao held 800,000 shares under trust with discretion reserved, the shareholding ratio is 0.67%. Note 2: Director I Hsi Cheng held 1,200,000 shares under trust with discretion reserved, the shareholding ratio is 1%. Note 3: CRO Chun Sheng Lin held 200,000 shares under trust with discretion reserved, the shareholding ratio is 0.17%.

15
3. Remuneration Paid During the Most Recent Fiscal Year to Directors, Supervisors, the General Manager, and Deputy General Managers 1. Remuneration of the Directors (including Independent Directors)
December 31,2018Unit: NT$ thousand
Note 1. The Compensation of Director and Compensation of Compensation for this table was be calculated based on the percentage of the actual amount distributed last year passed by the Board of Directors on March, 2019. Note 2. Hui Ming Chen is the Institutional Director-Representative of Silicon Power Computer & Communications Inc. The business execution expenses paid to the individual, and the Director’s Compensation paid to Institutional Director. Note 3. Yan Chiang Fan、Chieh Sheng Hsiao、Yu Nu Lin were new office assumed after re-election on 2018.06.27. Note 4. De Cheng Tu was dismissed after re-election on 2018.06.27.
Title Name
Director’s remuneration The sum of A, B, C and D as a percentage
of after-tax net profit
Remuneration from other jobs The sum of A, B, C, D, E, F and G as a percentage of after-tax net profit Remuneration
from reinvested businesses other than subsidiaries
Base Compensation (A)
Retirement pension (B)
Director’s Compensation (C)(Note 1)
Business execution expenses (D)
(Note 2 )
Remuneration, bonus and special fees (E) Retirement pension (F) Employee remuneration (G)
(Note 1)
The Company
All companies in the consolidated financial statements
The Company
All companies in the consolidated financial statements
The Company
All companies in the consolidated financial statements
The Company
All companies in the consolidated financial statements
The Company
All companies in the consolidated financial statements
The Company
All companies in the consolidated financial statements
The Company
All companies in the consolidated financial statements
The Company
All companies in the consolidated financial statements The
Company
All companies in the consolidated financial statements Cash Stock Cash Stock
Chairman& CEO Vincent Mao
- - - - 20,963 20,963 76 76 2.50% 2.50% 5,727 7,963 202 202 - - 3,599 268 3.50% 3.94% Nil
Director Wen Bin Lin
Director & CRO I Hsi Cheng
Director Silicon Power Computer & Communications Inc. Representative: Hui Ming Chen(Note 2)
Director Sheng Su Lee
Director Yan Chiang Fan (Note 3)
Independent Director Cheng Chieh Dai
Independent Director
Chieh Sheng Hsiao (Note 3)
Independent Director Yu Nu Lin (Note 3)
Independent Director De Cheng Tu (Note 4)
* Except for the disclosure in the table above, the remuneration received by the directors of the company for services to all companies in the financial report in the most recent year (such as non-employee consultants): 871 thousands.
Range of Remunerationfor pay to Each Director of the Company
Director’s name Total amount of the first four remunerations (A+B+C+D) Total amount of the first seven remunerations (A+B+C+D+E+F+G)
The Company All companies in the consolidated financial statements The Company All companies in the consolidated
financial statements
Lower than 2,000,000
Representative of Silicon Power Computer & Communications Inc.:
Hui Ming Chen, Yan Chiang Fan、Cheng Chieh Dai 、
Chieh Sheng Hsiao、 Yu Nu Lin、De Cheng Tu
Representative of Silicon Power Computer & Communications Inc.:
Hui Ming Chen, Yan Chiang Fan、Cheng Chieh Dai 、
Chieh Sheng Hsiao、 Yu Nu Lin、De Cheng Tu
Representative of Silicon Power Computer & Communications Inc.:
Hui Ming Chen, Yan Chiang Fan、Cheng Chieh Dai 、
Chieh Sheng Hsiao、 Yu Nu Lin、De Cheng Tu
Representative of Silicon Power Computer & Communications Inc.:
Hui Ming Chen, Yan Chiang Fan、Cheng Chieh Dai 、
Chieh Sheng Hsiao、 Yu Nu Lin、De Cheng Tu
2,000,000 (inclusive) - 5,000,000 (exclusive) Wen Bin Lin、I Hsi Cheng、Silicon
Power Computer & Communications Inc.、Sheng Su Lee
Wen Bin Lin、I Hsi Cheng、Silicon Power Computer & Communications
Inc.、Sheng Su Lee
Wen Bin Lin、Silicon Power Computer & Communications Inc.、
Sheng Su Lee
Wen Bin Lin、Silicon Power Computer & Communications Inc.、
Sheng Su Lee 5,000,000 (inclusive) - 10,000,000 (exclusive) Vincent Mao Vincent Mao Vincent Mao、I Hsi Cheng I Hsi Cheng
10,000,000 (inclusive) - 15,000,000 (exclusive) - - - Vincent Mao
15,000,000 (inclusive) - 30,000,000 (exclusive) - - - -
30,000,000 (inclusive) - 50,000,000 (exclusive) - - - -
Total 11 11 11 11

16
2. Remuneration paid to Supervisors December 31, 2018 Unit: NT$ thousand
Title Name
Supervisor’s Remuneration The sum of A, B, C, D as a percentage of after-tax net profit (%) Remuneration from
reinvested businesses other than subsidiaries
Base Compensation(A) Compensation(B) (Note 1) Business execution expenses (C)
The Company All companies in the
consolidated financial statements
The Company All companies in the
consolidated financial statements
The Company All companies in the
consolidated financial statements
The Company All companies in the
consolidated financial statements
Supervisor Yan Chiang Fan (Note 2)
- - 1,727 1,727 4 4 0.21% 0.21% None Supervisor Wei Zheng Tseng
(Note 2)
Range of Remuneration for pay to Each Supervisor of the Company
Supervisor’s Name
Total amount of the first three remunerations (A+B+C)
The Company All companies in the consolidated financial statements
Lower than 2,000,000 Yan Chiang Fan、Wei Zheng Tseng Yan Chiang Fan、Wei Zheng Tseng
2,000,000 (inclusive) - 5,000,000 (exclusive) - - 5,000,000 (inclusive) - 10,000,000 (exclusive) - -
10,000,000 (inclusive) - 15,000,000 (exclusive) - - 15,000,000 (inclusive) - 30,000,000 (exclusive) - - 30,000,000 (inclusive) - 50,000,000 (exclusive) - -
Total 2 2 Note 1. The Compensation of Supervisor for this table was be calculated based on the percentage of the actual amount distributed last year
passed by the Board of Directors on March, 2019. Note 2. The Company set up the Audit Committee to replace Supervisor by the Shareholders on 2018.6.27. Yan Chiang Fan、Wei Zheng
Tsengwere dismissed after re-election on 2018.06.27.
17
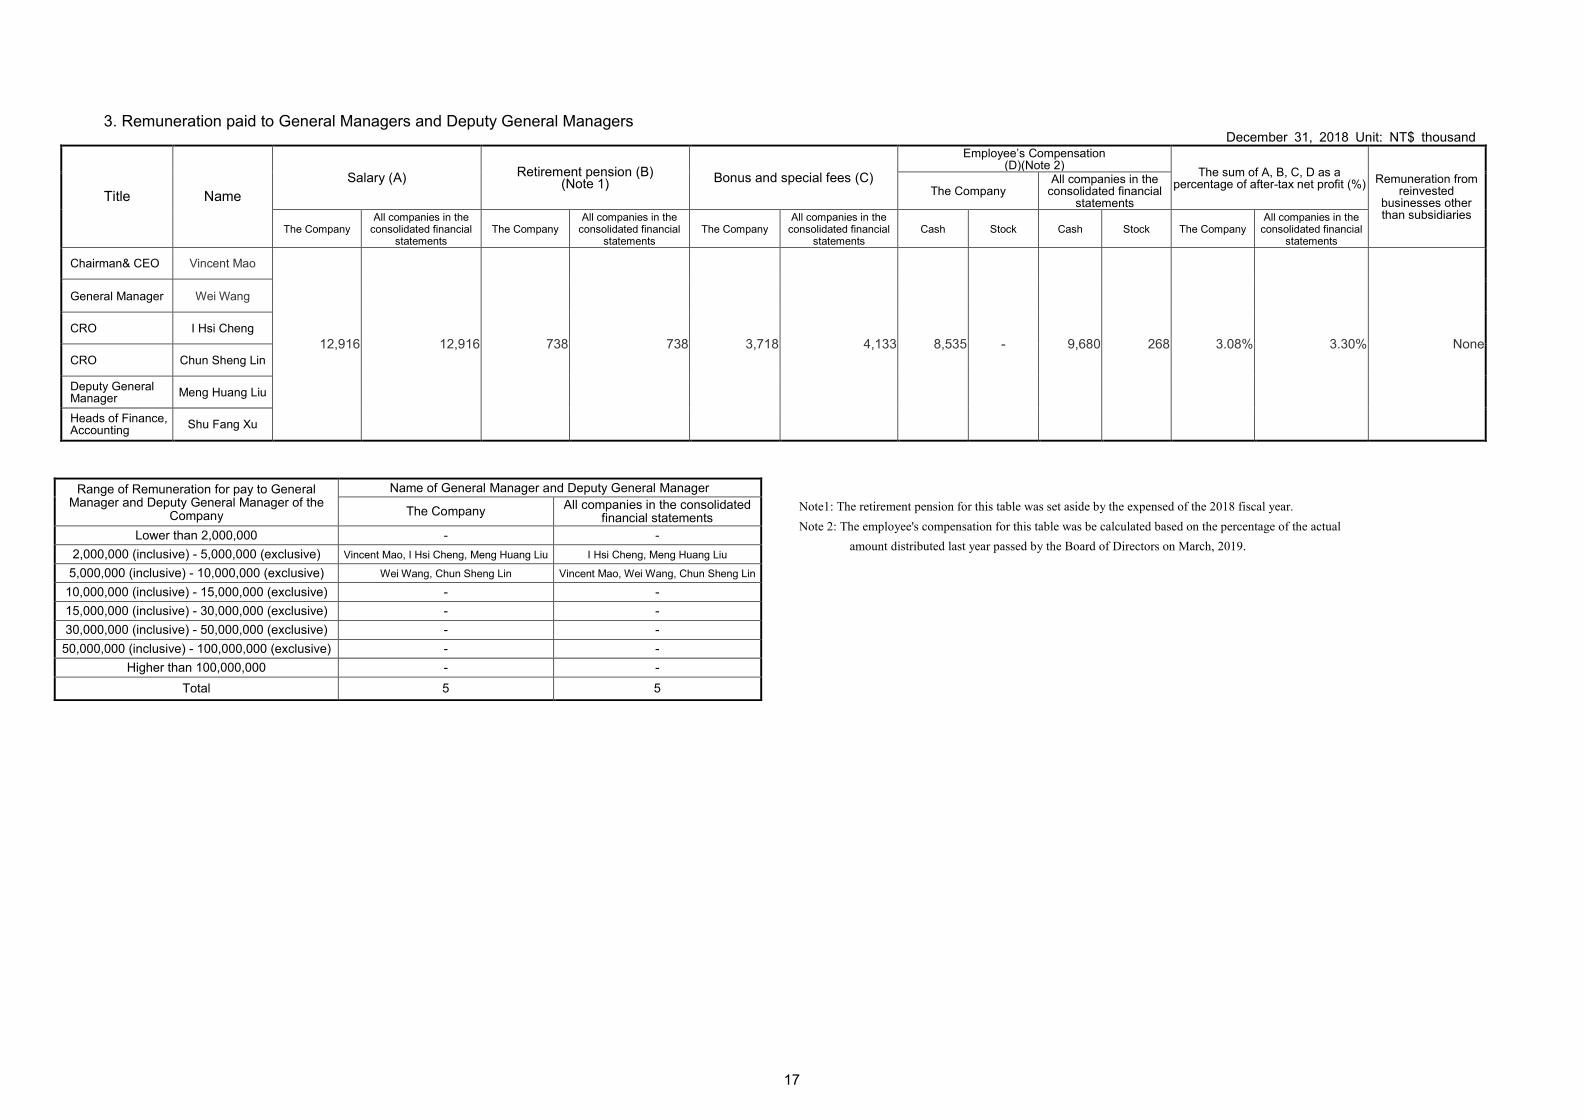
3. Remuneration paid to General Managers and Deputy General Managers December 31, 2018 Unit: NT$ thousand
Title Name Salary (A) Retirement pension (B)
(Note 1) Bonus and special fees (C)
Employee’s Compensation (D)(Note 2) The sum of A, B, C, D as a
percentage of after-tax net profit (%) Remuneration from reinvested
businesses other than subsidiaries
The Company All companies in the
consolidated financial statements
The Company All companies in the
consolidated financial statements
The Company All companies in the
consolidated financial statements
The Company All companies in the
consolidated financial statements
Cash Stock Cash Stock The Company All companies in the
consolidated financial statements
Chairman& CEO Vincent Mao
12,916 12,916 738 738 3,718 4,133 8,535 - 9,680 268 3.08% 3.30% None
General Manager Wei Wang
CRO I Hsi Cheng
CRO Chun Sheng Lin
Deputy General Manager Meng Huang Liu
Heads of Finance, Accounting Shu Fang Xu
Range of Remuneration for pay to General Manager and Deputy General Manager of the
Company
Name of General Manager and Deputy General Manager
The Company All companies in the consolidated financial statements
Lower than 2,000,000 - - 2,000,000 (inclusive) - 5,000,000 (exclusive) Vincent Mao, I Hsi Cheng, Meng Huang Liu I Hsi Cheng, Meng Huang Liu
5,000,000 (inclusive) - 10,000,000 (exclusive) Wei Wang, Chun Sheng Lin Vincent Mao, Wei Wang, Chun Sheng Lin
10,000,000 (inclusive) - 15,000,000 (exclusive) - - 15,000,000 (inclusive) - 30,000,000 (exclusive) - - 30,000,000 (inclusive) - 50,000,000 (exclusive) - -
50,000,000 (inclusive) - 100,000,000 (exclusive) - - Higher than 100,000,000 - -
Total 5 5
Note1: The retirement pension for this table was set aside by the expensed of the 2018 fiscal year. Note 2: The employee's compensation for this table was be calculated based on the percentage of the actual
amount distributed last year passed by the Board of Directors on March, 2019.

18
4. The Name and Distributed Status of the Manager Who Distributed the Employee's Compensation December 31, 2018Unit: NT$ thousand
Title Name Stock Cash Total The sum of as a
percentage of after-tax net profit (%)
Manager
Chairman & CEO Vincent Mao
- 8,535 8,535 1.02
General Manager Wei Wang
CRO I Hsi Cheng
CRO Chun Sheng Lin
Deputy General Manager Meng Huang Liu
Head of Finance, Accounting Shu Fang Xu
Note 1: The employee's compensation for this table was be calculated based on the percentage of the actual amount distributed 2017 fiscal year.
5. Separately compare and describe total remuneration, as a percentage of net income stated in the parent company only financial reports or individual financial reports, as paid by this company and by each other company included in the consolidated financial statements during the past 2 fiscal years to Directors, Supervisors, General Managers, and Deputy General Managers, and analyze and describe remuneration policies, standards, and packages, the procedure for determining remuneration, and its linkage to operating performance and future risk exposure.
Item
TitleCategory
The sum of Remuneration as a percentage of after-tax net profit
2017 Fiscal Year 2018 Fiscal Year
The Company All companies in the
consolidated financial statements
The Company All companies in the
consolidated financial statements
Director(including as a Manager at the same time) 4.19% 5.02% 3.50% 3.94%
Supervisor 0.44% 0.44% 0.21% 0.21%
General Manager and Deputy General Manager 5.83% 6.49% 3.08% 3.30%
The remuneration paid to the Directors and Supervisors by the Company in the last 2 fiscal years was set aside in accordance with the provisions of the Company's articles of incorporation. After review by the Compensation Committee, it was submitted to the Board of Directors for approval, and then submitted to the Shareholders' Meeting for approval and distributed according to the number of Directors and Supervisors.The remuneration paid by the Company to the General Manager and Deputy General Managers was based on their academic qualifications, work experience, working years, personal performance and contribution to the company's overall operations and future risks, and was refer to the payment standard of the same trade concerned and company operating performance, determined by the Board of Directors. The payment of the remuneration between the operating performances of the Company should be positively correlated.

19
4.The State of the Company's Implementation of Corporate Governance (1) The state of operations of the board of directors
The board of Directors convened five regular meetings (A) in the most fiscal year, the Directors’ attendance status is as follows:
Title Name Attendance in Person(B)
By Proxy
Attendance Rate in
Person(%) (%)【B/A】
Remark
Chairman & CEO Vincent Mao 5 0 100% None
Director I Hsi Cheng 5 0 100% None Director Wen Bin Lin 5 0 100% None
Director
Silicon Power Computer &
Communications Inc.
Representative: Hui Ming Chen
4 0 80% None
Director Sheng Su Lee 4 0 80% None
Director Yan Chiang Fan 2 0 67%
(Shall attend 3 times)
2018.06.27 New office
assumed after re-election
Independent director De Cheng Tu 2 0
100% (Shall attend 2
times)
2018.06.27 New office
assumed after re-election
Independent director Cheng Chieh Dai 5 0 100% None
Independent director Chieh Sheng Hsiao 3 0
100% (Shall attend 3
times)
2018.06.27 New office
assumed after re-election
Independent director Yu Nu Lin 3 0
100% (Shall attend 3
times)
2018.06.27 New office
assumed after re-election
Other matters that require reporting:
1. If there is any of the following circumstances for the operation of the board of Directors, it shall state the date, period, content of the proposal of the board meeting, the opinions of all independent directors and the company's handling for the independent directors' opinions.
(1) Matters listed in Article 14-3 of the Securities and Exchange Act: Please refer to p.47 through p.50.
(2) In addition to the preceding matters, other resolution matters of board meeting that opposed or reserved by the Independent Director and appears on record or written statement: None.

20
2. For the implement situation where the Director avoids a motion related to his/her own interests, it shall state the name of directors, the content of the proposal, the reasons for the avoidance of interests and the participation in the voting:
2018.03.15Board Meeting: Vincent Mao、I Hsi Cheng refused and did not participate in the discussion and voting because of the "Distribution of Operation and Project Bonus for Manager of 2017 fiscal year review by the Compensation Committee" involving their own interests. 2018.03.15Board Meeting: Vincent Mao、I Hsi Cheng refused and did not participate in the discussion and voting because of the "Distribution of Compensation for Employee, Directors and Supervisors of 2017 fiscal year" involving their own interests. 2018.05.04 Board Meeting: Vincent Mao、I Hsi Cheng refused and did not participate in the discussion and voting because of the "Adjustment of Salary for Manager review by the Compensation Committee" involving their own interests. 2018.06.27 Board Meeting: Cheng Chieh Dai、Chieh Sheng Hsiao andYu Nu Lin refused and did not participate in the discussion and voting because of the " Appointment of committee members of the Compensation Committee of the Company" involving their own interests. 2018.08.02 Board Meeting: Vincent Mao、I Hsi Cheng refused and did not participate in the discussion and voting because of the "The First Cash Distribution of Managers and Employees of 2017 fiscal year review by the Compensation Committee" involving their own interests. 2018.11.02 Board Meeting: Vincent Mao、I Hsi Cheng refused and did not participate in the discussion and voting because of the " The Second Cash Distribution of Managers and Employees of 2017 fiscal year review by the Compensation Committee" involving their own interests.
3. An evaluation of targets for strengthening of the functions of the board during the current and immediately preceding fiscal years, and measures taken toward achievement thereof:
Targets for Strengthening of the
Functions of the Board The evaluation of Implementation Status
Improve the quality of the Board of Directors
Improved the function of the Board of Directors, adopted a candidates nomination system, the members are diverse and professional. Arranged the Directors to participate in advanced courses every year and regularly advocates policies and regulations to enhance the Board's operational and decision-making capabilities.
Establish the Board of Directors a sound structure
Fully re-elected and set up the Audit Committee on 2018 fiscal year, each important proposal was reviewed by all independent directors in professional capacity.

21
Besides, Set up the Compensation Committee to evaluate and review the compensation system of the Company's Directors and Managers every year, and make recommendations to the Board of Directors for decision-making by the Board of Directors.
The compliance of Director recuse himself to avoid conflicts of interest
Where a director is required to refuse the proposal involving a conflict of interest, the director refused voluntarily from the proposal.
Evaluate the independence of the CPA
The Company's current entrusted “Deloitte & Touche” is one of the four major domestic firms. The Board of Directors regularly evaluates the independence of the CPA on the following matters to enhance the trustworthiness of the Company's financial reports: 1. An independent declaration issued by the CPA. 2. Ensure the CPA has no significant financial
interests or potential employment relationships with the Company and subsidiaries, which will affects his independence.
3. The same accountant has not continuously implemented attesting services for more than seven years.
The compliance of laws and policies
The Board of Directors has indeed complied with the operation of the “Rules for the Proceedings of Board Meetings” and adhered to the information transparency. The important resolutions of the Board of Directors were publicly announced and filed on the Market Observation Post System,MOPS and the Company's website in accordance with the regulations, and the implementation was in good condition.
Internal Control
The auditing unit supervises the Company's internal control and risk management, and the auditing supervisor attend the Board of Directors to report its implementation.

22
(2)The state of operations of the Audit Committee
The Audit Committee convened two regular meetings (A) in the most fiscal year, the Directors’ attendance status is as follows:
Title Name Attendance in Person(B)
By Proxy Attendance
Rate in Person(%) (%)【B/A】
Remark
Independent director
Cheng Chieh Dai
2 0 100% None
Independent director
Chieh Sheng Hsiao
2 0 100% None
Independent director Yu Nu Lin 2 0 100% None
Other matters that require reporting:
1.Matters listed in Article 14-5 of the Securities and Exchange Act and the matter was not approved by the Audit Committee, but had the consent of more than two-thirds of all Directors, it shall state the date, period, content of the proposal of the board meeting, the result of the Audit Committee for the proposal and the company's handling for the Audit Committees' opinions.
Date of Meeting Matters about Important Resolutions
The matter was not approved by the Audit Committee,
but had the consent of more than two-thirds of
all directors
2018.8.2 The 1st board
meeting of the 1st
term
Passed the Company’s consolidated financial reports for the second quarter of 2018. Note
Passed the Lending to subsidiary(Sync-Tech System Corp.). Note
Passed the Lending to subsidiary(Infinno Technology Corp.). Note
Passed the ratification of provide endorsement and guarantee for subsidiary's application for bank loan quota (Sync-Tech System Corp.).
Note
Passed the ratification of provide endorsement and guarantee for subsidiary(HeFei Sitronix Co., Ltd). Note
Passed the Change of audit supervisor of the Company. Note
2018.11.2 The 2nd board
meeting of the 1st
term
Passed the Internal Audit Plan of 2019 fiscal year. Note
Passed the Evaluation of independence of CPA. Note
Passed the CPA’s Professional Fees. Note
Passed the Adjustment of the amount of endorsements and guarantees for subsidiaries. Note
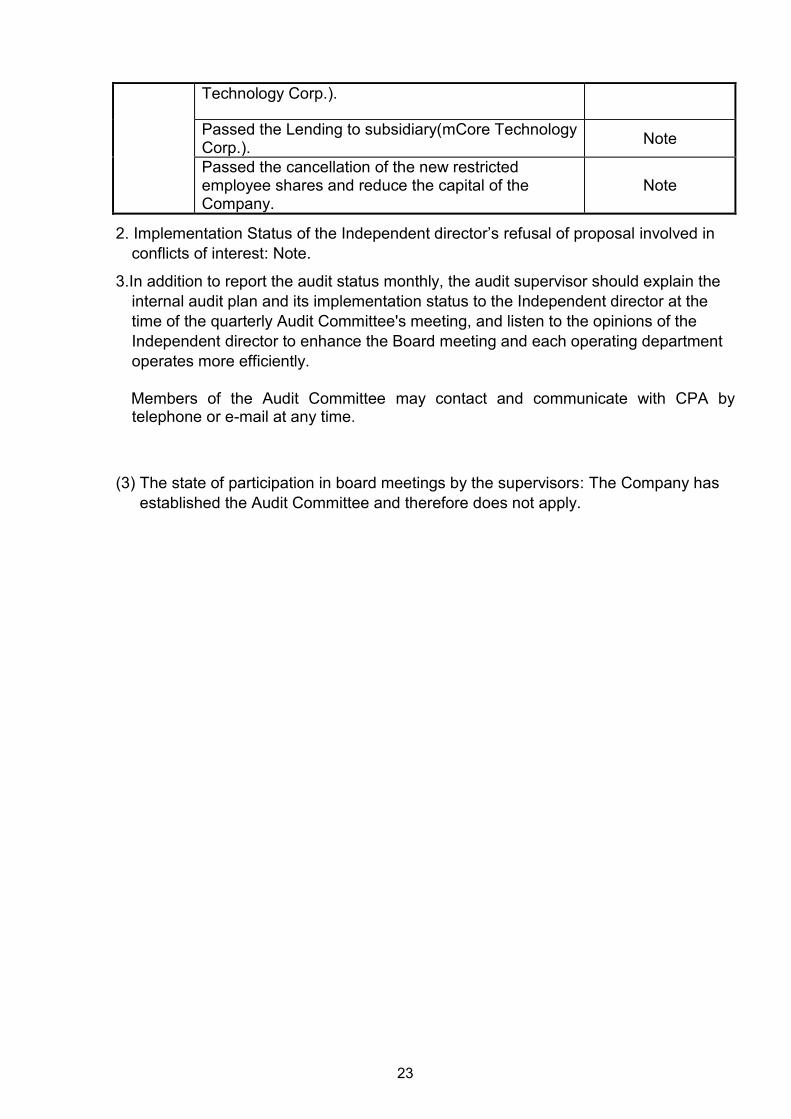
Passed the Lending to subsidiary(Forcelead Note
23
Technology Corp.).
Passed the Lending to subsidiary(mCore Technology Corp.). Note
Passed the cancellation of the new restricted employee shares and reduce the capital of the Company.
Note
2. Implementation Status of the Independent director’s refusal of proposal involved in conflicts of interest: Note.
3.In addition to report the audit status monthly, the audit supervisor should explain the internal audit plan and its implementation status to the Independent director at the time of the quarterly Audit Committee's meeting, and listen to the opinions of the Independent director to enhance the Board meeting and each operating department operates more efficiently.
Members of the Audit Committee may contact and communicate with CPA by telephone or e-mail at any time.
(3) The state of participation in board meetings by the supervisors: The Company has established the Audit Committee and therefore does not apply.

24
(4)The state of the company’s implementation of corporate governance, any departure of such implementation from the Corporate Governance Best-Practice Principles for TWSE/TPEx Listed Companies, and the reason for any such departure:
Assessment Item Operations Status Any departureand
reason for such Yes No Description 1. Does the company follow the “Corporate
Governance Best-Practice Principles for TWSE/GTSM Listed Companies”, and has the company established and disclosed its own Corporate Governance Best-Practice Principles?
The Company has not enacted "Corporate Governance Best-Practice Principles", but it has been operating in accordance with the relevant provisions of the Company Act and the Securities and Exchange Act and the current conditions of the Company, and has enacted"Rules and Procedures of Shareholders Meeting", "Rules and Procedures of Board of Director Meetings", "Procedures for Endorsement & Guarantee", "Procedures for Lending Funds to Other Parties", "Procedures for Acquisition or Disposal of Assets", "Policies and Procedures for Financial Derivatives Transactions" etc., its contents is consistent with the spirit of the “Corporate Governance Best-Practice Principles”.
No significant departure
2. The company's shareholding structure and shareholders' equity (1) Has the company set up internal operating
procedures to handle shareholder proposals, doubts, disputes and litigation matters and followed the procedures?
(2) Does the company have a list of its major
shareholders and theultimate controllers of the major shareholders?
(1) The Company has enacted the "Rules and Procedures
of Shareholders Meeting" and set up a speech system in accordance with the regulations. The spokesperson has appropriately handled issues such as shareholder suggestions or disputes. The Company has set up a spokesperson contact e-mail on the Company's website to facilitate good communication between the Company and investors.
(2) The Company has controlled the list of its major shareholders in accordance with the register of shareholders provided by the shareholder services agent, and has filed the transaction information of the
No significant departure

25
Assessment Item Operations Status Any departureand
reason for such Yes No Description (3) Has the company established and
implemented risk management and firewall mechanisms with its affiliates?
(4) Has the company set up an internal standard
to prohibit the insiders’ use of private information to trade securities?
directors and supervisors and major shareholders on a monthly basis.
(3) The Company has enacted “Supervisor Measures for Subsidiary”, "Procedures for dealing with related parties, specific companies and groups", and transactions within the affiliated enterprises were carried out in accordance with the Measures and Procedures.
(4) The Company has enacted the “Operating Procedures for Manage and Control for Preventing Insider Trading” to prevent insiders from using the undisclosed information on the market to purchase or sell securities.
3. The Composition and Duties of the Board of Directors
(1) Has the board of directors formulated a diversified approach based on the composition of its members and implemented it?
(2) Has the company set upother types of
functional committees voluntarily in addition to the remuneration committee and the audit committee according to law?
(1) The Board of Directors of the Company consists of 9
people, 3 of whom are Independent directors. One Independent director is a female with a CPA qualification who specializes in financial accounting. One Director is the CRO with R & D expertise, the rest of the Director members are the Company's Chairman & CEO or General Manager whose expertise includes marketing, corporate management, etc. The Directors all have the international perspective in compliance with the diversity policy.
(2) The Company has set up the Compensation Committee & Audit Committee. In the future, the company will evaluate and set up other functional committees in the direction of corporate governance.
No significant departure

26
Assessment Item Operations Status Any departureand
reason for such Yes No Description (3) Has the company set up a performance
appraisal method and an assessment method for the board of directors, and conducted performance appraisal on a regular basis every year?
(4) Does the company regularly evaluate the independence of its certifying accountants?
(3) The Company has regularly evaluated the operation of the Board of Directors annually through such as internal control and internal auditing system.
(4) The Company's current entrusted “Deloitte & Touche” is
one of the four major domestic firms. The Board of Directors regularly evaluates the independence of the CPA on the following matters to enhance the trustworthiness of the Company's financial reports: 1. An independent declaration issued by the CPA. 2. Ensure the CPA has no significant financial interests or
potential employment relationships with the Company and subsidiaries, which will affect his/her independence.
3. The same accountant has not continuously implemented attesting services for more than seven years.
No significant departure
4. Has the TWSE/TPEx listed company set up a dedicated (or concurrent) corporate governance unit or appointed personnel responsible for corporate governance related matters (including but not limited to providing the directors and supervisors with required information to carry out their business, handling corporate registration and change of corporate
The company has not set up a corporate governance unit, and the accounting unit is responsible for handling matters related to the Board and Shareholders' meetings, handling the corporate registration and change of corporate registration related matters, taking the minutes of board meetings and shareholders' meetings.
No significant departure

27
Assessment Item Operations Status Any departureand
reason for such Yes No Description registration related matters and taking the minutes of board meetings and shareholders' meetings)?
5. Has the company established a communication channel with stakeholders (including but not limited to shareholders, employees, customers and suppliers), set up an interested party page on the company's website, and responded appropriately to interested parties concerning important corporate social responsibility issues?
(1) Stakeholders can communicate with the Company through our spokesperson and acting spokesperson. The Company's website also has a stakeholder area, an e-mail address and contact telephone number are also set up for interested parties.
(2) The Company's website has a technical support service mailbox, and the dedicated person is responsible for handling the application issues of the product.
(3) The Company's website has also disclosed the contact information of the shareholder services agent and CPA, providing investors with contact information.
No significant departure
6. Does the company appoint a professional stock agency to handle shareholders’ meeting related affairs?
The Company has appointed the share administration agency of the Taishin International Bank as the shareholder services agent to handle the shareholders' meeting.
No significant departure
7. Information disclosure (1) Has the company set up a website to disclose
financial and corporate governance information?
(2) Does the company adopt other information
disclosure methods (such as setting up an English website, appointing a dedicated person responsible for the collection and disclosure of company information,
(1) The Company has set up a website to disclose company
profiles, basic information and financial information. The information is disclosed and maintained by the dedicated person. Website: (http://www.sitronix.com.tw).
(2) The Company's website contains information in both, a spokesperson and an acting spokesperson. The Company's website and public information observatory are used to disclose company-related operational information.
No significant departure

28
Assessment Item Operations Status Any departureand
reason for such Yes No Description implementing the spokesperson system, and posting the company's corporate briefing process on the website, etc.)?
8. Does the Company have any other important information (including but not limited to employees' rights, employee care, investor relations, supplier relationship, rights and interests of interested parties, training for directors and supervisors, implementation of risk management policies and risk measurement standards, implementation of customer policies, the Company’s purchase of liability insurance for directors and supervisors, etc.)?
(1) The Company protects the rights and interests of employees under the norms and spirit of the Labor Laws. The Company provides the work environment with equals, so that employees can work with peace of mind and without any worry. The company maintains a harmonious atmosphere with a corporate culture of mutual respect, implements various education and training, encourages colleagues to learn and grow, and enhances competitiveness. The company also has good welfare policies, including: annual health checkups, group commercial insurance, domestic travel and foreign travel subsidies, various sports competitions, subsidized gym fees, etc.
(2) The Company has set up the special investor relations department, and has established [investor relations] on the company's website to instantly update investors on important financial and stock information. The Company has also provided the spokesperson's contact information and e-mail to facilitate good communication between the company and investors.
(3) The Company regularly communicates with and audits suppliers every year, and assists in improving the production process to avoid harm to the environment and employees, ensuring that the products meet the
No significant departure

29
Assessment Item Operations Status Any departureand
reason for such Yes No Description requirements of the customer and the European Union's Restriction of Hazardous Substances Directive(RoHS).
(4)The Company has purchased liability insurance for the Director, Independent director and key managers to strengthen the protection of shareholders' equity. Relevant information has been announced in the Mops. (Code: 8016)
9. Please state the improvements made to the items in the corporate governance evaluation results issued by the Corporate Governance Center of the Taiwan Stock Exchange Co., Ltd., and indicate the enhancement and improvement measures for the items not yet improved (not applicable if not included as a company to be evaluated). Not applicable.

30
(5) If the Company has a compensation committee in place, the composition, duties, and operation of the compensation committee shall be disclosed
1.Information on the Compensation Committee’s Member
Identity (Note 1)
Conditions
Name
5 or More Years of Work Experience and Professional Qualifications (Note 1)
Meets the Independence (Note 2)
Number of Other Public
Companies in Which is
Concurrently Serving as an Independent
Director
Remark (Note 3)
A lecturer or higher in a department of commerce, law, finance, accounting, or other academic department related to necessary for the business of the company, in a public or private junior college, college, or university
A judge, public prosecutor, attorney, certified public accountant, or other professional or technical specialist who has passed a national examination and been awarded a certificate in a profession necessary for the business of the company
Have work experience in the area of commerce, law, finance, or accounting, or otherwise necessary for the business of the company
1 2 3 4 5 6 7 8
Independent director
Cheng Chieh Dai 0 No such
situation
Independent director
Chieh Sheng Hsiao 0 No such
situation
Other Jian Hua Pan (Note 4) 0 No such
situation Independent
director Yu Nu Lin
(Note 5) 0 No such situation
Note 1.In the Identity column, please fill in:Director, Independent director or other.
Note 2. Where the each member meets the following conditions during the two years prior to the position being assumed or during the term of office, please tick the corresponding boxes below codes.
(1) Not an employee of the Company or any of its affiliates. (2) Not a director or supervisor of the Company or any of its affiliates. Not applicable in cases where the person is an independent director of the
Company, its parent company, or any subsidiary in which the Company holds, directly or indirectly, more than 50% of the voting shares. (3) Not a natural-person shareholder who holds shares, together with those held by the person’s spouse, minor children, or held by the person
under others’ names, in an aggregate amount of 1% or more of the total number of outstanding shares of the Company or ranking in the top

31
10 in holdings. (4) Not a spouse, relative within the second degree of kinship, or lineal relative within the third degree of kinship, of any of the persons in the
preceding three subparagraphs. (5) Not a director, supervisor, or employee of a corporate shareholder who directly holds 5% or more of the total number of outstanding shares
of the Company or who holds shares ranking in the top five holdings. (6) Not a director, supervisor, officer, or shareholder holding 5% or more of the shares, of a specified company or institution which has a
financial or business relationship with the Company. (7) Not having a marital relationship, or a relative within the second degree of kinship to any other director of the Company. (8) Not been a person of any conditions as defined in Article 30 of the Company Act.
Note 3. If the identity of the member is a director, please explain whether it meets the provision of Article 6, paragraph of the ”Regulations Governing the Appointment and Exercise of Powers by the Remuneration Committee of a Company Whose Stock is Listed on the Stock Exchange or Traded Over the Counter”.
Note 4. Dismissed after re-election on 2018.06.27.
Note 5. New office assumed after re-election on 2018.06.27.

32
2. Information for the state of operations of the Compensation Committee
1. The total number of members of the Compensation Committee of the Company is 3.
2. Current member’s tenure: From June27, 2018 to June 26, 2021. In the most recently fiscal year, the Committee held five meetings (A), and the member’s qualifications and attendance are as follows:
Title Name Attendance in Person(B)
By Proxy
Attendance Rate in Person(%)
(B/A) Remark
Convener Cheng Chieh Dai 5 - 100% None
Member Chieh Sheng Hsiao
5 -
100% None
Member Jian Hua Pan 3
- 100% (Shall attend 3
times)
Dismissed after re-election on 2018.06.27
Member Yu Nu Lin 2 - 100%
(Shall attend 2 times)
New office assumed after re-election on 2018.06.27
Other matters that require reporting:
The matters of discussion and result of resolution of the Compensation Committee in most recently fiscal year:
Items Matters of Discussion Result of Resolution Handling 2018.03.05
The 15th board meeting of the
3thterm
Distribution of Compensation for Employee, Directors and Supervisors of 2017 fiscal year
In addition to Some members did not participate in the discussion and vote because of conflicts of interest, the rest attending members agreed to pass the resolutions.
None
2018.03.29 The 16th board meeting of the
3thterm
Adjustment of Salary for Manager
All attending Members of the Compensation Committee agreed to pass the resolutions.
None
2018.5.25 The 17th board meeting of the
3thterm
The First Cash Distribution of Managers and Employees of 2017 fiscal year
All attending Members of the Compensation Committee agreed to pass the resolutions.
None
2018.10.5 The 1st board meeting of the
4thterm
The Second Cash Distribution of Managers and Employees of 2017 fiscal year
All attending Members of the Compensation Committee agreed to pass the resolutions.
None

33
2018.12.21 The 2nd board meeting of the
4th term
Distribution of Managers Operation and Project Bonus of 2018 fiscal year
All attending Members of the Compensation Committee agreed to pass the resolutions.
None
If the board of Directors does not adopt or amend the suggestions of the Compensation Committee, it shall state the date of the meeting, the term, the content of the proposal, the resolution results of the Board of Directors and the handling of the members' opinions of the Compensation Committee by the Company(such as if the proposal of compensation passed by the Board of Directors is better than the suggestions of the Compensation Committee, it shall state the departures and reason/s for such departure): None. Resolutions of the Compensation Committee, if the member had any objection or reservation and appeared on record or written statement, it shall state the date of the meeting, the term, the content of the proposal, the opinions of all members and the handling of the members' opinions.: None.

34
(6)The State of the Company's Performance of Corporate Social Responsibility(CSR):
Assessment Item Operations Status Any departure and
reason for such Yes No Description
1. Implementation of Corporate Governance (1) Has the Company set up a Corporate Social
Responsibility Policy or System and a review of the implementation effectiveness?
(2) Does the Company regularly conduct social
responsibility education and training? (3) Has the Company set up a dedicated (or
concurrent) corporate social responsibility promotion unit which is authorized by the board of directors to be managed by the high-level management and reports to the Board of Directors?
(4) Has the Company formulated reasonable remuneration policy and combined the staff performance appraisal system with the corporate social responsibility policy, and set up clear and effective reward and punishment system?
(1) The Company has incorporated the spirit of Corporate
Social Responsibility into Corporate Governance activities, the development of sustainable environment and the maintenance of Social Charity, such as the establishment of the Independent Director System, the development of Energy-Saving and Carbon-Reducing power management products and the implementation of employee basic rights regulations, etc. and continue to promote related activities.
(2) The Company has long cultivated professional talents and accumulated its deep technology and experience to enhance the Company's business growth.
(3) The Company has not set up a dedicated (or concurrent) corporate social responsibility promotion unit.
(4) The Company has enacted an employee
compensation policy based on the requirements of the Labor Laws and the level of satisfaction of investors. It has also set up appraisal methods such as “Measures for Promotion by Performance and Management” and “Guidelines for Salary Operating”, to measure the contribution of employees to achieve organizational
No significant departure

35
Assessment Item Operations Status Any departure and
reason for such Yes No Description goals, as well as the basis for decision-making on talent training, development, recruitment and rewards. The Company rewards and punishes the employees with fairness, openness, and rewards and punishments as the principle, in order to use the system of rewards and punishments to achieve the goal of stimulating morale and strengthening discipline. The Company has also set up a number of rewards policies such as: "Patent Application and Rewards Measures" in order to encourage employees to apply for patents. In addition, the Company also provides a safe and reasonable working environment for all employees and safeguards employees' rights and interests, in order to fulfill its Corporate Social Responsibility.
2. Development of a Sustainable Environment (1) Is the Company committed to improving the
efficiency in the use of resources, and the use of recycled materials with low environmental impact?
(2) Has the Company established an appropriate
environmental management system according to its industrial characteristics?
(1) The Company’s products are Contract Manufacturing.
The Company also requires the outsourcers and suppliers to provide the Company's products and packaging materials while in compliance with the European Union’s RoHS directives and Customers' requirements for Green Environmental Protection.
(2) The Company cooperates with the government's policies to carry out the classification, recycling and reduction of various wastes, and introduces electronic operations in daily operations to reduce paper waste.
No significant departure

36
Assessment Item Operations Status Any departure and
reason for such Yes No Description (3) Is the Company aware of the impact of climate
change on its operations, and has it implemented greenhouse gas checking and developed a strategy for reduction of energy consumption and carbon emission as well as greenhouse gas reduction?
(3) The Company has continued to promote the concept of energy saving to employees, and reminded employees to turn off the unused power supply, and set the air conditioner at a reasonable temperature, as well as gradually replace the Energy-Saving Lamps, in order to achieve the goal of Energy-Saving and Carbon-Reduction.
No significant departure
3. Social Charity (1) Has the Company formulated relevant
management policies and procedures in accordance with relevant laws and regulations and international human rights conventions?
(2) Has the Company set up an employee
complaint mechanism and channel, and properly handles employee complaints?
(3) Does the Company provide a safe and healthy working environment for employees and regularly carry out safety and health education for employees?
(1) The Company complies with Labor Laws and relevant
regulations, protects the legitimate rights and interests of employees, as well as enacts Employee Manuals and Personnel Operation Regulations. Employees also can obtain the information that they need through the internal information network to protect their rights and interests.
(2)The Company has an employee-specific complaint mailbox inside, which is handled by a special person.
(3)The Company's office is equipped with a staff rest area, a newspaper reading area, a nursing room, etc., and provides a good working environment to employees. The Company has a security system, access to the
building elevators and company doors require swiping for access, and the first floor of the office building has security management, in order to maintain employee safety. The Company cooperates with the building
management unit to perform fire drills once a year
No significant departure

37
Assessment Item Operations Status Any departure and
reason for such Yes No Description (4) Has the Company established a mechanism for
regular employee communication and to keep them informed in a reasonable manner of the changes in the operation which may have a significant impact on the employees?
(5) Has the Company developed an effective training program for employees?
to improve the resilience of disasters, and assigns employees to participate in fire training each year. The Company implements employee health checks
each year and subsidizes gym fees of employees. In addition to the legally guaranteed employee
rights, the Company also provides other benefits to employees, such as group medical care, as well as provides a comfortable and safe working environment for employees.
(4) The Company regularly announces the information on the Company's Operating Revenue that was publicly announced on the Mops on the Company's website every month to let employees know, and the employees of all departments can achieve two-way communication through internal department meetings.
(5) The Company attaches great importance to the training and development of talents, and plans relevant management or other professional field courses according to work needs to provide training for employees. In addition to the basic professional internal training, the Company also provides subsidies for employees to have external training opportunities, and through experience sharing and inheritance, in order to achieve mutual learning and refined results. The Company also provides patent bonuses to encourage employees to apply for patents, in order to urge employees to break through and develop in the professional field.

38
Assessment Item Operations Status Any departure and
reason for such Yes No Description (6) Has the Company formulated relevant policies
and complaint procedures for the protection of consumers' rights in respect of R&D, procurement, production, operations and service processes?
(7) Does the Company comply with relevant laws and regulations and international standards for the marketing and labeling of products and services?
(8) Does the Company check whether a supplier
has any record of environmental and social impact before doing any business with the supplier?
(9) Does the contract between the Company and
its principal supplier contain the condition that the contract may be terminated at any time if the supplier is involved in a policy that violates its Corporate Social Responsibility and has a significant impact on the environment and society?
(6)The Company has set up the procedures on R & D, procurement, production, operation and service, and set up Customer Complaints Procedures as well as FAE technical service contact mailbox on the Company's website with a dedicated person to handle customer's complaints.
(7) The Company cooperates with the requirements of the RoHS Directives to establish a green supply chain management, and requires Suppliers and Outsourcers to supply the products, materials and packaging materials used by the Company to comply with relevant regulations.
(8)The Company has enacted Measures for Supplier Management, suppliers shall pass the ISO9001 evaluation, and the products shall meet the requirements of the EU Restriction of Hazardous Substances Directive (RoHS) and Q3-20 environmental restricted substances management measures.
(9)The Company regularly evaluates and audits according to the “Procedures for Supplier Management”. If there are any unqualified, the Suppliers are required to improve before the deadline, those who still fail after re-verification will be disqualified from the list of qualified suppliers.
4. Strengthening information disclosure (1) Does the Company disclose relevant and
(1) Through the annual report and the company's website,
No significant departure
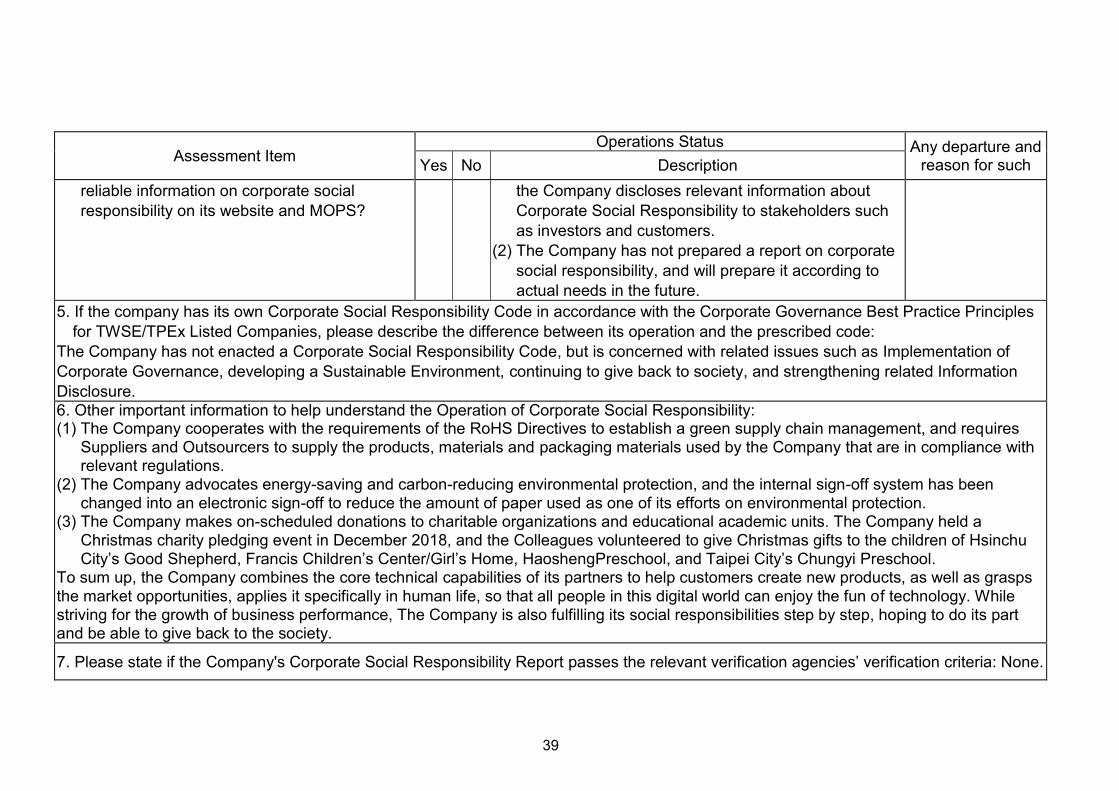
39
Assessment Item Operations Status Any departure and
reason for such Yes No Description reliable information on corporate social responsibility on its website and MOPS?
the Company discloses relevant information about Corporate Social Responsibility to stakeholders such as investors and customers.
(2) The Company has not prepared a report on corporate social responsibility, and will prepare it according to actual needs in the future.
5. If the company has its own Corporate Social Responsibility Code in accordance with the Corporate Governance Best Practice Principles for TWSE/TPEx Listed Companies, please describe the difference between its operation and the prescribed code:
The Company has not enacted a Corporate Social Responsibility Code, but is concerned with related issues such as Implementation of Corporate Governance, developing a Sustainable Environment, continuing to give back to society, and strengthening related Information Disclosure. 6. Other important information to help understand the Operation of Corporate Social Responsibility: (1) The Company cooperates with the requirements of the RoHS Directives to establish a green supply chain management, and requires
Suppliers and Outsourcers to supply the products, materials and packaging materials used by the Company that are in compliance with relevant regulations.
(2) The Company advocates energy-saving and carbon-reducing environmental protection, and the internal sign-off system has been changed into an electronic sign-off to reduce the amount of paper used as one of its efforts on environmental protection.
(3) The Company makes on-scheduled donations to charitable organizations and educational academic units. The Company held a Christmas charity pledging event in December 2018, and the Colleagues volunteered to give Christmas gifts to the children of Hsinchu City’s Good Shepherd, Francis Children’s Center/Girl’s Home, HaoshengPreschool, and Taipei City’s Chungyi Preschool.
To sum up, the Company combines the core technical capabilities of its partners to help customers create new products, as well as grasps the market opportunities, applies it specifically in human life, so that all people in this digital world can enjoy the fun of technology. While striving for the growth of business performance, The Company is also fulfilling its social responsibilities step by step, hoping to do its part and be able to give back to the society.
7. Please state if the Company's Corporate Social Responsibility Report passes the relevant verification agencies’ verification criteria: None.

40
(7)The State of the Company’s Performance in the Area of Good Faith Management and the Adoption of Related Measures:
Assessment Item Operations Status Any departure and
its reason for such Yes No Description 1. Setting Business Integrity Policies and Programs (1) Does the Company express its commitment to the
policies and practices of integrity management in its regulations and in the external documents, and do the board of directors and the management actively implement the business policies?
(2) Has the company set up a program for the
prevention of dishonesty as well as the procedures, conduct guidelines and a disciplinary and appeals system in various programs and implemented them?
(3) Has the Company adopted precautionary measures in respect of business activities with a high risk of dishonesty in Article 7 (2) of the Corporate Governance Best Practice Principles for TWSE/TPEx Listed Companies?
(1) The Board of Directors and the Management Team of the Company operate the business in good faith. The Company operates in compliance with various domestic laws and has internal control systems and various management regulations. The Company's Employee Handbook states that employees must comply with all management regulations and work rules, and faithfully perform their duties.
(2)The Company conducts educational training for employees or makes internal announcements to emphasize and promote the concept of integrity.
(3)The Company has set up effective internal control systems and regulation of report for fraudulent conduct. The Company has also set up various rules on rewards and punishment in the employee handbook, which clearly stipulates that employees must not engage in various fraud acts, illegal acts or damage the company's reputation.
No significant departure

41
Assessment Item Operations Status Any departure and
its reason for such Yes No Description 2. Implementation of Integrity Management (1) Does the Company assess the integrity record of
its business partner, and stipulate the terms of conduct on integrity in the contract with the business partner?
(2) Has the company set up a dedicated (or concurrent) corporate integrity promotion unit under the board of directors which regularly reports to the board on its work?
(3) Has the company formulated policies to prevent
conflicts of interest, provided appropriate channels for statements and implemented them?
(4) Has the Company established an effective
(1) The Company's business activities all follow the
Internal Control Systems and various management measures, and it has set up the procedures for supplier management. The Company has conducted regular evaluations of suppliers, and if there is any bad record, the said supplier will be replaced.
(2)The Company has not set up a special unit to promote Corporate Social Responsibility, but each department has taken a functional division of labor and supervised each other's daily operations in order to implement the Company's integrity management philosophy.
(3)The Company's Rules and Procedures of the Board of Directors’ Meetings expressly stipulates that any director has a stake in the matters of the meeting and its own or its legal representative, and if there is a conflict of interest with the Company, shall not join the discussion and vote, as well as shall not act on behalf of the other directors. If there is a related party transaction, it shall handle it in accordance with the Measures for Related Party Transaction Management.
(4)The Company has set up an effective accounting system and internal control system sin accordance
No significant departure

42
Assessment Item Operations Status Any departure and
its reason for such Yes No Description accounting system and internal control system for the implementation of integrity management, which is checked by the internal auditing unit on a regular basis or audited by external auditors?
(5) Does the company hold regular internal and external training on business integrity?
with the relevant laws and regulations. Internal auditors have performed audits in accordance with the audit plan, reported to the Board of Directors on a quarterly basis, and sent the reports to the Independent directors and Supervisors for signing before the end of the Audit Report.
(5)If the Securities Authorities have lectures on Laws and Regulations, Accounting, Corporate Governance, etc., the Company has already sent staff to participate. The Company's Director has participated in related courses such as Corporate Governance every year.
No significant departure
3. Operation of the Company Reporting System (1) Has the company set up specific reporting and
reward systems and a convenient reporting channel, and does the company assign appropriate personnel to investigate the person being reported?
(2) Has the company set up standard investigation
procedures and a related confidentiality mechanism for the matter being reported?
(1) The Company has set up a system to reward employee's performance and patent application. The Company has also set up the "Regulationsfor theReporting of Fraudulent Conduct" and "Measures for Employees' Complaints". Employees may follow the measures to file a report or complaint, and will be accepted by the responsible personnel.
(2) The Company has set up the "Regulations for the Reporting of Fraudulent Conduct", which clearly stipulates the standard operating procedures and related confidentiality mechanisms.
No significant departure

43
Assessment Item Operations Status Any departure and
its reason for such Yes No Description (3) Does the company take measures to protect the
reporter from improper treatment? (3) The Company will protect the one who made the
report and will make sure that the case is properly investigated.
4. Strengthening of Information Disclosure Does the Company disclose the contents of its Code
of Practice for Business Integrity and the effectiveness on its website and MOPS?
The information on the Company’s website (www.sitronix.com.tw) is collected and maintained by special personnel, and is regularly announced and updated to provide investors with access to financial and business information.
No significant departure
5. If the Company has its own Ethical Corporate Management Best Practice Principles in accordance with the "Ethical Corporate Management Best Practice Principles for TWSE/GTSM Listed Companies", please describe the difference between them:
The Company has not set up such Principles.
6. Other important information that will help stakeholders to understand the operation of the Company's integrity: (Such as the Company has reviewed and amended its Principles of good faith, etc.)
The Company's business philosophy attributes integrity as an important part, and lets the Board of Directors announce to the team of managers, as well as inculcates this concept in the customers, employees, suppliers and shareholders. For customers and suppliers, the Company has negotiated with them the delivery and quality of each product in a fair and reasonable manner. For shareholders, the Company provides the information of the Company in a timely manner according to the regulations of the competent authorities. As for the employees, the Company has also communicated the importance of integrity and the Company's related regulations through performance appraisal and training, to inculcate in them an honest and trustworthy behavior.

44
(8) Inquiry on Corporate Governance Best Practice Principles and related regulations:
The Investors can obtain information on the MOPS (code: 8016) or on the Company's website (http://www.sitronix.com.tw).
(9) Other important information to enhance the understanding of the corporate governance of the Company:
The Inquiry method is as follows:
1. The information on the Company’s website (www.sitronix.com.tw) is collected and maintained by special personnel, and is regularly announced and updated to provide investors with access to financial and business information.
2. The MOPS (code: 8016).

45
(10) Implementation of the Internal Control Systems 1. Internal Control Statements
Sitronix Technology Corp.
Statement of Internal Control Systems Date: March 15, 2019
Based on the findings of a self-assessment,the following statement is made with regard to the Company’s internal control systems during the 2018 fiscal year:
1. Sitronix has established an adequate internal control system. Sitronix’s Board of Directors and Managers are responsible for establishing, implementing, and maintaining the internal control systems. Our internal control system is a process designed to provide reasonable assurance over the effectiveness and efficiency of our operations (including pro fitability, performance and safeguarding of assets), reliability, timeliness, transparency of our reporting, and compliance with applicable laws, regulations and bylaws.
2. An internal control system has inherent limitations. No matter how perfectly designed, an effective internal control system can only provide reasonable assurance of accomplishing the preceding three objectives. Moreover, the effectiveness of an internal control system may be subject to changes due to the changing environment or circumstances that are beyond our control. Nevertheless, our internal control system contains self-monitoring mechanisms, and we will take immediate remedial actions in response to any identified deficiencies.
3. Sitronix evaluates the design and operating effectiveness of its internal control systems based on the criteria provided in the "Regulations Governing the Establishment of Internal Control Systems by Public Companies" (hereinafter below, the “Regulations”). The criteria adopted by the Regulations identify five constituent elements of internal control systems based on the process of management control: (1) control environment, (2) risk assessment, (3) control activities, (4) information and communications, and (5) monitoring activities. For the preceding five constituent elements, please refer to the provisions for the aforesaid “Regulations”.
4. Sitronix has evaluated the design and operating effectiveness of its internal control system according to the aforesaid “Regulations”.
5. Based on the findings of such evaluation, Sitronix believes that, on December 31, 2018, it has maintained, in all material respects, an effective internal control system (including the supervision and management of our subsidiaries), to provide reasonable assurance over our operational effectiveness and efficiency, reliability, timeliness, transparency of reporting, and compliance with applicable laws, regulations and bylaws.
6. This Statement is the essential content of Sitronix’s annual report and prospectus, and will be made public. Any misrepresentation and omission, or other illegality in the content publicly disclosed will entail a legal liability under Articles 20, 32, 171, and 174 of the Securities and Exchange Act.
7. This Statement was passed by the Board of Directors in their meeting held on March 15, 2019, with none of the night attending directors expressing dissenting opinions, and the rest all agreed the content of this Statement.
Sitronix Technology Corp.
Chairman & CEO:Vincent Mao
General Manager:Wei Wang

46
2. If the Company to commission an accountant to audit its internal control systems, it shall disclose the accountant’s audit report: None.
(11)The sanctions imposed in accordance with the law upon the Company or its
internal personnel, any sanctions imposed by the Company upon its internal personnel for violations of internal control systems provisions, principal deficiencies, and the state of any efforts to make improvements during the most recent fiscal year or during the current fiscal year up to the date of publication of the annual report: None.
(12)The important Resolutions of Shareholders’ Meeting and the Board Meetings
during the most recent fiscal year or during the current fiscal year up to the date of publication of the annual report:
1. Important Resolutions of the Shareholders’ Meeting and the Status of Implementation
Important Resolutions of the Shareholder’s Meeting of 2018 fiscal year Implement Status
1.Distribution of Earnings of 2017 Fiscal Year.
Passed the proposal by the Shareholders' Meeting for cash dividend of NT$5.5 per share (total are NT$662,846,861) to the Shareholders, and August 3, 2018 as the payment date.
2. Business Report and Financial Statements of 2017 Fiscal Year.
Passed the proposal by the Shareholders' Meeting, and then it had been announced to the Mops in accordance with regulations.
3. Amended the proposal of “Articles of Incorporation” of the Company.
Passed the proposal by the Shareholders' Meeting, and then has be implemented in accordance with the new revised provisions.
4. Amended the proposal of "Procedures for Acquisition or Disposal of Assets", " Policies and Procedures for Financial Derivatives Transactions", "Procedures for Lending Funds to Other Parties", "Procedures for Endorsement & Guarantee" of the Company.
Passed the proposal by the Shareholders' Meeting, and then has be implemented in accordance with the new revised provisions.
5. Abolished the proposal of “Measures for the Election of Directors and Supervisors “and enacted “Procedures for the Election of Directors” of the Company.
Passed the proposal by the Shareholders' Meeting, and then has be implemented in accordance with the new revised provisions.
6. Elected the Directors of the 9th term of the Company.
Elected 9 Directors (including 3 Independent directors), and set up the Audit Committee.
7. Release the Prohibition on New Directors or Representatives from Participation in Competitive Business.
Passed the Prohibition on New Directors or Representatives from Participation in Competitive Business.

47
2. Important Resolutions of the Board Meetings
Meeting’s Date Matters of Important Resolutions
Matters in §14-3 of
the Securities
and Exchange
Act
2018.03.15
The 13th board
meeting of the
8th term
1. Passed the Managers Operation and Project Bonus of 2017 fiscal year review by the Compensation Committee of the Company.
2. Passed the Distribution of Compensation for Employee, Directors and Supervisors of 2017 fiscal year.
3. Passed the Statement of Internal Control Systems of 2017 Fiscal Year of the Company.
4. Passed the Financial Statements and Business Report of 2017 Fiscal Year.
5. Passed the Distribution of Earnings of 2017 Fiscal Year. 6. Passed the amendment of "Procedures for Acquisition or
Disposal of Assets", " Policies and Procedures for Financial Derivatives Transactions", "Procedures for Lending Funds to Other Parties", "Procedures for Endorsement & Guarantee" of the Company.
7. Passed the election of the Directors of the 9th term of the Company.
8. Passed the candidates nomination of Director and Independent director.
9. Passed the Release the Prohibition on New Directors or Representatives from Participation in Competitive Business.
10. Passed the convention related matters of Shareholders’ Meeting of 2018 fiscal year.
11. Passed the cancellation of the New Restricted Employee Shares and reduce the capital of the Company.
Independent director’s opinion: None. The Company’s handling of Independent director’s opinion : None. Result of Resolution : All attending Directors agreed to pass.
2018.05.04
The 14th board
meeting of the
8th term
1. Passed the Adjustment of Salary for Manager reviewed by the Compensation Committee of the Company.
2. Passed the review of qualification of director candidates 3. Passed the cancellation of the New Restricted Employee
Shares and reduce the capital of the Company.
Independent director’s opinion : None. The Company’s handling of Independent director’s opinion: None. Result of Resolution: All attending Directors agreed to pass.

48
Meeting’s Date Matters of Important Resolutions
Matters in §14-3 of
the Securities
and Exchange
Act
2018.06.27
The 1st board
meeting of the
9th term
1. Passed the Recommendation of Chairman and CEO. 2. Passed the Appointment of the Compensation
Committee of the Company.
Independent director’s opinion :None. The Company’s handling of Independent director’s opinion :None. Result of Resolution : All attending Directors agreed to pass.
2018.08.02
The 2nd board
meeting of the
9th term
1. Passed the Cash Distribution of Managers and Employees of 2017 fiscal year review by the Compensation Committee of the Company.
2. Passed the Lending to subsidiary (Sync-Tech System Corp.).
3. Passed the Lending to subsidiary (Infinno Technology Corp.).
4. Passed the ratification of provide endorsement and guarantee for subsidiary's application for bank loan quota (Sync-Tech System Corp.).
5. Passed the ratification of provide endorsement and guarantee for subsidiary (HeFei Sitronix Co., Ltd)
6. Passed the Change of audit supervisor of the Company.
Independent director’s opinion : None. The Company’s handling of Independent director’s opinion : None. Result of Resolution: All attending Directors agreed to pass.
2018.11.02
The 3rd board
meeting of the
9th term
1. Passed the Adjustment of the amount of endorsements and guarantees for subsidiaries.
2. Passed the Second Cash Distribution of Managers and Employees of 2017 fiscal year review by the Compensation Committee of the Company.
3. Passed the Internal Audit Plan of 2019 fiscal year. 4. Passed the Evaluation of independent of CPA.
5. Passed the CPA’s Professional Fees.
6. Passed the cancellation of the New Restricted Employee
Shares and reduce the capital of the Company.
7. Passed the Lending to subsidiary (Forcelead Technology Corp.).
8. Passed the Lending to subsidiary (mCore Technology Corp.).

49
Meeting’s Date Matters of Important Resolutions
Matters in §14-3 of
the Securities
and Exchange
Act Independent director’s opinion : None. The Company’s handling of Independent director’s opinion: None. Result of Resolution :All attending Directors agreed to pass.
2019.03.15
The 4th board
meeting of the
9th term
1. Passed the Distribution of Manager Operation and Project Bonus of 2018 Fiscal Year reviewed by the Compensation Committee.
2. Passed the Distribution of Compensation for Employee, Directors and Supervisors of 2018 Fiscal Year.
3. Passed the Statement of Internal Control Systems of 2018 Fiscal Year.
4. Passed the Financial Statements and Business Report2018 Fiscal Year.
5. Passed the Distribution of Earnings of 2018 Fiscal Year. 6. Passed amendment of "Procedures for Acquisition or
Disposal of Assets" and "Policies and Procedures for Financial Derivatives Transactions" of the Company.
7. Passed the Amendment to partial provisions of “Information Cycle ”for Internal Control Systems of the Company.
8. Passed the convention related matters of Shareholders’ Meeting of 2019 fiscal year.
9. Passed the cancellation of the New Restricted Employee Shares and reduce the capital of the Company.
10. Passed the ratification of provide endorsement and guarantee for subsidiary's application for bank loan quota (Sync-Tech System Corp.).
11. Passed the proposal of Subsidiary acquired the Right-of-use assets from the Company.
Independent director’s opinion : None. The Company’s handling of Independent director’s opinion : None. Result of Resolution :All attending Directors agreed to pass.
2019.05.03 The 5th board meeting of the
9th term
1. Passed the Adjustment of Salary for Manager reviewed by the Compensation Committee.
2. Passed amendment of "Procedures for Lending Funds to Other Parties" and "Procedures for Endorsement &Guarantee" of the Company.
3. Passed the ratification of Increase the amount of
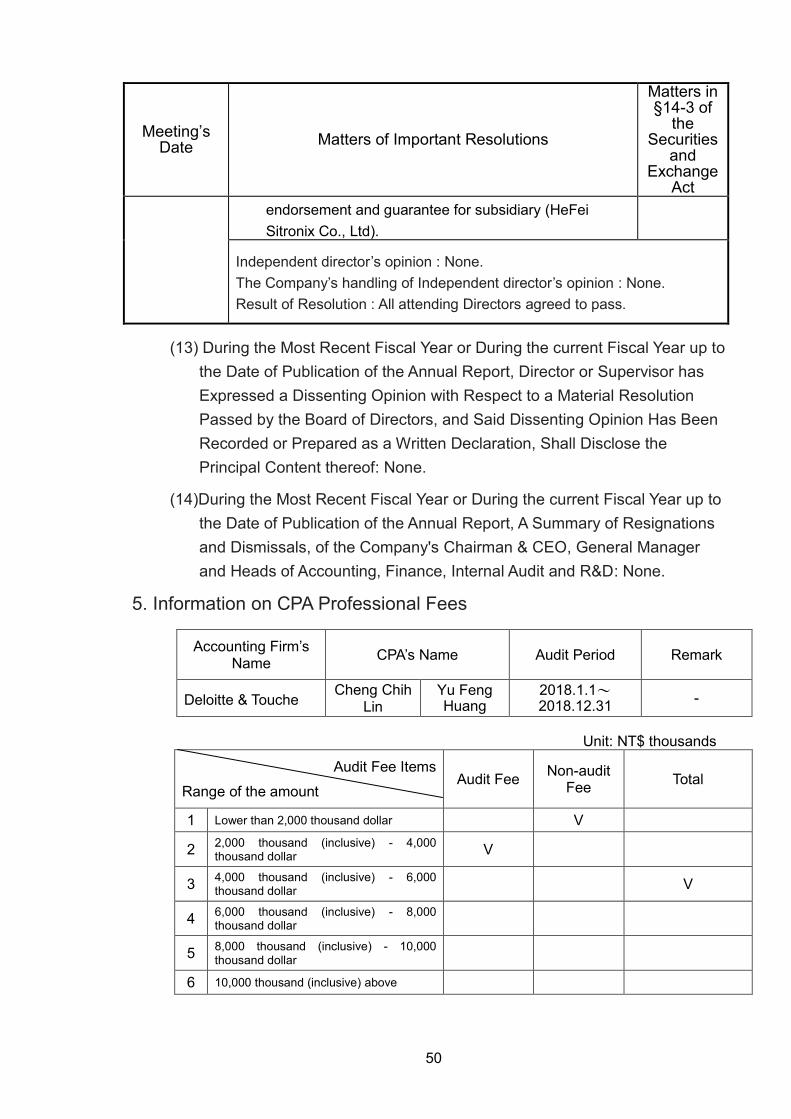
50
Meeting’s Date Matters of Important Resolutions
Matters in §14-3 of
the Securities
and Exchange
Act endorsement and guarantee for subsidiary (HeFei Sitronix Co., Ltd).
Independent director’s opinion : None. The Company’s handling of Independent director’s opinion : None. Result of Resolution : All attending Directors agreed to pass.
(13) During the Most Recent Fiscal Year or During the current Fiscal Year up to the Date of Publication of the Annual Report, Director or Supervisor has Expressed a Dissenting Opinion with Respect to a Material Resolution Passed by the Board of Directors, and Said Dissenting Opinion Has Been Recorded or Prepared as a Written Declaration, Shall Disclose the Principal Content thereof: None.
(14)During the Most Recent Fiscal Year or During the current Fiscal Year up to the Date of Publication of the Annual Report, A Summary of Resignations and Dismissals, of the Company's Chairman & CEO, General Manager and Heads of Accounting, Finance, Internal Audit and R&D: None.
5. Information on CPA Professional Fees
Accounting Firm’s Name CPA’s Name Audit Period Remark
Deloitte & Touche Cheng Chih
Lin Yu Feng Huang
2018.1.1~2018.12.31 -
Unit: NT$ thousands
Audit Fee Items Range of the amount
Audit Fee Non-audit Fee Total
1 Lower than 2,000 thousand dollar V
2 2,000 thousand (inclusive) - 4,000 thousand dollar V
3 4,000 thousand (inclusive) - 6,000 thousand dollar V
4 6,000 thousand (inclusive) - 8,000 thousand dollar
5 8,000 thousand (inclusive) - 10,000 thousand dollar
6 10,000 thousand (inclusive) above

51
(1) When non-audit fees paid to the CPA, to the accounting firm of the CPA, and/or to any affiliates of such accounting firm are one quarter or more of the audit fees paid thereto, the amounts of both audit and non-audit fees as well as details of non-audit services shall be disclosed:
Unit: NT$ thousands Accounting
Firm’s Name
CPA’s Name
Audit Fees
Non-Audit Fees CPA’s
Audit Period Remark System
of Design Business
registration HR Others Sub-total
Deloitte & Touche
Cheng Chih Lin
$3,620 $740 $740 2018.01.01~2018.12.31
Non-Audit Fees including Transfer Pricing Report and Tax Consultation
Yu Feng Huang
(2)When the Company changes its accounting firm and the audit fees paid for the fiscal year in which such change took place are lower than those for the previous fiscal year, the amounts of the audit fees before and after the change and the reasons shall be disclosed: No such situation.
(3)When the audit fees paid for the current fiscal year are lower than those for the previous fiscal year by 15 percent or more, the reduction in the amount of audit fees, reduction percentage, and reason(s) there for shall be disclosed: No such situation.
6. Information on replacement of certified public accountant: The Company has no replacement of the CPA during the 2 most recent fiscal year.
7. Has Chairman, General Manager, Manager in Charge of Finance or Accounting Matters of the Company, in the Most Recent Year Held a Position at the Accounting Firm of its Certified Public Accountant or at an Affiliated Enterprise of such Accounting Firm
Chairman and CEO, General Manager, Manager in charge of finance or accounting matters of the Company, has noheld a position at the accounting firm of its certified public accountant or at an affiliated enterprise of such accounting firm in the most recent year.
8. Change in Shares Transfer or Pledge about Director, Supervisor, Manager and Shareholder Holding more than 10 Percent Shares in the Company During the Most Recent Fiscal Year or During the Current Fiscal Year up to the Date of Publication of the Annual Report

52
(1)Change in shares transfer or pledge about Director, Supervisor, Manager and shareholder holding more than 10 percent shares in the Company
Unit: Share
Title Name
2018 fiscal year The current fiscal
year up to April 28, 2019
increase or decrease number of
shares transferred
increase or
decrease number of
shares pledged
increase or
decrease number of
shares transferred
increase or decrease number of
shares pledged
Chairman & CEO Vincent Mao 13,680 - - -
Director Wen Bin Lin - - - -
Director&CRO I Hsi Cheng 8,550 - - -
Director
Silicon Power Computer &
Communications Inc. - - - -
Representative: Hui Ming Chen - - - -
Director Sheng Su Lee - - - -
Director Yan Chiang Fan 29,000 - - -
Independent director Cheng Chieh Dai - - - -
Independent director Chieh Sheng Hsiao (2,000) - (14,000) -
Independent director Yu Nu Lin - - - -
General Manager Wei Wang (158,610) - (170,000) -
CRO Chun Sheng Lin 17,100 - (50,000) -
Deputy General Manager Meng Huang Liu 550 - - -
Heads of Finance, Accounting Shu Fang Xu 4,104 - - -
(2)Status about Share Transfer (Where the counterparty is a related party)
Director, Supervisor, Manager and shareholder holding more than 10 percent shares in the Company has no share transferring whose counterparty is a related party.
(3)Status about Share Pledge (Where the counterparty is a related party)
Director, Supervisor, Manager and Shareholder Holding more than 10 Percent Shares in the Company has no share pledging whose counterparty is a related party.

53
9. Information about Shareholding: Among the Company’s 10 Largest Shareholders is Related Party or a Relative within the Second Degree of Kinship of Another
April 28, 2019 Unit: Share;%
NAME SHAREHOLDING
BY SELF
SHAREHOLDING BY SPOUSES,
MINOR CHILDREN
SHAREHOLDING THROUGH NOMINEES
10 LARGEST SHAREHOLDERS
IS RELATED PARTY OR A
RELATIVE WITHIN THE SECOND DEGREE OF KINSHIP OF ANOTHER
REMARK
Shares shareholding ratio Shares sharehol
ding ratio Shares shareholding ratio
Name (or Name)
Relationship
New labor pension fund 8,572,500 7.13% - - - - - - -
Quant Foreign Value Small Cap Fund
4,382,100 3.64% - - - - - - -
Old labor pension fund 4,359,500 3.63% - - - - - - -
Gu Ming Investment Corp 3,358,339 2.79% - - - - - - -
Silicon Power Computer & Communications Inc.
3,000,000 2.50% - - - - - - -
Jianhua Commercial Bank in custody for Fuhua Digital Economic Securities Investment Trust Account
2,924,000 2.43% - - - - - - -
Morgan Stanley & Co. International Plc
2,505,000 2.08% - - - - - - -
JPMorgan Chase Bank N.A. Taipei Branch in custody for Norges Bank
2,481,066 2.06% - - - - - - -
Wen Bin Lin 2,200,000 1.83% 1,100,000 0.91% - - - - -
GMO Emerging Markets Fund
1,608,200 1.34% - - - - - - -

54
10. The Total Number of Shares of the Same Invested Enterprise Held by the Company, Company's Director, Supervisor, Manager or the Company Directly or Indirectly Controlled by the Company, All of Its Shareholding Ratios are Combined and Calculated
December 31, 2018 Unit: Share;%
Investments in Other
Enterprises (Note)
The Investments by the
Company
The Investments by Director,
Supervisor, Manager
orDirectly or Indirectly
controlled
Total investment
Number of Shares shareholding
ratio Shares
shareholding
ratio Shares
shareholding
ratio
Sitronix Technology (Belize)
Corp. 2,000,000 100% - - 2,000,000 100%
Sitronix Technology
(Mauritius) Corp. 2,000,000 100% - - 2,000,000 100%
Sitronix Holding
International Ltd. 2,000,000 100% - - 2,000,000 100%
Sitronix Technology
(Shenzhen) Co., Ltd.
Capital
Contribution
USD400 thousand
dollar
100% - -
Capital
Contribution
USD400
thousand dollar
100%
HeFei ezGreen Co., Ltd.
Capital
Contribution
RMB2,000
thousand dollar
100% - -
Capital
Contribution
RMB2,000
thousand dollar
100%
HeFei Sitronix Co., Ltd.
Capital
Contribution
RMB7,500
thousand dollar
75% - -
Capital
Contribution
RMB7,500
thousand dollar
75%
mCore Technology Corp. 9,583,010 91% - - 9,583,010 91%
Infinno Technology Corp. 13,289,616 64% 408,337 2% 13,697,953 66%
Sensortek Technology
Corp. 13,004,109 54% 3,766,502 16% 16,770,611 70%
Forcelead Technology
Corp. 29,685,240 76% 3,269,973 8% 32,955,213 84%
Sitronix Investment Corp. 32,977,204 100% - - 32,977,204 100%
Sync-Tech System Corp. 9,500,000 55% 1,088,000 6% 10,588,000 61%
Note: These are the Company’s long-term investment which is used the equity method.

55
IV. Fundraising Status 1. Source of Share Capital Status
(1)Source of Share Capital April 28, 2019
Year/ Month
Issue Price
Authorized Capital Paid-up Capital Remark
Shares (thousand shares)
Amount (thousand
dollar)
Shares (thousand shares)
Amount (thousand
dollar)
Source of Share Capital (thousand dollar)
Property other than cash is
paid by subscribers
Others
1998/08 10 4,500 45,000 4,500 45,000 Cash Injection 25,000 None Jian yi No.87329500
1998/12 10 7,000 70,000 7,000 70,000 Cash Injection 25,000 None Jian-yi No.88256462
1999/12 10 16,000 160,000 16,000 160,000 Cash Injection 90,000 None Jing(089)Shang No.089101284
1999/12 10 18,000 180,000 18,000 180,000 Cash Injection 20,000 None Jing(089)Shang No.089101157
2000/08 10 21,500 215,000 21,500 215,000 Cash Injection 35,000 None Jing(089)Shang No.089130952
2002/11 10 30,000 300,000 25,000 250,000 Cash Injection 35,000 None Jing-Shou-Shang No.09101479070
2003/06 10 66,800 668,000 33,432 334,325
Capitalization of earnings, capital surplus and employee bonus 84,325
None Jing-Shou-jhong No.0923228806
2004/07 10 66,800 668,000 46,668 466,680
Capitalization of earnings, capital surplus and employee bonus 132,355
None Jing-Shou-jhong No.09332442630
2005/01 10 66,800 668,000 47,303 473,035 Employee stock option certificates convert to common shares 6,355
None Jing-Shou-jhong No.09431572610
2005/04 10 66,800 668,000 47,488 474,880 Employee stock option certificates convert to common shares 1,845
None Jing-Shou-jhong No.09431949940
2005/07 10 100,000 1,000,000 63,704 637,044
Capitalization of earnings, capital surplus and employee bonus 162,164
None Jing-Shou-Shang No.09401122960
2005/07 10 100,000 1,000,000 66,785 667,855
Employee stock option certificates convert to common shares 1,255 Domestic convertible bonds convert to common shares 29,556
None Jing-Shou-Shang No.09401145870
2005/10 10 100,000 1,000,000 68,513 685,135
Employee stock option certificates convert to common shares 8,175 Domestic convertible bonds convert to common shares 9,105
None Jing-Shou-Shang No.09401213050
2006/01 10 100,000 1,000,000 69,520 695,206
Employee stock option certificates convert to common shares 1,545 Domestic convertible bonds convert to common shares 8,526
None Jing-Shou-Shang No.09501006430
2006/04 10 100,000 1,000,000 71,008 710,078 Employee stock option certificates convert to None Jing-Shou-Shang
No.09501069740

56
Year/ Month
Issue Price
Authorized Capital Paid-up Capital Remark
Shares (thousand shares)
Amount (thousand
dollar)
Shares (thousand shares)
Amount (thousand
dollar)
Source of Share Capital (thousand dollar)
Property other than cash is
paid by subscribers
Others
common shares 4,680 Domestic convertible bonds convert to common shares 10,193
2006/07 10 100,000 1,000,000 71,232 712,318
Employee stock option certificates convert to common shares 353 Domestic convertible bonds convert to common shares 1,887
None Jing-Shou-Shang No.09501144330
2006/09 10 150,000 1,500,000 88,260 882,595
Capitalization of earnings, capital surplus and employee bonus 170,277
None Jing-Shou-Shang No.09501200340
2006/11 10 150,000 1,500,000 89,388 893,882
Employee stock option certificates convert to common shares 7,638 Domestic convertible bonds convert to common shares 3,649
None Jing-Shou-Shang No.09501254780
2007/01 10 150,000 1,500,000 90,451 904,508
Employee stock option certificates convert to common shares 3,977 Domestic convertible bonds convert to common shares 6,649
None Jing-Shou-Shang No.09601010850
2007/05 10 150,000 1,500,000 90,773 907,728 Employee stock option certificates convert to common shares 3,220
None Jing-Shou-Shang No.09601106890
2007/09 10 150,000 1,500,000 103,764 1,037,639
Capitalization of earnings, capital surplus and employee bonus 128,523 Employee stock option certificates convert to common shares 1,388
None Jing-Shou-Shang No.09601224560
2007/12 10 150,000 1,500,000 107,635 1,076,351
Private placement by Cash Injection 35,000 Employee stock option certificates convert to common shares 3,712
None Jing-Shou-Shang No.09601295620 Jing-Shou-Shang No.09601307070
2008/04 10 150,000 1,500,000 107,641 1,076,414 Employee stock option certificates convert to common shares 63
None Jing-Shou-Shang No.09701090630
2008/08 10 150,000 1,500,000 103,028 1,030,284
Employee stock option certificates convert to common shares 3,870 Cancel treasury shares 50,000
None Jing-Shou-Shang No.09701192540 Jing-Shou-Shang No.09701205760
2008/09 10 150,000 1,500,000 111,100 1,110,998
Capitalization of earnings, capital surplus and employee bonus 80,714
None Jing-Shou-Shang No.09701245290
2008/11 10 150,000 1,500,000 111,244 1,112,438 Employee stock option certificates convert to common shares 1,440
None Jing-Shou-Shang No.09701300130
2009/04 10 150,000 1,500,000 111,336 1,113,365 Employee stock option certificates convert to common shares 927
None Jing-Shou-Shang No.09801071590
2009/07 10 150,000 1,500,000 111,341 1,113,415 Employee stock option certificates convert to common shares 50
None Jing-Shou-Shang No.09801132660
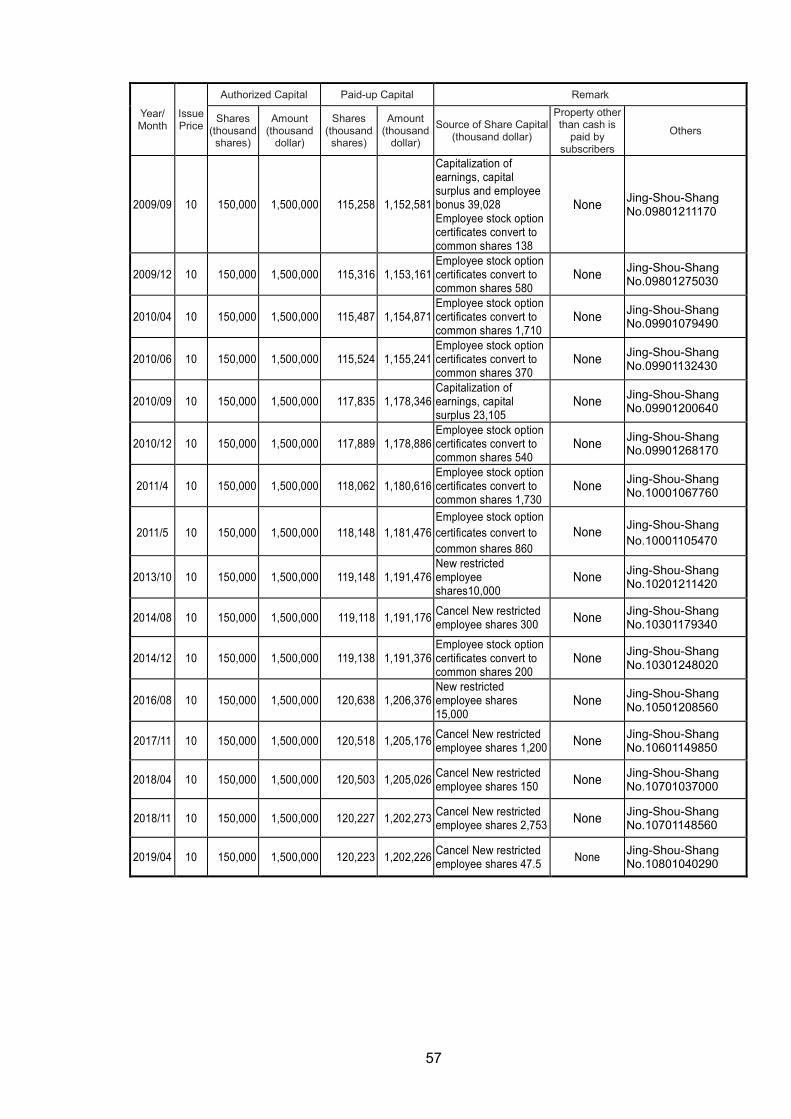
57
Year/ Month
Issue Price
Authorized Capital Paid-up Capital Remark
Shares (thousand shares)
Amount (thousand
dollar)
Shares (thousand shares)
Amount (thousand
dollar)
Source of Share Capital (thousand dollar)
Property other than cash is
paid by subscribers
Others
2009/09 10 150,000 1,500,000 115,258 1,152,581
Capitalization of earnings, capital surplus and employee bonus 39,028 Employee stock option certificates convert to common shares 138
None Jing-Shou-Shang No.09801211170
2009/12 10 150,000 1,500,000 115,316 1,153,161 Employee stock option certificates convert to common shares 580
None Jing-Shou-Shang No.09801275030
2010/04 10 150,000 1,500,000 115,487 1,154,871 Employee stock option certificates convert to common shares 1,710
None Jing-Shou-Shang No.09901079490
2010/06 10 150,000 1,500,000 115,524 1,155,241 Employee stock option certificates convert to common shares 370
None Jing-Shou-Shang No.09901132430
2010/09 10 150,000 1,500,000 117,835 1,178,346 Capitalization of earnings, capital surplus 23,105
None Jing-Shou-Shang No.09901200640
2010/12 10 150,000 1,500,000 117,889 1,178,886 Employee stock option certificates convert to common shares 540
None Jing-Shou-Shang No.09901268170
2011/4 10 150,000 1,500,000 118,062 1,180,616 Employee stock option certificates convert to common shares 1,730
None Jing-Shou-Shang No.10001067760
2011/5 10 150,000 1,500,000 118,148 1,181,476 Employee stock option certificates convert to common shares 860
None Jing-Shou-Shang No.10001105470
2013/10 10 150,000 1,500,000 119,148 1,191,476 New restricted employee shares10,000
None Jing-Shou-Shang No.10201211420
2014/08 10 150,000 1,500,000 119,118 1,191,176 Cancel New restricted employee shares 300 None Jing-Shou-Shang
No.10301179340
2014/12 10 150,000 1,500,000 119,138 1,191,376 Employee stock option certificates convert to common shares 200
None Jing-Shou-Shang No.10301248020
2016/08 10 150,000 1,500,000 120,638 1,206,376 New restricted employee shares 15,000
None Jing-Shou-Shang No.10501208560
2017/11 10 150,000 1,500,000 120,518 1,205,176 Cancel New restricted employee shares 1,200
None Jing-Shou-Shang No.10601149850
2018/04 10 150,000 1,500,000 120,503 1,205,026 Cancel New restricted employee shares 150 None Jing-Shou-Shang
No.10701037000
2018/11 10 150,000 1,500,000 120,227 1,202,273 Cancel New restricted employee shares 2,753 None Jing-Shou-Shang
No.10701148560
2019/04 10 150,000 1,500,000 120,223 1,202,226 Cancel New restricted employee shares 47.5 None Jing-Shou-Shang
No.10801040290

58
Unit: Share
April 28, 2019
Typeof Share
Authorized Capital
Remark Outstanding Shares Unissued Shares
Total Listed Not listed Amount
Registered Common Share
120,222,581 - 120,222,581 29,777,419 150,000,000
(2)Shareholder Structure April 28, 2019
Shareholder structure
Number
Government Agencies
Financial Institutions
Other Institutions Individuals
Foreign Institutions & Foreigners
Total
Number(people) 6 97 128 15,880 204 16,315
Shareholding Number(share)
15,449,040 19,916,821 7,283,594 31,474,485 46,098,641 120,222,581
Shareholding Percentage
12.85% 16.57% 6.06% 26.18% 38.34% 100.00%
(3) Diffusion of Ownership(par value each share NT$ 10 dollars) April 28, 2019
Range of Shareholding Number of Shareholder(people)
Shareholding Number(share)
Shareholding Percentage%
1~999 10,131 437,027 0.36% 1,000~5,000 5,123 8,949,028 7.44%
5,001~10,000 460 3,540,347 2.94% 10,001~15,000 142 1,823,634 1.52% 15,001~20,000 81 1,477,788 1.23% 20,001~30,000 75 1,886,431 1.57% 30,001~40,000 33 1,184,741 0.99% 40,001~50,000 33 1,519,824 1.26%
50,001~100,000 72 5,051,418 4.20% 100,001~200,000 74 10,979,049 9.13% 200,001~400,000 36 10,088,638 8.39% 400,001~600,000 12 5,845,610 4.86% 600,001~800,000 12 8,209,969 6.83%
800,001~1,000,000 6 5,402,686 4.49% Higher than 1,000,001 25 53,826,391 44.77%
Total 16,315 120,222,581 100.00%

59
(4) List of Major Shareholders The names, number and percentage of the shareholding of the shareholders with a stake of 5 percent or top ten shareholders
April 28, 2019 Share
Name of Major Shareholders Shareholding
Number Shareholding Percentage
New labor pension fund 8,572,500 7.13%
Quant Foreign Value Small Cap Fund 4,382,100 3.64%
Old labor pension fund 4,359,500 3.63%
Gu Ming Investment Corp 3,358,339 2.79% Silicon Power Computer & Communications Inc. 3,000,000 2.50%
Jianhua Commercial Bank in custody for Fuhua Digital Economic Securities Investment Trust Account
2,924,000 2.43%
Morgan Stanley & Co. International Plc 2,505,000 2.08% JPMorgan Chase Bank N.A. Taipei Branch in custody for Norges Bank 2,481,066 2.06%
Wen Bin Lin 2,200,000 1.83%
GMO Emerging Markets Fun 1,608,200 1.34%

60
(5)Share Prices for the Past 2 Fiscal Years, together with the Company's Net Worth pershare, Earnings per share, Dividends per share, and Related Information
Unit. NT$; thousand share Fiscal Year
2017 Fiscal Year
2018 Fiscal Year
The Current Fiscal Year up to March 31, 2019
Items
Prices per share
Highest 103.50 132.50 146.50 Lowest 79.00 70.80 95.30
Average 91.11 93.14 120.56
Net Worth per Share
Before distribution 38.83 39.20 -
After distribution 33.33 Note 4 -
Earnings per share
Weighted average number of shares (thousand shares)
119,241 119,461 -
Earnings per share 7.32 7.03 -
Dividends per share
Cash dividend 5.5 Note 4 -
stock dividend
distribution
Stock Dividend from Earnings
- Note 4 -
Stock Dividend from Capital
- Note 4 -
Accumulated undistributed dividends - - -
Investment Return Analysis
Price / Earnings ratio(Note 1) 12.45 13.25 -
Price / Dividend ratio(Note 2) 16.57 Note 4 -
Cash dividend yield rate (Note 3) 6.04% Note 4 -
Note 1: Price / Earnings ratio = average closing price per share for the year / earnings per share. Note 2: Price / Dividend ratio = average closing price per share for the year / cash dividend per share. Note 3: Cash dividend yield rate = cash dividend per share / average closing price per share for the year. Note 4: This proposal will determined after approved by the Shareholders' meeting of 2019 year.
(6) Company's Dividend Policy and Implementation thereof 1. Company's Dividend Policy
Dividend Policy enacted in accordance with the Articles of Incorporation of the Company: Article 19: If the Company's General Final Accounts have a surplus, they shall be
distributed in the following order. (1) Tax payment. (2) Cover the past losses. (3) Set aside 10% of said surplus as the Legal surplus reserve.

61
However, when the Legal surplus reserve has reached the Company's paid-up capital, this provision shall not apply.
(4) Set aside as Special surplus reserve in accordance with the laws.
(5) If there is still surplus, the Board of Directors shall propose a proposal of surplus distribution on the surplus and the accumulated undistributed surplus in the previous fiscal year, and submit to the Shareholders' meeting to resolve the dividends of the shareholders.
Article 19-1: The distribution of dividends of the Company's shareholders can be paid in cash or stock, but the proportion of cash dividends shall not less than 10% of the total dividends. The policy of allocating dividends shall be based on the factors such as current and future investment environment, capital requirements, competition at home and abroad and capital budget, etc., taking into account the interests of shareholders, balancing dividends and long-term financial planning of the company, etc., which are prepared by the Board of Directors according to the laws, and submitted to the Shareholders' meeting for approval.
2. The dividend distributions proposed at this Shareholders' Meeting (Passed by the Board of Directors, Has not approved by the Shareholder)
The Company’s dividend distributions of 2018 fiscal year, was proposed the Board of Directors as follow:
The Shareholders' cash dividends total are 601,112,905 dollars, 5 dollars per share, after passed the resolution of the Shareholders' meeting of this year and approved by the competent authority, and then it will delivery to the Board of Directors authorized the Chairman and CEO to set a separate benchmark date and carry out.
If the employee stock option certificate is converted, issued new shares according to the Measures for Offering and Issuance or bought back Treasury Shares of the Company, which affects the number of shares outstanding in the company, the aforesaid shareholder's per share ratio will subsequently change.
3. Has a material change in dividend policy is expected: None.
(7)Effect upon Business Performance and Earnings per share of any Stock Dividend Distribution Proposed or Adopted at this Shareholders' Meeting
Since the Company did not disclose financial forecasts in 2019 fiscal year, there is no relevant information to calculate the effect upon business performance and earnings per share of any stock dividend distribution proposed or adopted at this Shareholders' Meeting.
(8)Compensation of the Employee, Director and Supervisor

62
1. The Percentages or Ranges with Respect to Compensation of Employee, Director, and Supervisor, as set forth in the Company's Articles of Incorporation.
As stated in the Company's Articles of Incorporation, where the Company has earnings in this year, it should be set aside no more than 25 percent, no less than one percent of surplus for Employee compensation, and no more than three percent of surplus for Director compensation. However, when the Company still has accumulated losses, it should retain the amount of cover in advance, and then pay Employee compensation and Director Compensation according to the above ratio.
The Employee compensation is determined by the resolution of the Board of Directors in stock or cash, and the counterparty of distribution may including the employees of subsidiaries of the company meeting certain specific requirements.
Prior to the establishment of the Audit Committee of the Company, Supervisor's compensation was based on the distribution ratio specified in the first paragraph.
2.The basis for estimating the amount of employee, director, and supervisor compensation, for calculating the number of shares to be distributed as employee compensation, and the accounting treatment of the discrepancy, if any, between the actual distributed amount and the estimated figure, for the current period:
The basis for estimating the amount of employee, director, and supervisor compensation of this year is calculated accord to the Articles of Association of the Company. If there is any discrepancy between the actual distributed amount and the estimated figure, it shall be handled in accordance with the relevant laws and regulations.
3.Information on any Approval of Distribution of Compensation by the Board of, Directors:
Distribution of Compensation passed by the Board of Directors of the Company on March 15, 2019 are as follow:
(1)Distribution in cash: the employee's compensation is NT$ 75,632,684, and the Director and Supervisor's compensation is NT$ 22,689,805, which are no different from the estimated figure for the fiscal year these expenses are recognized.
(2)The amount of any Employee’s compensation distributed in stocks, and the size of that amount as a percentage of the sum of the after-tax net income stated in the Company unconsolidated or individual financial statements for the current period and total employee’s compensation: Not applicable.

63
4.The Actual Distribution of Employee, Director, and Supervisor Compensation for the Previous Fiscal Year (with an indication of the number of shares, monetary amount, and stock price, of the shares distributed), and, if there is any discrepancy between the actual distribution and the recognized employee, director, or supervisor compensation, additionally the discrepancy, cause, and how it is treated:
Items 2017 Fiscal Year(distribute on 2018 year)
Amount Recognized Actual Distribution Discrepancy
Compensation of Employee NT$78,584,179 NT$78,584,179 None
Compensation of DirectorSupervisor NT$23,575,253 NT$23,575,253 None
(9) Status of Treasury Share repurchases
No such situation.
2. The Annual Report Shall Provide Information on the Company's Issuance of Corporate Bonds, Including Unretired Bonds and Unissued Bonds for which an Issue is currently Under Preparation, and the Report Shall Disclose all the Matters Set Forth Thereunder and explain Their Effect upon shareholders' Equity in accordance with Article 248 of the Company Act: None.
3. The Status on Preferred Shares Shall Include Both Outstanding and Unissued Shares for which an Issue is Currently under Preparation, and Shall Disclose Any Conditions Attaching to Issuance and their Effect upon Shareholders' Equity. The Information on Preferred Shares Shall Also Specify the Matters Listed under Article 157 of the Company Act: None.
4. The Status on Global Depository Receipts Shall Include Information on Receipts Issues that Remain Partially Outstanding, and on Unissued Receipts for which an Issue is currently under Preparation, and be disclosedare the Date of Issue, Total Value of Issue, the Rights and Responsibilities of the Holders of Global Depository Receipts and Related Matters: None.
5. Employee Stock Options Status: None.

64
6. The Status of the New Restricted Employee Shares May 15, 2019 Types of New restricted employee shares
New restr icted employee shares of 2016 Fiscal Year First(term)
Effective date of registering July 15, 2016
Date of Issue April 5,2016 Number of New restricted employee shares has issued 1,500,000 shares
Issue Price 0 dollar Number of New restricted employee shares has issued as a percentage of total shares issued
1.25%
Vesting condi t ions for New restric ted employee shares
After the employee acquired the New restr icted employee shares, which st i l l worked in the Company at the expirat ion of the following vest ing per iod, has no violat ing the law, the employee contract, working rules, company regulat ions, and violat ing other agreements with the company and its situation seriously, as well as reach the Company's operating goal set by the Company, he wi l l acquire the share and i ts proport ion of the highest share of the shares to be allocated wil l be arranged as follows, however, the actual share rat io of the shares al located wil l be calculated according to the degree of achievement of the company's operat ional goals. ( I t is calculated according to the company's operat ional goals achievement, with init ia l EPS goal and highest proport ion EPS goal. If i t is equal to or lower than the init ia l EPS goal, the number of actual share al located is zero; I f i t is higher than the init ial EPS goal, the proport ion of the number of the actual shares allocated wi l l increase; I f i t is equal to or higher than the highest proport ion of the init ia l EPS goal, the highest proport ion of the shares wi l l be obtained.) The proport ion of the aforesaid shares is calculated to two decimal places and round down without any condit ion the number of shares al located is lef t after being calculated to an integer, and the remainder is discarded without any condit ion :
Vesting Proport ion of shares al located
Has been employed for one full year
af ter being al located 25%
Has been employed for two full years
af ter being al located 30%
Has been employed for three full years
af ter being al located 45%
Restricted Rights on New restricted employee shares
1. According to the trust agreement, after the employee is allocated New restricted employee shares, before the vesting condition is reached, the new shares may not be sold, mortgaged, transferred, donated, pledged, appraised without dissent, or disposed in other manner. However, if there are

65
other provisions in this measure, such provisions shall prevail. 2. The attendance, proposals, speeches, and voting rights of the
shareholders' meeting shall be executed by the trust custodian institution according to law.
3. After the issuance of New restricted employee shares, the new shares shall be immediately delivered to the Trustee and the employee shall not request the Trustee return the New restricted employee shares for any reason or manner until the vesting conditions are fulfilled.
4. Before the vesting condition is reached, if the employee terminates or cancels the delivery of trusts matters authorized by the Company or the person designated by the Company in violation of Article 7, paragraph 2, the Company has the right toredeem the shares from the employee without any compensation and cancel the shares.
Custody of New restricted employee shares Trust and Custody
Employees who have not been able to meet the vesting conditions after they have been allocated or subscribed
The Company will redeem the New restricted employee shares and cancel according to law. However, the Company will give employees the shares and interests allocated at the time of the vesting period free of charge.
Number of New restricted employee shares redeemed or bought back
415,030 shares
Number of shares has been lifted the Restrictions 425,720 shares Number of shares has not been lifted Restrictions 659,250 shares Number of shares has not been lifted Restrictions as a percentage of total shares issued(%)
0.55%
Impact on shareholders' equity Impact on the dilution of the original common shareholders' equity is little

66
(1)Name and Acquisit ion Status of Manager and Top 10 Employees Who Acquired New Restricted Employee Shares :
1.New Restr icted Employee Shares of 2016 Fiscal Year First(term)
May 15, 2019
Title (Note 1) Name
Num
ber of New
Restricted
Em
ployee Shares A
cquired
Num
ber of New
Restricted E
mployee
SharesA
cquired as a percentage of total shares issued
Has been lifted the Restrictions
Has not been lifted Restrictions
Num
ber of shares has been lifted the R
estrictions
Issue Price
Issue Am
ount
Num
ber of shares has been lifted the R
estrictions as a percentage of total shares issued
Num
ber of shares has not been lifted R
estrictions
Issue Price
Issue Am
ount
Num
ber of shares has not been lifted R
estrictions as a percentage of total shares issued
Manager
CEO Vincent Mao
591,000 0.49% 325,050 0 0 0.27% 265,950 0 0 0.22%
General Manager Wei Wang
CRO Chun Sheng Lin
Chief Shu Fang Xu
Deputy General Manager
Meng Huang Liu
CRO I Hsi Cheng
Employee
Chief Xiu Mei Wang
453,000 0.38% 249,150 0 0 0.21% 203,850 0 0 0.17%
Chief Gu Ze Wu
Chief Jian Long Lee
Senior Chief Zhi Bin Lin
Senior Chief Yan Zhong Lin
Chief Zong Yao Hu
Chief Sheng Hu Special Assistant Ru Hung Chen
Senior Chief Wei Yu Yang
Chief Yao Kui Yang
Senior Chief Quan Bin Xiong
Chief Jian Yuan Zhao
Chief Ren Jie Liu
Senior Chief Dahu Su
Senior Chief Xing Da Su
Note 1: Manager and Employee are sorted by Name stroke instead of Number of Shares.

67
7. Issuance of New Shares for Merger or Acquisition of Other Companies’ Shares Status
None. 8. The Capital Application Plan and Implement Status None.

68
V. Operations Summary 1. A description of the business
(1) Scope of Business
1. Major Lines of Business
The Main Business Items as stated in the Certificate of Incorporation and Business Registration Certificate are as follows:
(1) Design, manufacture, test and sale of various Integrated Circuits.
(2) Design, manufacture, test and sale of various Integrated Circuit modules.
(3) Research, development and sales of various Integrated Circuit applications.
(4) Trading and agency business of various Integrated Circuits.
2.Major Lines of Business and the Relative Weight of Each Unit: NT$ thousand
Major Product 2018 fiscal year
Volume of Units Sold Percentage(%)
Integrated Circuit Design Product 10,172,277 98.47%
Others 158,228 1.53%
Total 10,330,505 100.00%
Note: Others are other products that assist customers in purchasing.
3. New Products (Services) Planned for Development
(1) High-end smart phone display driver chip.
(2) Medium-size color automotive display driver chip.
(3) Integrated display driver and capacitive touch control chip (TDDI).
(4) Small size AMOLED display driver chip.
(2)Industrial Summary
1. The Current Status and Development of the Industrial
Sitronix Electronics has provided diversified product applications, from display driver chip, display driver ICs (DDIs) such as Feature phones, Smart phones, Automotive category and Industrial control category, to

69
non-DDI products such as MCU, Power management IC, Sensor (sensors), etc., which has crossed various f industries, applications, markets, and customer groups. We can roughly divide these products into three categories at first: Mobile phones DDI category, Industrial control category and Automotive DDI category, and SoC (system on a chip) category. Among them, the Industrial control category covers hundreds of applications, so it is difficult to analyze them one by one. As for the SoC category, Sensors is the biggest, so we will focus on the three topics of Sensors, Mobile phones DDI, and Automotive DDI, and focus on the recent developments that are more likely to be associated with the Company business.
1.Sensors and IOT
Sitronix's Sensors are designed by our subsidiary Sensortek which has seen significant breakthroughs in recent years. From the perspective of the overall Market, with the development of IOT and Industry 4.0, the application of various Sensors has become more and more extensive. We can make a rough classification from three levels of individual, family and society.
(a) Individual Consumer product: The applications related tomobile phones, wearable devices, automotive products, etc.
Figure 1Global Wearable devices shipments are expected to continue to rise in the next few years
Source: IDC, December 2017
In 2018, each vendor has made efforts to differentiate itself in the increasingly competitive market, making the functions of mobile phones and wearable devices more diversified, including several applications applied to various sensors, such as biometrics, gesture operation, emotion and health management. The biometric function of

70
analyzing the physical characteristics of the user is increasingly refined, such as iris, fingerprint recognition, etc. Sensors can also be used to track user finger movements, such as tapping or sliding, to control smart homes, cars, etc. In terms of physical and mental management, sensors can be used in mobile phones, wearable devices, or healthcare devices to detect physical indicators such as heartbeat, facial expression and skin temperature, as well as record the user's psychological and physiological status.
In addition, as for the larger consumer product, sensors are also widely used in the automotive devices category. Vendors have successively introduced the Advanced Driver Assistance System (ADAS), which uses Sensors in various safety devices, combined with gesture control and other operational functions, which are not only convenient, but also enhances driving safety. As for the development details of Automotive Industrial, we will discuss it in the third section.
(b) Family sharing equipment: Smart home application
Figure2Smart Home Market has continued to grow
Source: IHS, August 2017
In addition to the individual consumer product mentioned in the previous section, sensors have also been widely distributed in smart home applications. The world renowned vendors and many new startups have launched various products, and made the market more competitive and diverse. Smart air conditioners, refrigerators, door locks, lighting, sockets, security monitors, saucepans, toothbrushes, blinds and other applications have been launched one after another. A variety of different sensors can be used to detect indoor temperature, humidity, air quality, personnel dynamics, item movement, door and

71
window fragmentation, water leakage and icing, users’ return to home (and then the smart lock is automatically released) and other purposes.
One of the recent stars in the smart family is the smart speaker. According to estimates by KGI, the global production of smart speakers will reach 84.6 million units by 2020. Although Amazon announced the launch of smart speakers in 2014, its main opponents, Google Home, Apple's HomePod, etc., have only launched their offensive in the past two years. Smart Speakers can be called the hub of a smart home, which allows consumers to easily control home air conditioning, lighting, door locks, and even cars (users can ask smart speakers about their car usage, such as parking positions of different vehicles, remaining fuel) and so on. The popularity of smart speakers is a boon for other various smart device vendors, because they complement each other. At present, many vendors have integrated products with Amazon and Google, so consumers have a lot of choices when purchasing smart home products.
(c)Large-scale applications such as smart factories and smart cities
Important aspects of smart factories and smart cities, including collecting information with various instruments such as sensors equipped, and then integrating these information with big data and cloud technology to achieve proactive detection, pre-emptive prevention and quick judgment afterwards. The effect is used in various fields such as commerce, energy, transportation, and safety to make life safer, more environmentally friendly, and more efficient. These large-scale applications can be roughly divided into commercial and public categories.
For commercial purposes, vendors can help customers build IoT, cloud, and automated management systems, and help customers increase production and management efficiency with big data analytics services. In addition to Factory intelligence, sensors also play an important role in global logistics, especially when transporting valuable, fragile, or fresh goods.
As for public purposes, energy related applications are one of the most common smart city constructions. Many cities in the world have invested in the construction of smart grids, smart water meters, and smart gas meters. According to the estimation of power supply manufacturers, the global smart meter market is as high as 600 million units. In addition to the above energy management equipment, sensors can also be used in energy production applications such as wind

72
turbines.
Transportation is another important public purpose, and sensors installed on the road can gather data on the number of vehicles and speed. For example, local governments cooperate with manufacturers to build smart street lights and smart roads to help improve traffic conditions.
2. Mobile Phone Market's Growth and Technological Breakthroughs
In the case of the high-end mobile phones market becoming increasingly saturated and fiercely competitive, each mobile phone manufacturer responded with several strategies: (a) Capturing markets outside the high-end market: launching more mid-to-low-end, high cost performance ratiomMobile phones, and actively exploring new markets (outside China). (b) Launching detailed diversified products at existing high-end markets. (c) Developing a complete ecosystem of products such as home appliances, VR, and wearable devices, and using it with mobile phones to increase brand reliance.
Figure 3Forecast of the scale of Smart Phones
(a) Mid-to-Low-end, High Cost Performance Ratio Mobile Phones and New Markets
With the increasing saturation of China's market, each major brand has been more aggressive in capturing other markets. Among them, India, which is considered a battleground for mobile phones, has surpassed the United States in the third quarter of 2018 as the world's second largest smartphone market, second only to China. Xiaomi still dominates the Indian Market in 2018, while other brands such as Samsung and Vivo are closely behind. In the case of the overall Indian Market, Mobile phones, which sell for less than USD.250 dollars, still account for the vast majority.
(b) High-end diversified products

73
The full screen is the condition that the current master stream mobile phones already have. Among them, the full screen cutout design is expected to be adopted by more manufacturers in 2019. For the panel and driver IC plants that supply these Mobile phones, the increase in panel volume and the trend of profile cutting represents an increase in the price.
In addition to the full screen, other items such as multi-lens, 5G, foldable screens, etc. are all directions that Smart phone manufacturers may be focused on.
Moreover, each major manufacturer has also demonstrated a variety of products that can be paired with mobile phones, such as household electric appliances and remote control aircrafts. They also reflect the efforts of the mobile phone industry to expand the brand eco-chain in recent years to increase consumer reliance.
(c)Collaborate across the industry and develop a complete ecosystem to increase brand reliance
Although mobile phone manufacturers have continued to make innovative mobile phones, in response to the mobile phone hardware in the mature stage, the brands have invested in the development of the ecosystem, and multi-faceted alliances, in an effort to expand the momentum, enhance every area of consumer life, such as mobile payment, virtual reality devices and other applications.
3.Automotive Market
For Sitronix, automotive products are more profitable than DDI for consumer products such as mobile phones. Part of the reason comes from the high standard test specifications of the automotive products, in order to meet the needs of vehicles traveling under extreme conditions such as large temperature difference and high vibration, so the product can be used for many years. The Automotive Market is therefore relatively closed and has difficultyin obtaining the certification, but once it is certified, it can basically have long-term stable orders.
At the same time, as there wasan increase in demand, Automotive Industrial has continued to develop its requirements for convenience, safety and environmental protection, and has widely used the products such as Sensors and Automotive DDI.
(a) Convenience: The important role that Mobile phones play in the Internet of Vehicles
Each major automaker has introduced more convenient services, such

74
as allowing the driver to use basic mobile phone functions such as Phone, SMS, Map navigation, etc. on the car screen, as well as third-party apps, which make the driving experience more and more personalized.
In addition, there are also car manufacturers who build their own smart systems to provide consumers with more intimate services, and functions including transferring the address on the mobile phones directly to the vehicle to avoid the trouble of entering the destination, and transfer the driving directions to mobile phones after parking. You can use the mobile phones to lock or unlock the remote at any time, and there are many functions that can be operated by other devices such as Smart watches in addition to mobile phones, giving the driver greater freedom of operation.
(b) Safety: driving assistance, tire pressure detection, HUD and other equipment
The above conveniences of the various new functionsare attractive, but driving safety on the road is still the most important part of the automotive industry, and is one of the ultimate goals of vehicle intelligence. The concept of smart vehicles covers more basic assistance systems and more advanced automatic driving and other items, among which the advanced driver assistance system (ADAS) has reached a certain level of development planning. Sensors' applications in this system include detecting lane departures, driving blind spot warnings, parking assistance, driving fatigue detection, etc.
In addition, HUD is also an application related to driving safety. It can display the vehicle information such as driving route and vehicle speed in front of the driver's field of vision, reducing driver's line of sight movement and further ensuring driving safety. The HUD projects the light source from the inside of the instrument panel to the front windshield to present information in a reflective manner. This technology was originally found in military applications such as fighter jets, but high-end cars are also equipped with HUD devices. At present, HUD still has a lot of room for development, and it may gradually spread from high-end cars to general mid-low-end products in the future.
(c) Environmental protection: electric vehicle growth
In the case of increasingly strict carbon emission standards for vehicles, hybrid electric vehicles or pure electric vehicles can effectively solve the problem of vehicle carbon emissions. The market

75
for electric vehicles has entered a stage of growth, and countries have already had government subsidies to counter the relatively high prices and help electric vehicles become popular. In addition to the vehicle itself, the electric vehicle can also drive the business opportunities built by the charging pile or the charging station, and the screen on the charging pile can also be synchronized.
4.Overview of the Main Industry in which Sitronix Participates
From the three product categories such as sensors, mobile phones, and automotive devices, the recent development of the industry emphasizes the point that everything is connected, there is cross-domain cooperation, expansion of mid-low-end market, and the technical advancement of high-end market, in order to be more safer, more convenient, environmentally friendly and make life more efficient, as well as in the process of development, a large number of demand for technology products such as sensors and DDI has been generated. One of the current challenges lies in the integration of intra- and cross-domain standards, and whether the information content is compatible with different systems and brands. If the various information can be seamlessly distributed in the same field or across fields in the entire ecosystem, society can truly benefit from everything intelligence. Sitronix is an IC design company that has several display technologies, offers diversified products to a various industrial customers, and pursues R&D strength, so we are optimistic about this trend.
2. The Links between the Upstream, Midstream, and Downstream Segments of the Industry
As a whole, our semiconductor's upstream, midstream, and downstream relationships are shown in the following table, which can be broadly divided into chip design for upstream, mask and wafer fabrication for midstream, and wafer testing and packaging for downstream. Sitronix is an IC design company for upstream.
Upstream Midstream Downstream Applicator
IC Design
(Design House)
Mask and Wafer manufacturing
(Foundry)
Package and Testing
Brand Vendors
Communications Vendors
Computer Vendors

76
3.Product Development Trends
a. Zero external components
The zero-capacitance technology used by Sitronix is ahead of the market, and the company's R&D team is continuing to push this product feature and competitive advantage to the mid-high resolution display driver chip, allowing Sitronix to continue to stay ahead of the industry specifications and improve the technology threshold to ensure product advantages.
b. Medium-sizedautomotive panel driver IC
The Automotive panel market continues to grow every year, and the demand for medium-sized panels is increasing. In recent years, Sitronix has been strengthened by the development of the medium-sized automotive panel driver IC, which continues to be adopted by major customers and is expected to gradually increase its market share in the automotive display driver IC market.
c.Sensors
The Sensors produced by Sitronix’s subsidiary Sensortek continues to be upgraded and have successfully entered the high-end market and have received many customer support and recognition.
4. Status of Industrial Competition
Product Items
Partial Peers
Product Technology Difference and Market Status Analysis
LCD driver IC (Mono)
Ultrachip Epson
A.Product Technology Difference: Sitronix holds a number of patents that strengthen the Company's competitive advantage in many ways.
B.Market Status Analysis: In terms of mono TN and STN shipments, Sitronix is the market leader. This also means that Sitronix is one of the few vendors that can provide one-stop services on a large scale. The Company can supply various ICs, such as black and white and color, low resolution to high resolution, to customers according to the requirements of different product positioning in each Industry.
LCD driver IC (Color)
Novatek Himax
A.Product Technology Difference:
The Company holds innovative patented

77
Product Items
Partial Peers
Product Technology Difference and Market Status Analysis
Ilitek Focaltech GalaxyCoreNEW VISION
circuit design that can provide the best quality to the customer.
B.Market Status Analysis: Sitronix is currently the market leader in the Feature phone display driver IC. As for the Smart phone display driver IC part, because Sitronix just entered the Market soon, still has a lot of room for growth. Sitronix will continue to enhance its competitive advantage with Diversified products.
Touch control IC
Synaptics Goodix Focaltech
A.Product Technology Difference: Sitronix's anti-noise technology is effective against interference sources such as chargers, LCMs, etc.
B.Market Status Analysis: Sitronix is a newcomer to the Touch Control Market and still has a lot of room to grow.
Sensors AMS Bosch
A.Product Technology Difference: Sitronix Group’s subsidiary –
In addition to the standard version of the proximity sensors, Sensortek also offers multiple versions of small apertures and no holes to meet various needs of customers.
B.Market Status Analysis: Sensortek's Proximity sensors continue to be supported by each major customer, and Accelerometers are new to the Smart phones application market, with great room for growth.
(3) Research and Development Summary
1.Research and Development Expenses that Has Invested Unit: NT$ thousand
Fiscal Year 2018 fiscal year 2017 fiscal year
Research and Development Expenses 1,318,845 1,177,828
Research and Development Expenses as a Percentage of Operating revenue in Current Fiscal Year
13% 12%

78
2. Products and/or Technologies Successfully Developed Fiscal Year Content of Technologies
1999 Built a SOC architecture based on W65C02.
2000
Completed high-integration electronic dictionary chip, and built the IP shared 16Mbit Mask ROM, 32Kbit SRAM, Dual port SRAM, DMA, LCD controller, low voltage detector circuit, ect. Built a self-developed text LCD Controller/Driver architecture, which developed and improved anti-static damage capability to industrial level. Completed power-saving SOC chip, which standby current is less than 3 microamps.
2001
Completed Ultra Power Saver (60 μA) LCD Controller/Driver for Mobile Phones, which output voltage variations of various display patterns are less than 1%. Completed has a built-in Chinese character LCD Controller. Designed high voltage (40V) related IP, such as Power hoist protection circuit, high voltage ESD protection circuit, Level shift circuit, etc.
2002
Electronic dictionary, LCD Driver for electronic dictionary, LCD Driver for mobile phone, LCD Driver for PDA. Built-in power-saving OP and Booster circuit, which can greatly improve the electronic dictionary display quality and save 300 microamps. Built-in voltage divider capacitor and voltage double capacitor, which save on external parts of your phone. Completed uses the HI FAS drive LCD Drive, which saves 40% compared to conventional circuits.
2003
Built 0.35μ design. Built DSP technology. Built Audio application technology. Built CSTN color technology. Started to buildTFT color technology. Built Shared Pixel Rendering color technology. Built Color Dithering color technology. Built White LED driver technology.
2004
Completed an electronic dictionary platform with USB and Flash read interfaces. Completed DSP voice chip development. Completed 26XX series educational toy products. Completed development of 4KColor STN Driver, mass-produced and shipped. Completed development of 65KColor STN Driver, mass-produced and shipped. Completed product development of TFT LCD Driver for mobile phones.
2005
Completed a dictionary platform for next-generation architecture. Built music player software and hardware technology. Completed the development of the educational toy product line. Completed HIFAS architecture CSTN Driver. Introduced the mass production of TFT Mobile Driver. Built the technical capability of Large Panel Driver. Continue the cost down work of STN and CSTN products.
2006
Built VoIP control integrated circuit technology. Built the integrated circuit technology of the chip interface card reader of the USB interface. Built 8-bit microprocessor development system based on USB interface. Successful Completed introduces Green Driver technology into STN and CSTN products. Successfully introduced TFT IC into MP4 and high-end mobile phone market and smoothly introduced mass production. Built complete small and medium size TFT product line. Developed and completed Driver IC for automotive LCD. Started the mass production of 6 bits 384 Channels Source Driver for LCD monitor.

79
Fiscal Year Content of Technologies
Started the mass production of 256 Channels Gate Driver for LCD monitor. Introduced the mass production of 6 bits 642 Channels Source Driver for LCD monitor.
2007
Built an 8-bit and 32-bit digital photo frame system. USB interface single-chip for wafer reader is obtained international certification and introduced to mass production. Built complete and fast multimedia playback platform. Successfully introduced the mass production of Green Driver MSTN/CSTN. Successfully introduced the mass production of automotive LCD Driver. Completed Crosstalk Compensation circuit new technology and introduced to mass production. Built the R & D technology of Green Driver TFT. Started the mass production of 6 bits 384/642 Channels Source Driver for LCD monitor. Started the mass production of 256/300/350 Channels Gate Driver for LCD monitor. Completed the verification of6 bits 720/840 Channels Source Driver for LCD monitor. Completed the verification of 8 bits Source Driver & 400 Channels Gate Driver for LCD monitor. Completed the verification of 1200 Channels Source with 480/600 Channels Gate for AV monitor.
2008
Built complete digital photo frame product system. Built a multi-functional personal karaoke player. Introduced the mass production of Palette Driver. Developed the E-Paper driver chip. Introduced CABC & Dot Inversion TFT LCD driver IC for mobile phones. Started the mass production of 6 bits 642/720 Channels Source Driver/400 Channels Gate Driver for LCD monitor. Started the mass production of 400 Channels Gate Driver for LCD monitors. Completed the verification of 6 bits 960 Channels Source Driver. Completed the verification of 8 bits Source Driver for LCD monitor. Started the mass production of 1200 Channels Source Driver and 600 Channels Gate Driver for low-price Notebook panel. Completed the verification of 480 Channels Gate Driver. Completed the output of the Source Driver Engineering Sample of the 1200 Channels built-in Timing controller for digital photo frame panels.
2009
Personal portable Karaoke Audio Player product. Completed the development of voice book system design and software. Developed the TFT LCD drive single chip Green Driver technology for mobile phones. Started the mass production of small-size TFT LCD driver single-chip built-in capacitor technology. Started the mass production of small-size TFT LCD driver single-chip built-in backlight power-saving technology. Started the mass production of mini-LVDS 6 bits 960 channels COF source driver for LCD monitor. Started the mass production of RSDS 6 bits 960 channels COF source driver for LCD monitor. Completed the verification of mini-LVDS 6 bits 1026 channels COF source driver for LCD monitor. Completed the verification of mini-LVDS 768 channels COG source driver for Notebook panel. Completed the verification of supporting Dual gate architecture 800 ch and 600 ch COG gate driver for Notebook panel. Started the mass production of source driver with 1200 Channels built-in timing controller (Timing Controller) for digital photo frame panel.
2010 A new generation of multi-function control chip and processing platform.

80
Fiscal Year Content of Technologies
Portable music singing solution. Voice sound controlled platform. The 32-bit processor applied in the learning machine market solution. A new generation of 32-bit processor chips. The controller chips for Apple accessories product. Expanded the driver chips built-in capacitor products for mobile phones. Built the drive chip technology for small-size, HD resolution without capacitor. Developed the Small-size driver chip of circuit for reducing memory unit. Built the high-speed single-channel interface driving chips technology for mobile phones. Started the mass production of mini-LVDS 768 channels COG source driver for Notebook panel. Completed the verification of 4 960ch gate driver supporting dual gate architecture for medium-size panel. Completed the verification of source drive with 1200 channels built-in timing controller (Timing Controller) for automotive panel. Started the mass production ofmini-LVDS 6 bits 1026 channels COF source driver for LCD monitor. Started the mass production ofSource/Gate driver for industrial panel.
2011
Expanded the TFT LCD single-chip driver built-in capacitor products for mobile phone. Built the TFT LCD, HD resolution drive chip technology without capacitor for mobile phone. Built the high-speed single-channel interface driving chips technology for mobile phones. Introduced the new STN Driver IC for customer testing, and successfully introduced to mass production at the end of the year. Completely developed the TN Driver COG IC, and introduced it to the market for promotion. Developed medium-sized TFT 800*480 resolution 2 chip solution, high pin count gate driver, built-in timing generation circuit, supporting 1024*768 resolution driver IC and arbitrary resolution timing generation circuit. Developed the driver IC built-in timing generation circuits, real 8-bit driver ICs and temperature compensation circuits for automotive TFT panel. Started the mass production of Multi-finger touch solution for tablet. Passed the certification of Win7 10-finger touch Logo. Built the Single-layer ITO touch sensing technology. Started the mass production of a new generation of five-finger touch single chip for smart phones. Launched a multi-finger touch single chip designed specifically for tablet. Completed the support of OGS (One Glass Solution) multi-finger touch technology. Built the multi-touch technology that could resistant to high noise of power adapters.
2012
Built the drive chip technology for small-size, TFT LCD, HD resolution without capacitor. Developed the driver chip with built-in timing generation circuit and power circuit. Developed the control chip for 3D glasses. Mono-STN Green Driver external power system. Developed the1024*600 resolution 2Chip solution.
2013
Built the driver ICs with high-speed interface, high-speed SRAM, Line buffer technology for TFT LCDs mobile phones. HD720 (800*1280) For LTPS LCD Driver. Built the driver chip technology without capacitor for small-size, TFT LCD, function phones

81
Fiscal Year Content of Technologies
Developed the ES of PND 480x272 0C driver IC. Researched and developed the STN DRIVER NEW BOOST SYSTEM WITH ZERO CAPS.
2014
2/4 direction gesture control proximity sensor. Small sensor hole proximity sensor. 320*240 resolution STN display driver chip for industrial control measurement. 480*272 resolution color TFTdisplay driver chip for Smart Home Product. HVGA (480*320) Zero Cap a_Si TFT LCD driver IC. HD720 (1280*800) a_Si TFT LCD driver IC. WVGA Burst Out DC/DC Convertor for Zero Cap Driver IC. MIPI with 1.5G pbs Lane Speed. Touch IP for TDDI (Touch + display driver) Integrated IC.
2015
320*240 STN with LVDS display driver chip for industrial control measurement. 800*480 STN display driver chip for industrial control measurement. 1.5 m/m small-sensor-hole proximity sensors. 1920*720 1440-channel TFT display driver chip for Automotive Center Stack / Instrument Cluster.
2016 Announced to launch the HD720 Zero capacitance version. Announced to launch the FHD Zero capacitance version.
2017 Started the mass production of automotive touch controller IC. Launched the upgraded version of the invisible proximity sensors.
2018 Launched the low power consumption industrial control DDI product. Launched the Micro-size proximity sensor and P-Sensors.
(4) The Company's Long- and Short-term Business Development Plans
(1) Short-term Business Development Plans
Marketing Strategy:
Has continued to expand channels and strengthen overseas marketing (such as Japan, Korea, etc.) to increase the market share of LCD display driver chips.
Production Strategy:
Has strengthened its cooperation with the development of outsourcing manufacturers such as Foundry, Packaging plants and Test plants at home and abroad in order to enhance and stabilize the source and flexibility of supply. It also has actively established an information network connection with the cooperative supply chain manufacturers in order to facilitate immediate control of the progress and quantity of production.
Product Strategy:
Has continued to diversify the application of the product and maintain a balanced development of each product line in order to reduce the impact on the company's operations and profitability due to the economic cycle.

82
(2) Long- term Business Development Plans
Has continued to increase the breadth and depth of product applicability and has established complete sales spots. As well as implemented international development strategies to enhance the international brand customers and market reputation.
New processes and new technologies has been developed with supply chain plants to share the risks.
Has fully grasped the pulse of the market and is developing towards high-profit, high-growth niche products, and has continued to Invest in R & D, and master the key technologies, in order to achieve maximum profit.
Has provided complete analysis for corporate growth and market development, as well as conducted comprehensive financial planning and regular audits, in order to reduce operational risks and enhance the company's competitiveness.
Has upheld the philosophy of sustainable management, established a good corporate culture, and continued the direction of the short-term development plan, in order to respond to the growth of the scale of operations.
2. Production and Marketing Situation Summary (1)Market Analysis
1. The Geographic Areas Where the Main Products of the Company are Provided
Unit: NT$ thousand
Sales Areas 2017 2018
Amount Percentage
(%) Amount
Percentage (%)
Taiwan 805,321 8.54 730,627 7.07 Hong Kong and Others
8,625,741 91.46 9,599,878 92.93
Total 9,431,062 100.00 10,330,505 100.00
2. The Company's Market Share
Sitronix's major products are the mobile phones display driver IC. Sitronix has already been the market leader in the feature phone display driver IC, with a global market share of approximately 70%. As for Smart phones, because Sitronix has just started, the current global market accounts for

83
less than 10%, we still have a lot of room for growth. In the next few years, Sitronix's goal is to continue to strengthen its market position on feature phones, and at the same time enhance the global market share of Smart phone display driver IC.
3. The Company's Demand and Supply Conditions for the Market in the Future and the Market's Growth Potential
According to the survey of the Industrial Research Institute, if the application of the panel is differentiated by size, the application of the small-sized panel is still based on mobile phones, which is 80% of the demand. As the growth rate of Smart Phones continues to rise, it will continue to drive demand for small-sized panels and driver ICs.The functionality of consumer electronics has become more complex, and as the market becomes more demanding for panel resolution, color saturation, and responsiveness, peripheral IC integration for both product and panel-related applications will be more demanding, further pushing the demand for Display driver ICs.
4. The Company's Competitive Niche
(1) Professional and stable management team
Sitronix's market position is very clear, and the strategy is focused on long-term steady development. The Group's management team is experienced, and the decision-making is rigorous and clear. Therefore, the cooperation between the Upstream and Downstream supply chain can be effectively mastered. The critical technologies of its products are better mastered and have the strength of R&D for new products, enabling the company to maintain a good competitive advantage.
(2)Complete Product Portfolio
For Sitronix's major products’ Driver IC (DDI), the Company offers a complete product portfolio, from black and white TN and STN to color TFTs, from low resolution to medium and high resolution, for which every type is available.
In addition to DDI, Sitronix also offers touch control chips, MCUs, power management chips, ambient light sensors, distance sensors, acceleration sensors, etc. As a whole, the industry in which the Sitronix Group is involved spans feature phones, Smart phones, wearable

84
devices, the automotive category, industrial control category, etc. The industrial control category covers hundreds of applications, including various products such as: U-key, Multi-Function Product (such as Printer etc.), Smart meter, Electronic cigarette, etc. The advantages of a diversified product portfolio include: (a) For the customers with many different product lines and various needs, Sitronix can provide them with one-stop shopping. (b) Reduce the risk that a single product or a single industry brings to the Company. (c) Different industries have different revenue streams and gross profit trends,which can balance each other.
(3)Maintainsa good relationship with Foundry
The Group has long had a good track record with the well-known Foundry. In addition to fully grasping the timing of the production process, it can effectively reduce costs and ensure quality. In the slack season, the production capacity can be adjusted and the cost of foundry can be reduced. The cost, quality and efficiency of the Company's product can provide good competitiveness.
5. The Company's Positive and Negative Factors for Future Development, and the Company's Response to Such Factors
Positive factors
A.Internet of Things (IOT) has continued to grow
IOT's related applications are quite extensive, and with the rapid development of the various Handheld Device Accessories, it has brought new demands for DDIs and related sensors.
B.Panel’s size and quantity have grown
In addition to the growing demand for consumer electronics such as Smart phones and Smart wearable devices, other markets, such as the automotive category, medical, digital signages, etc., are expected to increase the use of panels. Besides, the existing panels also have a trend of increasing size. For example, the automation panel has been changed from less than 6 inches to 7 to 9 inches, or even 9 inches or more. The larger the panel size, the more DDI is needed. The overall market growth has been further promoted.
C. Industrial Structure of Work Specialization
Our IC Industrial is a business model with a Work Specialization. IC design companies focus on the design itself, not on factory
85
manufacturing. Therefore, in the rapidly changing Industrial environment, IC design companies can enjoy greater flexibility to upgrade existing products or plan new products.
Negative Factors and its Response Measures
A.The functions required by the driver IC have become more complex.
As electronic products demand more from all aspects of the panel, and panel types include LCDs and OLEDs, the design of driver ICs needs to evolve subsequently. This trend has increased the complexity of the driver IC.
Response Measures
.The Company's Market positioning is very clear, we will continue to strengthen product layout and communication with customers, master the most advanced technology trends and develop corresponding strategies, in order to reduce the related risks.
B. Product prices are facing downward pressure
The price of consumer products such as mobile phones is under relatively high pressure. Under the pressure of product price cuts, if the driver IC industry can't control the cost, it will affect the profit level.
Response Measures (1) Has continued to Invest in R & D, and has established
differentiated technical barriers to expand the distance from competitors.
(2) Product Portfolio Diversification has been adopted and has taken into account the industry's low price pressure and high gross profit.
(3) The rigorous Upstream and Downstream Industrial chain management has been continuously implemented and product costs have been controlled.
(4) Production processes and designs have continued to increase the grain yield per wafer, as well as strategic adjustments in the slack season.
(5) Customer service has been strengthened and new markets have been developed in order to maintain the competitive advantage of the Company.
C.The market changes quickly and the product life cycle becomes shorter
The technological advancement of semiconductors is fast, the demand for Product functions is increasing, and peer companies are
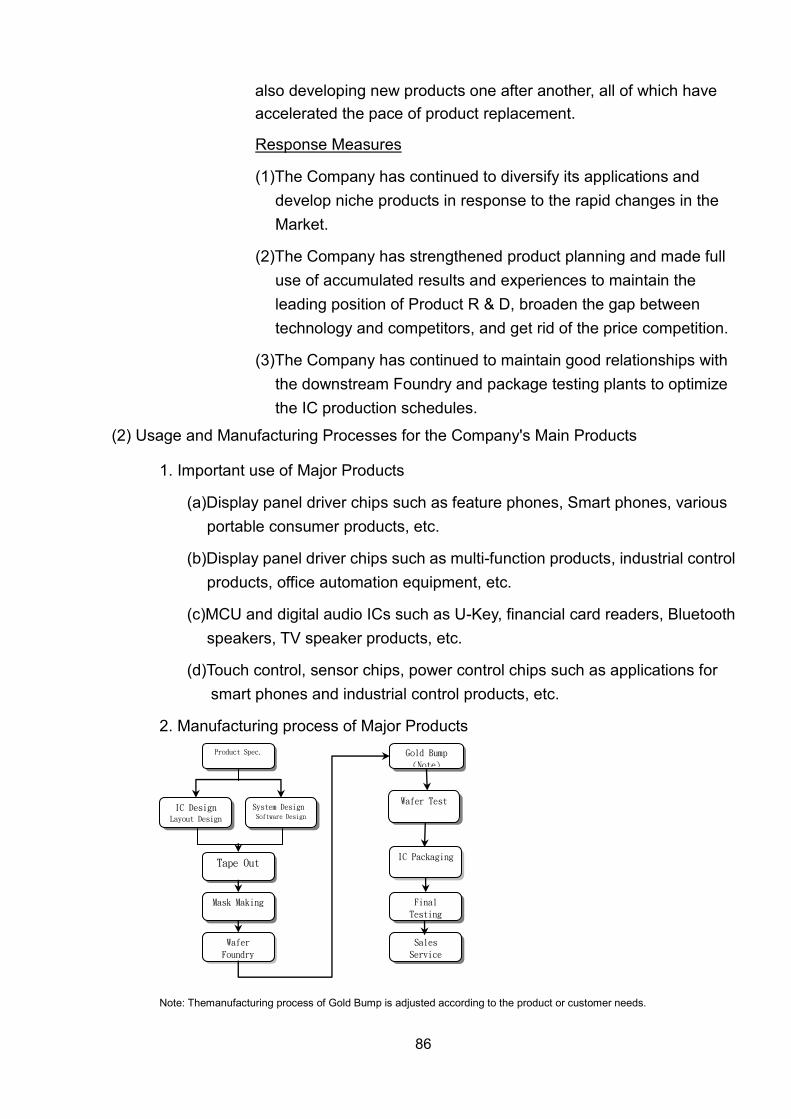
86
also developing new products one after another, all of which have accelerated the pace of product replacement.
Response Measures
(1)The Company has continued to diversify its applications and develop niche products in response to the rapid changes in the Market.
(2)The Company has strengthened product planning and made full use of accumulated results and experiences to maintain the leading position of Product R & D, broaden the gap between technology and competitors, and get rid of the price competition.
(3)The Company has continued to maintain good relationships with the downstream Foundry and package testing plants to optimize the IC production schedules.
(2) Usage and Manufacturing Processes for the Company's Main Products
1. Important use of Major Products
(a)Display panel driver chips such as feature phones, Smart phones, various portable consumer products, etc.
(b)Display panel driver chips such as multi-function products, industrial control products, office automation equipment, etc.
(c)MCU and digital audio ICs such as U-Key, financial card readers, Bluetooth speakers, TV speaker products, etc.
(d)Touch control, sensor chips, power control chips such as applications for smart phones and industrial control products, etc.
2. Manufacturing process of Major Products
Note: Themanufacturing process of Gold Bump is adjusted according to the product or customer needs.
Product Spec.
IC Design Layout Design
System Design Software Design
Tape Out
Mask Making
Wafer
Foundry
Gold Bump
(Note)
Wafer Test
IC Packaging
Final
Testing
Sales
Service

87
In the above-mentioned dice production process, the Company is responsible for Production specifications, IC design, System design and After-sales services. Mask making, Wafer foundry, Gold Bump, Wafer testing, Wafer dicing, IC packaging and Final testing are commissioned to professional manufacturers.
(3) Supply Situation for the Company's Major Raw Materials
The Group's main raw materials are wafers. Currently, the major suppliers are supplied by Taiwan Semiconductor Manufacturing Co., Ltd. (TSMC) and MagnaChip Semiconductor Ltd. (MagnaChip), etc., because of the stable quality of its products and production capacity and delivery period, the degree of cooperation is high, so the relationship between the two parties is good, and we have been working together for a long time, so there is no shortage of supply.
(4)A List of Any Suppliers and Clients Accounting for 10 Percent or More of the Company's Total Procurement (Sales) Amount in Either of the 2 Most Recent Fiscal Years, the Amounts Bought from (Sold To) Each, the Percentage of Total Procurement (Sales) Accounted for by Each, and an Explanation of the Reason for increases or decreases in the above Figures 1.Information on Major Suppliers in the Most Recent 2 Fiscal Years
Unit: NT$ thousand 2017 Fiscal Year 2018 Fiscal Year Up to Previous Quarter of 2019
Fiscal Year
Items Name Amount
% of net purchases for the full year〔%〕
Relationship
with the Issuer
Name Amount
% of net purchases for the full year〔%〕
Relationship with
the Issuer
Name Amount
% of net purchases for
the current fiscal year up to previous
quarter〔%〕
Relationship
with the issuer
1 A
supplier 2,840,272 61% None A supplier 3,903,897 74% None A
supplier 644,635 71% None
2 B
supplier 1,281,685 28% None B supplier 770,081 15% None B
supplier 116,395 13% None
3 Others 525,161 11% None Others 618,915 11% None Others 143,155 16% None
Total Net
purchase 4,647,118 100% None Net
purchase 5,292,893 100% None Net
purchase 904,185 100% None
Reason for Increases or Decreases: The main purchasing products of Sitronix and its subsidiaries are wafers. As a result of changes in product portfolio and manufacturing process, the suppliers, purchasing amounts and ratios subsequently changed.

88
Reason for Increases or Decreases: As a result of changes in the sales of product portfolio and the market environment of the major customers of Sitronix and its subsidiaries, the amount and proportion of sales subsequently changed.
(5) An Indication of the production Volume for the 2 Most Recent Fiscal Years
Unit: NT$ thousand/ thousand pieces Fiscal Year
Value, Volume of production
Major Products
2017 Fiscal Year 2018 Fiscal Year
Capacity of
Production
Volume of production
Value of production
Capacity of Production
Volume of production
Value of production
Integrated Circuit Design Products
- 1,444,426 6,682,326 - 1,537,641 7,324,117
Others - - 188,001 - - 118,979
Total - 1,444,426 6,870,327 - 1,537,641 7,443,096
Note: Sitronix and its subsidiaries' major products are designed for Integrated Circuit,IC. The products are manufactured by semiconductor factories, and then tested, packaged and shipped, the company itself has no capacity, so is not applicable in this.
2. Information on Major Customers of the Most Recent 2 Fiscal Years Unit: NT$ thousand
2017 Fiscal Year 2018 Fiscal Year Up to Previous Quarter of 2019
Fiscal Year
Items Name Amount
% of net sales for the full
year 〔%〕
Relationship
with the Issuer
Name Amount
% of net sales for the full year 〔%〕
Relationship with the
Issuer
Name Amount
% of net sales for
the current fiscal year
up to previous quarter 〔%〕
Relationship
with the Issuer
1 A customer 1,777,886 19% None A
customer 1,704,803 17% None A customer 343,730 13% None
2 B customer 1,045,030 11% None B
customer 1,026,545 10% None B customer 192,402 8% None
3 Others 6,608,146 70% None Others 7,599,157 73% None Others 2,025,461 79% None
Total Net sales 9,431,062 100% None Net sales 10,330,505 100% None Net
sales 2,561,593 100% None

89
(6) An Indication of the Volume of Units Sold for the 2 Most Recent Fiscal Years
Unit: NT$ thousand/ thousand pieces Fiscal Year
Volume, Value of Units Sold
Major Products
2017 Fiscal Year 2018 Fiscal Year
Domestic Sales Export Sales Domestic Sales Export Sales
Volume of Units
Sold
Value of Units Sold
Volume of Units Sold
Value of Units Sold
Volume of Units Sold
Value of Units Sold
Volume of Units Sold
Value of Units Sold
Integrated CircuitDesign
Products 88,256 705,868 1,180,347 8,616,872 64,144 597,161 1,465,220 9,575,116
Others - 99,453 - 8,869 - 133,466 - 24,762
Total 88,256 805,321 1,180,347 8,625,741 64,144 730,627 1,465,220 9,599,878
3. Employees
Fiscal Year 2017 Fiscal Year
2018 Fiscal Year
The Current Fiscal Yearup
toMarch 31, 2019
Number of Employee
Executive Officer 152 159 173
Professional 378 433 437
Assistant 79 79 83
Technician 54 72 70
Total 663 743 763
Average Age 38.06 37.29 37.12
Average Service Seniority 6.41 6.49 6.49
Educational Distribution Ratio
Doctor 2.3% 2.3% 2.1%
Master 51.0% 48.0% 47.0% Bachelor 42.6% 45.4% 46.6%
High School 3.8% 4.0% 4.2%
Below High School 0.3% 0.3% 0.1%
Total 100% 100% 100%

90
4. Disbursements for Environmental Protection:
Total Losses (Including Damage Awards) and Fines for Environmental Pollution for the 2 Most Recent Fiscal Years, and During the Current Fiscal Year up to the Date of Publication of the Annual Report, and an Explanation of the Measures (Including Corrective Measures) and possible Disbursements to be Made in the Future (Including An Estimate of Losses, Fines, and Compensation Resulting from any Failure to Adopt Responsive Measures, or if it is not Possible to Provide such an Estimate, an Explanation of the Reason Why it is not Possible): No such situation.
5. Labor Relations:
(1) List Any Employee Benefit Plans, Continuing Education, Training, Retirement Systems, and the Status of their Implementation, and the Status of Labor-Management Agreements and Measures for Preserving Employees' Rights and Interests
1.Welfare measures handled by the Company:
Providing employees with diversified intimate benefits, so that the colleagues can work wholeheartedly without any worries, as well as diversified entertainment and a wealth of club activities are also available to enable employees to give balance both work and life. The Company provides employee welfare as follows: 1. Humanized management, intimate and comfortable working
environment. 2. Two days off in a week, bridge holiday. 3. Vacation calculations and engagement leave better than the Labor
Standards Act. 4. Annual travel subsidies. 5. Employee car and motorcycle parking fee subsidies. 6. Providing high-level Group Insurance to ensure the medical quality of
care that employees receive and the economy for their family. 7. Regular free systemic health checkups every year to care for the
physical and mental health of employees. 8. Annual holiday gift certificates, bonuses, birthday gift certificates,
wedding and funeral celebration subsidies. 9. Afternoon tea snacks are provided daily for free. 10. Holds company activities once in a while to maintain good employee
relations. 11. Community activities and funding subsidies. 12. A sound education and training system and funding subsidies.
91
In order to promote good relations and teamwork, the Company will hold various sports games, sports events, family days, life lectures and other activities, and promote the interaction and connection between the Company and its employees, chiefs and colleagues through their participation in the said activities.
2. Welfare measures handled by the Employee Welfare Committee:
The Company establishes an Employee Welfare Committee as required and sets aside a Welfare Fund monthly. The Employee Welfare Committee plans and holds annual domestic and foreign travel, annual gift certificates, celebration of Father's Day and Mother's Day, corporate year-end activities and so on.
3. Education and Training:
In order to promote the quality of human resources and respond to the needs of the company's future internationalization and business management, the Company has set up Measures for education and training management, and provided a complete on-the-job training system to increase on-the-job professional skills and management training. The new recruit can enjoy training fee subsidies, and get the complete training of the new recruit training system, which will help the new recruit to quickly integrate into the organization and meet his/her self-development needs, as well as to enjoy a full range of growth environment and space.
4.Retirement system and its implementation:
The Company shall set aside 6% of the employee's pension wage monthly and deposit it in a personal pension account set up by the Bureau of Labor Insurance in accordance with the Labor Pension Act. Employees may also voluntarily contribute up to 6% of their monthly wage to their pension plan. Individuals who voluntarily pay the part of the employee may have the amount deducted from the total amount of personal comprehensive income for the year. In addition, if an employee meets the retirement qualification requirement for retirement under the Labor Standards Act, the Company will pay in accordance with the old labor retirement system: an equivalent of two months' average wage for every full year of employment; more than fifteen years of seniority, an equivalent of one month's average wage for every full year of employment, up to a maximum of forty-five months. The Group will set aside 2% of the total wage of employees on a monthly basis as their
92
Pension Fund in accordance with the Labor Standards Act, which is deposited in the name of the committee by the Labor Pension Fund Supervisory Committee into a special account of the Bank of Taiwan.
5. Agreement between employee and employer:
The Company attaches great importance to employee-employer relationship and handles the communication and coordination of employee and employer, so that both employers and employees can gain common understanding and ensure smooth operations.
(2)List Any Loss Sustained as a Result of Labor Disputes in the Most Recent Fiscal Year, and During the Current Fiscal Year up to the Date of Publication of the Annual Report, Disclose an Estimate of Losses Incurred to Date or Likely to be Incurred in the Future, and Indicate Mitigation Measures Being or to be Taken. If the Loss Cannot Be Reasonably Estimated, Make a Statement to that Effect:None.
6. Important Contracts: None.

93
VI. Financial Summary 1. Condensed Balance Sheets and Statements of Comprehensive Income
for the Past 5 Fiscal Years (1) Condensed Balance Sheets -Adopted the International Financial Reporting
Standards A. Consolidated Financial Statements
Unit: NT$ thousands Fiscal Year
Items
Financial Data for the past 5 fiscal years Financial Data of the current fiscal year up to March 31, 2019 (Note 3) 2014 2015 2016 2017 2018
Current assets 4,626,392 5,220,219 5,704,160 5,057,965 6,415,599 6,090,712
Property, Plant and Equipment 724,565 684,503 863,693 782,145 810,304 801,465
Intangible assets 59,855 54,499 44,780 55,789 47,875 46,989
Other assets 911,890 867,026 749,835 1,135,096 1,092,733 1,240,357
Total Assets 6,322,702 6,826,247 7,362,468 7,030,995 8,366,511 8,179,523
Current liabilities
Before distribution 2,139,129 2,342,310 2,219,675 1,903,937 2,940,851 2,306,180
After distribution 2,675,248 2,937,998 2,943,501 2,566,784 Note 1 Not applicable
Non-Current liabilities 93,815 114,390 126,265 128,814 219,988 274,599
Total liabilities
Before distribution 2,232,944 2,456,700 2,345,940 2,032,751 3,160,839 2,580,779
After distribution 2,769,063 3,052,388 3,069,766 2,695,598 Note 1 Not applicable
Equity attributable to shareholders of the parent 3,970,412 4,170,647 4,687,378 4,679,659 4,712,266 5,026,970
Share capital 1,191,376 1,191,376 1,206,376 1,205,176 1,202,226 1,202,226
Capital surplus 651,239 647,291 811,101 785,875 761,304 771,108
Retained earnings
Before distribution 2,066,497 2,356,301 2,799,023 2,766,102 3,026,335 3,229,728
After distribution 1,530,378 1,760,613 2,075,197 2,103,255 Note 1 Not applicable
Other Equity 61,300 (24,321) (129,122) (77,494) (277,599) (176,092)
Treasury stock - - - - - -
Non-controlling interests 119,346 198,900 329,150 318,585 493,406 571,774
Total equity
Before distribution 4,089,758 4,369,547 5,016,528 4,998,244 5,205,672 5,598,744
After distribution 3,553,639 3,773,859 4,292,702 4,335,397 Note 1 Not applicable
Note 1: The Proposal for Distribution of Earnings of 2018 fiscal year has not been approved by the shareholders' meeting.
Note 2: The Financial Data from 2014 fiscal year to 2018 fiscal year had audited and attested by the CPA.
Note 3: The Financial Data for First Quarter of 2019 is the number reviewed by the CPA.

94
(1) Condensed Balance Sheets-Adopted the International Financial Reporting Standards
B. Unconsolidated Financial Statements Unit: NT$ thousands
Fiscal Year Items
Financial Data for the past 5 fiscal years
2014 2015 2016 2017 2018
Current assets 3,406,787 3,483,145 4,156,236 3,573,205 4,022,086
Property, Plant and Equipment 488,908 443,195 539,985 429,248 454,410
Intangible assets 58,397 51,284 42,629 50,246 40,400
Other assets 1,595,587 1,622,472 1,795,317 2,173,676 2,405,849
Total assets 5,549,679 5,600,096 6,534,167 6,226,375 6,922,745
Current liabilities
Before distribution 1,501,913 1,360,875 1,776,952 1,476,132 2,135,760
After distribution 2,038,032 1,956,563 2,500,778 2,138,979 Note 1
Non-Current liabilities 77,354 68,574 69,837 70,584 74,719
Total liabilities
Before distribution 1,579,267 1,429,449 1,846,789 1,546,716 2,210,479
After distribution 2,115,386 2,025,137 2,570,615 2,209,563 Note 1
Equity attributable to shareholders of the parent 3,970,412 4,170,647 4,687,378 4,679,659 4,712,266
Share capital 1,191,376 1,191,376 1,206,376 1,205,176 1,202,226
Capital surplus 651,239 647,291 811,101 785,875 761,304
Retained earnings
Before distribution 2,066,497 2,356,301 2,799,023 2,766,102 3,026,335
After distribution 1,530,378 1,760,613 2,075,197 2,103,255 Note 1
Other Equity 61,300 (24,321) (129,122) (77,494) (277,599)
Treasury stock - - - - -
Non-controlling interests - - - - -
Total equity
Before distribution 3,970,412 4,170,647 4,687,378 4,679,659 4,712,266
After distribution 3,434,293 3,574,959 3,963,552 4,016,812 Note 1
Note 1: The Proposal for Distribution of Earnings of 2018 fiscal year has not been approved by the shareholders' meeting.
Note 2: The Financial Data from 2014 fiscal year to 2018 fiscal year had audited and attested by the CPA.

95
(2)Condensed Statements of Comprehensive Income-Adopted the International Financial Reporting Standards
A. Consolidated Financial Statements Unit: NT$ thousands
Fiscal Year Items
Financial Data for the past 5 fiscal years (Note 1) Financial Data for the current fiscal year up to March 31, 2019 (Note 2)
2014 2015 2016 2017 2018
Net revenue 7,595,150 9,266,108 10,189,747 9,431,062 10,330,505 2,561,593
Gross profit 2,065,742 2,481,024 2,881,882 2,514,333 2,870,026 836,742
Income from operations 748,494 963,462 1,245,724 853,537 1,042,514 314,387
Non-operating income and expense 99,282 63,990 12,761 134,731 79,416 24,290
Income before Income Tax 847,776 1,027,452 1,258,485 988,268 1,121,930 338,677
Income from Continuing Operation
718,574 845,829 1,099,027 891,234 1,013,820 302,993
Loss of suspended businessunit - - - - - -
Net income 718,574 845,829 1,099,027 891,234 1,013,820 302,993
Other comprehensive income (net of tax)
14,519 (101,788) 8,718 (18,662) (143,054) 101,872
Total comprehensive income
733,093 744,041 1,107,745 872,572 870,766 404,865
Net income attributable to stockholders of the parent
711,517 835,434 1,041,837 873,158 840,363 203,393
Net income attributable to non-controlling interests
7,057 10,395 57,190 18,076 173,457 99,600
Total comprehensive income attributable to stockholders of the parent
726,036 733,646 1,050,555 854,496 697,847 304,900
Total comprehensive income attributable to non-controlling interests
7,057 10,395 57,190 18,076 172,919 99,965
Earnings per Share 6.02 7.05 8.77 7.32 7.03 1.70
Note 1: The Financial Data from 2014 fiscal year to 2018 fiscal year had audited and attested by the CPA.
Note 2: The Financial Data for First Quarter of 2019is the number reviewed by the CPA.

96
(2) Condensed Statements of Comprehensive Income-Adopted the International Financial Reporting Standards
B. Unconsolidated Financial Statements Unit: NT$ thousands
Fiscal Year Items
Financial Data for the past 5 fiscal years
2014 2015 2016 2017 2018
Net revenue 6,010,205 7,000,517 7,876,747 7,553,780 7,503,697
Gross profit 1,609,459 1,885,705 2,051,777 1,923,918 1,806,085
Income from operations 705,700 881,911 935,213 750,120 550,252
Non-operating income and expense 120,672 89,742 222,910 210,404 354,344
Income before Income Tax 826,372 971,653 1,158,123 960,524 904,596
Income from Continuing Operation 711,517 835,434 1,041,837 873,158 840,363
Loss of suspended businessunit - - - - -
Net income 711,517 835,434 1,041,837 873,158 840,363
Other comprehensive income (net of tax) 14,519 (101,788) 8,718 (18,662) (142,516)
Total comprehensive income 726,036 733,646 1,050,555 854,496 697,847
Earnings per Share 6.02 7.05 8.77 7.32 7.03
Note 1: The Financial Data from 2014 fiscal year to 2018 fiscal year had audited and attested by the CPA.
(3) CPA’s Name and Audit Opinion in the Past 5 Fiscal Years Attesting
Fiscal Year Accounting Firm’s Name CPA’s Name Audit Opinion
2014 Deloitte & Touche Cheng Chih Lin、Hung-Wen Huang Unqualified Opinion
2015 Deloitte & Touche Su Li Fang、Yu Feng Huang Unqualified Opinion
2016 Deloitte & Touche Su Li Fang、Yu Feng Huang Unqualified Opinion
2017 Deloitte & Touche Cheng Chih Lin、Yu Feng Huang Unqualified Opinion
2018 Deloitte & Touche Cheng Chih Lin、Yu Feng Huang Unqualified Opinion

97
2. Financial Analysis for the Most Recent 5 Fiscal Years (1) Financial Data Adopted the International Financial Reporting Standards A. Consolidated Financial Statements
Fiscal Year Analysis Items
Financial Analysis for the past 5 fiscal years The current fiscal year up to March 31, 2019(Note 1) 2014 2015 2016 2017 2018
Financial structure
Debt to asset ratio 35.31 35.98 31.86 28.91 37.77 31.55 Long term capital to property, plant and equipment ratio
577.39 655.06 595.44 655.51 669.58 732.82
Solvency
Current ratio 216.27 222.86 256.98 265.65 218.15 264.10
Quick ratio 163.28 156.18 180.33 170.62 143.43 181.58
Time interest earned(times) 477.54 120.93 849.60 257.16 122.06 123.75
Operating perform
ance
Receivable turnover (times) 9.13 10.81 11.81 9.74 8.72 7.81
Average cash recovery day 39.97 33.76 30.90 37.47 41.85 46.73
Inventory turnover (times) 5.14 5.85 5.05 4.12 3.92 3.56 Payable turnover rate (times) 7.03 6.28 5.70 5.50 5.51 5.26
Days sales outstanding 71.01 62.39 72.27 88.59 93.11 102.52 Property, Plant and Equipment turnover (times)
10.64 13.15 13.16 11.46 12.97 12.71
Total asset turnover (times) 1.34 1.40 1.43 1.31 1.34 1.23
Profitability
Return on Assets (%) 12.78 12.97 15.50 12.42 13.26 14.96
Return on Equity (%) 18.53 19.99 23.41 17.79 19.87 22.43 Pre-tax net profit to Paid-up Capital ratio (%) 71.15 86.24 104.31 82.00 93.32 112.68
Net profit ratio (%) 9.46 9.12 10.78 9.44 9.81 11.82
Earnings per Share(dollar) 6.02 7.05 8.77 7.32 7.03 1.70
Cash flow
Cash flow ratio (%) 55.17 58.31 49.45 30.72 35.43 11.84 Cash flow adequacy ratio (%) 80.84 108.38 96.29 88.11 100.47 92.21
Cash reinvestment ratio (%) 15.36 16.80 8.73 (2.41) 6.28 4.18
Leverage
Operating leverage 8.60 8.21 7.00 9.32 8.37 6.70
Financial leverage 1.00 1.00 1.00 1.00 1.00 1.00 Please explain reasons for changes of over 20% in financial ratios over the last 2 fiscal years: (If the increases or decreases is less than 20%, no analysis is required) 1.Financial structure: Due to the increase of short-term loans to meet operational needs in 2018, the debt to
asset ratio increases. 2.Solvency: Due to the increase of short-term loans in 2018, the interest expense is increased, so the time
interest earned is reduced. 3.Operating capacity: Increases or decreases less than 20%. 4.Profitability: Increases or decreases less than 20%. 5.Cash flow: The increase in the cash reinvestment ratio over the same period last year was due to the fact that
net cash provided from operating activities were higher than in the same period last year. 6.Leverage:Increases or decreases less than 20%.
Note 1: The Financial Data for First Quarter of 2019 is the number reviewed by the CPA.

98
(1) Financial Data Adopted the International Financial Reporting Standards
B. Unconsolidated Financial Statements Fiscal Year
Analysis Items
Financial Analysis for the past 5 fiscal years
2014 2015 2016 2017 2018
Financial structure
Debt to asset ratio 28.45 25.52 28.26 24.84 31.93 Long term capital to property, plant and equipment ratio 827.91 956.51 880.99 1,106.64 1,053.45
Solvency
Current ratio 226.82 255.94 233.89 242.06 188.32 Quick ratio 179.57 170.79 159.36 155.61 120.23 Time interest earned(times) 1,537.00 453.14 13,625.97 296.36 115.41
Operating perform
ance
Receivable turnover (times) 8.69 11.08 10.61 8.32 8.15 Average cash recovery day 42.00 32.94 34.40 43.87 44.78 Inventory turnover (times) 5.72 6.64 5.44 4.55 4.39 Payable turnover rate (times) 7.84 7.05 5.85 5.35 5.60 Days sales outstanding 63.81 54.96 67.09 80.21 83.14 Property, Plant and Equipment turnover (times) 12.07 15.02 16.02 15.58 16.98
Total asset turnover (times) 1.18 1.25 1.29 1.18 1.14
Profitability
Return on Assets (%) 14.05 15.01 17.17 13.72 12.87 Return on Equity (%) 18.86 20.52 23.52 18.64 17.89 Pre-tax net profit to Paid-up Capital ratio (%) 69.36 81.55 96.00 79.69 75.24
Net profit ratio (%) 11.83 11.93 13.22 11.55 11.19 Earnings per Share(dollar) 6.02 7.05 8.77 7.32 7.03
Cash
flow
Cash flow ratio (%) 78.29 86.28 37.76 47.76 29.47 Cash flow adequacy ratio (%) 93.55 116.00 95.29 91.48 97.82 Cash reinvestment ratio (%) 18.78 14.15 1.47 (0.36) (0.64)
Leverage
Operating leverage 7.40 6.93 7.35 8.66 11.61
Financial leverage 1.00 1.00 1.00 1.00 1.01
Please explain reasons for changes of over 20% in financial ratios over the last 2 fiscal years: (If the increases or decreases is less than 20%, no analysis is required)
1.Financial structure: Due to the increase of short-term loans to meet operational needs in 2018, the debt to asset ratio increases.
2.Solvency: Due to the increase of short-term loans in 2018, current liabilities increased, so the current ratio and quick ratio decreased. At the same time, the interest expense generated by due to short-term loans also increased, so the time interest earned decreased.
3.Operating capacity: Increases or decreases less than 20%. 4.Profitability: Increases or decreases less than 20%. 5.Cash flow: Current liabilities increased in 2018 compared to last year, resulting in a decrease in net cash
flow ratio; Due to cash provided by operating activities decreased compared with the same period of last year, so the cash reinvestment ratio decreased.
6.Leverage:Due to operating profit of 2018 decreased compared to last year, resulting in an increase in operating leverage.

99
The financial ratios are calculated as follows: 1.Financial structure (1)Debt to asset ratio=liabilities/assets (2) Long term capital to property, plant and equipment ratio=(total equity+non-current
liabilities)/net property, plant and equipment 2.Solvency
(1)Current ratio=current assets/current liabilities (2)Quick ratio=(current assets-inventory-prepaid expenses)/current liabilities (3) Time interest earned=Earnings before interest and taxes/interest expense
3.Operating performance (1)Receivable(including accounts receivable and notes receivable due to business)
turnover rate=net sales/average receivable of each period(including accounts receivable and notes receivable due to business)
(2)Average cash recovery day=365/Total asset turnover (3)Inventory turnover=sales cost/average inventory (4)Payable(including accounts payable and notes payable due to business)turnover rate=
cost of sales/average payable of each period(including payable accounts payable and notes payable due to business)
(5)Days sales outstanding=365/inventory turnover (6)Property, plant and equipment turnover rate=net sales/net average property, plant and
equipment (7)Total asset turnover rate=net sales/average assets
4.Profitability (1)Return on assets=〔Net income+interest expense×(1-tax rate)〕/net s assets (2)Return on equity=Net income/average total equity (3)Net profit ratio=Net income/net sales (4)Earnings per share=(Net income attributable to parent company owner-preferred
stock dividend)/weighted average number of issued shares 5.Cash flow
(1)Cash flow ratio=net cash flow from operating activities/current liabilities (2)Net cash flow adequacy ratio=Most recent five-year cash flow from operating activities
/Most recent five-year(capital expenditure+inventory increase+cash dividends) (3)Cash reinvestment ratio=(net cash flow from operating activities-cash dividends)/
(gross property, plant and equipment+long term investment+other non-current assets+working capital)
6.Leverage (1)Operating leverage=(net operating revenue-variable operating costs and expenses)/
operating profit (2)Financial leverage=operating income/(operating income-interest expense)

100
3. Audit Committee’s Review Report for Financial Statements in the Most Recent Fiscal Year
Sitronix Technology Corp.
2018 Audit Committee’s Review Report
The undersigned Deloitte & Touche Taipei, Taiwan Republic of China
has duly audited the Operating Report, Financial Statements, and Profit
Distribution Proposed prepared by the supervisor for the year 2018, and
issued the recorded unqualified audit report. All statistical forms after
review by the Supervisor shall be compiled in accordance with the law.
Any discrepancies shall be reported to the superior under the Securities
and Exchange Act, and Company Act.
With respect,
Sitronix Technology Corp. 2019 Shareholders’ Meeting
Sitronix Technology Corp.
Chairman of the Audit Committee: Cheng Chieh Dai
March 15, 2019
101
4. Consolidated Financial Statements of the Most Recent Year with
Independent Auditors’Report and Notes
Please refer to p.117 through p.206 of the annual report.
5. Parent Company Only Financial Statements of the Most Recent Year
with Independent Auditors’ Report and Notes
Please refer to p.207 through p.289 of the annual report.
6. Where the Company or its Affiliates Have Experienced Financial
Difficulties in the Most Recent Fiscal Year or during the Current Fiscal
Year up to the Date of Publication of the Annual Report, Shall Explain
How the Said Difficulties will Affect the Company's Financial Situation:
None.

102
VII. Review and Analysis of Financial Condition and Financial Performance and Risk Issue
1. Review and Analysis of Financial Condition Unit: NT$ thousands
Fiscal Year Items
2018 Fiscal Year
2017 Fiscal Year
Discrepancy Remark Amount Rate%
Current Assets 6,415,599 5,057,965 1,357,634 27% Property, Plant and Equipment 810,304 782,145 28,159 4%
Intangible assets 47,875 55,789 (7,914) -14% Other Non-Current Assets 1,092,733 1,135,096 (42,363) -4%
Total Assets 8,366,511 7,030,995 1,335,516 19% Current Liabilities 2,940,851 1,903,937 1,036,914 54% Non-Current Liabilities 219,988 128,814 91,174 71%
Total Liabilities 3,160,839 2,032,751 1,128,088 55% Share Capital 1,202,226 1,205,176 (2,950) 0% Capital surplus 761,304 785,875 (24,571) -3% Retained earnings 3,026,335 2,766,102 260,233 9% Other Equity (277,599) (77,494) (200,105) -258% Non-controlling interests 493,406 318,585 174,821 55%
Total equity 5,205,672 4,998,244 207,428 4% Explanation for the change of 20% or more, and the amount of change of NT$10 million or more:
1.Current assets increase: due to increases in cash and cash equivalents, notes and accounts receivable, inventory.
2.Current liabilities increase: due to increases in short-term loans and accounts payable.
3.Non-current liabilities increase: due to an increase in refundable deposits. 4.Liabilities increase: due to increases in current liabilities and non-current liabilities. 5.Other equity decrease: Mainly due to decreases in recognition of restricted
employee shares generated employee compensation costs and effect on unrealized gains or losses from the financial assets measured at fair value through other comprehensive profit or loss.
6.Non-controlling interests increase: due to increases in minority interests in subsidiaries and profit of subsidiaries.
Note: Financial Condition of 2018 fiscal year and 2017 fiscal year fill in with Consolidated Financial Data.

103
2. Review and Analysis of Financial Performance Unit: NT$ thousands
Fiscal Year Items 2018 fiscal
year 2017 fiscal
year
Increases (Decreases)
Amount
Change
Rate%
Net revenue 10,330,505 9,431,062 899,443 10% Gross profit 2,870,026 2,514,333 355,693 14% Income from operations 1,042,514 853,537 188,977 22% Non-operating income and expense 79,416 134,731 (55,315) -41% Income before Income Tax 1,121,930 988,268 133,662 14% Net income 1,013,820 891,234 122,586 14% Other comprehensive income (net of tax) (143,054) (18,662) (124,392) -667%
Total comprehensive income 870,766 872,572 (1,806) 0% Net income attributable to stockholders of the parent 840,363 873,158 (32,795) -4% Net income attributable to non-controlling interests 173,457 18,076 155,381 860% Total comprehensive income attributable to stockholders of the parent
697,847 854,496 (156,649) -18%
Total comprehensive income attributable to non-controlling interests
172,919 18,076 154,843 857%
1. Explanation for the change of 20% or more, and the amount of change of NT$10 million or more: (1)Income from operations increase:
Due to increase in operating revenue increase, gross profit increase and operating expenses are well controlled, so operating profit increase.
(2)Non-operating income and expense decrease: Due to decrease in net foreign exchange gain increase and financial assets measured at fair value through profit or loss its net profit decrease.
(3)Other comprehensive income decrease: Due to decrease in unrealized gains or losses from the financial assets measured at fair value through other comprehensive profit or loss.
(4) Net profit attributable to the non-controlling interests and total comprehensive income (loss)attributable to the Non-controlling interests increase: Due to increase in profit of subsidiaries.
2.A sales volume forecast and the basis there for, effect upon the company's financial operations and measures to be taken in response: A sales volume forecast in the coming year, it depending on the industrial boom and the change in market supply and demand. The Company has been actively developing new products to prepare complete product lines and provide customer solutions for future growth and development.
Note: Financial condition of 2018 fiscal year and 2017 fiscal year fill in with consolidated financial data.

104
3. Review and Analysis of Cash Flow (1) Cash Flow Changes of this Fiscal Year
Unit: NT$ thousand
Beginning cash balance
Net cash flow from operating activities throughout this year
Net cash flow from investment and financing activities throughout this year
Cash surplus (Deficit)
corrective measures
Investment plan
Financing plan
1,421,885 1,041,995 (403,651) 2,060,229 - -
Analysis for change status: I. Operating activities: The net cash provided by operating activities is mainly
due to the cash income generated by operating revenue. II. Investing and financing activities: Mainly due to has continued to invest in
equipment such as mask required for the R & D of new products, purchase property, purchase of plant and equipment, financial assets, bond investments and cash dividends of distribution in the year.
(2) Analysis for Leverage of Cash Deficit and liquidity: Not applicable. (3) Analysis for cash flow in the coming year:
Unit: NT$ thousand
Beginning cashbalance
Net cash flowfrom operatingactivitiesthroughout the coming year
Net cash flow forecast for thecoming year
Cash surplus (Deficit) forecast
corrective measures
Investment plan
Financing plan
2,060,229 1,996,499 (1,593,977) 2,462,751 $ - $ -
Analysis of change status: I. Operating activities: The main reason is the 2019 Fiscal Year operating profit
is expected to continue to grow, actively controlling related losses and inventory turnover.
II. Investing and financing activities: Mainly due to has continued to invest in equipment such as mask required for the R & D of new products, purchase property, purchase of plant and equipment, financial assets, bond investments and cash dividends of distribution in the 2019 FiscalYear.
4. The Effect upon Financial and Business Operations of Any Major Capital Expenditures during the Most Recent Fiscal Year
(1) Major Capital Expenditures' Implementation Status and Sources of Funds
None.
(2)Expected Benefits
None.
105
5. The Company's Reinvestment Policy for the Most Recent Fiscal Year, the Main Reasons for the Profits/Losses Generated thereby, the Plan for Improving Re-investment Profitability, and Investment Plans for the Coming Year
The re-investment policy of the Group is focused on the primary business as the core, any investment will be carried out in conjunction with the business strategy, business expansion and long-term development, in order to increase revenue and profitability. An investment evaluation on the location, organization type, shareholding ratio and financial status of the investment business will be conducted for any investment, as the basis for the decision-making of the management. The Group also regularly assesses the status of profits/losses for the invested enterprises. In addition, the Company has enacted "Supervisory Measures for Subsidiaries" to supervise the operation status of the subsidiary company and set up an operating management mechanism in order to maximize the synergy of the Group.
The Company used the equity method to recognize that the investment interests total NT$ 282,885 thousand dollars on 2018 Fiscal Year, for the profits/losses recognition please refer to “The Unconsolidated Financial Statements of the Most Recent Period Audited and Attested by the CPA” of “VI. Financial Summary” of this annual report.
The investment plan for the coming year will be assessed separately depending on the overall industry and the Company's business needs.
6. Risk Issues and Its Assessment (1) Effect of Interest Rates, Exchange Rate Changes, and Inflation on the
Company's Profits / Losses and the Future Response Measures of the Company
A. Effect of Interest Rates, Exchange Rate Changes, and Inflation on the Company's Profits/Losses
Most of the Group's operational needs are supported by our own funds. Bank borrowing is usually not required. If there is bank borrowing, it is based on the premise of exchange rate hedging, and the amount is small. The increase in borrowing costs due to rising interest rates has little effect on the Group.
The Group's purchasing and sales are mainly in US dollars, so some exchange risks have been automatically avoided. The effect of fluctuations in the US dollar exchange rate on the Company's profits/losses mainly uses forward foreign exchange contracts and US

106
dollar borrowings to reduce the risk of exchange rate fluctuations.
There is no significant effect of inflation on annual profits/losses of the Group.
B. The Company’s Future Response Measures for Interest Rates, Exchange Rate Changes, and Inflation
In the future, the Group will continue to collect information on exchange rate fluctuations, and pay attention to the global exchange rate trends, adjust foreign currency positions in a timely manner to reduce the effect of exchange rate changes, as well as select the lower-cost foreign exchange as the hedging instruments in accordance with relevant regulations of the Company to avoid risks of exchange rate.
(2) High-Risk Investments, Highly Leveraged Investments, Loans to Other Parties, Endorsements, Guarantees, and Derivatives Transactions Which the Company Engaged In; the Main Reasons for the Profits/Losses Generated Thereby; and Future Response Measures of the Company
1.The Group does not engage in high-risk, highly leveraged investments.
2.The Group has set up "Policies and Procedures for Financial Derivatives Transactions", "Procedures for Lending Funds to Other Parties", "Procedures for Endorsement & Guarantee", and the related operations of the Group are handled in accordance with the above operating procedures.
3.The Company engages in derivatives transaction, which is aimed at hedging for the main purpose, or financial transactions related to the business operations of the company, to ensure the profit of the company's operations.
(3) Future Research and Development Projects, and Expenditures Expected in Connection therewith
For the R & D project for the coming year, please refer to the description of this annual report's "V. Operations Summary - New Products (Services) Planned for Development". The manpower and expenses of R & D that the Group continues to invest in this year are estimated to account for approximately 10%-15% of the Group's revenue. Before the R&D expenses are made, the Group will carefully assess the market risks and the investment’s expected benefits.
(4) Effect on the Company's Financial Operations of Important Policies Adopted and Changes in the Legal Environment at home and abroad, and Measures of the Company

107
Major policy and legal changes at home and abroad in recent years have no significant impact on the company's financial status and business. The Company will always obtain relevant information in the future and immediately study and formulate the necessary countermeasures to meet the operational needs of the Company.
(5) Effect on the Company's Financial Operations of Developments in Science and Technology as well as Industrial Change, and Measures of the Company
In recent years, with the continuous improvement of semiconductor manufacturing technology, the related applications of IC products are becoming more and more extensive. The Group takes the Display Driver IC as our core technology to gradually expand our application fields, including Computer Accessories, Multifunction Mobile Phones, Telephones and PDA with enough products to meet the needs of customers, and we also use our abilities in Systems Integration to expand our product line to Electronic Dictionaries, Language Learning Machines and other Consumer Electronics.
(6) Effect on the Company's Crisis Management of Changes in the Company's Corporate Image, and the Response Measures of the Company
The Company is a public company. The Company's reputation and operating performance is good. In the future, the Company will continue to focus on improving product quality and service to maintain a consistently good corporate image, so there is no impact on corporate crisis management.
(7) Expected Benefits and Possible Risks Associated with any Merger and Acquisitions, and the Response Measures of the Company
The Group has no plans for mergers and acquisitions.
(8) Expected Benefits and Possible Risks Associated with any Plant Expansion, and the Response Measures of the Company
The Group has no plans for Plant Expansion.
(9) Risks associated with any Consolidation of Sales or Purchasing Operations, and the Response Measures of the Company
Because the fabless professional IC design company needs to consider the wafer foundry's capacity, equipment, quality yield, process technology and confidentiality to select the appropriate wafer foundry, therefore, consolidation of purchasing is the characteristics of the industry of the domestic IC design industry. The company has dispersed the source of purchase to TSMC, UMC and Magna, as well as maintains a long-term

108
stable relationship with the packaging and testing plant to eliminate the risk of Consolidation of purchases.
As for the Company’s sales, the Group's product application is diversified and extensive, and the sales transaction counterparty is the Agent or Manufacturer. Different Agents are distinguished according to sales area and sales conditions. For products sold through Agents, the Group has Field Application Engineers(FAE) who directly contact and provide product technical services with End Customers. Therefore, in terms of End Customers, there is no risk for Consolidation of Sales.
(10) Effect upon and Risk to the Company in the Event a major Quantity of Shares Belonging to a Director, Supervisor, or Shareholder Holding more than 10 Percent Shares in the Company Has Been Transferred or has Otherwise Changed Hands, and the Response Measures of the Company
The Director or shareholder holding more than 10 percent shares in the Company has not transferred shares or has otherwise changed hands.
(11) Effect upon and Risk to the Company Associated with any Change in Governance Personnel or Top Management, and Response Measures of the Company
None.
(12) Litigious and Non-Litigious Matters
1.Major litigious, non-litigious or administrative disputes involving the company that was finalized or remained pending during the most recent fiscal year or during the current fiscal year up to the date of publication of the annual report, which might materially affect shareholders' equity or the price of the Company's securities, it shall disclose the facts in dispute, amount in dispute, commencement date, main parties involved, and current status of the case:
None.
2.Major litigious, non-litigious or administrative disputes that involve the Director, Supervisor, General Manager, a de facto responsible person or major shareholder holding more than 10 percent of the shares in the Company, or a subsidiary company, that was finalized or remained pending during the most recent fiscal year or during the current fiscal year up to the date of publication of the annual report, which might materially affect shareholders' equity or the price of the Company's securities, it shall disclose the facts in dispute, amount in dispute, commencement date, main parties involved, and current status of the case:

109
None.
(13) Explanation of Assessment and Analysis on the Information Security Risk
The Company has set up a capital security plan in accordance with the internal regulations of the “Measures of Information Security Management” and regularly reports the current status of the security management to the chief operating officer.
We also regularly entrust the external information security vendors to conduct information security inspections and audits to ensure the protection information.
The Company has been engaged in behavior auditing, event recording and security related tools in the long-term, and continues to integrate information security equipment, and let employees regularly exercise and train their professional functions in information security, to implement information security management.
Considering the scope of actual damages for information security insurance, based on the fact that the Company's operating characteristics are not easy to assess, the Company's management objectives are still to improve prevention and management measures as the main method.
(14) Other Important Risks, and Mitigation Measures being or to be taken
None.
7. Other Important Matters
None.

110
100% 91% 55% 100% 76% 54% 64% 75% 100% 100%
Sitronix
Technology
(Belize) Corp.
mCore
Technology
Corp.
Sync-Tech
System
Corp.
Sitronix
Investment
Corp.
Forcelead
Technology
Corp.
Sensortek
Technology
Corp.
Infinno
Technolog
y Corp.
HeFei
Sitronix
Co., Ltd
HeFei
ezGreen
Co., Ltd
Sitronix
Holding
International
Ltd
100%
Sitronix
Technology
(Mauritius) Corp.
100% 0.004% 0.005% 0.002%Sitronix
Technology(ShenZhen)
Co.,Ltd
Forcelead
Technology
Corp.
Sensortek
Technology
Corp.
Infinno
Technology
Corp.
Sitronix
Technology Corp.
VIII. Special Items 1. Related Information on Affiliates (1)Consolidated Business Report of Affiliates
1. Affiliates Summary
(1)Organizational Chart of the Affiliates (2018.12.31)
(2)Basic Information on Affiliates
Name of Affiliates Date of
Incorporation
Place of Registrati
on
Paid-up Capital
(thousand dollar)
Main Business Items
Sitronix Technology (Belize) Corp.
2003.06.27 Belize USD. 2,000 International Trade
Sitronix Technology (Mauritius) Corp.
2003.07.11 Mauritius USD. 2,000 International Trade
mCore Technology Corp.
2009.12.03 Taiwan, Hsinchu
NTD. 105,627
Provide the Integrated Solutions for System chip for electronic payment application and Digital signal processor hardware and software for digital music applications
Infinno Technology Corp.
2009.12.02 Taiwan, Hsinchu
NTD. 207,690
Professional Power Management Solution Integrated Circuit Design
Sensortek Technology Corp.
2009.12.01 Taiwan, Hsinchu
NTD. 241,146
R&D, Design and Sales of Sensor Integrated Circuit Products
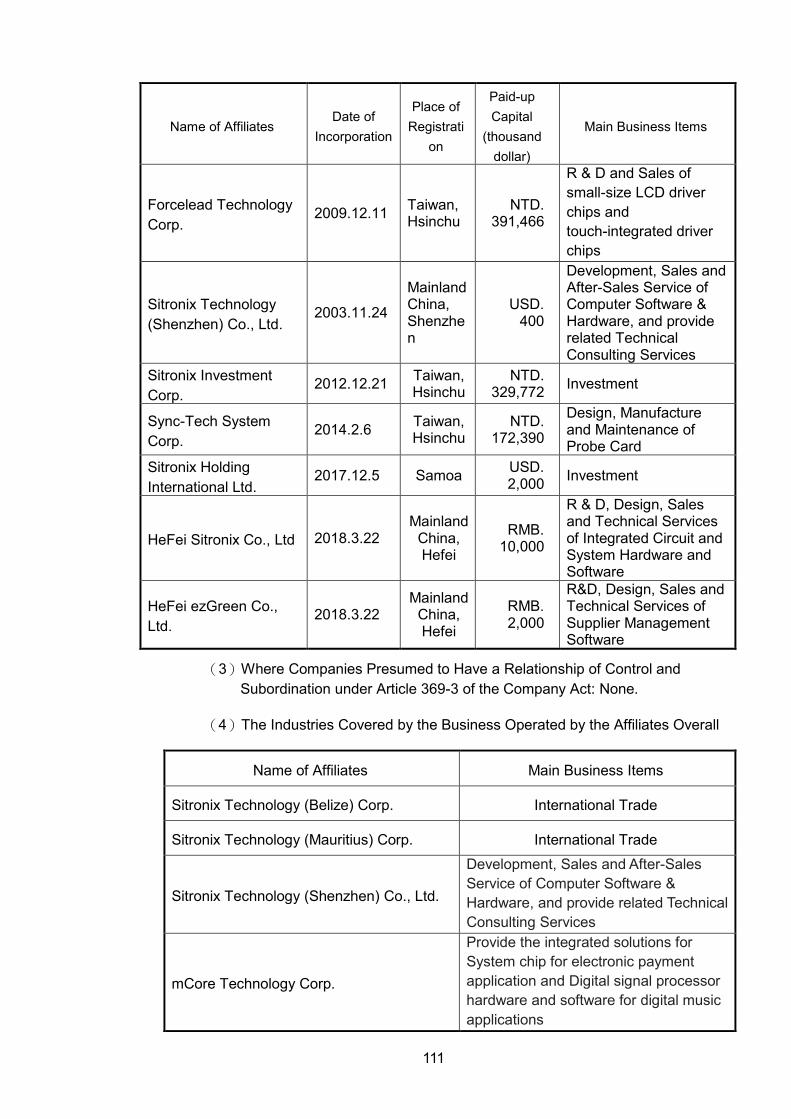
111
Name of Affiliates Date of
Incorporation
Place of Registrati
on
Paid-up Capital
(thousand dollar)
Main Business Items
Forcelead Technology Corp.
2009.12.11 Taiwan, Hsinchu
NTD. 391,466
R & D and Sales of small-size LCD driver chips and touch-integrated driver chips
Sitronix Technology (Shenzhen) Co., Ltd.
2003.11.24
Mainland China, Shenzhen
USD. 400
Development, Sales and After-Sales Service of Computer Software & Hardware, and provide related Technical Consulting Services
Sitronix Investment Corp.
2012.12.21 Taiwan, Hsinchu
NTD. 329,772 Investment
Sync-Tech System Corp.
2014.2.6 Taiwan, Hsinchu
NTD. 172,390
Design, Manufacture and Maintenance of Probe Card
Sitronix Holding International Ltd.
2017.12.5 Samoa USD. 2,000 Investment
HeFei Sitronix Co., Ltd 2018.3.22 Mainland
China, Hefei
RMB. 10,000
R & D, Design, Sales and Technical Services of Integrated Circuit and System Hardware and Software
HeFei ezGreen Co., Ltd.
2018.3.22 Mainland
China, Hefei
RMB. 2,000
R&D, Design, Sales and Technical Services of Supplier Management Software
(3)Where Companies Presumed to Have a Relationship of Control and Subordination under Article 369-3 of the Company Act: None.
(4)The Industries Covered by the Business Operated by the Affiliates Overall
Name of Affiliates Main Business Items
Sitronix Technology (Belize) Corp. International Trade
Sitronix Technology (Mauritius) Corp. International Trade
Sitronix Technology (Shenzhen) Co., Ltd.
Development, Sales and After-Sales Service of Computer Software & Hardware, and provide related Technical Consulting Services
mCore Technology Corp.
Provide the integrated solutions for System chip for electronic payment application and Digital signal processor hardware and software for digital music applications

112
Infinno Technology Corp. Professional Power Management Solution Integrated Circuit Design
Sensortek Technology Corp. R&D, Design and Sales of Sensor
Integrated Circuit Products
Forcelead Technology Corp. R&D and Sales of small-size LCD driver chips and touch-integrated driver chips
Sitronix Investment Corp. Investment
Sync-Tech System Corp. Design, Manufacture and Maintenance of Probe Card
Sitronix Holding International Ltd. Investment
HeFei Sitronix Co., Ltd R & D, Design, Sales and Technical Services of Integrated Circuit and System Hardware and Software
HeFei ezGreen Co., Ltd. R&D, Design, Sales and Technical Services of Supplier Management Software
(5)The Name of the Director, Supervisor or General Manager of Each Affiliates, and the Details of their Shareholding or Capital Contribution in Such Affiliate
December 31, 2018
Name of the Affiliates
Title Name or Representative
Shareholding Number of
Shares (thousand shares)
Shareholding
%
Sitronix Technology (Belize) Corp. Director Vincent Mao - -
Sitronix Technology (Mauritius) Corp. Director Vincent Mao - -
Sitronix Technology (Shenzhen) Co., Ltd.
Director
Sitronix Technology
(Mauritius) Corp. Representative:
Wei Wang
Capital Contribution
-
100% -
mCore Technology Corp.
Director
Sitronix Technology Corp. Representative:
Vincent Mao
9,583
- - -
-
91%
- - -
-
Director and General Manager
Representative: I Hsi Cheng
Director Representative:
Wei Wang Supervisor Shu Fang Xu

113
Name of the Affiliates
Title Name or Representative
Shareholding Number of
Shares (thousand shares)
Shareholding
%
Infinno Technology Corp.
Director
Sitronix Technology Corp. Representative:
Vincent Mao
13,290
- - - -
5,650
160
103
-
64%
- - - -
27%
1%
1%
-
Director and General Manager
Representative: Ru Hong Chen
Director Representative:
Vincent Lin
Supervisor Shu Fang Xu
Director
Compal Electronics, Inc. Representative: Jui-Tsung Chen
Director Representative: Pei-Yuan Chen
Supervisor Chiu-Rui Wei
Sensortek Technology Corp.
Director
Sitronix Technology Corp. Representative:
Vincent Mao
13,004 54%
361 2%
Director and General Manager
Representative: Sheng Su Lee
173 1%
Director Representative: Meng Huang Liu
65 -
Director Representative: Ru Hong Chen
-
-
Director Athos Ou 468 2% Supervisor Shu Hui Zheng 412 2%
Supervisor Wang Ping Wu - -
Forcelead Technology Corp.
Director
Sitronix Technology Corp. Representative:
Vincent Mao
29,685
831
843
115
35
76%
2%
2%
-
-
Director and General Manager
Representative: Jl -Jiang
Director Representative: Wei Wang
Supervisor Ru Hong Chen

114
Name of the Affiliates
Title Name or Representative
Shareholding Number of
Shares (thousand shares)
Shareholding
%
Sitronix Investment Corp.
Director
Sitronix Technology Corp. Representative:
Vincent Mao
32,977
- - - -
100%
- - - -
Director and General Manager
Representative: Min Hui Zhang
Director Representative: Shu Fang Xu
Supervisor Representative: Ru Hong Chen
Sync-Tech System Corp.
Director
Sitronix Technology Corp. Representative: Ru Hong Chen
9,500
620
100
268
-
-
55%
4%
1%
2% -
-
Director Representative:
Vincent Mao Director and
General Manager Representative:,
Zong Run Li
Director Representative: Meng Huang Liu
Supervisor Shu Fang Xu
Sitronix Holding International Ltd. Director Vincent Mao - -
HeFei Sitronix Co., Ltd.
Director
Sitronix Technology Corp. Representative: Ru Hong Chen
Capital Contribution
- - -
Capital Contribution
-
75% - - -
15% -
Director Representative:,Jian Yuan Zhao
Supervisor Representative:,De Yun Zhou
Director
Shenzhen Qianhai INFO Investment
Co., Ltd. Representative: Wang Chang Kai
HeFei ezGreen Co., Ltd.
Director
Sitronix Technology Corp. Representative:,Ying Lun Mao
Capital Contribution
100%

115
2. Operating Summary of Affiliates
December 31, 2018 Unit: Inaddition to Earnings per Share in NTD., Rest in NTD.Thousand dollar
Name of Affiliates(Note1) Paid-up Capital
Total Assets Total
Liabilities Net Worth
Operating revenue
Operating profit (Loss)
Net profit(Loss) after Tax
Earnings per Share (after Tax)
Sitronix Technology (Belize)
Corp. 61,430 114,068 - 114,068 - - 40,529 20.26
Sitronix Technology
(Mauritius) Corp. 61,430 114,066 - 114,066 855,785 34,130 40,529 20.26
Sitronix Technology
(Shenzhen) Co., Ltd. 12,286 36,252 10,382 25,870 89,876 2,827 1,457 -
Sitronix Holding International
Ltd. 61,430 62,026 - 62,026 - - 629 0.31
mCore Technology Corp. 105,627 143,447 31,071 112,376 181,414 11,158 12,422 1.18
Infinno Technology Corp. 207,690 140,446 61,411 79,235 165,185 (864) 12 0.00
Sensortek Technology Corp. 241,146 1,270,100 688,453 581,647 1,935,513 366,646 326,275 13.53
Forcelead Technology Corp. 391,466 752,187 235,007 517,180 775,418 54,298 63,976 1.63
Sitronix Investment Corp. 329,772 327,021 33,981 293,040 - (3,871) (4,979) (0.15)
Sync-Tech System Corp. 172,390 203,639 94,196 109,443 187,476 10,417 12,799 0.74
HeFei Sitronix Co., Ltd 44,720 62,164 12,503 49,661 4,876 (7,426) 4,953 -
HeFei ezGreen Co., Ltd. 8,944 8,761 73 8,688 - (306) (255) -
Note 1: If an affiliate is a foreign company, the related number of assets or liabilities and profit or loss are exchanged in New Taiwan dollars at the exchange rate on the reporting date.
(2)Consolidated Financial Statements of Affiliates
The companies required to be included in the consolidated financial statements of affiliates are all the same as companies required to be included in the consolidated financial statements of parent company as provided in Financial Accounting Criteria Gazette, and the relevant information that should be disclosed in the consolidated financial statements of affiliates has all been disclosed in the consolidated financial statements of parent and subsidiary companies, so no longer prepare another consolidated financial statements of affiliates.
(3)Report of Affiliates None.

116
2. Status of Carry Out a Private Placement of Securities during the Most Recent Fiscal Year or during the Current Fiscal Year up to the Date of Publication of the Annual Report
None.
3.Status of Holding or Disposal the Stocks of the Company during the Most Recent Fiscal Year or during the Current Fiscal Year up to the Date of Publication of the Annual Report
None.
4. Other Matters that Require Additional Description
None.
5. If Any of the Situations listed in Article 36, paragraph 3, subparagraph 2 of the Securities and Exchange Act, which might Materially Affect Shareholders' Equity or the Price of the Company's Securities, has occurred during the Most Recent Fiscal Year or during the Current Fiscal Year up to the Date of Publication of the Annual Report
None.

117
DECLARATION OF CONSOLIDATION OF FINANCIAL STATEMENTS OF AFFILIATES The entities that are required to be included in the consolidated financial statements of affiliates of
Sitronix Technology Corp. for the year ended December 31, 2018 under the “Criteria Governing
Preparation of Affiliation Reports, Consolidated Business Reports and Consolidated Financial
Statements of Affiliated Enterprises” are all the same as those included in the consolidated
financial statements of parent and subsidiary companies prepared in conformity with the
International Financial Reporting Standards 10 “Consolidated Financial Statements”. In addition,
the relevant information required to be disclosed in the consolidated financial statements of
affiliates has all been disclosed in the consolidated financial statements of parent and subsidiary
companies. Hence, we did not prepare a separate set of consolidated financial statements of
affiliates.
Very truly yours, Sitronix Technology Corp. By Vincent Mao Chairman March 15, 2019

118
INDEPENDENT AUDITORS’ REPORT The Board of Directors and the Shareholders Sitronix Technology Corp. Opinion We have audited the accompanying consolidated balance sheets of Sitronix Technology Corp. and its subsidiaries (the Group), which comprise the balance sheets as of December 31, 2018 and 2017, the related consolidated statements of comprehensive income, changes in equity and cash flows for the years then ended, and the notes to the consolidated financial statements, including a summary of significant accounting policies (collectively referred to as the “consolidated financial statements”). In our opinion, the accompanying consolidated financial statements present fairly, in all material respects, the consolidated financial position of the Group as of December 31, 2018 and 2017, and its consolidated financial performance and its consolidated cash flows for the years then ended in accordance with the Regulations Governing the Preparation of Financial Reports by Securities Issuers, and International Financial Reporting Standards (IFRS), International Accounting Standards (IAS), IFRIC Interpretations (IFRIC), and SIC Interpretations (SIC) endorsed and issued into effect by the Financial Supervisory Commission of the Republic of China. Basis for Opinion We conducted our audits in accordance with the Regulations Governing Auditing and Attestation of Financial Statements by Certified Public Accountants and auditing standards generally accepted in the Republic of China. Our responsibilities under those standards are further described in the Auditors’ Responsibilities for the Audit of the Consolidated Financial Statements section of our report. We are independent of the Group in accordance with the Norm of Professional Ethics for Certified Public Accountant of the Republic of China, and we have fulfilled our other ethical responsibilities in accordance with these requirements. We believe that the audit evidence we have obtained is sufficient and appropriate to provide a basis for our opinion. Key Audit Matters Key audit matters are those matters that, in our professional judgment, were of most significance in our audit of the consolidated financial statements for the year ended December 31, 2018. These matters were addressed in the context of our audit of the consolidated financial statements as a whole, and in forming our opinion thereon, and we do not provide a separate opinion on these matters. The Key audit matters for the Group’s consolidated financial statements for the year ended December 31, 2018 are stated as follows: Recognition of sales revenue The Group’s main source of revenue comes from the sale of memory chips. For the year ended December 31, 2018, the revenue recognized was NT$10,330,505 thousand, please refer to Notes 4, 27 and 40 for information of accounting policy of revenue recognition. Due to the market rebound of memory chips, the Group released certain sales orders by temporarily increasing the credit line. As such, this gives the rise to the potential risk of

119
overstating sales. We therefore considered the validity of occurrence of sales as a key audit matter for the year ended December 31, 2018. We have assessed that the customers of the Group whose annual revenue growth rates for 2018 have changed significantly to be subject to the risk of validity of revenue recognition. Therefore, our audit procedures performed with respect to these customers to confirm the validity of revenue recognition of the Group include, but are not limited to, the following: 1. We understood and tested the effectiveness of the design and implementation of the key internal controls
over revenue recognition; 2. We sampled and inspected the validity of the background information of customers that had significant
changes in the annual sales revenue growth rate and understood the reasonableness of such customers’ credit terms;
3. We performed on-site interviews by sampling and understood the business process and relevance of sales
revenue. 4. We sampled and inspected whether an original purchase order existed for each sale and was approved
appropriately. 5. We inspected product names and quantities on notifications of manufacturing, invoices and goods receipt
and inspected the amounts to ensure they were consistent; 6. We inspected the reasonableness of collection of accounts receivable and whether the collection amounts
and counterparties were consistent with the revenue recognized. Other Matter We have also audited the parent company only financial statements of Sitronix Technology Corp. as of and for the years ended December 31, 2018 and 2017 on which we have issued an unmodified opinion. Responsibilities of Management and Those Charged with Governance for the Consolidated Financial Statements Management is responsible for the preparation and fair presentation of the consolidated financial statements in accordance with the Regulations Governing the Preparation of Financial Reports by Securities Issuers, and International Financial Reporting Standards (IFRS), International Accounting Standards (IAS), IFRIC Interpretations (IFRIC), and SIC Interpretations (SIC) endorsed and issued into effect by the Financial Supervisory Commission of the Republic of China and for such internal control as management determines is necessary to enable the preparation of consolidated financial statements that are free from material misstatement, whether due to fraud or error. In preparing the consolidated financial statements, management is responsible for assessing the Group’s ability to continue as a going concern, disclosing, as applicable, matters related to going concern and using the going concern basis of accounting unless management either intends to liquidate the Group or to cease operations, or has no realistic alternative but to do so. Those charged with governance, including the audit committee, are responsible for overseeing the Group’s financial reporting process.

120
Auditors’ Responsibilities for the Audit of the Consolidated Financial Statements Our objectives are to obtain reasonable assurance about whether the consolidated financial statements as a whole are free from material misstatement, whether due to fraud or error, and to issue an auditors’ report that includes our opinion. Reasonable assurance is a high level of assurance, but is not a guarantee that an audit conducted in accordance with the auditing standards generally accepted in the Republic of China will always detect a material misstatement when it exists. Misstatements can arise from fraud or error and are considered material if, individually or in the aggregate, they could reasonably be expected to influence the economic decisions of users taken on the basis of these consolidated financial statements. As part of an audit in accordance with the auditing standards generally accepted in the Republic of China, we exercise professional judgment and maintain professional skepticism throughout the audit. We also: 1. Identify and assess the risks of material misstatement of the consolidated financial statements, whether due
to fraud or error, design and perform audit procedures responsive to those risks, and obtain audit evidence that is sufficient and appropriate to provide a basis for our opinion. The risk of not detecting a material misstatement resulting from fraud is higher than for one resulting from error, as fraud may involve collusion, forgery, intentional omissions, misrepresentations, or the override of internal control.
2. Obtain an understanding of internal control relevant to the audit in order to design audit procedures that are
appropriate in the circumstances, but not for the purpose of expressing an opinion on the effectiveness of the Group’s internal control.
3. Evaluate the appropriateness of accounting policies used and the reasonableness of accounting estimates and
related disclosures made by management.
4. Conclude on the appropriateness of management’s use of the going concern basis of accounting and, based on the audit evidence obtained, whether a material uncertainty exists related to events or conditions that may cast significant doubt on the Group’s ability to continue as a going concern. If we conclude that a material uncertainty exists, we are required to draw attention in our auditors’ report to the related disclosures in the consolidated financial statements or, if such disclosures are inadequate, to modify our opinion. Our conclusions are based on the audit evidence obtained up to the date of our auditors’ report. However, future events or conditions may cause the Group to cease to continue as a going concern.
5. Evaluate the overall presentation, structure and content of the consolidated financial statements, including
the disclosures, and whether the consolidated financial statements represent the underlying transactions and events in a manner that achieves fair presentation.
6. Obtain sufficient and appropriate audit evidence regarding the financial information of entities or business
activities within the Group to express an opinion on the consolidated financial statements. We are responsible for the direction, supervision, and performance of the group audit. We remain solely responsible for our audit opinion.
We communicate with those charged with governance regarding, among other matters, the planned scope and timing of the audit and significant audit findings, including any significant deficiencies in internal control that we identify during our audit. We also provide those charged with governance with a statement that we have complied with relevant ethical requirements regarding independence, and to communicate with them all relationships and other matters that may reasonably be thought to bear on our independence, and where applicable, related safeguards.

121
From the matters communicated with those charged with governance, we determine those matters that were of most significance in the audit of the consolidated financial statements for the year ended December 31, 2018 and are therefore the key audit matters. We describe these matters in our auditors’ report unless law or regulation precludes public disclosure about the matter or when, in extremely rare circumstances, we determine that a matter should not be communicated in our report because the adverse consequences of doing so would reasonably be expected to outweigh the public interest benefits of such communication. The engagement partners on the audit resulting in this independent auditors’ report are Cheng Chih Lin and Yu Feng Huang. Deloitte & Touche Taipei, Taiwan Republic of China March 15, 2019
Notice to Readers The accompanying consolidated financial statements are intended only to present the consolidated financial position, financial performance and cash flows in accordance with accounting principles and practices generally accepted in the Republic of China and not those of any other jurisdictions. The standards, procedures and practices to audit such consolidated financial statements are those generally applied in the Republic of China. For the convenience of readers, the independent auditors’ report and the accompanying consolidated financial statements have been translated into English from the original Chinese version prepared and used in the Republic of China. If there is any conflict between the English version and the original Chinese version or any difference in the interpretation of the two versions, the Chinese-language independent auditors’ report and consolidated financial statements shall prevail.

122
SITRONIX TECHNOLOGY CORP. AND SUBSIDIARIES CONSOLIDATED BALANCE SHEETS DECEMBER 31, 2018 AND 2017 (In Thousands of New Taiwan Dollars) 2018 2017 2018 2017 ASSETS Amount % Amount % LIABILITIES AND EQUITY Amount % Amount % CURRENT ASSETS CURRENT LIABILITIES
Cash and cash equivalents (Notes 4, 6 and 35) $ 2,060,229 25 $ 1,421,885 20 Short-term borrowings (Notes 4, 21 and 35) $ 476,168 6 $ 20,220 - Financial assets at fair value through profit or loss (Notes Financial liabilities at fair value through profit or loss - 4, 7 and 35) 133,677 2 279,824 4 current (Notes 4, 7 and 35) 1,262 - 480 - Financial assets at fair value through other comprehensive Trade payables (Notes 22 and 35) 1,560,675 19 1,141,166 16 income (Notes 4, 8 and 35) 216,918 3 - - Payables to related parties (Notes 35 and 36) - - 3,806 - Available-for-sale financial assets (Notes 4, 10 and 35) - - 282,619 4 Other payables (Notes 23 and 35) 521,254 6 472,412 7 Financial assets at amortized cost (Notes 4, 9 ,35 and 37) 382,291 4 - - Accrued employees' compensation and remuneration of directors Notes receivable and trade receivables, net (Notes 4, 14 and (Note 28) 195,831 2 126,244 2 35) 1,359,075 16 1,009,582 14 Current tax liabilities (Notes 4 and 29) 142,911 2 117,025 2 Debt investments with no active market - current (Notes 4, Provisions - current (Notes 4 and 24) - - 5,089 - 13, 35 and 37) - - 183,502 3 Other current liabilities (Notes 23 and 35) 42,750 - 17,495 - Notes receivable and trade receivable from related parties (Notes 4, 35 and 36) 39 - - - Total current liabilities 2,940,851 35 1,903,937 27 Other receivables (Notes 14 and 35) 53,332 1 65,277 1 Inventories (Notes 4, 5 and 15) 2,071,021 25 1,735,070 25 NON-CURRENT LIABILITIES Prepayments 126,479 1 74,361 1 Deferred tax liabilities (Notes 4 and 29) 610 - 576 - Other current assets (Notes 20 and 35) 12,538 - 5,845 - Net defined benefit liabilities (Notes 4 and 25) 51,318 1 57,555 1
Guarantee deposits received (Notes 33 and 36) 168,060 2 70,683 1 Total current assets 6,415,599 77 5,057,965 72
Total non-current liabilities 219,988 3 128,814 2 NON-CURRENT ASSETS
Financial assets at fair value through profit or loss - Total liabilities 3,160,839 38 2,032,751 29 non-current (Notes 4, 7 and 35) 87,124 1 31,493 1 Financial assets at fair value through other comprehensive EQUITY ATTRIBUTABLE TO SHAREHOLDERS OF THE PARENT income - non-current (Notes 4, 8 and 35) 633,921 8 - - (Notes 4, 26, 31 and 32) Available-for-sale financial assets - non-current (Notes 4, Share capital 10 and 35) - - 703,211 10 Ordinary shares 1,202,226 14 1,205,176 17 Held-to-maturity financial assets - non-current (Notes 4, 11 Capital surplus 761,304 9 785,875 11 and 35) - - 30,499 - Retained earnings Financial assets at amortized cost - non-current (Notes 4, 9 Legal reserve 875,493 11 788,177 12 and 35) 31,386 - - - Special reserve 26,644 - 8,728 - Financial assets measured at cost - non-current (Notes 4, 12 Unappropriated earnings 2,124,198 25 1,969,197 28 and 35) - - 25,833 - Total retained earnings 3,026,335 36 2,766,102 40 Property, plant and equipment (Notes 4 and 17) 810,304 10 782,145 11 Other equity Investment properties (Notes 4 and 18) 330,559 4 335,277 5 Exchange differences on translating the financial Intangible assets (Notes 4 and 19) 47,875 - 55,789 1 statements of foreign operations (846) - (943) - Other non-current assets (Notes 20, 33 and 35) 9,743 - 8,783 - Unrealized gain (loss) on financial assets at fair value
through other comprehensive income (251,101) (3) - - Total non-current assets 1,950,912 23 1,973,030 28 Unrealized gain (loss) on available-for-sale financial
assets - - (25,701) - Unearned compensation of employees (25,652) - (50,850) (1) Total other equity (277,599) (3) (77,494) (1) Equity attributable to shareholders of the parent 4,712,266 56 4,679,659 67 NON-CONTROLLING INTERESTS (Notes 16, 26 and 32) 493,406 6 318,585 4 Total equity 5,205,672 62 4,998,244 71 TOTAL $ 8,366,511 100 $ 7,030,995 100 TOTAL $ 8,366,511 100 $ 7,030,995 100 The accompanying notes are an integral part of the consolidated financial statements.
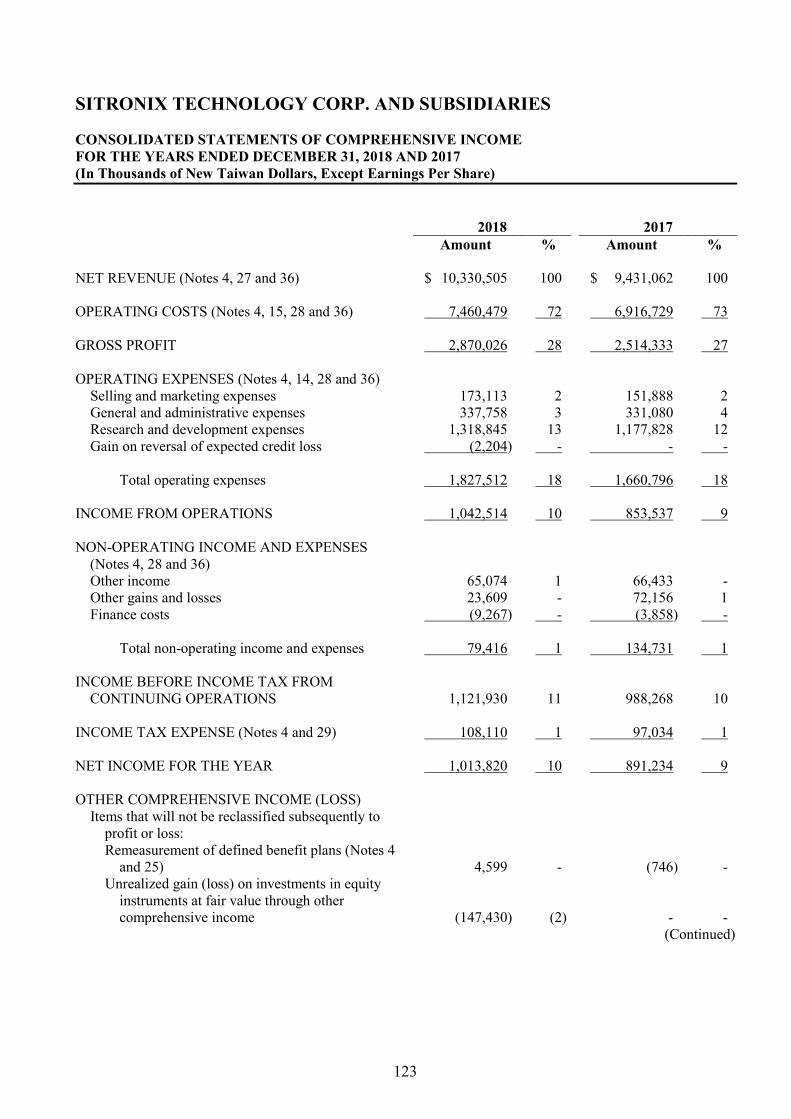
123
SITRONIX TECHNOLOGY CORP. AND SUBSIDIARIES CONSOLIDATED STATEMENTS OF COMPREHENSIVE INCOME FOR THE YEARS ENDED DECEMBER 31, 2018 AND 2017 (In Thousands of New Taiwan Dollars, Except Earnings Per Share) 2018 2017 Amount % Amount % NET REVENUE (Notes 4, 27 and 36) $ 10,330,505 100 $ 9,431,062 100 OPERATING COSTS (Notes 4, 15, 28 and 36) 7,460,479 72 6,916,729 73 GROSS PROFIT 2,870,026 28 2,514,333 27 OPERATING EXPENSES (Notes 4, 14, 28 and 36)
Selling and marketing expenses 173,113 2 151,888 2 General and administrative expenses 337,758 3 331,080 4 Research and development expenses 1,318,845 13 1,177,828 12 Gain on reversal of expected credit loss (2,204) - - -
Total operating expenses 1,827,512 18 1,660,796 18
INCOME FROM OPERATIONS 1,042,514 10 853,537 9 NON-OPERATING INCOME AND EXPENSES
(Notes 4, 28 and 36) Other income 65,074 1 66,433 - Other gains and losses 23,609 - 72,156 1 Finance costs (9,267) - (3,858) -
Total non-operating income and expenses 79,416 1 134,731 1
INCOME BEFORE INCOME TAX FROM
CONTINUING OPERATIONS 1,121,930 11 988,268 10 INCOME TAX EXPENSE (Notes 4 and 29) 108,110 1 97,034 1 NET INCOME FOR THE YEAR 1,013,820 10 891,234 9 OTHER COMPREHENSIVE INCOME (LOSS)
Items that will not be reclassified subsequently to profit or loss: Remeasurement of defined benefit plans (Notes 4
and 25) 4,599 - (746) - Unrealized gain (loss) on investments in equity
instruments at fair value through other comprehensive income (147,430) (2) - -
(Continued)

124
SITRONIX TECHNOLOGY CORP. AND SUBSIDIARIES CONSOLIDATED STATEMENTS OF COMPREHENSIVE INCOME FOR THE YEARS ENDED DECEMBER 31, 2018 AND 2017 (In Thousands of New Taiwan Dollars, Except Earnings Per Share) 2018 2017 Amount % Amount %
Items that may be reclassified subsequently to profit or loss: Exchange differences on translating foreign
operations $ (441) - $ (41) - Unrealized loss on available-for-sale financial
assets - - (17,875) - Unrealized gain (loss) on investments in debt
instruments at fair value through other comprehensive income 218 - - -
Other comprehensive income (loss) for the year,
net of income tax (143,054) (2) (18,662) - TOTAL COMPREHENSIVE INCOME FOR THE
YEAR $ 870,766 8 $ 872,572 9 NET INCOME ATTRIBUTABLE TO:
Owners of the Company $ 840,363 8 $ 873,158 9 Non-controlling interests 173,457 2 18,076 -
$ 1,013,820 10 $ 891,234 9
TOTAL COMPREHENSIVE INCOME
ATTRIBUTABLE TO: Owners of the Company $ 697,847 7 $ 854,496 9 Non-controlling interests 172,919 1 18,076 -
$ 870,766 8 $ 872,572 9
EARNINGS PER SHARE (Note 30)
Basic $ 7.03 $ 7.32 Diluted $ 6.94 $ 7.22
The accompanying notes are an integral part of the consolidated financial statements. (Concluded)

125
SITRONIX TECHNOLOGY CORP. AND SUBSIDIARIES CONSOLIDATED STATEMENTS OF CHANGES IN EQUITY FOR THE YEARS ENDED DECEMBER 31, 2018 AND 2017 (In Thousands of New Taiwan Dollars) Equity Attributable to Shareholders of the Parent Other Equity (Notes 4, 26 and 31)
Share Capital (Note 26) Retained Earnings
Exchange Differences on
Translating Unrealized Gain
(Loss) from
Unrealized Gain (Loss) on Financial
Assets at Fair Value Through
Other Unearned Non-controlling
Interests
Shares
(In Thousands) Amount Capital Surplus
(Notes 26 and 32) Legal Reserve Special reserve Unappropriated
Earnings (Note 26) Foreign
Operations Available-for-sale Financial Assets
Comprehensive Income
Compensation of Employees Total
(Notes 16, 26 and 32) Total Equity
BALANCE AT JANUARY 1, 2017 120,638 $ 1,206,376 $ 811,101 $ 683,993 $ 21,364 $ 2,093,666 $ (902 ) $ (7,826 ) $ - $ (120,394 ) $ 4,687,378 $ 329,150 $ 5,016,528 Appropriation of 2016 earnings
Legal reserve - - - 104,184 - (104,184 ) - - - - - - - Special reserve - - - - (12,636 ) 12,636 - - - - - - - Cash dividends distributed by the Company - - - - - (723,826 ) - - - - (723,826 ) - (723,826 )
Other changes in capital surplus
Changes in percentage of ownership interests in subsidiaries - - (14,006 ) - - (181,507 ) - - - - (195,513 ) 195,513 - Compensation costs of restricted shares for employees - - - - - - - - - 57,124 57,124 - 57,124 Retirement of restricted shares for employees (120 ) (1,200 ) (11,220 ) - - - - - - 12,420 - - - Net income for the year ended December 31, 2017 - - - - - 873,158 - - - - 873,158 18,076 891,234 Other comprehensive loss for year ended December 31, 2017, net of
income tax - - - - - (746 ) (41 ) (17,875 ) - - (18,662 ) - (18,662 ) Total comprehensive income for the year ended December 31, 2017 - - - - - 872,412 (41 ) (17,875 ) - - 854,496 18,076 872,572 Decrease in non- controlling interests - - - - - - - - - - - (174,547 ) (174,547 ) Dividends paid to non-controlling interests - - - - - - - - - - - (49,607 ) (49,607 ) BALANCE AT JANUARY 1, 2017 AS RESTATED 120,518 1,205,176 785,875 788,177 8,728 1,969,197 (943 ) (25,701 ) - (50,850 ) 4,679,659 318,585 4,998,244 EFFECT OF RETROSPECTIVE APPLICATION AND
RETROSPECTIVE RESTATEMENT - - - - - 81,235 - 25,701 (106,936 ) - - - - BALANCE AT DECEMBER 31, 2017 120,518 1,205,176 785,875 788,177 8,728 2,050,432 (943 ) - (106,936 ) (50,850 ) 4,679,659 318,585 4,998,244 Appropriation of 2017 earnings
Legal reserve - - - 87,316 - (87,316 ) - - - - - - - Special reserve. - - - - 17,916 (17,916 ) - - - - - - - Cash dividends distributed by the Company - - - - - (662,847 ) - - - - (662,847 ) - (662,847 )
Other changes in capital surplus
Changes in percentage of ownership interests in subsidiaries - - 3,014 - - (70 ) - - - - 2,944 (2,944 ) - Compensation cost of restricted shares for employees - - - - - - - - - (5,337 ) (5,337 ) - (5,337 ) Restricting employee rights, new shares are not vested (295 ) (2,950 ) (27,585 ) - - - - - - 30,535 - - - Disposal of equity instruments at fair value through other comprehensive
income - - - - - (3,047 ) - - 3,047 - - - - Net income for the year ended December 31, 2018 - - - - - 840,363 - - - - 840,363 173,457 1,013,820 Other comprehensive income (loss) for year ended December 31, 2018,
net of income tax - - - - - 4,599 97 - (147,212 ) - (142,516 ) (538 ) (143,054 ) Total comprehensive income (loss) for the year ended December 31,
2018 - - - - - 844,962 97 - (147,212 ) - 697,847 172,919 870,766 Increase in non- controlling interests - - - - - - - - - - - 23,689 23,689 Cash dividends distributed by subsidiaries - - - - - - - - - - - (18,843 ) (18,843 ) BALANCE AT DECEMBER 31, 2018 120,223 $ 1,202,226 $ 761,304 $ 875,493 $ 26,644 $ 2,124,198 $ (846 ) $ - $ (251,101 ) $ (25,652 ) $ 4,712,266 $ 493,406 $ 5,205,672 The accompanying notes are an integral part of the consolidated financial statements.
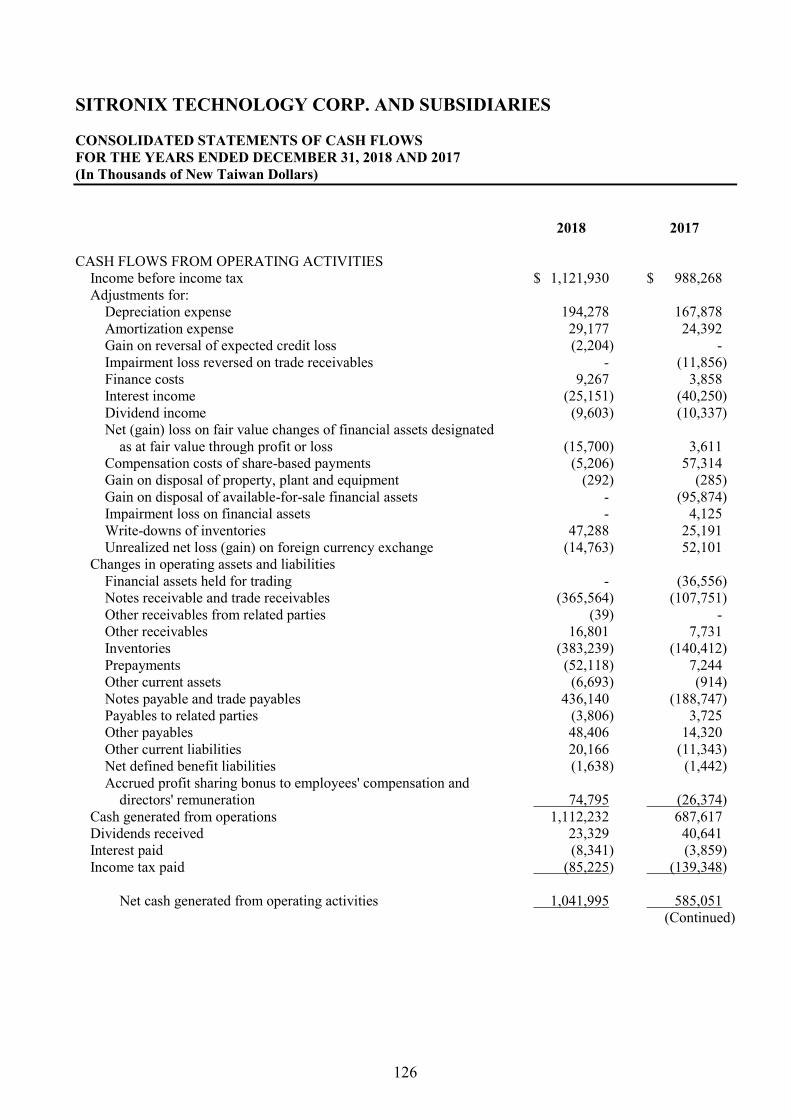
126
SITRONIX TECHNOLOGY CORP. AND SUBSIDIARIES CONSOLIDATED STATEMENTS OF CASH FLOWS FOR THE YEARS ENDED DECEMBER 31, 2018 AND 2017 (In Thousands of New Taiwan Dollars) 2018 2017 CASH FLOWS FROM OPERATING ACTIVITIES
Income before income tax $ 1,121,930 $ 988,268 Adjustments for:
Depreciation expense 194,278 167,878 Amortization expense 29,177 24,392 Gain on reversal of expected credit loss (2,204) - Impairment loss reversed on trade receivables - (11,856) Finance costs 9,267 3,858 Interest income (25,151) (40,250) Dividend income (9,603) (10,337) Net (gain) loss on fair value changes of financial assets designated
as at fair value through profit or loss (15,700) 3,611 Compensation costs of share-based payments (5,206) 57,314 Gain on disposal of property, plant and equipment (292) (285) Gain on disposal of available-for-sale financial assets - (95,874) Impairment loss on financial assets - 4,125 Write-downs of inventories 47,288 25,191 Unrealized net loss (gain) on foreign currency exchange (14,763) 52,101
Changes in operating assets and liabilities Financial assets held for trading - (36,556) Notes receivable and trade receivables (365,564) (107,751) Other receivables from related parties (39) - Other receivables 16,801 7,731 Inventories (383,239) (140,412) Prepayments (52,118) 7,244 Other current assets (6,693) (914) Notes payable and trade payables 436,140 (188,747) Payables to related parties (3,806) 3,725 Other payables 48,406 14,320 Other current liabilities 20,166 (11,343) Net defined benefit liabilities (1,638) (1,442) Accrued profit sharing bonus to employees' compensation and
directors' remuneration 74,795 (26,374) Cash generated from operations 1,112,232 687,617 Dividends received 23,329 40,641 Interest paid (8,341) (3,859) Income tax paid (85,225) (139,348)
Net cash generated from operating activities 1,041,995 585,051
(Continued)
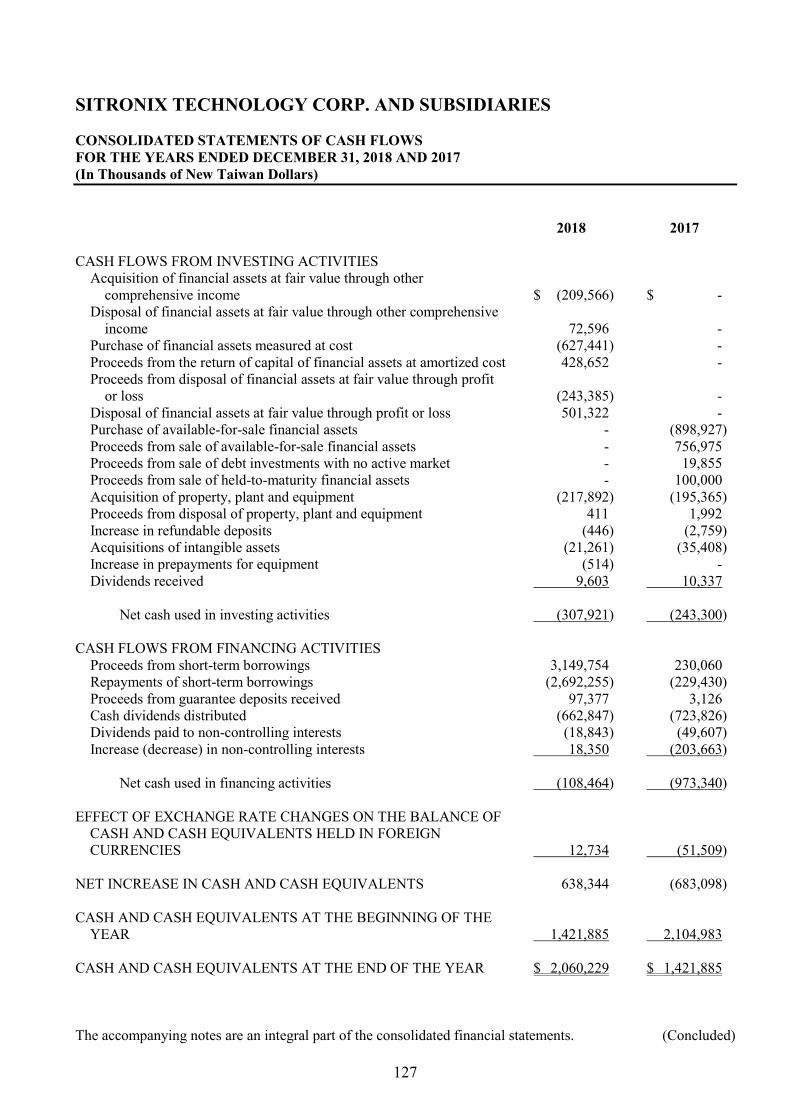
127
SITRONIX TECHNOLOGY CORP. AND SUBSIDIARIES CONSOLIDATED STATEMENTS OF CASH FLOWS FOR THE YEARS ENDED DECEMBER 31, 2018 AND 2017 (In Thousands of New Taiwan Dollars) 2018 2017 CASH FLOWS FROM INVESTING ACTIVITIES
Acquisition of financial assets at fair value through other comprehensive income $ (209,566) $ -
Disposal of financial assets at fair value through other comprehensive income 72,596 -
Purchase of financial assets measured at cost (627,441) - Proceeds from the return of capital of financial assets at amortized cost 428,652 - Proceeds from disposal of financial assets at fair value through profit
or loss (243,385) - Disposal of financial assets at fair value through profit or loss 501,322 - Purchase of available-for-sale financial assets - (898,927) Proceeds from sale of available-for-sale financial assets - 756,975 Proceeds from sale of debt investments with no active market - 19,855 Proceeds from sale of held-to-maturity financial assets - 100,000 Acquisition of property, plant and equipment (217,892) (195,365) Proceeds from disposal of property, plant and equipment 411 1,992 Increase in refundable deposits (446) (2,759) Acquisitions of intangible assets (21,261) (35,408) Increase in prepayments for equipment (514) - Dividends received 9,603 10,337
Net cash used in investing activities (307,921) (243,300)
CASH FLOWS FROM FINANCING ACTIVITIES
Proceeds from short-term borrowings 3,149,754 230,060 Repayments of short-term borrowings (2,692,255) (229,430) Proceeds from guarantee deposits received 97,377 3,126 Cash dividends distributed (662,847) (723,826) Dividends paid to non-controlling interests (18,843) (49,607) Increase (decrease) in non-controlling interests 18,350 (203,663)
Net cash used in financing activities (108,464) (973,340)
EFFECT OF EXCHANGE RATE CHANGES ON THE BALANCE OF
CASH AND CASH EQUIVALENTS HELD IN FOREIGN CURRENCIES 12,734 (51,509)
NET INCREASE IN CASH AND CASH EQUIVALENTS 638,344 (683,098) CASH AND CASH EQUIVALENTS AT THE BEGINNING OF THE
YEAR 1,421,885 2,104,983 CASH AND CASH EQUIVALENTS AT THE END OF THE YEAR $ 2,060,229 $ 1,421,885 The accompanying notes are an integral part of the consolidated financial statements. (Concluded)
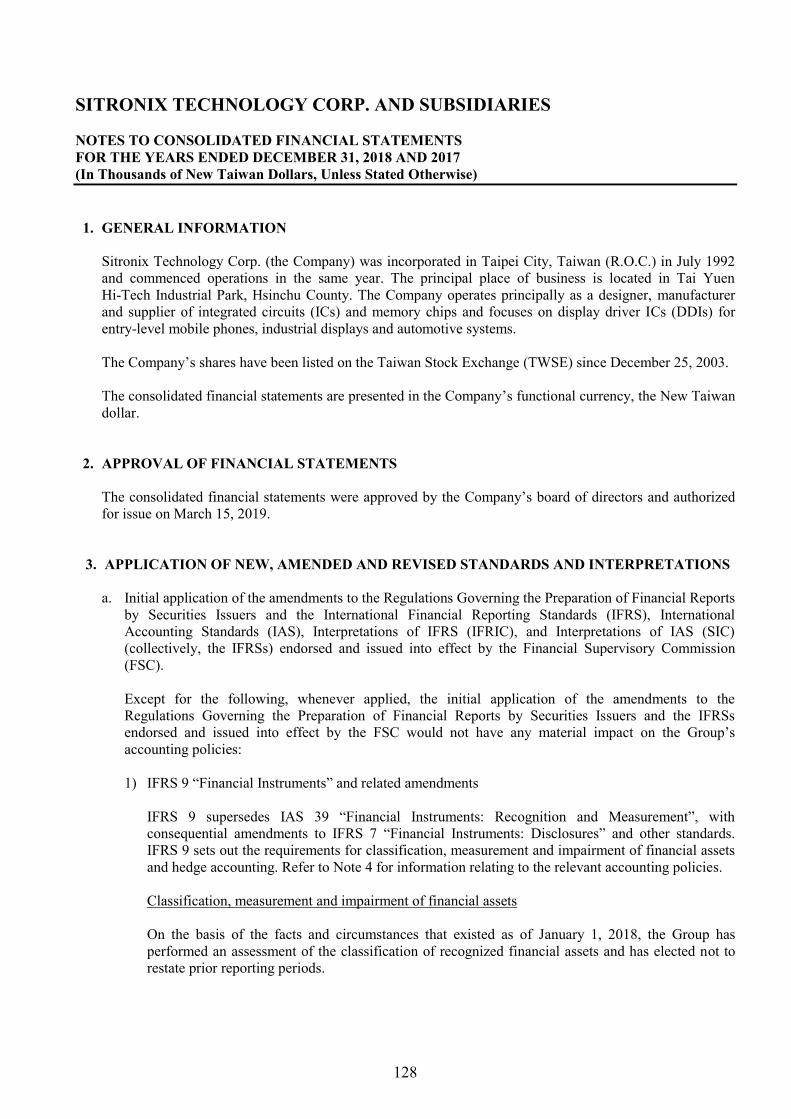
128
SITRONIX TECHNOLOGY CORP. AND SUBSIDIARIES NOTES TO CONSOLIDATED FINANCIAL STATEMENTS FOR THE YEARS ENDED DECEMBER 31, 2018 AND 2017 (In Thousands of New Taiwan Dollars, Unless Stated Otherwise) 1. GENERAL INFORMATION
Sitronix Technology Corp. (the Company) was incorporated in Taipei City, Taiwan (R.O.C.) in July 1992 and commenced operations in the same year. The principal place of business is located in Tai Yuen Hi-Tech Industrial Park, Hsinchu County. The Company operates principally as a designer, manufacturer and supplier of integrated circuits (ICs) and memory chips and focuses on display driver ICs (DDIs) for entry-level mobile phones, industrial displays and automotive systems. The Company’s shares have been listed on the Taiwan Stock Exchange (TWSE) since December 25, 2003. The consolidated financial statements are presented in the Company’s functional currency, the New Taiwan dollar.
2. APPROVAL OF FINANCIAL STATEMENTS
The consolidated financial statements were approved by the Company’s board of directors and authorized for issue on March 15, 2019.
3. APPLICATION OF NEW, AMENDED AND REVISED STANDARDS AND INTERPRETATIONS
a. Initial application of the amendments to the Regulations Governing the Preparation of Financial Reports by Securities Issuers and the International Financial Reporting Standards (IFRS), International Accounting Standards (IAS), Interpretations of IFRS (IFRIC), and Interpretations of IAS (SIC) (collectively, the IFRSs) endorsed and issued into effect by the Financial Supervisory Commission (FSC). Except for the following, whenever applied, the initial application of the amendments to the Regulations Governing the Preparation of Financial Reports by Securities Issuers and the IFRSs endorsed and issued into effect by the FSC would not have any material impact on the Group’s accounting policies: 1) IFRS 9 “Financial Instruments” and related amendments
IFRS 9 supersedes IAS 39 “Financial Instruments: Recognition and Measurement”, with consequential amendments to IFRS 7 “Financial Instruments: Disclosures” and other standards. IFRS 9 sets out the requirements for classification, measurement and impairment of financial assets and hedge accounting. Refer to Note 4 for information relating to the relevant accounting policies. Classification, measurement and impairment of financial assets On the basis of the facts and circumstances that existed as of January 1, 2018, the Group has performed an assessment of the classification of recognized financial assets and has elected not to restate prior reporting periods.

129
The following table shows the original measurement categories and carrying amounts under IAS 39 and the new measurement categories and carrying amounts under IFRS 9 for each class of the Group’s financial assets and financial liabilities as of January 1, 2018.
Measurement Category Carrying Amount Financial Assets IAS 39 IFRS 9 IAS 39 IFRS 9 Remark
Cash and cash equivalents Loans and receivables Amortized cost $ 1,421,885 $ 1,421,885 - Mutual funds Available‑for‑sale Mandatorily at FVTPL 68,340 68,340 (1) Available‑for‑sale Fair value through other
comprehensive income (i.e. FVTOCI)
688,649 688,649 (1)
Equity securities Available‑for‑sale Mandatorily at FVTPL 11,475 11,475 (2) Available‑for‑sale Fair value through other
comprehensive income (i.e. FVTOCI)
157,513 157,513 (2)
Debt securities Available‑for‑sale Mandatorily at FVTPL 71,124 71,124 (3) Available‑for‑sale Fair value through other
comprehensive income (i.e. FVTOCI)
14,562 14,562 (3)
Held-to-maturity Amortized cost 30,499 30,499 (3) Time deposits with
original maturities of more than 3 months
Loans and receivables Amortized cost 183,502 183,502 -
Notes receivable, trade receivables and other receivables
Loans and receivables Amortized cost 1,080,704 1,080,704 (4)
Financial Assets
IAS 39 Carrying Amount
as of January 1, 2018
Reclassifi- cations
IFRS 9 Carrying
Amount as of January 1,
2018
Retained Earnings Effect on
January 1, 2018
Other Equity
Effect on January 1,
2018 Remark FVTPL $ 311,317 $ - $ 311,317 - Add: Reclassification from
available-for-sale (IAS 39) - 150,939 150,939
(1), (2) and (3)
311,317 150,939 462,256 $ 2,631 $ (2,631 ) (1), (2) and (3) Fair value through other comprehensive
income (i.e. FVTOCI) - -
-
Debt instruments Add: Reclassification from
available-for-sale (IAS 39) - 14,562 14,562
(3)
Equity instrument - - - - Add: Reclassification from
available-for-sale (IAS 39) - 846,162 846,162
(1) and (2)
- 860,724 - 860,724 - 78,604 - (78,604 ) - (2) Amortized cost - - - Add: Reclassification from
held-to-maturity AS 39) - 30,499 30,499
(3)
Add: Reclassification from loans and receivable (IAS 39)
- 2,686,091 2,686,091
(4)
- 2,716,590 2,716,290 - - - $ 311,317 $ 3,728,253 $ 4,039,570 $ 81,235 $ (81,235 )
a) Mutual funds of $68,340 thousand previously classified as available-for-sale under IAS 39,
were mandatorily classified as at FVTPL under IFRS 9, because the contractual cash flows are not solely payments of principal and interest on the principal outstanding and they are not equity instruments. The retrospective adjustment resulted in an increase of $105 thousand in other equity - unrealized gain (loss) on available-for-sale financial assets and a decrease of $105 thousand in retained earnings on January 1, 2018. Investments of $688,649 in mutual funds previously classified as available-for-sale under IAS 39 were classified as at FVTOCI under IFRS 9 as they are equity instruments and are not held for trading. As a result, the related other equity - unrealized loss on available-for-sale financial assets of $6,315 thousand was reclassified to other equity - unrealized gain (loss) on financial assets at FVTOCI.

130
b) The Group elected to designate all its investments in equity securities previously classified as available-for-sale under IAS 39 as at FVTOCI under IFRS 9. As a result, the related other equity - unrealized gain (loss) on available-for-sale financial assets of $125 thousand and $(20,925) thousand was reclassified to retained earnings and other equity - unrealized gain (loss) on financial assets at FVTOCI.
As investments in unlisted shares previously measured at cost under IAS 39 have been classified at FVTOCI under IFRS 9, the Group recognized under IAS 39 impairment loss on certain investments in equity securities previously measured at cost and the loss was accumulated in retained earnings. Since those investments were designated as at FVTOCI under IFRS 9 and no impairment assessment is required, an adjustment was made that resulted in a decrease of $78,604 thousand in other equity - unrealized gain (loss) on financial assets at FVTOCI and an increase of $78,604 thousand in retained earnings on January 1, 2018.
c) Debt investments previously classified as available-for-sale under IAS 39 were classified as at
FVTPL under IFRS 9 because on initial recognition, the contractual cash flows were not solely payments of principal and interest on the principal outstanding. As a result of retrospective application, a related adjustment was made that resulted in an increase in retained earnings of $2,611 thousand on January 1, 2018.
Debt investments previously classified as available-for-sale under IAS 39 were classified as at FVTOCI with an assessment of expected credit losses under IFRS 9 because on initial recognition, the contractual cash flows were solely payments of principal and interest on the principal outstanding and based on the facts and circumstances that existed on January 1, 2018, it was assessed that these investments were held within a business model whose objective is achieved by both collecting contractual cash flows and selling financial assets. As a result of retrospective application, the related adjustments comprised a decrease in unrealized gain of $1,093 thousand. Debt investments previously classified as held-to-maturity financial assets under IAS 39 were classified as at amortized cost under IFRS 9 because on initial recognition, the contractual cash flows were solely payments of principal and interest on the principal outstanding and based on the facts and circumstances that existed on January 1, 2018, it was assessed that these investments were held within a business model whose objective is to collect contractual cash flows.
d) Notes receivable, trade receivables, other receivables, and other current assets that were previously classified as loans and receivables under IAS 39 were classified as at amortized cost with an assessment of expected credit losses under IFRS 9.
2) IFRS 15 “Revenue from Contracts with Customers” and related amendments
IFRS 15 establishes principles for recognizing revenue that apply to all contracts with customers and supersedes IAS 18 “Revenue”, IAS 11 “Construction Contracts” and a number of revenue-related interpretations. Refer to Note 4 for the related accounting policies. In identifying performance obligations, IFRS 15 and the related amendments require that a good or service is distinct if it is capable of being distinct (for example, the Group regularly sells it separately) and the promise to transfer it is distinct within the context of the contract (i.e. the nature of the promise in the contract is to transfer each good or service individually rather than to transfer a combined output). Under IFRS 15, the net effect of revenue recognized and consideration received and receivable is recognized as a contract asset or a contract liability. Prior to the application of IFRS 15, receivables were recognized or deferred revenue was reduced when revenue was recognized for the relevant contract under IAS 18.

131
The Group elected only to retrospectively apply IFRS 15 to contracts that were not complete as of January 1, 2018 and recognize the cumulative effect of the change in retained earnings on January 1, 2018. For all contract modifications that occurred on or before December 31, 2017, the Group did not apply the requirements in IFRS 15 individually to each of the modifications, and the Group identified the performance obligations and determined and allocated the transaction price in a manner that reflected the aggregate effect of all modifications that occurred on or before December 31, 2017. This reduced the complexity and cost of retrospective application and resulted in financial information that closely aligns with the financial information that would be available under IFRS 15 without the expedient. Anticipated impact on assets, liabilities and equity
January 1, 2018 As Originally
Stated
Adjustments Arising from
Initial Application
January 1, 2018 Restated
Refund liabilities (other current liabilities) $ - $ 5,089 $ 5,089 Provisions 5,089 (5,089) - Contract liabilities (other current
liabilities) - 1,933 1,933 Temporary credits (other current
liabilities) 1,933 (1,933) - $ 7,022 $ - $ 7,022
3) Amendments to IAS 12 “Recognition of Deferred Tax Assets for Unrealized Losses” The amendments clarify that the difference between the carrying amount of the debt instrument measured at fair value and its tax base gives rise to a temporary difference, even though there are unrealized losses on that asset, irrespective of whether the Group expects to recover the carrying amount of the debt instrument by sale or by holding it and collecting contractual cash flows. In addition, in determining whether to recognize a deferred tax asset, the Group should assess a deductible temporary difference in combination with all of its other deductible temporary differences, unless the tax law restricts the utilization of losses as deduction against income of a specific type, in which case, a deductible temporary difference is assessed in combination only with other deductible temporary differences of the appropriate type. The amendments also stipulate that, when determining whether to recognize a deferred tax asset, the estimate of probable future taxable profit may include some of the Group’s assets for more than their carrying amount if there is sufficient evidence that it is probable that the Group will achieve the higher amount and that the estimate for future taxable profit should exclude tax deductions resulting from the reversal of deductible temporary differences.
4) Amendments to IAS 40 “Transfers of Investment Property”
The amendments clarify that the Group should transfer to, or from, investment property when, and only when, the property meets, or ceases to meet, the definition of investment property and there is evidence of a change in use. In isolation, a change in management’s intentions for the use of a property does not provide evidence of a change in use. The amendments also clarify that evidence of a change in use is not limited to those illustrated in IAS 40.

132
5) IFRIC 22 “Foreign Currency Transactions and Advance Consideration”
IAS 21 stipulated that a foreign currency transaction shall be recorded on initial recognition in the functional currency by applying to the foreign currency amount the spot exchange rate between the functional currency and the foreign currency at the date of the transaction. IFRIC 22 further explains that the date of the transaction is the date on which an entity recognizes a non-monetary asset or non-monetary liability from payment or receipt of advance consideration. If there are multiple payments or receipts in advance, the entity shall determine the date of the transaction for each payment or receipt of advance consideration.
When the amendments are applied prospectively from January 1, 2018, the disclosures of related party transactions are enhanced.
b. The Regulations Governing the Preparation of Financial Reports by Securities Issuers and the
International Financial Reporting Standards (IFRS), International Accounting Standards (IAS), Interpretations of IFRS (IFRIC), and Interpretations of IAS (SIC) (collectively, the IFRSs) endorsed by the FSC for application starting from 2019
New IFRSs Effective Date
Announced by IASB (Note 1) Annual Improvements to IFRSs 2015-2017 Cycle January 1, 2019 Amendments to IFRS 9 “Prepayment Features with Negative
Compensation” January 1, 2019 (Note 2)
IFRS 16 “Leases” January 1, 2019 Amendments to IAS 19 “Plan Amendment, Curtailment or
Settlement” January 1, 2019 (Note 3)
Amendments to IAS 28 “Long-term Interests in Associates and Joint Ventures”
January 1, 2019
IFRIC 23 “Uncertainty over Income Tax Treatments” January 1, 2019 Note 1: Unless stated otherwise, the above New IFRSs are effective for annual periods beginning on
or after their respective effective dates. Note 2: The FSC permits the election for early adoption of the amendments starting from 2018. Note 3: The Group shall apply these amendments to plan amendments, curtailments or settlements
occurring on or after January 1, 2019. 1) IFRS 16 “Leases”
IFRS 16 sets out the accounting standards for leases that will supersede IAS 17, IFRIC 4 and a number of related interpretations. Definition of a lease Upon initial application of IFRS 16, the Group will elect to apply the guidance of IFRS 16 in determining whether contracts are, or contain, a lease only to contracts entered into (or changed) on or after January 1, 2019. Contracts identified as containing a lease under IAS 17 and IFRIC 4 will not be reassessed and will be accounted for in accordance with the transitional provisions under IFRS 16.

133
The Group as lessee Upon initial application of IFRS 16, the Group will recognize right-of-use assets, or investment properties if the right-of-use assets meet the definition of investment properties, and lease liabilities for all leases on the consolidated balance sheets except for those whose payments under low-value asset and short-term leases will be recognized as expenses on a straight-line basis. On the consolidated statements of comprehensive income, the Group will present the depreciation expense charged on right-of-use assets separately from the interest expense accrued on lease liabilities; interest is computed using the effective interest method. On the consolidated statements of cash flows, cash payments for the principal portion of lease liabilities will be classified within financing activities; cash payments for the interest portion will be classified within operating activities. Currently, payments under operating lease contracts, including property interest qualified as investment properties, are recognized as expenses on a straight-line basis prior IFRS 16. Cash flows for operating leases are classified within operating activities on the consolidated statements of cash flows. Leased assets and finance lease payables are recognized for contracts classified as finance leases. The Group anticipates applying IFRS 16 retrospectively with the cumulative effect of the initial application of this standard recognized on January 1, 2019. Comparative information will not be restated. Lease liabilities will be measured at the present value of the remaining lease payments, discounted using the lessee’s incremental borrowing rate on January 1, 2019 under IAS 17. Right-of-use assets will be measured at their carrying amount as if IFRS 16 had been applied since the commencement date, but discounted using the aforementioned incremental borrowing rate. Except for the following practical expedients which are to be applied, the Group will apply IAS 36 to all right-of-use assets. The Group expects to apply the following practical expedients: a) The Group will apply a single discount rate to a portfolio of leases with reasonably similar
characteristics to measure lease liabilities. b) The Group will account for those leases for which the lease term ends on or before December
31, 2019 as short-term leases. c) The Group will exclude initial direct costs from the measurement of right-of-use assets on
January 1, 2019. d) The Group will use hindsight, such as in determining lease terms, to measure lease liabilities. For leases currently classified as finance leases under IAS 17, the carrying amounts of right-of-use assets and lease liabilities on January 1, 2019 will be determined as at the carrying amounts of the respective leased assets and finance lease payables as of December 31, 2018.
The Group as lessor Except for sublease transactions, the Group will not make any adjustments for leases in which it is a lessor and will account for those leases with the application of IFRS 16 starting from January 1, 2019.

134
Anticipated impact on assets, liabilities and equity
Carrying Amount as of December 31,
2018
Adjustments Arising from
Initial Application
Adjusted Carrying
Amount as of January 1, 2019
Right-of-use assets $ - $ 91,959 $ 91,959 Prepayments 126,479 (520) 125,959 Total effect on assets $ 126,479 $ 91,439 $ 217,918 Lease liabilities - current $ - $ 31,737 $ 31,737 Lease liabilities - non-current - 59,702 59,702 Total effect on liabilities $ - $ 91,439 $ 91,439
2) IFRIC 23 “Uncertainty over Income Tax Treatments”
IFRIC 23 clarifies that when there is uncertainty over income tax treatments, the Group should assume that the taxation authority will have full knowledge of all related information when making related examinations. If the Group concludes that it is probable that the taxation authority will accept an uncertain tax treatment, the Group should determine the taxable profit, tax bases, unused tax losses, unused tax credits or tax rates consistently with the tax treatments used or planned to be used in its income tax filings. If it is not probable that the taxation authority will accept an uncertain tax treatment, the Group should make estimates using either the most likely amount or the expected value of the tax treatment, depending on which method the Group expects to better predict the resolution of the uncertainty. The Group has to reassess its judgments and estimates if facts and circumstances change. Upon initial application of IFRIC 23, the Group will recognize the cumulative effect of retrospective application on retained earnings on January 1, 2019.
3) Amendments to IFRS 9 “Prepayment Features with Negative Compensation” IFRS 9 stipulated that if a contractual term of a financial asset permits the issuer (i.e. the debtor) to prepay a debt instrument or permits the holder (i.e. the creditor) to put a debt instrument back to the issuer before maturity and the prepayment amount substantially represents unpaid amounts of the principal and interest on the principal amount outstanding, which may include reasonable compensation for early termination, the financial asset has contractual cash flows that are solely payments of principal and interest on the principal amount outstanding. The amendments further explain that reasonable compensation may be paid or received by either of the parties, i.e. a party may receive reasonable compensation when it chooses to terminate the contract early. Upon initial application of the above amendments, the Group will recognize the cumulative effect of retrospective application on retained earnings on January 1, 2019.
4) Annual Improvements to IFRSs 2015-2017 Cycle
Several standards, including IFRS 3, IFRS 11, IAS 12 and IAS 23 “Borrowing Costs”, were amended in this annual improvement. IAS 23 was amended to clarify that, if any specific borrowing remains outstanding after the related asset is ready for its intended use or sale, the related borrowing costs shall be included in the calculation of the capitalization rate on general borrowings. Upon initial application of the above amendment, the related borrowing costs will be included in the calculation starting from 2019.

135
5) Amendments to IAS 19 “Plan Amendment, Curtailment or Settlement”
The amendments stipulate that, if a plan amendment, curtailment or settlement occurs, the current service cost and the net interest for the remainder of the annual reporting period are determined using the actuarial assumptions used for the remeasurement of the net defined benefit liabilities (assets). In addition, the amendments clarify the effect of a plan amendment, curtailment or settlement on the requirements regarding the asset ceiling. The Group will apply the above amendments prospectively. Except for the above impacts, as of the date the consolidated financial statements were authorized for issue, the Group continues assessing other possible impacts that the application of the aforementioned amendments and the related amendments to the Regulations Governing the Preparation of Financial Reports by Securities Issuers will have on the Group’s financial position and financial performance and will disclose these other impacts when the assessment is completed.
c. New IFRSs in issue but not yet endorsed and issued into effect by the FSC
New IFRSs Effective Date
Announced by IASB (Note 1) Amendments to IFRS 3 “Definition of a Business” January 1, 2020 (Note 2) Amendments to IFRS 10 and IAS 28 “Sale or Contribution of Assets
between an Investor and its Associate or Joint Venture” To be determined by IASB
IFRS 17 “Insurance Contracts” January 1, 2021 Amendments to IAS 1 and IAS 8 “Definition of Material” January 1, 2020 (Note 3) Note 1: Unless stated otherwise, the above New IFRSs are effective for annual periods beginning on
or after their respective effective dates. Note 2: The Group shall apply these amendments to business combinations for which the acquisition
date is on or after the beginning of the first annual reporting period beginning on or after January 1, 2020 and to asset acquisitions that occur on or after the beginning of that period.
Note 3: The Group shall apply these amendments prospectively for annual reporting periods
beginning on or after January 1, 2020.
1) Amendments to IFRS 3 “Definition of a Business” The amendments clarify that, to be considered a business, an acquired set of activities and assets must include, at a minimum, an input and a substantive process applied to the input that together significantly contribute to the ability to create outputs. The amendments narrow the definitions of outputs by focusing on goods and services provided to customers, and the reference to an ability to reduce costs is removed. Moreover, the amendments remove the assessment of whether market participants are capable of replacing any missing inputs or processes and continuing to produce outputs. In addition, the amendments introduce an optional concentration test that permits a simplified assessment of whether an acquired set of activities and assets is not a business.
Except for the above impact, as of the date the consolidated financial statements were authorized for issue, the Group is continuously assessing the possible impact that the application of other standards and interpretations will have on the Group’s financial position and financial performance and will disclose the relevant impact when the assessment is completed.

136
4. SUMMARY OF SIGNIFICANT ACCOUNTING POLICIES a. Statement of compliance
The consolidated financial statements have been prepared in accordance with the Regulations Governing the Preparation of Financial Reports by Securities Issuers and IFRSs as endorsed and issued into effect by the FSC.
b. Basis of preparation The consolidated financial statements have been prepared on the historical cost basis except for financial instruments which are measured at fair value, and net defined benefit liabilities which are measured at the present value of the defined benefit obligation less the fair value of plan assets. The fair value measurements, which are grouped into Levels 1 to 3 based on the degree to which the fair value measurement inputs are observable and based on the significance of the inputs to the fair value measurement in its entirety, are described as follows: 1) Level 1 inputs are quoted prices (unadjusted) in active markets for identical assets or liabilities; 2) Level 2 inputs are inputs other than quoted prices included within Level 1 that are observable for an
asset or liability, either directly (i.e. as prices) or indirectly (i.e. derived from prices); and 3) Level 3 inputs are unobservable inputs for an asset or liability.
c. Classification of current and non-current assets and liabilities Current assets include: 1) Assets held primarily for the purpose of trading; 2) Assets expected to be realized within 12 months after the reporting period; and 3) Cash and cash equivalents unless the asset is restricted from being exchanged or used to settle a
liability for at least 12 months after the reporting period. Current liabilities include: 1) Liabilities held primarily for the purpose of trading; 2) Liabilities due to be settled within 12 months after the reporting period; and 3) Liabilities for which the Group does not have an unconditional right to defer settlement for at least
12 months after the reporting period. Terms of a liability that could, at the option of the counterparty, result in its settlement by the issue of equity instruments do not affect its classification.
Assets and liabilities that are not classified as current are classified as non-current.

137
d. Basis of consolidation
The consolidated financial statements incorporate the financial statements of the Company and the entities controlled by the Company (i.e. its subsidiaries). Income and expenses of subsidiaries acquired or disposed of during the period are included in the consolidated statement of profit or loss and other comprehensive income from the effective dates of acquisitions up to the effective dates of disposals, as appropriate. When necessary, adjustments are made to the financial statements of subsidiaries to bring their accounting policies into line with those used by the Company. All intra-group transactions, balances, income and expenses are eliminated in full upon consolidation. Total comprehensive income of subsidiaries is attributed to the owners of the Company and to the non-controlling interests even if this results in the non-controlling interests having a deficit balance.
Changes in the Group’s ownership interests in subsidiaries that do not result in the Group losing control over the subsidiaries are accounted for as equity transactions. The carrying amounts of the interests of the Group and the non-controlling interests are adjusted to reflect the changes in their relative interests in the subsidiaries. Any difference between the amount by which the non-controlling interests are adjusted and the fair value of the consideration paid or received is recognized directly in equity and attributed to the owners of the Company.
When the Group loses control of a subsidiary, a gain or loss is recognized in profit or loss and is calculated as the difference between (i) the aggregate of the fair value of the consideration received and any investment retained in the former subsidiary at its fair value at the date when control is lost and (ii) the assets (including any goodwill) and liabilities and any non-controlling interests of the former subsidiary at their carrying amounts at the date when control is lost. The Group accounts for all amounts recognized in other comprehensive income in relation to that subsidiary on the same basis as would be required if the Group had directly disposed of the related assets or liabilities. See Note 16 and Tables 6 and 7 for the detailed information of subsidiaries (including the percentages of ownership and main businesses).
e. Foreign currencies
In preparing the financial statements of each individual group entity, transactions in currencies other than the entity’s functional currency (i.e. foreign currencies) are recognized at the rates of exchange prevailing at the dates of the transactions. At the end of each reporting period, monetary items denominated in foreign currencies are retranslated at the rates prevailing at that date. Exchange differences on monetary items arising from settlement or translation are recognized in profit or loss in the period in which they arise. Non-monetary items measured at fair value that are denominated in foreign currencies are retranslated at the rates prevailing at the date when the fair value was determined. Exchange differences arising from the retranslation of non-monetary items are included in profit or loss for the period except for exchange differences arising from the retranslation of non-monetary items in respect of which gains and losses are recognized directly in other comprehensive income, in which cases, the exchange differences are also recognized directly in other comprehensive income.
Non-monetary items that are measured at historical cost in a foreign currency are not retranslated. For the purpose of presenting consolidated financial statements, the functional currencies of the Company and the group entities (including subsidiaries and associates that use currency different from the currency of the Company) are translated into the presentation currencies - the New Taiwan dollar as follows: Assets and liabilities are translated at the exchange rates prevailing at the end of the reporting period; income and expense items are translated at the average exchange rates for the period. The resulting currency translation differences are recognized in other comprehensive income (attributed to the owners of the Company and non-controlling interests as appropriate).

138
f. Inventories
Inventories consist of raw materials, supplies, spare parts, finished goods, merchandise and work in progress and are stated at the lower of cost or net realizable value. Inventory write-downs are made by item, except where it may be appropriate to group similar or related items. Net realizable value is the estimated selling price of inventories less all estimated costs of completion and costs necessary to make the sale. Inventories are recorded at standard cost and adjusted to approximate weighted - average cost on the balance sheet date.
g. Property, plant, and equipment
Property, plant and equipment are stated at cost and subsequently stated at cost, less recognized accumulated depreciation and accumulated impairment loss. Freehold land is not depreciated. Depreciation of property, plant and equipment is recognized using the straight-line method. Each significant part is depreciated separately. The estimated useful lives, residual values and depreciation methods are reviewed at the end of each reporting period, with the effects of any changes in estimates accounted for on a prospective basis. On derecognition of an item of property, plant and equipment, the difference between the sales proceeds and the carrying amount of the asset is recognized in profit or loss.
h. Investment properties
Investment properties are properties held to earn rentals and/or for capital appreciation (including property under construction for such purposes). Investment properties also include land held for a currently undetermined future use. Investment properties are initially measured at cost, including transaction costs. Subsequent to initial recognition, investment properties are measured at cost less accumulated depreciation and accumulated impairment loss. Depreciation is recognized using the straight-line method. On derecognition of an investment property, the difference between the net disposal proceeds and the carrying amount of the asset is included in profit or loss.
i. Intangible assets
1) Intangible assets acquired separately
Intangible assets with finite useful lives that are acquired separately are initially measured at cost and subsequently measured at cost less accumulated amortization and accumulated impairment loss. Amortization is recognized on a straight-line basis. The estimated useful life, residual value, and amortization method are reviewed at the end of each reporting period, with the effect of any changes in estimates accounted for on a prospective basis. Intangible assets with indefinite useful lives that are acquired separately are measured at cost less accumulated impairment loss.
2) Internally-generated intangible assets - research and development expenditure
Expenditure on research activities is recognized as an expense in the period in which it is incurred.

139
3) Derecognition of intangible assets On derecognition of an intangible asset, the difference between the net disposal proceeds and the carrying amount of the asset is recognized in profit or loss.
j. Impairment of tangible and intangible assets
At the end of each reporting period, the Group reviews the carrying amounts of its tangible and intangible assets to determine whether there is any indication that those assets have suffered an impairment loss. If any such indication exists, the recoverable amount of the asset is estimated in order to determine the extent of the impairment loss. When it is not possible to estimate the recoverable amount of an individual asset, the Group estimates the recoverable amount of the cash-generating unit to which the asset belongs. Corporate assets are allocated to the individual cash-generating units on a reasonable and consistent basis of allocation. Intangible assets with indefinite useful lives and intangible assets not yet available for use are tested for impairment at least annually, and whenever there is an indication that the asset may be impaired. The recoverable amount is the higher of fair value less costs to sell and value in use. If the recoverable amount of an asset or cash-generating unit is estimated to be less than its carrying amount, the carrying amount of the asset or cash-generating unit is reduced to its recoverable amount, with the resulting impairment loss recognized in profit or loss. When an impairment loss is subsequently reversed, the carrying amount of the asset, cash-generating unit or relevant assets of contract is increased to the revised estimate of its recoverable amount, but only to the extent of the carrying amount that would have been determined had no impairment loss been recognized for the asset, cash-generating unit or relevant assets of contract in prior years. A reversal of an impairment loss is recognized in profit or loss.
k. Financial instruments
Financial assets and financial liabilities are recognized when a group entity becomes a party to the contractual provisions of the instruments. Transaction costs that are directly attributable to the acquisition or issue of financial assets and financial liabilities (other than financial assets and financial liabilities at fair value through profit or loss) are added to or deducted from the fair value of the financial assets or financial liabilities, as appropriate, on initial recognition. Transaction costs directly attributable to the acquisition of financial assets or financial liabilities at fair value through profit or loss are recognized immediately in profit or loss.
1) Financial assets
All regular way purchases or sales of financial assets are recognized and derecognized on a settlement date basis.
a) Measurement category
2018 Financial assets are classified into the following categories: financial assets at FVTPL, financial assets at amortized cost, and investments in debt instruments and equity instruments at FVTOCI.

140
i. Financial assets at FVTPL
Financial assets measured at FVTPL include financial assets mandatorily measured or designated as at FVTPL. Financial assets mandatorily measured at FVTPL include investments in equity instruments which are not designated as at FVTOCI and debt instruments that do not meet the amortized cost criteria or the FVTOCI criteria. Financial assets at fair value through profit or loss are stated at fair value, with any gains or losses arising on remeasurement recognized in profit or loss. The net gain or loss recognized in profit or loss incorporates any dividend or interest earned on the financial asset. Fair value is determined in the manner described in Note 35.
ii. Financial assets at amortized cost
Financial assets that meet the following conditions are subsequently measured at amortized cost: i) The financial asset is held within a business model whose objective is to hold financial
assets in order to collect contractual cash flows; and ii) The contractual terms of the financial asset give rise on specified dates to cash flows
that are solely payments of principal and interest on the principal amount outstanding. Subsequent to initial recognition, financial assets at amortized cost (including cash and cash equivalents, accounts receivable, other receivables measured at amortized cost, and time deposits with original maturities of over 3 months) are measured at amortized cost, which equals the gross carrying amount determined using the effective interest method less any impairment loss. Exchange differences are recognized in profit or loss. Interest income is calculated by applying the effective interest rate to the gross carrying amount of such a financial asset, except for: i) Purchased or originated credit-impaired financial assets, for which interest income is
calculated by applying the credit-adjusted effective interest rate to the amortized cost of such financial assets.
ii) Financial assets that are not credit-impaired on purchase or origination but have
subsequently become credit-impaired, for which interest income is calculated by applying the effective interest rate to the amortized cost of such financial assets in subsequent reporting periods.
Cash equivalents include short-term investments or time deposits with original maturities of less than three months, which are highly liquid, readily convertible to a known amount of cash, and are subject to an insignificant risk of changes in value. These cash equivalents are held for the purpose of meeting short-term cash commitments.
iii. Investments in debt instruments at FVTOCI
Debt instruments that meet the following conditions are subsequently measured at FVTOCI: i) The debt instrument is held within a business model whose objective is achieved by both
the collecting of contractual cash flows and the selling of such financial assets; and ii) The contractual terms of the financial asset give rise on specified dates to cash flows
that are solely payments of principal and interest on the principal amount outstanding.

141
Investments in debt instruments at FVTOCI are subsequently measured at fair value. Changes in the carrying amounts of these debt instruments relating to changes in foreign currency exchange rates, interest income calculated using the effective interest method and impairment losses or reversals are recognized in profit or loss. Other changes in the carrying amount of these debt instruments are recognized in other comprehensive income and will be reclassified to profit or loss when the investment is disposed of.
iv. Investments in equity instruments at FVTOCI On initial recognition, the Group may make an irrevocable election to designate investments in equity instruments as at FVTOCI. Designation as at FVTOCI is not permitted if the equity investment is held for trading or if it is contingent consideration recognized by an acquirer in a business combination. Investments in equity instruments at FVTOCI are subsequently measured at fair value with gains and losses arising from changes in fair value recognized in other comprehensive income and accumulated in other equity. The cumulative gain or loss will not be reclassified to profit or loss on disposal of the equity investments; instead, it will be transferred to retained earnings. Dividends are recognized in profit and loss when the Group’s right to receive the dividends is established, unless they clearly represent a recovery of part of the cost of the investment, in which case, they are included in OCI.
2017
Financial assets are classified into the following categories: Financial assets at fair value through profit or loss, held-to-maturity financial assets, available-for-sale financial assets, and loans and receivables.
i. Financial assets at FVTPL
Financial assets are classified as at FVTPL when the financial assets are either held for trading or it is designated as at FVTPL. Financial assets at FVTPL are stated at fair value, with any gains or losses arising on remeasurement recognized in profit or loss. The net gain or loss recognized in profit or loss incorporates any dividend or interest earned on the financial asset. Fair value is determined in the manner described in Note 35.
ii. Held-to-maturity financial assets The entity classify investments in bonds payable as held-to-maturity financial assets when they has the positive intent and ability to hold the investment until maturity. On initial recognition, held-to-maturity financial assets are recognised as amortized cost after deducting any impairment losses using the effective interest method.
iii. Available-for-sale financial assets
Available-for-sale financial assets are non-derivatives that are either designated as available-for-sale or are not classified as loans and receivables, held-to-maturity investments or financial assets at fair value through profit or loss.

142
Available-for-sale financial assets are measured at fair value. Changes in the carrying amounts of available-for-sale monetary financial assets relating to changes in foreign currency exchange rates, interest income calculated using the effective interest method and dividends on available-for-sale equity investments are recognized in profit or loss. Other changes in the carrying amount of available-for-sale financial assets are recognized in other comprehensive income and will be reclassified to profit or loss when the investment is disposed of or is determined to be impaired. Dividends on available-for-sale equity instruments are recognized in profit or loss when the Group’s right to receive the dividends is established. Available-for-sale equity investments that do not have a quoted market price in an active market and whose fair value cannot be reliably measured and derivatives that are linked to and must be settled by delivery of such unquoted equity investments are measured at cost less any identified impairment loss at the end of each reporting period and presented in a separate line item as financial assets carried at cost. If, in a subsequent period, the fair value of the financial assets can be reliably measured, the financial assets are remeasured at fair value. The difference between the carrying amount and fair value is recognized in other comprehensive income on financial assets. Any impairment losses are recognized in profit and loss.
iv. Loans and receivables
Loans and receivables (including cash and cash equivalents, notes receivable and trade receivables, other receivables and debt investments with no active market) are measured using the effective interest method at amortized cost less any impairment, except for short-term receivables when the effect of discounting is immaterial. Cash equivalents include time deposits and bonds with repurchase agreements investments with original maturities within 3 months from the date of acquisition, which are highly liquid, readily convertible to a known amount of cash and are subject to an insignificant risk of changes in value. These cash equivalents are held for the purpose of meeting short-term cash commitments.
b) Impairment of financial assets and contract assets
2018 The Group recognizes a loss allowance for expected credit losses on financial assets at amortized cost (including trade receivables), investments in debt instruments that are measured at FVTOCI. The Group always recognizes lifetime expected credit losses (i.e. ECLs) for trade receivables. For all other financial instruments, the Group recognizes lifetime ECLs when there has been a significant increase in credit risk since initial recognition. If, on the other hand, the credit risk on a financial instrument has not increased significantly since initial recognition, the Group measures the loss allowance for that financial instrument at an amount equal to 12-month ECLs. For financial instruments and contract assets, the Group recognizes lifetime ECLs when there has been a significant increase in credit risk since initial recognition. If, on the other hand, the credit risk on a financial instrument has not increased significantly since initial recognition, the Group measures the loss allowance for that financial instrument at an amount equal to 12-month ECLs.
143
Expected credit losses reflect the weighted average of credit losses with the respective risks of default occurring as the weights. Lifetime ECLs represent the expected credit losses that will result from all possible default events over the expected life of a financial instrument. In contrast, 12-month ECLs represent the portion of lifetime ECLs that is expected to result from default events on a financial instrument that are possible within 12 months after the reporting date. The Group recognizes an impairment gain or loss in profit or loss for all financial instruments with a corresponding adjustment to their carrying amount through a loss allowance account, except for investments in debt instruments that are measured at FVTOCI, for which the loss allowance is recognized in other comprehensive income and does not reduce the carrying amount of such a financial asset. 2017 Financial assets, other than those at FVTPL, are assessed for indicators of impairment at the end of each reporting period. Financial assets are considered to be impaired when there is objective evidence, as a result of one or more events that occurred after the initial recognition of such financial assets, that the estimated future cash flows of the investment have been affected. Financial assets at amortized cost, such as trade receivables, are assessed for impairment on a collective basis even if they were assessed not to be impaired individually. Objective evidence of impairment for a portfolio of receivables could include the Group’s past experience with collecting payments, an increase in the number of delayed payments in the portfolio past the average credit period of 60 days, as well as observable changes in national or local economic conditions that correlate with defaults on receivables, and other situations. For a financial asset at amortized cost, the amount of the impairment loss recognized is the difference between such an asset’s carrying amount and the present value of its estimated future cash flows, discounted at the financial asset’s original effective interest rate. For a financial assets measured at amortized cost, if, in a subsequent period, the amount of the impairment loss decreases and the decrease can be related objectively to an event occurring after the impairment was recognized, the previously recognized impairment loss is reversed through profit or loss to the extent that the carrying amount of the investment at the date the impairment is reversed does not exceed what the amortized cost would have been had the impairment not been recognized. For available-for-sale equity investments, a significant or prolonged decline in the fair value of the security below its cost is considered to be objective evidence of impairment. For all other financial assets, objective evidence of impairment could include significant financial difficulty of the issuer or counterparty, breach of contract, such as a default or delinquency in interest or principal payments, it becoming probable that the borrower will enter bankruptcy or financial re-organization, or the disappearance of an active market for that financial asset because of financial difficulties. When an available-for-sale financial asset is considered to be impaired, cumulative gains or losses previously recognized in other comprehensive income are reclassified to profit or loss in the period.

144
In respect of available-for-sale equity securities, impairment loss previously recognized in profit or loss is not reversed through profit or loss. Any increase in fair value subsequent to an impairment loss is recognized in other comprehensive income. In respect of available-for-sale debt securities, impairment loss is subsequently reversed through profit or loss if an increase in the fair value of such an investment can be objectively related to an event occurring after the recognition of the impairment loss. For financial assets that are carried at cost, the amount of the impairment loss is measured as the difference between the asset’s carrying amount and the present value of the estimated future cash flows discounted at the current market rate of return for a similar financial asset. Such impairment loss will not be reversed in subsequent periods. The carrying amount of the financial asset is reduced by the impairment loss directly for all financial assets with the exception of trade receivables, where the carrying amount is reduced through the use of an allowance account. When a trade receivable and other receivables are considered uncollectable, it is written off against the allowance account. Subsequent recoveries of amounts previously written off are credited against the allowance account. Changes in the carrying amount of the allowance account are recognized in profit or loss except for uncollectable trade receivables that are written off against the allowance account.
c) Derecognition of financial assets
The Group derecognizes a financial asset only when the contractual rights to the cash flows from the asset expire, or when it transfers the financial asset and substantially all the risks and rewards of ownership of the asset to another party. Before 2017, on derecognition of a financial asset in its entirety, the difference between the asset’s carrying amount and the sum of the consideration received and receivable and the cumulative gain or loss which had been recognized in other comprehensive income is recognized in profit or loss. Starting from 2018, on derecognition of a financial asset at amortized cost in its entirety, the difference between the asset’s carrying amount and the sum of the consideration received and receivable is recognized in profit or loss. On derecognition of an investment in a debt instrument at FVTOCI, the difference between the asset’s carrying amount and the sum of the consideration received and receivable and the cumulative gain or loss which had been recognized in other comprehensive income is recognized in profit or loss. However, on derecognition of an investment in an equity instrument at FVTOCI, the difference between the asset’s carrying amount and the sum of the consideration received and receivable is recognized in profit or loss, and the cumulative gain or loss which had been recognized in other comprehensive income is transferred directly to retained earnings, without recycling through profit or loss.
2) Equity instruments
Debt and equity instruments issued by the Group are classified as either financial liabilities or as equity in accordance with the substance of the contractual arrangements and the definitions of a financial liability and an equity instrument. Equity instruments issued by the group entity are recognized at the proceeds received, net of direct issue costs. Repurchase of the Group’s own equity instruments is recognized in and deducted directly from equity. No gain or loss is recognized in profit or loss on the purchase, sale, issue or cancellation of the Group’s own equity instruments.

145
3) Financial liabilities a) Subsequent measurement
Except the following situation, all financial liabilities are measured at amortized cost using the effective interest method.
i. Financial liabilities at FVTPL
Financial liabilities held for trading are stated at fair value, with any gain or loss arising on remeasurement recognized in profit or loss. Fair value is determined in the manner described in Note 35.
b) Derecognition of financial liabilities
The difference between the carrying amount of the financial liability derecognized and the consideration paid, including any non-cash assets transferred or liabilities assumed, is recognized in profit or loss.
4) Derivative financial instruments
The Group enters into a variety of derivative financial instruments to manage its exposure to interest rate and foreign exchange rate risks, including cross currency swaps, foreign exchange forward contracts, and convertible bond asset swaps. Derivatives are initially recognized at fair value at the date the derivative contracts are entered into and are subsequently remeasured to their fair value at the end of each reporting period. The resulting gain or loss is recognized in profit or loss immediately unless the derivative is designated and effective as a hedging instrument, in which event the timing of the recognition in profit or loss depends on the nature of the hedge relationship. When the fair value of derivative financial instruments is positive, the derivative is recognized as a financial asset; when the fair value of derivative financial instruments is negative, the derivative is recognized as a financial liability. Before 2017, derivatives embedded in non-derivative host contracts were treated as separate derivatives when they met the definition of a derivative; their risks and characteristics were not closely related to those of the host contracts; and the contracts were not measured at FVTPL. Starting from 2018, derivatives embedded in hybrid contracts that contain financial asset hosts that is within the scope of IFRS 9 are not separated; instead, the classification is determined in accordance with the entire hybrid contract. Derivatives embedded in non-derivative host contracts that are not financial assets that is within the scope of IFRS 9 (e.g. financial liabilities) are treated as separate derivatives when they meet the definition of a derivative; their risks and characteristics are not closely related to those of the host contracts; and the host contracts are not measured at FVTPL.
l. Revenue recognition
2018 The Group identifies contracts with customers, allocates the transaction price to the performance obligations and recognizes revenue when performance obligations are satisfied. Revenue from the sale of goods comes from sales of integrated circuits. Sales of integrated circuits are recognized as revenue when the goods are delivered to the customer’s specific location because it is the time when the customer has full discretion over the manner of distribution and price to sell the goods, has the primary responsibility for sales to future customers and bears the risks of obsolescence.

146
The Group does not recognize revenue on materials delivered to subcontractors because this delivery does not involve a transfer of control. 2017 Revenue is measured at the fair value of the consideration received or receivable. Revenue is reduced for estimated customer returns, rebates and other similar allowances. Allowance for sales returns and liability for returns are recognized at the time of sale based on the seller’s reliable estimate of future returns and based on past experience and other relevant factors. 1) Sale of goods
Revenue from the sale of goods is recognized when all the following conditions are satisfied: a) The Group has transferred to the buyer the significant risks and rewards of ownership of the
goods; b) The Group retains neither continuing managerial involvement to the degree usually associated
with ownership nor effective control over the goods sold; c) The amount of revenue can be measured reliably; d) It is probable that the economic benefits associated with the transaction will flow to the Group;
and e) The costs incurred or to be incurred in respect of the transaction can be measured reliably. The Group does not recognize sales revenue on materials delivered to subcontractors because this delivery does not involve a transfer of risks and rewards of materials ownership.
2) Rendering of services
Service income is recognized when services are provided.
3) Dividend and interest income Dividend income from investments is recognized when the shareholder’s right to receive payment has been established provided that it is probable that the economic benefits will flow to the Group and the amount of income can be measured reliably. Interest income from a financial asset is recognized when it is probable that the economic benefits will flow to the Group and the amount of income can be measured reliably. Interest income is accrued on a time basis, by reference to the principal outstanding and at the effective interest rate applicable.
m. Leasing
Leases are classified as finance leases whenever the terms of the lease transfer substantially all the risks and rewards of ownership to the lessee. All other leases are classified as operating leases. 1) The Group as lessor
Rental income from operating leases is recognized on a straight-line basis over the term of the relevant lease. Initial direct costs incurred in negotiating and arranging an operating lease are added to the carrying amount of the leased asset and amortized on a straight-line basis over the lease term.

147
The contingent rental of the lease agreement is recognized as an expense in the year in which it occurs.
2) The Group as lessee
Operating lease payments are recognized as an expense on a straight-line basis over the lease term. n. Borrowing costs
Borrowing costs are recognized in profit or loss in the period in which they are incurred.
o. Employee benefits
1) Short-term employee benefits
Liabilities recognized in respect of short-term employee benefits are measured at the undiscounted amount of the benefits expected to be paid in exchange for the related services.
2) Retirement benefits
Payments to defined contribution retirement benefit plans are recognized as an expense when employees have rendered services entitling them to the contributions. Defined benefit costs (including service cost, net interest and remeasurement) under defined benefit retirement benefit plans are determined using the projected unit credit method. Service cost (including current service cost) and net interest on the net defined benefit liability are recognized as employee benefit expenses in the period they occur. Remeasurement, comprising actuarial gains and losses, the effect of the changes to the asset ceiling and the return on plan assets (excluding interest), is recognized in other comprehensive income in the period in which they occur. Remeasurement recognized in other comprehensive income is reflected immediately in accumulated deficit and will not be reclassified to profit or loss. Net defined benefit liabilities represent the actual deficit in the Group’s defined benefit plan. Any surplus resulting from this calculation is limited to the present value of any refunds from the plans or reductions in future contributions to the plans.
p. Share-based payment arrangements
The fair value at the grant date of the restricted shares for employees is expensed on a straight-line basis over the vesting period, based on the Group’s best estimates of the number of shares or options that are expected to ultimately vest, with a corresponding increase in capital surplus - employee share options or other equity - unearned employee benefit. It is recognized as an expense in full at the grant date if vested immediately.
When restricted shares for employees are issued, other equity - unearned employee benefits are recognized on the grant date, with a corresponding increase in capital surplus - restricted shares for employees. If restricted shares for employees are granted for consideration and should be returned, they are recognized as payables. Dividends paid to employees on restricted shares that do not need to be returned if employees resign in the vesting period are recognized as expenses when the dividends are declared with a corresponding adjustment in retained earnings and capital surplus - restricted shares for employees.

148
At the end of each reporting period, the Group revises its estimate of the number of equity instruments expected to vest. The impact of the revision of the original estimates is recognized in profit or loss such that the cumulative expense reflects the revised estimate, with a corresponding adjustment to the non-controlling interests, capital surplus - employee share options and capital surplus-restricted share options.
q. Taxation
Income tax expense represents the sum of the tax currently payable and deferred tax. 1) Current tax
According to the Income Tax Law, an additional tax at 10% of unappropriated earnings is provided for as income tax in the year the shareholders approve to retain earnings. Adjustments of prior years’ tax liabilities are added to or deducted from the current year’s tax provision.
2) Deferred tax
Deferred tax is recognized on temporary differences between the carrying amounts of assets and liabilities and the corresponding tax bases used in the computation of taxable profit. If a temporary difference arises from the initial recognition of assets and liabilities in a transaction that (other than in the acquisition of a subsidiary) affects neither the taxable profit nor the accounting profit, the resulting deferred tax asset or liability is not recognized. Deferred tax liabilities are generally recognized for all taxable temporary differences. Deferred tax assets are generally recognized for all deductible temporary differences, to the extent that it is probable that taxable profits will be available against which those deductible temporary differences can be utilized. Deferred tax liabilities are recognized for taxable temporary differences associated with investments in subsidiaries and associates, except where the Group is able to control the reversal of the temporary difference and it is probable that the temporary difference will not reverse in the foreseeable future. Deferred tax assets arising from deductible temporary differences associated with such investments and interests are only recognized to the extent that it is probable that there will be sufficient taxable profits against which to utilize the benefits of the temporary differences and they are expected to reverse in the foreseeable future. The carrying amount of deferred tax assets is reviewed at the end of each reporting period and reduced to the extent that it is no longer probable that sufficient taxable profits will be available to allow all or part of the asset to be recovered. A previously unrecognized deferred tax asset is also reviewed at the end of each reporting period and recognized to the extent that it has become probable that future taxable profit will allow the deferred tax asset to be recovered. Deferred tax liabilities and assets are measured at the tax rates that are expected to apply in the year which the liabilities are settled or the assets are realized, based on tax rates (and tax laws) that have been enacted or substantively enacted by the end of the reporting period. The measurement of deferred tax liabilities and assets reflects the tax consequences that would follow from the manner in which the Group expects, at the end of the reporting period, to recover or settle the carrying amount of its assets and liabilities.

149
3) Current and deferred taxes Current and deferred taxes are recognized in profit or loss, except when they relate to items that are recognized in other comprehensive income or directly in equity, in which case, the current and deferred taxes are also recognized in other comprehensive income or directly in equity, respectively.
5. CRITICAL ACCOUNTING JUDGMENTS AND KEY SOURCES OF ESTIMATION
UNCERTAINTY In the application of the Group’s accounting policies, management is required to make judgments, estimates and assumptions about the carrying amounts of assets and liabilities that are not readily apparent from other sources. The estimates and associated assumptions are based on historical experience and other factors that are considered relevant. Actual results may differ from these estimates. The estimates and underlying assumptions are reviewed on an ongoing basis. Revisions to accounting estimates are recognized in the year in which the estimate is revised if the revision affects only that period or in the period of the revision and future years if the revision affects both current and future years.
a. Write-down of inventories
The net realizable value of inventory is the estimated selling price in the ordinary course of business less the estimated costs of completion and disposal. The estimation of net realizable value was based on current market conditions and the historical experience with product sales of a similar nature. Changes in market conditions may have a material impact on the estimation of the net realizable value.
6. CASH AND CASH EQUIVALENTS
December 31 2018 2017 Bank deposits $ 1,522,563 $ 1,279,730 Cash on hand 389 524 Repurchase agreements collateralized by bonds 537,277 141,631
$ 2,060,229 $ 1,421,885 The market rate intervals of bank deposits and repurchase agreements collateralized by bonds at the end of the reporting period were as follows:
December 31 2018 2017 Bank deposits 0.001%-3.50% 0.001%-3.80% Repurchase agreements collateralized by bonds 0.45%-0.48% 0.35%-1.75%

150
7. FINANCIAL ASSETS AT FAIR VALUE THROUGH PROFIT AND LOSS
December 31 2018 2017 Financial assets at FVTPL - current Financial assets mandatorily classified as at FVTPL
Derivative financial assets Foreign exchange forward contracts (a) $ 168 $ -
Non-derivative financial assets Domestic mutual fund investments 31,045 - Domestic listed shares 32,698 - Convertible bonds asset swap 15,766 - Convertible bonds 54,000 -
Financial assets held for trading Non-derivative financial assets
Domestic mutual funds investments - 150,963 Domestic listed shares - 8,416 Convertible bonds asset swaps - 109,866 Convertible bonds - 10,579
$ 133,677 $ 279,824 Financial assets at FVTPL - non-current Financial assets mandatorily classified as at FVTPL
Convertible bond asset swaps $ 65,504 $ - Convertible bonds 21,620 -
Financial assets held for trading Convertible bond assets swaps - 10,073 Convertible bonds - 21,420
$ 87,124 $ 31,493 Financial liabilities at FVTPL - current Derivative financial liabilities
Foreign exchange forward contracts (a) $ 10 $ - Cross-currency swap contracts (b) 1,252 480
$ 1,262 $ 480 a. At the end of the reporting period, outstanding foreign exchange forward contracts not under hedge
accounting were as follows:
Currency Maturity Date Notional Amount (In Thousands)
December 31, 2018 Sell forward exchange contracts USD/NTD 2019.1.31 US$2,000/NT$61,420 Buy forward exchange contracts NTD/USD 2019.1.22 NT$76,700/US$2,500 Buy forward exchange contracts NTD/USD 2019.2.11 NT$61,350/US$2,000

151
The Group entered into foreign exchange forward contracts to manage exposures to exchange rate fluctuations of foreign currency denominated assets and liabilities.
b. At the end of the reporting period, outstanding cross-currency swap contracts not under hedge
accounting were as follows:
December 31, 2018
Notional Amount (In Thousands) Maturity Date
Range of Interest Rates
Paid
Range of Interest Rates
Received US$ 5,000 2019.1.2 - 4.00% US$ 1,000 2019.1.2 - 5.6% US$ 500 2019.1.2 - 3.1% US$ 500 2019.1.2 - 5.0% US$ 300 2019.1.2 - 5.6% US$ 200 2019.1.2 - 5.0% US$ 4,000 2019.1.8 - LIBOR (1 MTH)
+0.35% US$ 2,000 2019.2.13 - LIBOR (3 MTH)
+0.20%
December 31, 2017
Notional Amount (In Thousands) Maturity Date
Range of Interest Rates
Paid
Range of Interest Rates
Received US$ 2,000 2018.2.27 - 1.91% The Group entered into cross-currency swap contracts to manage exposures to exchange rate and interest rate fluctuations of foreign currency denominated assets and liabilities.
8. FINANCIAL ASSETS AT FAIR VALUE THROUGH OTHER COMPREHENSIVE INCOME -
2018
December 31,
2018 Current Investments in equity instruments at FVTOCI $ 187,259 Investments in debt instruments at FVTOCI 29,659 $ 216,918 Non-current Investments in equity instruments at FVTOCI $ 619,107 Investments in debt instruments at FVTOCI 14,814 $ 633,921

152
a. Investments in equity instruments at FVTOCI
December 31,
2018 Current Domestic investments
Listed shares (1) and (2) $ 187,259
Non-current Foreign investments
Unlisted shares (1) $ 30,961 Unlisted equity investments (1) 588,146
$ 619,107 These investments in equity instruments are not held for trading. Instead, they are held for strategic purposes. Accordingly, the management elected to designate these investments in equity instruments as at FVTOCI as they believe that recognizing short-term fluctuations in these investments’ fair value in profit or loss would not be consistent with the Group’s strategy of holding these investments for purposes. These investments in equity instruments were classified as available-for-sale and financial assets measured at cost under IAS 39. Refer to Notes 3, 10 and 12 for information relating to their reclassification and comparative information for 2017. In 2018, the Group acquired the ordinary shares of listed companies at NT$149,269 thousand and the ordinary shares of foreign companies at USD1,008 thousand for strategic investment purposes. The management designated these investments as at FVTOCI. In 2018, the Group sold its ordinary shares of listed companies in order to manage credit concentration risk. The sold shares had a fair value of $72,596 thousand and the Group transferred a gain of $3,047 thousand from other equity to retained earnings. Dividends of $9,073 thousand were recognized during the year. Those related to investments held at the end of the reporting period was $9,073 thousand.
b. Investments in debt instruments at FVTOCI
December 31,
2018 Current Foreign corporate bonds $ 29,659 Non-current Foreign corporate bonds $ 14,814 In September 2016 and July 2018, the Group bought foreign corporate bonds amounting to $15,654 thousand and $967 thousand with coupon rates of 2.25% and 4.125%, respectively. The expiry dates are September 2021 and October 2019, respectively. The bonds were classified as available-for-sale financial assets under IAS 39. Refer to Notes 3 and 10 for information relating to their reclassification and comparative information for 2017.

153
9. FINANCIAL ASSETS AT AMORTIZED COST - 2018
December 31,
2018 Current Domestic investments
Time deposits with original maturities of more than 3 months (a) $ 262,500 Pledged fixed deposits (b) 119,791
$ 382,291 Non-current Foreign investments
Foreign corporate bonds (c) $ 31,386 a. The interest rates for time deposits with original maturities of more than 3 months ranged from 0.73%
to 1.07% as at the end of the reporting period. The time deposits were classified as debt investments with no active market under IAS 39. Refer to Notes 3 and 13 for information relating to their reclassification and comparative information for 2017.
b. Pledged fixed deposits were classified as debt investments with no active market under IAS 39. Refer to
Notes 3 and 13 for information relating to their reclassification and comparative information for 2017. c. Foreign corporate bond were classified as held-to-maturity financial assets under IAS 39. Refer to
Notes 3 and 11 for information relating to their reclassification and comparative information for 2017. d. Refer to Note 37 for information relating to investments in financial assets at amortized cost pledged as
security.
10. AVAILABLE-FOR-SALE FINANCIAL ASSETS - 2017
December 31,
2017 Current Domestic mutual fund $ 8,215 Foreign mutual 60,125 Listed shares 143,155 Convertible bonds 53,000 Foreign convertible bonds 18,124 $ 282,619 Non-current Foreign mutual funds $ 688,649 Foreign corporate bonds 14,562 $ 703,211

154
11. HELD-TO-MATURITY FINANCIAL ASSETS - 2017
December 31,
2017 Non-current Foreign investments
FORCAY 3.375% 04/22/2025 Priority unsecured Dollar debt $ $ 30,499 The Group purchased the priority unsecured US dollar debt issued by Formosa Group (Cayman) Limited at $32,675 thousand, with an expiry date of April 22, 2025 and an interest rate of 3.375%.
12. FINANCIAL ASSETS MEASURED AT COST - 2017
December 31,
2017 Non-current Foreign unlisted ordinary shares $ 18,398 Domestic unlisted ordinary shares 7,435 $ 25,833 Classified according to financial asset measurement categories
Available-for-sale financial assets $ 25,833 Management believed that the above unlisted equity investments held by the Group had fair values which cannot be reliably measured, because the range of reasonable fair value estimates was so significant. Therefore, they were measured at cost less impairment at the end of the reporting period. During 2017, the Group assessed that the financial assets of Dawning Leading Technology Inc. were not recoverable and recognized an impairment loss of $4,125 thousand.
13. DEBT INVESTMENTS WITH NO ACTIVE MARKET - 2017
December 31,
2017 Current Time deposits $ 100,000 Pledged fixed deposits 83,502 $ 183,502 Refer to Note 37 for information relating to bond investments with no active market pledged as security.

155
14. NOTES RECEIVABLE, TRADE RECEIVABLES AND OTHER RECEIVABLES December 31 2018 2017 Notes receivable $ 4,257 $ 4,720 Trade receivables 1,375,746 1,027,994 Less: Allowance for impairment loss (20,928) (23,123)
$ 1,359,075 $ 1,009,582
Other receivables Income tax refund receivable $ 26,955 $ - Factored accounts receivable (Note 35) 22,000 - Others 4,377 65,277 $ 53,332 $ 65,277 2018 The average credit period of sales of goods was 15-135 days. No interest was charged on trade receivables. where appropriate, as a means of mitigating the risk of financial loss from defaults. The Group adopted a policy of only dealing with entities that are rated the equivalent of investment grade or higher and obtaining sufficient collateral, where appropriate, as a means of mitigating the risk of financial loss from defaults. The Group uses other publicly available financial information or its own trading records to rate its major customers. The Group’s exposure and the credit ratings of its counterparties are continuously monitored. Credit exposure is controlled by counterparty limits that are reviewed and approved by the risk management committee annually. The Group applies the simplified approach to providing for expected credit losses prescribed by IFRS 9, which permits the use of lifetime expected loss provision for all trade receivables. The expected credit losses on trade receivables are estimated using a provision matrix by reference to past default experience of the debtor and an analysis of the debtor’s current financial position, adjusted for general economic conditions of the industry in which the debtors operate and an assessment of both the current as well as the forecasted direction of economic conditions at the reporting date. As the Group’s historical credit loss experience does not show significantly different loss patterns for different customer segments, the provision for loss allowance based on past due status is not further distinguished according to the Group’s different customer base. The Group writes off a trade receivable when there is information indicating that the debtor is in severe financial difficulty and there is no realistic prospect of recovery, e.g. when the debtor has been placed under liquidation. For trade receivables that have been written off, the Group continues to engage in enforcement activity to attempt to recover the receivables due. Where recoveries are made, these are recognized in profit or loss. The following table details the loss allowance of trade receivables based on the Group’s provision matrix. December 31, 2018
Not Past Due Less than 60 Days 61 to 90 Days Over 90 Days
Total
Gross carrying amount $ 1,287,015 $ 77,056 $ 3,729 $ 7,946 $ 1,375,746 Loss allowance (Lifetime ECLs) (1,336) (11,218) (428) (7,946) (20,928) Amortized cost $ 1,285,679 $ 65,838 $ 3,301 $ - $ 1,354,818

156
The movements of the loss allowance of trade receivables were as follows: 2018 Balance at January 1, 2018 per IAS 39 $ 23,132 Adjustment on retrospective application of IFRS 9 - Balance at January 1, 2018 and December 31, 2018 per IFRS 9 23,132 Less: Impairment loss for the current year (2,204) Balance at December 31 $ 20,928 Compared with January 1, 2018, the total carrying amount of accounts receivable as of December 31, 2018 increased by a net amount of $347,752 thousand, and the loss allowance reduced by $2,204 thousand, which was due to the good collection situation and changes in accounts receivable of different risk groups. 2017 The Group applied the same credit policy in 2018 and 2017. Interest is not accrued on accounts receivable. In determining the recoverability of accounts receivable, the Group considers any change in the credit quality of accounts receivable from the date of original credit to the date of balance sheet. Allowance for doubtful debt for impairment loss was based on the estimated irrecoverable amounts determined by reference to past default experience of the counterparties and an analysis of their current financial position. For some trade receivables balances that were past due at the end of the reporting period, the Group did not recognize an allowance for impairment loss because there was no significant change in credit quality and the amounts were still considered recoverable. The Group did not hold any collateral or other credit enhancements for these balances. The accounts receivable aging schedule were as follows:
December 31,
2017 Not past due $ 1,011,961 Up to 60 days 9,626 61-90 days 59 Over 90 day 6,348 Total $ 1,207,994 The above aging schedule was based on the number of past due days from the end of the credit term. The movements of the allowance for doubtful trade receivables were as follows:
Individually Assessed for Impairment
Collectively Assessed for Impairment Total
Balance at January 1, 2017 $ 11,353 $ 23,635 $ 34,988 Add: bad debt expense - 74 74 Less: Reversal of bad debt expense (1,067) (10,863) (11,930) Balance at December 31, 2017 $ 10,286 $ 12,846 $ 23,132
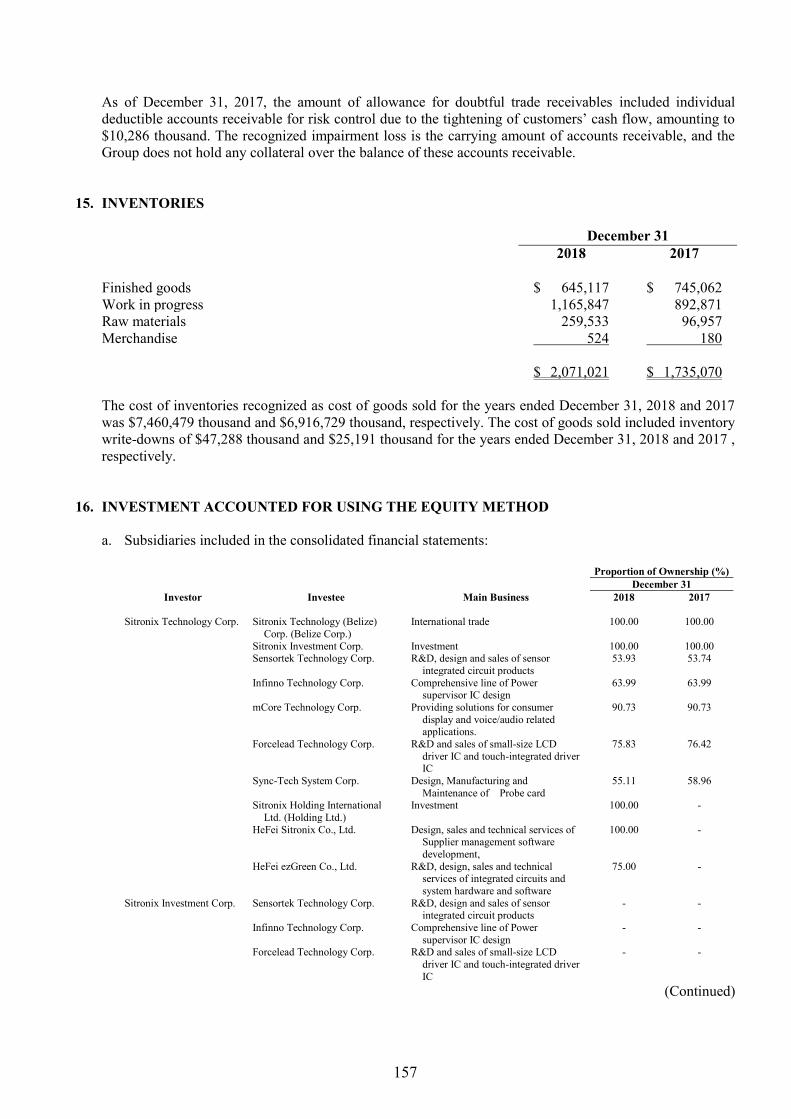
157
As of December 31, 2017, the amount of allowance for doubtful trade receivables included individual deductible accounts receivable for risk control due to the tightening of customers’ cash flow, amounting to $10,286 thousand. The recognized impairment loss is the carrying amount of accounts receivable, and the Group does not hold any collateral over the balance of these accounts receivable.
15. INVENTORIES
December 31 2018 2017 Finished goods $ 645,117 $ 745,062 Work in progress 1,165,847 892,871 Raw materials 259,533 96,957 Merchandise 524 180 $ 2,071,021 $ 1,735,070 The cost of inventories recognized as cost of goods sold for the years ended December 31, 2018 and 2017 was $7,460,479 thousand and $6,916,729 thousand, respectively. The cost of goods sold included inventory write-downs of $47,288 thousand and $25,191 thousand for the years ended December 31, 2018 and 2017 , respectively.
16. INVESTMENT ACCOUNTED FOR USING THE EQUITY METHOD
a. Subsidiaries included in the consolidated financial statements:
Proportion of Ownership (%) December 31
Investor Investee Main Business 2018 2017 Sitronix Technology Corp. Sitronix Technology (Belize)
Corp. (Belize Corp.) International trade
100.00 100.00
Sitronix Investment Corp. Investment 100.00 100.00 Sensortek Technology Corp.
R&D, design and sales of sensor
integrated circuit products 53.93 53.74
Infinno Technology Corp. Comprehensive line of Power supervisor IC design
63.99 63.99
mCore Technology Corp. Providing solutions for consumer display and voice/audio related applications.
90.73 90.73
Forcelead Technology Corp. R&D and sales of small-size LCD driver IC and touch-integrated driver IC
75.83 76.42
Sync-Tech System Corp. Design, Manufacturing and Maintenance of Probe card
55.11 58.96
Sitronix Holding International Ltd. (Holding Ltd.)
Investment 100.00 -
HeFei Sitronix Co., Ltd.
Design, sales and technical services of Supplier management software development,
100.00 -
HeFei ezGreen Co., Ltd.
R&D, design, sales and technical services of integrated circuits and system hardware and software
75.00 -
Sitronix Investment Corp. Sensortek Technology Corp. R&D, design and sales of sensor integrated circuit products
- -
Infinno Technology Corp. Comprehensive line of Power supervisor IC design
- -
Forcelead Technology Corp. R&D and sales of small-size LCD driver IC and touch-integrated driver IC
- -
(Continued)

158
Proportion of Ownership (%) December 31
Investor Investee Main Business 2018 2017 Belize Corp. Sitronix Technology (Mauritius)
Corp. (Mauritius Corp.) International trade
100.00 100.00
Mauritius Corp. Sitronix Technology (Shenzhen) Co., Ltd.
Computer software and hardware development, sales and after-sales service business and related technical consulting services
100.00 100.00
(Concluded) The financial statements of the above subsidiaries included in the consolidated financial statements for the years ended December 31, 2018 and 2017 have been audited. On April 13, 2018, the Group invested in Holding Ltd., and its proportion of ownership is 100%. On May 2, 2018, the Group invested in HeFei ezGreen Co., Ltd. and HeFei Sitronix Co., Ltd., with proportions of ownership of 100% and 75%, respectively.
Refer to Notes 32 for information relating to equity transactions with non-controlling interests.
b. Details of subsidiaries that have material non-controlling interests
Proportion of Ownership and Voting Rights Held by
Non-controlling Interests Principal Place of December 31
Name of Subsidiary Business 2018 2017 Sensortek Technology Corp. Taiwan 46.07% 46.26% Infinno Technology Corp. Taiwan 36.01% 36.01% Forcelead Technology Corp. Taiwan 24.17% 23.58% Sync-Tech System Corp. Taiwan 44.89% 41.04%
Profit (Loss) Allocated to
Non-controlling Interests Accumulated Non-controlling
Interests For the Year Ended December 31
Name of Subsidiary 2018 2017 2018 2017 Sensortek Technology Corp. $ 150,373 $ 3,017 $ 267,934 $ 119,780 Infinno Technology Corp. 4 (6,107) 28,530 28,526 Forcelead Technology Corp. 15,374 25,257 124,979 122,550 Sync-Tech System Corp. 5,315 (6,257) 49,129 38,463 Others 2,391 2,166 22,834 9,266 Total $ 173,457 $ 18,076 $ 493,406 $ 318,585

159
Summarized financial information in respect of each of the Group’s subsidiaries that has material non-controlling interests is set out below. The summarized financial information below represents amounts before intragroup eliminations.
December 31 2018 2017
Current assets $ 2,207,134 $ 1,329,819 Non-current assets 159,438 149,990 Current liabilities (934,705) (470,792) Non-current liabilities (144,361) (57,296) Equity $ 1,287,506 $ 951,721
For the Year Ended December 31 2018 2017
Revenue $ 3,063,591 $ 1,972,242 Profit for the year $ 403,062 $ 52,043 Other comprehensive income for the year - - Total comprehensive income for the year $ 403,062 $ 52,043 Profit attributable to:
Owners of Company $ 231,996 $ 36,133 Non-controlling interests of the subsidiaries 171,066 15,910
$ 403,062 $ 52,043 Total comprehensive income attributable to:
Owners of Company $ 231,996 $ 36,133 Non-controlling interests of the subsidiaries 171,066 15,910
$ 403,062 $ 52,043 Net cash inflow (outflow) from: Operating activities $ 415,585 $ (94,147) Investing activities (123,400) (104,974) Financing activities 57,606 (31,459) Effects of exchange rate changes on the balance of cash and cash
equivalents held in foreign currencies
5,047
(10,497) Net cash inflow (outflow) $ 354,838 $ (241,077) Dividends paid to non-controlling interests $ 18,843 $ 49,607

160
17. PROPERTY, PLANT AND EQUIPMENT
Freehold Land Buildings Machinery Equipment
Test Equipment
Office Equipment Total
Cost Balance at January 1,2017 $ 153,508 $ 549,476 $ 69,157 $ 687,996 $ 10,412 $ 1,470,549 Additions - 60 21,223 173,750 332 195,365 Disposals - - (1,132 ) (153,063) - (154,195 ) Effect of foreign currency exchange
differences - (27 )
-
-
(39 )
(66 ) Reclassified (27,966 ) (84,341 ) - - - (112,307 ) Balance at December 31, 2017 $ 125,542 $ 465,168 $ 89,248 $ 708,683 $ 10,705 $ 1,399,346 Accumulated depreciation Balance at January 1,2017 $ - $ 106,320 $ 32,760 $ 458,843 $ 8,933 $ 606,856 Additions - 16,405 13,543 132,818 1,083 163,849 Disposals - - (696 ) (151,792 ) - (152,488 ) Effect of foreign currency exchange
differences - (25 ) - - (26 ) (51 ) Reclassified - (965 ) - - - - (965 ) Balance at December 31, 2017 $ - $ 121,735 $ 45,607 $ 439,869 $ 9,990 $ 617,201 Balance at January 1, 2017 $ 153,508 $ 443,156 $ 36,397 $ 229,153 $ 1,479 $ 863,693 Carrying amount at December 31,
2017 $ 125,542 $ 343,433
$ 43,641
$ 268,814
$ 715
$ 782,145 Cost Balance at January 1,2018 $ 125,542 $ 465,168 $ 89,248 $ 708,683 $ 10,705 $ 1,399,346 Additions - 17,243 23,938 175,167 1,544 217,892 Disposals - (5,427 ) (824 ) (191,498 ) (205 ) (197,954 ) Effect of foreign currency exchange
differences - (51 ) - - (834 ) (885 ) Balance at December 31, 2018 $ 125,542 $ 476,933 $ 112,362 $ 692,352 $ 11,210 $ 1,418,399 Accumulated depreciation Balance at January 1,2018 $ - $ 121,735 $ 45,607 $ 439,869 $ 9,990 $ 617,201 Additions - 15,117 15,659 157,803 981 189,560 Disposals - (5,427 ) (705 ) (191,498 ) (205 ) (197,835 ) Effect of foreign currency exchange
differences - (50 ) - - (781 ) (831 ) Balance at December 31, 2018 $ - $ 131,375 $ 60,561 $ 406,174 $ 9,985 $ 608,095 Balance at January 1, 2018 $ 125,542 $ 343,433 $ 43,641 $ 268,814 $ 715 $ 782,415 Carrying amount at December 31,
2018 $ 125,542 $ 345,558 $ 51,801 $ 286,178 $ 1,225 $ 810,304
The Group’s of property, plant and equipment are depreciated on a straight-line basis over their estimated useful lives as follows: Buildings
Main buildings 50 years Renovation construction 5 years
Machinery equipment 3-6 years Test equipment 3-6 years Office equipment 5-6 years

161
18. INVESTMENT PROPERTIES
Land Buildings Total Cost Balance at January 1, 2017 $ 97,979 $ 155,582 $ 253,561 Reclassified 27,966 84,341 112,307 Balance at December 31, 2017 $ 125,945 $ 239,923 $ 365,868 Accumulated depreciation Balance at January 1, 2017 $ - $ 25,597 $ 25,597 Depreciation expense - 4,029 4,029 Reclassified - 965 965 Balance at December 31, 2017 $ - $ 30,591 $ 30,591 Balance at January 1,2017 $ 97,979 $ 129,985 $ 227,964 Carrying amount at
December 31, 2017 $ 125,945 $ 209,332 $ 335,277 Cost Balance at January 1 and December 31, 2018 $ 125,945 $ 239,923 $ 365,868 Accumulated depreciation Balance at January 1, 2018 $ - $ 30,591 $ 30,591 Depreciation expense - 4,718 4,718 Balance at December 31, 2018 $ - $ 35,309 $ 35,309 Balance at January 1,2018 $ 125,945 $ 209,332 $ 335,277 Carrying amount at December 31, 2018 $ 125,945 $ 204,614 $ 330,559
Investment properties are depreciated using the straight-line method over their estimated useful lives as follows: Main buildings 50 years The determination of fair values of the Group’s investment properties was performed by independent qualified professional vaulters of the China Real Estate Appraising Firm using Level 3 inputs. The evaluation is based on the weighted average of the income method and the market comparison method. The significant unobservable input used include the discount rate, and the fair values as appraised are as follows:
December 31 2018 2017
Fair value $ 494,153 $ 491,784
All of the Group’s investment properties were held under freehold interests.

162
19. INTANGIBLE ASSETS
Royalty Computer Software Total
Cost Balance at January 1, 2017 $ 95,954 $ 22,573 $ 118,527 Additions 4,134 31,274 35,408 Disposals (520) - (520) Effect of foreign currency exchange differences - (9) (9) Balance at December 31, 2017 $ 99,568 $ 53,838 $ 153,406 Accumulated amortization Balance at January 1, 2017 $ 55,317 $ 18,430 $ 73,747 Additions 12,557 11,815 24,392 Disposals (520) - (520) Effect of foreign currency exchange differences - (2) (2) Balance at December 31, 2017 $ 67,374 $ 30,243 $ 97,617 Balance at January 1, 2017 $ 40,637 $ 4,143 $ 44,780 Carrying amount at December 31, 2017 $ 32,194 $ 23,595 $ 55,789 Cost Balance at January 1, 2018 $ 99,568 $ 53,838 $ 153,406 Additions 5,032 16,229 21,261 Disposals (3,445) (1,740) (5,185) Effect of foreign currency exchange differences - (5) (5) Balance at December 31, 2018 $ 101,155 $ 68,322 $ 169,477 Accumulated amortization Balance at January 1, 2018 $ 67,374 $ 30,243 $ 97,617 Additions 11,975 17,202 29,177 Disposals (3,445) (1,740) (5,185) Effect of foreign currency exchange differences - (7) (7) Balance at December 31, 2018 $ 75,904 $ 45,698 $ 121,602 Balance at January 1, 2018 $ 32,194 $ 23,595 $ 55,789 Carrying amount at December 31, 2018 $ 25,251 $ 22,624 $ 47,875 Intangible assets are amortized on a straight-line basis over their estimated useful lives as follows: Royalty 2-10 years Computer software 2-5 years

163
20. OTHER ASSETS
December 31 2018 2017 Current Provisional payments $ 10,898 $ 3,117 Others 1,640 2,728 $ 12,538 $ 5,845 Non-current Refundable deposits $ 9,229 $ 8,783 Prepayments for equipment 514 - $ 9,743 $ 8,783
21. BORROWINGS
a. Short-term borrowings
December 31 2018 2017 Short-term unsecured borrowings Bank loans $ 476,168 $ 20,220 The range of weighted average effective interest rates on bank loans was 1.50%-2.88% and 1.25%-2.59% as of December 31, 2018 and 2017, respectively.
22. TRADE PAYABLES
December 31 2018 2017 Trade payables $ 1,560,675 $ 1,141,166
The credit period for trade payable is 20-90 days. The Group has financial risk management policies in place to ensure that all payables are paid within the pre-agreed credit terms.

164
23. OTHER LIABILITIES
December 31 2018 2017 Current Other payables
Payables for salaries $ 323,432 $ 344,635 Payables for research 60,641 33,135 Others 137,181 94,642
$ 521,254 $ 472,412 Other liabilities
Temporary receipts $ 19,246 $ 12,700 Contract liabilities 18,069 - Others 5,435 4,795
$ 42,750 $ 17,495
24. PROVISIONS
December 31 2018 2017 Current Customer returns and rebates $ - $ 5,089 The provision for customer returns and rebates was based on historical experience, management’s judgments and other known reasons estimated product returns and rebates may occur in the year. The provision was recognized as a reduction of operating income in the year the related goods were sold.
25. RETIREMENT BENEFIT PLANS
a. Defined contribution plans
The Group adopted a pension plan under the Labor Pension Act (the LPA), which is a state-managed defined contribution plan. Under the LPA, the Group makes monthly contributions to employees’ individual pension accounts at 6% of monthly salaries and wages.
b. Defined benefit plans The defined benefit plan adopted by the Group in accordance with the Labor Standards Law is operated by the government. Pension benefits are calculated on the basis of the length of service and average monthly salaries of the 6 months before retirement. The Group contributes amounts equal to 2% of total monthly salaries and wages to a pension fund administered by the pension fund monitoring committee. Pension contributions are deposited in the Bank of Taiwan in the committee’s name. Before the end of each year, the Group assesses the balance in the pension fund. If the amount of the balance in the pension fund is inadequate to pay retirement benefits for employees who conform to retirement requirements in the next year, the Group is required to fund the difference in one appropriation that should be made before the end of March of the next year. The pension fund is managed by the Bureau
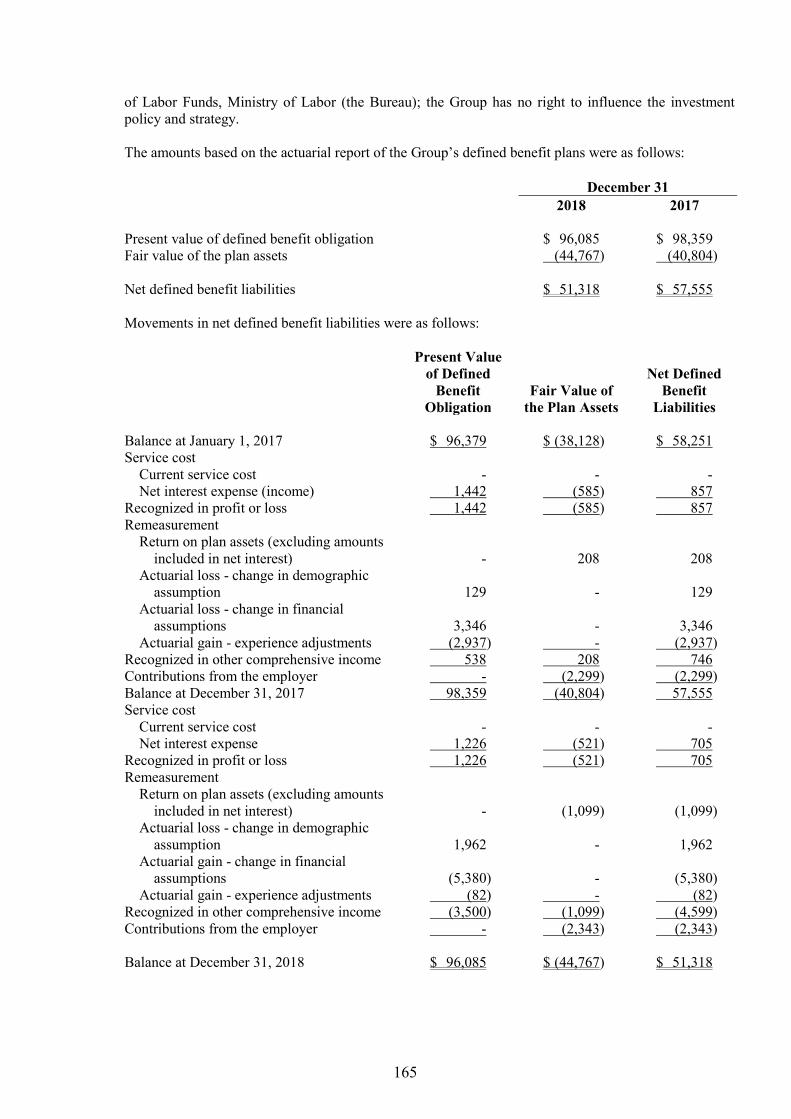
165
of Labor Funds, Ministry of Labor (the Bureau); the Group has no right to influence the investment policy and strategy. The amounts based on the actuarial report of the Group’s defined benefit plans were as follows: December 31 2018 2017 Present value of defined benefit obligation $ 96,085 $ 98,359 Fair value of the plan assets (44,767) (40,804) Net defined benefit liabilities $ 51,318 $ 57,555 Movements in net defined benefit liabilities were as follows:
Present Value of Defined
Benefit Obligation
Fair Value of the Plan Assets
Net Defined
Benefit Liabilities
Balance at January 1, 2017 $ 96,379 $ (38,128) $ 58,251 Service cost
Current service cost - - - Net interest expense (income) 1,442 (585) 857
Recognized in profit or loss 1,442 (585) 857 Remeasurement
Return on plan assets (excluding amounts included in net interest)
- 208
208
Actuarial loss - change in demographic assumption
129 -
129
Actuarial loss - change in financial assumptions
3,346 -
3,346
Actuarial gain - experience adjustments (2,937) - (2,937) Recognized in other comprehensive income 538 208 746 Contributions from the employer - (2,299) (2,299) Balance at December 31, 2017 98,359 (40,804) 57,555 Service cost
Current service cost - - - Net interest expense 1,226 (521) 705
Recognized in profit or loss 1,226 (521) 705 Remeasurement
Return on plan assets (excluding amounts included in net interest)
- (1,099)
(1,099)
Actuarial loss - change in demographic assumption
1,962 -
1,962
Actuarial gain - change in financial assumptions
(5,380) -
(5,380)
Actuarial gain - experience adjustments (82) - (82) Recognized in other comprehensive income (3,500) (1,099) (4,599) Contributions from the employer - (2,343) (2,343) Balance at December 31, 2018 $ 96,085 $ (44,767) $ 51,318

166
An analysis by function of the amounts recognized in profit or loss in respect of the defined benefit plans is as follows: For the Year Ended December 31 2018 2017 Operating costs $ - $ - Selling and marketing expenses 87 104 General and administrative expenses 168 188 Research and development expenses 450 565 $ 705 $ 857 Through the defined benefit plans under the Labor Standards Law, the Group is exposed to the following risks: 1) Investment risk: The plan assets are invested in domestic and foreign/ equity and debt securities,
bank deposits, etc. The investment is conducted at the discretion of the Bureau or under the mandated management. However, in accordance with relevant regulations, the return generated by plan assets should not be below the interest rate for a 2-year time deposit with local banks.
2) Interest risk: A decrease in the government bond interest rate will increase the present value of the
defined benefit obligation; however, this will be partially offset by an increase in the return on the plan’s debt investments.
3) Salary risk: The present value of the defined benefit obligation is calculated by reference to the
future salaries of plan participants. As such, an increase in the salary of the plan participants will increase the present value of the defined benefit obligation.
The actuarial valuations of the present value of the defined benefit obligation were carried out by qualified actuaries. The significant assumptions used for the purposes of the actuarial valuations were as follows: December 31 2018 2017 Discount rate 1.00% 1.25% Expected rate of salary increase 4.30% 5.00% If possible reasonable change in each of the significant actuarial assumptions will occur and all other assumptions will remain constant, the present value of the defined benefit obligation would increase (decrease) as follows: For the Year Ended December 31 2018 2017 Discount rate
0.25% increase $ (3,070) $ (3,351) 0.25% decrease $ 3,204 $ 3,503
Expected rate of salary increase 0.25% increase $ 3,093 $ 3,367 0.25% decrease $ (2,982) $ (3,241)

167
The sensitivity analysis presented above may not be representative of the actual change in the present value of the defined benefit obligation as it is unlikely that the change in assumptions would occur in isolation of one another as some of the assumptions may be correlated. December 31 2018 2017 The expected contributions to the plan for the next year $ 2,341 $ 2,303 The average duration of the defined benefit obligation 12 years 13 years
26. EQUITY
a. Share capital
December 31 2018 2017 Number of shares authorized (in thousands) 200,000 200,000 Share capital $ 2,000,000 $ 2,000,000 Number of shares issued and fully paid (in thousands) 120,223 120,518 Shares issued $ 1,202,226 $ 1,205,176 Fully paid ordinary shares, which have a par value of $10, carry one vote per share and carry a right to dividends. The authorized shares include 20,000 thousand shares reserved for the exercise of employee stock options. The changes in the Group's share capital are mainly due to the cancellation of the newly issued restricted shares as the new shares did not meet the required conditions.
b. Capital surplus
December 31 2018 2017 May be used to offset a deficit, distributed as cash dividends, or transferred to share capital (1) Issuance of ordinary shares $ 278,773 $ 278,773 Conversion of bonds 335,041 335,041 May be used to offset a deficit only Issuance of ordinary shares 69,595 53,633 Changes in percentage of ownership interests in subsidiaries (2) 16,255 13,241 May not be used for any purpose Employee restricted shares 61,640 105,187 $ 761,304 $ 785,875
168
1) Such capital surplus may be used to offset a deficit; in addition, when the Company has no deficit, such capital surplus may be distributed as cash dividends or transferred to share capital.
2) Such capital surplus arises from the effect of changes in ownership interests in subsidiaries resulting
from equity transactions other than actual disposals or acquisitions, or from changes in capital surplus of subsidiaries accounted for using the equity method.
c. Retained earnings and dividend policy
Under the dividends policy as set forth in the amended Articles, where the Company made a profit in a fiscal year, the profit shall be distributed in the following order: 1) Utilized for paying taxes. 2) Offsetting losses of previous years. 3) Setting aside as a legal reserve of 10% of the remaining profit (legal reserve that has reached the
company’s paid-in capital is not subject to this condition ). 4) Setting aside or reversing a special reserve in accordance with the laws and regulations. 5) Any remaining profit together with any undistributed retained earnings shall be used by the
Company’s board of directors as the basis for proposing a distribution plan, which should be resolved in the shareholders’ meeting for the distribution of dividends and bonuses to shareholders.
For the policies on the distribution of employees’ compensation and remuneration of directors and supervisors after the amendment, refer to employees’ compensation and remuneration of directors and supervisors in Notes 28(f). The distribution of dividends to shareholders of the company can be made in cash or shares, but the proportion of cash dividends distributed should not be less than 10% of the total dividends distributed. The dividends policy is dependent on the Company's current and future investment environment, capital needs, domestic and international competition and capital budget, etc., taking into account the interests of shareholders, balance of dividends and long-term financial planning of the Company, the board of directors plans to distribute the case to the shareholders' meeting. An appropriation of earnings to a legal reserve shall be made until the legal reserve equals the Company’s paid-in capital. The legal reserve may be used to offset deficits. If the Company has no deficit and the legal reserve has exceeded 25% of the Company’s paid-in capital, the excess may be transferred to capital or distributed in cash. Items referred to under Rule No. 1010012865, Rule No. 1010047490 and Rule No. 1030006415 issued by the FSC and in the directive titled “Questions and Answers for Special Reserves Appropriated Following Adoption of IFRSs” should be appropriated to or reversed from a special reserve by the Company.
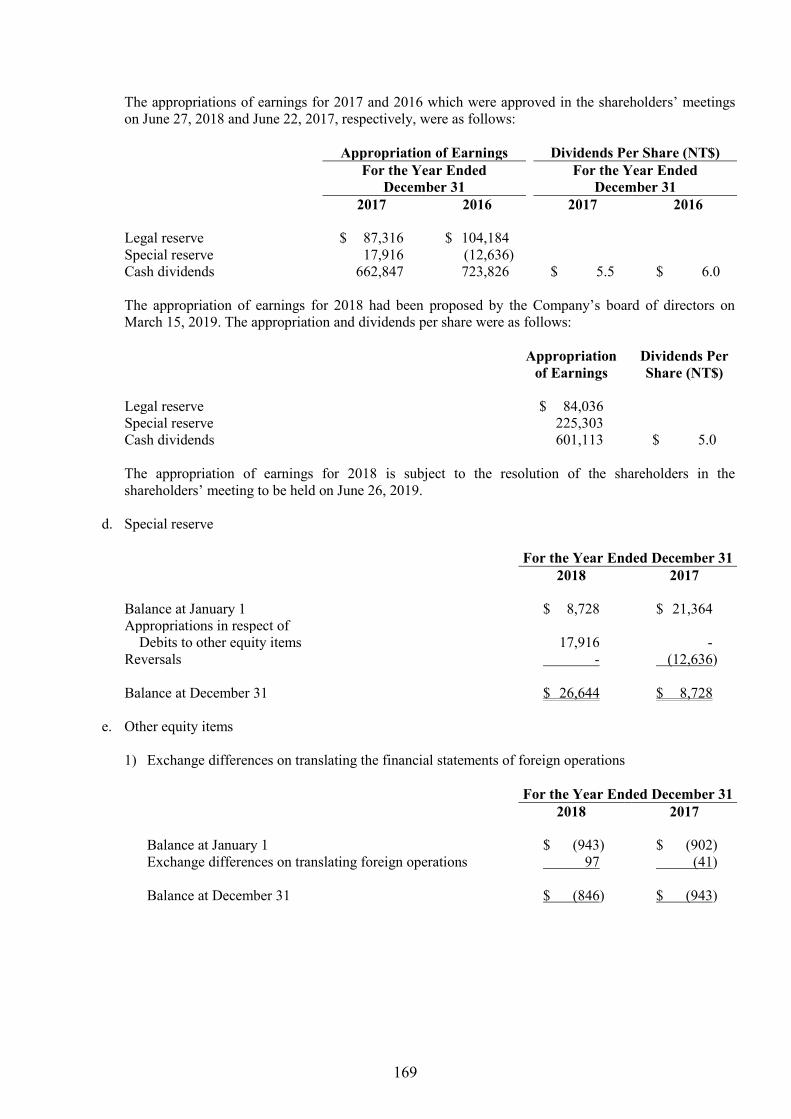
169
The appropriations of earnings for 2017 and 2016 which were approved in the shareholders’ meetings on June 27, 2018 and June 22, 2017, respectively, were as follows: Appropriation of Earnings Dividends Per Share (NT$)
For the Year Ended
December 31 For the Year Ended
December 31 2017 2016 2017 2016 Legal reserve $ 87,316 $ 104,184 Special reserve 17,916 (12,636) Cash dividends 662,847 723,826 $ 5.5 $ 6.0 The appropriation of earnings for 2018 had been proposed by the Company’s board of directors on March 15, 2019. The appropriation and dividends per share were as follows:
Appropriation
of Earnings Dividends Per Share (NT$)
Legal reserve $ 84,036 Special reserve 225,303 Cash dividends 601,113 $ 5.0 The appropriation of earnings for 2018 is subject to the resolution of the shareholders in the shareholders’ meeting to be held on June 26, 2019.
d. Special reserve
For the Year Ended December 31 2018 2017 Balance at January 1 $ 8,728 $ 21,364 Appropriations in respect of
Debits to other equity items 17,916 - Reversals - (12,636) Balance at December 31 $ 26,644 $ 8,728
e. Other equity items 1) Exchange differences on translating the financial statements of foreign operations
For the Year Ended December 31 2018 2017 Balance at January 1 $ (943) $ (902) Exchange differences on translating foreign operations 97 (41) Balance at December 31 $ (846) $ (943)

170
2) Unrealized gain (loss) on available-for-sale financial assets Balance at January 1, 2017 $ (7,826) Unrealized gain (loss) from available-for-sale financial assets (5,688) Cumulative gain (loss) reclassified to profit or loss upon disposal of
available-for-sale financial assets (12,187) Balance at December 31, 2017 $ (25,701) Balance at January 1, 2018 per IAS 39 $ (25,701) Adjustment on retrospective application of IFRS 9 25,701 Balance at January 1, 2018 per IFRS 9 $ -
3) Unrealized gain (loss) on financial assets at FVTOCI
For the Year Ended
December 31, 2018
Balance at January 1 per IAS 39 $ - Adjustment on retrospective application of IFRS 9 (106,936) Balance at January 1 per IFRS 9 (106,936) Recognized for the year
Unrealized gain (loss) - debt instruments 218 Unrealized gain (loss) - equity instruments (147,430)
Cumulative unrealized gain (loss) of equity instruments transferred to retained earnings due to disposal 3,047
Balance at December 31 $ (251,101)
4) Unearned employee benefits
For the Year Ended December 31 2018 2017 Balance at January 1 $ (50,850) $ (120,394) (Reversal) of share-based payment expenses recognized (5,337) 57,124 Retirement of restricted shares for employees 30,535 12,420 Balance at December 31 $ (25,652) $ (50,850)

171
f. Non-controlling interests
For the Year Ended December 31 2018 2017 Balance at January 1 $ 318,585 $ 329,150 Share attributable to non-controlling interests:
Share in profit for the year 173,457 18,076 Exchange difference on translating the financial statements of
foreign operations (538) - Cash dividends distributed by subsidiaries (18,843) (49,607) Changes in non-controlling interests in the current period 20,745 20,966 Balance at December 31 $ 493,406 $ 318,585
27. REVENUE
a. Disaggregation of revenue
For the Year Ended December 31 2018 2017 Product Integrated circuit $ 10,172,277 $ 9,322,740 Others 158,228 108,322 $ 10,330,505 $ 9,413,062 Primary geographical markets Hong Kong $ 8,847,013 $ 7,976,834 Taiwan 730,627 805,321 China 480,686 414,563 Others 272,179 234,344 $ 10,330,505 $ 9,431,062 The basis of calculation of the Group’s revenue segregated by geographical location is mainly based on the location the goods were shipped.
b. Contract balances
For the Year Ended December 31 2018 2017 Accounts receivable (Note 14) $ 1,354,818 $ 1,004,862
For the Year Ended
December 31, 2018
Contract liabilities - current (Note 23)
Sales of goods $ 18,069

172
28. NET PROFIT (LOSS) FROM CONTINUING OPERATIONS
a. Other income
For the Year Ended December 31
2018 2017
Interest income $ 25,151 $ 40,250 Rental income 14,319 12,978 Dividend income 9,603 10,337 Others 16,001 2,868
$ 65,074 $ 66,433
b. Other gains and losses
For the Year Ended December 31 2018 2017
Gain (loss) on financial assets designated as at FVTPL $ 15,700 $ (3,611) Net foreign exchange gains (losses) 13,430 (11,787) Impairment loss on financial assets - (4,125) Gain disposal of available-for-sale financial assets - 95,874 Other losses (5,521) (4,195) $ 23,609 $ 72,156
c. Finance costs
For the Year Ended December 31
2018 2017
Interest on loans $ 9,267 $ 3,858 d. Depreciation and amortization
For the Year Ended December 31 2018 2017
Property, plant and equipment $ 189,560 $ 163,849 Investment properties 4,718 4,029 Intangible assets 29,177 24,392 $ 223,455 $ 192,270 An analysis of depreciation by function
Operating expenses $ 171,086 $ 150,356 Operating costs 18,474 13,493
$ 189,560 $ 163,849
(Continued)

173
For the Year Ended December 31 2018 2017
An analysis of amortization by function
General and administrative expenses $ 2,577 $ 2,645 Research and development expenses 26,600 21,747
$ 29,177 $ 24,392
(Concluded)
e. Employee benefits expense
For the Year Ended December 31 2018 2017
Short-term benefits $ 1,237,154 $ 1,109,949 Post-employment benefits (Note 25)
Defined contribution plans 36,432 39,668 Defined benefit plans 726 865
Share-based payments Equity-settled (5,206) 57,314
Total employee benefits expense $ 1,269,106 $ 1,207,796 An analysis of employee benefits expense by function
Operating costs $ 1,214,365 $ 1,159,226 Operating expenses 54,741 48,570
$ 1,269,106 $ 1,207,796
f. Employees’ compensation and remuneration of directors
According to the Articles of Incorporation of the Group, the Group accrued employees’ compensation and remuneration of directors and supervisors at rates of no less than 1% and no higher than 25%, and rates of no higher than 3%, respectively, of net profit before income tax, employees’ compensation, and remuneration of directors and supervisors. The Group estimated employees’ compensation was $75,633 thousand and $78,584 thousand and remuneration of directors and supervisors was $22,690 thousand and $23,575 thousand as of December 31, 2018 and 2017, respectively. The employees’ compensation and the remuneration of directors and supervisors for the years ended December 31, 2018 and 2017, which were approved by the Group’s board of directors on March 15, 2019 and March 15, 2018, respectively, are as follows: Amount For the Year Ended December 31 2018 2017 Cash Shares Cash Shares Employees’ compensation $ 75,633 $ - $ 78,584 $ - Remuneration of directors and
supervisors 22,690 - 23,575 - If there is a change in the amounts after the annual consolidated financial statements were authorized

174
for issue, the differences are recorded as a change in the accounting estimate. There is no difference between the actual amounts of employees’ compensation and remuneration of directors and supervisors paid and the amounts recognized in the consolidated financial statements for the years ended December 31, 2018 and 2017. Information on the employees’ compensation and remuneration of directors resolved by the Group’s board of directors in 2018 and 2017 is available at the Market Observation Post System website of the Taiwan Stock Exchange.
g. Gains or losses on foreign currency exchange
For the Year Ended December 31 2018 2017
Foreign exchange gains $ 190,866 $ 152,021 Foreign exchange losses (177,436) (163,808) Net gains (losses) $ 13,430 $ (11,787)
29. INCOME TAXES RELATING TO CONTINUING OPERATIONS
a. Major components of income tax expense recognized in profit or loss:
For the Year Ended December 31 2018 2017
Current tax In respect of the current year $ 121,944 $ 101,869 Income tax on unappropriated earnings - 411 Adjustments for prior years (13,868) (5,365) 108,076 96,915
Deferred tax In respect of the current year 34 119
Income tax expense recognized in profit or loss $ 108,110 $ 97,034 A reconciliation of accounting profit and income tax expenses is as follows: For the Year Ended December 31 2018 2017 Profit before tax from continuing operations $ 1,121,930 $ 988,268 Income tax expense calculated at the statutory rate $ 274,758 $ 185,718 Non-deductible expenses in determining taxable income (56,313) (38,899) Tax-exempt income (78,912) (37,915) Income tax on unappropriated earnings - 411 Impact of the temporary differences (8,180) (6,791) Effects of investment credits (3,031) (125) Unrecognized tax-deductible loss (6,344) - Adjustments for prior years’ tax (13,868) (5,365) Income tax expense recognized in profit or loss $ 108,110 $ 97,034 In 2017, the applicable corporate income tax rate used by the group entities in the ROC was 17%.

175
However, the Income Tax Act in the ROC was amended in 2018, and the corporate income tax rate was adjusted from 17% to 20%, effective in 2018. In addition, the rate of the corporate surtax applicable to the 2018 unappropriated earnings will be reduced from 10% to 5%. The applicable tax rate used by the subsidiaries in China is 25% Tax rates used by other group entities operating in other jurisdictions are based on the tax laws in those jurisdictions. As the status of the 2019 appropriations of earnings is uncertain, the potential income tax consequences of 5% of the 2018 unappropriated earnings are not reliably determinable.
b. Current tax liabilities
December 31 2018 2017 Current tax liabilities
Income tax payable $ 142,911 $ 117,025 c. Deferred tax liabilities
The movements of deferred tax liabilities were as follows:
For the year ended December 31, 2017
Deferred Tax liabilities Opening Balance
Recognized in Profit or Loss Closing Balance
Temporary differences $ 457 $ 119 $ 576 For the year ended December 31, 2018
Deferred Tax liabilities Opening Balance
Recognized in Profit or Loss Closing Balance
Temporary differences $ 576 $ 34 $ 610
d. Deductible temporary differences for which no deferred assets have been recognized in the parent company only balance sheets
December 31 2018 2017 Deductible temporary differences $ 161,872 $ 162,321
e. The tax exemption periods for the Group’s manufacture of high-order integrated circuit design-SOC,
LCD Driver IC and other products are as follows:
Sitronix Technology Corp.
Expansion of Construction Project Tax-exemption Period The eighth issuance of shares 2015.01.01-2018.09.30 The ninth issuance of shares 2016.01.01-2019.11.30

176
Sensortek Technology Corp.
Expansion of Construction Project Tax-exemption Period The first issuance of shares 2016.01.01-2020.12.31
Forcelead Technology Corp.
Expansion of Construction Project Tax-exemption Period The first issuance of shares 2015.01.01-2019.12.31
f. Information on unrecognized deferred income tax liabilities associated with investments
As of December 31, 2018 and 2017, there were no recognized taxable temporary differences associated with investments in subsidiaries and branches for which no deferred tax liabilities were recognized.
g Income tax assessments
The Group’s tax returns through 2016 have been assessed by the tax authorities. 30. EARNINGS PER SHARE
Unit: NT$ Per Share
For the Year Ended December 31 2018 2017 Basic earnings per share $ 7.03 $ 7.32 Diluted earnings per share $ 6.94 $ 7.22 The earnings and weighted average number of ordinary shares outstanding used in the computation of earnings per share are as follows: Net Income for the Year
For the Year Ended December 31 2018 2017 Net Income for the year $ 840,363 $ 873,158 Earnings used in the computation of basic earnings per share $ 840,363 $ 873,158 Effect of potentially dilutive ordinary shares
Employee restricted stock - - Employees’ compensation - -
Earnings used in the computation of diluted earnings per share $ 840,363 $ 873,158

177
Weighted average number of ordinary shares outstanding (in thousands of shares):
For the Year Ended December 31 2018 2017 Weighted average number of ordinary shares in computation of basic
earnings per share
119,461 119,241 Effect of potentially dilutive ordinary shares:
Employee restricted stock 660 604 Employees’ compensation 930 1,130
Weighted average number of ordinary shares used in the
computation of diluted earnings per share
121,051
120,975 Since the Company offered to settle compensation or bonuses paid to employees in cash or shares, the Company assumed the entire amount of the compensation or bonus will be settled in shares and the resulting potential shares were included in the weighted average number of shares outstanding used in the computation of diluted earnings per share, as the effect is dilutive. Such dilutive effect of the potential shares is included in the computation of diluted earnings per share until the number of shares to be distributed to employees is resolved in the following year.
31. SHARE-BASED PAYMENT ARRANGEMENTS
Employee restricted stock awards
In the shareholders’ meeting on June 22, 2016, the shareholders approved a restricted share plan for employees with a total amount of $15,000 thousand, consisting of 1,500 thousand shares. The aforementioned resolution was made effective by the FSC on July 15, 2016. The board of directors of the Company approved the issuance of 1,500 thousand shares of restricted stock awards to employees in their meeting on August 5, 2016 totaling $15,000 thousand, with face value of $10 for each share, and the price of each share was NT$0 (that is, free of charge). The dates of issuance and distribution were both August 5, 2016, and the fair value of the shares on the date of distribution was $103.5 After the employees have been awarded the restricted stock awards, if they remain employed by the Company at the end of the vesting periods in the table below, did not breach any laws, labor contracts, work rules, work regulations and other agreements with the Group, and achieved the Group’s set of business objectives, the maximum number of shares awarded will be based on the proportions in the table below, however, the actual proportion awarded will be based on the attainment of the Company’s operating goals:
Vesting period Proportions
Remain employed by the Company within one year 25% Remain employed by the Company within two year 30% Remain employed by the Company within three year 45% The restrictions the employees are subject to before the aforementioned conditions are met are as follows: a. According to the trust agreement, after the employee acquired the new shares, the employee cannot sell,
mortgage, transfer, donate, pledge, no objection to the right to buy, or other way due to disposal before the vested condition is reached. However, if there are other norms in this measure, they shall be regulated.

178
b. The attendance, proposals, speeches, and voting rights of the shareholders’ meeting shall be executed by the trust custodian institution according to law.
c. Employee restricted stock, after the new shares are issued, they should be immediately delivered to the
trust, and the employee must not ask the trustee for any reason or manner to receive the return of the employee's rights to new shares before the vested condition is reached.
d. The new shares issued by the Company that restrict employee rights shall be handled in the form of
stock trusts, and the company or the person designated by the company shall sign and revise the trust related contracts on behalf of all the assigned employees. Before the vested condition is reached, if the employee terminates or terminates the agent’s authorization to deliver the trust in violation of the above-mentioned provisions, the company has the right to withdraw the shares and cancel the loss to the employee at no charge.
Relevant information on new shares of restricted employee rights issued is as follows:
Number of Shares
(In Thousands of Shares) 2018 2017 Balance at January 1 1,125 1,500 Vested (171) (255) Cancelled (295) (120) Balance at December 31 659 1,125 Compensation costs recognized (reversed) were $(5,337) thousand and $57,124 thousand for the years ended December 31, 2018 and 2017, respectively. Sensortek Technology Corp. issuance of employee stock option certificates
On May 2, 2017, the board of directors of Sensortek Technology Corp. approved the issuance of 3,000 thousand units of employee stock option certificates, each unit of stock option certificate can be exchanged for 1 share of common stock. The stock option certificates can be issued all at once or split into several issues, the actual issuance date is to be fixed by the Chairman. Eligible employees are limited to full-time employees within Sensortek Technology Corp. The holder of the stock option certificates can exercise the options at any time after the date of issuance. Sensortek Technology Corp. gave its employees 2,919 thousand units of employee stock option certificates in June 27, 2017. Information about employee stock option certificates is as follows:
For the Year Ended December 31, 2017
Number of Shares
(In Thousands)
Weighted- average
Exercise Price (NT$)
Balance at January 1 - $ - Options granted 2,919 11.00 Options exercised (2,893) 11.00 Options forfeited (26) 11.00 Balance at December 31 -

179
As of the balance sheet date, Sensortek Technology Corp. did not have any outstanding employee stock option certificates. Sensortek Technology Corp. used the Black-Scholes option pricing evaluation model for its employee stock option on June 27,2017, and the input values are as follows:
June 2017 Grant-date share price (NT$) $ 8.49 Exercise price (NT$) $ 11.00 Expected volatility 26.26% Expected life (in years) 39 days Expected dividend yield - Risk-free interest rate 0.38% The market price of the stock on the date of issuance was based on the market approach, and the expected volatility is calculated on the basis of the historical stock price information of similar companies. The cost of remuneration recognized by the Sensortek Technology Corp. was $0 in 2017. Sync-Tech System Corp.’s issuance of employee stock option certificates On December 9, 2015, the board of directors of Sync-Tech System Corp. approved the issuance of 3,000 thousand units of employee stock option certificates, each unit of stock option certificate can be exchanged for 1 share of common stock. The stock option certificates can be issued all at once or split into several issues, the actual issuance date is to be fixed by the Chairman. Eligible employees are limited to full-time employees within Sync-Tech System Corp. The holder of the stock option certificates can exercise the options at any time after the date of issuance. Sync-Tech System Corp. distributed 257 thousand units of employee stock option certificates to employees on November, 7 2017. Information on employee stock option certificates is summarized as follows:
For the Year Ended December 31, 2017
Number of Shares
(In Thousands)
Weighted- average
Exercise Price (NT$)
Balance at January 1 - $ - Options granted 257 10.00 Options exercised (257) 10.00 Balance at December 31 - - The date of grant of employee stock option certificates was November 7, 2017, and the Black-Scholes option pricing model was used to calculate the fair values, the input values used in the option pricing model are as follows:
November 2017 Grant date share price (NT$) $ 5.80 Exercise price (NT$) $ 10.00 Expected volatility rate 32.42% Option life (in years) 5 years Dividend yield - Risk-free interest rate 0.69%

180
Sync-Tech System Corp. distributed 279 thousand units of employee stock option certificates to employees on November 13, 2018. Information on employee stock option certificates is summarized as follows:
For the Year Ended December 31, 2018
Number of Shares
(In Thousands)
Weighted- average
Exercise Price (NT$)
Balance at January 1 - $ - Options granted 279 10.00 Options exercised (279) 10.00 Balance at December 31 - - The date of grant of employee stock option certificates was November 13, 2018, and the Black-Scholes option pricing model was used to calculate the fair values, the input values used in the option pricing model are as follows:
November 2018 Grant date share price (NT$) $ 4.93 Exercise price (NT$) $ 10.00 Expected volatility rate 32.66% Option life (in years) 5 years Dividend yield - Risk-free interest rate 0.80% The remuneration costs of Sync-Tech System Corp.’s employee stock option schemes for 2018 and 2017 were $131 thousand and $190 thousand, respectively.
32. PARTIAL ACQUISITION OR DISPOSAL OF SUBSIDIARIES - WITHOUT LOSS OF CONTROL In January 2017, the Group subscribed for additional new shares of Infinno Technology Corp. at a percentage different from its existing ownership percentage, increasing its continuing interest from 45.76% to 63.99%. In January 2017, the Group subscribed for additional new shares of mCore Technology Corp. at a percentage different from its existing ownership percentage, increasing its continuing interest from 87.12% to 90.73%. Due to the distribution of employees’ compensation in the form of shares by Forcelead Technoloy Corp. in July 2017 and the purchase of some of their shares in November 2017, the Group’s shareholdings increased from 68.09% to 76.42%. In August 2018, due to the distribution of employees’ compensation in the form of shares by Forcelead Technoloy Corp., the Group’s shareholding ratio decreased from 76.42% to 75.83%. In August 2017, due to the distribution of employees’ compensation in the form of shares and implementation of employee stock option certificates by Sensortek Technology Corp., the Group’s shareholdings decreased from 61.41% to 53.74%. In April and October 2018, as the Group repurchased some of the shares from Sensortek Technology Corp. and in May 2018, the Group distributed employees’ compensation in the form of shares, the shareholding ratio increased from 53.74% to 53.93%.

181
In December 2017, due to the execution of new shares of Sync-Tech system Corp. employees, the shareholding ratio decreased from 59.87% to 58.96%. In November and December 2018, due to partial disposal of Sync-Tech’s shares and the execution of employee stock options, the shareholding ratio decreased from 58.96% to 55.11%. The Group invested in HeFei Sitronix Co., Ltd. on May, 2018, with a shareholding ratio of 75%. The above transactions were accounted for as equity transactions, since the Group did not cease to have control over these subsidiaries. 2018 Sensortek
Technology Corp.
Forcelead Technology
CORP. Sync-Tech
System Corp. HeFei Sitronix
Corp. Cash consideration paid $ (1,155) $ - $ - $ - Cash consideration received - - 7,790 11,715 Non-cash transaction 1,195 4,013 131 - The proportionate share of the
carrying amount of the net assets of the subsidiary transferred to (from) non-controlling interests
26
(3,705) (5,351)
(11,715) Differences recognized from equity
transactions
$ 66 $ 308
$ 2,570 $ - Line items adjusted for equity transactions
Capital surplus - changes in
percentage of ownership interests in subsidiaries
$ 136 $ 308 $ 2,570 $ - Retained earnings $ (70) $ - $ - $ - 2017
Infinno Technology
Corp.
mCore Technology
Corp.
Sensortek Technology
Corp.
Forcelead Technology
Corp. Sync-Tech
System Corp. Cash consideration paid $ - $ - $ - $ (238,226) $ - Cash consideration received 119 57 31,817 - 2,570 Non-cash transaction - - 1,162 27,764 190 The proportionate share of the
carrying amount of the net assets of the subsidiary transferred to (from) non-controlling interests
(20,877)
(1,172) (31,620)
34,661
(1,958) Differences recognized from
equity transactions
$ (20,758) $ (1,115)
$ 1,359 $ (175,801)
$ 802 (Continued)
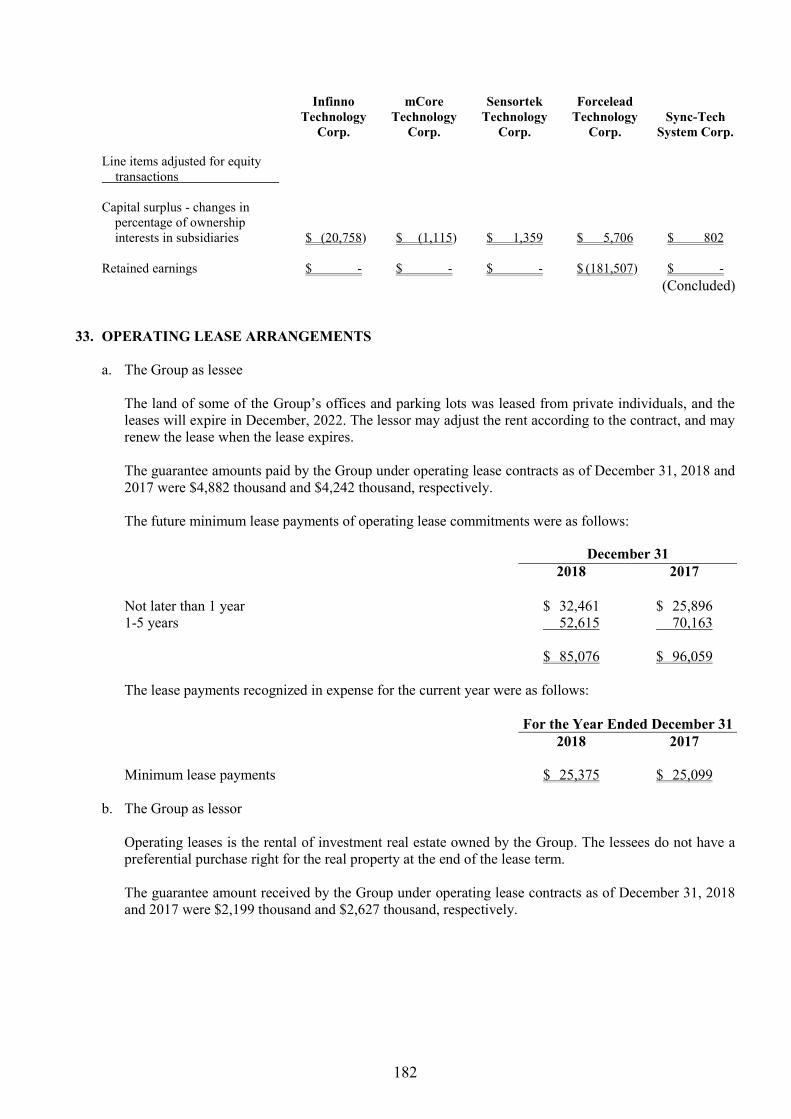
182
Infinno Technology
Corp.
mCore Technology
Corp.
Sensortek Technology
Corp.
Forcelead Technology
Corp. Sync-Tech
System Corp. Line items adjusted for equity transactions
Capital surplus - changes in
percentage of ownership interests in subsidiaries
$ (20,758) $ (1,115) $ 1,359 $ 5,706
$ 802 Retained earnings $ - $ - $ - $ (181,507) $ -
(Concluded)
33. OPERATING LEASE ARRANGEMENTS
a. The Group as lessee
The land of some of the Group’s offices and parking lots was leased from private individuals, and the leases will expire in December, 2022. The lessor may adjust the rent according to the contract, and may renew the lease when the lease expires. The guarantee amounts paid by the Group under operating lease contracts as of December 31, 2018 and 2017 were $4,882 thousand and $4,242 thousand, respectively. The future minimum lease payments of operating lease commitments were as follows: December 31 2018 2017 Not later than 1 year $ 32,461 $ 25,896 1-5 years 52,615 70,163 $ 85,076 $ 96,059 The lease payments recognized in expense for the current year were as follows: For the Year Ended December 31 2018 2017 Minimum lease payments $ 25,375 $ 25,099
b. The Group as lessor Operating leases is the rental of investment real estate owned by the Group. The lessees do not have a preferential purchase right for the real property at the end of the lease term. The guarantee amount received by the Group under operating lease contracts as of December 31, 2018 and 2017 were $2,199 thousand and $2,627 thousand, respectively.

183
The future minimum lease payments of operating lease commitments were as follows: December 31 2018 2017 Not later than 1 year $ 7,346 $ 9,613 Over 1 year 12,073 19,095 $ 19,419 $ 28,708
34. CAPITAL MANAGEMENT
The Group manages its capital to ensure that the Group will be able to continue as going concerns while maximizing the return to shareholders through the optimization of the debt and equity balance. The capital structure of the Group consists of net debt (borrowings offset by cash and cash equivalents) and equity attributable to owners of the Group (comprising issued capital, reserves, retained earnings and other equity). The Group is not subject to any externally imposed capital requirements.
35. FINANCIAL INSTRUMENTS
a. Fair value of financial instruments not measured at fair value
The management considers that the carrying amounts of financial assets and financial liabilities recognized in the financial statements approximate their fair values or their fair values cannot be reliably measured.
b. Fair value of financial instruments measured at fair value on a recurring basis
1) Fair value hierarchy
December 31, 2018 Level 1 Level 2 Level 3 Total Financial assets at FVTPL Derivative financial assets $ - $ 168 $ - $ 168 Domestic listed shares 32,698 - - 32,698 Domestic corporate funds 31,045 - - 31,045 Convertible bond asset swaps - 81,270 - 81,270 Convertible bonds - 75,620 - 75,620
$ 63,743 $ 157,058 $ - $ 220,801
(Continued)

184
Level 1 Level 2 Level 3 Total
Financial assets at FVTOCI
Investments in equity instruments at FVTOCI
Domestic listed shares $ 187,259 $ - $ - $ 187,259 Foreign unlisted shares - - 30,961 30,961 Foreign unlisted equity
investments - - 588,146 588,146 Investments in debt instruments
at FVTOCI Foreign corporate bonds 44,473 - - 44,473
$ 231,732 $ - $ 619,107 $ 850,839
Financial liabilities at FVTPL
Derivatives $ - $ 1,262 $ - $ 1,262 (Concluded)
December 31, 2017 Level 1 Level 2 Level 3 Total Financial assets at FVTPL Non-derivative financial assets
held for trading $ 159,379 $ - $ - $ 159,379 Financial assets designated as at
FVTPL - 151,938 - 151,938 $ 159,379 $ 151,938 $ - $ 311,317
Available-for-sale financial assets Equity investments-securities
listed in the ROC $ 143,155 $ - $ - $ 143,155 Domestic mutual fund 8,215 - - 8,215 Foreign mutual fund 60,125 - 688,649 748,774 Investments in debt instruments 32,686 53,000 - 85,686
$ 244,181 $ 53,000 $ 688,649 $ 985,830
Financial liabilities at FVTPL Derivatives $ - $ 480 $ - $ 480 There were no transfers between Level 1 and Level 2 in 2018 and 2017.

185
2) Valuation techniques and inputs applied for Level 2 fair value measurement
Financial Instruments Valuation Techniques and Inputs Convertible bonds Based on the public market quotes provided by third-party
agencies. Convertible bond asset swaps Based on the public market quotation of convertible bond, the
parameters of the repurchase, the coupon interest and the interest compensation are considered as the basis for fair value measurement.
Derivatives - foreign exchange forward contracts and Cross-currency swap contracts
Discounted cash flow method: Estimate the future cash flow at the end of the period by
observing the forward exchange rate and the exchange rate and interest rate set by the contract, and have already discounted the discount rate of each counterparty's credit risk.
3) Valuation techniques and inputs applied for Level 3 fair value measurement
Foreign unlisted (OTC) equity investments are evaluated by the method of net asset value. The management of the Group evaluates the target of such equity investments with the open market quotation, and the net asset amount tends to the fair value of the equity investments.
4) Adjustment of financial instruments measured using Level 3 fair values The Group's financial assets under level 3 fair value measurement are equity instruments measured at fair value through other comprehensive income.
For the year ended December 31, 2018
For the Year Ended
December 31, 2018
Balance at January 1, 2018 $ 714,482 Additions 30,704 Disposals (2,038) Recognized under other comprehensive income (124,041) Balance at December 31, 2018 $ 619,107
c. Categories of financial instruments
December 31 2018 2017 Financial assets Financial assets at FVTPL
Held for trading $ - $ 159,379 Mandatorily classified as at FVTPL 220,801 - Designated as at FVTPL - 151,938
Held-to-maturity investments - 30,499 (Continued)

186
December 31 2018 2017 Loans and receivables (1) $ - $ 2,686,091 Available-for-sale financial assets (2) - 1,011,663 Financial assets at amortized cost (3) 3,898,890 - Financial assets at FVTOCI
Equity instruments 806,366 - Debt instruments 44,473 -
Financial liabilities Financial liabilities at FVTPL
Held for trading 1262 480 Financial liabilities at amortized cost (4) 2,595,412 1,650,304
(Concluded)
1) The balances include loans and receivables measured at amortized cost, which comprise cash and cash equivalents, debt investments with no active market, trade and other receivables, other receivables and other current assets.
2) The balances include the carrying amount of available-for-sale financial assets measured at cost. 3) The balances include financial assets at amortized cost, which comprise cash and cash equivalents,
debt investments, time deposits with original maturity of more than 3 months, pledge fixed deposit, notes receivable and trade receivables (including receivables from related parties), other receivables, other current assets and refundable deposits.
4) The balances include financial liabilities at amortized cost, which comprise short-term borrowings,
accounts payable, payables to related parties, other payables and other current liabilities. d. Financial risk management objectives and policies
The Group’s major financial instruments include equity and debt investments, trade receivables, trade payables and borrowings. The Group’s Corporate Treasury function provides services to the business, coordinates access to domestic and international financial markets, monitors and manages the financial risks relating to the operations of the Group through internal risk reports which analyze exposures by degree and magnitude of risks. These risks include market risk (including foreign currency risk, interest rate risk and other price risk), credit risk and liquidity risk. The Group seeks to minimize the effects of these risks by using derivative financial instruments to hedge risk exposures. The use of financial derivatives is governed by the Group’s policies approved by the board of directors, which provided written principles on foreign currency risk, interest rate risk, credit risk, the use of financial derivatives and non-derivative financial instruments, and the investment of excess liquidity. Compliance with policies and exposure limits is reviewed by the internal auditors on a continuous basis. The Group did not enter into or trade financial instruments, including derivative financial instruments, for speculative purposes. 1) Market risk
The Group’s activities exposed it primarily to the financial risks of changes in foreign currency exchange rates (see (a) below) and interest rates (see (b) below). The Group entered into a variety of derivative financial instruments to manage its exposure to foreign currency risk and interest rate risk.

187
There has been no change in the risk of financial instruments in the Group of companies and the way in which they are managed and measured. a) Foreign currency risk
The Group’s operating activities are partially denominated in foreign currencies and apply natural hedge. The carrying amounts of the Group’s foreign currency denominated monetary assets and monetary liabilities (including those eliminated on consolidation) and of the derivatives exposed to foreign currency risk at the end of the reporting period are set out in Note 38.
Sensitivity analysis
The Group was mainly exposed to the USD, JPY and CNY. The following table details the Group’s sensitivity to a 5% increase and decrease in the New Taiwan dollars (i.e. the functional currency) against the relevant foreign currencies. The sensitivity analysis included only outstanding foreign currency denominated monetary items, and adjusts their translation at the end of the reporting period for a 5% change in foreign currency rates. A positive number below indicates an increase in pre-tax profit and other equity associated with the New Taiwan dollar strengthening 5% against the relevant currency. For a 5% weakening of the New Taiwan dollar against the relevant currency, there would be an equal and opposite impact on pre-tax profit and other equity, and the balances below would be negative. USD Impact JPY Impact CNY Impact
For the Year Ended
December 31 For the Year Ended
December 31 For the Year Ended
December 31 2018 2017 2018 2017 2018 2017
Profit or loss $ (9,900 ) $ 40,462 $ (32) $ 469 $ 3,074 $ 53
b) Interest rate risk
The Group was exposed to interest rate risk because the Group borrowed funds at both fixed and floating interest rates. The carrying amounts of the Group’s financial assets and financial liabilities with exposure to interest rates at the end of the reporting period were as follows: December 31 2018 2017 Fair value interest rate risk
Financial assets $ 2,006,507 $ 825,838 Cash flow interest rate risk
Financial assets 429,515 776,992 Financial liabilities 476,168 20,220
Sensitivity analysis The sensitivity analysis below was determined based on the Group’s exposure to interest rates for both derivative and non-derivative instruments at the end of the reporting period. For floating rate liabilities, the analysis was prepared assuming the amount of each liability outstanding at the end of the reporting period was outstanding for the whole year.
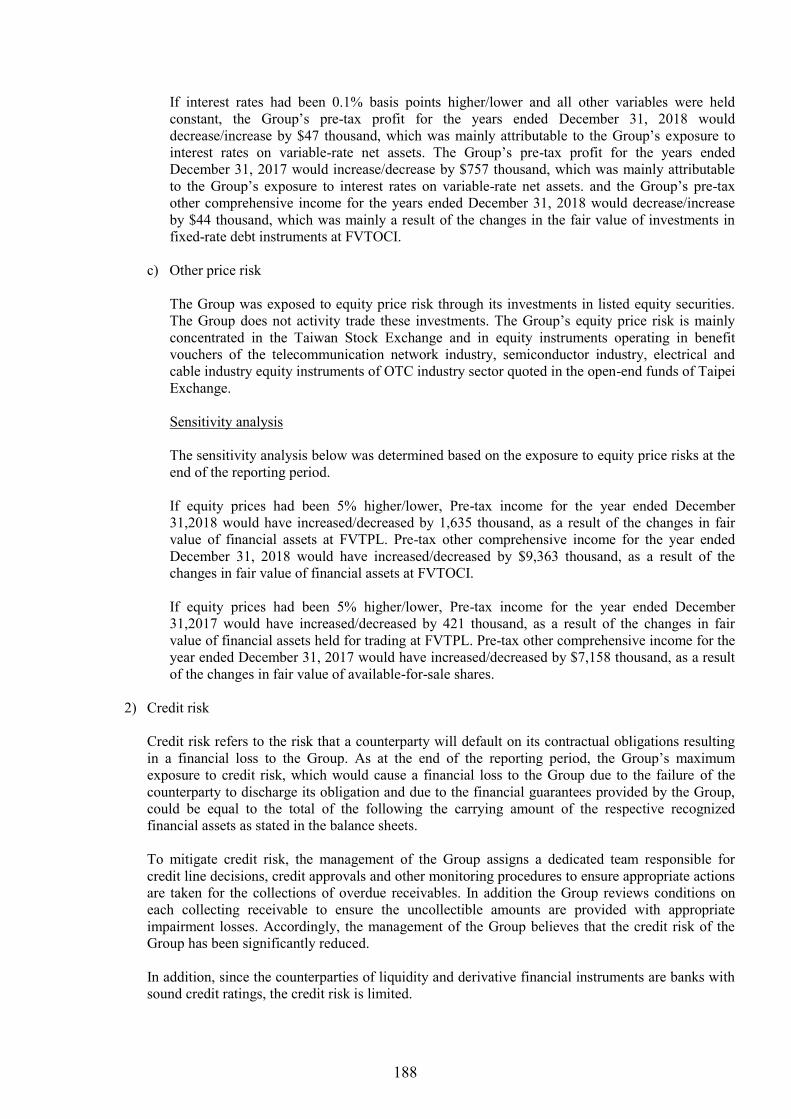
188
If interest rates had been 0.1% basis points higher/lower and all other variables were held constant, the Group’s pre-tax profit for the years ended December 31, 2018 would decrease/increase by $47 thousand, which was mainly attributable to the Group’s exposure to interest rates on variable-rate net assets. The Group’s pre-tax profit for the years ended December 31, 2017 would increase/decrease by $757 thousand, which was mainly attributable to the Group’s exposure to interest rates on variable-rate net assets. and the Group’s pre-tax other comprehensive income for the years ended December 31, 2018 would decrease/increase by $44 thousand, which was mainly a result of the changes in the fair value of investments in fixed-rate debt instruments at FVTOCI.
c) Other price risk
The Group was exposed to equity price risk through its investments in listed equity securities. The Group does not activity trade these investments. The Group’s equity price risk is mainly concentrated in the Taiwan Stock Exchange and in equity instruments operating in benefit vouchers of the telecommunication network industry, semiconductor industry, electrical and cable industry equity instruments of OTC industry sector quoted in the open-end funds of Taipei Exchange. Sensitivity analysis The sensitivity analysis below was determined based on the exposure to equity price risks at the end of the reporting period. If equity prices had been 5% higher/lower, Pre-tax income for the year ended December 31,2018 would have increased/decreased by 1,635 thousand, as a result of the changes in fair value of financial assets at FVTPL. Pre-tax other comprehensive income for the year ended December 31, 2018 would have increased/decreased by $9,363 thousand, as a result of the changes in fair value of financial assets at FVTOCI. If equity prices had been 5% higher/lower, Pre-tax income for the year ended December 31,2017 would have increased/decreased by 421 thousand, as a result of the changes in fair value of financial assets held for trading at FVTPL. Pre-tax other comprehensive income for the year ended December 31, 2017 would have increased/decreased by $7,158 thousand, as a result of the changes in fair value of available-for-sale shares.
2) Credit risk
Credit risk refers to the risk that a counterparty will default on its contractual obligations resulting in a financial loss to the Group. As at the end of the reporting period, the Group’s maximum exposure to credit risk, which would cause a financial loss to the Group due to the failure of the counterparty to discharge its obligation and due to the financial guarantees provided by the Group, could be equal to the total of the following the carrying amount of the respective recognized financial assets as stated in the balance sheets. To mitigate credit risk, the management of the Group assigns a dedicated team responsible for credit line decisions, credit approvals and other monitoring procedures to ensure appropriate actions are taken for the collections of overdue receivables. In addition the Group reviews conditions on each collecting receivable to ensure the uncollectible amounts are provided with appropriate impairment losses. Accordingly, the management of the Group believes that the credit risk of the Group has been significantly reduced. In addition, since the counterparties of liquidity and derivative financial instruments are banks with sound credit ratings, the credit risk is limited.

189
Apart from customers whose accounts receivable constitutes more than 10% of the Group’s total accounts receivable, the Group did not have significant credit risk exposure to any single counterparty or any group of counterparties having similar characteristics. The Group’s concentration of credit risk was 26% and 36% of total trade receivables as of December 31, 2018 and 2017, respectively.
3) Liquidity risk
The Group manages liquidity risk by monitoring and maintaining a level of cash and cash equivalents deemed adequate to finance the Group’s operations and mitigate the effects of fluctuations in cash flows. In addition, management monitors the utilization of bank borrowings and ensures compliance with loan covenants.
The Group relies on bank borrowings as a significant source of liquidity. As of December 31, 2018 and 2017, the Group had available unutilized short-term bank loan facilities set out in (c) below. a) Liquidity and interest rate risk tables for non-derivative financial liabilities
The following table details the Group’s remaining contractual maturities for its non-derivative financial liabilities with agreed repayment periods. The table has been drawn up based on the undiscounted cash flows of financial liabilities from the earliest date on which the Group can be required to pay. The table included both interest and principal cash flows. Specifically, bank loans with a repayment on demand clause were included in the earliest time band regardless of the probability of the banks choosing to exercise their rights. The maturity dates for other non-derivative financial liabilities were based on the agreed repayment dates. December 31, 2018
On Demand or Less than
1 Month 1-3 Months 3 Months to 1
Year 1-5 Years Total Non-derivative financial liabilities
Non-interest bearing liabilities $ 918,387 $ 950,082 $ 249,844 $ - $ 2,118,313 Variable interest rate liabilities 580 476,519 - - 477,099
December 31, 2017
On Demand or Less than
1 Month 1-3 Months 3 Months to 1
Year 1-5 Years Total Non-derivative financial liabilities
Non-interest bearing liabilities $ 765,047 $ 672,384 $ 92,641 $ - $ 1,630,072 Variable interest rate liabilities 12 12,220 8,000 - 20,232
The amounts included above for variable interest rate instruments for both non-derivative financial assets and liabilities were subject to change if changes in variable interest rates were to differ from those estimates of interest rates determined at the end of the reporting period.
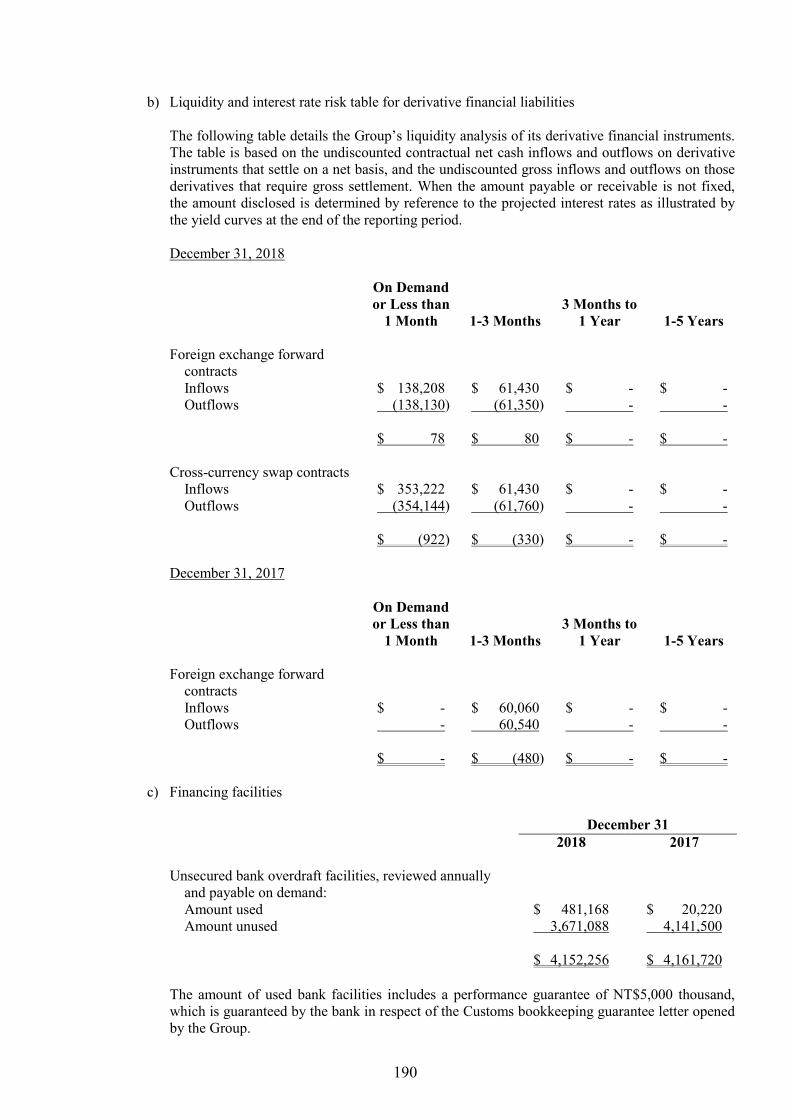
190
b) Liquidity and interest rate risk table for derivative financial liabilities
The following table details the Group’s liquidity analysis of its derivative financial instruments. The table is based on the undiscounted contractual net cash inflows and outflows on derivative instruments that settle on a net basis, and the undiscounted gross inflows and outflows on those derivatives that require gross settlement. When the amount payable or receivable is not fixed, the amount disclosed is determined by reference to the projected interest rates as illustrated by the yield curves at the end of the reporting period.
December 31, 2018
On Demand or Less than
1 Month 1-3 Months 3 Months to
1 Year 1-5 Years Foreign exchange forward
contracts Inflows $ 138,208 $ 61,430 $ - $ - Outflows (138,130) (61,350) - -
$ 78 $ 80 $ - $ - Cross-currency swap contracts
Inflows $ 353,222 $ 61,430 $ - $ - Outflows (354,144) (61,760) - -
$ (922) $ (330) $ - $ -
December 31, 2017
On Demand or Less than
1 Month 1-3 Months 3 Months to
1 Year 1-5 Years
Foreign exchange forward contracts Inflows $ - $ 60,060 $ - $ - Outflows - 60,540 - -
$ - $ (480) $ - $ -
c) Financing facilities
December 31 2018 2017 Unsecured bank overdraft facilities, reviewed annually
and payable on demand: Amount used $ 481,168 $ 20,220 Amount unused 3,671,088 4,141,500
$ 4,152,256 $ 4,161,720
The amount of used bank facilities includes a performance guarantee of NT$5,000 thousand, which is guaranteed by the bank in respect of the Customs bookkeeping guarantee letter opened by the Group.

191
The relevant information of the Group for the sale of accounts receivable is as follows: December 31, 2018
Counterparties Receivables
Sold Amounts Collected
Advances Received at Year-end
Interest Rates on Advances Received (%) Credit Line
Taipei Fubon Commercial
Bank $ 58,860 $ 36,860 $ - - USD 1,500
The above are revolving amounts. Under the terms of the contract for sale, losses arising from commercial disputes (such as return or discount of sales, etc.) shall be borne by the Group, and losses arising from credit risk shall be borne by such banks. The reserve amount for the factored accounts receivable are recognized under other receivables.
36. TRANSACTIONS WITH RELATED PARTIES
In addition to those disclosed in other notes, detail of transactions between the Group and related parties are disclosed below. a. Related party name and category
Related Party Name Related Party Category Silicon Power Computer & Communications
Inc. Related party in substance
Vincent Mao The Group’s key management personnel Wen Bin Lin The Group’s key management personnel Chun Sheng Lin The Group’s key management personnel I Hsi Cheng The Group’s key management personnel Wei Wang The Group’s key management personnel Shu Fang Xu The Group’s key management personnel Meng Huang Liu The Group’s key management personnel Zheng Long Jiang The Group’s key management personnel Xi Hao Zhong The Group’s key management personnel Min Huei Jhang The Group’s key management personnel Ru Hung Chen The Group’s key management personnel
b. Sales of goods
For the Year Ended December 31 Related Party Category 2018 2017
Substantial related party $ 37 $ -
The transactions for related parties were negotiated under the terms of general transactions and prices.

192
c. Rental income
For the Year Ended December 31 Related Party Category 2018 2017
Substantial related party $ 2,034 $ 2,034 The terms of transactions between the Group and its related parties for the collection of rent are based on the terms of the agreement as there are no comparable transactions for comparison.
d. Manufacturing expense
For the Year Ended December 31 Related Party Category 2018 2017
Substantial related party $ 1,995 $ 8,247
The payment of manufacturing expenses to related parties, the terms of the transaction are calculated according to the contract agreement.
e. Operating expenses
For the Year Ended December 31 Related Party Category 2018 2017
Substantial related party $ - $ 9 The transaction in which the Group makes payments of operating expenses to a related party is subject to a regular transaction and price.
f. Receivables from related parties
For the Year Ended December 31 Related Party Category Line Item 2018 2017
Substantial related party Accounts receivable from
related parties $ 39 $ -
The outstanding accounts receivable from related parties were unsecured. For year ended December 31, 2018, no impairment losses were recognized for accounts receivable from related parties.
g. Payables to related parties
For the Year Ended December 31
Related Party Category Line Item 2018 2017 Substantial related party Payables to related parties $ - $ 3,804 Other payables to related
parties - 2
$ - $ 3,806 There was no collateral pledged on the outstanding accounts payable to related parties.

193
h. Guarantee Deposits received
For the Year Ended December 31 Related Party Category 2018 2017
Substantial related party $ 356 $ 356 The above deposit margin for each related party is mainly generated by the lease deposit.
i. Property transactions
For the year ended December 31,2018
Related Party Category/Name Line Item Number of
Shares Underlying
Assets Purchase Price The Group’s key management
personnel Note 1,502,000 Securities-
FORCELEAD $ 84,112
A transaction in which the Group obtains financial assets from a related party is subject to a contractual agreement because there is no comparable transaction for comparison. (Note: Please refer to note 32.)
j. Compensation of key management personnel
For the Year Ended December 31 2018 2017
Short-term employee benefits $ 88,611 $ 90,564 Share-based payment (2,102) 22,507 Post-employment benefits 1,766 1,746 $ 88,275 $ 114,817 The remuneration of directors and key executives was determined by the remuneration committee based on the performance of individuals and market trends.
37. ASSETS PLEDGED AS COLLATERAL OR FOR SECURITY
The following assets were provided as collateral for long-term and short-term borrowings.
December 31,
2018 December 31,
2017 Pledged deposits $ 119,791 $ 83,502
Pledged deposits for 2018 are financial assets measured at amortized cost, and pledged deposits for 2017 are investments in debt instruments with no active market.

194
38. SIGNIFICANT ASSETS AND LIABILITIES DENOMINATED IN FOREIGN CURRENCIES The group entities’ significant financial assets and liabilities denominated in foreign currencies aggregated by the foreign currencies other than functional currencies and the related exchange rates between foreign currencies and respective functional currencies were as follows:
December 31 2018 2017
Foreign
Currency Exchange
Rate Foreign
Currency Exchange
Rate Financial assets Monetary items
USD $ 60,928 30.715 $ 64,185 29.76 RMB 13,749 4.472 233 4.565 JPY 90,782 0.2782 102,922 0.2642
Non-monetary items USD 20,653 30.715 27,902 29.76
Financial liabilities Monetary items
USD 67,374 30.715 36,993 29.76 JPY 93,115 0.2782 83,433 0.2642
The Group is mainly exposed to the USD and JPY. The following information was aggregated by the functional currencies of the group entities, and the exchange rates between the respective functional currencies and the presentation currency were disclosed. The significant realized and unrealized foreign exchange gains (losses) were as follows:
For the Year Ended December 31 2018 2017
Foreign Currencies Exchange Rate
Net Foreign Exchange Gains
(Losses) Exchange Rate
Net Foreign Exchange Gains
(Losses) NTD 1 (NTD:NTD) $ 13,405 1 (NTD:NTD) $ (11,787) RMB 4.472 (RMB:NTD) 25 4.565 (RMB:NTD) - $ 13,430 $ (11,787)
39. SEPARATELY DISCLOSED ITEMS a. Information on significant transactions and b. information on investees:
1) Financing provided to others: Table 1 (attached) 2) Endorsements/guarantees provided: Table 2 (attached) 3) Marketable securities held (excluding investment in subsidiaries): Table 3 (attached) 4) Marketable securities acquired or disposed of at costs or prices of at least NT$300 million or 20%
of the paid-in capital: None

195
5) Acquisition of individual real estate at costs of at least NT $300 million or 20% of the paid-in
capital: None
6) Disposal of individual real estate at prices of at least NT$300 million or 20% of the paid-in capital: None
7) Total purchases from or sales to related parties amounting to at least NT$100 million or 20% of the
paid-in capital: Table 4 (attached) 8) Receivables from related parties amounting to at least NT$100 million or 20% of the paid-in
capital: None 9) Trading in derivative instruments: Note 7 and Note 35. 10) Intercompany relationships and significant intercompany transactions: Table 5 (attached) 11) Information on investees: Table 6 (attached)
c. Information on investments in mainland China: Table 7 and 8 (attached)
In the preparation of consolidated financial statements, major transactions between parent and subsidiary companies and their balances have been fully eliminated.
40. SEGMENT INFORMATION
a. The operating decision makers of the Group use the distribution of resources and the evaluation of segment performance to focus on the financial information of the Group as a whole, while individual companies have similar economic characteristics, and individual companies have used similar processes to produce similar products and sell them through the same sales method, so the Company and its subsidiaries are reported by the single operating department. The Company and its subsidiaries provide the segment information reviewed by the operating decision maker on the same basis as the financial statements, and the profit and loss, assets and liabilities of the operating department are measured on the same basis as the combined financial Report preparation, Therefore, the segment income and operating results to be reported in 2018 and 2017 can be referenced by the combined consolidated income and loss Statement for 2018 and 2017. Segment assets that should be reported can be found in the consolidated balance sheets for the years ended December 31, 2018 and 2017.
b. Segment revenues and results The following was an analysis of the Group’s revenue and results from continuing operations by reportable segment. For the Year Ended December 31 2018 2017 IC design $ 10,172,277 $ 9,322,740 Other income 158,228 108,322
Total $ 10,330,505 $ 9,431,062

196
c. Geographical information The Group operates in two principal geographical areas - Taiwan and China. The Group’s net operating revenue from external customers by location of operations and information about its non-current assets by location of assets are detailed below.
Revenue from External
Customers
For the Year Ended Non-current Assets December 31 December 31
2018 2017 2018 2017 Taiwan $ 730,627 $ 805,321 $ 1,170,425 $ 1,172,144 Hong Kong 8,847,013 7,976,834 - - China 480,686 414,563 18,313 1,067 Others 272,179 234,344 - - $ 10,330,505 $ 9,431,062 $ 1,188,738 $ 1,173,211 Non-current assets exclude financial instruments and other tax assets.
d. Information about major customers Single customers who contributed 10% or more to the Group’s revenue were as follows:
For the Year Ended December 31 2018 2017
Amount Amount of
Total Sales
Amount Amount of
Total Sales Customer A $ 1,704,803 17 $ 1,777,886 19 Customer B 1,026,545 10 1,045,030 11

197
TABLE 1 SITRONIX TECHNOLOGY CORP. AND SUBSIDIARIES FINANCING PROVIDED TO OTHERS FOR THE YEAR ENDED DECEMBER 31, 2018 (In Thousands of New Taiwan Dollars, Unless Stated Otherwise)
No. Lender Borrower Financial Statement Account
Related Parties
Highest Balance for the Period
Ending Balance
Actual Amount
Borrowed Interest Rate Nature of
Financing
Business Transaction
Amounts
Reasons for Short-term Financing
Allowance for
Impairment Loss
Collateral Financing Limit for
Each Borrower
Aggregate Financing
Limits Item Value
0 The Company mCore Technology
Corp. Other receivables
from related parties
Yes $ 100,000 $ 100,000 $ - - For financing $ - Working capital
$ - - $ - $ 935,932 $ 1,871,864
Forcelead Technology Corp.
Other receivables from related parties
Yes 100,000 100,000 15,358 - For financing - Working capital
- - - 935,932 1,871,864
Infinno Technology Corp.
Other receivables from related parties
Yes 100,000 100,000 23,036 - For financing - Working capital
- - - 935,932 1,871,864
Sync-Tech System Corp.
Other receivables from related parties
Yes 100,000 100,000 44,072 - For financing - Working capital
- - - 935,932 1,871,864
Note 1: The description is as follows:
1. Lender is numbered as 0. 2. Investee is numbered sequentially from 1.
Note 2: According to the ”Financing providing and operation management method”, the total amount and the available amount to any individual for lending are as follows: 1. The total amount for lending shall not exceed forty percent of SITRONIX’s net worth. However the total amount lendable to any subsidiary for short-term financing could be up to the total available amount of the company. 2. The total amount for lending to any directly or indirectly owned foreign subsidiaries with 100% ownership shall not exceed forty percent of SITRONIX’s net worth. The total amount for lending to any individual shall not exceed fifty percent of the total
available amount 3. Where funds are lent to a company or business with business relationships with the Company, the total amount for lending to any individual shall not exceed the amount of business transaction between the two parties. Amount of business transaction defines
the highest amount of purchase or sales. 4. The total amount for lending to any individual shall not exceed 50% of the Group's net worth for the Company or firm that needs short-term financing.

198
TABLE 2 SITRONIX TECHNOLOGY CORP AND SUBSIDIARIES ENDORSEMENTS/GUARANTEES PROVIDED FOR THE YEAR ENDED DECEMBER 31, 2018 (In Thousands of New Taiwan Dollars, Unless Stated Otherwise)
No. Endorser/Guarantor
Endorsee/Guarantee Limit on
Endorsement/ Guarantee Given on Behalf of Each
Party (Note 2)
Maximum Amount
Endorsed/ Guaranteed
During the Period
Outstanding Endorsement/
Guarantee at the End of the Period
Actual Amount Borrowed
Amount Endorsed/
Guaranteed by Collateral
Ratio of Accumulated Endorsement/
Guarantee to Net Equity in Latest
Financial Statements (%)
Aggregate Endorsement/
Guarantee Limit (Note 2)
Endorsement/ Guarantee Given
by Parent on Behalf of
Subsidiaries
Endorsement/ Guarantee Given by Subsidiaries on Behalf of Parent
Endorsement/ Guarantee Given
on Behalf of Companies in
Mainland China
Name Relationship
0 The Company Forcelead
Technology Corp.
Subsidiary $ 2,339,830 $ 300,000 $ 300,000 $ 92,145 $ - 6.37 $ 2,339,830 Yes - -
Sensortek Technology Corp.
Subsidiary 2,339,830 400,000 400,000 107,503 - 8.50 2,339,830 Yes - -
Sync-Tech System Corp
Subsidiary 2,339,830 100,000 100,000 35,000 - 2.12 2,339,830 Yes - -
mCore Technology Corp.
Subsidiary 2,339,830 100,000 100,000 19,737 - 2.12 2,339,830 Yes - -
Infinno Technology Corp.
Subsidiary 2,339,830 100,000 100,000 9,214 - 2.12 2,339,830 Yes - -
HeFei Sitronix Co., Ltd.
Subsidiary 2,339,830 100,000 100,000 25,586 - 2.12 2,339,830 Yes - Yes
Note 1: The description is as follows
1. Lender is numbered as 0. 2. Investee is numbered sequentially from 1.
Note 2: According to the "endorsement guarantee operation management measures" of Sitronix Technology Corp. the total amount of endorsement guarantee shall not exceed 50% of the net financial statements of the most recent year by the accountant's visa verification. The amount of endorsement guarantee for a single enterprise shall not exceed 25% of the net value of the financial statements of the most recent year by the accountant's verification visa. However, the amount of endorsement guarantee for a company that directly and indirectly holds more than 50% of the voting shares of the Company shall not exceed 50% of the net financial statements of the Company's most recent year by the accountant's verification visa.

199
TABLE 3 SITRONIX TECHNOLOGY CORP AND SUBSIDIARIES MARKETABLE SECURITIES HELD DECEMBER 31, 2018 (In Thousands of New Taiwan Dollars, Unless Stated Otherwise)
Holding Company Name Type and Name of Marketable Securities Relationship with the Holding Company Financial Statement Account
December 31, 2018 Note Number of
Shares Carrying Amount
Percentage of Ownership (%) Fair Value
The Company Bond FORCAY 3.375% 04/22/2025, USD bond - Financial assets at amortized
cost-noncurrent - $ 31,386 - $ 31,386 Note 2
Adimmune Corporation First Secured Convertible bond
- Financial assets at fair value through other comprehensive income-current
- 54,000 - 54,000 Note 1
Honhai 2.25% 09/23/2021, USD bond - Investments in debt instruments at FVTOCI-noncurrent
- 14,814 - 14,814 Note 1
Alltop Technology Co., Ltd Third unsecures Convertible bond asset swap
- Financial assets at fair value through other comprehensive income-current
- 5,727 - 5,727 Note 1
EVA Air Third Secured unsecuries Convertible bond
- Financial assets at fair value through other comprehensive income-noncurrent
- 21,620 - 21,620 Note 1
DACIN Construction Co., Ltd Forth unsecured Convertible bond asset swap
- Financial assets at fair value through other comprehensive income-noncurrent
- 5,020 - 5,020 Note 1
APAQ TECHNOLOGY CO., LTD. Second unsecured Convertible bond asset swap
- Financial assets at fair value through other comprehensive income-noncurrent
- 17,374 - 17,374 Note 1
WALTON ADVANCED ENGINEERING, INC. Second unsecured Convertible bond asset swap
- Financial assets at fair value through other comprehensive income-noncurrent
- 13,010 - 13,010 Note 1
DA-CIN CONSTRUCTION CO., LTD. Fifth unsecured Convertible bond asset swap
- Financial assets at fair value through other comprehensive income-noncurrent
- 10,046 - 10,046 Note 1
Fund Fubon SSE180 ETF - Financial assets at fair value
through other comprehensive income-current
632 15,945 - 15,945 Note 1
(Continued)

200
Holding Company Name Type and Name of Marketable Securities Relationship with the Holding Company Financial Statement Account
December 31, 2018 Note Number of
Shares Carrying Amount
Percentage of Ownership (%) Fair Value
The Company Share YOUNGTEK ELECTRONICS
CORPORATION - Investments in equity
instruments at FVTOCI-current
300 $ 12,045 - $ 12,045 Note 1
T3EX GLOBAL HOLDINGS CORP. - Investments in equity instruments at FVTOCI-current
438 10,687 - 10,687 Note 1
TUNG HO STEEL ENTERPRISE CORP. - Investments in equity instruments at FVTOCI-current
784 14,896 - 14,896 Note 1
CTCI CORPORATION - Investments in equity instruments at FVTOCI-current
497 22,067 - 22,067 Note 1
SILICON POWER COMPUTER &COMMUNICATIONS INC.
- Investments in equity instruments at FVTOCI-current
4,149 62,231 - 62,231 Note 1
CTBC Financial Holding Co., Ltd. - Investments in equity instruments at FVTOCI-current
1,550 31,310 - 31,310 Note 1
MIRLE AUTOMATION CORPORATION - Investments in equity instruments at FVTOCI-current
336 14,126 - 14,126 Note 1
TAISHIN FINANCIAL HOLDING CO., LTD. Preferred Stock E
- Investments in equity instruments at FVTOCI-current
374 19,897 - 19,897 Note 1
Equity Investment HANS GLOBAL SELECT FUND LIMITED - Investments in equity
instruments at FVTOCI-noncurrent
120 291,153 - 291,153 Note 3
United MD Fund Participating Share Class D - Investments in equity instruments at FVTOCI-noncurrent
3,050 26,463 50 26,463 Note 3
Sitronix Investment Corp Fund Yuanta/P-shares Taiwan Top 50 ETF - Financial assets at fair value
through other comprehensive income-current
200 15,100 - 15,100 Note 1
Share TAIWAN SEMICONDUCTOR
MANUFACTURING COMPANY LIMITED
- Financial assets at fair value through other comprehensive income-current
145 32,698 - 32,698 Note 1
Equity Investment HANS GLOBAL SELECT FUND LIMITED - Investments in equity
instruments at FVTOCI-noncurrent
112 270,530 - 270,530 Note 3
(Continued)
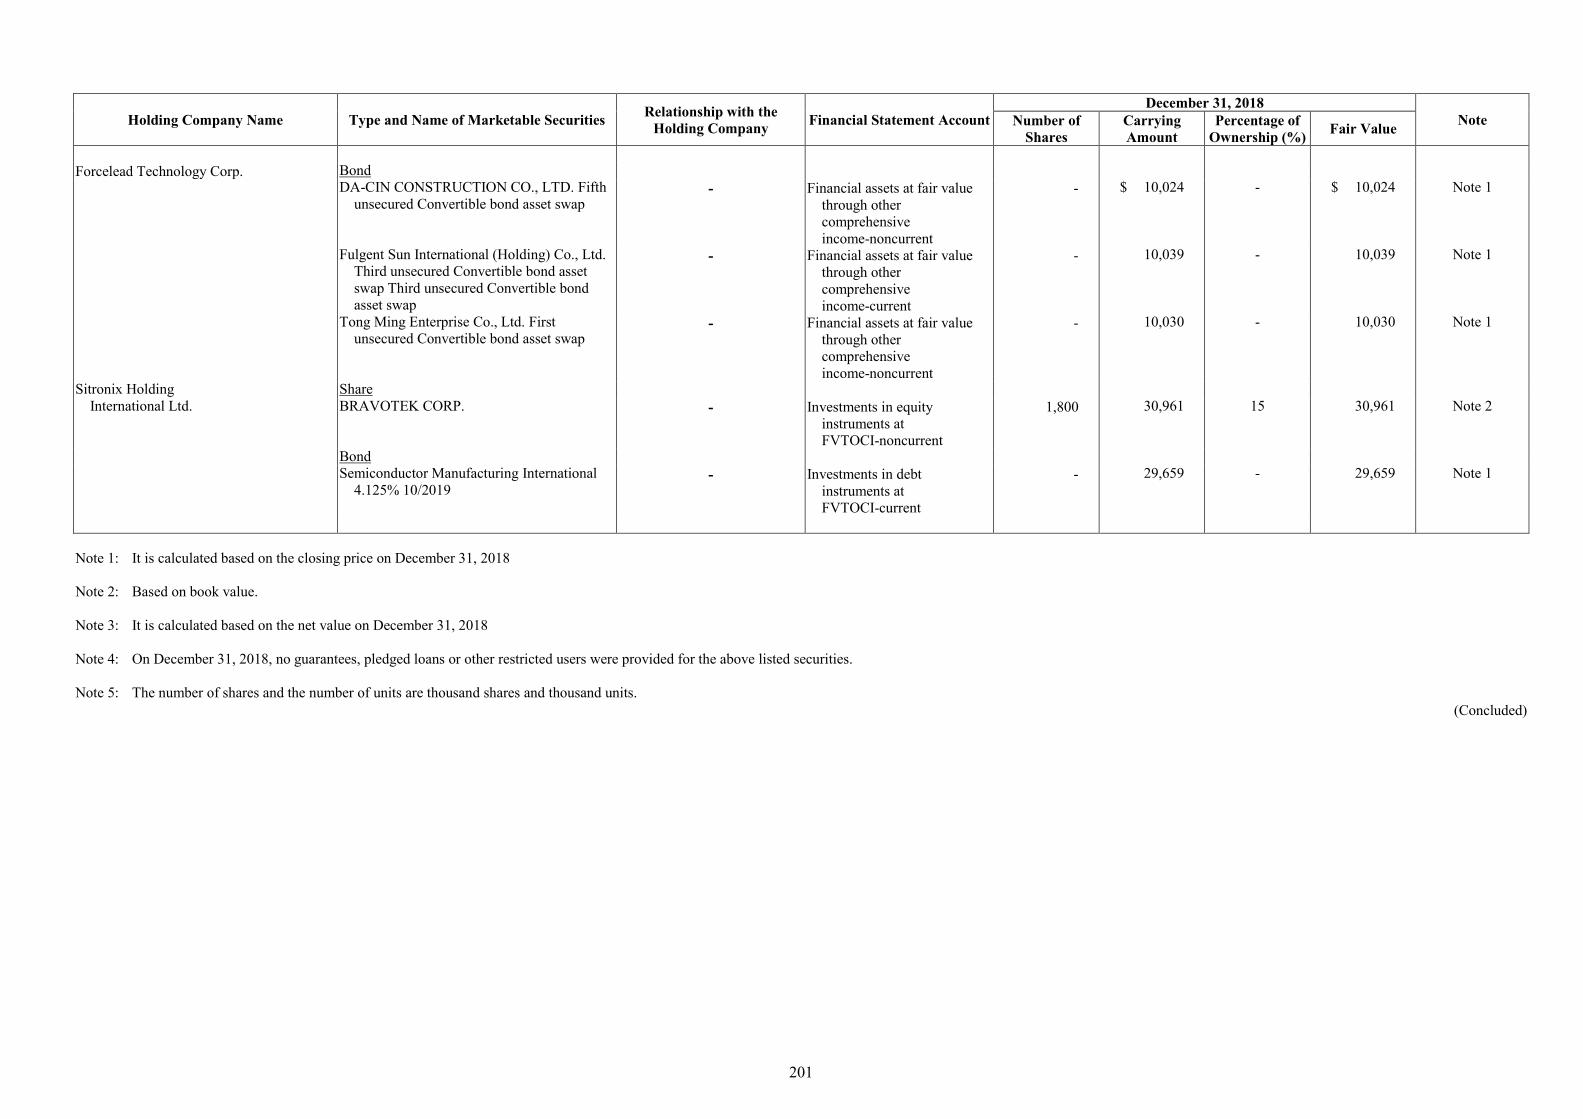
201
Holding Company Name Type and Name of Marketable Securities Relationship with the Holding Company Financial Statement Account
December 31, 2018 Note Number of
Shares Carrying Amount
Percentage of Ownership (%) Fair Value
Forcelead Technology Corp. Bond DA-CIN CONSTRUCTION CO., LTD. Fifth
unsecured Convertible bond asset swap - Financial assets at fair value
through other comprehensive income-noncurrent
- $ 10,024 - $ 10,024 Note 1
Fulgent Sun International (Holding) Co., Ltd. Third unsecured Convertible bond asset swap Third unsecured Convertible bond asset swap
- Financial assets at fair value through other comprehensive income-current
- 10,039 - 10,039 Note 1
Tong Ming Enterprise Co., Ltd. First unsecured Convertible bond asset swap
- Financial assets at fair value through other comprehensive income-noncurrent
- 10,030 - 10,030 Note 1
Sitronix Holding Share International Ltd. BRAVOTEK CORP. - Investments in equity
instruments at FVTOCI-noncurrent
1,800 30,961 15 30,961 Note 2
Bond Semiconductor Manufacturing International
4.125% 10/2019 - Investments in debt
instruments at FVTOCI-current
- 29,659 - 29,659 Note 1
Note 1: It is calculated based on the closing price on December 31, 2018 Note 2: Based on book value. Note 3: It is calculated based on the net value on December 31, 2018 Note 4: On December 31, 2018, no guarantees, pledged loans or other restricted users were provided for the above listed securities. Note 5: The number of shares and the number of units are thousand shares and thousand units.
(Concluded)

202
TABLE 4 SITRONIX TECHNOLOGY CORP AND SUBSIDIARIES TOTAL PURCHASES FROM OR SALES TO RELATED PARTIES AMOUNTING TO AT LEAST NT$100 MILLION OR 20% OF THE PAID-IN CAPITAL FOR THE YEAR ENDED DECEMBER 31, 2018 (In Thousands of New Taiwan Dollars, Unless Stated Otherwise)
Buyer Related Party Relationship Transaction Details Abnormal Transaction Notes/Accounts
Receivable (Payable) Note Purchase/ Sale Amount % of
Total Payment Terms Unit Price Payment Terms Ending Balance
% of Total
The Company Sitronix Technology
(Mauritius) Corp. Substantial related party Sale $ 821,660 11 After acceptance net 60 days
from monthly closing date $ - - $ - - -
The Company Sensortek Technology Corp.
Substantial related party Purchase 297,139 7 After acceptance net 45 days from monthly closing date
- - 91,971 8 -

203
TABLE 5 SITRONIX TECHNOLOGY CORP AND SUBSIDIARIES INTERCOMPANY RELATIONSHIPS AND SIGNIFICANT INTERCOMPANY TRANSACTIONS FOR THE YEAR ENDED DECEMBER 31, 2018 (In Thousands of New Taiwan Dollars, Unless Stated Otherwise)
No. Investee Company Counterparty Relationship Transaction Details
Financial Statement Accounts Amount Payment Terms % of Total Sales or Assets
0 Sitronix Technology Corp. Sitronix Technology (Mauritius) Corp. from the parent company to the subsidiary. Sales $ 821,660 - 8 Sensortek Technology Corp. from the parent company to the subsidiary. Sales 10,113 - - Purchases 297,139 - 3 Rental income 4,344 - - Accounts receivable 3,449 - - Accounts payable 91,971 - 1 Forcelead Technology Corp. from the parent company to the subsidiary. Sales 10,772 - - Rental income 1,730 - - Accounts receivable 3,309 - - Other receivables 15,703 - - Infinno Technology Corp. from the parent company to the subsidiary. Sales 6,231 - - Rental income 1,730 - - Accounts receivable 1,777 - - Other receivables 24,525 - - mCore Technology Corp. from the parent company to the subsidiary. Sales 7,710 - - Purchases 62,930 - 1 Expenditure on technical Services 5,173 - - Rental income 2,211 - - Accounts receivable 2,158 - - Accounts payable 10,431 - - Other receivables 1,810 - Sync-Tech System Corp. from the parent company to the subsidiary. Sales 2,484 - - Rental income 14,014 - - Production overheads 43,107 - - Research and development expenses 1,121 - - Other receivables 45,929 - 1 Other payables 5,533 - - Sitronix Technology (Shenzhen) Co.,
Ltd. from the parent company to the subsidiary. Professional service fees 89,876 - 1
HeFei Sitronix Co., Ltd. from the parent company to the subsidiary. Sales 5,454 - - Accounts receivable 5,448 - -
1 Forcelead Technology Corp. Sync-Tech System Corp. from the subsidiary to the subsidiary. Production overheads 7,383 - -
Note 1: The purchase transactions of the Company and its subsidiaries, their trading prices and collection conditions, are not significantly different from those of non-subsidiaries, and the rest of the transactions with the subsidiaries are calculated
in accordance with the contract agreement. Note 2: The transaction of the Forcelead Technology Corp. and the Sync-Tech System Corp. is calculated according to the agreement between the two parties.
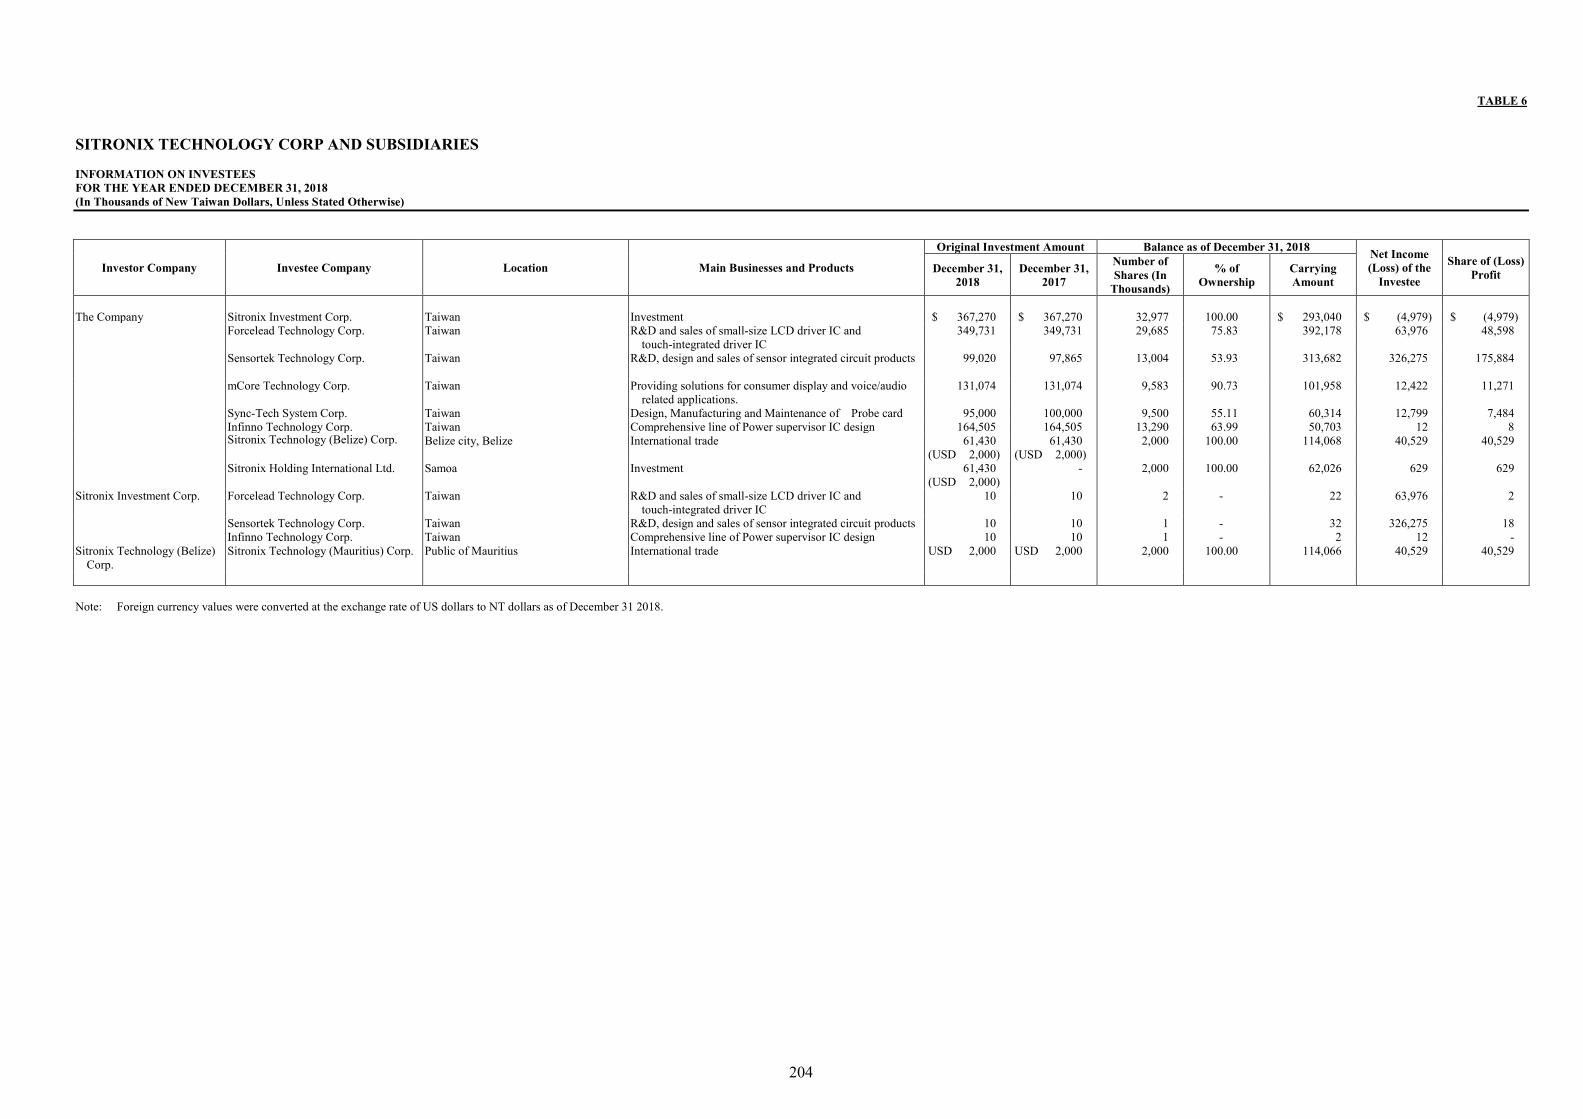
204
TABLE 6 SITRONIX TECHNOLOGY CORP AND SUBSIDIARIES INFORMATION ON INVESTEES FOR THE YEAR ENDED DECEMBER 31, 2018 (In Thousands of New Taiwan Dollars, Unless Stated Otherwise)
Investor Company Investee Company Location Main Businesses and Products
Original Investment Amount Balance as of December 31, 2018 Net Income (Loss) of the
Investee
Share of (Loss) Profit December 31,
2018 December 31,
2017
Number of Shares (In
Thousands)
% of Ownership
Carrying Amount
The Company Sitronix Investment Corp. Taiwan Investment $ 367,270 $ 367,270 32,977 100.00 $ 293,040 $ (4,979) $ (4,979) Forcelead Technology Corp. Taiwan R&D and sales of small-size LCD driver IC and
touch-integrated driver IC 349,731 349,731 29,685 75.83 392,178 63,976 48,598
Sensortek Technology Corp.
Taiwan R&D, design and sales of sensor integrated circuit products 99,020 97,865 13,004 53.93 313,682 326,275 175,884
mCore Technology Corp. Taiwan Providing solutions for consumer display and voice/audio related applications.
131,074 131,074 9,583 90.73 101,958 12,422 11,271
Sync-Tech System Corp. Taiwan Design, Manufacturing and Maintenance of Probe card 95,000 100,000 9,500 55.11 60,314 12,799 7,484 Infinno Technology Corp. Taiwan Comprehensive line of Power supervisor IC design 164,505 164,505 13,290 63.99 50,703 12 8 Sitronix Technology (Belize) Corp.
Belize city, Belize International trade 61,430
(USD 2,000) 61,430 (USD 2,000)
2,000 100.00 114,068 40,529 40,529
Sitronix Holding International Ltd. Samoa Investment 61,430 (USD 2,000)
- 2,000 100.00 62,026 629 629
Sitronix Investment Corp. Forcelead Technology Corp. Taiwan R&D and sales of small-size LCD driver IC and touch-integrated driver IC
10 10 2 - 22 63,976 2
Sensortek Technology Corp. Taiwan R&D, design and sales of sensor integrated circuit products 10 10 1 - 32 326,275 18 Infinno Technology Corp. Taiwan Comprehensive line of Power supervisor IC design 10 10 1 - 2 12 - Sitronix Technology (Belize)
Corp. Sitronix Technology (Mauritius) Corp. Public of Mauritius International trade USD 2,000
USD 2,000 2,000 100.00 114,066 40,529 40,529
Note: Foreign currency values were converted at the exchange rate of US dollars to NT dollars as of December 31 2018.

205
TABLE 7 SITRONIX TECHNOLOGY CORP AND SUBSIDIARIES INFORMATION ON INVESTMENTS IN MAINLAND CHINA FOR THE YEAR ENDED DECEMBER 31, 2018 (In Thousands of New Taiwan Dollars, Unless Stated Otherwise)
Investee Company Main Businesses and Products Paid-in
Capital (US$ in Thousands)
Method of Investment
Accumulated Outward
Remittance for Investment
from Taiwan as of
January 1, 2018 (US$ in Thousands)
Remittance of Funds Accumulated Outward
Remittance for Investment
from Taiwan as of
December 31, 2018 (US$ in Thousands)
Net Income (Loss) of the
Investee
% Ownership
for Direct or Indirect
Investment
Investment Gain (Loss)
(Note 2)
Carrying Amount as of December 31,
2018
Accumulated Repatriation of Investment Income as of December 31,
2018
Outward (US$ in Thousands) Inward
Sitronix Technology (Shenzhen)
Co., Ltd. Computer software and hardware
development, sales and after-sales service business and related technical consulting services
$ 12,286 (USD 400)
Note 1 $ 12,286 (USD 400)
$ - $ - $ 12,286 (USD 400)
$ 1,457 100 $ 1,457 $ 25,870 $ -
HeFei ezGreen Co., Ltd. Design, sales and technical services of Supplier management software development
8,944 (RMB 2,000)
Note 4 - 8,944 (RMB 2,000)
- 8,944 (RMB 2,000)
(255) 100 (255) 8,688 -
HeFei Sitronix Co., Ltd
R&D, design, sales and technical services of integrated circuits and system hardware and software
44,720 (RMB 10,000)
Note 5 - 33,540 (RMB 7,500)
- 33,540 (RMB 7,500)
4,953 75 3,716 37,246 -
Accumulated Outward Remittance for Investment in
Mainland China as of December 31, 2018(US$ in Thousands )
Investment Amount Authorized by the Investment Commission,
MOEA (US$ in Thousands )
Upper Limit on the Amounts of Investment Stipulated by
Investment Commission, MOEA
$ 56,362 $ 262,613 $ 2,822,521 (USD 1,835) (USD 8,550) Note 1: The Company invested in a company located in mainland China indirectly through the existing company in a third country. Note 2: The foreign currency component is converted at the US dollar and RMB dollar exchange rate of December 31 2018. Note 3: According to the Investment Commission, MOEA, the limit on the amount of investments in mainland China is 60% of the net asset value. Note 4: Direct Investment, as of December 31 2018, the total investment amount approved by Investment Commission, MOEA is RMB10,000 thousand, of which RMB2,000 thousand has been remitted. Note 5: Direct Investment, as of December 31 2018, the total investment amount approved by Investment Commission, MOEA is RMB45,000 thousand, of which RMB7,500 thousand has been remitted.
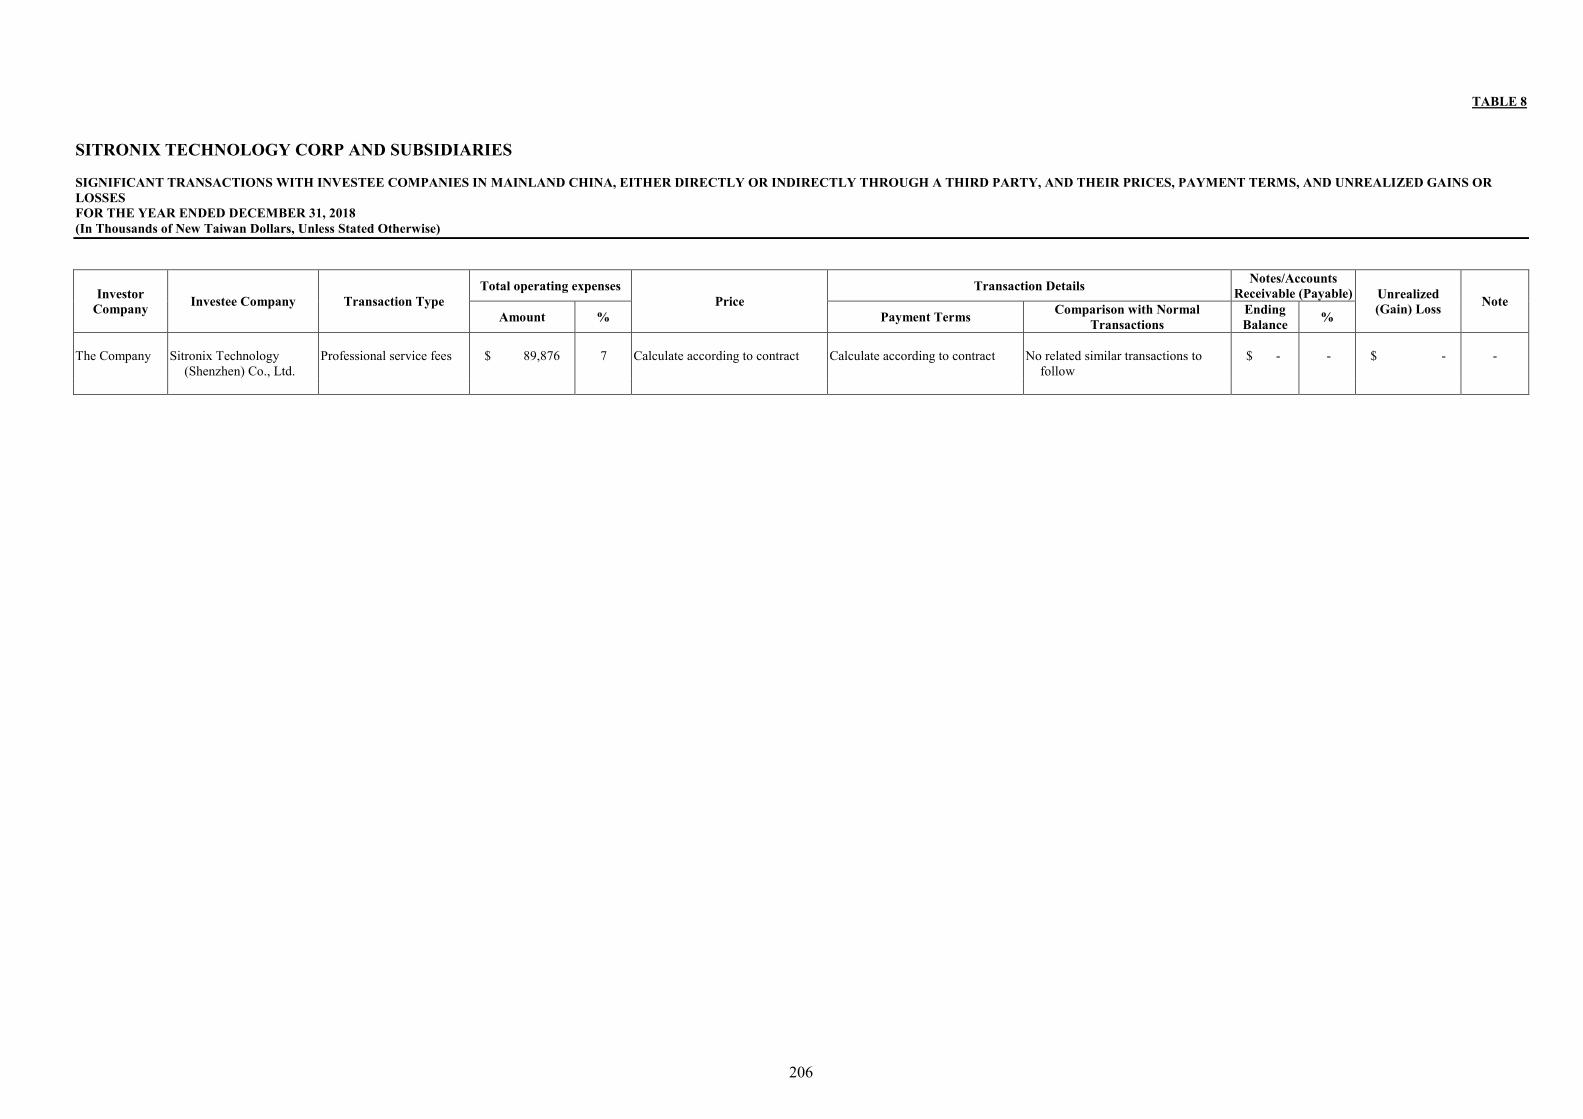
206
TABLE 8 SITRONIX TECHNOLOGY CORP AND SUBSIDIARIES SIGNIFICANT TRANSACTIONS WITH INVESTEE COMPANIES IN MAINLAND CHINA, EITHER DIRECTLY OR INDIRECTLY THROUGH A THIRD PARTY, AND THEIR PRICES, PAYMENT TERMS, AND UNREALIZED GAINS OR LOSSES FOR THE YEAR ENDED DECEMBER 31, 2018 (In Thousands of New Taiwan Dollars, Unless Stated Otherwise)
Investor Company Investee Company Transaction Type
Total operating expenses Price
Transaction Details Notes/Accounts Receivable (Payable) Unrealized
(Gain) Loss Note Amount % Payment Terms Comparison with Normal
Transactions Ending Balance %
The Company Sitronix Technology
(Shenzhen) Co., Ltd. Professional service fees $ 89,876 7 Calculate according to contract Calculate according to contract No related similar transactions to
follow $ - - $ - -

207
INDEPENDENT AUDITORS’ REPORT The Board of Directors and the Shareholders Sitronix Technology Corp. Opinion We have audited the accompanying financial statements of Sitronix Technology Corp. (the Company), which comprise the balance sheets as of December 31, 2018 and 2017, the statements of comprehensive income, changes in equity and cash flows for the years then ended, and the notes to the financial statements, including a summary of significant accounting policies. In our opinion, the accompanying financial statements present fairly, in all material respects, the financial position of the Company as of December 31, 2018 and 2017, and its financial performance and its cash flows for the years then ended in accordance with the Regulations Governing the Preparation of Financial Reports by Securities Issuers. Basis for Opinion We conducted our audits in accordance with the Regulations Governing Auditing and Attestation of Financial Statements by Certified Public Accountants and auditing standards generally accepted in the Republic of China. Our responsibilities under those standards are further described in the Auditors’ Responsibilities for the Audit of the Financial Statements Section of our report. We are independent of the Company in accordance with the Norm of Professional Ethics for Certified Public Accountant of the Republic of China, and we have fulfilled our other ethical responsibilities in accordance with these requirements. We believe that the audit evidence we have obtained is sufficient and appropriate to provide a basis for our opinion. Key Audit Matters Key audit matters are those matters that, in our professional judgment, were of most significance in our audit of the financial statements for the year ended December 31, 2018. These matters were addressed in the context of our audit of the financial statements as a whole, and in forming our opinion thereon, and we do not provide a separate opinion on these matters. The key audit matters for the Company’s parent company only financial statements for the year ended December 31, 2018 are stated as follows: Recognition of sales revenue The Company’s main source of revenue comes from the sale of memory chips. For the year ended December 31, 2018, the revenue recognized was NT$7,503,697 thousand, please refer to Notes 4 and 27 for information of accounting policy of revenue recognition. Due to the market rebound of memory chips, the Company released certain sales orders by temporarily increasing the credit line. As such, this gives the rise to the potential risk of overstating sales. We therefore considered the validity of occurrence of sales as a key audit matter for the year ended December 31, 2018.

208
We have assessed that the customers of the Company whose annual revenue growth rates for 2018 have changed significantly to be subject to the risk of validity of revenue recognition. Therefore, our audit procedures performed with respect to these customers to confirm the validity of revenue recognition of the Company include, but are not limited to, the following: 1. We understood and tested the effectiveness of the design and implementation of the key internal controls
over revenue recognition; 2. We sampled and inspected the validity of the background information of customers that had significant
changes in the annual sales revenue growth rate and understood the reasonableness of such customers’ credit terms;
3. We performed on-site interviews by sampling and understood the business process and relevance of sales
revenue; 4. We sampled and inspected whether an original purchase order existed for each sale and was approved
appropriately; 5. We inspected product names and quantities on notifications of manufacturing, invoices and goods receipt
and inspected the amounts to ensure they were consistent. 6. We inspected the reasonableness of collection of accounts receivable and whether the collection amounts
and counterparties were consistent with the revenue recognized. Responsibilities of Management and Those Charged with Governance for the Financial Statements Management is responsible for the preparation and fair presentation of the financial statements in accordance with the Regulations Governing the Preparation of Financial Reports by Securities Issuers, and for such internal control as management determines is necessary to enable the preparation of financial statements that are free from material misstatement, whether due to fraud or error. In preparing the financial statements, management is responsible for assessing the Company’s ability to continue as a going concern, disclosing, as applicable, matters related to going concern and using the going concern basis of accounting unless management either intends to liquidate the Company or to cease operations, or has no realistic alternative but to do so. Those charged with governance, including the audit committee, are responsible for overseeing the Company’s financial reporting process. Auditors’ Responsibilities for the Audit of the Financial Statements Our objectives are to obtain reasonable assurance about whether the financial statements as a whole are free from material misstatement, whether due to fraud or error, and to issue an auditors’ report that includes our opinion. Reasonable assurance is a high level of assurance, but is not a guarantee that an audit conducted in accordance with the auditing standards generally accepted in the Republic of China will always detect a material misstatement when it exists. Misstatements can arise from fraud or error and are considered material if, individually or in the aggregate, they could reasonably be expected to influence the economic decisions of users taken on the basis of these financial statements.

209
As part of an audit in accordance with the auditing standards generally accepted in the Republic of China, we exercise professional judgment and maintain professional skepticism throughout the audit. We also: 1. Identify and assess the risks of material misstatement of the financial statements, whether due to fraud or
error, design and perform audit procedures responsive to those risks, and obtain audit evidence that is sufficient and appropriate to provide a basis for our opinion. The risk of not detecting a material misstatement resulting from fraud is higher than for one resulting from error, as fraud may involve collusion, forgery, intentional omissions, misrepresentations, or the override of internal control.
2. Obtain an understanding of internal control relevant to the audit in order to design audit procedures that are
appropriate in the circumstances, but not for the purpose of expressing an opinion on the effectiveness of the Company’s internal control.
3. Evaluate the appropriateness of accounting policies used and the reasonableness of accounting estimates and
related disclosures made by management. 4. Conclude on the appropriateness of management’s use of the going concern basis of accounting and, based
on the audit evidence obtained, whether a material uncertainty exists related to events or conditions that may cast significant doubt on the Company’s ability to continue as a going concern. If we conclude that a material uncertainty exists, we are required to draw attention in our auditors’ report to the related disclosures in the financial statements or, if such disclosures are inadequate, to modify our opinion. Our conclusions are based on the audit evidence obtained up to the date of our auditors’ report. However, future events or conditions may cause the Company to cease to continue as a going concern.
5. Evaluate the overall presentation, structure and content of the financial statements, including the disclosures,
and whether the financial statements represent the underlying transactions and events in a manner that achieves fair presentation.
6. Obtain sufficient and appropriate audit evidence regarding the financial information of the entities or
business activities within the Company to express an opinion on the financial statements. We are responsible for the direction, supervision and performance of the audit. We remain solely responsible for our audit opinion.
We communicate with those charged with governance regarding, among other matters, the planned scope and timing of the audit and significant audit findings, including any significant deficiencies in internal control that we identify during our audit. We also provide those charged with governance with a statement that we have complied with relevant ethical requirements regarding independence, and to communicate with them all relationships and other matters that may reasonably be thought to bear on our independence, and where applicable, related safeguards. From the matters communicated with those charged with governance, we determine those matters that were of most significance in the audit of the financial statements for the year ended December 31, 2018 and are therefore the key audit matters. We describe these matters in our auditors’ report unless law or regulation precludes public disclosure about the matter or when, in extremely rare circumstances, we determine that a matter should not be communicated in our report because the adverse consequences of doing so would reasonably be expected to outweigh the public interest benefits of such communication.

210
The engagement partners on the audit resulting in this independent auditors’ report are Cheng Chih Lin and Yu Feng Huang. Deloitte & Touche Taipei, Taiwan Republic of China March 15, 2019
Notice to Readers The accompanying financial statements are intended only to present the financial position, financial performance and cash flows in accordance with accounting principles and practices generally accepted in the Republic of China and not those of any other jurisdictions. The standards, procedures and practices to audit such financial statements are those generally applied in the Republic of China. For the convenience of readers, the independent auditors’ report and the accompanying financial statements have been translated into English from the original Chinese version prepared and used in the Republic of China. If there is any conflict between the English version and the original Chinese version or any difference in the interpretation of the two versions, the Chinese-language independent auditors’ report and financial statements shall prevail.

211
SITRONIX TECHNOLOGY CORP. PARENT COMPANY ONLY BALANCE SHEETS DECEMBER 31, 2018 AND 2017 (In Thousands of New Taiwan Dollars) 2018 2017 2018 2017 ASSETS Amount % Amount % LIABILITIES AND EQUITY Amount % Amount % CURRENT ASSETS CURRENT LIABILITIES
Cash and cash equivalents (Notes 4, 6 and 35) $ 1,046,299 15 $ 764,490 12 Short-term borrowings (Notes 4, 21 and 35) $ 445,368 6 $ - - Financial assets at fair value through profit or loss - Financial liabilities at fair value through profit or loss - current (Notes 4, 7 and 35) 75,840 1 279,824 5 current (Notes 4, 7 and 35) 1,090 - 480 - Financial assets at fair value through other comprehensive Trade payables (Notes 22 and 35) 1,019,841 15 860,657 14 income - current (Notes 4, 8 and 35) 187,259 3 - - Payables to related parties (Notes 35 and 36) 102,633 2 48,225 1 Available-for-sale financial assets - current (Notes 4, 10 Accrued profit sharing to employees and compensation to and 35) - - 262,929 4 directors (Note 28) 98,323 1 102,159 2 Financial assets at amortized cost - current (Notes 4, 9, 35 Other payables (Notes 23 and 35) 345,198 5 349,331 6 and 37) 166,302 3 - - Other payables to related parties (Notes 35 and 36) 6,765 - 10,179 - Debt investments with no active market - current (Notes 4, Current tax liabilities (Notes 4 and 29) 78,908 1 89,180 1 13,35 and 37) - - 25,679 - Provisions - current (Notes 4 and 24) - - 5,089 - Notes receivables and trade receivable (Notes 4, 14 and 35) 950,215 14 499,875 8 Other current liabilities (Notes 23 and 35) 37,634 1 10,832 - Notes receivable and trades receivable from related parties (Notes 4, 35 and 36) 16,738 - 372,416 6 Total current liabilities 2,135,760 31 1,476,132 24 Other receivables (Notes 14 and 35) 26,363 - 63,836 1 Other receivables from related parties (Notes 35 and 36) 88,324 1 23,657 - NON-CURRENT LIABILITIES Inventories (Notes 4, 5 and 15) 1,378,966 20 1,216,478 20 Deferred tax liabilities (Notes 4 and 29) 610 - 576 - Prepayments 75,095 1 59,667 1 Net defined benefit liabilities - non-current (Notes 4 and 25) 51,318 1 57,555 1 Other current assets (Notes 20 and 35) 10,685 - 4,354 - Guarantee deposits received (Notes 23, 33 and 36) 22,791 - 12,453 -
Total current assets 4,022,086 58 3,573,205 57 Total non-current liabilities 74,719 1 70,584 1
NON-CURRENT ASSETS Total liabilities 2,210,479 32 1,546,716 25
Financial assets at fair value through profit or loss - non-current (Notes 4, 7 and 35) 67,070 1 31,493 1 EQUITY ATTRIBUTABLE TO OWNERS OF THE COMPANY (Notes Financial assets at fair value through other comprehensive 4, 26, 31 and 32) income - non-current (Notes 4, 8 and 35) 332,430 5 - - Share capital Available-for-sale financial assets - non-current (Notes 4, Ordinary shares 1,202,226 17 1,205,176 19 10 and 35) - - 371,529 6 Capital surplus 761,304 11 785,875 13 Held-to-maturity financial assets - non-current (Notes 4, 11 Retained earnings and 35) - - 30,499 - Legal reserve 875,493 13 788,177 13 Financial assets at amortized cost - non-current (Notes 4, 9, Special reserve 26,644 - 8,728 - 35 and 37) 31,386 - - - Unappropriated earnings 2,124,198 31 1,969,197 31 Financial assets measured at cost - non-current (Notes 4, 12 Total retained earnings 3,026,335 44 2,766,102 44 and 35) - - 25,833 - Other equity Investment accounted for using the equity method (Notes 4, Exchange differences on translating the financial statement 16, 32 and 36) 1,433,903 21 1,165,896 19 of foreign operations (846) - (943) - Property, plant and equipment (Notes 4, 17 and 36) 454,410 6 429,248 7 Unrealized gain (loss) on financial assets at fair value Investment properties (Notes 4 and 18) 535,150 8 543,340 9 through other comprehensive income (251,101) (4) - - Intangible assets (Notes 4 and 19) 40,400 1 50,246 1 Unrealized gain (loss) on available-for-sale financial Other non-current assets (Notes 20, 33 and 35) 5,910 - 5,086 - assets - - (25,701) -
Unrealized compensation of employees (25,652) - (50,850) (1) Total non-current assets 2,900,659 42 2,653,170 43 Total other equity (277,599) (4) (77,494) (1)
Total equity 4,712,266 68 4,679,659 75 TOTAL $ 6,922,745 100 $ 6,226,375 100 TOTAL $ 6,922,745 100 $ 6,226,375 100 The accompanying notes are an integral part of the financial statements.

212
SITRONIX TECHNOLOGY CORP. PARENT COMPANY ONLY STATEMENTS OF COMPREHENSIVE INCOME FOR THE YEARS ENDED DECEMBER 31, 2018 AND 2017 (In Thousands of New Taiwan Dollars, Except Earnings Per Share) 2018 2017 Amount % Amount % NET REVENUE (Notes 4 and 27) $ 7,503,697 100 $ 7,553,780 100 OPERATING COSTS (Notes 4, 15, 28 and 36) 5,697,612 76 5,629,862 74 GROSS PROFIT 1,806,085 24 1,923,918 26 OPERATING EXPENSES (Notes 4, 28 and 36)
Selling and marketing expenses 164,179 2 98,946 1 General and administrative expenses 155,033 2 188,103 3 Research and development expenses 936,621 13 886,749 12
Total operating expenses 1,255,833 17 1,173,798 16
INCOME FROM OPERATIONS 550,252 7 750,120 10 NON-OPERATING INCOME AND EXPENSES
Other income (Notes 4, 28 and 36) 68,977 1 75,617 1 Other gains and losses (Notes 4 and 28) 10,388 - 39,618 - Finance costs (Notes 4 and 28) (7,906) - (3,252) - Share of profit of subsidiaries and associates (Notes
4 and 16) 282,885 4 98,421 1
Total non-operating income and expenses 354,344 5 210,404 2 INCOME BEFORE INCOME TAX FROM
CONTINUING OPERATIONS 904,596 12 960,524 12 INCOME TAX EXPENSE (Notes 4 and 29) 64,233 1 87,366 1 NET INCOME FOR THE YEAR 840,363 11 873,158 11 OTHER COMPREHENSIVE INCOME (LOSS)
Items that will not be reclassified subsequently to profit or loss: Remeasurement of defined benefit plans (Notes 4
and 25) 4,599 - (746) - Unrealized loss on investments in equity
instruments at fair value through other comprehensive income (86,278) (1) - -
Share of the other comprehensive loss of associates accounted for using the equity method (61,152) (1) - -
(Continued)

213
SITRONIX TECHNOLOGY CORP. PARENT COMPANY ONLY STATEMENTS OF COMPREHENSIVE INCOME FOR THE YEARS ENDED DECEMBER 31, 2018 AND 2017 (In Thousands of New Taiwan Dollars, Except Earnings Per Share) 2018 2017 Amount % Amount %
Items that may be reclassified subsequently to profit or loss (Notes 4 and 26): Exchange differences on translating foreign
operations $ 97 - $ (41) - Unrealized gain (loss) on available-for-sale
financial assets - - (20,672) - Unrealized gain (loss) on investments in debt
instruments at fair value through other comprehensive income 251 - - -
Share of the other comprehensive income (loss) of associates accounted for using the equity method (33) - 2,797 -
Other comprehensive income (loss) for the year,
net of income tax (142,516) (2) (18,662) - TOTAL COMPREHENSIVE INCOME FOR THE
YEAR $ 697,847 9 $ 854,496 11 EARNINGS PER SHARE (Note 30)
Basic $ 7.03 $ 7.32 Diluted $ 6.94 $ 7.22
The accompanying notes are an integral part of the parent company only financial statements. (Concluded)

214
SITRONIX TECHNOLOGY CORP. PARENT COMPANY ONLY STATEMENTS OF CHANGES IN EQUITY FOR THE YEARS ENDED DECEMBER 31, 2018 AND 2017 (In Thousands of New Taiwan Dollars) Other Equity (Notes 24, 26 and 31)
Share Capital (Note 26) Retained Earnings Exchange
Differences on Unrealized Gain
(Loss) from
Unrealized Gain (Loss) on Financial
Assets at Fair Value Through
Other Unearned
Shares
(In Thousands) Amount Capital Surplus
(Notes 26 and 32) Legal Reserve Special reserve Unappropriated
Earnings (Note 26) Translating
Foreign Operations Available-for-sale Financial Assets
Comprehensive Income
Compensation of Employees Total Equity
BALANCE AT JANUARY 1, 2017 120,638 $ 1,206,376 $ 811,101 $ 683,993 $ 21,364 $ 2,093,666 $ (902 ) $ (7,826 ) $ - $ (120,394 ) $ 4,687,378 Appropriation of 2016 earnings
Legal reserve - - - 104,184 - (104,184 ) - - - - - Special reserve - - - - (12,636 ) 12,636 - - - - - Cash dividends distributed by the Company - - - - - (723,826 ) - - - - (723,826 )
Other changes in capital surplus
Changes in percentage of ownership interests in subsidiaries - - (14,006 ) - - (181,507 ) - - - - (195,513 ) Compensation costs of restricted shares for employees - - - - - - - - - 57,124 57,124 Retirement of restricted shares for employees (120 ) (1,200 ) (11,220 ) - - - - - - 12,420 - Net income for the year ended December 31, 2017 - - - - - 873,158 - - - - 873,158 Other comprehensive loss for year ended December 31, 2017, net of income
tax - - - - - (746 ) (41 ) (17,875 ) - - (18,662 ) Total comprehensive income for the year ended December 31, 2017 - - - - - 872,412 (41 ) (17,875 ) - - 854,496 BALANCE AT JANUARY 1, 2017 AS RESTATED 120,518 1,205,176 785,875 788,177 8,728 1,969,197 (943 ) (25,701 ) - (50,850 ) 4,679,659 EFFECT OF RETROSPECTIVE APPLICATION AND RETROSPECTIVE
RESTATEMENT - - - - - 81,235 - 25,701 (106,936 ) - - BALANCE AT DECEMBER 31, 2017 120,518 1,205,176 785,875 788,177 8,728 2,050,432 (943 ) - (106,936 ) (50,850 ) 4,679,659 Appropriation of 2017 earnings
Legal reserve - - - 87,316 - (87,316 ) - - - - - Special reserve. - - - - 17,916 (17,916 ) - - - - - Cash dividends distributed by the Company - - - - - (662,847 ) - - - - (662,847 )
Other changes in capital surplus
Changes in percentage of ownership interests in subsidiaries - - 3,014 - - (70 ) - - - - 2,944 Compensation cost of restricted shares for employees - - - - - - - - - (5,337 ) (5,337 ) Restricted employee rights, new shares are not vested (295 ) (2,950 ) (27,585 ) - - - - - - 30,535 - Disposal of equity instruments at fair value through other comprehensive
income - - - - - (3,047 ) - - 3,047 - - Net income for the year ended December 31, 2018 - - - - - 840,363 - - - - 840,363 Other comprehensive income (loss) for year ended December 31, 2018, net
of income tax - - - - - 4,599 97 - (147,212 ) - (142,516 ) Total comprehensive income (loss) for the year ended December 31, 2018 - - - - - 844,962 97 - (147,212 ) - 697,847 BALANCE AT DECEMBER 31, 2018 120,223 $ 1,202,226 $ 761,304 $ 875,493 $ 26,644 $ 2,124,198 $ (846 ) $ - $ (251,101 ) $ (25,652 ) $ 4,712,266 The accompanying notes are an integral part of the parent company only financial statements.

215
SITRONIX TECHNOLOGY CORP. PARENT COMPANY ONLY STATEMENTS OF CASH FLOWS FOR THE YEARS ENDED DECEMBER 31, 2018 AND 2017 (In Thousands of New Taiwan Dollars) 2018 2017 CASH FLOWS FROM OPERATING ACTIVITIES
Income before income tax $ 904,596 $ 960,524 Adjustments for:
Depreciation expense 120,078 102,717 Amortization expense 24,133 19,562 Impairment loss reversed on trade receivables - (2,494) Net (gain) loss on fair value changes of financial assets designated as at fair
value through profit or loss (17,410) 3,611 Finance costs 7,906 3,252 Interest income (17,285) (24,620) Dividend income (9,073) (9,873) Compensation cost of share-based payment (5,337) 57,124 Share of profits of associates (282,885) (98,421) Loss (gain) on disposal of property, plant and equipment 3 (23) Gain on disposal of available-for-sale financial assets - (56,374) Impairment loss on financial assets - 4,125 Write-downs of inventories 9,000 30,500 Unrealized net loss (gain) on foreign currency exchange (3,876) 30,513 Deferred other revenue (644) (772)
Changes in operating assets and liabilities Financial assets held for trading - (36,556) Notes receivable and trade receivables (462,625) (11,836) Receivables from related parties 349,875 47,501 Other receivables 38,941 2,191 Other receivables from related parties (2,256) 1,254 Inventories (171,488) 7,168 Prepayments (15,428) 10,558 Other current assets (6,331) (1,584) Notes payable and trade payables 171,715 (230,096) Payables to related parties 55,326 (21,660) Other payables (4,678) 8,682 Other payables to related parties (3,414) 4,440 Other current liabilities 21,713 2,842 Net defined benefit liabilities (1,638) (1,442) Accrued profit sharing bonus to employees' compensation and remuneration
of directors (3,836) (19,736) Cash generated from operations 695,082 781,077 Interest received 15,816 24,941 Interest paid (6,988) (3,252) Income tax paid (74,471) (97,621)
Net cash generated from operating activities 629,439 705,145
CASH FLOWS FROM INVESTING ACTIVITIES
Acquisition of financial assets at fair value through other comprehensive income (149,269) - Disposal of financial assets at fair value through other comprehensive income 72,596 - Purchase of financial assets measured at cost (344,502) - Proceeds from the return of capital of financial assets carried at amortized cost 203,879 - Acquisition of financial assets at fair value through profit or loss (137,646) -
(Continued)

216
SITRONIX TECHNOLOGY CORP. PARENT COMPANY ONLY STATEMENTS OF CASH FLOWS FOR THE YEARS ENDED DECEMBER 31, 2018 AND 2017 (In Thousands of New Taiwan Dollars) 2018 2017
Proceeds from disposal of financial assets at fair value through profit or loss $ 455,322 $ - Purchase of available-for-sale financial assets - (544,749) Proceeds from disposal of available-for-sale financial assets - 392,485 Proceeds from sale of debt investments with no active market - 19,872 Proceeds from sale of held-to-maturity financial assets - 100,000 Acquisition of investments accounted for using the equity method (104,182) (338,051) Acquisition of property, plant and equipment (137,053) (97,091) Proceeds from disposal of property, plant and equipment - 1,292 Increase in refundable deposits (664) (934) Increase in other receivable from related parties (62,466) (20,000) Purchase for intangible assets (14,287) (27,179) Increase in prepayments for equipment (160) - Dividends received 65,633 115,737 Net cash inflow on disposal of subsidiaries 5,000 -
Net cash used in investing activities (147,799) (398,618)
CASH FLOWS FROM FINANCING ACTIVITIES
Proceeds from short-term borrowings 2,743,106 - Repayments of short-term borrowings (2,296,153) - Proceeds from guarantee deposits received 10,338 1,324 Cash dividends distributed (662,847) (723,826)
Net cash used in financing activities (205,556) (722,502)
EFFECT OF EXCHANGE RATE CHANGES ON THE BALANCE OF CASH
AND CASH EQUIVALENTS HELD IN FOREIGN CURRENCIES 5,725 (27,154) NET INCREASE (DECREASE) IN CASH AND CASH EQUIVALENTS 281,809 (443,129) CASH AND CASH EQUIVALENTS AT THE BEGINNING OF THE YEAR 764,490 1,207,619 CASH AND CASH EQUIVALENTS AT THE END OF THE YEAR $ 1,046,299 $ 764,490 The accompanying notes are an integral part of the parent company only financial statements. (Concluded)

217
SITRONIX TECHNOLOGY CORP. NOTES TO PARENT COMPANY ONLY FINANCIAL STATEMENTS FOR THE YEARS ENDED DECEMBER 31, 2018 AND 2017 (In Thousands of New Taiwan Dollars, Unless Stated Otherwise) 1. GENERAL INFORMATION
Sitronix Technology Co., Ltd. (the Company) was incorporated in Taipei City, Taiwan (R.O.C.) in July 1992 and commenced operations in the same year. The principal place of business is located in Tai Yuen Hi-Tech Industrial Park, Hsinchu County. The Company operates principally as a designer, manufacturer and supplier of integrated circuits (ICs) and memory chips and focuses on display driver ICs (DDIs) for entry-level mobile phones, industrial displays and automotive systems. The Company’s shares have been listed on the Taiwan Stock Exchange (TWSE) since December 25, 2003. The financial statements are presented in the Company’s functional currency, the New Taiwan dollar.
2. APPROVAL OF FINANCIAL STATEMENTS
The financial statements were approved by the Company’s board of directors and authorized for issue on March 15, 2019.
3. APPLICATION OF NEW, AMENDED AND REVISED STANDARDS AND INTERPRETATIONS
a. Initial application of the amendments to the Regulations Governing the Preparation of Financial Reports
by Securities Issuers and the International Financial Reporting Standards (IFRS), International Accounting Standards (IAS), Interpretations of IFRS (IFRIC), and Interpretations of IAS (SIC) (collectively, the IFRSs) endorsed and issued into effect by the Financial Supervisory Commission (FSC). Except for the following, whenever applied, the initial application of the amendments to the Regulations Governing the Preparation of Financial Reports by Securities Issuers and the IFRSs endorsed and issued into effect by the FSC would not have any material impact on the Company’s accounting policies: 1) IFRS 9 “Financial Instruments” and related amendments
IFRS 9 supersedes IAS 39 “Financial Instruments: Recognition and Measurement”, with consequential amendments to IFRS 7 “Financial Instruments: Disclosures” and other standards. IFRS 9 sets out the requirements for classification, measurement and impairment of financial assets and hedge accounting. Refer to Note 4 for information relating to the relevant accounting policies. Classification, measurement and impairment of financial assets On the basis of the facts and circumstances that existed as of January 1, 2018, the Company has performed an assessment of the classification of recognized financial assets and has elected not to restate prior reporting periods.

218
The following table shows the original measurement categories and carrying amounts under IAS 39 and the new measurement categories and carrying amounts under IFRS 9 for each class of the Company’s financial assets and financial liabilities as of January 1, 2018.
Measurement Category Carrying Amount Financial Assets IAS 39 IFRS 9 IAS 39 IFRS 9 Remark
Cash and cash equivalents Loans and receivables Amortized cost $ 764,490 $ 764,490 - Mutual funds Available‑for‑sale Mandatorily at FVTPL 60,125 60,125 (1) Available‑for‑sale Fair value through other
comprehensive income (i.e. FVTOCI)
356,967 356,967 (1)
Equity securities Available‑for‑sale Fair value through other comprehensive income (i.e. FVTOCI)
157,513 157,513 (2)
Debt securities Available‑for‑sale Mandatorily at FVTPL 71,124 71,124 (3) Available‑for‑sale Fair value through other
comprehensive income (i.e. FVTOCI)
14,562 14,562 (3)
Held-to-maturity Amortized cost 30,499 30,499 (3) Time deposits with
original maturities of more than 3 months
Loans and receivables Amortized cost 25,679 25,679 -
Notes receivable, trade receivables and other receivables(including related parties)
Loans and receivables Amortized cost 964,138 964,138 (4)
Financial Assets
IAS 39 Carrying Amount
as of January 1, 2018
Reclassifi- cations
IFRS 9 Carrying
Amount as of January 1,
2018
Retained Earnings Effect on
January 1, 2018
Other Equity
Effect on January 1,
2018 Remark FVTPL $ 311,317 $ - $ 311,317 - Add: Reclassification from
available-for-sale (IAS 39) - 131,249 131,249
(1), (2) and (3)
311,317 131,249 442,566 $ 2,396 $ (2,396 ) (1), (2) and (3) Fair value through other comprehensive
income (i.e. FVTOCI) - -
-
Debt instruments Add: Reclassification from
available-for-sale (IAS 39) - 14,562 14,562
(3)
Equity instrument - - - - Add: Reclassification from
available-for-sale (IAS 39) - 514,480 514,480
(1) and(2)
- 529,042 - 529,042 - 78,604 - (78,604 ) - (2) Amortized cost - - - Add: Reclassification from
held-to-maturity AS 39) - 30,499 30,499
(3)
Add: Reclassification from loans and receivables (IAS 39)
- 1,754,307 1,754,307
(4)
- 1,784,806 1,784,806 - - - Investment accounted for using equity
method 1,165,896 - 1,165,896 235 (235)
(5)
$ 1,477,213 $ 2,445,097 $ 3,922,310 $ 81,235 $ (81,235 )
a) Mutual funds of $60,125 thousand previously classified as available-for-sale under IAS 39,
were mandatorily classified as at FVTPL under IFRS 9, because the contractual cash flows are not solely payments of principal and interest on the principal outstanding and they are not equity instruments. The retrospective adjustment resulted in an increase of $215 thousand in other equity - unrealized gain (loss) on available-for-sale financial assets and a decrease of $215 thousand in retained earnings on January 1, 2018. Investments of $356,967 in mutual funds previously classified as available-for-sale under IAS 39 were classified as at FVTOCI under IFRS 9 as they are equity instruments and are not held for trading. As a result, the related other equity - unrealized gain (loss) on available-for-sale financial assets of $3,273 thousand was reclassified to other equity - unrealized gain (loss) on financial assets at FVTOCI.

219
b) The Company elected to designate all its investments in equity securities previously classified as available-for-sale under IAS 39 as at FVTOCI under IFRS 9. As a result, the related other equity - unrealized gain (loss) on available-for-sale financial assets of $(20,925) thousand was reclassified to other equity - unrealized gain (loss) on financial assets at FVTOCI.
As investments in unlisted shares previously measured at cost under IAS 39 have been classified at FVTOCI under IFRS 9. The Company recognized under IAS 39 impairment loss on certain investments in equity securities previously measured at cost and the loss was accumulated in retained earnings. Since those investments were designated as at FVTOCI under IFRS 9 and no impairment assessment is required, an adjustment was made that resulted in a decrease of $78,604 thousand in other equity - unrealized gain (loss) on financial assets at FVTOCI and an increase of $78,604 thousand in retained earnings on January 1, 2018.
c) Debt investments previously classified as available-for-sale under IAS 39 were classified as at
FVTPL under IFRS 9, because on initial recognition, the contractual cash flows were not solely payments of principal and interest on the principal outstanding. As a result of retrospective application, a related adjustment was made that resulted in an increase in retained earnings of $2,611 thousand on January 1, 2018.
Debt investments previously classified as available-for-sale under IAS 39 were classified as at FVTOCI with an assessment of expected credit losses under IFRS 9, because on January 1, 2018, the contractual cash flows were solely payments of principal and interest on the principal outstanding and based on the facts and circumstances that existed on January 1, 2018, it was assessed that these investments were held within a business model whose objective is achieved by both collecting contractual cash flows and selling financial assets. As a result of retrospective application, the related adjustments comprised a decrease in unrealized gain of $1,093 thousand. Debt investments previously classified as held-to-maturity financial assets under IAS 39 were classified as at amortized cost under IFRS 9 because on initial recognition the contractual cash flows were solely payments of principal and interest on the principal outstanding and based on the facts and circumstances that existed on January 1, 2018, it was assessed that these investments were held within a business model whose objective is to collect contractual cash flows.
d) Notes receivable, trade receivables, other receivables, and other current assets (including related parties) that were previously classified as loans and receivables under IAS 39 were classified as at amortized cost with an assessment of expected credit losses under IFRS 9.
e) As a result of the retrospective application of IFRS 9 by associates, there was a decrease in
other equity - unrealized gain (loss) on available-for-sale financial assets of $235 thousand and an increase in retained earnings of $235 thousand on January 1, 2018.
2) IFRS 15 “Revenue from Contracts with Customers” and related amendments
IFRS 15 establishes principles for recognizing revenue that apply to all contracts with customers and supersedes IAS 18 “Revenue”, IAS 11 “Construction Contracts” and a number of revenue-related interpretations. Refer to Note 4 for the related accounting policies. In identifying performance obligations, IFRS 15 and the related amendments require that a good or service is distinct if it is capable of being distinct (for example, the Company regularly sells it separately) and the promise to transfer it is distinct within the context of the contract (i.e. the nature of the promise in the contract is to transfer each good or service individually rather than to transfer a combined output).

220
Under IFRS 15, the net effect of revenue recognized and consideration received and receivable is recognized as a contract asset or a contract liability. Prior to the application of IFRS 15, receivables were recognized or deferred revenue was reduced when revenue was recognized for the relevant contract under IAS 18. The Company elected only to retrospectively apply IFRS 15 to contracts that were not complete as of January 1, 2018 and recognize the cumulative effect of the change in retained earnings on January 1, 2018. For all contract modifications that occurred on or before December 31, 2017, the Company did not apply the requirements in IFRS 15 individually to each of the modifications, and the Company identified the performance obligations and determined and allocated the transaction price in a manner that reflected the aggregate effect of all modifications that occurred on or before December 31, 2017. This reduced the complexity and cost of retrospective application and resulted in financial information that closely aligns with the financial information that would be available under IFRS 15 without the expedient. Anticipated impact on assets, liabilities and equity
January 1, 2018 As Originally
Stated
Adjustments Arising from
Initial Application
January 1, 2018 Restated
Refund liabilities (other current liabilities) $ - $ 5,089 $ 5,089 Provisions 5,089 (5,089) - Contract liabilities (other current
liabilities) - 1,933 1,933 Temporary credits (other current
liabilities) 1,933 (1,933) - $ 7,022 $ - $ 7,022
3) Amendments to IAS 12 “Recognition of Deferred Tax Assets for Unrealized Losses” The amendments clarify that the difference between the carrying amount of the debt instrument measured at fair value and its tax base gives rise to a temporary difference, even though there are unrealized losses on that asset, irrespective of whether the Company expects to recover the carrying amount of the debt instrument by sale or by holding it and collecting contractual cash flows. In addition, in determining whether to recognize a deferred tax asset, the Company should assess a deductible temporary difference in combination with all of its other deductible temporary differences, unless the tax law restricts the utilization of losses as deduction against income of a specific type, in which case, a deductible temporary difference is assessed in combination only with other deductible temporary differences of the appropriate type. The amendments also stipulate that, when determining whether to recognize a deferred tax asset, the estimate of probable future taxable profit may include some of the Company’s assets for more than their carrying amount if there is sufficient evidence that it is probable that the Company will achieve the higher amount and that the estimate for future taxable profit should exclude tax deductions resulting from the reversal of deductible temporary differences. Prior to the amendment, in assessing a deferred tax asset, the company assumed that it will recover the asset at its carrying amount when estimating probable future taxable profit. The company applied the above amendments retrospectively in 2018.

221
4) Amendments to IAS 40 “Transfers of Investment Property”
The amendments clarify that the Company should transfer to, or from, investment property when, and only when, the property meets, or ceases to meet, the definition of investment property and there is evidence of a change in use. In isolation, a change in management’s intentions for the use of a property does not provide evidence of a change in use. The amendments also clarify that evidence of a change in use is not limited to those illustrated in IAS 40.
5) IFRIC 22 “Foreign Currency Transactions and Advance Consideration”
IAS 21 stipulated that a foreign currency transaction shall be recorded on initial recognition in the functional currency by applying to the foreign currency amount the spot exchange rate between the functional currency and the foreign currency at the date of the transaction. IFRIC 22 further explains that the date of the transaction is the date on which an entity recognizes a non-monetary asset or non-monetary liability from payment or receipt of advance consideration. If there are multiple payments or receipts in advance, the entity shall determine the date of the transaction for each payment or receipt of advance consideration.
When the amendments are applied prospectively from January 1, 2019, the disclosure of related party transactions are enhanced.
b. The Regulations Governing the Preparation of Financial Reports by Securities Issuers and the
International Financial Reporting Standards (IFRS), International Accounting Standards (IAS), Interpretations of IFRS (IFRIC), and Interpretations of IAS (SIC) (collectively, the IFRSs) endorsed by the FSC for application starting from 2019
New IFRSs Effective Date
Announced by IASB (Note 1) Annual Improvements to IFRSs 2015-2017 Cycle January 1, 2019 Amendments to IFRS 9 “Prepayment Features with Negative
Compensation” January 1, 2019 (Note 2)
IFRS 16 “Leases” January 1, 2019 Amendments to IAS 19 “Plan Amendment, Curtailment or
Settlement” January 1, 2019 (Note 3)
Amendments to IAS 28 “Long-term Interests in Associates and Joint Ventures”
January 1, 2019
IFRIC 23 “Uncertainty over Income Tax Treatments” January 1, 2019 Note 1: Unless stated otherwise, the above New IFRSs are effective for annual periods beginning on
or after their respective effective dates. Note 2: The FSC permits the election for early adoption of the amendments starting from 2018. Note 3: The Company shall apply these amendments to plan amendments, curtailments or settlements
occurring on or after January 1, 2019. 1) IFRS 16 “Leases”
IFRS 16 sets out the accounting standards for leases that will supersede IAS 17, IFRIC 4 and a number of related interpretations.

222
Definition of a lease Upon initial application of IFRS 16, the Company will elect to apply the guidance of IFRS 16 in determining whether contracts are, or contain, a lease only to contracts entered into (or changed) on or after January 1, 2019. Contracts identified as containing a lease under IAS 17 and IFRIC 4 will not be reassessed and will be accounted for in accordance with the transitional provisions under IFRS 16. The Company as lessee Upon initial application of IFRS 16, the Company will recognize right-of-use assets or investment properties if the right-of-use assets meet the definition of investment properties, and lease liabilities for all leases on the balance sheets except for those whose payments under low-value asset and short-term leases will be recognized as expenses on a straight-line basis. On the statements of comprehensive income, the Company will present the depreciation expense charged on right-of-use assets separately from the interest expense accrued on lease liabilities; interest is computed using the effective interest method. On the statements of cash flows, cash payments for the principal portion of lease liabilities will be classified within financing activities; cash payments for the interest portion will be classified within operating activities. Currently, payments under operating lease contracts, including property interest qualified as investment properties, are recognized as expenses on a straight-line basis prior IFRS 16. Cash flows for operating leases are classified within operating activities on the statements of cash flows. Leased assets and finance lease payables are recognized for contracts classified as finance leases. The Company anticipates applying IFRS 16 retrospectively with the cumulative effect of the initial application of this standard recognized on January 1, 2019. Comparative information will not be restated. Lease liabilities will be measured at the present value of the remaining lease payments, discounted using the lessee’s incremental borrowing rate on January 1, 2019 under IAS 17. Right-of-use assets will be measured at their carrying amount as if IFRS 16 had been applied since the commencement date, but discounted using the aforementioned incremental borrowing rate. Except for the following practical expedients which are to be applied, the Company will apply IAS 36 to all right-of-use assets. The Company expects to apply the following practical expedients: a) The Company will apply a single discount rate to a portfolio of leases with reasonably similar
characteristics to measure lease liabilities. b) The Company will account for those leases for which the lease term ends on or before
December 31, 2019 as short-term leases. c) The Company will exclude initial direct costs from the measurement of right-of-use assets on
January 1, 2019. d) The Company will use hindsight, such as in determining lease terms, to measure lease liabilities. For leases currently classified as finance leases under IAS 17, the carrying amounts of right-of-use assets and lease liabilities on January 1, 2019 will be determined as at the carrying amounts of the respective leased assets and finance lease payables as of December 31, 2018.

223
The Company as lessor Except for sublease transactions, the Company will not make any adjustments for leases in which it is a lessor and will account for those leases with the application of IFRS 16 starting from January 1, 2019. Anticipated impact on assets, liabilities and equity
Carrying Amount as of December 31,
2018
Adjustments Arising from
Initial Application
Adjusted Carrying
Amount as of January 1, 2019
Right-of-use assets $ - $ 64,308 $ 64,308 Total effect on assets $ - $ 64,308 $ 64,308 Lease liabilities - current $ - $ 23,773 $ 23,773 Lease liabilities - non-current - 40,535 40,535 Total effect on liabilities $ - $ 64,308 $ 64,308
2) IFRIC 23 “Uncertainty over Income Tax Treatments”
IFRIC 23 clarifies that when there is uncertainty over income tax treatments, the Company should assume that the taxation authority will have full knowledge of all related information when making related examinations. If the Company concludes that it is probable that the taxation authority will accept an uncertain tax treatment, the Company should determine the taxable profit, tax bases, unused tax losses, unused tax credits or tax rates consistently with the tax treatments used or planned to be used in its income tax filings. If it is not probable that the taxation authority will accept an uncertain tax treatment, the Company should make estimates using either the most likely amount or the expected value of the tax treatment, depending on which method the Company expects to better predict the resolution of the uncertainty. The Company has to reassess its judgments and estimates if facts and circumstances change. Upon initial application of IFRIC 23, the Company will recognize the cumulative effect of retrospective application on retained earnings on January 1, 2019.
3) Amendments to IFRS 9 “Prepayment Features with Negative Compensation” IFRS 9 stipulated that if a contractual term of a financial asset permits the issuer (i.e. the debtor) to prepay a debt instrument or permits the holder (i.e. the creditor) to put a debt instrument back to the issuer before maturity and the prepayment amount substantially represents unpaid amounts of the principal and interest on the principal amount outstanding, which may include reasonable compensation for early termination, the financial asset has contractual cash flows that are solely payments of principal and interest on the principal amount outstanding. The amendments further explain that reasonable compensation may be paid or received by either of the parties, i.e. a party may receive reasonable compensation when it chooses to terminate the contract early. Upon initial application of the above amendments, the Company will recognize the cumulative effect of retrospective application on retained earnings on January 1, 2019.

224
4) Amendments to IAS 19 “Plan Amendment, Curtailment or Settlement”
The amendments stipulate that, if a plan amendment, curtailment or settlement occurs, the current service cost and the net interest for the remainder of the annual reporting period are determined using the actuarial assumptions used for the remeasurement of the net defined benefit liabilities (assets). In addition, the amendments clarify the effect of a plan amendment, curtailment or settlement on the requirements regarding the asset ceiling. The Company will apply the above amendments prospectively. Except for the above impacts, as of the date the financial statements were authorized for issue, the Company continues assessing other possible impacts that the application of the aforementioned amendments and the related amendments to the Regulations Governing the Preparation of Financial Reports by Securities Issuers will have on the Company’s financial position and financial performance and will disclose these other impacts when the assessment is completed.
c. New IFRSs in issue but not yet endorsed and issued into effect by the FSC
New IFRSs Effective Date
Announced by IASB (Note 1) Amendments to IFRS 3 “Definition of a Business” January 1, 2020 (Note 2) Amendments to IFRS 10 and IAS 28 “Sale or Contribution of Assets
between an Investor and its Associate or Joint Venture” To be determined by IASB
IFRS 17 “Insurance Contracts” January 1, 2021 Amendments to IAS 1 and IAS 8 “Definition of Material” January 1, 2020 (Note 3) Note 1: Unless stated otherwise, the above New IFRSs are effective for annual periods beginning on
or after their respective effective dates. Note 2: The Company shall apply these amendments to business combinations for which the
acquisition date is on or after the beginning of the first annual reporting period beginning on or after January 1, 2020 and to asset acquisitions that occur on or after the beginning of that period.
Note 3: The Company shall apply these amendments prospectively for annual reporting periods
beginning on or after January 1, 2020.
1) Amendments to IFRS 3 “Definition of a Business” The amendments clarify that, to be considered a business, an acquired set of activities and assets must include, at a minimum, an input and a substantive process applied to the input that together significantly contribute to the ability to create outputs. The amendments narrow the definitions of outputs by focusing on goods and services provided to customers, and the reference to an ability to reduce costs is removed. Moreover, the amendments remove the assessment of whether market participants are capable of replacing any missing inputs or processes and continuing to produce outputs. In addition, the amendments introduce an optional concentration test that permits a simplified assessment of whether an acquired set of activities and assets is not a business.
Except for the above impact, as of the date the parent company only financial statements were authorized for issue, the Company is continuously assessing the possible impact that the application of other standards and interpretations will have on the Company’s financial position and financial performance and will disclose the relevant impact when the assessment is completed.

225
4. SUMMARY OF SIGNIFICANT ACCOUNTING POLICIES a. Statement of compliance
The parent company only financial statements have been prepared in accordance with the Regulations Governing the Preparation of Financial Reports by Securities Issuers.
b. Basis of preparation
The financial statements have been prepared on the historical cost basis except for financial instruments which are measured at fair value, and net defined benefit liabilities which are measured at the present value of the defined benefit obligation less the fair value of plan assets. The fair value measurements, which are grouped into Levels 1 to 3 based on the degree to which the fair value measurement inputs are observable and based on the significance of the inputs to the fair value measurement in its entirety, are described as follows: 1) Level 1 inputs are quoted prices (unadjusted) in active markets for identical assets or liabilities; 2) Level 2 inputs are inputs other than quoted prices included within Level 1 that are observable for an
asset or liability, either directly (i.e. as prices) or indirectly (i.e. derived from prices); and 3) Level 3 inputs are unobservable inputs for an asset or liability.
When preparing its parent company only financial statements, the Company used the equity method to account for its investments in subsidiaries and associates. In order for the amounts of the net profit for the year, other comprehensive income for the year and total equity in the parent company only financial statements to be the same as the amounts attributable to the owner of the Company in its consolidated financial statements, adjustments arising from the differences in accounting treatment between parent company only basis and consolidated basis were made to investments accounted for by equity method, share of profit or loss of subsidiaries and associates, share of other comprehensive income of subsidiaries and associates and related equity items, as appropriate, in the parent company only financial statements.
c. Classification of current and non-current assets and liabilities
Current assets include: 1) Assets held primarily for the purpose of trading; 2) Assets expected to be realized within 12 months after the reporting period; and 3) Cash and cash equivalents unless the asset is restricted from being exchanged or used to settle a
liability for at least 12 months after the reporting period. Current liabilities include: 1) Liabilities held primarily for the purpose of trading; 2) Liabilities due to be settled within 12 months after the reporting period; and 3) Liabilities for which the Company does not have an unconditional right to defer settlement for at
least 12 months after the reporting period. Terms of a liability that could, at the option of the counterparty, result in its settlement by the issue of equity instruments do not affect its classification.

226
Assets and liabilities that are not classified as current are classified as non-current. d. Foreign currencies
In preparing the parent company only financial statements of each individual group entity, transactions in currencies other than the Company’s functional currency (i.e. foreign currencies) are recognized at the rates of exchange prevailing at the dates of the transactions. At the end of each reporting period, monetary items denominated in foreign currencies are retranslated at the rates prevailing at that date. Exchange differences on monetary items arising from settlement or translation are recognized in profit or loss in the period in which they arise. Non-monetary items measured at fair value that are denominated in foreign currencies are retranslated at the rates prevailing at the date when the fair value was determined. Exchange differences arising from the retranslation of non-monetary items are included in profit or loss for the period except for exchange differences arising from the retranslation of non-monetary items in respect of which gains and losses are recognized directly in other comprehensive income, in which cases, the exchange differences are also recognized directly in other comprehensive income. Non-monetary items that are measured at historical cost in a foreign currency are not retranslated.
e. Inventories
Inventories consist of raw materials, supplies, spare parts, finished goods, merchandise and work in progress and are stated at the lower of cost or net realizable value. Inventory write-downs are made by item, except where it may be appropriate to group similar or related items. Net realizable value is the estimated selling price of inventories less all estimated costs of completion and costs necessary to make the sale. Inventories are recorded at standard cost and adjusted to approximate weighted - average cost on the balance sheet date.
f. Investments in subsidiaries
The Company uses the equity method to account for its investments in subsidiaries. Subsidiaries are the entities controlled by the Company.
Under the equity method, an investment in a subsidiary is initially recognized at cost and the carrying amount is increased or decreased to recognize the Company’s share of the profit or loss and other comprehensive income of the subsidiary after the date of acquisition. Besides, the Company also recognizes the Company’s share of the change in other equity of the subsidiary. Changes in the Company’s ownership interest in a subsidiary that do not result in the Company losing control of the subsidiary are equity transactions. The Company recognizes directly in equity any difference between the carrying amount of the investment and the fair value of the consideration paid or received. When the Company’s share of losses of a subsidiary exceeds its interest in that subsidiary (which includes any carrying amount of the investment accounted for by the equity method and long-term interests that, in substance, form part of the Company’s net investment in the subsidiary), the Company continues recognizing its share of further losses.

227
The Company assesses its investment for any impairment by comparing the carrying amount with the estimated recoverable amount as assessed based on the entire financial statements of the invested company. Impairment loss is recognized when the carrying amount exceeds the recoverable amount. If the recoverable amount of the investment subsequently increases, the Company recognizes the reversal of the impairment loss; the adjusted post-reversal carrying amount should not exceed the carrying amount that would have been recognized (net of amortization or depreciation) had no impairment loss been recognized in prior years. An impairment loss recognized on goodwill cannot be reversed in a subsequent period. When the Company loses control of a subsidiary, it recognizes the investment retained in the former subsidiary at its fair value at the date when control is lost. The difference between the fair value of the retained investment plus any consideration received and the carrying amount of the previous investment at the date when control is lost is recognized as a gain or loss in profit or loss. Besides, the Company accounts for all amounts previously recognized in other comprehensive income in relation to that subsidiary on the same basis as would be required if the Company had directly disposed of the related assets or liabilities. Profits or losses resulting from downstream transactions are eliminated in full only in the parent company only financial statements. Profits and losses resulting from upstream transactions and transactions between subsidiaries are recognized only in the parent company financial statements only to the extent of interests in the subsidiaries that are not related to the Company.
g. Property, plant and equipment
Property, plant and equipment are stated at cost and subsequently stated at cost, less recognized accumulated depreciation and accumulated impairment loss. Freehold land is not depreciated. Depreciation of property, plant and equipment is recognized using the straight-line method. Each significant part is depreciated separately. The estimated useful lives, residual values and depreciation methods are reviewed at the end of each reporting period, with the effects of any changes in estimates accounted for on a prospective basis. On derecognition of an item of property, plant and equipment, the difference between the sales proceeds and the carrying amount of the asset is recognized in profit or loss.
h. Investment properties
Investment properties are properties held to earn rentals and/or for capital appreciation (including property under construction for such purposes). Investment properties also include land held for a currently undetermined future use. Investment properties are initially measured at cost, including transaction costs. Subsequent to initial recognition, investment properties are measured at cost less accumulated depreciation and accumulated impairment loss. Depreciation is recognized using the straight-line method. On derecognition of an investment property, the difference between the net disposal proceeds and the carrying amount of the asset is included in profit or loss.

228
i. Intangible assets
1) Intangible assets acquired separately
Intangible assets with finite useful lives that are acquired separately are initially measured at cost and subsequently measured at cost less accumulated amortization and accumulated impairment loss. Amortization is recognized on a straight-line basis. The estimated useful life, residual value, and amortization method are reviewed at the end of each reporting period, with the effect of any changes in estimates accounted for on a prospective basis. Intangible assets with indefinite useful lives that are acquired separately are measured at cost less accumulated impairment loss.
2) Internally-generated intangible assets - research and development expenditure
Expenditure on research activities is recognized as an expense in the period in which it is incurred.
3) Derecognition of intangible assets On derecognition of an intangible asset, the difference between the net disposal proceeds and the carrying amount of the asset is recognized in profit or loss.
j. Impairment of tangible and intangible assets
At the end of each reporting period, the Company reviews the carrying amounts of its tangible and intangible assets, to determine whether there is any indication that those assets have suffered an impairment loss. If any such indication exists, the recoverable amount of the asset is estimated in order to determine the extent of the impairment loss. When it is not possible to estimate the recoverable amount of an individual asset, the Company estimates the recoverable amount of the cash-generating unit to which the asset belongs. Corporate assets are allocated to the individual cash-generating units on a reasonable and consistent basis of allocation. Intangible assets with indefinite useful lives and intangible assets not yet available for use are tested for impairment at least annually, and whenever there is an indication that the asset may be impaired.
The recoverable amount is the higher of fair value less costs to sell and value in use. If the recoverable amount of an asset or cash-generating unit is estimated to be less than its carrying amount, the carrying amount of the asset or cash-generating unit is reduced to its recoverable amount, with the resulting impairment loss recognized in profit or loss. When an impairment loss is subsequently reversed, the carrying amount of the asset or cash-generating unit is increased to the revised estimate of its recoverable amount, but only to the extent of the carrying amount that would have been determined had no impairment loss been recognized for the asset or cash-generating unit in prior years. A reversal of an impairment loss is recognized in profit or loss.
k. Financial instruments
Financial assets and financial liabilities are recognized when a group entity becomes a party to the contractual provisions of the instruments. Transaction costs that are directly attributable to the acquisition or issue of financial assets and financial liabilities (other than financial assets and financial liabilities at fair value through profit or loss) are added to or deducted from the fair value of the financial assets or financial liabilities, as appropriate, on initial recognition. Transaction costs directly attributable to the acquisition of financial assets or financial liabilities at fair value through profit or loss are recognized immediately in profit or loss.

229
1) Financial assets
All regular way purchases or sales of financial assets are recognized and derecognized on a settlement date basis.
a) Measurement category
2018 Financial assets are classified into the following categories: financial assets at FVTPL, financial assets at amortized cost, and investments in debt instruments and equity instruments at FVTOCI.
i. Financial assets at FVTPL
Financial assets measured at FVTPL include financial assets mandatorily measured or designated as at FVTPL. Financial assets mandatorily measured at FVTPL include investments in equity instruments which are not designated as at FVTOCI and debt instruments that do not meet the amortized cost criteria or the FVTOCI criteria. Financial assets at fair value through profit or loss are stated at fair value, with any gains or losses arising on remeasurement recognized in profit or loss. The net gain or loss recognized in profit or loss incorporates any dividend or interest earned on the financial asset. Fair value is determined in the manner described in Note 35.
ii. Financial assets at amortized cost
Financial assets that meet the following conditions are subsequently measured at amortized cost: i) The financial asset is held within a business model whose objective is to hold financial
assets in order to collect contractual cash flows; and ii) The contractual terms of the financial asset give rise on specified dates to cash flows
that are solely payments of principal and interest on the principal amount outstanding. Subsequent to initial recognition, financial assets at amortized cost (including cash and cash equivalents, accounts receivable, other receivables measured at amortized cost, and time deposits with original maturities of over 3 months) are measured at amortized cost, which equals the gross carrying amount determined using the effective interest method less any impairment loss. Exchange differences are recognized in profit or loss. Interest income is calculated by applying the effective interest rate to the gross carrying amount of such a financial asset, except for: i) Purchased or originated credit-impaired financial assets, for which interest income is
calculated by applying the credit-adjusted effective interest rate to the amortized cost of such financial assets;
ii) Financial assets that are not credit-impaired on purchase or origination but have
subsequently become credit-impaired, for which interest income is calculated by applying the effective interest rate to the amortized cost of such financial assets in subsequent reporting periods.

230
Cash equivalents include short-term investments or time deposits with original maturities of less than three months, which are highly liquid, readily convertible to a known amount of cash, and are subject to an insignificant risk of changes in value. These cash equivalents are held for the purpose of meeting short-term cash commitments.
iii. Investments in debt instruments at FVTOCI
Debt instruments that meet the following conditions are subsequently measured at FVTOCI: i) The debt instrument is held within a business model whose objective is achieved by both
the collecting of contractual cash flows and the selling of such financial assets; and ii) The contractual terms of the financial asset give rise on specified dates to cash flows
that are solely payments of principal and interest on the principal amount outstanding. Investments in debt instruments at FVTOCI are subsequently measured at fair value. Changes in the carrying amounts of these debt instruments relating to changes in foreign currency exchange rates, interest income calculated using the effective interest method and impairment losses or reversals are recognized in profit or loss. Other changes in the carrying amount of these debt instruments are recognized in other comprehensive income and will be reclassified to profit or loss when the investment is disposed of.
iv. Investments in equity instruments at FVTOCI
If an equi ty i nvestment is not hel d for tr adi ng, an entity can make an irrevocabl e elec tion at i nitial recogniti on to measure it at FVTOCI with onl y di vidend i ncome r ecognised in profit or loss. On initial recognition, the Company may make an irrevocable election to designate investments in equity instruments as at FVTOCI. Designation as at FVTOCI is not permitted if the equity investment is held for trading or if it is contingent consideration recognized by an acquirer in a business combination. Investments in equity instruments at FVTOCI are subsequently measured at fair value with gains and losses arising from changes in fair value recognized in other comprehensive income and accumulated in other equity. The cumulative gain or loss will not be reclassified to profit or loss on disposal of the equity investments; instead, it will be transferred to retained earnings. Dividends are recognized in profit and loss when the Company’s right to receive the dividends is established, unless they clearly represent a recovery of part of the cost of the investment, in which case, they are included in OCI.
2017 Financial assets are classified into the following categories: Financial assets at FVTPL, held-to-maturity investments, available-for-sale financial assets and loans and receivables. i. Financial assets at FVTPL
Financial assets are classified as at FVTPL when such financial assets are either held for trading or designated as at FVTPL. Financial assets at FVTPL are stated at fair value, with any gains or losses arising on remeasurement recognized in profit or loss. The net gain or loss recognized in profit or loss incorporates any dividends or interest earned on such a financial asset. Fair value is determined in the manner described in Note 35.

231
ii. Held-to-maturity investments
Corporate bonds which the Company has a positive intent and ability to hold to maturity are classified as held-to-maturity investments. Subsequent to initial recognition, held-to-maturity investments are measured at amortized cost using the effective interest method less any impairment.
iii. Available-for-sale financial assets
Available-for-sale financial assets are non-derivatives that are either designated as available-for-sale or are not classified as loans and receivables, held-to-maturity investments or financial assets at FVTPL. Available-for-sale financial assets are measured at fair value. Changes in the carrying amounts of available-for-sale monetary financial assets (relating to changes in foreign currency exchange rates, interest income calculated using the effective interest method and dividends on available-for-sale equity investments) are recognized in profit or loss. Other changes in the carrying amount of available-for-sale financial assets are recognized in other comprehensive income and will be reclassified to profit or loss when such investments are disposed of or are determined to be impaired. Dividends on available-for-sale equity instruments are recognized in profit or loss when the Company’s right to receive the dividends is established. Available-for-sale equity investments that do not have a quoted market price in an active market and whose fair value cannot be reliably measured and derivatives that are linked to and must be settled by delivery of such unquoted equity investments are measured at cost less any identified impairment loss at the end of each reporting period and presented as a separate line item as financial assets measured at cost. If, in a subsequent period, the fair value of the financial assets can be reliably measured, the financial assets are remeasured at fair value. The difference between the carrying amount and the fair value of such financial assets is recognized in other comprehensive income. Any impairment losses are recognized in profit and loss.
iv. Loans and receivables
Loans and receivables (including cash and cash equivalents, notes receivable and trade receivables, other receivables and debt investments with no active market) are measured using the effective interest method at amortized cost less any impairment, except for short-term receivables when the effect of discounting is immaterial. Cash equivalents include time deposits and bonds with repurchase agreements investments with original maturities within 3 months from the date of acquisition, which are highly liquid, readily convertible to a known amount of cash and are subject to an insignificant risk of changes in value. These cash equivalents are held for the purpose of meeting short-term cash commitments.
b) Impairment of financial assets
2018
The Company recognizes a loss allowance for expected credit losses on financial assets at amortized cost (including trade receivables) and, investments in debt instruments that are measured at FVTOCI.

232
The Company always recognizes lifetime expected credit losses (i.e. ECLs) for trade receivables. For all other financial instruments, the Company recognizes lifetime ECLs when there has been a significant increase in credit risk since initial recognition. If, on the other hand, the credit risk on a financial instrument has not increased significantly since initial recognition, the Company measures the loss allowance for that financial instrument at an amount equal to 12-month ECLs. For financial instruments and contract assets, the Company recognizes lifetime ECLs when there has been a significant increase in credit risk since initial recognition. If, on the other hand, the credit risk on a financial instrument has not increased significantly since initial recognition, the Company measures the loss allowance for that financial instrument at an amount equal to 12-month ECLs. Expected credit losses reflect the weighted average of credit losses with the respective risks of default occurring as the weights. Lifetime ECLs represent the expected credit losses that will result from all possible default events over the expected life of a financial instrument. In contrast, 12-month ECLs represent the portion of lifetime ECLs that is expected to result from default events on a financial instrument that are possible within 12 months after the reporting date. The Company recognizes an impairment gain or loss in profit or loss for all financial instruments with a corresponding adjustment to their carrying amount through a loss allowance account, except for investments in debt instruments that are measured at FVTOCI, for which the loss allowance is recognized in other comprehensive income and does not reduce the carrying amount of such a financial asset. 2017
Financial assets, other than those at FVTPL, are assessed for indicators of impairment at the end of each reporting period. Financial assets are considered to be impaired when there is objective evidence, as a result of one or more events that occurred after the initial recognition of such financial assets, that the estimated future cash flows of the investment have been affected. Financial assets at amortized cost, such as trade receivables, are assessed for impairment on a collective basis even if they were assessed not to be impaired individually. Objective evidence of impairment for a portfolio of receivables could include the Company’s past experience with collecting payments, an increase in the number of delayed payments in the portfolio past the average credit period of 60 days, as well as observable changes in national or local economic conditions that correlate with defaults on receivables, and other situations. For a financial asset at amortized cost, the amount of the impairment loss recognized is the difference between such an asset’s carrying amount and the present value of its estimated future cash flows, discounted at the financial asset’s original effective interest rate. For a financial asset at amortized cost, if, in a subsequent period, the amount of the impairment loss decreases and the decrease can be related objectively to an event occurring after the impairment was recognized, the previously recognized impairment loss is reversed through profit or loss to the extent that the carrying amount of the investment (at the date on which the impairment is reversed) does not exceed what the amortized cost would have been had the impairment not been recognized. For available-for-sale equity investments, a significant or prolonged decline in the fair value of the security below its cost is considered to be objective evidence of impairment. For all other financial assets, objective evidence of impairment could include significant financial difficulty of the issuer or counterparty, breach of contract such as a default or delinquency in interest or principal payments, it becoming probable that the borrower will enter

233
bankruptcy or financial re-organization, or the disappearance of an active market for those financial assets because of financial difficulties.
When an available-for-sale financial asset is considered to be impaired, cumulative gains or losses previously recognized in other comprehensive income are reclassified to profit or loss in the period. In respect of available-for-sale equity securities, impairment loss previously recognized in profit or loss is not reversed through profit or loss. Any increase in fair value subsequent to impairment is recognized in other comprehensive income. In respect of available-for-sale debt securities, impairment loss is subsequently reversed through profit or loss if an increase in the fair value of such an investment can be objectively related to an event occurring after the recognition of the impairment loss. For a financial asset measured at cost, the amount of the impairment loss is measured as the difference between such an asset’s carrying amount and the present value of its estimated future cash flows discounted at the current market rate of return for a similar financial asset. Such impairment loss will not be reversed in subsequent periods. The carrying amount of a financial asset is reduced by the impairment loss directly for all financial assets, with the exception of trade receivables, where the carrying amount is reduced through the use of an allowance account. When trade receivables are considered uncollectible, they are written off against the allowance account. Subsequent recoveries of amounts previously written off are credited against the allowance account. Changes in the carrying amount of the allowance account are recognized in profit or loss except for uncollectible trade receivables that are written off against the allowance account.
c) Derecognition of financial assets
The Company derecognizes a financial asset only when the contractual rights to the cash flows from the financial asset expire, or when it transfers the financial asset and substantially all the risks and rewards of ownership of the financial asset to another party. Before 2017, on derecognition of a financial asset in its entirety, the difference between the asset’s carrying amount and the sum of the consideration received and receivable and the cumulative gain or loss which had been recognized in other comprehensive income is recognized in profit or loss. Starting from 2018, on derecognition of a financial asset at amortized cost in its entirety, the difference between the asset’s carrying amount and the sum of the consideration received and receivable is recognized in profit or loss. On derecognition of an investment in a debt instrument at FVTOCI, the difference between the asset’s carrying amount and the sum of the consideration received and receivable and the cumulative gain or loss which had been recognized in other comprehensive income is recognized in profit or loss. However, on derecognition of an investment in an equity instrument at FVTOCI, the difference between the asset’s carrying amount and the sum of the consideration received and receivable is recognized in profit or loss, and the cumulative gain or loss which had been recognized in other comprehensive income is transferred directly to retained earnings, without recycling through profit or loss.
2) Equity instruments
Debt and equity instruments issued by the Company are classified as either financial liabilities or as equity in accordance with the substance of the contractual arrangements and the definitions of a financial liability and an equity instrument. Equity instruments issued by the Company are recognized at the proceeds received, net of direct issue costs.

234
The repurchase of the Company’s own equity instruments is recognized in and deducted directly from equity. No gain or loss is recognized in profit or loss on the purchase, sale, issuance or cancellation of the Company’s own equity instruments.
3) Financial liabilities
a) Subsequent measurement
Except for the following situation, all financial liabilities are measured at amortized cost using the effective interest method:
i. Financial liabilities at FVTPL
Financial liabilities held for trading are stated at fair value, with any gain or loss arising on remeasurement recognized in profit or loss. Fair value is determined in the manner described in Note 35.
b) Derecognition of financial liabilities
The difference between the carrying amount of a financial liability derecognized and the consideration paid, including any non-cash assets transferred or liabilities assumed, is recognized in profit or loss.
4) Derivative financial instruments
The Company enters into a variety of derivative financial instruments to manage its exposure to interest rate and foreign exchange rate risks, including cross currency swaps and convertible bond asset swaps. Derivatives are initially recognized at fair value at the date on which the derivative contracts are entered into and are subsequently remeasured to their fair value at the end of each reporting period. The resulting gain or loss is recognized in profit or loss immediately unless the derivative is designated and effective as a hedging instrument; in which event, the timing of the recognition in profit or loss depends on the nature of the hedging relationship. When the fair value of a derivative financial instrument is positive, the derivative is recognized as a financial asset; when the fair value of a derivative financial instrument is negative, the derivative is recognized as a financial liability. Before 2017, derivatives embedded in non-derivative host contracts were treated as separate derivatives when they met the definition of a derivative; their risks and characteristics were not closely related to those of the host contracts; and the contracts were not measured at FVTPL. Starting from 2018, derivatives embedded in hybrid contracts that contain financial asset hosts that is within the scope of IFRS 9 are not separated; instead, the classification is determined in accordance with the entire hybrid contract. Derivatives embedded in non-derivative host contracts that are not financial assets that is within the scope of IFRS 9 (e.g. financial liabilities) are treated as separate derivatives when they meet the definition of a derivative; their risks and characteristics are not closely related to those of the host contracts; and the host contracts are not measured at FVTPL.
l. Provisions
Provisions are measured at the best estimate of the discounted cash flows of the consideration required to settle the present obligation at the end of the reporting period, taking into account the risks and uncertainties surrounding the obligation.

235
m. Revenue Recognition
2018 The Company identifies contracts with customers, allocates the transaction price to the performance obligations and recognizes revenue when performance obligations are satisfied. Revenue from the sale of goods comes from sales of integrated circuits. Sales of integrated circuits are recognized as revenue when the goods are delivered to the customer’s specific location because it is the time when the customer has full discretion over the manner of distribution and price to sell the goods, has the primary responsibility for sales to future customers and bears the risks of obsolescence. The Company does not recognize revenue on materials delivered to subcontractors because this delivery does not involve a transfer of control. 2017 Revenue is measured at the fair value of the consideration received or receivable. Revenue is reduced for estimated customer returns, rebates and other similar allowances. Allowances for sales returns and liabilities for returns are recognized at the time of sale based on the seller’s reliable estimate of future returns and based on past experience and other relevant factors. 1) Sale of goods
Revenue from the sale of goods is recognized when all the following conditions are satisfied: a) The Company has transferred to the buyer the significant risks and rewards of ownership of the
goods; b) The Company retains neither continuing managerial involvement to the degree usually
associated with ownership nor effective control over the goods sold; c) The amount of revenue can be measured reliably; d) It is probable that the economic benefits associated with the transaction will flow to the
Company; and e) The costs incurred or to be incurred in respect of the transaction can be measured reliably. The Company does not recognize sales revenue on materials delivered to subcontractors because this delivery does not involve a transfer of risks and rewards of the materials’ ownership.
2) Rendering of services
Service income is recognized when services are provided. 3) Dividend and interest income
Dividend income from investments is recognized when the shareholder’s right to receive payment has been established provided that it is probable that the economic benefits will flow to the Company and the amount of income can be measured reliably.
Interest income from a financial asset is recognized when it is probable that the economic benefits will flow to the Company and the amount of income can be measured reliably. Interest income is accrued on a time basis by reference to the principal outstanding and at the effective interest rate applicable.

236
n. Leasing
Leases are classified as finance leases whenever the terms of the lease transfer substantially all the risks and rewards of ownership to the lessee. All other leases are classified as operating leases. 1) The Company as lessor
Rental income from operating leases is recognized on a straight-line basis over the term of the relevant lease. Initial direct costs incurred in negotiating and arranging an operating lease are added to the carrying amount of the leased asset and amortized on a straight-line basis over the lease term.
2) The Company as lessee
Operating lease payments are recognized as an expense on a straight-line basis over the lease term.
o. Borrowing costs
Borrowing costs are recognized in profit or loss in the period in which they are incurred.
p. Employee benefits
1) Short-term employee benefits
Liabilities recognized in respect of short-term employee benefits are measured at the undiscounted amount of the benefits expected to be paid in exchange for the related services.
2) Retirement benefits
Payments to defined contribution retirement benefit plans are recognized as an expense when employees have rendered services entitling them to the contributions. Defined benefit costs (including service cost, net interest and remeasurement) under defined benefit retirement benefit plans are determined using the projected unit credit method. Service cost and net interest on the net defined benefit liabilities are recognized as employee benefits expense in the period in which they occur. Remeasurement, comprising actuarial gains and losses, the effect of the changes to the asset ceiling and the return on plan assets (excluding interest), is recognized in other comprehensive income in the period in which it occurs. Remeasurement recognized in other comprehensive income is reflected immediately in retained earnings and will not be reclassified to profit or loss. Net defined benefit liabilities represents the actual deficit in the Company’s defined benefit plan. Any surplus resulting from this calculation is limited to the present value of any refunds from the plans or reductions in future contributions to the plans.
q. Share-based payment arrangements
The fair value at the grant date of the restricted shares for employees is expensed on a straight-line basis over the vesting period, based on the Company’s best estimates of the number of shares or options that are expected to ultimately vest, with a corresponding increase in other equity - unearned employee benefits. It is recognized as an expense in full at the grant date if vested immediately. When restricted shares for employees are issued, other equity - unearned employee benefits are recognized on the grant date, with a corresponding increase in capital surplus - restricted shares for employees. If restricted shares for employees are granted for consideration and should be returned, they are recognized as payables. Dividends paid to employees on restricted shares that do not need to be

237
returned if employees resign in the vesting period are recognized as expenses when the dividends are declared with a corresponding adjustment in retained earnings and capital surplus - restricted shares for employees. At the end of each reporting period, the Company revises its estimate of the number of restricted shares for employees expected to vest. The impact of the revision of the original estimates is recognized in profit or loss such that the cumulative expenses reflect the revised estimate, with a corresponding adjustment to capital surplus - restricted shares for employees.
r. Taxation
Income tax expense represents the sum of the tax currently payable and deferred tax. 1) Current tax
According to the Income Tax Law, an additional tax at 10% of unappropriated earnings is provided for as income tax in the year the shareholders approve to retain earnings. Adjustments of prior years’ tax liabilities are added to or deducted from the current year’s tax provision.
2) Deferred tax
Deferred tax is recognized on temporary differences between the carrying amounts of assets and liabilities and the corresponding tax bases used in the computation of taxable profit. Deferred tax liabilities are generally recognized for all taxable temporary differences. Deferred tax assets are generally recognized for all deductible temporary differences to the extent that it is probable that taxable profits will be available against which those deductible temporary differences can be utilized. Deferred tax liabilities are recognized for taxable temporary differences associated with investments in subsidiaries, except where the Company is able to control the reversal of the temporary difference and it is probable that the temporary difference will not reverse in the foreseeable future. Deferred tax assets arising from deductible temporary differences associated with such investments and interests are only recognized to the extent that it is probable that there will be sufficient taxable profits against which to utilize the benefits of the temporary differences and they are expected to reverse in the foreseeable future. The carrying amount of deferred tax assets is reviewed at the end of each reporting period and reduced to the extent that it is no longer probable that sufficient taxable profits will be available to allow all or part of the asset to be recovered. A previously unrecognized deferred tax asset is also reviewed at the end of each reporting period and recognized to the extent that it has become probable that future taxable profit will allow the deferred tax asset to be recovered.
Deferred tax liabilities and assets are measured at the tax rates that are expected to apply in the year which the liabilities are settled or the assets are realized, based on tax rates and tax laws that have been enacted or substantively enacted by the end of the reporting period. The measurement of deferred tax liabilities and assets reflects the tax consequences that would follow from the manner in which the Company expects, at the end of the reporting period, to recover or settle the carrying amount of its assets and liabilities.
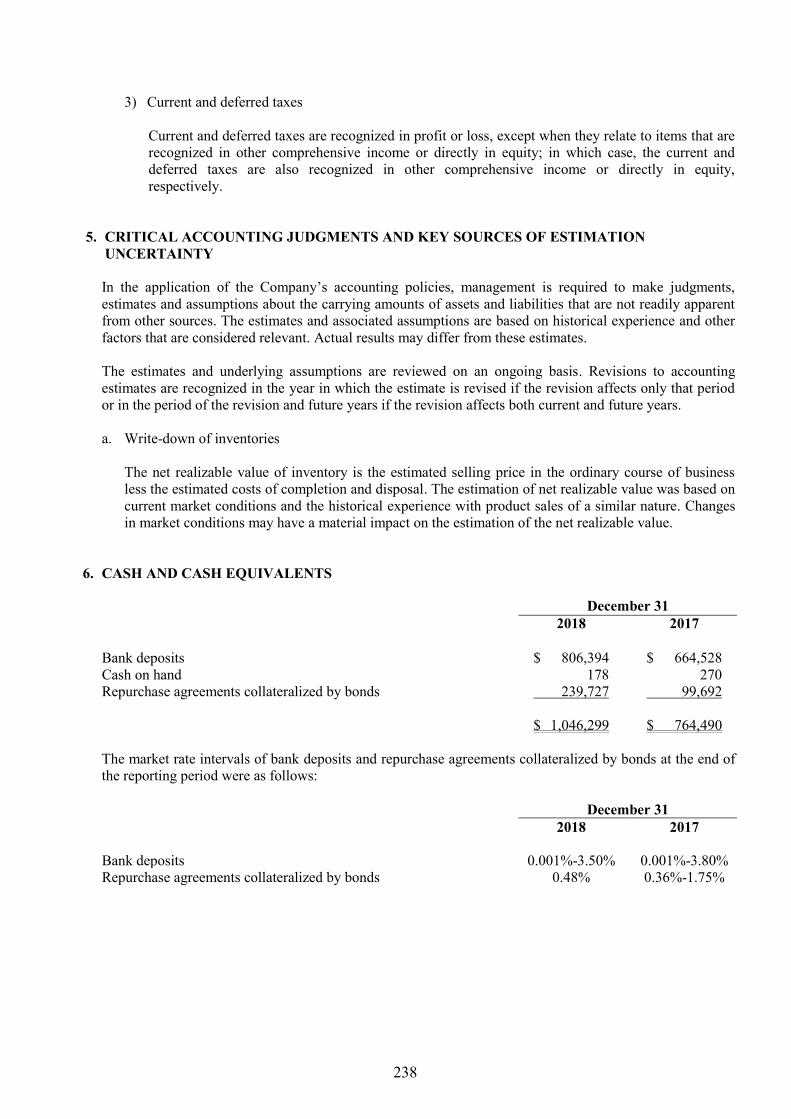
238
3) Current and deferred taxes Current and deferred taxes are recognized in profit or loss, except when they relate to items that are recognized in other comprehensive income or directly in equity; in which case, the current and deferred taxes are also recognized in other comprehensive income or directly in equity, respectively.
5. CRITICAL ACCOUNTING JUDGMENTS AND KEY SOURCES OF ESTIMATION
UNCERTAINTY In the application of the Company’s accounting policies, management is required to make judgments, estimates and assumptions about the carrying amounts of assets and liabilities that are not readily apparent from other sources. The estimates and associated assumptions are based on historical experience and other factors that are considered relevant. Actual results may differ from these estimates. The estimates and underlying assumptions are reviewed on an ongoing basis. Revisions to accounting estimates are recognized in the year in which the estimate is revised if the revision affects only that period or in the period of the revision and future years if the revision affects both current and future years. a. Write-down of inventories
The net realizable value of inventory is the estimated selling price in the ordinary course of business less the estimated costs of completion and disposal. The estimation of net realizable value was based on current market conditions and the historical experience with product sales of a similar nature. Changes in market conditions may have a material impact on the estimation of the net realizable value.
6. CASH AND CASH EQUIVALENTS
December 31 2018 2017 Bank deposits $ 806,394 $ 664,528 Cash on hand 178 270 Repurchase agreements collateralized by bonds 239,727 99,692 $ 1,046,299 $ 764,490
The market rate intervals of bank deposits and repurchase agreements collateralized by bonds at the end of the reporting period were as follows:
December 31 2018 2017 Bank deposits 0.001%-3.50% 0.001%-3.80% Repurchase agreements collateralized by bonds 0.48% 0.36%-1.75%

239
7. AVAILABLE-FOR-SALE FINANCIAL ASSETS
December 31 2018 2017 Financial assets at FVTPL - current Mandatorily measured at FVTPL
Derivative financial assets Foreign exchange forward contracts (a) $ 168 $ -
Non-derivative financial assets Domestic mutual funds investment 15,945 - Convertible bonds asset swap 5,727 - Convertible bonds 54,000 -
Financial assets held for trading Non-derivative financial assets
Domestic mutual funds investments - 150,963 Domestic listed shares - 8,416 Convertible bonds asset swaps - 109,866 Convertible bonds - 10,579
$ 75,840 $ 279,824 Financial assets at FVTPL - non-current Mandatorily measured at FVTPL
Convertible bonds asset swaps $ 45,450 $ - Convertible bonds 21,620 -
Financial assets held for trading Convertible bonds asset swaps - 10,073 Convertible bonds - 21,420
$ 67,070 $ 31,493 Financial liabilities at FVTPL - current Derivative financial liabilities
Foreign exchange forward contracts (a) $ 10 $ - Cross-currency swap contracts (b) 1,080 480
$ 1,090 $ 480
a. At the end of the reporting period, outstanding foreign exchange forward contracts not under hedge
accounting were as follows:
Currency Maturity Date Notional Amount (In Thousands)
December 31, 2018 Sell forward exchange contracts
USD/NTD 2019.1.31 US$2,000/NT$61,420
Buy forward exchange contracts
NTD/USD 2019.1.22 NT$76,700/US$2,500
Buy forward exchange contracts
NTD/USD 2019.2.11 NT$61,350/US$2,000

240
The Company entered into foreign exchange forward contracts to manage exposures to exchange rate fluctuations of foreign currency denominated assets and liabilities.
b. At the end of the reporting period, outstanding cross-currency swap contracts not under hedge accounting were as follows:
December 31, 2018
Notional Amount (In Thousands) Maturity Date
Range of Interest Rates
Paid
Range of Interest Rates
Received US$ 5,000 2019.1.2 - 4.00% US$ 1,000 2019.1.2 - 5.60% US$ 4,000 2019.1.8 - LIBOR (1 MTH)
+0.35% US$ 2,000 2019.2.13 - LIBOR (3 MTH)
+0.20% December 31, 2017
Notional Amount (In Thousands) Maturity Date
Range of Interest Rates
Paid
Range of Interest Rates
Received US$ 2,000 2018.2.27 - 1.91% The Company entered into cross-currency swap contracts to manage exposures to exchange rate and interest rate fluctuations of foreign currency denominated assets and liabilities.
8. FINANCIAL ASSETS AT FAIR VALUE THROUGH OTHER COMPREHENSIVE INCOME -
2018
December 31,
2018 Current Investments in equity instruments at FVTOCI $ 187,259 Non-current Investments in equity instruments at FVTOCI $ 317,616 Investments in debt instruments at FVTOCI 14,814 $ 332,430

241
a. Investments in equity instruments at FVTOCI
December 31,
2018 Current Domestic investments
Listed shares (1) and (2) $ 187,259
Non-current Foreign investments
Unlisted equity investments (1) $ 317,616 These investments in equity instruments are not held for trading. Instead, they are held for strategic purposes. Accordingly, the management elected to designate these investments in equity instruments as at FVTOCI as they believe that recognizing short-term fluctuations in these investments’ fair value in profit or loss would not be consistent with the Company’s strategy of holding these investments for purposes. These investments in equity instruments were classified as available-for-sale and financial assets measured at cost under IAS 39. Refer to Notes 3, 10 and 12 for information relating to their reclassification and comparative information for 2017. In 2018, the Company acquired ordinary shares of listed companies amounting to $149,269 thousand for strategic purposes which were designated as at FVTOCI due to strategic purposes.
In 2018, the Company sold its ordinary shares of listed and unlisted companies in order to manage credit concentration risk. The sold shares had a fair value of $72,596 thousand and the Company transferred a loss of $3,047 thousand from other equity to retained earnings.
Dividends of $9,073 thousand were recognized during the year. Those related to investments held at the end of the reporting period was $9,073 thousand.
b. Investments in debt instruments at FVTOCI
December 31,
2018 Non-current Foreign corporate bonds $ 14,814
In September 2016, the Company purchased foreign corporate bonds for $15,654 thousand. The maturity date was September 2021 and the coupon rate was 2.25%. The bonds acquired in September 2016 were classified as available-for-sale financial assets under IAS 39. Refer to Notes 3 and 10 for information relating to their reclassification and comparative information for 2017.

242
9. FINANCIAL ASSETS AT AMORTIZED COST - 2018
December 31,
2018 Current Domestic investments
Time deposits with original maturities of more than 3 months (a) $ 137,500 Pledged fixed deposits (b) 28,802 $ 166,302
Non-current Foreign investments
Foreign corporate bonds (c) $ 31,386 a. The interest rates for time deposits with original maturities of more than 3 months were from 0.75% to
1.07% as at the end of the reporting period. b. Pledged deposits were classified as debt investments with no active market under IAS 39. Refer to
Notes 3 and 13 for information relating to their reclassification and comparative information for 2017. c. Foreign corporate bonds were classified as held-to-maturity financial assets under IAS 39. Refer to
Notes 3 and 11 for information relating to their reclassification and comparative information for 2017. d. Refer to Notes 37 for information relating to investments in financial assets at amortized cost pledged
as security.
10. AVAILABLE-FOR-SALE FINANCIAL ASSETS - 2017
December 31,
2017 Current Domestic listed shares and emerging market shares $ 131,680 Convertible bonds 53,000 Foreign convertible bonds 18,124 Foreign mutual funds 60,125 $ 262,929 Non-current Foreign mutual funds $ 356,967 Foreign corporate bonds 14,562 $ 371,529

243
11. HELD-TO-MATURITY FINANCIAL ASSETS - 2017
December 31,
2017 Non-current Foreign investments
FORCAY 3.375% 04/22/2025 Priority unsecured US dollar debt $ $ 30,499 The Company purchased the priority unsecured US dollar debt issued by Formosa Group (Cayman) Limited at $32,675 thousand, with an expiry date of April 22, 2025 and an interest rate of 3.375%.
12. FINANCIAL ASSETS MEASURED AT COST - 2017
December 31,
2017 Non-current Foreign unlisted ordinary shares $ 18,398 Domestic unlisted ordinary shares 7,435 $ 25,833 Classified according to financial asset measurement categories
Available-for-sale financial assets $ 25,833 Management believed that the above unlisted equity investments held by the Company had fair values which cannot be reliably measured, because the range of reasonable fair value estimates was so significant. Therefore, they were measured at cost less impairment at the end of the reporting period. During 2017, the Company assessed that the financial assets of Dawning Leading Technology Inc. were not recoverable and recognized an impairment loss of $4,125 thousand.
13. DEBT INVESTMENTS WITH NO ACTIVE MARKET - 2017
December 31,
2017 Current Pledged fixed deposits $ 25,679 Refer to Note 37 for information relating to bond investments with no active market pledged as security.

244
14. NOTES RECEIVABLE, TRADE RECEIVABLES AND OTHER RECEIVABLES
December 31 2018 2017 Notes receivable $ 4,257 $ 4,720 Trade receivables 963,807 513,004 Less: Allowance for impairment loss (17,849) (17,849)
$ 950,215 $ 499,875 Other receivables Income tax refund receivable $ 23,744 $ - Others 2,619 63,836 $ 26,363 $ 63,836 2018 The average credit period of sales of goods was 30-120 days. No interest was charged on trade receivables. where appropriate, as a means of mitigating the risk of financial loss from defaults. The Company adopted a policy of only dealing with entities that are rated the equivalent of investment grade or higher and obtaining sufficient collateral, where appropriate, as a means of mitigating the risk of financial loss from defaults. The Company uses other publicly available financial information or its own trading records to rate its major customers. The Company’s exposure and the credit ratings of its counterparties are continuously monitored. Credit exposure is controlled by counterparty limits that are reviewed and approved by the risk management committee annually. The Company applies the simplified approach to providing for expected credit losses prescribed by IFRS 9, which permits the use of lifetime expected loss provision for all trade receivables. The expected credit losses on trade receivables are estimated using a provision matrix by reference to past default experience of the debtor and an analysis of the debtor’s current financial position, adjusted for general economic conditions of the industry in which the debtors operate and an assessment of both the current as well as the forecasted direction of economic conditions at the reporting date. As the Company’s historical credit loss experience does not show significantly different loss patterns for different customer segments, the provision for loss allowance based on past due status is not further distinguished according to the Company’s different customer base. The Company writes off a trade receivable when there is information indicating that the debtor is in severe financial difficulty and there is no realistic prospect of recovery, e.g. when the debtor has been placed under liquidation. For trade receivables that have been written off, the Company continues to engage in enforcement activity to attempt to recover the receivables due. Where recoveries are made, these are recognized in profit or loss. The following table details the loss allowance of trade receivables based on the Company’s provision matrix.
December 31, 2018
Not Past Due Less than 60 Days 61 to 90 Days Over 91 Days Total
Gross carrying amount $ 884,997 $ 72,220 $ 39 $ 6,551 $ 963,807 Loss allowance (Lifetime ECLs) (75) (11,184) (39) (6,551) (17,849) Amortized cost $ 884,922 $ 61,036 $ - $ - $ 945,958
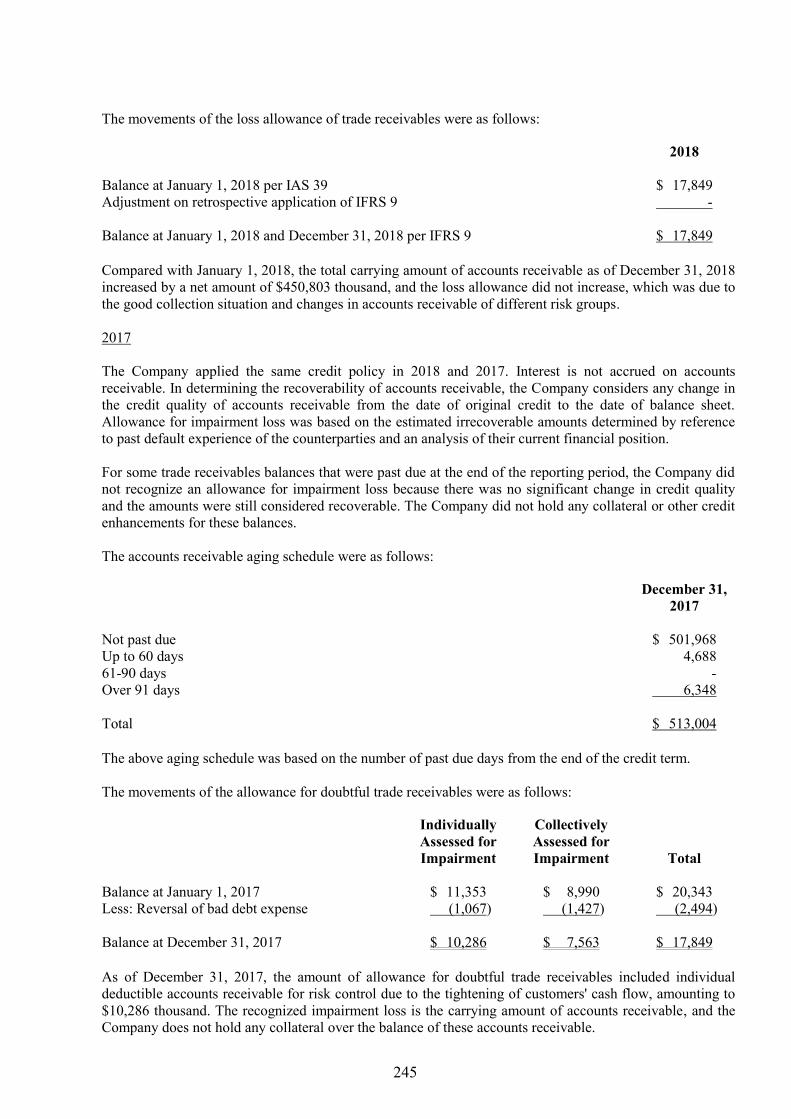
245
The movements of the loss allowance of trade receivables were as follows:
2018 Balance at January 1, 2018 per IAS 39 $ 17,849 Adjustment on retrospective application of IFRS 9 - Balance at January 1, 2018 and December 31, 2018 per IFRS 9 $ 17,849
Compared with January 1, 2018, the total carrying amount of accounts receivable as of December 31, 2018 increased by a net amount of $450,803 thousand, and the loss allowance did not increase, which was due to the good collection situation and changes in accounts receivable of different risk groups.
2017
The Company applied the same credit policy in 2018 and 2017. Interest is not accrued on accounts receivable. In determining the recoverability of accounts receivable, the Company considers any change in the credit quality of accounts receivable from the date of original credit to the date of balance sheet. Allowance for impairment loss was based on the estimated irrecoverable amounts determined by reference to past default experience of the counterparties and an analysis of their current financial position. For some trade receivables balances that were past due at the end of the reporting period, the Company did not recognize an allowance for impairment loss because there was no significant change in credit quality and the amounts were still considered recoverable. The Company did not hold any collateral or other credit enhancements for these balances. The accounts receivable aging schedule were as follows:
December 31,
2017 Not past due $ 501,968 Up to 60 days 4,688 61-90 days - Over 91 days 6,348 Total $ 513,004 The above aging schedule was based on the number of past due days from the end of the credit term. The movements of the allowance for doubtful trade receivables were as follows: Individually
Assessed for Impairment
Collectively Assessed for Impairment Total
Balance at January 1, 2017 $ 11,353 $ 8,990 $ 20,343 Less: Reversal of bad debt expense (1,067) (1,427) (2,494) Balance at December 31, 2017 $ 10,286 $ 7,563 $ 17,849 As of December 31, 2017, the amount of allowance for doubtful trade receivables included individual deductible accounts receivable for risk control due to the tightening of customers' cash flow, amounting to $10,286 thousand. The recognized impairment loss is the carrying amount of accounts receivable, and the Company does not hold any collateral over the balance of these accounts receivable.

246
15. INVENTORIES
December 31 2018 2017 Finished goods $ 420,392 $ 511,403 Work in progress 777,456 650,716 Raw materials 181,118 54,308 Merchandise - 51 $ 1,378,966 $ 1,216,478 The cost of inventories recognized as cost of goods sold for the years ended December 31, 2018 and 2017 was $5,697,612 thousand and $5,629,862 thousand, respectively. The cost of goods sold included inventory write-downs of $9,000 thousand and $30,500 thousand for the years ended December 31, 2018 and 2017, respectively.
16. INVESTMENT ACCOUNTED FOR USING THE EQUITY METHOD
December 31 2018 2017 Investments in subsidiaries Forcelead Technology Corp. $ 392,178 $ 397,246 Sensortek Technology Corp. 313,682 138,519 Sitronix Investment Corp. 293,040 359,171 Sitronix Technology ( Sitronix Belize) Corp. 114,068 74,318 mCore Technology Corp. 101,958 90,687 Sitronix Holding International Ltd. 62,026 - Sync-Tech System Corp. 60,314 55,260 Infinno Technology Corp. 50,703 50,695 HeFei Sitronix Co., Ltd. 37,246 - HeFei ezGreen Co., Ltd. 8,688 - $ 1,433,903 $ 1,165,896
Proportion of Ownership and
Voting Rights December 31
Name of Associate 2018 2017 Forcelead Technology Corp. 75.83% 76.42% Sensortek Technology Corp. 53.93% 53.74% Sitronix Investment Corp. 100.00% 100.00% Sitronix Technology (Sitronix Belize) Corp. 100.00% 100.00% mCore Technology Corp. 90.73% 90.73% Sitronix Holding International Ltd. 100.00% - Sync-Tech System Corp. 55.11% 58.96% Infinno Technology Corp. 63.99% 63.99% HeFei Sitronix Co., Ltd. 75.00% - HeFei ezGreen Co., Ltd. 100.00% - Refer to Note 32 for the acquisitions and disposals of investments in subsidiaries.

247
The investments in subsidiaries accounted for using the equity method and the share of profit or loss and other comprehensive income of those investments for the years ended December 31, 2018 and 2017 were based on the subsidiaries’ financial statements which have been audited for the same years.
17. PROPERTY, PLANT AND EQUIPMENT
Freehold Land Buildings
Machinery Equipment
Test Equipment
Office Equipment Total
Cost Balance at January 1,2017 $ 95,640 $ 351,885 $ 32,186 $ 420,643 $ 3,888 $ 904,242 Additions - 60 3,432 93,599 - 97,091 Disposals - - (431) ( 102,371) - (102,802) Reclassified (27,966) (84,341) - - - (112,307) Balance at December 31, 2017 $ 67,674 $ 267,604 $ 35,187 $ 411,871 $ 3,888 $ 786,224 Accumulated depreciation Balance at January 1,2017 $ - $ 69,254 $ 21,058 $ 271,050 $ 2,895 $ 364,257 Additions - 10,420 5,321 79,254 222 95,217 Disposals - - (431) (101,102) - (101,533) Reclassified - (965) - - - - (965) Balance at December 31, 2017 $ - $ 78,709 $ 25,948 $ 249,202 $ 3,117 $ 356,976 Balance at January 1,2017 $ 95,640 $ 282,631 $ 11,128 $ 149,593 $ 993 $ 539,985 Carrying amount at December 31,
2017 $ 67,674 $ 188,895 $ 9,239 $ 162,669 $ 771 $ 429,248 Cost Balance at January 1,2018 $ 67,674 $ 267,604 $ 35,187 $ 411,871 $ 3,888 $ 786,224 Additions - 4,481 9,910 122,549 113 137,053 Disposals - (3,002) (325) (83,440) (205) (86,972) Balance at December 31, 2018 $ 67,674 $ 269,083 $ 44,772 $ 450,980 $ 3,796 $ 836,305 Accumulated depreciation Balance at January 1,2018 $ - $ 78,709 $ 25,948 $ 249,202 $ 3,117 $ 356,976 Additions - 9,796 6,012 95,852 228 111,888 Disposals - (3,002) (322) (83,440) (205) (86,969) Balance at December 31, 2018 $ - $ 85,503 $ 31,638 $ 261,614 $ 3,140 $ 381,895 Balance at January 1,2018 $ 67,674 $ 188,895 $ 9,239 $ 162,669 $ 771 $ 429,248 Carrying amount at December 31,
2018 $ 67,674 $ 183,580 $ 13,134 $ 189,366 $ 656 $ 454,410
The above items of property, plant and equipment are depreciated on a straight-line basis over their estimated useful lives as follows:
Buildings
Main buildings 50 years Renovation construction 5 years
Machinery equipment 3-6 years Test equipment 3-6 years Office equipment 5-6 years

248
18. INVESTMENT PROPERTIES
Land Buildings Total Cost Balance at January 1, 2017 $ 155,845 $ 332,074 $ 487,919 Reclassified 27,966 84,341 112,307 Balance at December 31, 2017 $ 183,811 $ 416,415 $ 600,226 Accumulated depreciation Balance at January 1, 2017 $ - $ 48,421 $ 48,421 Depreciation expense - 7,500 7,500 Reclassified - 965 965 Balance at December 31, 2017 $ - $ 56,886 $ 56,886 Balance at January 1,2017 $ 155,845 $ 283,653 $ 439,498 Carrying amounts at December 31, 2017 $ 183,811 $ 359,529 $ 543,340 Cost Balance at January 1 and December 31, 2018 $ 183,811 $ 416,415 $ 600,226 Accumulated depreciation Balance at January 1, 2018 $ - $ 56,886 $ 56,886 Depreciation expense - 8,190 8,190 Balance at December 31, 2018 $ - $ 65,076 $ 65,076 Balance at January 1,2018 $ 183,811 $ 359,529 $ 543,340 Carrying amount at December 31, 2018 $ 183,811 $ 351,339 $ 535,150
Investment properties are depreciated using the straight-line method over their estimated useful lives as follows: Main buildings 50 years The determination of fair values of the Company’s investment properties was performed by independent qualified professional values of the China Real Estate Appraising Firm using Level 3 inputs. The evaluation is based on the cost method and the weighted average of the income method and the market comparison method. The significant unobservable input used include the discount rate, and the fair values as appraised are as follows:
December 31 2018 2017
Fair value $ 794,532 $ 785,993
All of the Company’s investment properties were held under freehold interests.

249
19. INTANGIBLE ASSETS
Royalty Computer Software Total
Cost Balance at January 1, 2017 $ 73,222 $ 14,202 $ 87,424 Additions 2,916 24,263 27,179 Balance at December 31, 2017 $ 76,138 $ 38,465 $ 114,603 Accumulated amortization Balance at January 1, 2017 $ 33,527 $ 11,268 $ 44,795 Amortization expenses 11,369 8,193 19,562 Balance at December 31, 2017 $ 44,896 $ 19,461 $ 64,357 Balance at January 1, 2017 $ 39,695 $ 2,934 $ 42,629 Carrying amount at December 31, 2017 $ 31,242 $ 19,004 $ 50,246 Cost Balance at January 1, 2018 $ 76,138 $ 38,465 $ 114,603 Additions 1,853 12,434 14,287 Disposals - (1,460) (1,460) Balance at December 31, 2018 $ 77,991 $ 49,439 $ 127,430 Accumulated amortization Balance at January 1, 2018 $ 44,896 $ 19,461 $ 64,357 Amortization expenses 10,833 13,300 24,133 Disposals - (1,460) (1,460) Balance at December 31, 2018 $ 55,729 $ 31,301 $ 87,030 Balance at January 1, 2018 $ 31,242 $ 19,004 $ 50,246 Carrying amount at December 31, 2018 $ 22,262 $ 18,138 $ 40,400 Intangible assets are amortized on a straight-line basis over their estimated useful lives as follows: Royalty 2-10 years Computer software 2-5 years

250
20. OTHER ASSETS
December 31 2018 2017 Current Others $ 10,685 $ 4,354 Non-current Refundable deposits $ 5,750 $ 5,086 Prepayments for equipment 160 - $ 5,910 $ 5,086
21. SHORT-TERM BORROWINGS
December 31 2018 2017 Short-term unsecured borrowings Bank loans $ 445,368 $ -
The range of weighted average effective interest rates on bank loans was 2.81%-2.88% as of December 31, 2018.
22. TRADE PAYABLES
December 31 2018 2017 Trade payables $ 1,019,841 $ 860,657
The credit period for trade payables is 20-60 days. The Company has financial risk management policies in place to ensure that all payables are paid within the pre-agreed credit terms.
23. OTHER LIABILITIES
December 31 2018 2017 Current Other payables
Payables for salaries $ 233,839 $ 266,654 Payables for research 37,812 21,307 Others 73,547 61,370
$ 345,198 $ 349,331 (Continued)

251
December 31 2018 2017 Other liabilities
Contract liabilities $ 18,069 $ - Temporary receipts 15,886 $ 7,487 Others 3,679 3,345
$ 37,634 $ 10,832 Non-current Guarantee deposits received $ 22,791 $ 12,453
(Concluded) 24. PROVISIONS
December 31 2018 2017 Current Customer returns and rebates $ - $ 5,089
The provision for customer returns and rebates was based on historical experience, management’s judgments and other known reasons estimated product returns and rebates may occur in the year. The provision was recognized as a reduction of operating income in the year the related goods were sold.
25. RETIREMENT BENEFIT PLANS
a. Defined contribution plans
The Company adopted a pension plan under the Labor Pension Act (the LPA), which is a state-managed defined contribution plan. Under the LPA, the Company makes monthly contributions to employees’ individual pension accounts at 6% of monthly salaries and wages.
b. Defined benefit plans The defined benefit plan adopted by the Company in accordance with the Labor Standards Law is operated by the government. Pension benefits are calculated on the basis of the length of service and average monthly salaries of the 6 months before retirement. The Company contributes amounts equal to 2% of total monthly salaries and wages to a pension fund administered by the pension fund monitoring committee. Pension contributions are deposited in the Bank of Taiwan in the committee’s name. Before the end of each year, the Company assesses the balance in the pension fund. If the amount of the balance in the pension fund is inadequate to pay retirement benefits for employees who conform to retirement requirements in the next year, the Company is required to fund the difference in one appropriation that should be made before the end of March of the next year. The pension fund is managed by the Bureau of Labor Funds, Ministry of Labor (the Bureau); the Company has no right to influence the investment policy and strategy.

252
The amounts based on the actuarial report of the Company’s defined benefit plans were as follows: December 31 2018 2017 Present value of defined benefit obligation $ 96,085 $ 98,359 Fair value of the plan assets (44,767) (40,804) Net defined benefit liability $ 51,318 $ 57,555 Movements in net defined benefit liabilities were as follows:
Present Value of Defined
Benefit Obligation
Fair Value of the Plan Assets
Net Defined
Benefit Liabilities
Balance at January 1, 2017 $ 96,379 $ (38,128) $ 58,251 Service cost
Current service cost - - - Net interest expense (income) 1,442 (585) 857 Recognized in profit or loss 1,442 (585) 857 Remeasurement
Return on plan assets (excluding amounts included in net interest)
- 208
208
Actuarial loss - change in demographic assumptions
129 -
129
Actuarial loss - change in financial assumptions
3,346 -
3,346
Actuarial gain - experience adjustments (2,937) - (2,937) Recognized in other comprehensive income 538 208 746 Contributions from the employer - (2,299) (2,299) Balance at December 31, 2017 98,359 (40,804) 57,555 Service cost
Current service cost - - - Net interest expense (income) 1,226 (521) 705 Recognized in profit or loss 1,226 (521) 705 Remeasurement
Return on plan assets (excluding amounts included in net interest)
- (1,099)
(1,099)
Actuarial loss - change in demographic assumptions
1,962 -
1,962
Actuarial gain - change in financial assumptions
(5,380) -
(5,380)
Actuarial gain - experience adjustments (82) - (82) Recognized in other comprehensive income (3,500) (1,099) (4,599) Contributions from the employer - (2,343) (2,343) Balance at December 31, 2018 $ 96,085 $ (44,767) $ 51,318

253
An analysis by function of the amounts recognized in profit or loss in respect of the defined benefit plans is as follows: For the Year Ended December 31 2018 2017 Operating costs $ - $ - Selling and marketing expenses 87 104 General and administrative expenses 168 188 Research and development expenses 450 565 $ 705 $ 857 Through the defined benefit plans under the Labor Standards Law, the Company is exposed to the following risks: 1) Investment risk: The plan assets are invested in domestic and foreign/ equity and debt securities,
bank deposits, etc. The investment is conducted at the discretion of the Bureau or under the mandated management. However, in accordance with relevant regulations, the return generated by plan assets should not be below the interest rate for a 2-year time deposit with local banks.
2) Interest risk: A decrease in the government bond interest rate will increase the present value of the
defined benefit obligation; however, this will be partially offset by an increase in the return on the plan’s debt investments.
3) Salary risk: The present value of the defined benefit obligation is calculated by reference to the
future salaries of plan participants. As such, an increase in the salary of the plan participants will increase the present value of the defined benefit obligation.
The actuarial valuations of the present value of the defined benefit obligation were carried out by qualified actuaries. The significant assumptions used for the purposes of the actuarial valuations were as follows: December 31 2018 2017 Discount rate 1.00% 1.25% Expected rate of salary increase 4.30% 5.00% If possible reasonable change in each of the significant actuarial assumptions will occur and all other assumptions will remain constant, the present value of the defined benefit obligation would increase (decrease) as follows: For the Year Ended December 31 2018 2017 Discount rate
0.25% increase $ (3,070) $ (3,351) 0.25% decrease $ 3,204 $ 3,503
Expected rate of salary increase 0.25% increase $ 3,093 $ 3,367 0.25% decrease $ (2,982) $ (3,241)

254
The sensitivity analysis presented above may not be representative of the actual change in the present value of the defined benefit obligation as it is unlikely that the change in assumptions would occur in isolation of one another as some of the assumptions may be correlated. December 31 2018 2017 The expected contributions to the plan for the next year $ 2,341 $ 2,303 The average duration of the defined benefit obligation 12 years 13 years
26. EQUITY
a. Share capital
December 31 2018 2017 Number of shares authorized (in thousands) 200,000 200,000 Share capital $ 2,000,000 $ 2,000,000 Number of shares issued and fully paid (in thousands) 120,223 120,518 Shares issued $ 1,202,226 $ 1,205,176 Fully paid ordinary shares, which have a par value of $10, carry one vote per share and carry a right to dividends. The authorized shares include 20,000 thousand shares reserved for the exercise of employee stock options. The changes in the Company's share capital are mainly due to the cancellation of the newly issued restricted shares as the new shares did not meet the required conditions.
b. Capital surplus December 31 2018 2017 May be used to offset a deficit, distributed as cash dividends, or transferred to share capital (1) Issuance of ordinary shares $ 278,773 $ 278,773 Conversion of bonds 335,041 335,041 May be used to offset a deficit only Issuance of ordinary shares 69,595 53,633 Changes in percentage of ownership interests in subsidiaries (2) 16,255 13,241 May not be used for any purpose Employee restricted shares 61,640 105,187 $ 761,304 $ 785,875 1) Such capital surplus may be used to offset a deficit; in addition, when the Company has no deficit,
such capital surplus may be distributed as cash dividends or transferred to share capital.

255
2) Such capital surplus arises from the effect of changes in ownership interests in subsidiaries resulting
from equity transactions other than actual disposals or acquisitions, or from changes in capital surplus of subsidiaries accounted for using the equity method.
c. Retained earnings and dividend policy
Under the dividends policy as set forth in the amended Articles, where the Company made a profit in a fiscal year, the profit shall be distributed in the following order: 1) Utilized for paying taxes. 2) Offsetting losses of previous years. 3) Setting aside as a legal reserve of 10% of the remaining profit (legal reserve that has reached the
company’s paid-in capital is not subject to this condition). 4) Setting aside or reversing a special reserve in accordance with the laws and regulations. 5) Any remaining profit together with any undistributed retained earnings shall be used by the
Company’s board of directors as the basis for proposing a distribution plan, which should be resolved in the shareholders’ meeting for the distribution of dividends and bonuses to shareholders.
For the policies on the distribution of employees’ compensation and remuneration of directors and supervisors after the amendment, refer to employees’ compensation and remuneration of directors and supervisors in Notes 28(f). The distribution of dividends to shareholders of the company can be made in cash or shares, but the proportion of cash dividends distributed should not be less than 10% of the total dividends distributed. The dividends policy is dependent on the Company's current and future investment environment, capital needs, domestic and international competition and capital budget, etc., taking into account the interests of shareholders, balance of dividends and long-term financial planning of the Company, the board of directors plans to distribute the case to the shareholders' meeting. An appropriation of earnings to a legal reserve shall be made until the legal reserve equals the Company’s paid-in capital. The legal reserve may be used to offset deficits. If the Company has no deficit and the legal reserve has exceeded 25% of the Company’s paid-in capital, the excess may be transferred to capital or distributed in cash. Items referred to under Rule No. 1010012865, Rule No. 1010047490 and Rule No. 1030006415 issued by the FSC and in the directive titled “Questions and Answers for Special Reserves Appropriated Following Adoption of IFRSs” should be appropriated to or reversed from a special reserve by the Company. The appropriations of earnings for 2017 and 2016 which were approved in the shareholders’ meetings on June 27, 2018 and June 22, 2017, respectively, were as follows: Appropriation of Earnings Dividends Per Share (NT$)
For the Year Ended
December 31 For the Year Ended
December 31 2017 2016 2017 2016 Legal reserve $ 87,316 $ 104,184 Special reserve 17,916 (12,636) Cash dividends 662,847 723,826 $ 5.5 $ 6.0

256
The appropriation of earnings for 2018 had been proposed by the Company’s board of directors on March 15, 2019. The appropriation and dividends per share were as follows:
Appropriation
of Earnings Dividends Per Share (NT$)
Legal reserve $ 84,036 Special reserve 225,303 Cash dividends 601,113 $ 5.0 The appropriation of earnings for 2018 is subject to the resolution of the shareholders in the shareholders’ meeting to be held on June 26, 2019.
d. Special reserve
For the Year Ended December 31 2018 2017 Balance at January 1 $ 8,728 $ 21,364 Appropriations in respect of
Debits to other equity items 17,916 - Reversals - (12,636) Balance at December 31 $ 26,644 $ 8,728
e. Other equity items 1) Exchange differences on translating the financial statements of foreign operations
For the Year Ended December 31 2018 2017 Balance at January 1 $ (943) $ (902)
Share of exchange differences from investments accounted for using the equity method 97 (41)
Balance at December 31 $ (846) $ (943)
2) Unrealized gain (loss) on available-for-sale financial assets
Balance at January 1, 2017 $ (7,826) Unrealized gain (loss) from available-for-sale financial assets (8,485) Cumulative unrealized gain (loss) of available-for-sale financial assets
reclassified to profit or loss due to disposal (12,187) Share of unrealized gains (losses) from available-for-sale financial assets
accounted for using the equity method 2,797 Balance at December 31, 2017 $ (25,701) Balance at January 1, 2018 per IAS 39 $ (25,701) Adjustment on retrospective application of IFRS 9 25,701 Balance at January 1, 2018 per IFRS 9 $ -

257
3) Unrealized gain (loss) on financial assets at FVTOCI
For the Year Ended
December 31, 2018
Balance at January 1 per IAS 39 $ - Adjustment on retrospective application of IFRS 9 (106,936) Balance at January 1 per IFRS 9 (106,936) Recognized for the year
Unrealized gain (loss) - debt instruments 251 Unrealized gain (loss) - equity instruments (86,278)
Share from associates accounted for using the equity method (61,185) Cumulative unrealized gain (loss) of equity instruments transferred to retained
earnings due to disposal 3,047 Balance at December 31 $ (251,101)
4) Unearned employee benefits
The shareholders approved a restricted share plan for employees (see Note 31). For the Year Ended December 31 2018 2017 Balance at January 1 $ (50,850) $ (120,394) (Reversal) of share-based payment expenses recognized (5,337) 57,124 Retirement of restricted shares for employees 30,535 12,420 Balance at December 31 $ (25,652) $ (50,850)
27. REVENUE
a. Disaggregation of revenue
For the Year Ended December 31 2018 2017 Product Integrated circuit $ 7,450,970 $ 7,502,814 Others 52,727 50,966 $ 7,503,697 $ 7,553,780 Primary geographical markets Hong Kong $ 6,356,041 $ 6,450,905 Taiwan 435,260 477,062 China 409,712 399,698 Others 302,684 226,115 $ 7,503,697 $ 7,553,780

258
The basis of calculation of the Company’s revenue segregated by geographical location is mainly based on the location the goods were shipped.
b. Contract balances
For the Year Ended December 31 2018 2017 Accounts receivable (Note 14) $ 945,958 $ 495,155
For the Year Ended
December 31 2018 Contract liabilities - current (Note 23)
Sales of goods $ 18,069 28. NET PROFIT (LOSS) FROM CONTINUING OPERATIONS
a. Other income
For the Year Ended December 31
2018 2017
Rental income $ 38,482 $ 36,912 Interest income 17,285 24,620 Dividend income 9,073 9,873 Others 4,137 4,212
$ 68,977 $ 75,617 b. Other gains and losses
For the Year Ended December 31 2018 2017
Gain (loss) on financial assets designated as at FVTPL $ 17,410 $ (3,611) Net foreign exchange gains (losses) 1,437 (1,520) Impairment loss on financial assets - (4,125) Gain on disposal of available-for-sale financial assets - 56,374 Other losses (8,459) (7,500) $ 10,388 $ 39,618
c. Finance costs
For the Year Ended December 31
2018 2017
Interest on loans $ 7,906 $ 3,252

259
d. Depreciation and amortization
For the Year Ended December 31 2018 2017
Property, plant and equipment $ 111,888 $ 95,217 Investment properties 8,190 7,500 Intangible assets 24,133 19,562 $ 144,211 $ 122,279 An analysis of depreciation by function
Operating expenses $ 100,564 $ 87,593 Operating costs 11,324 7,624 $ 111,888 $ 95,217
An analysis of amortization by function
General and administrative expenses $ 2,484 $ 2,576 Research and development expenses 21,649 16,986
$ 24,133 $ 19,562
e. Employee benefits expense
For the Year Ended December 31 2018 2017
Short-term benefits $ 746,081 $ 762,980 Post-employment benefits (Notes 25)
Defined contribution plans 24,238 22,637 Defined benefit plans 705 857
Share-based payments Equity-settled (5,337) 57,124
Total employee benefits expense $ 765,687 $ 843,598 An analysis of employee benefits expense by function
Operating expenses $ 765,687 $ 843,598 f. Employees’ compensation and remuneration of directors
According to the Articles of Incorporation of the Company, the Company accrued employees’ compensation and remuneration of directors and supervisors at rates of no less than 1% and no higher than 25%, and rates of no higher than 3%, respectively, of net profit before income tax, employees’ compensation, and remuneration of directors and supervisors. The Company’s estimated employees’ compensation was $75,633 thousand and $78,584 thousand, and the remuneration of directors and supervisors was $22,690 thousand and $23,575 thousand as of December 31, 2018 and 2017, respectively.

260
The employees’ compensation and the remuneration of directors and supervisors for the years ended December 31, 2018 and 2017, which were approved by the Company’s board of directors on March 15, 2019 and March 15, 2018 respectively, are as follows: Amount For the Year Ended December 31 2018 2017 Cash Shares Cash Shares Employees’ compensation $ 75,633 $ - $ 78,584 $ - Remuneration of directors and
supervisors 22,690 - 23,575 - If there is a change in the amounts after the annual consolidated financial statements were authorized for issue, the differences are recorded as a change in the accounting estimate. There is no difference between the actual amounts of employees’ compensation and remuneration of directors and supervisors paid and the amounts recognized in the consolidated financial statements for the years ended December 31, 2018 and 2017. Information on the employees’ compensation and remuneration of directors resolved by the Company’s board of directors in 2019 and 2018 is available at the Market Observation Post System website of the Taiwan Stock Exchange.
g. Gains or losses on foreign currency exchange
For the Year Ended December 31 2018 2017 Foreign exchange gains $ 118,612 $ 91,722 Foreign exchange losses (117,175) (93,242) Net gains (losses) $ 1,437 $ (1,520)
29. INCOME TAXES RELATING TO CONTINUING OPERATIONS
a. Major components of income tax expense recognized in profit or loss:
For the Year Ended December 31 2018 2017 Current tax
In respect of the current year $ 65,242 $ 89,814 Adjustments for prior years (1,043) (2,567) 64,199 87,247
Deferred tax In respect of the current year 34 119
Income tax expense recognized in profit or loss $ 64,233 $ 87,366

261
A reconciliation of accounting loss and income tax expenses is as follows: For the Year Ended December 31 2018 2017 Profit before tax from continuing operations $ 904,596 $ 960,524 Income tax expense calculated at the statutory rate $ 180,919 $ 163,289 Nondeductible expenses in determining taxable income (58,941) (38,196) Tax-exempt income (42,786) (35,981) Impact of the temporary differences (10,885) 821 Effects of investment credits (3,031) - Adjustments for prior years’ tax (1,043) (2,567) Income tax expense recognized in profit or loss $ 64,233 $ 87,366 In 2017, the applicable corporate income tax rate used by the Company entities in the ROC is 17%. However, the Income Tax Act in the ROC was amended in 2018, and the corporate income tax rate was adjusted from 17% to 20%, effective in 2018. In addition, the rate of the corporate surtax applicable to the 2018 unappropriated earnings will be reduced from 10% to 5%. As the status of 2019 appropriations of earnings is uncertain, the potential income tax consequences of 5% of the 2018 unappropriated earnings are not reliably determinable.
b. Current tax liabilities
December 31 2018 2017 Current tax liabilities
Income tax payable $ 78,908 $ 89,180 c. Deferred tax liabilities
The movements of deferred tax liabilities were as follows:
For the year ended December 31, 2017
Deferred Tax liabilities Opening Balance
Recognized in Profit or Loss Closing Balance
Temporary differences $ 457 $ 119 $ 576 For the year ended December 31, 2018
Deferred Tax liabilities Opening Balance
Recognized in Profit or Loss Closing Balance
Temporary differences $ 576 $ 34 $ 610
d. Deductible temporary differences for which no deferred assets have been recognized in the parent company only balance sheets
December 31 2018 2017 Deductible temporary differences $ 72,890 $ 93,574

262
e. The tax exemption periods for the Company’s manufacture of high-order integrated circuit design-SOC,
LCD Driver IC and other products are as follows:
Expansion of Construction Project Tax-exemption Period The eighth issuance of shares 2015.01.01-2018.09.30 The ninth issuance of shares 2016.01.01-2019.11.30
f. As of December 31, 2018 and 2017, there were no recognized taxable temporary differences associated
with investments in subsidiaries and branches for which no deferred tax liabilities were recognized. g Income tax assessments
The Company's tax returns through 2016 have been assessed by the tax authorities. 30. EARNINGS PER SHARE
Unit: NT$ Per Share
For the Year Ended December 31 2018 2017 Basic earnings per share $ 7.03 $ 7.32 Diluted earnings per share $ 6.94 $ 7.22 The earnings and weighted average number of ordinary shares outstanding used in the computation of earnings per share are as follows: Net Income for the Year
For the Year Ended December 31 2018 2017 Net income for the year $ 840,363 $ 873,158 Earnings used in the computation of basic earnings per share $ 840,363 $ 873,158 Effect of potentially dilutive ordinary shares
Employee restricted stock - - Employee s’ compensation - -
Earnings used in the computation of diluted earnings per share $ 840,363 $ 873,158 Weighted average number of ordinary shares outstanding (in thousands of shares):
For the Year Ended December 31 2018 2017 Weighted average number of ordinary shares in computation of basic
earnings per share
119,461 119,241 Effect of potentially dilutive ordinary shares:
Employee restricted stock 660 604 Employees’ compensation 930 1,130
Weighted average number of ordinary shares in computation of diluted earnings per share
121,051
120,975

263
Since the Company offered to settle compensation or bonuses paid to employees in cash or shares, the Company assumed the entire amount of the compensation or bonus will be settled in shares, and the resulting potential shares were included in the weighted average number of shares outstanding used in the computation of diluted earnings per share, as the effect is dilutive. Such dilutive effect of the potential shares is included in the computation of diluted earnings per share until the number of shares to be distributed to employees is resolved in the following year.
31. SHARE-BASED PAYMENT ARRANGEMENTS Employee restricted stock
In the shareholders’ meeting on June 22, 2016, the shareholders approved a restricted share plan for employees with a total amount of $15,000 thousand, consisting of 1,500 thousand shares. The aforementioned resolution was made effective by the FSC on July 15, 2016. The board of directors of the Company approved the issuance of 1,500 thousand shares of restricted stock awards to employees in their meeting on August 5, 2016 totaling $15,000 thousand, with face value of $10 for each share, and the price of each share was NT$0 (that is, free of charge). The dates of issuance and distribution were both August 5, 2016, and the fair value of the shares on the date of distribution was $103.5. After the employees have been awarded the restricted stock awards, if they remain employed by the Company at the end of the vesting periods in the table below, did not breach any laws, labor contracts, work rules, work regulations and other agreements with the Company, and achieved the Company's set of business objectives, the maximum number of shares awarded will be based on the proportions in the table below, however, the actual proportion awarded will be based on the attainment of the Company’s operating goals. After employees received the restricted stock, remaining in the company at the expiration of the following vested period, without violating laws, labor contracts, work rules, company regulations and other agreed circumstances with the company, and achieving the company's operational objectives set by the company, the proportion of the highest share of the number of shares to be allotted will be as follows: The actual share of the shares to be allotted will be calculated based on the company's operational target:
Vesting Period Proportions Remain employed by the Company within one year 25% Remain employed by the Company within two year 30% Remain employed by the Company within three year 45% Employees still serve in the company after the expiration of the vested period. Those who have not violated the labor contract, work rules, etc., and have achieved the performance requirements of the company, may receive new shares. The restrictions the employees are subject to before the aforementioned conditions are met are as follows The restrictions on the rights of the employees who acquire the restricted shares but have not met the vesting conditions are as follows: a. According to the trust agreement, after the employee acquired the new shares, the employee cannot sell,
mortgage, transfer, donate, pledge, no objection to the right to buy, or other way due to disposal before the vested condition is reached. However, if there are other norms in this measure, they shall be regulated.
b. The attendance, proposals, speeches, and voting rights of the shareholders' meeting shall be executed by
the trust custodian institution according to law.

264
c. Employee restricted stock, after the new shares are issued, they should be immediately delivered to the trust, and the employee must not ask the trustee for any reason or manner to receive the return of the employee's rights to new shares before the vested condition is reached.
d. The new shares issued by the Company that restrict employee rights shall be handled in the form of
stock trusts, and the company or the person designated by the company shall sign and revise the trust related contracts on behalf of all the assigned employees. Before the vested condition is reached, if the employee terminates or terminates the agent's authorization to deliver the trust in violation of the above-mentioned provisions, the company has the right to withdraw the shares and cancel the loss to the employee at no charge.
Relevant information on new shares of restricted employee rights issued is as follows:
Number of Shares
(In Thousands of Shares) 2018 2017 Balance at January 1 1,125 1,500 Vested (171) (255) Cancelled (295) (120) Balance at December 31 659 1,125 Compensation costs recognized (reversed) were $(5,337) thousand and $57,124 thousand for the years ended December 31, 2018 and 2017, respectively.
32. PARTIAL ACQUISITION OR DISPOSAL OF SUBSIDIARIES - WITHOUT LOSS OF CONTROL In December 2017, due to the execution of new shares of Sync-Tech system Corp. employees, the shareholding ratio decreased from 59.87% to 58.96%. In November and December 2018, due to partial disposal of Sync-Tech’s shares and the execution of employee stock options, the shareholding ratio decreased from 58.96% to 55.11%. In August 2017, due to the distribution of employees’ compensation in the form of shares and implementation of employee stock option certificates by Sensortek Technology Corp., the Company’s shareholdings decreased from 61.41% to 53.74%. In April and October 2018, as the Company repurchased some of the shares from Sensortek Technology Corp. and in May 2018, the Company distributed employees’ compensation in the form of shares, the shareholding ratio increased from 53.74% to 53.93%. Due to the distribution of employees’ compensation in the form of shares by Forcelead Technology Corp. in July 2017, the Company’s shareholding percentage decreased from 68.09% to 65.47%. In November 2017, due to the repurchase of some of their shares, the Company’s shareholding percentage increased from 65.47% to 76.42%. In August 2018, due to the distribution of employees’ compensation in the form of shares by Forcelead Technology Corp., the Company’s shareholding percentage decreased from 76.42% to 75.83%. In January 2017, the Company subscribed for additional new shares of Infinno Technology Corp. at a percentage different from its existing ownership percentage, increasing its continuing interest from 45.76% to 63.99%.
In January 2017, the Company subscribed for additional new shares of mCore Technology Corp. at a percentage different from its existing ownership percentage, increasing its continuing interest from 87.12% to 90.73%.

265
The above transactions were accounted for as equity transactions, since the Company did not cease to have control over these subsidiaries. For details about the partial acquisition of subsidiaries, refer to Note 32 to the Company’s consolidated financial statements for the year ended December 31, 2018.
33. OPERATING LEASE ARRANGEMENTS a. The Company as lessee
The land of some of the Company's offices and parking lots was leased from private individuals, and the leases will expire in July, 2021. The lessor may adjust the rent according to the contract, and may renew the lease when the lease expires. The guarantee amounts paid by the Company under operating lease contracts as of December 31, 2018 and 2017 were $3,778 thousand and $3,120 thousand, respectively. The future minimum lease payments of operating lease commitments were as follows: December 31 2018 2017 No later than 1 year $ 22,007 $ 18,114 1-5 years 32,014 46,000 $ 54,021 $ 64,114 The lease payments recognized as expense were as follows: For the Year Ended December 31 2018 2017 Minimum lease payments $ 20,642 $ 17,829
b. The Company as lessor
Operating lease is the rental of investment real estate owned by the company. The lessees do not have bargain purchase options to acquire the properties at the expiry of the lease term. The guarantee amount received by the Company under operating lease contract at December 31, 2018 and 2017 were $4,362 thousand and $4,789 thousand, respectively.
The future minimum lease payments of operating lease commitments were as follows: December 31 2018 2017 No later than 1 year $ 21,432 $ 19,782 Over 1 year 68,417 19,323 $ 89,849 $ 39,105

266
34. CAPITAL MANAGEMENT
The Company manages its capital to ensure that the Company will be able to continue as a going concern while maximizing the return to shareholders through the optimization of the debt and equity balance. The capital structure of the Company consists of net debt (borrowings offset by cash and cash equivalents) and equity of the Company (comprising issued capital, reserves, retained earnings and other equity). The Company is not subject to any externally imposed capital requirements.
35. FINANCIAL INSTRUMENTS
a. Fair value of financial instruments not measured at fair value
The management considers that the carrying amounts of financial assets and financial liabilities recognized in the financial statements approximate their fair values or their fair values cannot be reliably measured.
b. Fair value of financial instruments measured at fair value on a recurring basis
1) Fair value hierarchy
December 31, 2018
Level 1 Level 2 Level 3 Total Financial assets at FVTPL Derivative financial assets $ - $ 168 $ - $ 168 Domestic corporate funds 15,945 - - 15,945 Convertible bond asset swaps - 51,177 - 51,177 Convertible bonds - 75,620 - 75,620
$ 15,945 $ 126,965 $ - $ 142,910 Financial assets at FVTOCI Investments in equity instruments at
FVTOCI Domestic listed shares $ 187,259 $ - $ - $ 187,259 Foreign unlisted equity
investment - - 317,616 317,616 Investments in debt instruments at
FVTOCI Foreign corporate bonds 14,814 - - 14,814
$ 202,073 $ - $ 317,616 $ 519,689
Financial liabilities at FVTPL Derivatives $ - $ 1,090 $ - $ 1,090
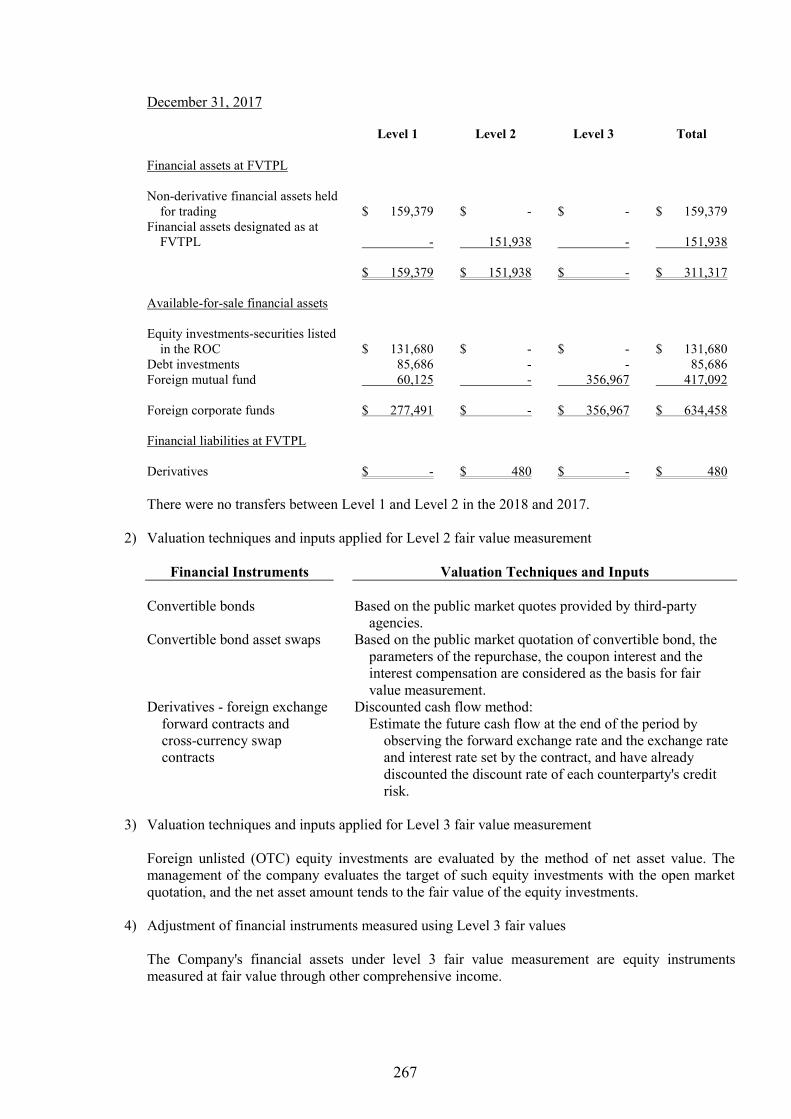
267
December 31, 2017 Level 1 Level 2 Level 3 Total Financial assets at FVTPL Non-derivative financial assets held
for trading $ 159,379 $ - $ - $ 159,379 Financial assets designated as at
FVTPL - 151,938 - 151,938
$ 159,379 $ 151,938 $ - $ 311,317
Available-for-sale financial assets Equity investments-securities listed
in the ROC $ 131,680 $ - $ - $ 131,680 Debt investments 85,686 - - 85,686 Foreign mutual fund 60,125 - 356,967 417,092 Foreign corporate funds $ 277,491 $ - $ 356,967 $ 634,458
Financial liabilities at FVTPL Derivatives $ - $ 480 $ - $ 480 There were no transfers between Level 1 and Level 2 in the 2018 and 2017.
2) Valuation techniques and inputs applied for Level 2 fair value measurement
Financial Instruments Valuation Techniques and Inputs Convertible bonds Based on the public market quotes provided by third-party
agencies. Convertible bond asset swaps Based on the public market quotation of convertible bond, the
parameters of the repurchase, the coupon interest and the interest compensation are considered as the basis for fair value measurement.
Derivatives - foreign exchange forward contracts and cross-currency swap contracts
Discounted cash flow method: Estimate the future cash flow at the end of the period by
observing the forward exchange rate and the exchange rate and interest rate set by the contract, and have already discounted the discount rate of each counterparty's credit risk.
3) Valuation techniques and inputs applied for Level 3 fair value measurement
Foreign unlisted (OTC) equity investments are evaluated by the method of net asset value. The management of the company evaluates the target of such equity investments with the open market quotation, and the net asset amount tends to the fair value of the equity investments.
4) Adjustment of financial instruments measured using Level 3 fair values The Company's financial assets under level 3 fair value measurement are equity instruments measured at fair value through other comprehensive income.
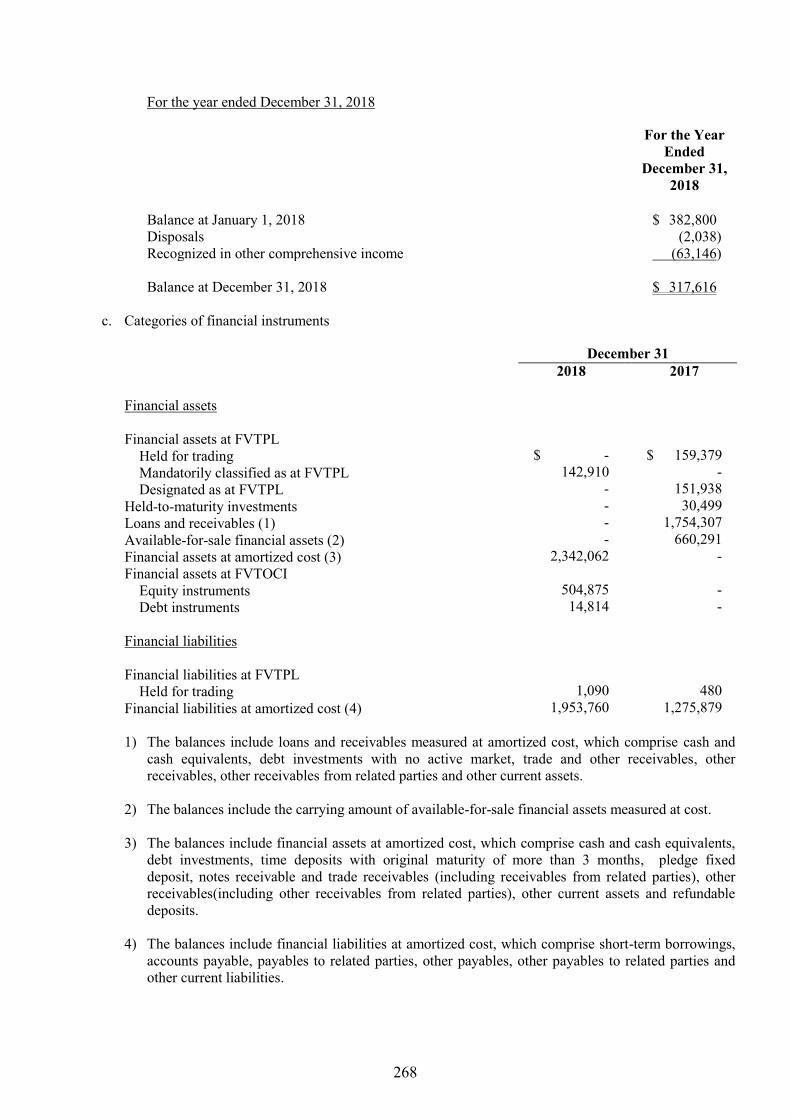
268
For the year ended December 31, 2018
For the Year Ended
December 31, 2018
Balance at January 1, 2018 $ 382,800 Disposals (2,038) Recognized in other comprehensive income (63,146) Balance at December 31, 2018 $ 317,616
c. Categories of financial instruments
December 31 2018 2017 Financial assets Financial assets at FVTPL
Held for trading $ - $ 159,379 Mandatorily classified as at FVTPL 142,910 - Designated as at FVTPL - 151,938
Held-to-maturity investments - 30,499 Loans and receivables (1) - 1,754,307 Available-for-sale financial assets (2) - 660,291 Financial assets at amortized cost (3) 2,342,062 - Financial assets at FVTOCI
Equity instruments 504,875 - Debt instruments 14,814 -
Financial liabilities Financial liabilities at FVTPL
Held for trading 1,090 480 Financial liabilities at amortized cost (4) 1,953,760 1,275,879
1) The balances include loans and receivables measured at amortized cost, which comprise cash and
cash equivalents, debt investments with no active market, trade and other receivables, other receivables, other receivables from related parties and other current assets.
2) The balances include the carrying amount of available-for-sale financial assets measured at cost. 3) The balances include financial assets at amortized cost, which comprise cash and cash equivalents,
debt investments, time deposits with original maturity of more than 3 months, pledge fixed deposit, notes receivable and trade receivables (including receivables from related parties), other receivables(including other receivables from related parties), other current assets and refundable deposits.
4) The balances include financial liabilities at amortized cost, which comprise short-term borrowings,
accounts payable, payables to related parties, other payables, other payables to related parties and other current liabilities.

269
d. Financial risk management objectives and policies The Company’s major financial instruments include equity and debt investments, trade receivables, trade payables and borrowings. The Company’s corporate treasury function provides services to the business, coordinates access to domestic and international financial markets, monitors and manages the financial risks relating to the operations of the Company through internal risk reports which analyze exposures by degree and magnitude of risks. These risks include market risk (including foreign currency risk, interest rate risk and other price risk), credit risk and liquidity risk. The Company seeks to minimize the effects of these risks by using derivative financial instruments to hedge risk exposures. The use of financial derivatives is governed by the Company’s policies approved by the board of directors, which provided written principles on foreign currency risk, interest rate risk, credit risk, the use of financial derivatives and non-derivative financial instruments, and the investment of excess liquidity. Compliance with policies and exposure limits is reviewed by the internal auditors on a continuous basis. The Company did not enter into or trade financial instruments, including derivative financial instruments, for speculative purposes.
1) Market risk
The Company’s activities exposed it primarily to the financial risks of changes in foreign currency exchange rates (see (a) below) and interest rates (see (b) below). The Company entered into a variety of derivative financial instruments to manage its exposure to foreign currency risk and interest rate risk. There has been no change in the Company’s exposure to market risks or the manner in which these risks are managed and measured. a) Foreign currency risk
The Company’s operating activities are partially denominated in foreign currencies and apply natural hedge. The carrying amounts of the Company’s foreign currency denominated monetary assets and monetary liabilities (including those eliminated on consolidation) and of the derivatives exposed to foreign currency risk at the end of the reporting period are set out in Note 38.
Sensitivity analysis
The Company was mainly exposed to the USD, JPY and CNY. The following table details the Company’s sensitivity to a 5% increase and decrease in the New Taiwan dollars (i.e. the functional currency) against the relevant foreign currencies. The sensitivity analysis included only outstanding foreign currency denominated monetary items, and adjusts their translation at the end of the reporting period for a 5% change in foreign currency rates. A positive number below indicates an increase in pre-tax profit and other equity associated with the New Taiwan dollar strengthening 5% against the relevant currency. For a 5% weakening of the New Taiwan dollar against the relevant currency, there would be an equal and opposite impact on pre-tax profit and other equity, and the balances below would be negative. USD Impact JPY Impact CNY Impact For the Year Ended
December 31 For the Year Ended
December 31 For the Year Ended
December 31 2018 2017 2018 2017 2018 2017
Profit or loss $ (25,561) $ 11,269 $ 52 $ 285 $ 3,068 $ 46

270
b) Interest rate risk
The Company was exposed to interest rate risk because the Company borrowed funds at both fixed and floating interest rates. The carrying amounts of the Company’s financial assets and financial liabilities with exposure to interest rates at the end of the reporting period were as follows: December 31 2018 2017 Fair value interest rate risk
Financial assets $ 945,797 $ 385,576 Cash flow interest rate risk
Financial assets 260,727 402,710 Financial liabilities 445,368 -
Sensitivity analysis The sensitivity analysis below was determined based on the Company’s exposure to interest rates for both derivative and non-derivative instruments at the end of the reporting period. For floating rate liabilities, the analysis was prepared assuming the amount of each liability outstanding at the end of the reporting period was outstanding for the whole year. If interest rates had been 0.1% basis points higher/lower and all other variables were held constant, the Company’s pre-tax profit for the years ended December 31, 2018 would decrease/increase by $185 thousand, which was mainly attributable to the Company’s exposure to interest rates on variable-rate net assets. The Company’s pre-tax profit for the year ended December 31, 2017 would increase/decrease by $403 thousand, which was mainly attributable to the Company’s exposure to interest rates on variable-rate net assets, and the Company’s pre-tax other comprehensive income for the year ended December 31, 2018 would decrease/increase by $15 thousand, which was mainly a result of the changes in the fair value of investments in fixed-rate debt instruments at FVTOCI.
c) Other price risk
The Company was exposed to equity price risk through its investments in listed equity securities. The Company does not activity trade these investments. The Company’s equity price risk is mainly concentrated in the Taiwan Stock Exchange and in equity instruments operating in benefit vouchers of the telecommunication network industry, semiconductor industry, electrical and cable industry equity instruments of OTC industry sector quoted in the open-end funds of Taipei Exchange. Sensitivity analysis The sensitivity analysis below was determined based on the exposure to equity price risks at the end of the reporting period. If equity prices had been 5% higher/lower, pre-tax other comprehensive income for the year ended December 31, 2018 would have increased/decreased by $9,363 thousand, as a result of the changes in fair value of financial assets at FVTOCI.

271
If equity prices had been 5% higher/lower, pre-tax other comprehensive income for the year ended December 31, 2017 would have increased/decreased by $421 thousand, as a result of the changes in fair value of held for trading shares. Pre-tax other comprehensive income for the year ended December 31, 2017 would have increased/decreased by $6,584 thousand, as a result of the changes in fair value of available-for-sale shares.
2) Credit risk
Credit risk refers to the risk that the counterparty will default on its contractual obligations resulting in a financial loss to the Company. As at the end of the reporting period, the Company’s maximum exposure to credit risk, which would cause financial loss to the Company due to the failure of the counterparty to discharge its obligation and due to the financial guarantees provided by the Company, could be equal to the total of the following the carrying amount of the respective recognized financial assets as stated in the balance sheets. To mitigate credit risk, the management of the Company assigns a dedicated team responsible for credit line decisions, credit approvals and other monitoring procedures to ensure appropriate actions are taken for the collections of overdue receivables. In addition the Company reviews conditions on each collecting receivable to ensure the uncollectible amounts are provided with appropriate impairment losses. Accordingly, the management of the Company believes that the credit risk of the Company has been significantly reduced. In addition, since the counterparties of liquidity and derivative financial instruments are banks with sound credit ratings, the credit risk is limited. Apart from customers whose total accounts receivable constitute more than 10% of the Company’s total accounts receivable, are more than 10%, the Company did not have significant credit risk exposure to any single counterparty or any group of counterparties having similar characteristics. The Company’s concentration of credit risk was of 49% and 39% of total trade receivables as of December 31, 2018 and 2017, respectively.
3) Liquidity risk
The Company manages liquidity risk by monitoring and maintaining a level of cash and cash equivalents deemed adequate to finance the Company’s operations and mitigate the effects of fluctuations in cash flows. In addition, management monitors the utilization of bank borrowings and ensures compliance with loan covenants.
The Company relies on bank borrowings as a significant source of liquidity. As of December 31, 2018 and 2017, the Company had available unutilized short-term bank loan facilities set out in (c) below. a) Liquidity and interest rate risk tables for non-derivative financial liabilities
The following table details the Company’s remaining contractual maturities for its non-derivative financial liabilities with agreed repayment periods. The table has been drawn up based on the undiscounted cash flows of financial liabilities from the earliest date on which the Company can be required to pay. The table included both interest and principal cash flows. Specifically, bank loans with a repayment on demand clause were included in the earliest time band regardless of the probability of the banks choosing to exercise their rights. The maturity dates for other non-derivative financial liabilities were based on the agreed repayment dates.

272
December 31, 2018
On Demand or Less than
1 Month 1-3 Months 3 Months to 1
Year 1-5 Years Total Non-derivative financial liabilities
Non-interest bearing liabilities $ 200,228 $ 246,058 $ - $ - $ 446,286 Variable interest rate liabilities 642,865 654,689 209,920 - 1,507,474
December 31, 2017
On Demand or Less than
1 Month 1-3 Months 3 Months to 1
Year 1-5 Years Total Non-derivative financial liabilities
Non-interest bearing liabilities $ 595,459 $ 518,491 $ 161,929 $ - $ 1,275,879
The amounts included above for variable interest rate instruments for both non-derivative financial assets and liabilities were subject to change if changes in variable interest rates were to differ from those estimates of interest rates determined at the end of the reporting period.
b) Liquidity and interest rate risk table for derivative financial liabilities
The following table details the Company’s liquidity analysis of its derivative financial instruments. The table is based on the undiscounted contractual net cash inflows and outflows on derivative instruments that settle on a net basis, and the undiscounted gross inflows and outflows on those derivatives that require gross settlement. When the amount payable or receivable is not fixed, the amount disclosed is determined by reference to the projected interest rates as illustrated by the yield curves at the end of the reporting period. December 31, 2018
On Demand or Less than 1 Month 1-3 Months
3 Months to 1 Year 1-5 Years
Foreign exchange forward
contracts Inflows $ 138,208 $ 61,430 $ - $ - Outflows (138,130) (61,350) - -
$ 78 $ 80 $ - $ - Cross-currency swap
contracts Inflows $ 307,150 $ 61,430 $ - $ - Outflows (307,900) (61,760) - -
$ (750) $ (330) $ - $ -

273
December 31, 2017
On Demand or Less than 1 Month 1-3 Months
3 Months to 1 Year 1-5 Years
Cross-currency swap
contracts Inflows $ - $ 60,060 $ - $ - Outflows - (60,540) - -
$ - $ (480) $ - $ - c) Financing facilities
December 31 2018 2017 Unsecured bank overdraft facilities, reviewed annually
and payable on demand: Amount used $ 445,368 $ - Amount unused 2,594,300 2,712,320
$ 3,039,668 $ 2,712,320 36. TRANSACTIONS WITH RELATED PARTIES
In addition to those disclosed in other notes, detail of transactions between the Company and related parties are disclosed below. a. Related party name and category
Related Party Name Related Party Category Sensortek Technology Corp. Subsidiary Forcelead Technology Corp. Subsidiary mCore Technology Corp. Subsidiary Infinno Technology Corp. Subsidiary Sync-Tech System Corp. Subsidiary Sitronix Investment Corp Subsidiary HeFei Sitronix Co., Ltd. Subsidiary HeFei ezGreen Co., Ltd. Subsidiary Sitronix Technology (Mauritius) Corp.
(Sitronix Mauritius) Subsidiary
Sitronix Technology (Shenzhen) Co., Ltd. Subsidiary Silicon Power Computer & Communications
Inc. Related party in substance
Vincent Mao The principal management of a subsidiary Wen Bin Lin The principal management of a subsidiary Chun Sheng Lin The principal management of a subsidiary I Hsi Cheng The principal management of a subsidiary Wei Wang The principal management of a subsidiary Shu Fang Xu The principal management of a subsidiary Meng Huang Liu The principal management of a subsidiary Zheng Long Jiang The principal management of a subsidiary Xi Hao Zhong The principal management of a subsidiary Min Huei Jhang The principal management of a subsidiary Ru Hung Chen The principal management of a subsidiary

274
b. Sales of goods
For the Year Ended December 31 Related Party Category 2018 2017
Fellow subsidiaries Sitronix Mauritius $ 821,660 $ 3,242,799 Others 42,765 38,219
Total 864,425 3,281,018 Substantial related party 37 - $ 864,462 $ 3,281,018
The sale of goods to related parties were made based on general terms and prices.
c. Purchases
For the Year Ended December 31 Related Party Category 2018 2017
Subsidiary $ 360,090 $ 296,933
Transactions involving the purchase of goods from related parties were made based on general terms and prices.
d. Manufacturing expense
For the Year Ended December 31 Related Party Category 2018 2017
Subsidiary $ 41,787 $ 28,859
The payment of manufacturing expenses to related parties, the terms of the transaction are calculated according to the contract agreement.
e. Expenditure on technical services
For the Year Ended December 31 Related Party Category 2018 2017
Subsidiary $ 5,173 $ 5,215
The payment of technical service expenditure to the related parties, the terms of the transaction are calculated according to the contract agreement.
f. Operating expenses
For the Year Ended December 31 Related Party Category 2018 2017
Subsidiary $ 91,397 $ 145
The payment of operating expenses to the related parties, the terms of the transaction are calculated according to the contract agreement.

275
g. Rental income
For the Year Ended December 31 Related Party Category 2018 2017
Subsidiary Sync-Tech System Corp. $ 14,014 $ 14,043 Sensortek Technology Corp. 4,344 4,344 Others 5,900 5,900
Total 24,258 24,287 Substantial related party 2,034 2,034 $ 26,292 $ 26,321 Rental income from related parties are negotiated based on the agreements as there are no similar transactions for comparison.
h. Handling fee revenue
For the Year Ended December 31 Related Party Category 2018 2017
Subsidiary $ 1,350 $ 1,115
Handling fees from related parties are calculated based on the agreements as there are no similar transactions for comparison.
i. Other revenue
For the Year Ended December 31 Related Party Category 2018 2017
Subsidiary $ 667 $ 772 The company receipted other revenue from related parties and the terms of the transaction are calculated in accordance with the contract agreement.
j. Rental expenses
For the Year Ended December 31 Related Party Category 2018 2017
Subsidiary $ 1,320 $ 1,320
The payment of rental expenses to the related parties, the terms of the transaction are calculated according to the contract agreement.

276
k. Disposals of property, plant and equipment Proceeds Gain (Loss) on Disposal
For the Year Ended
December 31 For the Year Ended
December 31 Related Party Category 2018 2017 2018 2017
Subsidiary $ - $ 1,268 $ - $ -
The Company disposed property, plant and equipment to related parties, the terms of the transaction are calculated according to the contract agreement.
l. Disposals of other assets
Proceeds Gain (Loss) on Disposal
For the Year Ended
December 31 For the Year Ended
December 31 Related Party Category 2018 2017 2018 2017
Subsidiary- Prepayments $ 220 $ - $ - $ -
The Company disposed prepayments to related parties, the terms of the transaction are calculated according to the contract agreement.
m. Receivables from related parties
For the Year Ended December 31
Related Party Category 2018 2017 Fellow subsidiary Sitronix Mauritius $ - $ 360,650 Others 16,699 11,766
Total 16,699 372,416 Substantial related party 39 - $ 16,738 $ 372,416 There is no guarantee for receivables from related parties. The amount of accounts receivable from related parties does not include the bad debt fee in 2018 and 2017.
n. Other receivables from related parties (excluding loans to related parties)
For the Year Ended December 31 Related Party Category 2018 2017
Subsidiary $ 5,858 $ 3,657
The above-mentioned other receivables are mainly generated by rental income, endorsement guarantee fees and collection and payment.

277
o. Payables to related parties
For the Year Ended December 31 Related Party Category 2018 2017
Subsidiary Sensortek Technology Corp. $ 91,971 $ 35,687 mCore Technology Corp. 10,431 12,307 Others 231 231 $ 102,633 $ 48,225
There is no collateral pledged on the balance of payables to related parties.
p. Other payables to related parties
For the Year Ended December 31 Related Party Category 2018 2017
Subsidiary $ 6,765 $ 10,179
Other payables to related parties are mainly due to technical service expenditure and manufacturing expenses.
q. Guarantee deposits received
For the Year Ended December 31 Related Party Category 2018 2017
Subsidiary $ 2,163 $ 2,163 Substantial related party 356 356 $ 2,519 $ 2,519
The guarantee deposits received are mainly generated by the rental deposit.
r. Property transactions
2017
Related Party Category Item shares Transaction target Acquire price The main management of
the company and its subsidiaries
Long-term equity investment accounted for using the equity method
1,502,000 Securities-Forcelead $ 84,112
A transaction in which the Company obtains financial assets from a related party is subject to a contractual agreement because there is no comparable transaction for comparison.

278
s. Loans to related parties
December 31 Related Party Category 2018 2017
Other receivables from related parties
Subsidiary $ 82,466 $ 20,000 Interest revenue
Subsidiary $ 709 $ 111 The Company provides short-term loans to subsidiaries with interest rates ranging from 1.25% to 3.54%. As there are no similar transactions for comparison, the terms of the transaction are calculated in accordance with the contract.
t. Endorsements and guarantees provided by the Company
December 31 Related Party Category 2018 2017
Subsidiary Amount endorsed $ 1,100,000 $ 1,200,000 Amount utilized $ 289,185 $ 254,271
The Company provides endorsement guarantees for subsidiaries to obtain purchase contracts and bank credit lines from suppliers. The terms and conditions of the transaction for the collection of relevant handling fees shall be calculated according to the agreement of the contract, as there is no relevant similar transaction to follow.
u. Compensation of key management personnel
For the Year Ended December 31 2018 2017 Short-term employee benefits $ 47,154 $ 50,361 Share-based payments (2,102) 22,507 Post-employment benefits 737 727 $ 45,789 $ 73,595
The remuneration of directors and key executives was determined based on the performance of individuals and company profits.
37. ASSETS PLEDGED AS COLLATERAL OR FOR SECURITY
The following assets were provided as collateral for the tariff of imported raw materials guarantees:
December 31 2018 2017 Pledged deposits $ 28,802 $ 25,679
Pledged deposits for 2018 are financial assets measured at amortized cost, and pledged deposits for 2017 are investments in debt instruments with no active market.

279
38. SIGNIFICANT ASSETS AND LIABILITIES DENOMINATED IN FOREIGN CURRENCIES The Company’s significant financial assets and liabilities denominated in foreign currencies aggregated by the foreign currencies other than functional currencies and the related exchange rates between foreign currencies and respective functional currencies were as follows:
December 31 2018 2017
Foreign
Currency Exchange Rate Foreign
Currency Exchange Rate Financial assets Monetary items
USD $ 35,966 30.715 $ 38,250 29.76 JPY 70,496 0.2782 90,182 0.2642 RMB 13,723 4.472 202 4.565
Non-monetary items USD 11,845 30.715 16,756 29.76
Financial liabilities Monetary items
USD 52,610 30.715 30,677 29.76 JPY 66,724 0.2782 68,560 0.2642
The significant unrealized foreign exchange gains (losses) were as follows:
For the Year Ended December 31 2018 2017
Foreign Currency Exchange Rate
Net Foreign Exchange Gains
(Losses) Exchange Rate
Net Foreign Exchange Gains
(Losses)
USD 1:30.715 (USD:NTD) $ 3,432 1:29.76 (USD:NTD) $ 155 JPY 1:0.2782 (JPY:NTD) (6) 1:0.2642 (JPY:NTD) (65) RMB 1:4.472 (RMB:NTD) 190 1:4.565 (RMB:NTD) 5
$ 3,616 $ 95
39. SEPARATELY DISCLOSED ITEMS
a. Information on significant transactions and b. information on investees:
1) Financing provided to others: Table 1 (attached) 2) Endorsements/guarantees provided: Table 2 (attached) 3) Marketable securities held (excluding investment in subsidiaries): Table 3 (attached) 4) Marketable securities acquired or disposed of at costs or prices of at least NT$300 million or 20%
of the paid-in capital: None 5) Acquisition of individual real estate at costs of at least NT$300 million or 20% of the paid-in
capital: None

280
6) Disposal of individual real estate at prices of at least NT$300 million or 20% of the paid-in capital:
None 7) Total purchases from or sales to related parties amounting to at least NT$100 million or 20% of the
paid-in capital: Table 4 (attached) 8) Receivables from related parties amounting to at least NT$100 million or 20% of the paid-in
capital: None 9) Trading in derivative instruments: Note 7 and Note 35 10) Information on investee: Table 5 (attached)
c. Information on investments in mainland China: Tables 6 and 7 (attached)

281
TABLE 1 SITRONIX TECHNOLOGY CORP. AND SUBSIDIARIES FINANCING PROVIDED TO OTHERS FOR THE YEAR ENDED DECEMBER 31, 2018 (In Thousands of New Taiwan Dollars, Unless Stated Otherwise)
No. Lender Borrower Financial Statement Account
Related Parties
Highest Balance for the Period Ending Balance
Actual Borrowing
Amount Interest Rate Nature of
Financing
Business Transaction
Amounts
Reasons for Short-term Financing
Allowance for Impairment Loss
Collateral Financing Limit for Each Borrower
Aggregate Financing Limits Item Value
0 The Company mCore Technology Corp. Other receivables
from related parties Yes $ 100,000 $ 100,000 $ - - For financing $ - Working capital $ - - $ - $ 935,932 $ 1,871,864
Forcelead Technology Corp.
Other receivables from related parties
Yes 100,000 100,000 15,358 - For financing - Working capital - - - 935,932 1,871,864
Infinno Technology Corp. Other receivables from related parties
Yes 100,000 100,000 23,036 - For financing - Working capital - - - 935,932 1,871,864
Sync-Tech System Corp. Other receivables from related parties
Yes 100,000 100,000 44,072 - For financing - Working capital - - - 935,932 1,871,864
Note 1: The description is as follows
1. Lender is numbered as 0. 2. Investee is numbered sequentially from 1.
Note 2: According to the ”Financing providing and operation management method”, the total amount and the available amount to any individual for lending are as follows:
1. The total amount for lending shall not exceed forty percent of SITRONIX’s net worth .However the total amount lendable to any subsidiary for short-term financing could upper to the total available amount of the company. 2. The total amount for lending to any directly or indirectly hold foreign subsidiaries with 100% ownership shall not exceed forty percent of SITRONIX’s net worth. The total amount for lending to any individual shall not exceed fifty percent of the total available amount 3. Where funds are lent to a company or business with business relationships with the Company, the total amount for lending to any individual shall not exceed the amount of business transaction between the two parties. Amount of business transaction defines the highest amount of purchase or sales.
4. The total amount for lending to any individual shall not exceed 50% of the Company's net worth for the company or firm that needs short-term financing.

282
TABLE 2 SITRONIX TECHNOLOGY CORP AND SUBSIDIARIES ENDORSEMENTS/GUARANTEES PROVIDED FOR THE YEAR ENDED DECEMBER 31, 2018 (In Thousands of New Taiwan Dollars, Unless Stated Otherwise)
No. (Note 1)
Endorser/ Guarantor
Endorsee/Guarantee Limit on
Endorsement/ Guarantee Given on
Behalf of Each Party
(Note 2)
Maximum Amount
Endorsed/ Guaranteed During the
Period
Outstanding Endorsement/ Guarantee at the End of the
Period
Actual Borrowing
Amount
Amount Endorsed/
Guaranteed by Collateral
Ratio of Accumulated Endorsement/ Guarantee to Net Equity in
Latest Financial
Statements (%)
Aggregate Endorsement/
Guarantee Limit
(Note 2)
Endorsement/ Guarantee Given by Parent on Behalf of
Subsidiaries
Endorsement/ Guarantee Given by
Subsidiaries on Behalf of Parent
Endorsement/ Guarantee Given on Behalf of
Companies in Mainland
China Name Relationship
0 The Company Forcelead
Technology Corp. Subsidiary $ 2,339,830 $ 300,000 $ 300,000 $ 92,145 $ - 6.37 $ 2,339,830 Yes - -
Sensortek Technology Corp.
Subsidiary 2,339,830 400,000 400,000 107,503 - 8.50 2,339,830 Yes - -
Sync-Tech System Corp
Subsidiary 2,339,830 100,000 100,000 35,000 - 2.12 2,339,830 Yes - -
mCore Technology Corp.
Subsidiary 2,339,830 100,000 100,000 19,737 - 2.12 2,339,830 Yes - -
Infinno Technology Corp.
Subsidiary 2,339,830 100,000 100,000 9,214 - 2.12 2,339,830 Yes - -
HeFei Sitronix Co., Ltd.
Subsidiary 2,339,830 100,000 100,000 25,586 - 2.12 2,339,830 Yes - Yes
Note 1: The description is as follows
1. Lender is numbered as 0. 2. Investee is numbered sequentially from 1.
Note 2: According to the "endorsement guarantee operation management measures" of Sitronix Technology Corp. the total amount of endorsement guarantee shall not exceed 50% of the net financial statements of the most recent year by the accountant's visa verification. The amount of endorsement guarantee for a single enterprise shall not exceed 25% of the net value of the financial statements of the most recent year by the accountant's verification visa. However, the amount of endorsement guarantee for a company that directly and indirectly holds more than 50% of the voting shares of the company shall not exceed 50% of the net financial statements of the company's most recent year by the accountant's verification visa.
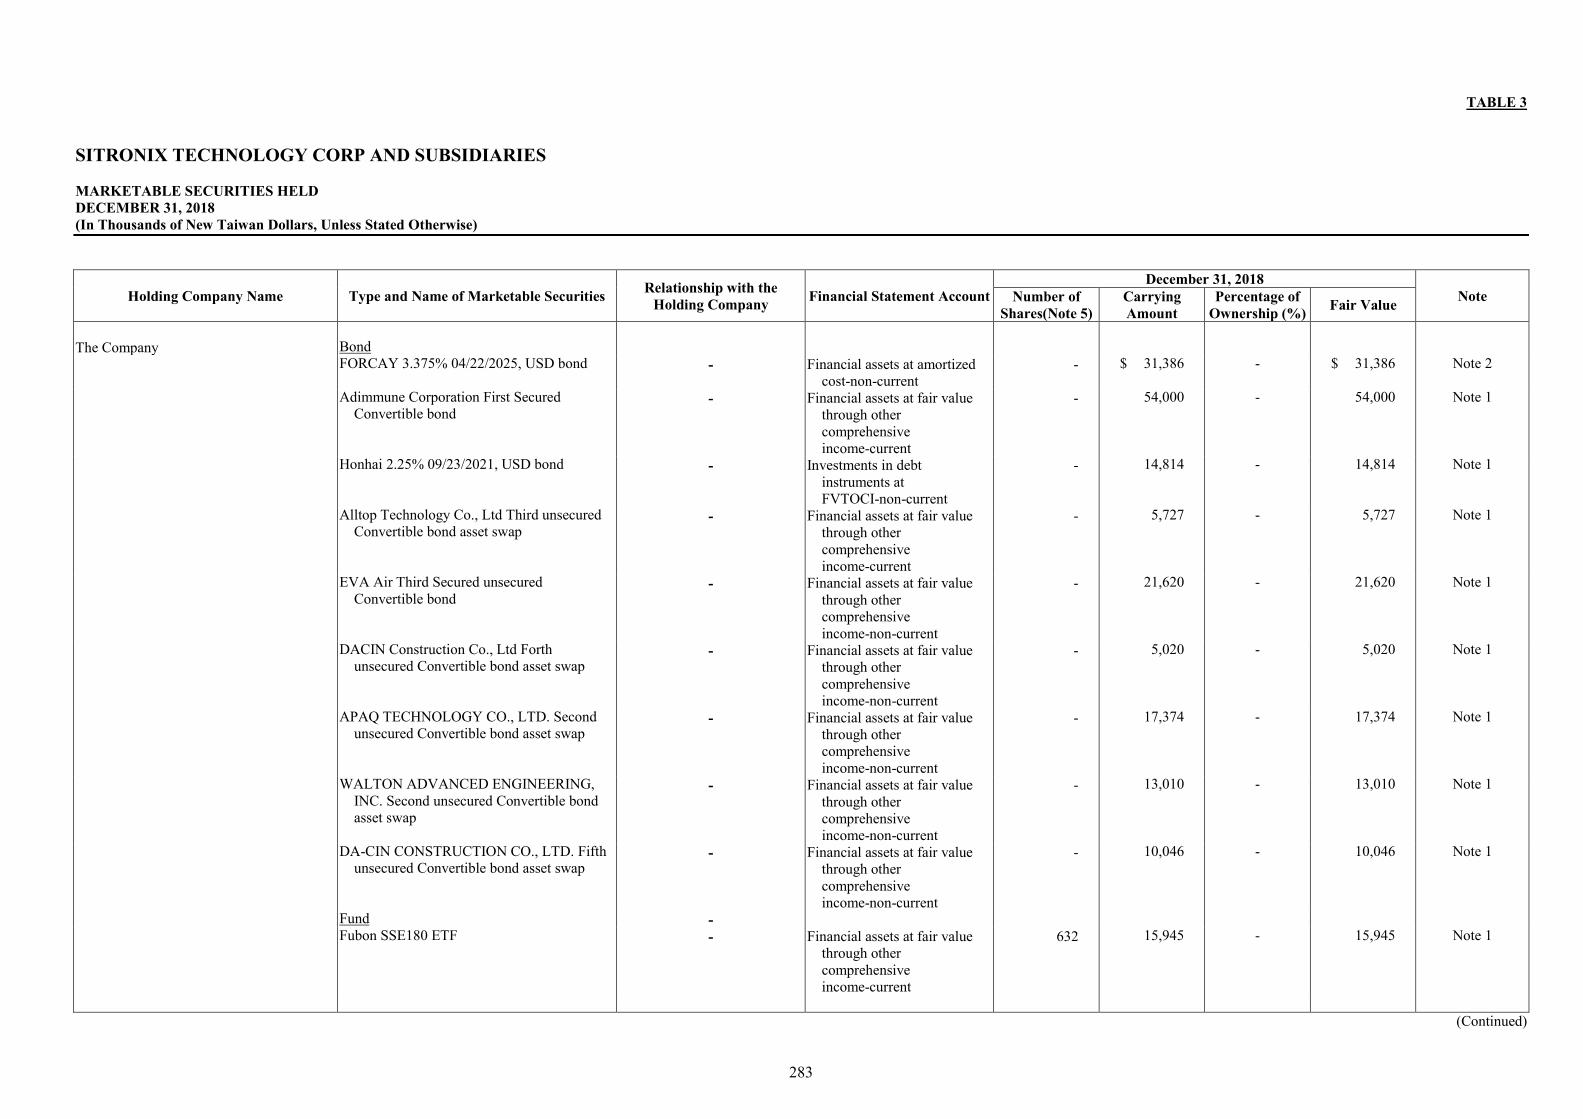
283
TABLE 3 SITRONIX TECHNOLOGY CORP AND SUBSIDIARIES MARKETABLE SECURITIES HELD DECEMBER 31, 2018 (In Thousands of New Taiwan Dollars, Unless Stated Otherwise)
Holding Company Name Type and Name of Marketable Securities Relationship with the Holding Company Financial Statement Account
December 31, 2018 Note Number of
Shares(Note 5) Carrying Amount
Percentage of Ownership (%) Fair Value
The Company Bond FORCAY 3.375% 04/22/2025, USD bond - Financial assets at amortized
cost-non-current - $ 31,386 - $ 31,386 Note 2
Adimmune Corporation First Secured Convertible bond
- Financial assets at fair value through other comprehensive income-current
- 54,000 - 54,000 Note 1
Honhai 2.25% 09/23/2021, USD bond - Investments in debt instruments at FVTOCI-non-current
- 14,814 - 14,814 Note 1
Alltop Technology Co., Ltd Third unsecured Convertible bond asset swap
- Financial assets at fair value through other comprehensive income-current
- 5,727 - 5,727 Note 1
EVA Air Third Secured unsecured Convertible bond
- Financial assets at fair value through other comprehensive income-non-current
- 21,620 - 21,620 Note 1
DACIN Construction Co., Ltd Forth unsecured Convertible bond asset swap
- Financial assets at fair value through other comprehensive income-non-current
- 5,020 - 5,020 Note 1
APAQ TECHNOLOGY CO., LTD. Second unsecured Convertible bond asset swap
- Financial assets at fair value through other comprehensive income-non-current
- 17,374 - 17,374 Note 1
WALTON ADVANCED ENGINEERING, INC. Second unsecured Convertible bond asset swap
- Financial assets at fair value through other comprehensive income-non-current
- 13,010 - 13,010 Note 1
DA-CIN CONSTRUCTION CO., LTD. Fifth unsecured Convertible bond asset swap
- Financial assets at fair value through other comprehensive income-non-current
- 10,046 - 10,046 Note 1
Fund - Fubon SSE180 ETF - Financial assets at fair value
through other comprehensive income-current
632 15,945 - 15,945 Note 1
(Continued)
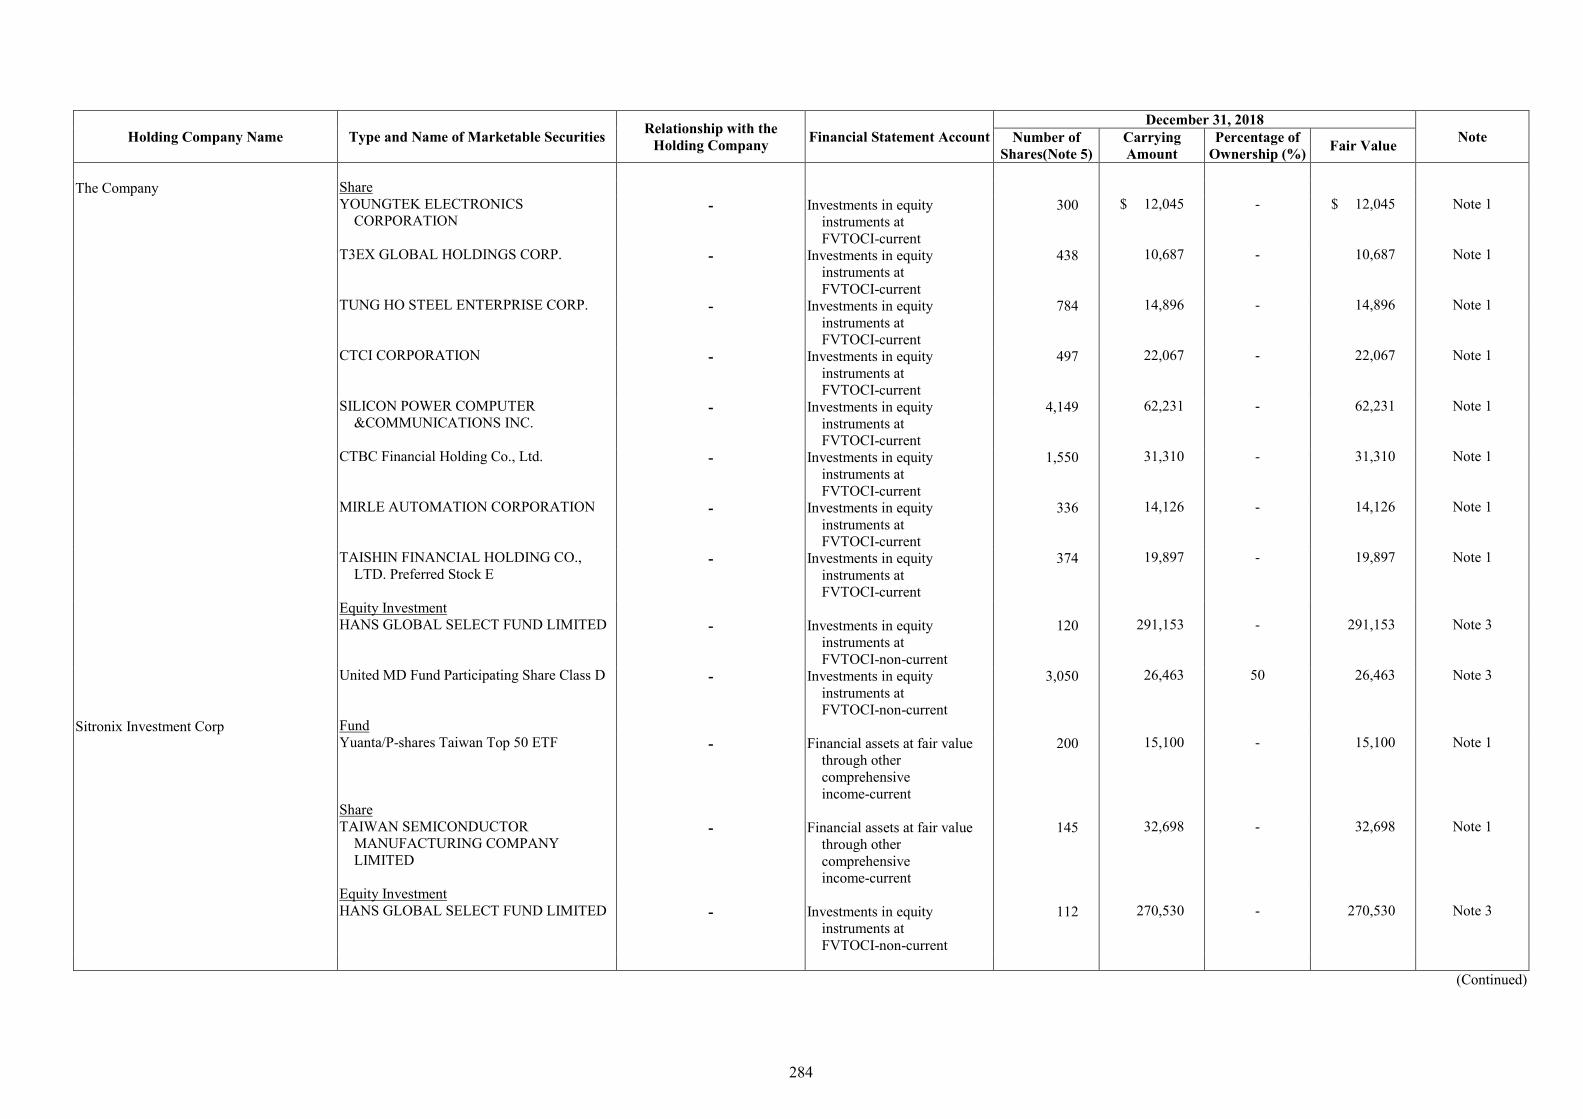
284
Holding Company Name Type and Name of Marketable Securities Relationship with the Holding Company Financial Statement Account
December 31, 2018 Note Number of
Shares(Note 5) Carrying Amount
Percentage of Ownership (%) Fair Value
The Company Share YOUNGTEK ELECTRONICS
CORPORATION - Investments in equity
instruments at FVTOCI-current
300 $ 12,045 - $ 12,045 Note 1
T3EX GLOBAL HOLDINGS CORP. - Investments in equity instruments at FVTOCI-current
438 10,687 - 10,687 Note 1
TUNG HO STEEL ENTERPRISE CORP. - Investments in equity instruments at FVTOCI-current
784 14,896 - 14,896 Note 1
CTCI CORPORATION - Investments in equity instruments at FVTOCI-current
497 22,067 - 22,067 Note 1
SILICON POWER COMPUTER &COMMUNICATIONS INC.
- Investments in equity instruments at FVTOCI-current
4,149 62,231 - 62,231 Note 1
CTBC Financial Holding Co., Ltd. - Investments in equity instruments at FVTOCI-current
1,550 31,310 - 31,310 Note 1
MIRLE AUTOMATION CORPORATION - Investments in equity instruments at FVTOCI-current
336 14,126 - 14,126 Note 1
TAISHIN FINANCIAL HOLDING CO., LTD. Preferred Stock E
- Investments in equity instruments at FVTOCI-current
374 19,897 - 19,897 Note 1
Equity Investment HANS GLOBAL SELECT FUND LIMITED - Investments in equity
instruments at FVTOCI-non-current
120 291,153 - 291,153 Note 3
United MD Fund Participating Share Class D - Investments in equity instruments at FVTOCI-non-current
3,050 26,463 50 26,463 Note 3
Sitronix Investment Corp Fund Yuanta/P-shares Taiwan Top 50 ETF - Financial assets at fair value
through other comprehensive income-current
200 15,100 - 15,100 Note 1
Share TAIWAN SEMICONDUCTOR
MANUFACTURING COMPANY LIMITED
- Financial assets at fair value through other comprehensive income-current
145 32,698 - 32,698 Note 1
Equity Investment HANS GLOBAL SELECT FUND LIMITED - Investments in equity
instruments at FVTOCI-non-current
112 270,530 - 270,530 Note 3
(Continued)

285
Holding Company Name Type and Name of Marketable Securities Relationship with the Holding Company Financial Statement Account
December 31, 2018 Note Number of
Shares Carrying Amount
Percentage of Ownership (%) Fair Value
Forcelead Technology Corp. Bond - DA-CIN CONSTRUCTION CO., LTD. Fifth
unsecured Convertible bond asset swap - Financial assets at fair value
through other comprehensive income-non-current
- $ 10,024 - $ 10,024 Note 1
Fulgent Sun International (Holding) Co., Ltd. Third unsecured Convertible bond asset swap Third unsecured Convertible bond asset swap
- Financial assets at fair value through other comprehensive income-current
- 10,039 - 10,039 Note 1
Tong Ming Enterprise Co., Ltd. First unsecured Convertible bond asset swap
- Financial assets at fair value through other comprehensive income-non-current
- 10,030 - 10,030 Note 1
Sitronix Holding Share International Ltd. BRAVOTEK CORP. - Investments in equity
instruments at FVTOCI-non-current
1,800 30,961 15 30,961 Note 2
Bond - Semiconductor Manufacturing International
4.125% 10/2019 - Investments in debt
instruments at FVTOCI-current
- 29,659 - 29,659 Note 1
Note 1: It is calculated based on the closing price on December 31, 2018 Note 2: It is listed by book value. Note 3: It is calculated based on the net value on December 31, 2018 Note 4: On December 31, 2018, the above listed securities did not provide guarantees, pledge loans or other restricted users. Note 5: The number of shares and the number of units are thousand share and thousand.
(Concluded)

286
TABLE 4 SITRONIX TECHNOLOGY CORP AND SUBSIDIARIES TOTAL PURCHASES FROM OR SALES TO RELATED PARTIES AMOUNTING TO AT LEAST NT$100 MILLION OR 20% OF THE PAID-IN CAPITAL FOR THE YEAR ENDED DECEMBER 31, 2018 (In Thousands of New Taiwan Dollars, Unless Stated Otherwise)
Buyer Related Party Relationship Transaction Details Abnormal Transaction Notes/Accounts
Receivable (Payable) Note Purchase/ Sale Amount % of
Total Payment Terms Unit Price Payment Terms Ending Balance
% of Total
The Company Sitronix Technology
(Mauritius) Corp. Substantial related party Sale $ 821,660 11 After acceptance net 60 days
from monthly closing date $ - - $ - - -
The Company Sensortek Technology Corp.
Substantial related party Purchase 297,139 7 After acceptance net 45 days from monthly closing date
- - 91,971 8 -

287
TABLE 5 SITRONIX TECHNOLOGY CORP AND SUBSIDIARIES INFORMATION ON INVESTEES FOR THE YEAR ENDED DECEMBER 31, 2018 (In Thousands of New Taiwan Dollars, Unless Stated Otherwise)
Investor Company Investee Company Location Main Businesses and Products
Original Investment Amount Balance as of December 31, 2018 Net Income (Loss) of the
Investee
Share of (Loss) Profit December 31,
2018 December 31,
2017
Number of Shares (In
Thousands)
% of Ownership
Carrying Amount
The Company Sitronix Investment Corp. Taiwan Investment $ 367,270 $ 367,270 32,977 100.00 $ 293,040 $ (4,979) $ (4,979) Forcelead Technology Corp. Taiwan R&D and sales of small-size LCD driver IC and
touch-integrated driver IC 349,731 349,731 29,685 75.83 392,178 63,976 48,598
Sensortek Technology Corp.
Taiwan R&D, design and sales of sensor integrated circuit products
99,020 97,865 13,004 53.93 313,682 326,275 175,884
mCore Technology Corp. Taiwan Providing solutions for consumer display and voice/audio related applications.
131,074 131,074 9,583 90.73 101,958 12,422 11,271
Sync-Tech System Corp. Taiwan Design, Manufacturing and Maintenance of Probe card
95,000 100,000 9,500 55.11 60,314 12,799 7,484
Infinno Technology Corp. Taiwan Comprehensive line of Power supervisor IC design 164,505 164,505 13,290 63.99 50,703 12 8 Sitronix Technology (Belize) Corp.
Belize city, Belize International trade 61,430
(USD 2,000) 61,430 (USD 2,000)
2,000 100.00 114,068 40,529 40,529
Sitronix Holding International Ltd. Samoa Investment 61,430 (USD 2,000)
- 2,000 100.00 62,026 629 629
Sitronix Investment Corp. Forcelead Technology Corp. Taiwan R&D and sales of small-size LCD driver IC and touch-integrated driver IC
10 10 2 - 22 63,976 2
Sensortek Technology Corporation Taiwan R&D, design and sales of sensor integrated circuit products
10 10 1 - 32 326,275 18
Infinno Technology Corporation Taiwan Comprehensive line of Power supervisor IC design 10 10 1 - 2 12 - Sitronix Technology (Belize)
Corp. Sitronix Technology (Mauritius) Corp. Public of Mauritius International trade USD 2,000
USD 2,000
2,000 100.00 114,066 40,529 40,529
Note 1: Foreign currency values were converted at the exchange rate of US dollars to NT dollars as of December 31, 2018.

288
TABLE 6 SITRONIX TECHNOLOGY CORP AND SUBSIDIARIES INFORMATION ON INVESTMENT IN MAINLAND CHINA FOR THE YEAR ENDED DECEMBER 31, 2018 (In Thousands of New Taiwan Dollars, Unless Stated Otherwise)
Investee Company Main Businesses and Products
Paid-in Capital (US$ in
Thousands)
Method of Investment
Accumulated Outward
Remittance for Investment
from Taiwan as of
January 1, 2018 (US$ in
Thousands)
Remittance of Funds Accumulated Outward
Remittance for Investment
from Taiwan as of
December 31, 2018
(US$ in Thousands)
Net Income (Loss) of the
Investee
% Ownership for Direct or
Indirect Investment
Investment Gain (Loss)
(Note 2)
Carrying Amount as of December 31,
2018
Accumulated Repatriation of
Investment Income
as of December 31,
2018
Outward (US$ in
Thousands ) Inward
Sitronix Technology
(Shenzhen) Co., Ltd. Computer software and
hardware development, sales and after-sales service business and related technical consulting services
$ 12,286 (USD 400)
Note 1 $ 12,286 (USD 400)
$ - $ - $ 12,286 (RMB 400)
$ 1,457 100 $ 1,457 $ 25,870 $ -
HeFei ezGreen Co., Ltd.
Design, sales and technical services of Supplier management software development
8,944 (RMB 2,000)
Note 4 - 8,944 (RMB2,000)
- 8,944 (RMB2,000)
(255) 100 (255) 8,688 -
HeFei Sitronix Co., Ltd.
R&D, design, sales and technical services of integrated circuits and system hardware and software
44,720 (RMB10,000)
Note 5 - 33,540 (RMB7,500)
- 33,540 (RMB7,500)
4,953 75 3,716 37,246 -
Accumulated Outward Remittance for Investment in Mainland China as of
December 31, 2018 (US$ inThousands )
Investment Amount Authorized by the Investment Commission, MOEA (US$
inThousands )
Upper Limit on the Amounts of Investment Stipulated by Investment
Commission, MOEA
$ 56,362 (US$ 1,835)
$ 262,613 (US$ 8,550)
$ 2,822,521
Note 1: The Company invested in a company located in mainland China indirectly through the existing company in a third country. Note 2: The foreign currencies are converted at the US dollar and RMB dollar exchange rate of December 31, 2018. Note 3: According to the Investment Commission, MOEA, 60% of the net value of investments in mainland China is set Note 4: Direct Investment, as of December 31, 2018, the total investment amount approved by the Investment Commission, MOEA, is RMB 10,000 thousand , the investment money of the company has exported RMB 2,000 thousand. Note 5: Direct Investment, as of December 31, 2018, the total investment amount approved by the Investment Commission, MOEA, is RMB 45,000 thousand , the investment money of the company has exported RMB 7,500 thousand.

289
TABLE 7 SITRONIX TECHNOLOGY CORP AND SUBSIDIARIES SIGNIFICANT TRANSACTIONS WITH INVESTEE COMPANIES IN MAINLAND CHINA, EITHER DIRECTLY OR INDIRECTLY THROUGH A THIRD PARTY, AND THEIR PRICES, PAYMENT TERMS, AND UNREALIZED GAINS OR LOSSES FOR THE YEAR ENDED DECEMBER 31, 2018 (In Thousands of New Taiwan Dollars, Unless Stated Otherwise)
Investor Company Investee Company Transaction Type
Total operating expenses Price
Transaction Details Notes/Accounts Receivable (Payable) Unrealized
(Gain) Loss Note Amount % Payment Terms Comparison with Normal
Transactions Ending Balance %
The Company Sitronix Technology
(Shenzhen) Co., Ltd. Professional service fees $ 89,876 7 Calculate according to contract Calculate according to contract No related similar transactions to
follow $ - - $ - -

Sitronix Technology Corp.
Chairman Vincent Mao

Headquarters11F-1, No. 5, Taiyuan 1st St., Jhubei CityHsinchu County 302, TaiwanTEL +886-3-5526500FAX +886-3-5526501
Taipei Office6F., No. 608, Ruiguang Rd., Neihu Dist.,Taipei City 114, TaiwanTEL +886-2-2659-1276 FAX +886-2-2658-2554
www.sitronix.com.tw