situation analysis poverty and hunger - amazon...
TRANSCRIPT
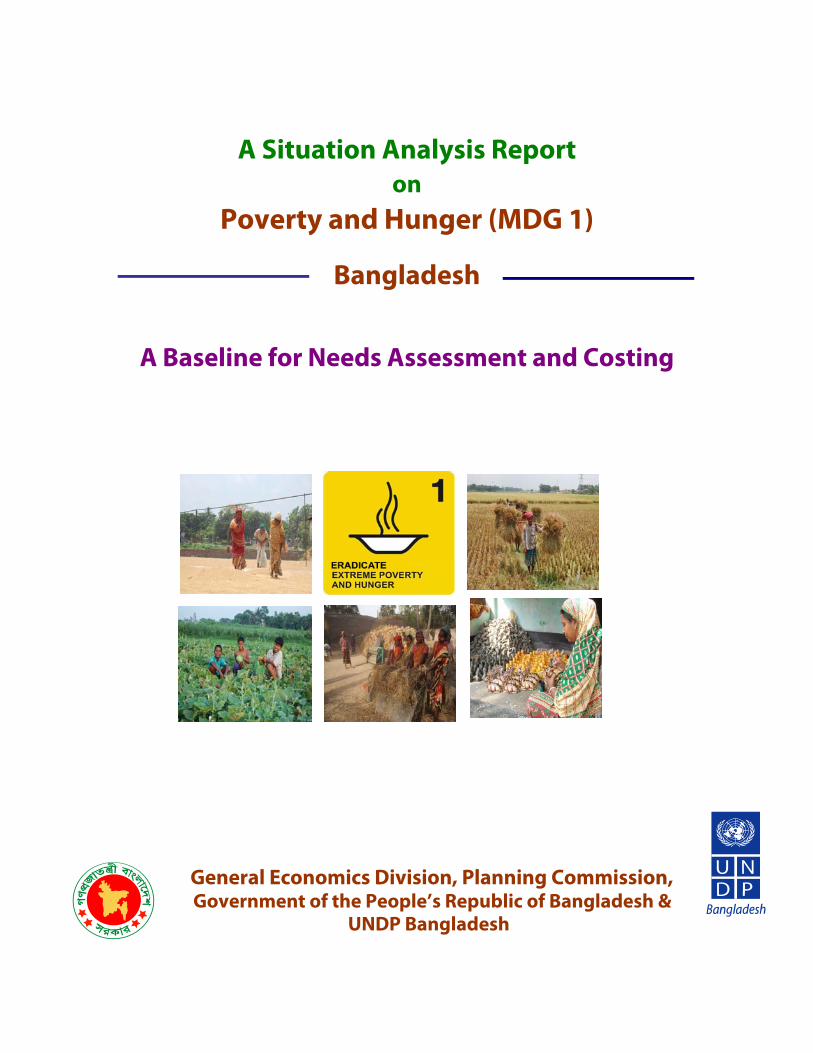
A Situation Analysis Report
on
Poverty and Hunger (MDG 1)
Bangladesh
A Baseline for Needs Assessment and Costing
General Economics Division, Planning Commission, Government of the People’s Republic of Bangladesh &
UNDP Bangladesh
2
A Situation Analysis Report
on
Poverty and Hunger (MDG 1)
Bangladesh
A Baseline for Needs Assessment and Costing
General Economics Division, Planning Commission, Government of the People’s Republic of Bangladesh &
UNDP Bangladesh
3
A Situation Analysis Report on
Poverty and Hunger (MDG 1) Bangladesh
A Baseline for Needs Assessment and Costing
Conducted by
General Economics Division, Planning Commission, Government of the People’s Republic of Bangladesh & UNDP Bangladesh
This report is the situational assessment of the MDG 1 on Poverty and Hunger and has been prepared by Prof. Dr. Md. Akteruzzaman, as a Economist and Poverty expert for the Project “Support to Monitoring PRS and MDGs in Bangladesh” The inferences from the study were utilized for the MDG Needs Assessment and Costing for Bangladesh through the Thematic Working Group (TWG) on Poverty. The MDG Needs Assessment and Costing (2009-2015) for Bangladesh contains the detailed situation analysis, the challenges, proposed interventions and costs for implementing the interventions to achieve the MDGs in Bangladesh.
Disclaimer
The analysis, findings & recommendations of this situation analysis report on the MDG 1 (Poverty and Hunger) do not necessarily reflect the views of General Economics Division, Planning Commission and United Nations Development Porgramme, Bangladesh, rather with which the duly author is concerned.

4
Table of Contents Page
List of Tables 5 List of Figures 5 List of Tables List of Annex 5 Abbreviation 6 Glossary 7
Table of Contents 4 1: Introduction 8 2. Methodology 9 3. Situation and Trend Analysis of Poverty and Hunger in Bangladesh: An Overview
10
4. Challenges and Opportunities in Reducing Poverty and Hunger 19 5.Conclusions 22
Bibliography 25
Annex 26
5
LIST OF TABLES
Table Title Page
3.1 Proportion of population below national poverty line 9 3.2 Annual rate of poverty reduction (%) over 1990-2007 9 3.3 Proportion of population below national poverty line by divisions 10 3.4 Poverty gap ratio during 1990-2007 10 3.5 Annual rate of poverty reduction over 2000-05 and years required to achieved
targets by 2015 by divisions 11
3.6 Poverty gap ratio by regions in 2005 11 3.7 Annual rate of reduction of poverty ratio over 1990 to 2015 and time required for
achievement of target 12
3.8 Share of overseas employment over 1976-2007 12 3.9 Gini index of inequality 13
3.10 Share of poorest quintile in national income 13 3.11 Sector wise share in GDP (%) 14 3.12 Sector wise labor absorption (%) 14 3.13 Employment to population ratio (Nationally) 15 3.14 Employment to population ratio (by gender) 15 3.15 Day of employment per year per worker by division, 2005 15 3.16 Youth employment to population 16 3.17 Employment of youth aged 15-29 to population ratio (by location) 16 3.18 Nominal and real agricultural daily wage rate, 1983-2002 16 3.19 Prevalence of underweight children under five years of age 18 3.20 Proportion of population below minimum level of dietary energy consumption
(DCI method in mn) 18
LIST OF FIGURES
Figure Title Page
1.1 Gini ratio during 1990 -2007 by residence of Bangladesh 13 1.2 Growth rate of GDP 14 1.3 Population (mn) below hard core poverty 17
LIST OF ANNEX
Table Title PageA1 Socio-economic profiles by class, 2006 24 A2 Socio-economic profiles by zones, 2006 24
6
A B B R E V I A T I O N ADB Asian Development Bank BBS Bangladesh Bureau of Statistics BDHS Bangladesh Demographic and Health Survey BIDS Bangladesh Institute of Development Studies CAGR Compound annual growth rate CBN Cost of basic needs CCA Common Country Assessment CGE Computable general equilibrium CNS Child Nutrition Survey CSO Civil society organization EFA Education for All EU European Union FDI Foreign direct investment FY Fiscal year GDP Gross domestic product GNI Gross national income GoB Government of Bangladesh HIES Household Income and Expenditure Survey HRD Human resources development I-PRSP Interim-PRSP LDC Least development countries MDG Millennium Development Goal MoEF Ministry of Environment and Forests NGO Non-government organization NPA National Plan of Action NRR Net Reproduction Rate NSP National Strategic Plan ODA Official development assistance OECD Organization for Economic Cooperation and Development PG Poverty gap PPP Purchasing power parity PRSP Poverty reduction strategy paper SAM Social accounting matrix SHD Sustainable human development SPG Squared poverty gap TWG Technical working group UNCT UN country team UNEP United Nations Environment Programme VGD Vulnerable Group Development VGF Vulnerable Group Feeding
7
GLOSSARY
Proportion of population below $1 (PPP) per day: Proportion of population below $1 per day is the percentage of the population living on less then $1.08 a day at 1993 international prices.
Poverty gap ratio (incidence multiplied by depth of poverty): Poverty gap ratio is the mean distance separating the population from the poverty line (with the non-poor being given a distance of zero), expressed as a percentage of the poverty line.
Share of poorest quintile in national consumption: Share of the poorest quintile in national consumption is the income that accrues to the poorest fifty of the population.
Prevalence of underweight children under-five years of age: Prevalence of (moderately or severely) underweight children is the percentage of children under five years old whose weight for age is less then minus two standard deviations from the median for the international reference population ages 0-59 months.
Proportion of population below minimum level of dietary energy consumption: Proportion of the population below the minimum level of dietary energy consumption is the percentage of the population whose food intake falls below the minimum level of dietary energy requirements. This is also referred to as the prevalence of under-nourishment, which is the percentage of the population that is undernourished.
Unemployment rate of young people aged 15-24 years, each sex and total: Unemployment rate of young people aged 15-24 years is the number of unemployed people ages 15-24 divided by the labour force of the same age group. Unemployed people are all those who are not employed during a specified reference period but are available for work and have taken concrete steps to seek paid employment of self-emplacement. In situations where the conventional means of seeking work are of limited relevance, where the labour marker is largely unorganized or of limited scope, where labour absorption is temporarily inadequate of where the labour force is largely self employed, a relaxed definition of unemployment can be applied, based on only the first two criteria (without work and currently available for work)
The labour force consists of those who are employed plus those who are unemployed during the relevant reference period. It is the economically active portion of the population. Employment refers to being engaged in an economic activity during a specified reference period of being temporarily absent from such an activity, while economic activity refers to the production of goods and services for pay of profit of for use by own household.
Total Labour Force and Youth Labour Force: The total labour force covers labour force participants 15 years and over while youth labour force refers to age group 15-29 years. The labour force is based on ‘extended definition’ which includes, in addition to persons employed or unemployed, persons who engage themselves in such household activities as threshing, cleaning, care of livestock and poultry, food processing and similar activities. Squared poverty gap (SPG): Takes into account not only the distance separating the poor from the poverty line but also inequality among the poor. The poverty gap and the squared poverty gap estimates are calculated using the cost-of-basic-needs method. Productive work: It is essential for the workers to have acceptable livelihoods as well as to ensure sustainable development and competitiveness of enterprises.
8
1. Introduction
1.1 Background of the Study
Millennium Development Goals (MDGs) were selected as a set of quantifiable and time-bound goals for reducing poverty and for significantly improving the human condition by 2015 under the Millennium Declaration (GA Resolution A/54/2000) adopted. MDGs offer a unique opportunity to guide development planning, resource allocation, and higher resource mobilization in low income developing countries like Bangladesh. They enable all actors in the development process to shift from asking “how well can Bangladesh do with respect to the MDGs with its given constraints?” to asking the question “In order to achieve the MDGs, what does Bangladesh need to do. This will enable Bangladesh to systematically MDG-based plan its national strategies around and especially to those targets that are lagging far behind. In order to do so, however, the first step is to conduct a detailed MDG needs assessment and costing that attempts to answer the question of what does Bangladesh need to achieve the MDGs in terms of human resources, infrastructure and financial resources? The process for creating an MDG based national development strategy; working groups will need to determine how the country will meet the MDG1. It is important that work on an MDG-based national development strategy build on current thinking and development practice—to draw on past lessons and to avoid repeating work or circumventing existing processes. It will draw particularly heavily on past work in two areas: strategy formulation and data analysis. The first section, “Taking stock of existing plans and strategies,” briefly outlines how MDG-based national development strategies can build on development strategies that have already been written or implemented. The second, “Defining the baseline,” outlines how and why a country should start a needs assessment by reviewing current MDG-related activities and progress toward the MDG1. “Working with primary data” and “Overcoming difficulties,” go into more detail on how baseline information can be located. An MDG framework aims to align existing planning instruments and processes with the ambition, scope, rigor, timeframe, and financing necessary to meet or exceed the MDG1. The existing plans and strategies may be technically sound but limited in ambition due to resource constraints. They may therefore simply need to be expanded in ambition and scope. Such planning documents can offer valuable guidance on targets, interventions, and priority areas for MDG-based planning. Working groups can also use available documents to identify areas where existing policies and strategies can be strengthened to meet the MDG1. Over the years, it has been inundated with the statistics and the pictures of poverty around the Bangladesh so much so that many people in both the rural and urban have come to accept it as an unfortunate but unalterable state of affairs. The truth, however, is that things have changed in recent years. The world today is more prosperous than it ever has been. The technological advances in recent years have created encouraging new opportunities to improve economies and reduce hunger. Although many countries remain off track in meeting the ambitious Millennium Development Goals that seek to slash hunger poverty and a host of other social ills by 2015, quick and significant progress is obviously possible. But the dramatic surge in food prices has plunged millions of poor people and many net food importing poor countries into a food crisis. Consequently, it has also put at risk their chances of achieving the Millennium Development Goals (MDGs) by 2015. Whilst the focus has been on the impact on the MDG1 of reducing poverty and hunger, given the close inter-connectedness between all the 8 MDGs. The analysis report thus will give a practical guidance on undertaking an MDG1 needs assessment and preparing a framework for meeting the MDG1.
9
1.2 Objectives of the Study The broad objective of the analysis report is to elaborate analysis of the development records, strategic plan and challenges to the MDG1. The specific objectives of the analysis report are as follows:
• Take stock of the country’s development record on MDG1 from 1990 to present. • Analyze the existing policy frameworks and strategies that contribute to each MDG1; • Identify the major challenges for the government/s to meet the attaining of each MDG1;
1.3 Organization of the Report This present chapter is followed by chapter 2 which discusses the methodology adopted in this report. Chapter 3 discusses an overview of the poverty and hunger situation in Bangladesh is followed by Chapter 4 which explained the trend analysis of poverty and hunger since 1990 to to-date. In Chapter 5, Policies and Programs / Government strategies have been analyzed and the challenges and opportunities in reducing poverty and hunger are explained in Chapter 6. 2. Methodology
2.1 Data Sources This analysis report is based on the national household surveys data. Data were collected from several surveys and report of government of Bangladesh. There are Bangladesh Demographic and Health Survey (BDHS), Yearbook of Statistics, Household Income and Expenditure Survey (HIES), Labor Force Survey, Child Nutrition Survey (CNS) conducted by the Statistical Yearbook of Bangladesh, Bangladesh Bureau of Statistics, Multiple Indicator Cluster Survey (MICS) survey conducted by UNICEF and BBS. The policy documents such PRSP-I, IPRSP and draft PRSP-II, different reports published from GED, Planning Commission have been consulted.
2.2 Methodology and Assumptions
The methodological approach adopted in this report is roughly as follows. To estimate the growth rate semi-log and general formula were used. For projecting the time-path of the different MD outcomes to 2015, a few common scenarios were considered. Assuming that the same relationship holds in the future, the 2.7% consumption growth have assumed would be consistent with an annual GDP per capita growth rate of 4%; in other words, it assumes that economic growth will be somewhat (but not substantially) higher in the future than it was during the 1990s. The other assumption that is common to virtually all the simulations is an increase in adult male and female schooling. Here our assumption is that both male and female adult schooling will increase by 0.3 years annually between now and 2015. Such growth would result in mean schooling reaching a level of 7 years for females and 9 years for males by 2015 (from their 2000 values of 4.5 and 2.5 years, respectively). Admittedly, these assumptions are arbitrary, but, given the enormous investments being made in education in Bangladesh during the 1990s, the assumptions are realistic and likely to materialize over the coming decade. More importantly, as is noted throughout the report, none of the assumptions made are sacrosanct; they are only meant to illustrate the range of MD outcomes under a set of possible scenarios. The projections could be undertaken for any combination of changes in the policy. Additional sector-specific assumptions are made for projecting the individual MD outcomes. For instance, in the poverty simulations, we assume that consumption inequality will continue to rise and per capita land availability will continue to decline at roughly the rates at which these variables have changed during the decade of the 1990s.
2.3 Limitations By its very nature, any empirical analysis is predicated on assumptions about data quality and measurement, inferences of causality between variables, and potential biases of statistical and

10
econometric estimates. The analysis presented in this report is not immune to these same concerns. It is therefore important to note that the results and simulations presented in this report may give an impression of precision. They should be treated as indicative of possible broad trends, and could usefully be complemented with other analyses using different methodological approaches. Finally, it is important to note an important limitation of the simulations performed in this report. The simulations are based on statistical analysis of household survey data. By its very nature, such analysis tends to over-emphasize readily-measurable variables, such as household income or consumption, levels, and access to infrastructure, and under-emphasize qualitative variables.
3. Situation and Trend Analysis of Poverty and Hunger in Bangladesh: An Overview
Experience of the last few decades indicates that on average economic growth in Bangladesh has been associated with reduction in income poverty and faster reduction of non-income poverty. Poverty reduction, however, has not proceeded at the same rate with growth of income in different sub-periods. The variation in the rate of poverty reduction in different sub-periods provides some evidence that growth can be more or less pro-poor depending on other factors. It may be noted that a simple measure of pro-poor growth is given by the growth elasticity of poverty defined as the ratio of the percentage change in the poverty headcount ratio to the percentage change in the growth rate. The higher is the growth elasticity of poverty, the more pro-poor is economic growth. The need for pro-poor growth strategy emerges out of the fact that poverty is not only disgraceful to the poor but also a barrier to development since it limits economic demand, squeezes human capability and hampers social cohesion and political stability of the society. Pro-poor growth strategy is thus a precondition for more sustainable and stable development of the society specially where there is enormous magnitude of poverty as in Bangladesh. Target 1(a): Halve, between 1990 and 2015, the proportion of people whose income is less than one US dollar a day To achieve MDG 1, Bangladesh must reduce by 2015 the proportion of population with income less than one US dollar (PPP) a day from 58.8 percent in 1990 to 29.4 percent.
3.1 Poverty reduction
The proportion of population below national poverty line in 2005 was 40.0 and the extrapolated value was 37.80 though CPD mentioned that the price hikes on general commodities increased proportion of the population below poverty line more than 8.50% that means the poverty increased from 2005 at 40.0 to 48.5 percent in 2007 (Table 3.1). Table 3.1: Proportion of population below national poverty line
Year Rural Urban National 1990 61.20 44.90 58.80 1995 55.30 29.50 51.00 2000 52.30 35.20 48.90 2005 43.80 28.40 40.00 2007* 42.30 27.60 38.66 2015 30.60 22.50 29.40
The poverty situations varied in period of time as well as between urban and rural areas. The rate of poverty reduction shows that the trend was found higher during 2000-05 while the reduction rate was found higher also in urban areas. The plausible reason for higher growth of reduction poverty during 2000-05 due to steadiness of agricultural growth and there was no natural hazards. On the other hand, the flood in 1997 and 1998 seriously affected in human life and the crop and animal damaged severely.
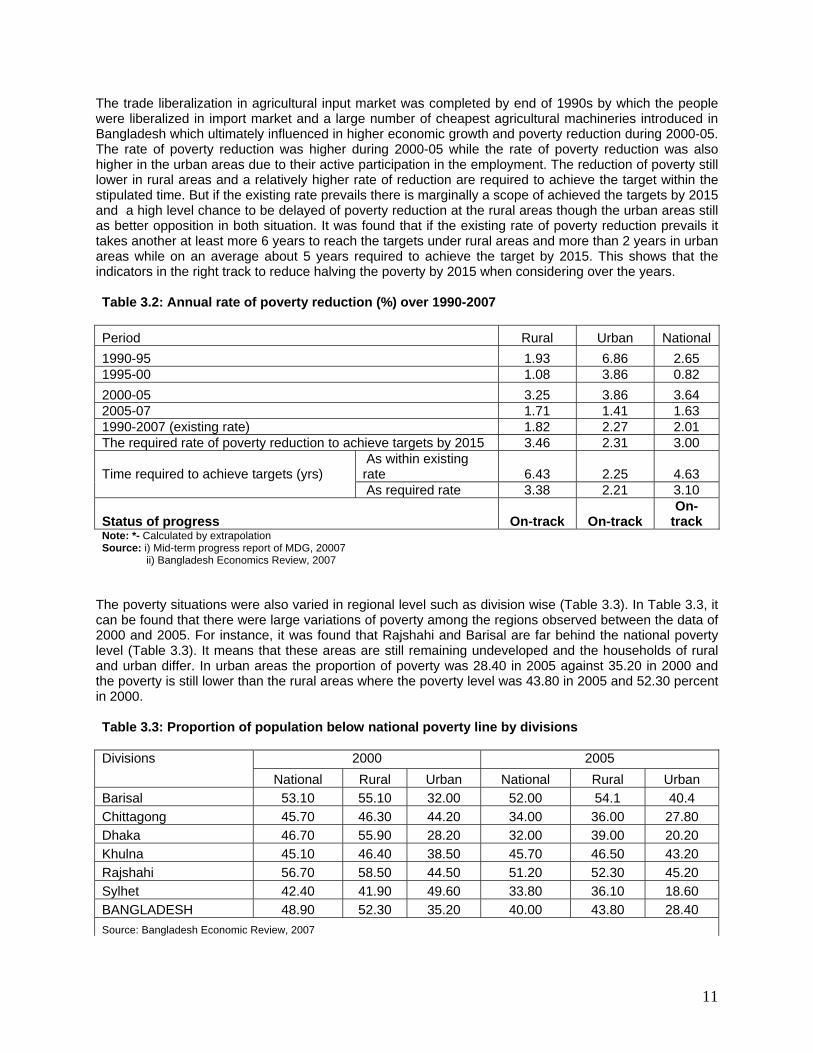
11
The trade liberalization in agricultural input market was completed by end of 1990s by which the people were liberalized in import market and a large number of cheapest agricultural machineries introduced in Bangladesh which ultimately influenced in higher economic growth and poverty reduction during 2000-05. The rate of poverty reduction was higher during 2000-05 while the rate of poverty reduction was also higher in the urban areas due to their active participation in the employment. The reduction of poverty still lower in rural areas and a relatively higher rate of reduction are required to achieve the target within the stipulated time. But if the existing rate prevails there is marginally a scope of achieved the targets by 2015 and a high level chance to be delayed of poverty reduction at the rural areas though the urban areas still as better opposition in both situation. It was found that if the existing rate of poverty reduction prevails it takes another at least more 6 years to reach the targets under rural areas and more than 2 years in urban areas while on an average about 5 years required to achieve the target by 2015. This shows that the indicators in the right track to reduce halving the poverty by 2015 when considering over the years. Table 3.2: Annual rate of poverty reduction (%) over 1990-2007 Period Rural Urban National 1990-95 1.93 6.86 2.65 1995-00 1.08 3.86 0.82 2000-05 3.25 3.86 3.64 2005-07 1.71 1.41 1.63 1990-2007 (existing rate) 1.82 2.27 2.01 The required rate of poverty reduction to achieve targets by 2015 3.46 2.31 3.00
As within existing rate 6.43 2.25 4.63 Time required to achieve targets (yrs) As required rate 3.38 2.21 3.10
Status of progress On-track On-track On-
track Note: *- Calculated by extrapolation Source: i) Mid-term progress report of MDG, 20007 ii) Bangladesh Economics Review, 2007
The poverty situations were also varied in regional level such as division wise (Table 3.3). In Table 3.3, it can be found that there were large variations of poverty among the regions observed between the data of 2000 and 2005. For instance, it was found that Rajshahi and Barisal are far behind the national poverty level (Table 3.3). It means that these areas are still remaining undeveloped and the households of rural and urban differ. In urban areas the proportion of poverty was 28.40 in 2005 against 35.20 in 2000 and the poverty is still lower than the rural areas where the poverty level was 43.80 in 2005 and 52.30 percent in 2000. Table 3.3: Proportion of population below national poverty line by divisions
2000 2005 Divisions National Rural Urban National Rural Urban
Barisal 53.10 55.10 32.00 52.00 54.1 40.4 Chittagong 45.70 46.30 44.20 34.00 36.00 27.80 Dhaka 46.70 55.90 28.20 32.00 39.00 20.20 Khulna 45.10 46.40 38.50 45.70 46.50 43.20 Rajshahi 56.70 58.50 44.50 51.20 52.30 45.20 Sylhet 42.40 41.90 49.60 33.80 36.10 18.60 BANGLADESH 48.90 52.30 35.20 40.00 43.80 28.40 Source: Bangladesh Economic Review, 2007

12
In the case of regional basis, an investigation has been done to explore whether any lagging region will ultimately achieve the targets or not. It has been found that the rate of reduction over 2000-05 was higher in Dhaka, Chittagong and Sylhet while the condition was worse in Rajshahi, Khulna and Barisal even in urban areas of Rajshahi (Table 3.4). There might be possibilities of rural people of Rajshahi divisions migrated to urban slums and they become moor poorer due to less opportunity to work over there in monga season. Higher rate of poverty reduction is urgency in the lagging regions such as Barisal, Rajshahi and Khulna to achieve the targets by 2015. The achievement will be delayed in those regions compare to other regions. Here a simple calculation has been done and found that a number of folds will be required to achieve the targets in Khulna, Barisal and Rajshahi otherwise there is less chance to achieve the targets within the next decades if the existing rate of poverty reduction prevails (Table 3.4). Thus, Barisal, Khulna and Rajshahi are off-track in the development process which should be challenge for achieving the targets of MDG1. Table 3.4: Annual rate of poverty reduction over 2000-05 and years required to achieved targets by 2015 by divisions
Time required (years)
Rate of reduction over 2000-2005
Required rate of poverty
reduction to achieve targets
by 2015
As required rate
As existing rate
Divisions
National Rural Urban National National National
Barisal 0.41 0.36 5.25 4.35 5.20 55.12
(Off-track)
Chittagong 5.12 4.45 7.42 1.35 3.40 0.90
(On-track)
Dhaka 6.30 6.05 5.67 0.81 3.20 0.41
(On-track)
Khulna 0.27 0.04 2.44 3.57 4.57 61.26
(Off-track)
Rajshahi 1.94 2.12 0.31 4.26 5.12 11.24
(Off-track)
Sylhet 4.06 2.77 12.50 1.30 3.38 1.08
(On-track)
BANGLADESH 3.64 3.25 3.86 2.65 4.00 2.91
(On-track)
Poverty gap
To achieve MDG 1, the reduction of poverty gap halving by 2015. Trends in the poverty gap show a drop from 17.20 in 1990 to 12.90 in 2000 and 9.00 in 2005 and the target is 8.6 by 2015. This suggests that even among the poor, greater shares of the people are now closer to the poverty line than at the beginning of the 1990s. It is also worth noting however, that the distributional sensitive measures (PG, SPG) declined relatively more rapidly than the poverty headcount rate. On average, rural areas did better than urban areas in reducing the depth and severity of poverty, which implies that growth in rural areas was more pro-poor than in urban areas. The urban poverty gaps stood at 9.50 percent in 2000 and extend to lesser that 7.0 percent in 2005 (Table 3.5).

13
Table 3.5: Poverty gap ratio during 1990-2007
Year Rural Urban National 1990 18.10 12.00 17.20 1995$ 15.95 10.75 15.05 2000 13.80 9.50 12.90 2005 9.80 6.50 9.00 2007* 8.20 5.30 7.44 2015 9.05 6.00 8.60
Note: $, *- represent respectively calculated by interpolation and extrapolation Source: i) Mid-term progress report of MDG, 20007 ii) Bangladesh Economics Review, 2007
Trends in the poverty gap show a rate of change 6.05 and 8.67 percent during 2000-05 and 2005-07 and the overall rate was 3.34 during 1990-2007 (Table 3.6). The additional requirement will be less than the existing rate which induced early achievement of these targets irrespective of rural and urban areas. It has happened due to people are more rational and the impact of good economic performance of the economy as whole during 2000-05. Table 3.6: Annual rate of reduction of poverty ratio over 1990 to 2015 and time required for achievement of target Period Rural Urban National 1990-95 2.38 2.08 2.50 1995-00 2.70 2.32 2.86 2000-05 5.80 6.32 6.05 2005-07 8.16 9.23 8.67 1990-2007 3.22 3.28 3.34 Required rate 1.30 1.65 1.95 Time required in existing rate (years) 0.26 0.21 0.35 Time required in existing rate (years) 0.65 0.42 0.59 Status of progress On-track On-track On-track
There was large variation of poverty gap among the regions and like poverty the gap was also found higher in Khulna, Barisal and Rajshahi and the poverty gap was 15.50, 10.80 and 11.9 respectively in 2005. It means that the people of these areas did not able overcome the incidence of poverty so much due to their lack of job opportunities as well as the flow of foreign remittance was still lower considering the other areas (Table 3.8). The severity of poverty depends on the localization which will be followed income inequality and disparities among the regions which suggested a localized MDG based policy document for achieving target by 2015.
Table 3.7: Poverty gap ratio by region in 2005
Divisions Rural Urban National Barisal 16.30 10.70 15.50 Chittagong 6.50 5.60 6.30 Dhaka 8.60 4.00 6.90 Khulna 10.40 12.30 10.80 Rajshahi 12.00 11.40 11.90 Sylhet 7.60 4.50 7.20 BANGLADESH 9.80 6.50 9.00
14
Fig 1.1: Gini-ratio during 1990-2007 by residence of Bangladesh
0 0.1 0.2 0.3 0.4 0.5 0.6
1990 1995$ 2000 2005
Rural
Urban
National
2007*
Table 3.8: Share of overseas employment over 1976-2007
Overseas EmploymentSl. No.
Name of District
Number (%) 33 Jhenaidah 31110 0.62 34 Naogaon 30184 0.60 35 Pirojpur 30184 0.60 36 Gopalganj 27777 0.55 37 Meherpur 26851 0.53 38 Natore 25925 0.51 39 Narial 25184 0.50 40 Sirajganj 24258 0.48 41 Jhaladati 22221 0.44 42 Rajbari 20184 0.40 43 Satkhira 19814 0.39 44 Barguna 17777 0.36 45 Bagerhat 17592 0.35 46 Gaibandha 15740 0.31 47 Rajshahi 14829 0.29 48 Magura 14259 0.28 49 Patuakhali 13333 0.26 50 Khulna 13148 0.26 51 Jaipurhat 11666 0.23 52 Chuadanga 10925 0.22 53 Netrokona 10555 0.21 54 Dinajpur 8889 0.18 55 Sherpur 8518 0.17 56 Rangpur 8148 0.16 57 Thakuraon 5926 0.12 58 Kurigram 4815 0.10 59 Nilphamari 2778 0.05 60 Khagrachari 1667 0.03 61 Lalmonirhat 1481 0.03 62 Bandarban 1296 0.03 63 Panchagarm 741 0.01 64 Rangamati 556 0.01
Income Inequality
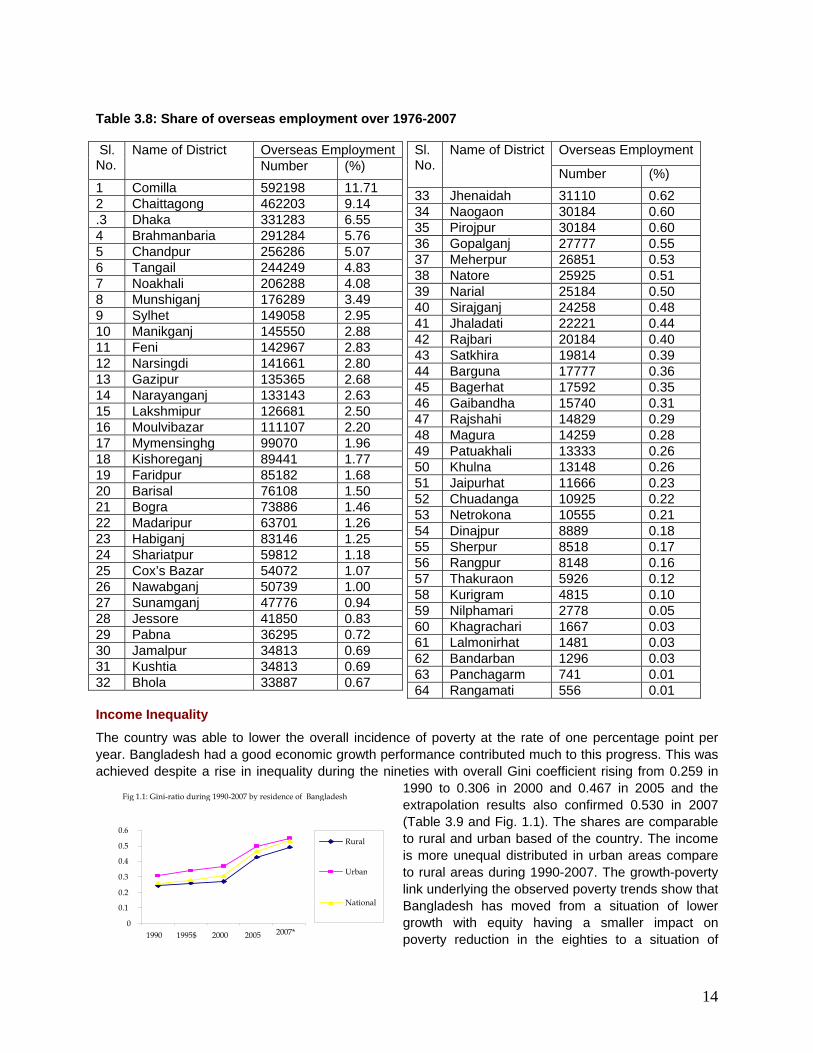
The country was able to lower the overall incidence of poverty at the rate of one percentage point per year. Bangladesh had a good economic growth performance contributed much to this progress. This was achieved despite a rise in inequality during the nineties with overall Gini coefficient rising from 0.259 in
1990 to 0.306 in 2000 and 0.467 in 2005 and the extrapolation results also confirmed 0.530 in 2007 (Table 3.9 and Fig. 1.1). The shares are comparable to rural and urban based of the country. The income is more unequal distributed in urban areas compare to rural areas during 1990-2007. The growth-poverty link underlying the observed poverty trends show that Bangladesh has moved from a situation of lower growth with equity having a smaller impact on poverty reduction in the eighties to a situation of
Overseas Employment Sl. No.
Name of District Number (%)
1 Comilla 592198 11.71 2 Chaittagong 462203 9.14 .3 Dhaka 331283 6.55 4 Brahmanbaria 291284 5.76 5 Chandpur 256286 5.07 6 Tangail 244249 4.83 7 Noakhali 206288 4.08 8 Munshiganj 176289 3.49 9 Sylhet 149058 2.95 10 Manikganj 145550 2.88 11 Feni 142967 2.83 12 Narsingdi 141661 2.80 13 Gazipur 135365 2.68 14 Narayanganj 133143 2.63 15 Lakshmipur 126681 2.50 16 Moulvibazar 111107 2.20 17 Mymensinghg 99070 1.96 18 Kishoreganj 89441 1.77 19 Faridpur 85182 1.68 20 Barisal 76108 1.50 21 Bogra 73886 1.46 22 Madaripur 63701 1.26 23 Habiganj 83146 1.25 24 Shariatpur 59812 1.18 25 Cox’s Bazar 54072 1.07 26 Nawabganj 50739 1.00 27 Sunamganj 47776 0.94 28 Jessore 41850 0.83 29 Pabna 36295 0.72 30 Jamalpur 34813 0.69 31 Kushtia 34813 0.69 32 Bhola 33887 0.67
15
4.65.2
3.13.8
4.9 4.65.3
3.7
7.256.53
5.666.18
5.02
6.35 6.13 6.17
012345678
1 2 3 4 5 6 7 8
GDP growth ratePer capita GDP growth rate GDP growth rate/Per employed person
higher growth with inequality having a larger impact on poverty reduction in the nineties. The latter clearly is a better alternative than the former but the policy challenge lie in bringing about a sharper pro-poor orientation to the growth process. Table 3.9: Gini index of inequality
Year Rural Urban National 1990 0.243 0.307 0.259 1995$ 0.260 0.340 0.280 2000 0.271 0.368 0.306 2005 0.428 0.497 0.467 2007* 0.490 0.550 0.530
Note: $, *- represent respectively calculated by interpolation and extrapolation Source: i) Mid-term progress report of MDG, 20007 ii) Bangladesh Economics Review, 2007
The inequality in Bangladesh is explained by the fact that the lowest quintile represents only 6.5 percent of the national income and it decreased to 5.0 percent in 2007. In rural areas, the lowest quintile share to total national income was relatively better in rural areas than the urban areas (Table 3.10). Table 3.10: Share of poorest quintile in national income Year Rural Urban National
1990 6.74 6.40 6.50 1995 6.49 5.12 5.71 2000 7.09 5.04 6.15 2005 5.88 4.84 5.30 2007* 5.40 4.80 5.00 2015 3.38 3.20 3.25
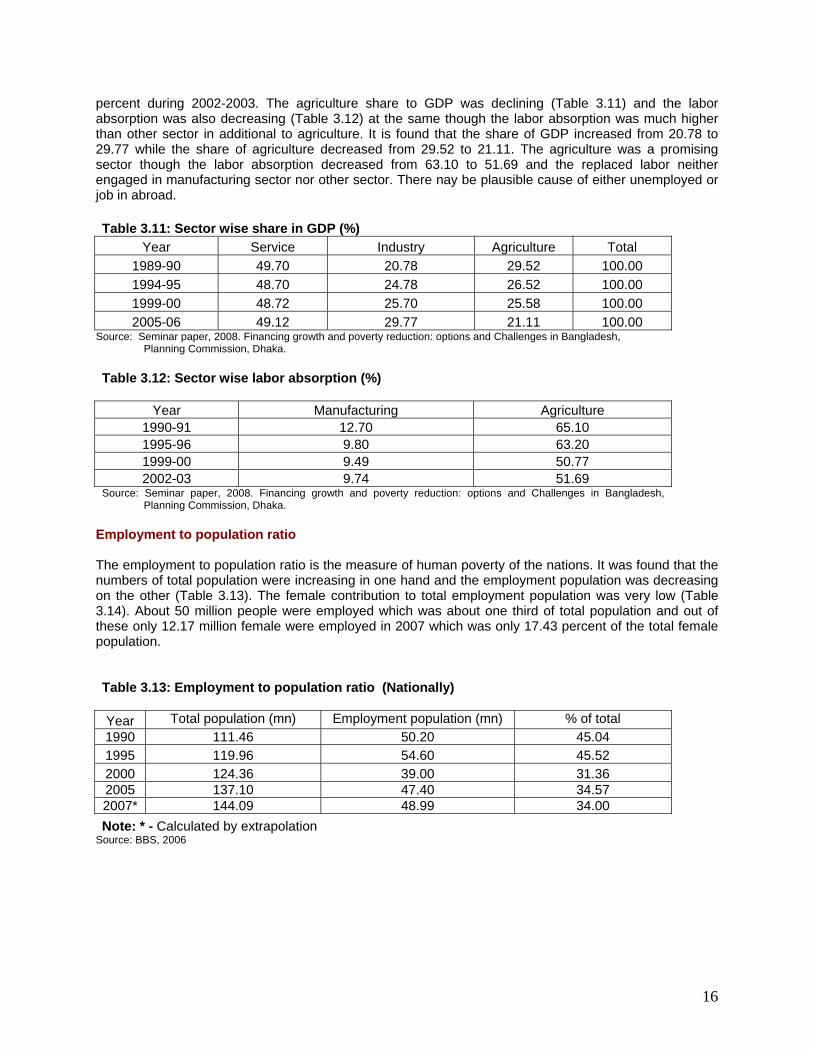
The share of the poorest in national income in rural areas was better than the urban poor. It indicates that the poorest of the urban was fallen in severe poverty than the rural poor. This trend indicates that the urban poor worsen than the rural areas. The rich people in urban areas are becoming richer than the rich people in rural areas. The rural poor are mostly engaged in wage earning at home and abroad than the rich people. Moreover, the social safety net program are mostly covering in the rural areas that becoming the less income inequality in the rural areas. The government recent polices may have direct impact on the pro-poor people in the rural areas too. Thus, more number of pro-poor programs for the urban peoples is suggested in addition to strengthen the rural pro-poor programs. Target 1(b): Achieve full and productive employment and decent work for all, including women and young people Growth rate of GDP The GDP growth rate for the nation as a whole, per capita GDP growth rate and per employed person GDP growth rate has been estimated (Fig 1.2). It is found that the national GDP growth rate was about 5-6 percent which was higher than the per employed person GDP growth rate (ranges 5-7 percent) in compare to per capita GDP growth rate. It means that the employed person contributed a lot to the national GDP. The per capita GDP sharply increased during 2004-2006 compare to per capita GDP growth rate of 3.1-3.8
Fig 1.2
16
percent during 2002-2003. The agriculture share to GDP was declining (Table 3.11) and the labor absorption was also decreasing (Table 3.12) at the same though the labor absorption was much higher than other sector in additional to agriculture. It is found that the share of GDP increased from 20.78 to 29.77 while the share of agriculture decreased from 29.52 to 21.11. The agriculture was a promising sector though the labor absorption decreased from 63.10 to 51.69 and the replaced labor neither engaged in manufacturing sector nor other sector. There nay be plausible cause of either unemployed or job in abroad. Table 3.11: Sector wise share in GDP (%)
Year Service Industry Agriculture Total 1989-90 49.70 20.78 29.52 100.00 1994-95 48.70 24.78 26.52 100.00 1999-00 48.72 25.70 25.58 100.00 2005-06 49.12 29.77 21.11 100.00
Source: Seminar paper, 2008. Financing growth and poverty reduction: options and Challenges in Bangladesh, Planning Commission, Dhaka.
Table 3.12: Sector wise labor absorption (%)
Year Manufacturing Agriculture 1990-91 12.70 65.10 1995-96 9.80 63.20 1999-00 9.49 50.77 2002-03 9.74 51.69
Source: Seminar paper, 2008. Financing growth and poverty reduction: options and Challenges in Bangladesh, Planning Commission, Dhaka.
Employment to population ratio The employment to population ratio is the measure of human poverty of the nations. It was found that the numbers of total population were increasing in one hand and the employment population was decreasing on the other (Table 3.13). The female contribution to total employment population was very low (Table 3.14). About 50 million people were employed which was about one third of total population and out of these only 12.17 million female were employed in 2007 which was only 17.43 percent of the total female population. Table 3.13: Employment to population ratio (Nationally) Year Total population (mn) Employment population (mn) % of total 1990 111.46 50.20 45.04 1995 119.96 54.60 45.52 2000 124.36 39.00 31.36 2005 137.10 47.40 34.57 2007* 144.09 48.99 34.00 Note: * - Calculated by extrapolation
Source: BBS, 2006
17
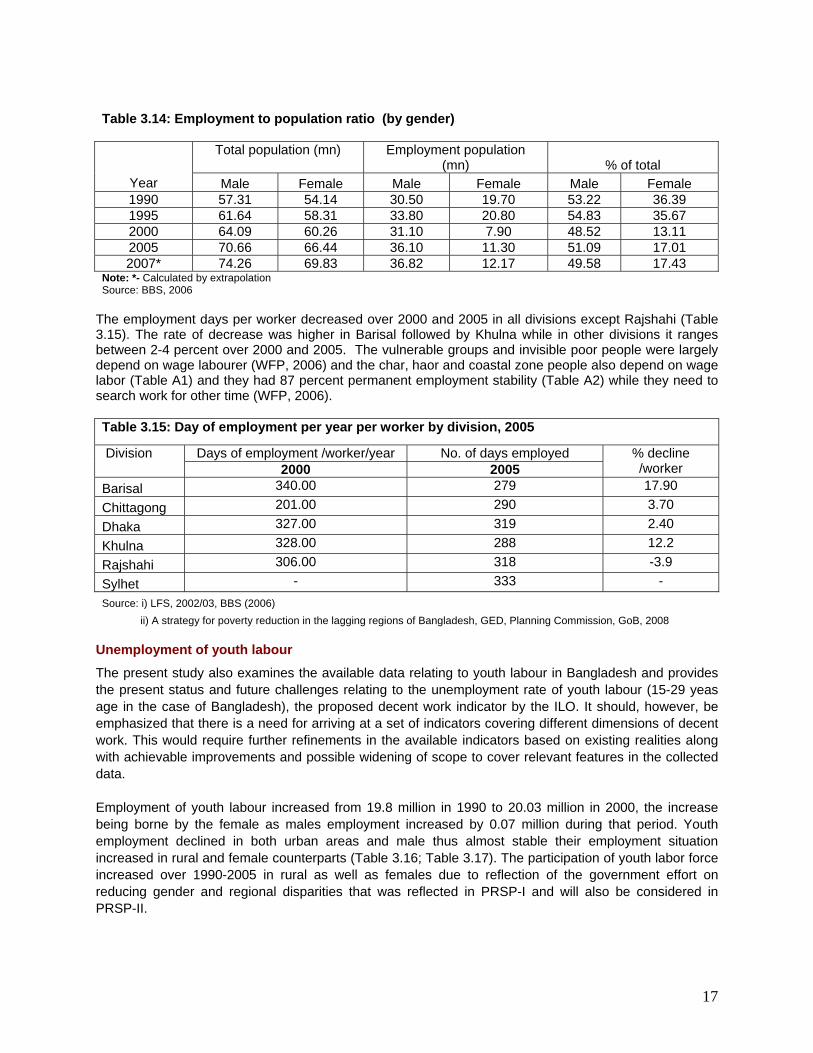
Table 3.14: Employment to population ratio (by gender)
Total population (mn) Employment population (mn) % of total
Year Male Female Male Female Male Female 1990 57.31 54.14 30.50 19.70 53.22 36.39 1995 61.64 58.31 33.80 20.80 54.83 35.67 2000 64.09 60.26 31.10 7.90 48.52 13.11 2005 70.66 66.44 36.10 11.30 51.09 17.01 2007* 74.26 69.83 36.82 12.17 49.58 17.43
Note: *- Calculated by extrapolation Source: BBS, 2006
The employment days per worker decreased over 2000 and 2005 in all divisions except Rajshahi (Table 3.15). The rate of decrease was higher in Barisal followed by Khulna while in other divisions it ranges between 2-4 percent over 2000 and 2005. The vulnerable groups and invisible poor people were largely depend on wage labourer (WFP, 2006) and the char, haor and coastal zone people also depend on wage labor (Table A1) and they had 87 percent permanent employment stability (Table A2) while they need to search work for other time (WFP, 2006). Table 3.15: Day of employment per year per worker by division, 2005
Days of employment /worker/year No. of days employed Division 2000 2005
% decline /worker
Barisal 340.00 279 17.90
Chittagong 201.00 290 3.70
Dhaka 327.00 319 2.40
Khulna 328.00 288 12.2
Rajshahi 306.00 318 -3.9
Sylhet - 333 - Source: i) LFS, 2002/03, BBS (2006) ii) A strategy for poverty reduction in the lagging regions of Bangladesh, GED, Planning Commission, GoB, 2008
Unemployment of youth labour
The present study also examines the available data relating to youth labour in Bangladesh and provides the present status and future challenges relating to the unemployment rate of youth labour (15-29 yeas age in the case of Bangladesh), the proposed decent work indicator by the ILO. It should, however, be emphasized that there is a need for arriving at a set of indicators covering different dimensions of decent work. This would require further refinements in the available indicators based on existing realities along with achievable improvements and possible widening of scope to cover relevant features in the collected data. Employment of youth labour increased from 19.8 million in 1990 to 20.03 million in 2000, the increase being borne by the female as males employment increased by 0.07 million during that period. Youth employment declined in both urban areas and male thus almost stable their employment situation increased in rural and female counterparts (Table 3.16; Table 3.17). The participation of youth labor force increased over 1990-2005 in rural as well as females due to reflection of the government effort on reducing gender and regional disparities that was reflected in PRSP-I and will also be considered in PRSP-II.

18
Since the poorest of the poor typically employed as agricultural laborers, it may be worthwhile looking at the trends in agricultural wages. The trends in the agricultural daily wage rate are shown in Table 3.18. The rice wage rates of agricultural male laborers were higher in 2000 and 2005 before 1990 and 1995. The real wage decreased again in 2007 due to price hikes of common foods in 2007. The rice wage rates were almost stagnant in 1990 and 1995 due to bumper production. Rice wages of agricultural laborer have also been found to be increased during 2000 to 2005 and the rising trend in rice wage indicates improvement in the welfare of the rural poor. But the situation has been destroyed in price hikes since 2007 by which the rice wage decreased and welfare of poor decreased drastically. Thus, the government should continue the subsidized or price support program for the producers as well as for the consumers for reduction of poverty for pro-poor people. Table 3.16: Youth employment to population
Total (mn) Youth (mn)** Year 1990 1995 2000 2005 1990 1995$ 2000 2005 1. Total population 109.0 118.3 127.5 138.6 27.4 29.0 30.6 80.5 2. Total labor force* 45.1 56.0 53.5 49.5 19.8 19.9 20.3 20.4
Male 27.3 34.7 33.4 37.4 11.6 11.6 11.5 10.0 Gender Female 18.1 21.3 20.1 12.1 8.2 8.3 8.9 10.4 Rural 37.3 40.1*** 43.4 46.5*** 16.3 16.4 16.6 16.8 Residenc
e Urban 8.1 9.2*** 10.0 11.1*** 3.5 3.5 3.7 2.2 Notes: *- Considered here the total labor force aged 15 years and over
**-Considered total youth aged 15- 29 years; *** - Calculated by extrapolations; $ calculated by interpolations Source: i) LFS, 2002/03, BBS (2006)
ii) A strategy for poverty reduction in the lagging regions of Bangladesh, Planning Commission, GoB, 2008 Table 3.17: Growth rate youth employed over 1990-2005 by residence and gender
Period Rural Urban Male Female 1990-1995 0.120 0.000 0.00 0.24 1995-2000 0.240 1.140 -0.17 1.45 2000-2005 0.240 -8.110 -2.61 3.37 1990-2005 0.200 -3.940 -1.07 1.41
Source: Calculated from Table 3.17 Table 3.18: Nominal and real agricultural daily wage rate, 1990-2007
Nominal wage rate (Taka/day) Rice wage rate (kg/day) Year Male Female
Rice price (Tk/kg) Male Female
1990 42.95 28.50 12.33 3.48 2.31 1995 46.22 31.58 13.75 3.36 2.30 2000 61.10 47.94 14.25 4.29 3.36 2005 84.04 61.05 17.39 4.83 3.51 2007 103.0 76.00 24.43 4.22 3.11
Source: i) Statistical Bulletin Bangladesh, BBS, June 2007 ii) A strategy for poverty reduction in the lagging regions of Bangladesh, Planning Commission, GoB, 2008 Target 2: Halve, between 1990 and 2015, the proportion of people who suffer from hunger
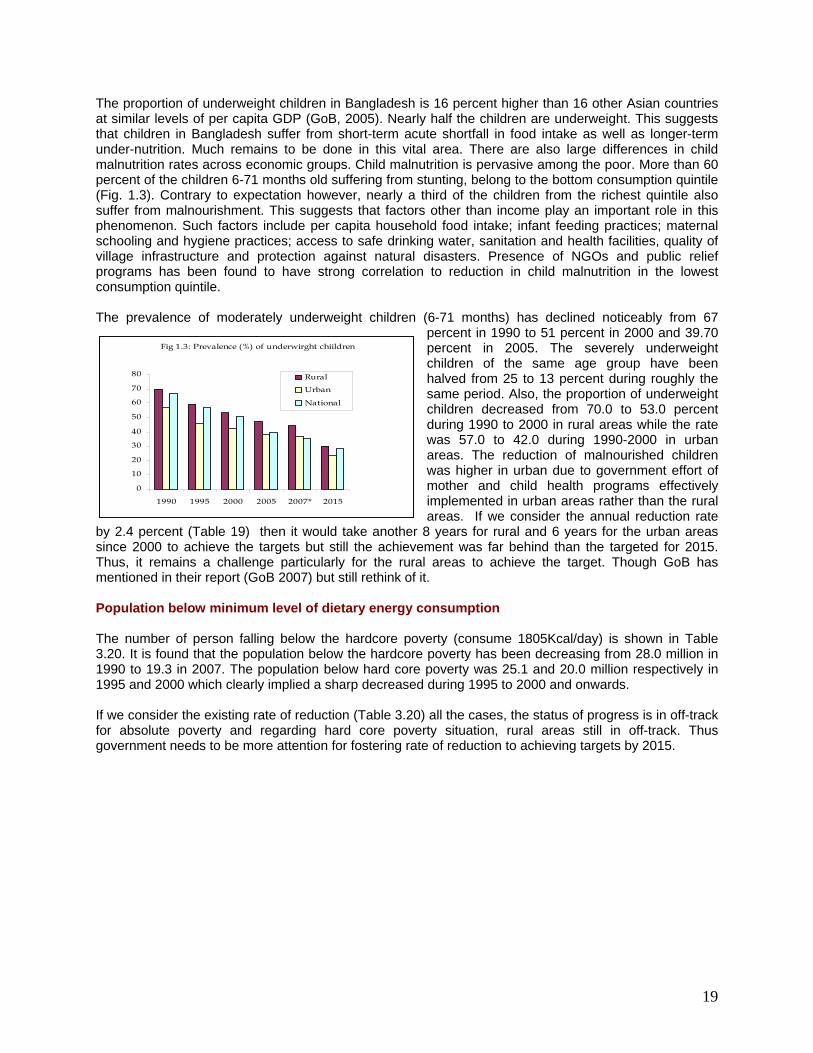
Prevalence of underweight children below 5 years The prevalence of moderately underweight children (6-71 months) has declined noticeably from 67 percent in 1990 to 51 percent in 2000, while that of severely underweight children of the same age group has been halved from 25 to 13 percent during roughly the same period. Also, the proportion of moderately underweight children under the age of five years reduced from 56 to 48 percent during the period 1997-2000.
19
Fig 1.3: Prevalence (%) of underwirght chiildren
0
10
20
30
40
50
60
70
80
1990 1995 2000 2005 2007* 2015
Rural
Urban
National
The proportion of underweight children in Bangladesh is 16 percent higher than 16 other Asian countries at similar levels of per capita GDP (GoB, 2005). Nearly half the children are underweight. This suggests that children in Bangladesh suffer from short-term acute shortfall in food intake as well as longer-term under-nutrition. Much remains to be done in this vital area. There are also large differences in child malnutrition rates across economic groups. Child malnutrition is pervasive among the poor. More than 60 percent of the children 6-71 months old suffering from stunting, belong to the bottom consumption quintile (Fig. 1.3). Contrary to expectation however, nearly a third of the children from the richest quintile also suffer from malnourishment. This suggests that factors other than income play an important role in this phenomenon. Such factors include per capita household food intake; infant feeding practices; maternal schooling and hygiene practices; access to safe drinking water, sanitation and health facilities, quality of village infrastructure and protection against natural disasters. Presence of NGOs and public relief programs has been found to have strong correlation to reduction in child malnutrition in the lowest consumption quintile. The prevalence of moderately underweight children (6-71 months) has declined noticeably from 67
percent in 1990 to 51 percent in 2000 and 39.70 percent in 2005. The severely underweight children of the same age group have been halved from 25 to 13 percent during roughly the same period. Also, the proportion of underweight children decreased from 70.0 to 53.0 percent during 1990 to 2000 in rural areas while the rate was 57.0 to 42.0 during 1990-2000 in urban areas. The reduction of malnourished children was higher in urban due to government effort of mother and child health programs effectively implemented in urban areas rather than the rural areas. If we consider the annual reduction rate
by 2.4 percent (Table 19) then it would take another 8 years for rural and 6 years for the urban areas since 2000 to achieve the targets but still the achievement was far behind than the targeted for 2015. Thus, it remains a challenge particularly for the rural areas to achieve the target. Though GoB has mentioned in their report (GoB 2007) but still rethink of it. Population below minimum level of dietary energy consumption The number of person falling below the hardcore poverty (consume 1805Kcal/day) is shown in Table 3.20. It is found that the population below the hardcore poverty has been decreasing from 28.0 million in 1990 to 19.3 in 2007. The population below hard core poverty was 25.1 and 20.0 million respectively in 1995 and 2000 which clearly implied a sharp decreased during 1995 to 2000 and onwards. If we consider the existing rate of reduction (Table 3.20) all the cases, the status of progress is in off-track for absolute poverty and regarding hard core poverty situation, rural areas still in off-track. Thus government needs to be more attention for fostering rate of reduction to achieving targets by 2015.
20
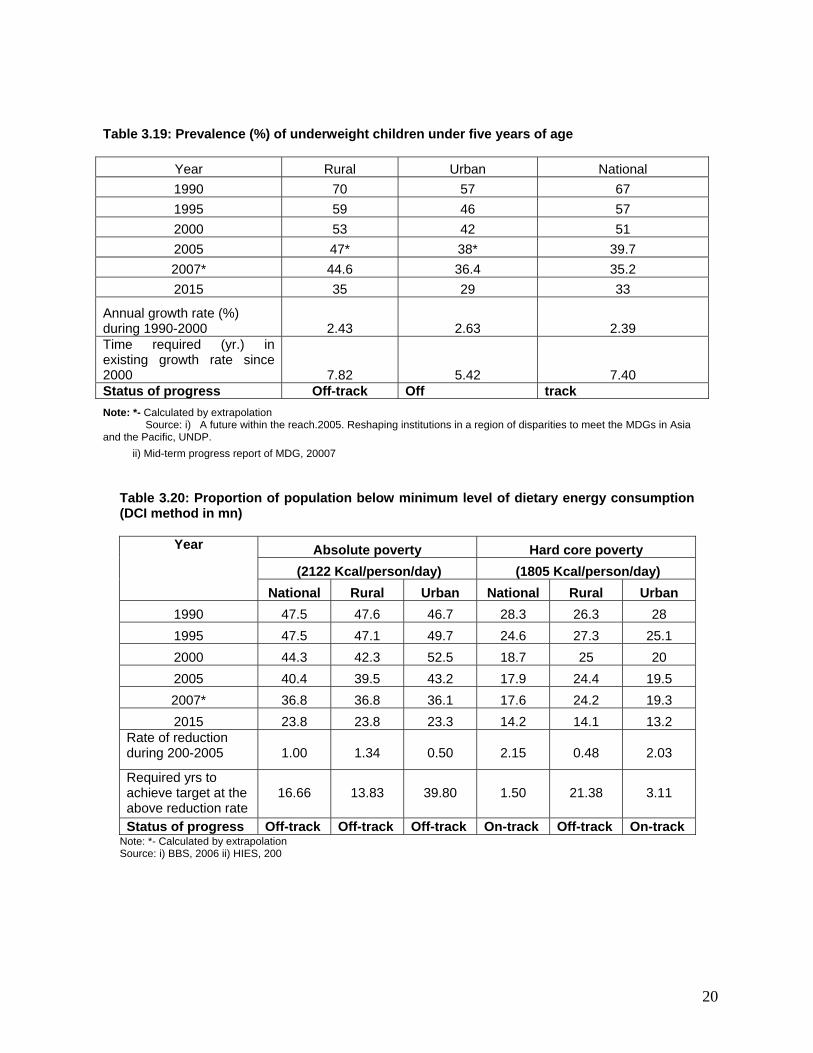
Table 3.19: Prevalence (%) of underweight children under five years of age
Year Rural Urban National 1990 70 57 67 1995 59 46 57 2000 53 42 51 2005 47* 38* 39.7 2007* 44.6 36.4 35.2 2015 35 29 33
Annual growth rate (%) during 1990-2000 2.43 2.63 2.39 Time required (yr.) in existing growth rate since 2000 7.82 5.42 7.40 Status of progress Off-track Off track Note: *- Calculated by extrapolation
Source: i) A future within the reach.2005. Reshaping institutions in a region of disparities to meet the MDGs in Asia and the Pacific, UNDP. ii) Mid-term progress report of MDG, 20007
Table 3.20: Proportion of population below minimum level of dietary energy consumption (DCI method in mn)
Absolute poverty Hard core poverty (2122 Kcal/person/day) (1805 Kcal/person/day)
Year
National Rural Urban National Rural Urban 1990 47.5 47.6 46.7 28.3 26.3 28 1995 47.5 47.1 49.7 24.6 27.3 25.1 2000 44.3 42.3 52.5 18.7 25 20 2005 40.4 39.5 43.2 17.9 24.4 19.5 2007* 36.8 36.8 36.1 17.6 24.2 19.3 2015 23.8 23.8 23.3 14.2 14.1 13.2
Rate of reduction during 200-2005
1.00
1.34
0.50
2.15
0.48
2.03
Required yrs to achieve target at the above reduction rate
16.66
13.83
39.80
1.50
21.38
3.11
Status of progress Off-track Off-track Off-track On-track Off-track On-track Note: *- Calculated by extrapolation Source: i) BBS, 2006 ii) HIES, 200

21
4. Challenges and Opportunities in Reducing Poverty and Hunger
Much will need to be done to achieve the MDG1 target of halving the proportion of poor whose income is less than one dollar a day, and halving the proportion who suffer from hungry and malnutrition. Bangladesh has nearly 63 million poor – the third largest poor population in any country after China and India – and one of the highest rates of child malnutrition in the world. One third of the population lives in extreme poverty, and nearly half of Bangladesh’s children are underweight. Demographic changes in upcoming years are likely to affect poverty and hunger in adverse ways. Achieving the MDG1 within the next decade will require Bangladesh to develop and implement more ambitious and effective strategies. The primary challenges and actions needed to address them are summarized below. Challenge 1: Reducing hunger and malnutrition: Comprehensive programme of integrated actions on many fronts The role of agriculture and rural development plays in combating poverty and hunger in the country. As various international poverty studies and surveys also indicate, there is perhaps no other economic activity that generates the same level income and employment from agriculture and rural development. Improvement of the growth performance of the agriculture sector with various sub-sectors to realize the vision calls for a comprehensive multi-sectoral approach to address all aspects of agricultural production focusing on food production (cereals and non-cereals), food security, employment, and income generating activities (IGAs) to achieve higher growth and reduce poverty and hunger. Bangladesh faces tremendous challenges in doing this. Some of the important challenges are as follows:
In the face of decreasing farm size, degrading soil quality and limiting water resources, the main challenge for the country is to maximize production in order to improve food availability from domestic sources;
With the present production technology package approaching a limit, one major challenge is to harness productivity gains making breakthrough in yield frontier technology, i.e., hybrids/crossbreds, biotechnology, genetic engineering in crop, livestock, fisheries and forestry;
In the backdrop of decreasing water resources and increasing irrigation cost due to rising fuel/energy prices, emerging challenge is to improve water use efficiency in rice production and shift to water efficient food crops;
The growing competition in global market due to trade liberalization has, no doubt, created opportunities as well as constraints for the Bangladeshi small holders (in horticulture, dairy, poultry, shrimp, fish and wood products) accounting for four-fifths of all farm holdings. They have to be given effective support to allow a level playing field for them to compete with others and reap the benefits of a globalize world;
With 50 million people living below poverty line, Bangladesh has a formidable challenge to strike a balance between ensuring adequate incentives for the numerous small producers (rice, poultry, dairy, fish, nursery etc.) on the one hand and keeping food prices low for the poor consumers on the other;
With economic growth, income inequality in rural areas is also on the rise, which brings forth a challenge to escalate income generating programmes and accelerate poverty reduction in rural areas;
While there has been an overall improvement in food availability at the household level, intra-household food entitlement between men and women (especially lactating women) and between adults and children remains an issue to be addressed;
Already vulnerable food security situation worsens when food production (crops, livestock and fisheries) drops due to natural disasters, which means that the country needs to bolster its capacity in agriculture production to ensure food security, especially in vulnerable disaster-prone areas;
With the increase in population, increase in production of fish, milk, meat and eggs and self-employment of fishers and livestock rearing farmers are important to supply balanced

22
food for the growing population through small holders encouragement and private sector promotion in poultry, dairy and fisheries sub-sectors;
Coping with the climate changes, maintaining ecological balance and conserving biodiversity for the growing population is one of the most growing challenges of Bangladesh.
To meet these challenges, the overriding task is to mobilize resources for agriculture sector including adequate financial support from internal and external sources and strengthen cooperation with the countries in the region in the fields of science, technology and knowledge sharing.
Challenge 2: Youth employment
The challenge in the case of youth labour, which is likely to reach a level of nearly 30 million in 2015, is to create employment at a much faster rate compared to other segments of the labour force. For example, if the target is to reduce the youth unemployment rate to the same level of the total labour force in 2015, then Bangladesh will have to generate more than 11 million jobs specifically for the youth population. There are two important issues to be considered. First, the problem of unemployment mostly affects the youth labour in Bangladesh. The economy therefore needs to accelerate the generation of employment opportunities for the youth. Second, the large majority of the educated youth remain unemployed due to mismatch between supply and demand in the labour market, inappropriate and inadequate skills and the slow pace of job creation, particularly in the formal sector. In order to meet the challenge of the youth labour market, Bangladesh will need to rapidly expand the productive and skill-intensive formal and informal sectors. Global partnerships can contribute by providing new formats and strategic directions in creating decent and productive employment for the youth. Although domestic investment is the main driver of growth and foreign direct investment (FDI) flows are yet to rise rapidly in Bangladesh, development dimensions of the youth can be made an integral part of the country’s FDI policy through global partnerships in transferring technology, upgrading skills and management capabilities of the youth labour force that will attract not only more FDI but also support its higher productivity. Beneficial global partnerships can also create opportunities for skilled and knowledge based youth manpower export. Collaborative efforts for producing trained youth labour in strategically chosen thrust areas, such as the maintenance of community and social services in developed countries which face increasingly severe demographic imbalances due to the shortage of working age population, can emerge as effective global means of addressing the youth labour issues in Bangladesh.
Challenge 3: Reaching the poor: Promoting pro-poor growth The initial level of inequality of income and ownership of assets and its possible further deterioration will determine the poverty outcome. Pro-poor growth, therefore, needs to be promoted so that the positive impact of economic growth on poverty reduction is increasingly larger than the adverse impact of income inequality, and the poor are able to participate more actively in the growth process and derive increasingly higher benefits from it. Creation of more jobs and opportunities for entrepreneurship and self employment by the poor will need to be speeded up aggressively, so as to address the massive backlog of underemployment, as well as the large annual addition to the labour force on account of demographic factors. Income growth in rural areas has proven to be pro-poor in Bangladesh, and its continuation will need to be promoted pro-actively. Coordinated actions will be required in areas such as:
Building the income-generating capacities of the poor by pursuing social sector programmes and policies that develop their human capital. This should include improving poor people’s access to the essential health service package (ESP), addressing the
23
problem of child malnutrition, and undertaking a comprehensive programme to improve the coverage and quality of education and skill development.
Enabling the poor to participate more actively in economic activities through initiatives to facilitate their access to markets for credit, land, and labour.
Enhancing cooperation and partnership among Government, the private sector, and civil society in scaled-up efforts to implement the PRSP.
Challenge 4: Expansion of urban employment The urban population and the urban labour force will experience accelerated growth due to natural increase, rural-urban migration, and reclassification of rural into urban areas. As the large majority of the urban labour force will belong to the youth labour category, the formal sector will be required to provide employment to a progressively larger segment of the youth labour force. This has direct implications for ensuring decent work to meet the dual role of employment in terms of both generating income and fulfilling the individual’s social functions.
Linkages to PRSP-II
The Bangladesh second PRSP is being prepared under full government ownership and direction. Twelve sectors have been identified for the Bangladesh PRSP and an equal number of thematic groups have been set up by the Government for coordinating the preparation of the various thematic background papers. A mapping of the sectors indicates that most of the sectors address the MDG1 by focusing on poverty eradication. The draft PRSP-II had already emphasized on the agricultural and rural development sector to increase productivity and employment generation for rural areas. For increasing the foreign remittance, the rural youth employment have addresses and skilled oriented manpower export is suggested and accordingly the policy matrix have been suggested. Towards this end, the Government has reinvigorated its pro-poor bias, allocating from FY08 an increased annual pro-poor spending of 1% of GDP. This link between the budgeting and the MDG1 was clearly stated in the Finance Minister’s budget speeches of FY 08 and FY09.

24
5. CONCLUSIONS
Bangladesh’s progress on the MDG indicators during the 1990s does not mean that there are no problems going forward. Indeed, there are several areas of concern highlighted in this report. First, there are very large regional disparities in virtually all of the MDG1 indicators in Bangladesh. Divisions such as Barisal, Rajshahi and Khulna have generally not performed well on several of the MDG1 indicators. Even if Bangladesh as a whole attains some of the MDG1 indicators, there will be several areas of the country that will remain distantly behind for example; rural and urban as well as specialized zones such as haor, hilly areas, costal areas and char areas. The analysis report also suggests that many of the MDG1 indicators are geographically concentrated in a few regions. This in turn means that targeting interventions, central government resources, and economic growth opportunities to the lagging divisions will speed up attainment of the MDG1. The report notes that a reduction in the proportion of underweight children is strongly associated with a reduction of child mortality. Finally, the importance of systematically monitoring MDG1 outcomes at disaggregated levels and evaluating the impact of public programs cannot be overemphasized. There is a paucity of reliable, time-series data on most MDG1 indicators at the district and upazila (sub-district) levels. The lack of such data makes it virtually impossible to monitor progress toward attainment of the MDG1 at lower levels of administration.
Bibliography
1. A. Begum and M. Salimullah 2004, Millennium Development Goals Needs Assessment:
Bangladesh, Working Draft, 17 January 2004, Bangladesh Institute of Development Studies, Dhaka 2. ADB (2005) A Future Within Reach: Reshaping institutions of disparities to meet the Millennium
Development Goals in Asia and the Pacific, ESCAP-UNDP, Dhaka 3. BBS (2000) Report of the household income and expenditure (HIES), Ministry of Planning, Dhaka,
Bangladesh. 4. BBS (2005) Report of the household income and expenditure (HIES), Ministry of Planning, Dhaka, Bangladesh. 5. BBS (2006) Statistical Yearbook of Bangladesh, Ministry of Planning, Dhaka, Bangladesh. 6. Barakat, M A. (2008) Financing growth and poverty reduction: options and Challenges in Bangladesh, Seminar paper, Planning Commission, Dhaka, Bangladesh 7. Chandrika Bahadur (2005) Preparing National Strategies to Achieve the Millennium Development Goals; A Handbook, Millennium Project, United Nations. 8. GoB (2007) Millennium Development Goals: Mid-Term Bangladesh Progress Report 2007, GED, Planning Commission, Dhaka 9 GoB (2008) A Strategy for Poverty Reduction in the Lagging Regions of Bangladesh, GED, Planning Commission, Dhaka 10. GoB (2005) Unlocking the Potential: National Strategy for Accelerated Poverty Reduction, GED, Planning Commission, Dhaka 11. GoB (2007) Bangladesh Economics Review, Ministry of Finance, GoB, Dhaka, Bangladesh 12. GoB (2005, 2006, 2007) Annual Development Plan, Planning Commission, Dhaka, Bangladesh 13. MICS (2006) Monitoring the situation of children nad women, Multiple Indicator Cluster Survey, Vol. I, Technical Report, Progotir Pothey, BBS & UNICEF 14. People’s Forum on MDG (2005) Millennium Development Goals: A People’s Progress Report, BANGLADESH 15. Richard Anker et al 2002, Measuring Decent Work with Statistical Indicators, Working Paper No. 2,
Policy Integration Department, Statistical Development and Analysis Group, International Labour Office, Geneva, October 2002
16. UNCT (2005) A future within the reach.2005: Reshaping institutions in a region of disparities to meet the MDGs in Asia and the Pacific, UNDP. 17. Web page of UN. Official list of MDG indictors Achieve full and productive employment and decent
work for all including women and young people 18. World Bank (2005) Attaining The Millennium Development Goals In Bangladesh: How Likely and
What Will It Take To Reduce Poverty, Child Mortality and Malnutrition, Gender Disparities, and to Increase School Enrollment and Completion?, Human Development Unit, South Asia Region
19. WFP (2006) Rural Bangladesh: Socioeconomic Profile of WFP Operational Areas & Beneficiaries, TANGO International, Dhaka.
20. WFP (2004) Local Estimation of poverty and malnutrition in Bangladesh, BBS & WFP, Dhaka, Bangladesh.
Annex
Table A1: Socio-economic class profiles, 2006
Classes % of household
Dependency ratio
Farm size (decimal)
% HH having
average land
% HH depend on wage
labor
Food security in
months
Non-vulnerable 16.00 61 351.00 86.59 15.00 11.00 On-the-edge 37.00 66 115.00 51.79 36.00 10.00 Vulnerable 32.00 76 69.00 25.33 57.00 8.00 Invisible poor 15.00 87 56.00 9.10 70.00 3.00 Total 100.00 - 162.00 41.89 - .
Source: Rural Bangladesh: Socioeconomic profiles of WFP operation areas & beneficiaries, Tango International, WFP, 2006 Table A2: Socio-economic profiles by zones, 2006
Zone HH size (no.)
Dependency ratio
Farm size (decimal)
% HH having
average land
% HH depend on wage labor
% permanent employment
stability
CHT 5.13 90.31 174.75 53.34 24.30 72.90 Coastal 5.42 95.97 152.76 36.28 36.00 91.70 Drought 4.21 62.67 203.15 41.40 39.20 98.40 N/W 4.56 76.88 203.19 47.28 39.50 91.80 Char 4.62 76.31 114.29 39.18 43.80 75.20 Haor 4.64 90.61 125.73 39.86 30.60 85.2 Total - - 162.52 41.89 38.20 87.1
Source: Rural Bangladesh: Socioeconomic profiles of WFP operation areas & beneficiaries, Tango International, WFP, 2006