situation and outlook of the us aquaculture industry 2000 - 2001 dr. terry hanson mississippi state...
TRANSCRIPT
Situation and Outlook of the Situation and Outlook of the US Aquaculture IndustryUS Aquaculture Industry
2000 - 20012000 - 2001
Dr. Terry HansonDr. Terry Hanson
Mississippi State UniversityMississippi State University
Department of Agricultural EconomicsDepartment of Agricultural Economics

Presentation
• World trends
• National – consumption– species & facilities
• Highlight on Catfish Industry– Short- and Long-Term

Aquaculture is: - farming of aquatic organisms
- intervention in the rearing process to enhance production
- ownership of the stock being cultivated

World AquacultureProduction

World Capture Fisheries and Aquaculture Production
0
20
40
60
80
100
120
140
1990 1991 1992 1993 1994 1995 1996 1997 1998 1999
mill
on m
etri
c to
ns
Capture Fisheries Aquaculture
Source: USDC/NOAA/NMFS, 2001
0
5,000
10,000
15,000
20,000
25,000
30,000
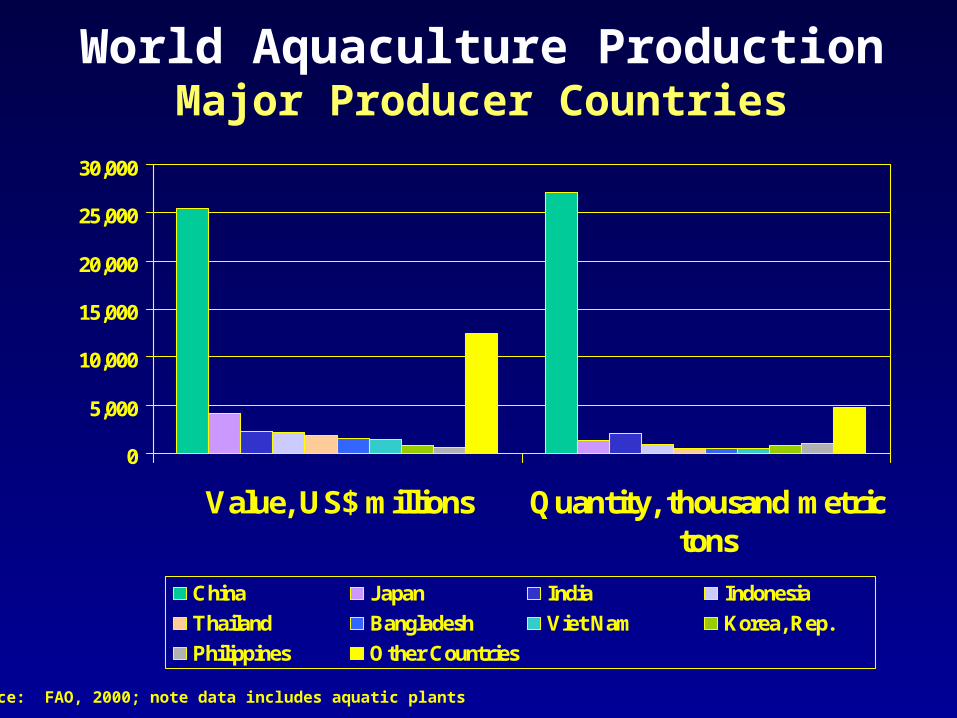
Value, US$ millions Quantity, thousand metrictons
China Japan India Indonesia
Thailand Bangladesh Viet Nam Korea, Rep.
Philippines Other Countries
World Aquaculture ProductionMajor Producer Countries
Source: FAO, 2000; note data includes aquatic plants

US Consumption of Fish and Shellfish

US Per Capita ConsumptionFish and Shellfish Products
11.811.5
12.512.8
12.1 12.2
12.912.7
13.4
13.0
12.512.7
12.5
13.4
14.2
15.1
15.5
16.2
15.2
15.6
15.0 14.9 14.815.0
15.215.0
14.814.6
14.915.1
15.6
11
12
13
14
15
16
17
1970 1975 1980 1985 1990 1995 2000
POUNDS
15.6 lbs./capita15.6 lbs./capita20002000
Source: USDC/NOAA/NMFS, 2001

0
10
20
30
40
50
60
70B
eef
Bro
iler
s
Pork
Fis
h &
Sh
ellf
ish
Tu
rkey
US Per Capita Consumptionof Meat and Fish, 2000*
Lb/person/year
66.0
55.749.2
15.6 14.3
* Boneless weight
Source: USDA Agricultural Baseline Projections to 2010, February 2001

Top Ten Seafood Species in 2000
13.60Total of Top Ten0.27Scallops0.43Flounder/Sole0.46Crabs0.48Clams0.77Cod1.12Catfish1.59Salmon1.68Alaskan Pollock3.20Shrimp3.60Tuna
SpeciesSpecies ConsumptionConsumption
lbs. per personlbs. per person
Source: National Fisheries Institute, 2001
13.60Total of Top Ten0.27Scallops0.43Flounder/Sole0.46Crabs0.48Clams0.77Cod1.12Catfish1.59Salmon1.68Alaskan Pollock3.20Shrimp3.60Tuna
13.60Total of Top Ten0.27Scallops0.43Flounder/Sole0.46Crabs0.48Clams0.77Cod1.12Catfish1.59Salmon1.68Alaskan Pollock3.20Shrimp3.60Tuna
13.60Total of Top Ten0.27Scallops0.43Flounder/Sole0.46Crabs0.48Clams0.77Cod1.12Catfish1.59Salmon1.68Alaskan Pollock3.20Shrimp3.60Tuna
13.60Total of Top Ten0.27Scallops0.43Flounder/Sole0.46Crabs0.48Clams0.77Cod1.121.591.68Alaskan Pollock3.203.60Tuna

Top Ten Seafood Species in 2000
13.60Total of Top Ten0.27Scallops0.43Flounder/Sole0.46Crabs0.48Clams0.77Cod1.12Catfish1.59Salmon1.68Alaskan Pollock3.20Shrimp3.60Tuna
SpeciesSpecies ConsumptionConsumption
lbs. per personlbs. per person
Source: USDOC/NOAA/NMFS, 2001
13.60Total of Top Ten0.27Scallops0.43Flounder/Sole0.46Crabs0.48Clams0.77Cod1.12Catfish1.59Salmon1.68Alaskan Pollock3.20Shrimp3.60Tuna
13.60Total of Top Ten0.27Scallops0.43Flounder/Sole0.46Crabs0.48Clams0.77Cod1.12Catfish1.59Salmon1.68Alaskan Pollock3.20Shrimp3.60Tuna
13.60Total of Top Ten0.27Scallops0.43Flounder/Sole0.46Crabs0.48Clams0.77Cod1.12Catfish1.59Salmon1.68Alaskan Pollock3.20Shrimp3.60Tuna
13.60Total of Top Ten0.27Scallops0.43Flounder/Sole0.46Crabs0.48Clams0.77Cod1.12Catfish - 100% is from Aq.1.59Salmon - 50% is from Aq.1.68Alaskan Pollock3.20Shrimp - 27% is from Aq.3.60Tuna

U.S.AquacultureProduction

Production States
NORTH CENTRALNORTH CENTRAL NORTHEASTERNNORTHEASTERN
SOUTHERNSOUTHERN
WESTERNWESTERN
TROPICAL & SUBTROPICALTROPICAL & SUBTROPICAL
PerchStriped BassTilapia
CatfishStriped BassTilapiaBaitfish
TroutSalmonShellfishStriped BassTilapia
Ornamental, Food and Shellfish
SalmonShellfishStriped Bass
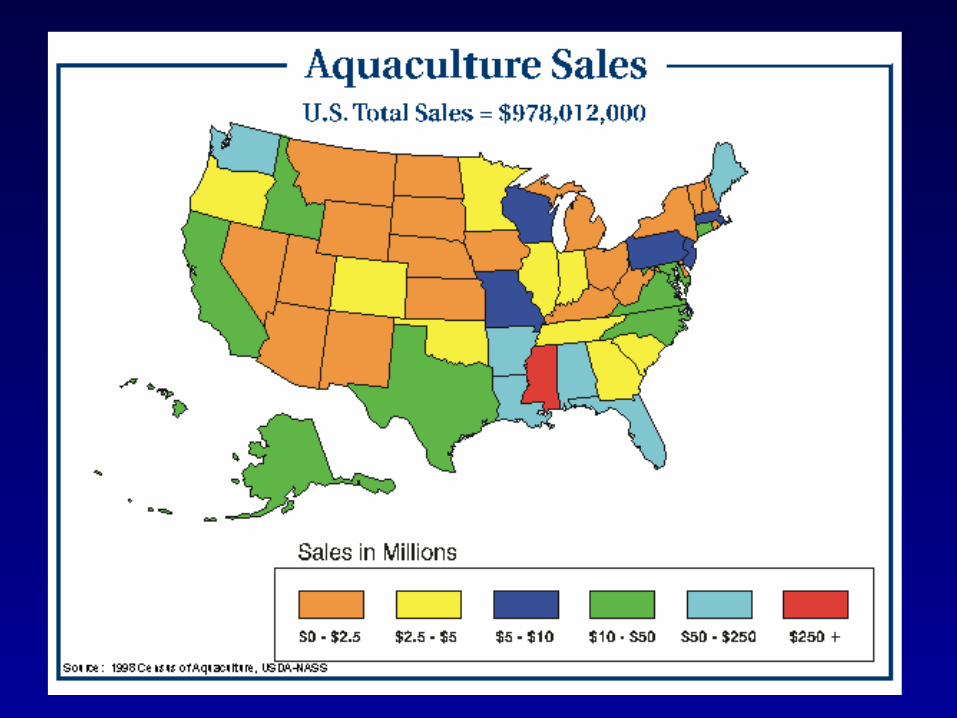
Aquaculture Sales

Sales by Aquaculture Category
• Food fish - 70%
• Mollusks - 9%
• Ornamental fish - 7%
• Baitfish - 4%
• Crustaceans - 4%
• Sport/Game - 1%
• Other animal aqua. - 5%
Food Fish Species
• Catfish• Rainbow trout• Atlantic Salmon• Striped Bass• Tilapia• Others

Food Crustacean Species
• Shrimp• Crayfish• Freshwater prawn• Softshell crab

Baitfish Species• Golden shiner• Fathead minnow• Goldfish• Others
– Bull minnow– common carp– tilapia– sunfish

Ornamental Species
• Goldfish
• Angelfish
• Guppies
• South American Catfish
• Koi carp
• 100’s of others
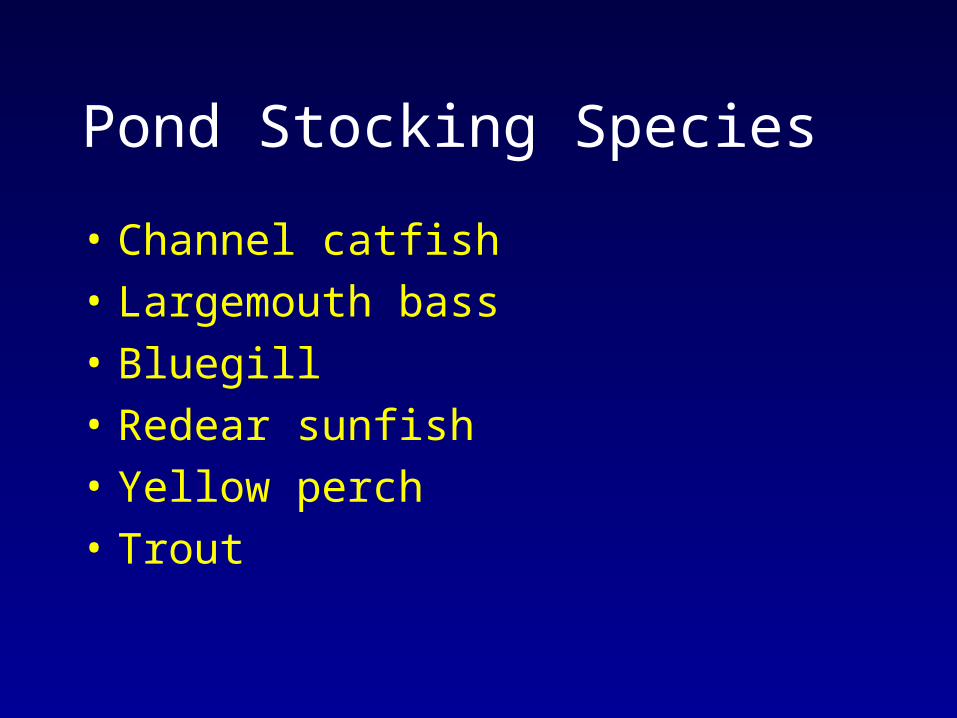
Pond Stocking Species
• Channel catfish
• Largemouth bass
• Bluegill
• Redear sunfish
• Yellow perch
• Trout

0200400600
Value Quantity
Catfish SalmonTrout BaitfishOysters ClamsCrayfish TilapiaHybrid striped bass Shrimp
Estimated 1999 US Finfish & Shellfish AquacultureProduction & Value (1,000,000)

0
50
100
Value Quantity
Salmon TroutBaitfish OystersClams CrayfishTilapia Hybrid striped bassShrimp
Estimated 1999 US Finfish & Shellfish AquacultureProduction & Value (1,000,000)

• Ponds - 63% ->
• Cagesand pens
• Raceways
• Closedre-circulation systems
Aquaculture Production Facility Types In Use
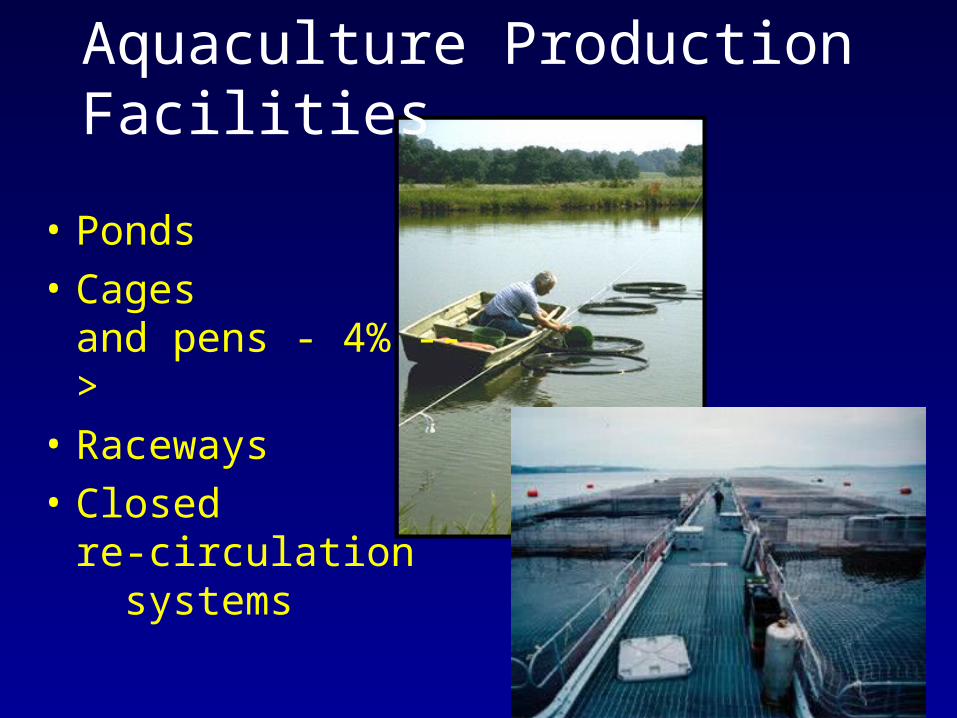
Aquaculture Production Facilities
• Ponds
• Cagesand pens - 4% -->
• Raceways
• Closedre-circulation systems

Aquaculture Production Facilities
• Ponds
• Cagesand pens
• Raceways - 14% --->
• Closedre-circulation systems
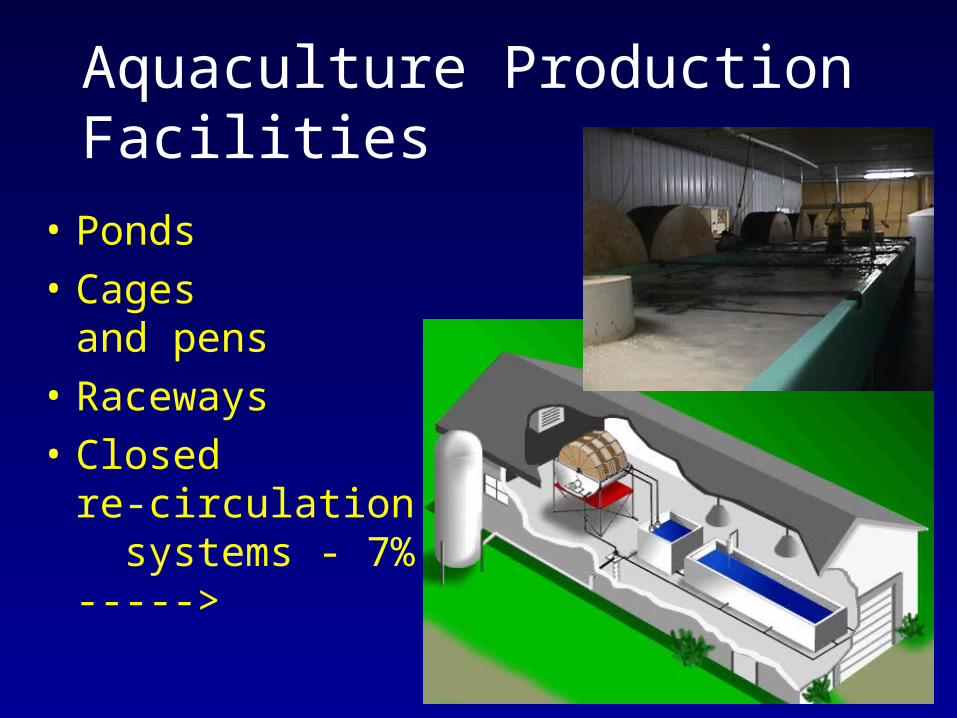
Aquaculture Production Facilities
• Ponds
• Cagesand pens
• Raceways
• Closedre-circulation systems - 7% ----->

U.S.CatfishIndustry

Catfish Water Surface Acres
0
20,000
40,000
60,000
80,000
100,000
120,00019
89
1990
1991
1992
1993
1994
1995
1996
1997
1998
1999
2000
Acr
es
AL
AR
LA
MS
Total Catfish Acreage = 185,700
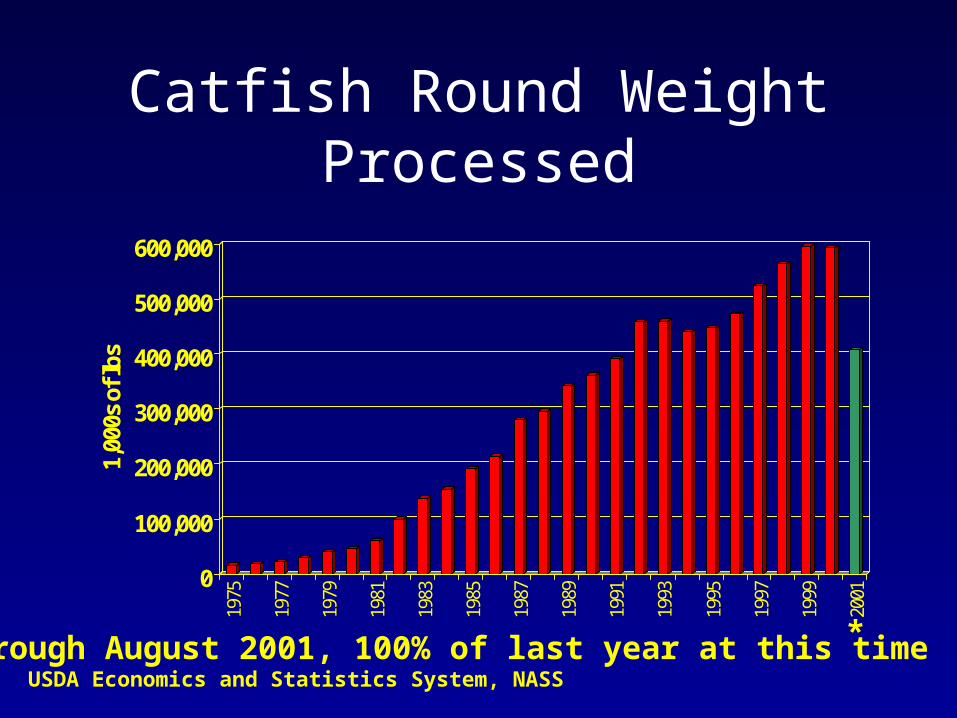
Catfish Round Weight Processed
0
100,000
200,000
300,000
400,000
500,000
600,000
1,00
0s o
f lbs
1975
1977
1979
1981
1983
1985
1987
1989
1991
1993
1995
1997
1999
2001
* through August 2001, 100% of last year at this timeSource: USDA Economics and Statistics System, NASS
*

Total U.S. Catfish Sales
$0
$100,000
$200,000
$300,000
$400,000
$500,000
$600,000
1,00
0s o
f D
olla
rs
1987
1988
1989
1990
1991
1992
1993
1994
1995
1996
1997
1998
1999
2000
2001
Source: USDA Economics and Statistics System, NASS
?

Fresh and FrozenCatfish Products
020,00040,00060,00080,000
100,000120,000140,000160,000180,000200,000
1986
1988
1990
1992
1994
1996
1998
2000
1,00
0s o
f L
bs.
FreshFrozen

Product Form Sold
21%
62%
17%Whole fish
Fillets
Other

FRESH
$1.95
$2.00
$2.05
$2.10
$2.15
$2.20
$2.25
$2.30
$2.35
1 2 3 4 5 6 7 8 9 10 11 12
1999
2000
2001
FROZEN
$2.15
$2.20
$2.25
$2.30
$2.35
$2.40
$2.45
$2.50
$2.55
$2.60
1 2 3 4 5 6 7 8 9 10 11 12
1999
2000
2001
Average Fresh and Frozen Catfish Product PriceReceived by Processors, 1999 - July 2001
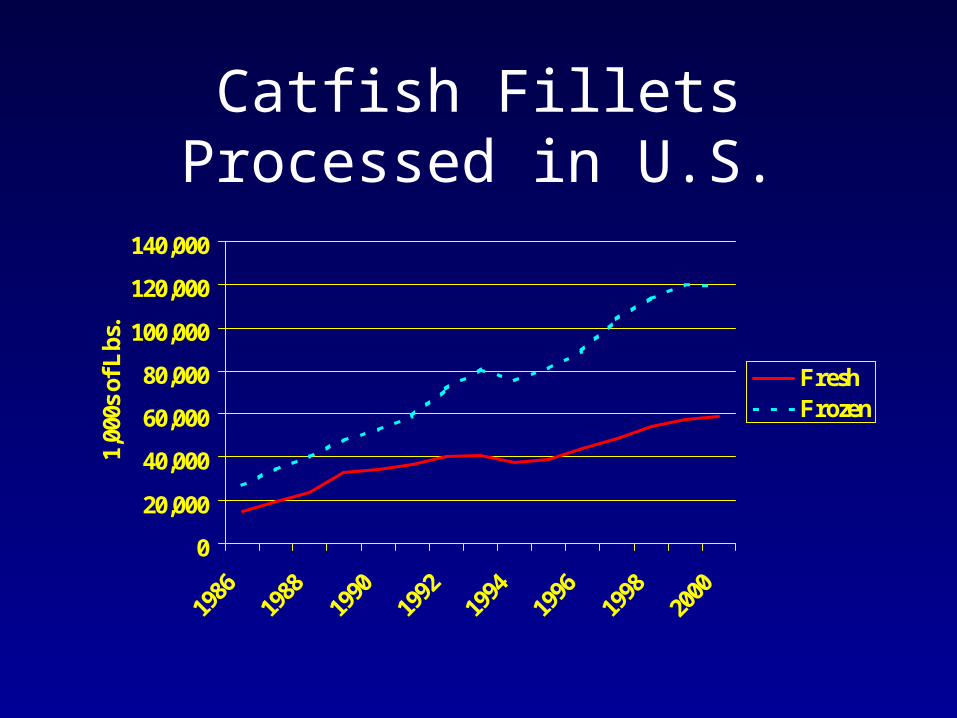
Catfish Fillets Processed in U.S.
0
20,000
40,000
60,000
80,000
100,000
120,000
140,000
1,00
0s o
f Lbs
.
FreshFrozen

Catfish Industry Issues
• Low catfish prices for producers
• Increasing production costs
• EPA effluent discharge regulations
• Other issues affecting production costs

Low Catfish Prices Received by Producers
• Why?• Viet Namese frozen fillet imports increasing• On-farm inventories up• Full freezers at processing plants• Economic uncertainty• Stagnant per capita consumption

60.0
62.0
64.0
66.0
68.0
70.0
72.0
74.0
76.0
78.0
80.0
Jan
Feb
Mar
Apr
May
Jun
Jul
Aug
Sep Oct
Nov
Dec
$/lb
Po
nd
Ban
k P
rice
1975-2000 Avg Price
Catfish Price Paid to Farmer, $/lb
25-year avg

60.0
62.0
64.0
66.0
68.0
70.0
72.0
74.0
76.0
78.0
80.0
Jan
Feb
Mar
Apr
May
Jun
Jul
Aug
Sep Oct
Nov
Dec
$/lb
Po
nd
Ban
k P
rice
1975-2000 Avg Price '1990-2000 Avg
Catfish Price Paid to Farmer, $/lb
25-year avg
10-year avg

60.0
62.0
64.0
66.0
68.0
70.0
72.0
74.0
76.0
78.0
80.0
Jan
Feb
Mar
Apr
May
Jun
Jul
Aug
Sep Oct
Nov
Dec
$/lb
Po
nd
Ban
k P
rice
1975-2000 Avg Price '1990-2000 Avg '1995-2000 Average
Catfish Price Paid to Farmer, $/lb
25-year avg
10-year avg
5-year avg

60.0
62.0
64.0
66.0
68.0
70.0
72.0
74.0
76.0
78.0
80.0
Jan
Feb
Mar
Apr
May Jun
Jul
Aug
Sep Oct
Nov
Dec
$/lb
Pon
d B
ank
Pri
ce
1975-2000 Avg Price 2001 '1990-2000 Avg '1995-2000 Average
Catfish Price Paid to Farmer, $/lb
25-year avg
10-year avg
5-year avg
2001 price

Average 2001 prices* are:
• $0.09/lb less than 5-year average
• $0.06/lb less than 10-year average
* through September 2001, not adjusted for inflation (nominal prices)

60.0
62.0
64.0
66.0
68.0
70.0
72.0
74.0
76.0
78.0
80.0
Jan
Feb
Mar
Apr
May Jun
Jul
Aug
Sep Oct
Nov
Dec
$/lb
Po
nd
Ban
k P
rice
2001 2000
Catfish Price Paid to Farmer, $/lb
2001 price
2000 price
$0.12 per lb lessin Sept. 2001 thanin 2000 = -16%

Lower Price Received by Farmer& Net Returns
• Cost of production:– $0.60 - $0.72 / lb– Present price of $0.62 / lb =>
• Loss for less efficient farmers• Very low profit for efficient farmers

Imports of Catfish to U.S.
02,0004,0006,0008,000
10,00012,00014,00016,00018,00020,000
1,00
0s lb
.
1976
1978
1980
1982
1984
1986
1988
1990
1992
1994
1996
1998
2000
Source: USDA/NASS

Imports of Catfish to U.S.
02,0004,0006,0008,000
10,00012,00014,00016,00018,00020,000
1,00
0s lb
.
1976
1978
1980
1982
1984
1986
1988
1990
1992
1994
1996
1998
2000
<= River Catfish from Brazil whole fish from rivers
Source: USDA/NASS

Imports of Catfish to U.S.
02,0004,0006,0008,000
10,00012,00014,00016,00018,00020,000
1,00
0s lb
.
1976
1978
1980
1982
1984
1986
1988
1990
1992
1994
1996
1998
2000
Viet NameseFrozen Fillets78% - 97% ofall imports =>
Source: USDA/NASS * Through July 2001
*

Frozen Catfish Fillet Sales in the U.S.2000-present
0
2
4
6
8
10
12
14Ja
n '0
0
Mar
'00
May
'00
Jul '
00
Sep
'00
Nov
'00
Jan
'01
Mar
'01
May
'01
Jul '
01
Mill
ion
Lb
s
0%2%4%6%8%10%12%14%16%18%20%
Frozen Fillet Sales (Produced in U.S.)
Viet Namese Imported Frozen Fillets
Viet Namese Fish as % of Total Frozen Fillet Sales in US
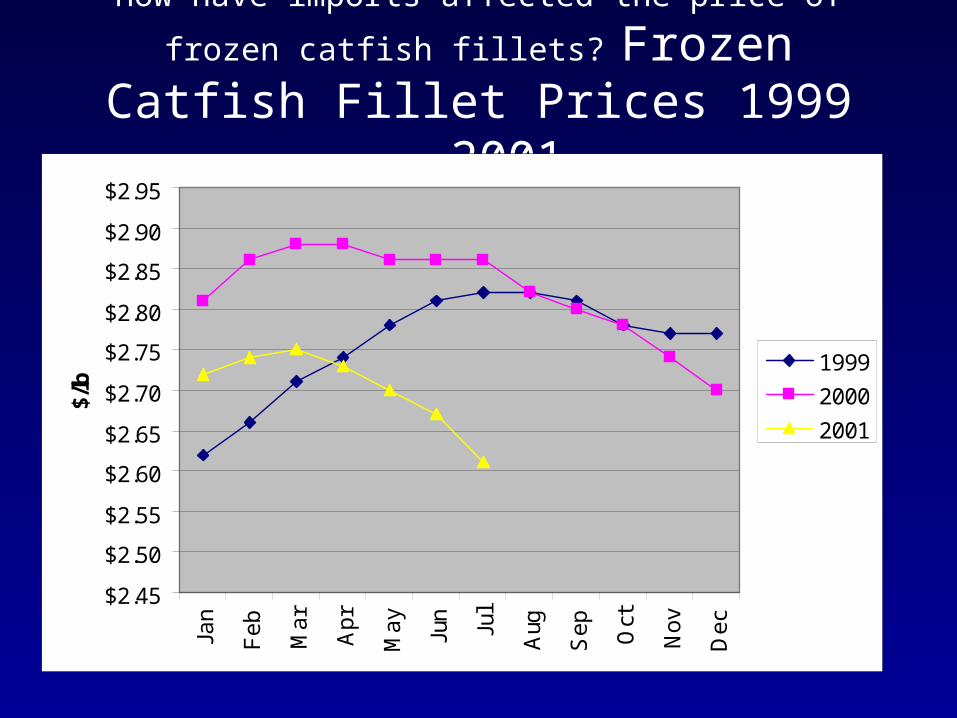
How have imports affected the price of frozen catfish fillets?
Frozen Catfish Fillet Prices 1999 - 2001
$2.45
$2.50
$2.55
$2.60
$2.65
$2.70
$2.75
$2.80
$2.85
$2.90
$2.95Ja
n
Fe
b
Ma
r
Ap
r
Ma
y
Jun
Jul
Aug
Se
p
Oct
No
v
De
c
$/lb
1999
2000
2001

Comparison of Fillet and Pond Bank Prices
$2.45
$2.50
$2.55
$2.60
$2.65
$2.70
$2.75
$2.80
$2.85
$2.90
$2.95Ja
n
Feb
Mar
Apr
May Jun
Jul
Aug
Sep Oct
Nov
Dec
Froz
en F
illet
Pri
ce $
/lb
0.60
0.65
0.70
0.75
0.80
2000 Fillet
2001 Fillet
2000 Fish
2001 Fish
Pond Bank Price $/lb

Industry Response to Imports
• Legislation– “Country of Origin” labeling
– Removal of Channel Catfish images on import packaging
– Seek to have ‘Catfish’ name removed from non-Ictaluridae fish species
• Advertising– Concentrate on strict US safety and health standards
• Legal– Anti-dumping case?

Food Fish Inventories UP• Compared to last year
Food Fish Inventories are Up
– Large FF + 54%– Medium + 46%– Small + 24%
0
50
100
150
200
250
300
2000 2001
LargeMediumSmall

Food Fish Inventories UPWhy?
• Fish size that processors want has increased• Early 1990’s - 1.00 lb avg
• Mid 1990’s - 1.25 lb avg
• Early 2000’s - 1.50 lb avg
• Some processors now wanting 2.0 lb avg
• Larger fish require longer production cycle• 18-24 months

Food Fish Inventories UP
• “Glut” of fish ready for harvest– Expensive and risky for farmers to keep on-farm
– Low prices make selling unattractive
• Some Processors are reducing the number of shifts or processing lines

Increasing Production Costs
• Feed price inching upward
• Increasing bird populations
• Diseases: old and new

Nominal Catfish Feed Prices
0
50
100
150
200
250
300
9/1/
1997
12/1
/199
7
3/1/
1998
6/1/
1998
9/1/
1998
12/1
/199
8
3/1/
1999
6/1/
1999
9/1/
1999
12/1
/199
9
3/1/
2000
6/1/
2000
9/1/
2000
12/1
/200
0
3/1/
2001
6/1/
2001
Fee
d P
rice
, $/t
on
32% protein feed price Poly. (32% protein feed price)

Types of Bird Damage
• Feeding on catfish (80%)
• Injury of fish (33%)
• Disrupting feeding (23%)
• Damaging structures (23%)
• Transmission of disease– White Pelican - trematode - Ram’s horn
snail, since 1998

DCCO Wintering Population and Catfish Acreage in MS Delta
0
20,000
40,000
60,000
80,000
100,000
120,00019
90
1991
1992
1993
1994
1995
1996
1997
1998
1999
2000
2001
DC
CO
s &
Cat
fish
Acr
eage
DCCO Winter Pop Aquaculture Acres


EPA Effluent Discharge Regulation
• Looking at aquaculture discharge as point source of pollution– Diverse industry
• Screener survey sent out in Aug/Sept ‘01
• Long form of survey to follow
• Regulations due out in July 2002– Expected to increase costs of production

Cash Costs for a 250 Acre Catfish Farm Stocking 7,500 5" Fish Per Year
-1,200
-1,000
-800
-600
-400
-200
0
200
400
600
190 200 210 220 230 240 250 260 270 280 290 300 310
Feed price per ton
Inco
me
Abo
ve V
aria
ble
Cos
ts
75 cents/lb
Fish Price
55 cents/lb
60 cents/lb
65 cents/lb
70 cents/lb

Short-Run
• If producers cannot cover variable costs:– Stop producing?– Difficult to stop multiple-batch production
systems– May delay restocking ponds
• Could lead to future shortages 15 - 18 months later

Long-Run
• If producers cannot cover Variable and Fixed costs, then what?
– Make Adjustments to production scheme• modular components specializing in developing
large stockers
• use of genetically improved or hybrid catfish for faster growth
• better management of off-flavor, diseases, and birds

Outlook for 2002
• Expansion on hold– Less new pond construction– Efficient farms will break even– Less efficient farms will lose some equity
gained in last few years

Outlook for 2002
• If prices remain low:– some producers will not restock– could lead to a shortage of fish in 2003– adapt with new less expensive strategies of
production

Outlook for 2002
• Much depends on how successful industry is in handling increasing imports
Outlook for Long-Term
• Food producers will be needed
• Food producers will make a living and make money
• Catfish production will continue to increase– Fish consumption will continue to go up– Beef is a substitute
• high beef prices will likely increase fish consumption