situational analysis of energy industry, policy and
TRANSCRIPT

75Situational Analysis of Energy Industry, Policy and Strategy for Kenya
Situational Analysis of
Energy Industry, Policy and Strategy
for Kenya

74 Situational Analysis of Energy Industry, Policy and Strategy for Kenya
1Situational Analysis of Energy Industry, Policy and Strategy for Kenya
Situational Analysis of
Energy Industry,Policy and Strategy
for Kenya

2 Situational Analysis of Energy Industry, Policy and Strategy for Kenya
Published by
© Institute of Economic Affairs (IEA), 2015
5th Floor ACK Garden House1st Ngong AvenueP.O. Box 53989-00200Nairobi, KenyaTel: 242-20-2721262, 2717402Fax: 254-20-2716231Cell: 0724-256510, 0733-272126Email: [email protected]: www.ieakenya.or.ke
Design and layoutSunburst Communications Ltd.Tel: +254 (0) 722 374 226/720 768 853Email: [email protected]

3Situational Analysis of Energy Industry, Policy and Strategy for Kenya
Table of Contents
Foreword 5
Acknowledgement 6
Executive Summary 7
List of Acronyms 9
1.0 Introduction 11
1.1 Background 11
1.2 Energy problem in Kenya 12
1.3 Objectives of the study 13
1.4 Organization of the paper 13
2.0 Methodology 14
2.1 Types and sources of data 14
2.2 Limitation of study 14
3.0 Energy Policies and Institutions in Kenya 16
3.1 Policies and strategies 17
3.1.1 Kenya Vision 2030 17
3.1.2 Sessional Paper No. 4 of 2004 19
3.1.2.1 Electricity sub-sector 19
3.1.2.2 Petroleum sub sector 20
3.1.2.3 Renewable energy 20
3.1.3 Energy Act of 2006 21
3.1.4 Rural Electrification Master Plan 21
3.1.5 Feed-in Tariff Policy 22
3.2 Institutional set up 23
3.2.1 Ministry of Energy and Petroleum 23
3.2.2 Energy Tribunal 23
3.2.3 Energy Regulatory Commission 23
3.2.4 Generation 23
3.2.5 Transmission and Distribution 24
4.0 Energy Supply and Demand in Kenya 25
4.1 Biomass 25
4.2 Oil and Gas 27
4.3 Import and Exports 28
4.4 Consumption 30
4.5 Prices 31
4.6 Oil and Gas reserves 31
4.7 Coal 33
4.8 Electricity 34
4.8.1 Electricity sources 34
4.8.2 Installed capacity 35

4 Situational Analysis of Energy Industry, Policy and Strategy for Kenya
4.8.3 Distribution and transmission 37
4.8.4 Generation of electricity 40
4.8.5 Demand 41
4.8.6 Tariffs and profitability 44
4.8.7 Challenges 45
4.9 Infrastructure 45
4.9.1 Mombasa port 45
4.9.2 Mombasa refinery 46
4.9.3 Pipeline 46
4.9.4 LAPSSET project 46
4.9.5 Least Cost power development plan –strategy 47
5.0 Conclusion and Recommendations 54
6.0 Kenya Energy Scenarios 56
6.1 Introduction 56
6.1.6 Background 56
6.1.2 What are scenarios? 56
6.1.3 Scenarios methodology used 57
6.2 SWOT analysis of the energy sector 58
6.3 Identifying the driving forces/variable 60
6.3.1 Drivers of the future: Critical certainities 60
6.3.1.1 Demographics 60
6.3.1.2 Urbanization 60
6.3.1.3 Economic performance 61
6.4 Drivers of the future: Critical uncertainities 62
6.5 Impact/Uncertainty analysis 62
6.6 Scenarios analysis 63
6.6.1 The scenarios framework 63
6.6.2 The scenarios stories 65
6.6.2.1 Renewable energy scenario 66
6.6.2.2 Business as usual/non renewable energy scenario 68
6.7 The scenarios actors 70
7.0 Policy recommendations 71
8.0 References 72

5Situational Analysis of Energy Industry, Policy and Strategy for Kenya
Foreword
Kenya is in a very interesting development phase with regards to its domestic energy requirements. In the past decade the country has grappled with the challenge of unreliable, expensive and unsustainable energy use supporting a stagnating industrial and manufacturing base. This is due to aging energy infrastructure that can no longer meet the modern day requirements as envisaged in the country’s economic blueprint, the Kenya Vision 2030.
At the same time the country has recently made some welcome discoveries in the form of coal, oil and gas deposits that could significantly change the structure of the economy, with major contributions to public revenue as well as impact on other economic sectors.
This poses a unique challenge to policy makers, the private sector, and to those who utilise our energy resources the most. How can an economy which relies heavily on wood fuel and biomass as its largest energy source, achieve sustainable energy use through the gradual increase in the use of renewable energy sources that are often expensive due to the technology deployed, in the face of oil and coal discoveries that could be more readily accessible in spite of its known effects on the environment. This challenge requires a very careful implementation of energy sector reforms that not only develops the newly discovered energy sources but also puts in place an investment framework that ensures diversification of energy sources with focus on making renewable sources competitive in the energy matrix. The development of such a strategy requires a clear understanding of Kenya’s energy demand and supply structure. This study aims at providing a situational analysis of the energy sector in Kenya by examining the composition, sources and strategies in the sector, as well as by conducting scenarios based on the different policy paths that Kenya as a nation might consider.
It is our belief that this study therefore contributes towards the recognition of the range of policy choices required for the development of a sustainable energy use for Kenya by providing analysis and recommendations to policy makers.
Lastly, the Institute of Economic Affairs (IEA-Kenya) is grateful to the IDRC Canada through the Think Tank Initiative (TTI) and to the Korean Energy Economic Institute (KEEI) for their support towards this project.
Kwame OwinoChief Executive

6 Situational Analysis of Energy Industry, Policy and Strategy for Kenya
The Institute of Economic Affairs (IEA - Kenya) would like to express its gratitude to the authors of this book. These are: David Owiro, Georges Poquillon, Katindi Sivi Njonjo and Chrispine Oduor. Further appreciation goes to Veronica Nguti and Stephen Jairo for their support and input during the study.
The IEA also acknowledges all participants who attended and made valuable input during the Kenya Energy Scenarios building workshops. These are: Hannah Wanjiru, Margaret K Chemengich, Otiato Guguyu, Peter Achar, Margaret Owino, Irene Njoroge, Nicholas Gachole, Maina Wambugu, Susanne Rabisch, Zilper Audi and Everlyne Odete.
The IEA acknowledges Oscar Ochieng and Chrispine Oduor for editing the publication and for coordinating the design and layout.
Last but not least, the IEA is grateful to the International Development Research Centre (IDRC) and Korea Energy Economics Institute (KEEI), for their generous financial support in making this publication possible.
Acknowledgement

7Situational Analysis of Energy Industry, Policy and Strategy for Kenya
The energy sector relies on three main sources of energy, biomass, petroleum and electricity, at 68%, 21% and 9% of total energy consumption in Kenya. Biomass constitutes the largest source of energy consumed in Kenya in the form of wood fuel and charcoal, which is extensively used in the rural areas by mostly poor households for cooking and heating purposes. Apart from poor rural households, biomass is also used by small business, principally kiosks and restaurants within urban centers.
Biomass
The main challenge in its use as as wood fuel is the widening gap between the current demand and the lack of a sustainable supply, i.e. a supply that does not harm the ecosystem, particularly forests. The fact that the wood fuel sub-sector is almost entirely informal presents serious challenges when it comes to enforcement of regulations.
Therefore, amongst the first reforms that the Government must do is to ensure sustainable use of biomass either through re-afforestation or reducing/changing consumption patterns. This can be done through: developing sustainable plantation of fast growing tree species, integrating wood fuel into the farmland system, improving the current technologies that use charcoal and improving the legal and regulatory framework.
Secondly, bio-fuels, namely bio-diesel, bio-ethanol, and bio-gas are used to a very small extent in Kenya, despite the fact they can be perfect substitute for petroleum-fuels. Two plants produce bio-ethanol from molasses, mainly derived from the sugar cane industry; and bio-diesel production principally relies on the jatropha species. In a country where food security has not been achieved in all the provinces, the development of bio-fuels often face opposition as it reduces the amount of land available for arable lands dedicated to growing food for consumption.
Petroleum
Fossil fuels in Kenya is overwhelmingly dominated by petroleum accounting for about 25% of the total imports. Although oil and gas discoveries are being made in Kenya it is yet to start extraction and production from its reserves, it therefore entirely relies on imports of both crude and refined oil.
Over the last decade, the composition of oil imports has switched from crude petroleum to refined petroleum fuels. This change highlights the increasing mismatch between Kenya’s refining capacity and the demand for refined petroleum fuels in the country and the region. Indeed, the total production of refined oil from the oil refinery in Mombasa has been steadily declining over the last decade in spite of the increasing demand. This decline in refined petroleum is attributed to aging facilities leading to high inefficiency of the refinery facility at the port. Upgrading and regular maintenance is mandatory if Kenya is to continue refining petroleum at the old refinery in Mombasa.
Consumption of petroleum increased by 3.7% annually over the last decade to reach 3,638,000 tonnes in 2012. Retail pump outlets are the main consumers with about 60% of the total consumption. The principal challenge of high petroleum consumption is the corresponding vulnerability of the economy to price fluctuations in the case of non-oil producing countries.
Oil and Gas Deposit Discovery
However, Kenya has recently discovered some exploitable oil deposits, so far amounting to 540 million of barrels with indications that the extraction process could start within the next five years, even as further
Executive Summary

8 Situational Analysis of Energy Industry, Policy and Strategy for Kenya
exploration continues. Should oil deposits be found to be commercially viable, the government must ensure that the revenues resulting from the exploitation of the reserve are fairly shared among the different stakeholders, in order to prevent any protestation and discontentment in the population, as well as ensure that adequate measures are enacted to prevent the dutch disease and the emergence of a resource curse. To do so, the legal, institutional and policy framework governing the energy sector specifically and the extractive sector in general must be appropriate given the unique developmental challenges facing the country, in addition to it’s development priorities.
Finally, the new strategies in the sector require adequate infrastructure for their successful fulfillment. These large projects including a new port, a new pipeline linking the Kenyan coast to Ethiopia and South Sudan, and a new refinery have already been designed, although the funding is yet to be completed.
Coal and Gas
Regarding gas and coal, Kenya does not import gas yet, but this should change in the near future with the completion of a gas thermal power generation plant. Electricity production is mainly through Hydro-power generation, although this might change with the exploitation of a 400 million tonnes coal mine that has recently been discovered, and is expected to power the operations of two new 960MW power plants by 2017.
Electricity
Electricity in Kenya is generated from hydro, thermal, geothermal and wind. Installed capacities amounted 1,766.4MW in 2013 for a total generation of 8,045GWh. Although hydro remains the main source of production in terms of installed capacities, the fact that it is quite unreliable pushed the government to favour wind, thermal and geothermal generation in it’s current plans for the sector. Indeed, the Kenyan government have planned to raise total installed capacity to 6,762MW by 2017 of which 55% would consist of thermal and 32% of geothermal.
Geothermal generation appears to be very attractive as it presents the highest efficiency rate and does not rely on any combustible energy sources that need to be imported. Moreover, it is a renewable source of energy, which has no sizable adverse effects on the environment.
Distribution and Transmission Network
The distribution and transmission network is made of 49,828km of electric lines and additional 3,574km should be implemented by 2017. Distribution and transmission losses remain an important issue as the rate of loss verged on 17% in 2012. The main hindrances to the improvement of the quality of the network are the huge incurred investments, which require the participation of donors or of private investors. Expanding the medium voltage network to shorten low voltage lines would also be relevant.
Consumption Patterns
Electricity consumption reached 6,581GWh in 2012/13, increasing by 73% from 2007/08. Large and medium companies are the largest consumers, consuming about twice as much power as domestic consumers. It should be noted that the current tariff pattern largely favour the large firms compared to small firms and households. The fact that large and medium companies yielded, relatively, 48% and 79% less revenue than households and small commercial consumers respectively testify of special advantages granted to this group.
Another concern stems from the decreasing consumption of electricity per consumer. This might result either from an unmatched demand due to slow increase in generation compared to the rise in consumers, or from inadequate expansion of the network that connect individuals with low demand for electricity. This specific problem therefore needs to be addressed by conducting survey to order to determine the real demand for power.
9Situational Analysis of Energy Industry, Policy and Strategy for Kenya
List of Acronyms
ABPP Africa Biogas Partnership Programme ACFC Agro-Chemical and Food CompanyACON African Christians Organization Network AFD French Development AgencyAfDB African Development BankAGO Automotive Gas OilASAL Arid and Semi-arid LandsAU African Union CBK Central Bank of KenyaCBO Community based organisationCDC Commonwealth Development Corporation CDM Clean Development Mechanism CEEC Centre for Energy Efficiency and Conservation CFL Compact Fluorescent Lamp CIDA Canadian International Development AuthorityCPI Consumer Price IndexCSO Civil Society OrganisationDEEP Developing Energy Enterprises Program DGIS Directorate General for International Cooperation DSM Demand Side ManagementEAPP East African Power Pool EDF Electricity de FranceEIB European Investment BankEMA Energy Management Awards EMP Energy Management Plans EPC Engineering, Procurement and ConstructionERC Energy Regulatory Commission ESCOs Energy Service Companies EU European UnionFiT Feed-In-Tariff FKE Federation of Kenya EmployersFY Fiscal YearGDC Geothermal Development Company GDP Gross Domestic ProductGHG Green House Gas GoK Government of KenyaGRA Geothermal Resource AssessmentGT Gas TurbineGWh Gigawatt hoursHFO Heavy Fuel OilHVDC High Voltage Direct Current IBRD International Bank for Reconstruction and DevelopmentIEA Kenya Institute of Economic Affairs, KenyaIFC International Finance Corporation IPP Independent Power ProducerISAK Improved Cook-stoves Association of Kenya IUNPDP Interim Update of the National Power Development PlanJICA Japan International Cooperation AgencyKAM Kenya association of ManufacturersKBS Kenya Bureau of Statistics

10 Situational Analysis of Energy Industry, Policy and Strategy for Kenya
KEBS Kenya Bureau of StandardsKEEI Korea Energy Economics InstituteKEFRI Kenya Forestry Research InstituteKENDBIP Kenya National Domestic Biogas ProgrammeKenGen Kenya Electricity Generating Company LimitedKEREA Kenya Renewable Energy AssociationKES Kenya Shillings KETRACO Kenya Electricity Transmission Company Limited KfW Kredintsatalt fur Weidraufbau (of Germany)KIPPRA Kenya Institute for Public Policy Research and Analysis KIRDI Kenya Industrial Research and Development Institute KIRDI Kenya Industrial Research and Development InstituteKMC Kenya Meat Commission KNBA Kenya National Bureau of Statistics KPC Kenya Pipeline Company LimitedKPC Kenya Power Company KPLC Kenya Power & Lighting Company LimitedKPRL Kenya Petroleum Refinery LimitedKTDA Kenya Tea Development AuthorityKW Kilowatt KWh Kilowatt hours LED Light Emitting Diodes LPG Liquefied Petroleum GasMENR Ministry of Environment and Natural Resources MEPS Minimum Energy Performance Standards MFIs Micro Finance InstitutionsMoE Ministry of EnergyMSD Medium Speed DieselMVA Megavolt Amperes MW Megawatt MWe Megawatt electric NEMA National Environment Management AuthorityNEPAD New Partnership for Africa’s Development NGO Non-Governmental OrganisationNOCK National Oil Corporation of KenyaPPA Power Purchase Agreement PSDA Private Sector for Development in Agriculture Programme PV Photo VoltaicREA Rural Electrification AuthorityREEEP Renewable Energy and Energy Efficiency Partnership REF Rural Electrification FundREP Rural Electrification Programme REP Rural Electrification ProgrammeRES Renewable Energy Sources RTAP Regional Technical Assistance Programme SA Statistical Abstract SAPP Southern African Power PoolSE4ALL Sustainable Energy for All SHS Solar Home Systems SIDA Swedish International Development AuthoritySMEs Small and Medium Enterprises SWH Solar Water Heaters UNDP United Nations Development ProgrammeUNEP United Nations Environment Programme UNIDO United Nations Industrial Development Organization USD US dollars
11Situational Analysis of Energy Industry, Policy and Strategy for Kenya
Introduction1
1.1 Background
Kenya has witnessed tremendous economic growth over the previous decade from the year 2003 to 2013. Average annual GDP growth rates have stood at about 5%, with the main economic drivers being agriculture, wholesale and retail trade, and transport and communication which contributed 17.6%, 15.2% and 10.8% respectively in 2013 (Economic Survey, 2013). During this period Kenya implemented bold economic and structural reforms as elaborated by the national economic plan known as the Economic Recovery Strategy (ERS) covering the 2003-2007 period. The ERS aimed at achieving the following:
i. Restoration of economic growth within the context of a stable macroeconomic environment;ii. Rehabilitation and expansion of infrastructure;iii. Equity and poverty reduction; andiv. Improving governance.
In addition the ERS policy emphasized the role of equity in its overall socio-economic agenda. This was to be achieved through adoption of a growth strategy based on sectors that generated rapid employment, and that provide more income generating opportunities for the poor. The sectors identified included agriculture, tourism, trade and industry, Information Communication Technology (ICT) forestry, and mining. ERS also gave renewed attention to the needs of arid and semi-arid districts and the need for additional resources to address them.
Arising from the implementation of sound fiscal and monetary policies supported by strong structural reforms, Kenya’s economy has grown significantly from virtual stagnation in 2002 when it expanded from 0.6% in 2002 to 6.1% in 2006 and 6.3% in the first quarter of 2007. This was the first time in two decades for Kenya to record four consecutive years of high economic growth. The robust economic growth was evident in all sectors of the economy. In 2008 to 2010 the economy suffered a shock in the form of post election violence following disputed presidential elections in 2007 that resulted in a negotiated settlement by way of a national accord that saw the establishment of a grand coalition government for the period 2008 to 2013.
The successor of the ERS is the Vision 2030 which is the national economic planning document that is to ensure the attainment of a middle income status by the year 2030. The plan outlines three pillars through which this will be possible, namely the economic, social and political pillars. The vision 2030 is implemented through five year rolling plans known as the Medium Term Plans. Currently Kenya has embarked on the second five year Medium Term Plan beginning in 2013.
In spite of the positive economic outlook Kenya still faces a number of economic challenges, for instance in the period 1972 to 2003, despite annual gross domestic product (GDP) growth rates averaging 3.5% per capita real GDP grew at only 0.2% over the same period (UNEP, 2006), reflecting growing population pressure as well as declining socioeconomic conditions. In the period that followed between 2003 and 2013, the positive GDP growth also does not result in significant welfare improvements, notably unemployment levels remain high at about 12% open unemployment, high rates of inflation, and high levels of corruption amongst other economic challenges.
12 Situational Analysis of Energy Industry, Policy and Strategy for Kenya
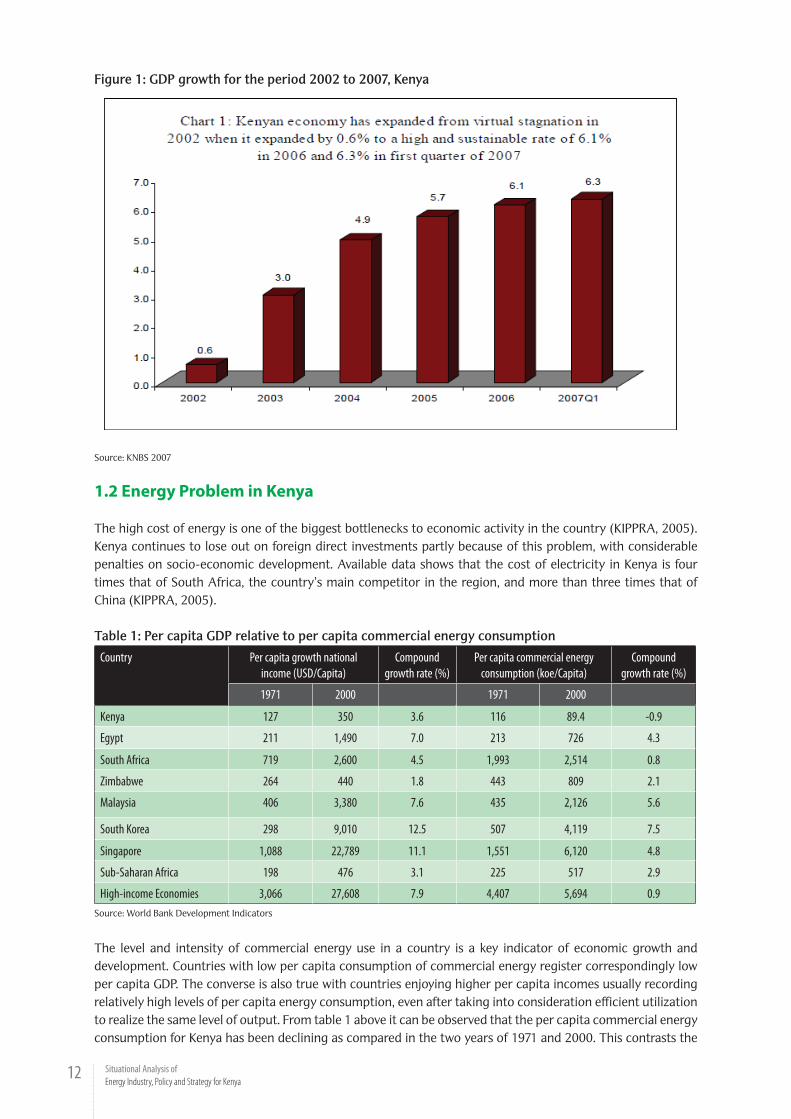
Figure 1: GDP growth for the period 2002 to 2007, Kenya
Source: KNBS 2007
1.2 Energy Problem in Kenya
The high cost of energy is one of the biggest bottlenecks to economic activity in the country (KIPPRA, 2005). Kenya continues to lose out on foreign direct investments partly because of this problem, with considerable penalties on socio-economic development. Available data shows that the cost of electricity in Kenya is four times that of South Africa, the country’s main competitor in the region, and more than three times that of China (KIPPRA, 2005).
Table 1: Per capita GDP relative to per capita commercial energy consumption
Country Per capita growth national income (USD/Capita)
Compound growth rate (%)
Per capita commercial energy consumption (koe/Capita)
Compound growth rate (%)
1971 2000 1971 2000
Kenya 127 350 3.6 116 89.4 -0.9
Egypt 211 1,490 7.0 213 726 4.3
South Africa 719 2,600 4.5 1,993 2,514 0.8
Zimbabwe 264 440 1.8 443 809 2.1
Malaysia 406 3,380 7.6 435 2,126 5.6
South Korea 298 9,010 12.5 507 4,119 7.5
Singapore 1,088 22,789 11.1 1,551 6,120 4.8
Sub-Saharan Africa 198 476 3.1 225 517 2.9
High-income Economies 3,066 27,608 7.9 4,407 5,694 0.9Source: World Bank Development Indicators
The level and intensity of commercial energy use in a country is a key indicator of economic growth and development. Countries with low per capita consumption of commercial energy register correspondingly low per capita GDP. The converse is also true with countries enjoying higher per capita incomes usually recording relatively high levels of per capita energy consumption, even after taking into consideration efficient utilization to realize the same level of output. From table 1 above it can be observed that the per capita commercial energy consumption for Kenya has been declining as compared in the two years of 1971 and 2000. This contrasts the

13Situational Analysis of Energy Industry, Policy and Strategy for Kenya
positive growth in commercial energy consumption in countries witnessing positive growth over the same period such as Egypt and South Africa. Notably the fastest growth in commercial energy consumption were witnessed by South East Asian economies of Malaysia, South Korea and Singapore, perhaps a reflection of their booming economies.
The Sessional Paper no 4 of 2004 notes the challenges of the energy sector in Kenya includes, inter alia, a weak power transmission and distribution infrastructure due to limited investments in power system upgrading. As a consequence, the economy experiences high electric power system losses estimated at 20% of net generation, extreme voltage fluctuations and intermittent power outages at 11,000 per month, which cause material damage and losses in production. These power system weaknesses coupled with the high cost of power from Independent Power Producers (IPPs) contribute to high cost of doing business in Kenya. Other power sub-sector challenges include low per capita power consumption at 121 kWh and low countrywide electricity access at 15.3% of the total population and 3.8% of the rural population as at 2004.
The current electricity demand is 1,191 MW while the effective installed capacity under normal hydrology is 1,429 MW. Generation capacities from Hydro, Geothermal, baggase (co-generation) and wind are 52.1%, 13.2%, 1.8% and 0.4% respectively while fossil based thermal contributes at 32.5%. The peak load is projected to grow to about 2,500MW by 2015 and 15,000 MW by 2030. To meet this demand, the projected installed capacity should increase gradually to 19,200 MW by 2030 (MoE, 2013).
To address these challenges Government has formulated strategies whose objectives are to rapidly expand installed electricity capacity, expand and upgrade the transmission and distribution networks, and develop renewable sources of energy: geothermal, solar, wind, biomass and small hydro power, among others.
The purpose of this study is therefore to conduct a situational analysis of the energy sector in Kenya, by examining the Policy, Industry, Strategy with a view to highlighting the challenges facing the sector as well as recommending policy options that might provide solutions.
1.3 Objectives of the Study
The purpose of the study is to undertake a situational analysis of the Energy sector in Kenya with a specific view of examining the energy policy, industry and strategy and plans for the sector. Further an analysis of the different scenarios will be conducted in order to determine the policy paths given a particular policy option. Additionally, the study will also recommend policy options for enhancing the formulation and implementation of energy policy in Kenya.
1.4 Organization of the Paper
The study is organized in two main chapters with various subsections. Chapter one comprises of a description of the methodology of the situational analysis, followed by a review of the energy policies in Kenya and an examination of the energy demand and supply situation. Chapter two consists of the energy policy scenario, including a swot analysis, identification of key variables and driving factors, the scenario analysis itself and a conclusion with the main policy recommendations.
14 Situational Analysis of Energy Industry, Policy and Strategy for Kenya
Methodology2The conceptual framework for this study involved two main kinds of analyses. The first one consists of reviewing the existing legal and regulatory framework pertaining the Kenyan energy sector, from independence to now, in order to assess in which legal environment the sector has developed throughout the years. Most of the documents used were bills and/or acts regulating the energy sector, energy governmental policies shaping the principal orientations followed by Kenyan authority, and governmental strategy envisioning and designing the future of the energy sector in Kenya. A particular focus was put on the different institutions in charge of the energy policy in general and on the way these institutions interact with each other. The second process entailed Assessing the state of the energy sector over a period of about 10 years. Each component of the sector was identified and accurately investigated and secondly more general analyses were also conducted, notably regarding infrastructure and hydrocarbon potential reserves.
2.1. Type and sources of data
The study relied on both primary and secondary data. Raw data from governmental agencies, international institutions and private companies were used to perform trend analyses over period ranging from 5 to 15 years. The main sources being World Bank Databank, the Economic Survey issued by the Kenyan National Bureau of Statistics (KNBS) and the Kenya Power Lightening Company (KPLC) Annual reports. Specific variables were also created from these databases when indicators relevant for the investigations were not directly available. Then the analyses per se mostly consisted in computing percentage variations of variables over time, both in term of total variation over the whole period or in term of average annual variation. The results were laid out either in a graph or in a table, depending on the specific point to be emphasized.
Several types of report were used to document the rest of the study. First of all, publications from the Kenyan government such as the Energy Act or various strategic plans provided us information on the current legal framework ruling the energy sector and on the direction the current government has imagined for the future of energy in Kenya respectively. The Least Cost Power Development Plan (2011-2031) and the Vision 2030 objectives, as well as many reports of the Energy Regulatory Commission (ERC), were of particular interest. We also relied on reports issued by different international institutions such as the World Bank or the United Nations Development Programme (UNDP), which publish relevant and detailed policy impact analyses of various energy uses. Numerous non-governmental organisations (NGO) carried out interesting research on this topic; Action Aid, PISCES and KIPPRA among others. Indeed, such organisations, usually, have a narrower area of interest, which leads them to produce quite specific research. Finally, findings of academic research papers from various scientific reviews were used to complete the documentation.
2.2. Limitation of the study
When gathering information to write this report, several issues and hindrances were noted by the researchers. Accessing certain primary source data did represent a challenge. As it is common in developing countries, a large share of Kenya’s economy is informal, compelling the researchers to base some analyses on estimations or old surveys. This case particularly applied to data on the use of biomass, which almost entirely arises in the informal sector. Secondly, whilst private companies are inclined to provide quite precise and complete statistics, mainly because they are accountable to their shareholders, a significant number of them keep publishing detailed and transparent information. With this regard, the oil and gas sectors, as well as independent private producers of electricity, are sometime relatively opaque when it comes to communicating the exact nature of the infrastructure there are operating. When data from private firm are lacking, in most of the cases the governmental statistics agency are not able to substitute for them. Indeed the information made available by the

15Situational Analysis of Energy Industry, Policy and Strategy for Kenya
Kenyan National Bureau of Statistics remained quite general, preventing any in depth analysis of disaggregated data.
Information on the current state of oil and gas deposit exploration was also difficult to access. Neither the oil companies nor the government offered a clear and transparent picture of the state of advancement of the different project, making any evaluation of the true potential of Kenya’s hydrocarbon reserve difficult to carry out.

16 Situational Analysis of Energy Industry, Policy and Strategy for Kenya
Energy Policies and Institutions In Kenya
3
Kenya has effected a number of policies to govern the energy sector by way of policies, institutions and legal framework which have been formulated from time to time. The country embarked on fundamental liberalization reforms in the energy sector after the mid 1990s following the enactment of the Electric Power Act of 1997 and almost a decade later in the energy Act of 2006. These legislation laid the foundations for the separation of generation from transmission and distribution in the electricity sub-sectors as well as the liberalization of procurement, distribution and pricing of petroleum products in the country. Previously the petroleum sub-sector was regulated through the Petroleum (exploration and production) Act of 1994 and the Petroleum Development Fund Act of 1991. The Energy Act consolidated all laws relating to the energy sector and provided for the establishment of the Energy Regulatory Commission (ERC) as a single sector regulator.
Figure 3.1. : Institutional framework in the Energy Sector in Kenya
Source: MOE
These broad based energy sector reforms were laid out in the Sessional paper no 4 of 2004 that provided for the unbundling of functions in the electricity sub-sector as well as consolidation of all energy laws under a re mandated regulatory commission with a strengthened functions.
In this section we review the policies, institutions and legal frameworks that govern the Energy sector in Kenya. These include, Kenya Vision 2030, Sessional Paper No. 4 of 2004, The Energy Act of 2006, among others as well as the key institutions, such as the Ministry of Energy, the Energy Regulatory Commission (ERC), Kenya Power and Lighting Company (KPLC), KETRACO, KENGEN among others.

17Situational Analysis of Energy Industry, Policy and Strategy for Kenya
3.1. Policies and Strategies
3.1.1.Kenya Vision 2030 Kenya Vision 2030 is the new long-term development blueprint for the country. It is motivated by a collective aspiration for a better society by the year 2030. The aim of Kenya Vision 2030 is to create “a globally competitive and prosperous country with a high quality of life by 2030”. It aims to transform Kenya into “a newly-industrializing, middle-income country providing a high quality of life to all its citizens in a clean and secure environment”.
On energy, the Vision 2030 notes that currently the energy costs in Kenya are higher than those of her competitors in the face of growing energy demand. It therefore prioritizes the growth of energy generation and increased efficiency in energy consumption. This will be achieved through continued institutional reforms in the energy sector, including a strong regulatory framework, encouraging private generators of power, and separating generation from distribution, as well as securing new sources of energy through exploitation of geothermal power, coal, renewable energy sources, and connecting Kenya to energy-surplus countries in the region.
While significant gains in infrastructure development have been realized over the last 5 years, Vision 2030 notes that Kenya’s global competitiveness is still weak, especially in the following areas:• EnergycostinKenyaisUS$0.150perKWh.ThiscomparespoorlywithMexico(US$0.075),TaiwanandChina
(US$0.070),Colombia(US$0.064)andSouthAfrica(US$0.040);• Duetoover-relianceonhydroelectricity, thefrequencyofpoweroutages ishigh(33percentcompared
with the average for Mexico, China and South Africa, which stands at 1 per cent). Production lost due to these outages is approximately 9.3% (compared with the average for Mexico, China and South Africa, which stands at 1.8 per cent). Also, it takes approximately 66 days to obtain electricity connection in Kenya (compared with an average of 18 days in Mexico, China and South Africa);
• TelecommunicationscostsinKenyaareUS$15,000permonthfora2Mbpsinternationalleasedline.Thissituation compares unfavourably with key Business Process Outsourcing (BPO) destinations e.g. India (US$4,800),thePhilippines(US$4,400),Poland(US$2,000)andMorocco(US$7,000);
• TotalwateravailabilityinKenyaiscurrentlyabout~937m3/capita,whichisfarbelowtheaverageforAfrica(~4,500m3/capita);
• System losses: Unaccounted-for-water losses average 60 per cent while electricity transmission lossesaverage 18.5 per cent;
Goals for 2012
The Vision 2030 document also identifies a number of broad goals to be pursued to deal with the above mentioned challenges, these include:• Acceleratingongoinginfrastructuredevelopment,focusingonquality,aestheticsandfunctionalityofthe
infrastructure services developed;• Buildinginfrastructuredevelopmenttosupport identifiedflagshipprojectstoensurecontributiontothe
economic growth and social equity goals;
In order to achieve the above goals a number of measures have been planned in order to tackle the challenges. Firstly, government has continued to finance extension of electricity supply in the rural areas as part of the basic infrastructure to stimulate economic growth and employment creation. The current policy provides for the extension of electricity to market centres, public secondary schools, youth polytechnics, health centres, and water systems, among other community projects. This is intended to increase electricity access in rural areas currently at 4% to 12% by the year 2012.
The Rural Electrification Authority charged with the mandate of implementing the Rural Electrification Programme came into operation in July 2007. This is expected to increase the speed of implementation of several projects that are lined up for implementation throughout the country. Currently, the Authority is in the

18 Situational Analysis of Energy Industry, Policy and Strategy for Kenya
process of developing a comprehensive rural electrification master plan which shall provide crucial information for selecting projects for funding at a given time.
In addition, Ethiopia and Kenya have undertaken a feasibility study financed by several international development partners to facilitate the transfer of electricity to Kenya from a number of large Ethiopian hydro power projects that provide power at lower costs compared to local ones.
The Vision 2030 further identifies flagship projects to be undertaken for delivery within specific timelines, the following is a brief overview of energy specific projects to be undertaken by 2013:
1. A total of 215 rural electrification projects, estimated to cost KES. 1,483 million, are scheduled to be completed by February 2008. These projects include new isolated power stations being erected at Hola (Tana River district), Elwak (Mandera district), Mpeketoni (Lamu district), Merti (Isiolo district), Habasweni (Wajir district) and Mfangano Island (Suba district) at a cost of Kshs.474 million. All these projects are being funded solely by the Government of Kenya.
2. On rural electrification: Kenya is committed to a Rural Electrification Programme in partnership with Development Partners. The Government of France is currently financing a rural electrification project to the tune of KES. 2.7 billion to cover various parts of the country. Upon completion, the project will facilitate connection of power to 460 trading centres and 110 secondary schools, among other public facilities. The new Rural Electrification Authority will build on these achievements to bring more electric power to rural Kenya.
3. On Power to Public Institutions: The Government intends to spend KShs. 180 million to provide solar electricity generators to 74 public institutions including boarding primary and secondary schools, health centres and dispensaries in Baringo, Marakwet, Samburu, West Pokot, Turkana, Makueni, Narok, Kajiado, Moyale, Marsabit and Mandera Counties.
4. On Energy access scale-up programme: Through this project, one million households will be connected with electricity over the next five years at an estimated cost of KES.84 billion. The programme will target connecting all major trading centres, secondary and primary schools, community water supply works and health centres in the country. This programme will be financed by the Government as well as development partners.
5. Enhanced oil supply capacity: Plans are underway for installation of booster pump stations to double the capacity of the Mombasa to Nairobi oil pipeline from 440m3/hr to 880m3/hr. Four booster pumps will be installed in Samburu, Manyani, Makindu and Konza.
6. Extension of the national oil pipeline: A study has been completed on the projected demand for petroleum products in the country. The Kenya Pipeline Company has selected an Engineering Design and Construction Supervision Consultant for the construction of a 340km parallel oil pipeline from Nairobi to Eldoret.
7. Joint ventures: The Government will also partner with the government of Uganda and Tamoil East Africa limited in a Joint Venture Company for the extension of 352km oil pipeline from Eldoret to Kampala.
8. Construction of 6,000 tonne common user Liquid Petrolium Gas (LPG) import handling facility in Mombasa through public private partnership. This is expected to increase parcel sizes imported thus reducing freight costs and making LPG cheaper to Kenyans.
9. Construction of 2,000 tonne common user LPG handling facility in Nairobi. With increased storage space, supply sources will increase thus competitively priced LPG can be obtained.
10. Local coal supply: following the completion of appraisal drilling in Mui Basin of Kitui and Mwingi district, Kenya will have access to local coal as an every source. Initial exploration activities have indicated existence of coal. Appraisal drilling projects to ascertain the commercial quality and viability of the deposits are in progress.
11. Olkaria IV appraisal drilling of 6 wells are expected to produce 70 MW of electricity. The project is expected to prove that commercially exploitable steam is available in the field.
12. Wind Power Generation by IPP’s at various sites. It is envisaged that wind power will provide total power installed of about 150MW.
13. Co-generation Power: Power will also be obtained in the process of producing sugar. It is envisaged that the potential of about 120 MW will be exploited using sugar factories as a base. This will be done through public-private partnership.

19Situational Analysis of Energy Industry, Policy and Strategy for Kenya
14. The Energy Sector Recovery Project (ESRP), funded by the World Bank and some bilateral donors, has a major component on “Distribution Reinforcement and Upgrade” to be implemented over a period of four years. This is intended to improve quality and reliability of supply, reduce system losses and increase access to electricity service especially in the urban and peri-urban areas. This is of special interest to the industrial sector where power outages in the past led to losses.
15. The Governments of Kenya and Tanzania have obtained funding for implementation of a 330kV transmission line project between Arusha in Tanzania and Nairobi. This will be another source of extra power.
Overall, the Kenya Vision 2030 has put in place an ambitious plan to increase energy supply through heavy infrastructure investments and exploration of natural resources for power generation. If these are implemented they should result in sufficient growth in energy consumption as well as enhance economic growth across all economic sectors.
3.1.2. Sessional Paper No. 4 of 2004 The Sessional Paper No. 4 of 2004 is the single policy document that cements the liberalization reforms in the energy sector in the mid 1990s. Its vision is to promote equitable access to quality energy services at least cost while protecting the environment. The paper therefore lays the policy framework upon which cost-effective, affordable and adequate quality energy services will be made available to the domestic economy on a sustainable basis over the period 2004-2023.
The Sessional Paper further recognizes that the success of socio-economic and environmental transformation strategies pursued by the Government at present and in the future is to a large extent, dependent on the performance of the energy sector as an economic infrastructure.
The specific objectives of the energy policy are to:• Providesustainablequalityenergyservicesfordevelopment;• Utiliseenergyastooltoaccelerateeconomicempowermentforurbanandruraldevelopment;• Improveaccesstoaffordableenergyservices;• Provideanenablingenvironmentfortheprovisionofenergyservices;• Enhancesecurityofsupply;• Promotedevelopmentofindigenousenergyresources;and• Promoteenergyefficiencyandconservationaswellasprudentenvironmental,healthandsafetypractices.
In order to achieve these objectives the sessional paper introduced a raft of energy sector reforms. We discuss these briefly under the main energy sub-sectors below.
3.1.2.1. Electricity sub-sector
Firstly, the paper proposed the enactment of an Energy Act to succeed the Electric Power Act No. 11 of 1997 and the Petroleum Act, Cap 116 of 1994 to facilitate prudent regulation and enhance stakeholder interests including boosting of investor confidence. The new Act will also bring under its purview, other energy sources and resources currently not covered in other legislation. The Act was eventually enacted in 2006.
Secondly, it proposed the establishment of a single independent energy regulator under the Energy Act with adequate mandate to regulate all sector players, this led to the repeal of the Electricity Regulatory Board and the establishment of the Energy Regulatory Commission with an expanded mandate.
Thirdly, it proposed the establishment of a State Owned Enterprise known as the Geothermal Development Company (GDC) to be in charge of geothermal resource assessments and sale of steam to future IPPs and KenGen for electricity generation. GDC will also sell low enthalpy to other users
Fourthly, it earmarked the privatization of KenGen over time starting with an initial public offering (IPO) of 30% of its equity through the Nairobi Stock Exchange.
20 Situational Analysis of Energy Industry, Policy and Strategy for Kenya
Fifth, it established the Rural Electrification Authority (REA) to accelerate the pace of rural electrification in the country, a function previously undertaken by the Ministry of Energy.
Sixth, it proposed the unbundling of KPLC into two entities, one for transmission which will be 100% state owned and the other for distribution which will be private sector owned, This has seen the establishment of KETRACO as a transmission company for new transmissions with KPLC carrying out distribution and old transmissions.
Lastly, it proposed the promotion of privately or community owned vertically integrated entities either operating renewable energy power plants or hybrid systems, to coexist with licensed electricity distributors.
Other relevant policy reforms introduced by the sessional paper are:
• Allowingpowergenerationcompaniestoaccessbulkelectricityconsumersthroughthepowertransmissionnetwork;
• Creatingadomesticpowerpoolwithaprovisionforwholesaleandretailmarketstocreatecompetitionandthus reduce the cost of electricity;
• Privatisationorconcessioningisolatedpowerstationstoreduceoperatingcostsandthusfreeupresourcesfor rural electrification expansion;
• Increaselifelinetariffapplicabletodomesticconsumersofupto50kWhpermonthtoatleastrecoverthecost of electricity generation; and
• Transferoftheruralelectrificationassetswithintheinterconnectedelectricitynetworktolicensedelectricitydistributors at cost consistent with the law.
3.1.2.2. Petroleum sub-sector
The proposals in the Sessional paper for the petroleum sub-sector are as discussed below.Firstly the Sessional Paper proposed the divestiture of government interest in oil refining and marketing and eventually in the Kenya Pipeline Company (KPC), This is yet to happen.
Secondly, the paper advocates for promotion of investments in oil refining including supply and distribution of petroleum products throughout the country.
Thirdly, it proposes for the enhancement of exploration for fossil fuels particularly hydrocarbons through sub-division of exploration acreage into smaller blocks and collection of additional geological data to attract more oil prospecting companies, this is under progress with indications of significant commercially viable hydrocarbon deposits in parts of Northern Kenya already discovered.
Fourthly, it proposes for the financing of strategic energy reserves by the Government and private sector, equivalent to 90 days demand in the medium to long term.
Lastly, it proposes for the strengthening of regional and international cooperation to promote data and information exchange on oil exploration.
3.1.2.3. Renewable Energy
In order to encourage the wider adoption and use of renewable energy technologies and thereby enhance their role in the country’s energy supply matrix, the sessional paper proposes that Government will design incentive packages to promote private sector investments in renewable energy and other off-grid generation. Also, Government will provide requisite support for research and development in emerging technologies like co-generation and wind energy generation. Co-generation in the country’s sugar belt will be promoted through an attractive bulk tariff regime that recognizes the need to reduce oil based thermal generation to tap the current potential estimated at 300 MW of electricity.

21Situational Analysis of Energy Industry, Policy and Strategy for Kenya
3.1.3. Energy Act of 2006 The Energy Act of 2006, as already stated above, consolidates all laws relating to the energy sector in Kenya, its basis is the Sessional Paper no. 4 of 2004 which provides for further liberalization of the energy sector that had started in 1994. The Act repeals the Electric Power Act of 1997 and the Petroleum Act. It further provides for the establishment of the ERC and the REA. The Act also outlines the functions and powers of the two bodies.
In addition, the Act also establishes the Energy Tribunal whose purpose is to hear appeals from decisions of the ERC. The institutional setup situates the two bodies, namely the ERC and the Tribunal as overall regulatory bodies independent of State influence. The two coordinate and advise the Ministry of Energy on policy and strategy.
Currently the review process is on-going with a view to strengthening the mandates of the existing institutions. The key reforms are the inclusion of the energy policy and integrated energy plan in the Act, together with the establishment of a National Energy Regulatory Commission headed by a Director-General; National Electricity and Renewable Energy Authority headed by a Chief Executive Officer; establishment of the National Energy Institute, Energy Efficiency and Conservation Agency and a Nuclear Electricity Corporation. The review also incorporates coal regulations. The bill repeals the Energy Act of 2006, Geothermal Resources Act and Petroleum (exploration and production) Act.
3.1.4. Rural Electrification Master PlanThe Rural Electrification Master plan is a rolling plan for the electrification of rural areas through the rural electrification program. It is updated on an annual basis in order to respond to the most urgent needs of rural populations regarding electricity connectivity. Development and review of the master plan involves stakeholder participation in the annual review exercises. The main agency responsible for this is the Rural Electrification Authority (REA) which was established by the Energy Act of 2006, and operationalized in 2007, its sole mandate is to accelerate rural electrification.
The REA strategic plan outlines various objectives towards achieving its goals, as highlighted below:• PhaseI2008-2012:ConnectallPublicFacilities
- Connect 1 Million Customers- Increase connectivity from about 12% to 22%- Increase access to 100% (Access means households within 1.2km of M.V/L.V line while connectivity is
the actual connection to electricity)• PhaseII2013-2022:ConnectCustomers(increaseconnectivityfrom22%to65%)• PhaseIII2022-2030:ConnectCustomers(increaseconnectivityfrom65%to100%)
Table 3.4.1.: Public facilities electrified as of June 2011
Facility No of Facility electrified from
73-03/04
No of Facility electrified from
03/04- 10/11
Total electrified To be electrified 10/11-12/13
TOTAL
Trading centers 1,096 5,783 6,879 3,371 10,250
Public secondary schools 285 4,163 4,448 2,478 6,926
Health centers 348 2,082 2,430 1,516 3,946
TOTAL 1,729 12,028 13,757 7,365 21,122
Level of electrification 4% 10% 18% 22%
Access level 15% 70% 100%
Funds required to electrify the remaining facilities: KES 25 billion (USD 250 million)
Funds committed: KES 17 billion (USD 170 million). Balance: KES 8 billion (USD 80 million) Source: REA 2011
The main funding sources for REA projects is the government of Kenya at 80% and Development Partner support at 20% as highlighted in the table below.

22 Situational Analysis of Energy Industry, Policy and Strategy for Kenya
Table 3.4.2.: Funding for Rural Electrification Projects
Funding (KES million) Share
73/74 - 02/03 03/04 - 10/100 TOTAL
Internal sources 4,271 31,475 35,746 80%
External sources 2,994 5,883 8,877 20%
TOTAL 7,265 37, 358 44,623 100%Source: REA 2011
REA implements rural electrification projects through either one of the following:1. Grid Extension: expanding the national grid to widen coverage;2. Off Grid Supply: establishing electricity supply to installations that are off the national grid;3. Isolated Diesel Stations; and4. Installation of solar photovoltaic system (PV), Wind and Bio gas systems in public institutions.
Once REA completes its projects, it hand them over to KPLC for operation and maintenance based on a Service Level Agreement (SLA). However the projects continue to remain the property of REA, and in this case REA does not pay KPLC operation and maintenance costs of the projects as this is recovered through the electricity retail tariff.
3.1.5. Feed-in Tariff (FiT) PolicyIn 2010, the Kenyan Government published new Feed-in-tariffs (FiT) to provide Investment security to renewable electricity generators, reduce administrative and transaction costs and encourage private investors in establishment of Independent Power Production (IPPs). The current FiT modifies the first tariffs of 2008, and now includes geothermal, solar and bio gas generated electricity. These tariffs apply to grid-connected plants and are valid for a 20-year period from the beginning of the Power Purchasing Agreement (PPA), with approval of the PPAs granted by the ERC.
The FiT Policy further guarantees the PPA with the main power utility KPLC, proposals are received and processed for all categories with the incentive for bigger projects being a favourable tariff structure to both the investor and KPLC.
Table 3.5. : Tariff as per the PiT policy
Renewable source Power plant capacity Period of time Maximumfeed-in tariff level in USD/kWh
Firm Non-firm
Geothermal < 70 MW 20 years 0.085 N/A
Wind 0.5 MW – 100 MW 0.12
Biomass 0.5 MW – 100 MW 0.08 0.06
Small Hydro power 0.5 MW – 0.99 MW1 MW – 5 MW5.1 MW – 10 MW
0.120.100.08
0.100.080.06
Bio gas 0.5 MW – 40 MW 0.08 0.06
Solar 0.5 MW – 10 MW 0.20 0.10Source: MOE, 2013
Grid systems operators have to guarantee connection and priority purchase, transmission and distribution for electricity from renewable sources. Further each project must complete a mandatory feasibility assessment conducted by the Ministry of Energy to determine financial viability.
The main challenges the policy faces is that growth in installed capacity is not matching demand, mainly due to delays in implementation. Secondly, the strict requirement by lenders for payment guarantees further slows down the investments. Other challenges such as frequent weather variability from hydrological sources;

23Situational Analysis of Energy Industry, Policy and Strategy for Kenya
inadequate human capacity; community compensation and benefit sharing as well as national and county government revenue sharing; amongst others continue to hinder the fast growth of investments.
To address some of the challenges, the government has put in place a number of incentives in the policy, these are:1. Waiver of duty on power generation equipment imported into the country;2. Government offering letters of Comfort to IPPs in order to facilitate securing of funding for Operators;3. Periodic resource assessment by the government and conducting of feasibility studies for availing to the
private sector; and 4. Provision of tax holidays to attract investments in renewable energy.
3.2. Institutional Set up
Policy Making Institutions
3.2.1. Ministry of Energy and PetroliumThe Ministry of Energy and Petroleum is responsible for overall policy coordination and development in the Energy sector in Kenya. Its responsible for setting policy upon receipt of advise from the ERC and the Energy Tribunal.
3.2.2.Energy TribunalThe Energy Tribunal is established under the Energy Act of 2006, its main function is to hear appeals from decisions made by the ERC.
3.2.3.Energy Regulatory CommissionThe Electricity Regulatory Board (ERB) is an autonomous, independent sub-sector regulator, established in 1998 under the Electric Power Act to, inter alia, set, review and adjust consumer tariffs, approve power purchase agreements, promote competition in the sub-sector where feasible, resolve consumer complaints and enforce environmental, health and, safety regulations.
Implementing Institutions: Electricity Sub-sector
3.2.4. Generation
KenGenKenGen, a 100% state owned company, and KPLC in which state interest stands at 51% of the equity are the principal players in the power sub-sector. KPLC has a virtual monopoly in power transmission and distribution. Furthermore, KPLC as the only licensed Public Electricity Supplier has energy purchase contracts with IPPs and KenGen. KenGen accounts for about 82.1% of the total installed capacity, the private sector for about 15.2%, imports for about 2.4% and the Government under the Rural Electrification Programme for less than 1%. The two parastatals: KenGen and KPLC, have the responsibility of raising funds needed for system expansion with and without state guarantees.
GDCThe Geothermal Development Corporation (GDC) is a State Owned Enterprise with the mandate to fast track development of geothermal resources in the country. GDC was established by the Energy Act of 2006.Its specific mandate is:
GDC’s Mandate is: To promote rapid development of geothermal resources in Kenya through surface exploration and drilling for steam.• Toavailsteamtopowerplantdevelopersforelectricitygeneration.• Tomanagethegeothermalreservoirs-toensureconstantsupplyofsteamforpowergeneration.• Topromotealternativeusesofgeothermalresourcesotherthanelectricitygeneration.• Theseincludegreenhouseheating,dryingofgrains,pasteurizingmilk,coolingandheatingofrooms,among
others.

24 Situational Analysis of Energy Industry, Policy and Strategy for Kenya
IPPsThe involvement of the private sector in commercial power generation is a recent development since power generation was only liberalised in 1997. Four IPPs with a combined installed capacity of 187 MW are currently in operation. The role of the private sector is expected to grow over time in power generation, distribution and supply.
3.2.5. Transmission and Distribution
Kenya Power and Lighting CompanyDespite the electricity tariff reforms and organizational restructuring, KPLC, which is the sole distributor of commercial electricity, has continued to manifest weak financial performance, which has impeded access to domestic and international money markets for the needed system reinforcement and expansion. Further more, such performance has largely influenced the demand for and degree of onerous payment security guarantees from lenders and IPPs, further aggravating the already weak financial situation of KPLC. There is therefore need to undertake further reforms to improve KPLC’s performance and create an appropriate power market structure capable of attracting both domestic and foreign investments, at competitive costs.
Kenya Electricity Transmission CompanyKenya Electricity Transmission Company (KETRACO) is a State Owned Corporation that was established to develop new high voltage electricity transmission infratsructure that will form the backbone of the National Transmission Grid, in line with Kenya Vision 2030. It is involved in the planning, designing, building, and maintaining electricity transmission lines and associated substations.
Rural Electrification AuthorityThe Rural Electrification Authority was established by the Energy Act of 2006 with the mandate to accelerate the pace of rural electrification in the country, in order to promote sustainable socio-economic development.
Implementing Institutions: Petroleum Sub-sector
Kenya Petroleum Refineries LtdDirect Government involvement in the petroleum industry is in the oil refinery where it co-owns the Kenya Petroleum Refineries Ltd (KPRL) with three private companies (Shell, BP Petroleum and Caltex) on a 50-50 % equity basis and in oil storage facilities at Kipevu, capable of holding 1.5 million barrels. The storage facilities are available to all licensed importers at a fee.
Kenya Pipeline CompanyThe Government through the Kenya Pipeline Company (KPC), in which it has 100% equity, owns a petroleum pipeline that runs from Mombasa to Nairobi and western Kenya with terminals in Nakuru, Eldoret and Kisumu.
National Oil Corporation of KenyaThe Government is also the sole owner of the National Oil Corporation of Kenya (NOCK), which is involved in oil supply and distribution. NOCK also undertakes oil exploration on behalf of the Government.
NOCK, on the other hand has seen its market share decline from about 2% in 2000 to about 0.6% in 2003 and has thus failed to live to the original Government objective of using the company to regulate petroleum market prices through competition, following the deregulation of the industry in 1994.
Private MarketersThe private sector has an extensive network of distribution and marketing outlets in different parts of the country and accounts for about 99.4% of the total market sales of petroleum fuels. Seven oil companies, Shell, British Petrolium (BP), Total, Mobil, Kenol, Kobil and Caltex account for about 85% of the total sales and the balance of 15% by NOCK and several small companies. Collectively, the oil companies have installed about 1000 filling and service stations countrywide.
25Situational Analysis of Energy Industry, Policy and Strategy for Kenya
Energy Supply and Demand in Kenya
4
Kenyan consumption of energy is largely dominated by biomass (68%), followed by petroleum product (21%) and electricity (9%), the remaining 1% consisting of solar and other form of energy. Wood fuel and charcoal are the main biomass sources of energy and are mainly used in rural areas where it is estimated that 80% of the population of Kenya relies on this kind of energy. On the other hand, imported petroleum and electricity are the two principal components of the domestic energy market in Kenya, and consequently directed to a larger extent toward urban areas, supplying both households and businesses.
In 2012, the total Kenyan consumption of energy amounted 4,117 thousand tonnes of oil equivalent (ttoe), down 3.4% on the previous year, consumption of liquid fuels accounted for 83.2%, that of Hydro and Geothermal Energy (H&GE) and coke and coal for 11.6% and 5.1% respectively (Figure 1), which exhibits a clear preponderance of liquid fuels as a source of energy. This distribution remained relatively stable over the period 1998-2012, liquid fuels having always been overwhelmingly dominating. Over this period, the total consumption increased by 58% with coal and coke experiencing the highest growth (183%), followed by liquid fuels (56%) and H&GE (43.4%). Note that the consumption of liquid fuels is mainly supplied from importation of crude oil and from local production of petroleum. The quantity of petroleum exported has kept increasing over the 1998-2012 period to account for 73.9% of the total consumption of liquid fuels in 2012. Imports of crude oil followed an opposite trend as it share dropped from 82.8% of the total liquid fuels consumption in 1998 to 24.2% in 2012.
Petroleum and electricity, the two main components of the formal energy market account for almost the whole energy infrastructure in Kenya. The majority of the current public investment in energy pertains the electricity sector with the building of new generation facilities and the expansion of the transmission network. Although the current state of power production principally relies on hydrogenation, the better efficiency and the numerous sites suitable for geothermal generation are likely to change this balance of power in a close future. Moreover, exploration of subsoil yielded to the discovery of coal deposits, of which the exploitation would modify the current energy mix significantly. Despite several waves of exploration aiming at finding hydrocarbon over the last fifty years, Kenya is not yet an oil and gas producing economy. The only oil infrastructures of the country comprise a 70,000 bbl/d refinery in Mombasa and a pipeline transporting oil from Mombasa to the South-Western part of the country via Nairobi. However, several projects of new oil facilities are under study following the recent oil discovery.
4.1. Biomass
Biomass corresponds to all the materials used as energy sources which are derived from plant, vegetation or industrial or agricultural waste. It constitutes the main source of primary energy in Kenya as it accounts for about 68% of the total energy use. According to the last survey carried out by the Kenyan government in 2002, 34.3 million of tonnes of biomass was consumed annually, of which 15.1 million made of fuelwood (firewood) and 16.1 million made of wood for charcoal, outlining the clear domination of woodfuels as the share of the total biomass. The large quantity of wood require to satisfy the demand led to an unsustainable exploitation of forests and woodlands, calling for the establishment of a proper afforestation policy aiming at maintaining a constant forest coverage. Indeed, the current resources of Kenya only enable to supply 16 million of tonnes of biomass when the demand is estimated to 40.5 million (NEMA: National Environment Management). However, it should be noted that drawing a precise picture of the consumption of biomass in Kenya is made quite difficult since most of the process, from tree cutting to trading in urban areas, is operated in the informal sector.(Biomass Energy Use in Kenya, IIED, 2010)

26 Situational Analysis of Energy Industry, Policy and Strategy for Kenya
4.1.1. Fuelwood and CharcoalFuelwood and charcoal are the principal source of energy in Kenya among rural and poor urban households, which mainly use it for cooking and heating. It is also of prior importance for small-scale rural industries that do not have access to other kind of energy. Most of the supply of woodfuel comes from farmlands as they provide 84% of the total woodfuel requirement (NEMA, 2004).
In terms of consumption, households are the biggest consumers of wood energy with 6,5 tonnes per household in 2000. Table 5 presents the figures of consumption for a range of energy types.
Table 5: Annual consumption of various energy types (2000)
Firewood (tonnes/yr)
Wood for Charcoal
(tonnes/yr)
Wood Wastes
(tonnes/yr)
Farm Residue
(tonnes/yr)
Kerosene (litres/yr)
LPG (kg/yr) Electricity (Kwh/yr)
Rural Household 14,065,004 7,624,935 136,459 2,649,981 172,761,463 1,406,270 93,376,810
Urban Household 358,709 6,020,663 83,863 12,832 150,707,171 16,883,884 723,013,990
Cottage Industry 467,145 2,860,900 2,142,950 7,021,875 353,558,397
TOTAL 14,890,858 16,506,498 220,321 2,662,813 325,611,584 25,312,028 1,169,949,197Source: MOE; 2002 report
Total consumption of wood products amounted 31,617,677 tonnes in 2000 with firewood, charcoal and wood wastes accounting for 47%, 52% and 1% of the total respectively. Rural households consumed 94% of the total production of firewood. This results from the easier access of rural households to woodlands and forests, and to the fact that firewood is more suited for rural areas. Consumption of charcoal is much more balanced between rural and urban households (46% against 36%). Indeed, charcoal remains the cheapest cooking fuel available in urban areas and its transportation to cities and towns is much easier than that of firewood. Hence, it is used by most of the low-income urban households. Small-scaled rural cottage industries are also non-negligible consumers of charcoal with 3,328,045 tonnes of woodfuels consumed. Restaurants and kiosk are the principal users of this kind of energy with about 75% of the total industries consumption. The other industries relying and fuelwood and charcoal are making, tobacco curing, fish smoking, jaggaries, bakeries and the tea industry.
One of the main challenges encountered is the wide gap between demand and sustainable supply. Indeed, taking the current consumption habits of Kenyans regarding biomass lead to a deficit in wood energy, which might durably harm the forest coverage and provoke soil erosion and land degradation. Table 6 shows the projection of the demand and supply of biomass. The deficit, mainly due to the rise in population, is projected to increase up to 63.4% in 2020 if nothing is done to reverse the trend.
Fuelwood and charcoal industry also suffer from very low adoption of technologies, mainly because of a lack of capital to invest in more effective production means (ActionAid). The charcoal production process is especially inefficient as it is estimated that 10kg of wood are required to produce 1kg of charcoal (Kirubi et al, 2000). Moreover, an additional 20% loss arises during transportation, which raise CO2 emissions resulting from charcoal production from 6 to 13 times higher than those resulting from firewood combustion (Bailis et al, 2003).
Table 6: Projection of biomass consumption and supply
2000 2005 2010 2015 2020
Population 28,686,607 32,694,444 36,810,671 40,941,673 44,981,767
Consumption (tonnes/yr) 35,119,615 39,896,632 44,599,347 49,164,960 53,416,327
Sustainable Supply (tonnes/yr) 15,024,510 15,488,936 16,634,550 17,984,406 19,559,738
Deficit (tonnes/yr) -20,095,105 -24,407,696 -27,964,797 -31,180,555 -33,856,589
Deficit (%) -57.2 -61.2 -62.7 -63.4 -63.4
Deficit (tonnes/person) -0.701 -0.747 -0.760 -0.762 -0.753Source: MOE, 2002 report

27Situational Analysis of Energy Industry, Policy and Strategy for Kenya
Finally, the fuelwood and charcoal production sector is mainly informal, despite the fact it generates up to 20 times more employment than the other energy sectors (ActionAid), which represents an important loss in tax raising for the Kenyan government. Different strategies therefore could be implemented to secure this sector, among others:
• Developingplantationareasdevotedtowoodfuelproductionwithappropriatefastgrowingtreespecies.• Integrating woodfuel into the farmland system. However, themain hindrances of this strategy are the
numerous small agricultural plots in Kenya which are not suitable for such growing and the resulting competition with agricultural crop.
• Improvingthemanagementofwoodlandsandfarmlandsinordertoensureasustainablesystem.• Improvingthetechnologybyreplacingcurrent10%efficiencycharcoalkilnsby25%efficiencykilns.This
would lead to a significant decrease in the quantity of wood allocated to charcoal production. Improving and strengthening the wood energy institutional framework by creating technical agency empowered to regulate to sector.
4.1.2. BiofuelBiofuels, namely bio-ethanol and bio-diesel, are of particular interest as substitute for petroleum. Given Kenya’s current spending in oil, around 25% of its total imports bill (Stock-taking and gap analysis report, MOE, 2013), any alternative energy enabling to reduce its oil importation would be beneficial to the economy.
The bio-ethanol industry started in the early 1980s with the gasohol program, but the latter was abandoned in the 1990s. The main use of ethanol as an energy source is to form E10 fuel; that is, when ethanol is blended with petrol at 10%. Indeed, the advantage of this blend is that it does not require any modification of engines to be properly used as fuel. The present-day Kenyan ethanol industry comprised two main producers, Muhoroni Agrochemical & Food Company and Spectre International, which, together, have capacity of 125,000 liters per day (lpd). However, the current supply of molasses, the only feedstock available in Kenya, does not enables to exceed a 60,000lpd production. Fulfilling the entire capacity would require a better productivity of the sugar cane industry which is the major provider of molasses.
Moreover, the bio-ethanol industry’s competitiveness is negatively impacted by poor planning and strategy, and by aging infrastructure. That notwithstanding, the production model of the new Mumias Sugar Company plants that plans to integrate sugar, ethanol and power production together seems much more sustainable and efficient. The fact that Spectre International intends to modernise its production facility in order to raise its capacity to 230,000lpd is another sign that the sector is going to expand over the next few years.
Bio-diesel is a very good substitute for petroleum-based diesel. It is derived from bearing plants such as coconut, cottonseed, croton or jatropha. Bio-diesel consumption in Kenya is currently inexistent, principally because most of the motor vehicles are petrol-powered. Yet, several projects have flourished, most of them based on jatropha as the principal feedstock.
4.1.3. BiogasEven if biogas is not a large-scale used energy, the Kenyan government together with Non Governmental organisations (NGOs), private investors and international donors have pushed for the development of this type of energy since the 1980s. Biogas presents the advantage of being generated from agro-processing municipal waste or cut flowers, and might be a good opportunity in term of power generation. Current installed capacity using biogas for power generation comprise the Dagoreti biogas plant in Nairobi (30kW) and the Kilifi Sisal Plantation/Dairy (15kW). Finally, potential capacity derived from floriculture is estimated to amount 20MW and that from sisal industry 10MW.
4.2. Oil and Gas
Petroleum is the main fossil fuel energy used in Kenya. Indeed, around 25% of total Kenyan imports consist of petroleum product, both crude oil and already refined products. Currently, Kenya imports 100% of its petroleum needs, but economically exploitable oil deposit have been discovered in the Rift Valley region and should turn Kenya into an oil producer country within the next few years. Exploration for hydrocarbon is still under

28 Situational Analysis of Energy Industry, Policy and Strategy for Kenya
progress in most of the exploration blocks, thus the proven reserves of oil of Kenya could increase in a close future. Although some coal deposits have been discovered in Eastern Kenya extraction has not started yet. The situation is similar for natural gas as, if some blocks around the offshore region of Lamu present characteristics which might led to gas discovery, current Kenya gas proven reserve are still inexistent. As a result, Kenya has to import the totality of its consumption of fossil fuel.
4.2.1. Petroleum and gasPetroleum composes 21% of Kenya’s primary energy sources, ranking 2nd just behind biomass (68%). Exploration of the Kenyan subsoil for hydrocarbons is still under progress and, even tough oil deposits have been discovered recently, no extraction has yet arising. Consequently, current consumption of petroleum fully depends on imports. Kenya imports both crude and refined oil, the refining process being carried out in Mombasa by the Kenyan Petroleum Refineries Limited (KPRL). Given its current refining capacity, KPRL is able to supply about 45% of the Kenyan market, the balance 55% consequently consisting in imports of already refined Petroleum products.
The types of crude oil imported by Kenya are the Murban crude from Abu Dhabi and, to a lower extent, the Arabian medium from Saudi Arabia. Note that Abu Dhabi’s oil presents the advantage of yielding much more diesel, petrol and kerosene than fuel oil, which is much more in accordance with Kenyan economy’s needs. Regarding gas, the current consumption is inexistent; several projects involving building facilities to import liquefied natural gas (LNG) have been developed. The current exploration process in the Lamu region might also lead to the discovery of exploitable gas deposits.
4.3. Import and Exports
Table 7 shows Kenyan imports of crude petroleum, petroleum fuel, lubricating oils and lubricating grease. Total imports increased from 3585.9 thousand of tonnes (tton) over the period of interest, which corresponds to a yearly 1% growth rate. Kenyan population growth rate lying around 2.5% over the last decade, the per capita consumption of petroleum has thus been declining over the years. Notable falls in petroleum products arose in 2002, 2005 and 2010 to a lower extent. These sizable declines probably originate from the political context as these three years hosted a presidential election, a referendum for a new constitution and the entry into force of the new constitution respectively. Indeed, over the last decade, election or assimilated periods often coincided with violence among the population and political uncertainty, which are likely to negatively impact trade flows as Kenyan’s partners prefer waiting before the situation goes back to normal.
Crude oil and petroleum fuels are the main type of petroleum imports accounting for more than 90% of the total imports. If crude petroleum imports were higher than petroleum fuels once during the first half of the 2000s, they have kept declining over the last decade to be outstripped by petroleum fuel in 2006. This change of dominant position directly results from the decreasing efficiency at producing of the only Kenyan refinery. Indeed, Mombasa refinery exhibits aging and outdated facilities, and it became cheaper to import already refined products than to keep refining imported crude oil.
Crude oil intake at the refinery exhibited a sizable 43% drop between 2011 and 2012, decreasing from 1,742.2tton to 992.1tton over this period. This significant lessening is attributed to a change in the tolling/leasing patterns of KPRL, which is now able to procure crude oil, process and sell refined petroleum products to oil marketing companies. Excluding the year 2012, crude oil intake fluctuated over the period 1998 to 2011 with value ranging between 1,492.1tton and 2,012.8tton to average 1,625.8tton. Even if 2012 performances are of conjectural type, whether future crude oil intakes will go back to 2011 level will largely depend on the decision of the government to upgrade it or transform it into a stocking hub for petroleum products. Figures from Table 8, which present the different petroleum products produced in Kenya, are in line with the above finding as the production of the major outputs, namely motor gasoline, illuminating kerosene, light diesel oil and fuel, declined by 37% to 60%.
Total exports of petroleum encompass domestic and re-export, which both fluctuated to a great extent over the period 2003-2012 as it can be seen in Table 9. Domestic exports increased from 2.3tton in 2003 to 216.1tton in 2007 (which corresponds to 930% increase), and re-exports followed an opposite trend as they dropped

29Situational Analysis of Energy Industry, Policy and Strategy for Kenya
from 1313.6tton in 2003 to 18tton in 2007 before rising again to attain 128.7tton in 2012. Overall exports decreased by 86% over the period 2003-2012 from 1,315.9tton to 184.6tton. This sizable declined is the result of new administration measures taken by the Kenyan Revenue regarding petroleum products’ importation, exportation, re-exportation and transit.
Table 7: Imports of petroleum product (‘000 tonnes)1998 1999 2000 2001 2002 2003 2004 2005 2006 2007 2008 2009 2010 2011 2012
Crude Petroleum 2,157.7 2,139.3 2,452.3 1,965.6 1,493.4 1,382.6 2,043.8 1,774 1,643.2 1,687.7 1,610.1 1,551.5 1,772.1 1,772.1 997
Petroleum Fuels 1,387.8 1,250.9 874.9 1,208.3 1,023.5 1,819.9 1,491.7 1,130.9 1,402.7 1,999.9 1,704.5 2,259 2,071.9 2,235.6 2,803.4
Lubricating Oils 38.2 41.5 40 29.7 33.6 23.8 11.9 0.4 2.6 0 12.4 17 3 0 0.1
Lubricating Greases 2.2 0.8 0.9 0.7 11.7 5.6 29.7 66.8 124.4 93.2 118.6 265 218.2 278 342
TOTAL 3,585.9 3,432.5 3,3368.1 3,204.3 2,562.2 3,231.9 3,577.1 2,972.1 3,172.9 3691.8 3,523.2 4,151.1 3,844.6 4,285.7 4,142.5
Source: Economic Survey, variousSource: Economic Survey, various
Table 8.: Finished petroleum product (‘000 tonnes)1998 1999 2000 2001 2002 2003 2004 2005 2006 2007 2008 2009 2010 2011 2012
Liquified Petroleum gas 29 27.1 34 28.1 24.1 14 16.9 28.5 30.1 33.2 32.7 29.4 29.2 27.6 17.1
Motor gasoline premium 158.9 157.9 201.6 154.4 150.7 149 205.2 175.2 127.1 156 134.9 109.5 153.1 151.5 111.2
Motor gasoline regular 137.4 127.4 133.2 119 102.1 79.8 70.3 61.8 51.4 50.7 46.7 47.7 46.3 36.9 5.9
Illuminative kerosene and jet/turbo fuel 355.1 337.4 400.4 320 272.9 279 306.7 325.6 343.7 338.5 316.9 359.3 349.3 393.3 224.4
Light diesel oil 401.2 406 482.2 406.8 379.1 301.4 361 344 334.2 364 350 371.9 367.3 402.8 223
Heavy and Marine diesel oil 27.6 25.1 28.6 29.6 25.4 40.7 26.3 22.8 33.3 32.5 24 17.8 25.8 26.6 16.4
Fuel oil 499.1 507.2 615.8 534.6 533.1 534.4 619.9 589.5 596.2 534.2 515.2 479.9 449.6 520 299.5
Bitumen 19.8 20.3 21.5 22.3 16.4 10.7 6.5 20.4 17.4 16.6 12.4 0.3 15.9 -5.4 0
Additives -0.6 -0.6 -0.8 -0.6 -0.4 -0.4 -0.5 -3.8 24.3 40.5 58.6 78.8 82.3 115.2 46.7
Refinery usage (fuel and losses) 94.1 90.2 96.3 81.3 77.4 64.4 80.6 81.3 93.3 96.5 91.3 92.4 101.4 83.7 48
TOTAL 1,721.6 1,698 2,012.8 1,695.5 1,580.8 1,492 1,720.9 1,645.3 1,651 1,662.7 1,582.7 1,605 1,602.2 1,752.2 992.2
Source: Economic Survey, various
Table 9 : Domestic and re-export of petroleum (‘000 tonnes)2003 2004 2005 2006 2007 2008 2009 2010 2011 2012
Domestic 2.3 37.4 174.2 170.2 216.1 99.8 97.4 95.1 125.3 55.9
Re-Export 1313.6 1455.8 1116.1 323 18 76 113.4 121.3 115.7 128.7
Source: Economic Survey, various

30 Situational Analysis of Energy Industry, Policy and Strategy for Kenya
Table 10: Petroleum product demand (‘000 tonnes)
1998 1999 2000 2001 2002 2003 2004 2005 2006 2007 2008 2009 2010 2011 2012
Liquified Petroleum gas 31.3 32.2 33.4 35.6 40.5 40.9 41.7 49.4 64.6 77.4 84.4 74.6 87.8 91.6 93.6
Motor Spirit 395.8 384.6 365.7 374.3 365.9 327.9 326.4 333.7 358.2 367.1 381.3 461.7 597.2 562.1 618.5
Aviation Spirit 3.2 2.5 2.2 2.4 1.8 1.5 1.8 2 2 2.2 2.5 1.4 2.5 2.8 1.8
Jet/turbo fuel 419.4 418.7 432.2 417.3 470.2 487.3 521.1 559.1 593.3 638.5 559.2 570.9 539.6 670.6 671
Illuminative kerosene 318.2 406.8 283.7 306.1 273.6 190 236.1 307 279.2 265.2 244.7 332.8 316 269.6 309
Light diesel oil 607.5 601.7 712.8 663.7 627.3 649.6 789.4 892.4 1,035.6 1,116.5 1,141.1 1,416.1 1,517.3 1,461.8 1,486.3
Heavy diesel 26.4 25.7 28.1 27.7 28 24.4 25.2 25.5 40.7 40.1 30 29.3 25 27.6 20.8
Fuel oil 397.3 439.4 490 558.1 498.7 407 432.8 546.7 664.6 614.8 690 729.4 680.3 771.8 437
TOTAL 2,199.1 2,311.6 2,448.1 2,385.2 2,306 2,128.6 2,374.5 2,715.8 3,038.2 3,121.8 3,133.2 3,610.8 3,765.7 3,857.9 3,638
Source: Economic Survey, various
4.4. Consumption
The Kenyan consumption of petroleum fuels increased by 65.4% over the period 1998-2012 from 2,199.1 tton to 3,638 tton, which represent an annual rise of 3.7%. Table 10 shows the consumption of various petroleum products over the period 1998-2012. Motor spirit, Jet/turbo fuel, illuminating kerosene and light diesel are the most consumed products. To the exception of kerosene, the main use of these types of fuel is to power engines, either for motor vehicle or for aircraft. Motor spirit, jet/turbo fuel and light diesel oil experience growths of 56%, 60% and 145%. Conversely, kerosene consumption reduced by 3% between 1998 and 2012. Kerosene is an important source of energy for cooking and heating, especially among low-middle class households, as well as for powering old vehicles such as tractors. The decreasing use of kerosene might be due to the substitution of fuel by electricity as electricity access expanded or to an increasing use in biomass which is known to be cheaper than kerosene.
According to Figure 3, the consumption stagnated from 1998 to 2003 and then kept increasing significantly until 2011. The main consumers of petroleum fuels are retail pump outlets and road transport; the civil aviation; and industrial, commercial and affiliated consumers, which accounted for 52.6%, 18.9% and 14.6% of the total consumption respectively over the period 1998-2012. It should be worth noting that, while the quantity of petroleum fuels used by the aviation and the industrial and commercial sectors “only” rose by 51.2% and 69.6% respectively over the period of interest, which remains close to the increase of the total consumption (65.4%), retail pump outlets and road transport grew by 100.3% over the same period. The fact that retail pump outlets and road transportation sector consolidated its dominant position as the first petroleum consumer is likely to stem from the automobile boom which arose in the country (the number of registered vehicles increased by 142% between 2003 and 2011). Indeed 2003 saw a liberalization of consumer credits which many individual used to buy cars. In 2012, the share of petroleum devoted to transportation exceeded 60% of the total petroleum consumption. On the opposite, the share of petroleum feeding electricity generation sizably decreased between 2011 and 2012, which might be a consequence of the switch in electricity strategy from hydro and thermal to geothermal and wind generation.

31Situational Analysis of Energy Industry, Policy and Strategy for Kenya
Figure 3: Consumption of petroleum by consumer type (‘000 tonnes)
Source: Economic Survey, various
4.5. Prices
Table 11: Kenyan average retail price (constant 2002 KES)
2005 2006 2007 2008 2009 2010 2011 2012
Motor Spirit Premium 53.13 60.76 61.61 52.91 48.39 55.24 60.48 53.05
Motor Spirit Regular 56.14 60.50 60.33 53.28 48.74 0.00 0.00 0.00
Gas oil 47.86 52.12 53.92 47.09 43.07 50.30 56.45 49.91
Illuminative kerosene 43.57 43.93 44.34 39.33 35.98 42.80 46.24 40.85
LPG 1,224.48 1,241.63 1,243.63 1,188.45 1,140.82 1,265.29 1,653.90 1,219.01
Source: Economic Survey, various
According to Table 11, illuminative kerosene is the cheapest fuel with a price of KES. 40.85/liter, followed in increasing order by gas oil (Ksh. 49.91/liter) and motor spirit (Ksh. 53.05/liter) in 2012. All these three fuels experience an import drop in price in 2009 decreasing by 8.5%. Liquefied Petroleum Gas (LPG) followed a different trend as it peaked in 2011 at Ksh. 1653.0/13kg tank before returning to its former level in 2012.
4.6. Oil and Gas Reserves
4.6.1. HistoryOil and gas exploration go back to the fifties when British Petroleum (BP) and Shell started investigating Lamu Basin’s subsoil. Several wells were drilled in 1960 but did not yield to the discovery of exploitable oil deposits, despite significant indications on the presence of hydrocarbon in the area. Various attempts arose up to 1990, however remained unsuccessful. In 1995, the results of a in-house survey initiated by National Oil that carried out an in-depth analysis of Lamu Basin’s geological and geophysical characteristics gave a new start to oil exploration. The government of Kenya then decided to subdivide the Lamu embayment into 10 blocks. Production Sharing Contracts having been signed by 2002 for 7 of them. Nowadays, Kenyan exploration areas are segmented into 46 blocks operated by 23 exploration companies.

32 Situational Analysis of Energy Industry, Policy and Strategy for Kenya
Oil and gas potential resources of Kenya are spread over four large sedimentary basins: Lamu, Anza, Mandera, and Tertiary Rift basins. These four basins are then further divided into exploration blocks as shown in Figure 4, below.
Figure 4: Kenya Exploration Blocks
Source: Economic Survey, various
4.6.2. Proven reservesSince 2000, the East African region has been benefiting from a renewal of interest by oil and gas companies as new discoveries of gas and oil reserves arose. Indeed, since Tanzania and Uganda happened to have proven reserves of natural gas of 230 and 500 billion cubic feet (bcf ) respectively, plus an additional 2.5 billion barrel (bb) of proven reserves of oil in Uganda, many energy experts inferred that Kenya’s subsoil is likely to contain large deposits of hydrocarbon. The fact that some zones in Kenya present similar geological and geophysical characteristics to those in Uganda and Tanzania further strengthened this idea.
In 2013, the Canadian Africa Oil Corp. announced having discovered gross contingent resources of 338 million of barrel (mb) in Northern basin, and the British Tuwoll Oil Plc. confirmed that South Lokichar basin’s reserves exceeded 300mb. Officially, the reserves to be extracted are supposed to consist of 540mb. Other exploration companies communicated about potential reserves in different zones, Pancontinental claimed prospective resources of 3.7 billion barrels (bb) of oil or 10.2 trillion cubic feet (bcf ) of gas in Lamu Basin, but the exploration process remains not advanced enough to make a clear picture of Kenyan hydrocarbon reserves. The numerous on-going exploration projects should however allow improving the knowledge of the true state of reserve of oil and gas in Kenya. Currently, even if Tuwoll Oil predicts that Kenya could start exporting by 2016, the International Monetary Fund (IMF) forecasts oil exploitation to start in 6 to 7 years.
33Situational Analysis of Energy Industry, Policy and Strategy for Kenya
4.6.3. ChallengesThe potential new rush to hydrocarbon in Kenya raises some concerns about the current Kenyan oil and gas legal and regulatory framework, and its ability at efficiently regulating and controlling extraction and exploitation. The oil and gas sector is still governed by the Petroleum Law of 1986, of which a revision is to be incorporated in the new energy bill, which is completed at 95% and should pass in the first quarter of 2014. Indeed, despite huge potential reserves of Natural gas, the current degree of progress of exploration is largely imbalanced toward oil to the detriment of gas, principally because the current legal framework governing the issuing of exploration contracts for gas remains too unclear.
The case of the mining industry should serve as a warning as 43 mining contracts have been suspended because of wrong behaviour of some mining companies, which shed light on the poor screening by the Kenyan mining authority when it comes to attribute permits. The issue of oil and gas revenues also needs to be addressed. The actual repartition provides 80% of oil and gas revenue to go to the National Government, 15% to the county government and the remaining 5% to the local communities. However, several incidents involving demonstration of local community already arose, most of the time to complain about the too low employment of local workers by oil companies.
Infrastructures are the other major challenge of oil and gas exploitation. The recent discoveries of hydrocarbon in Kenya were made offshore in the Lamu Bassin or in Northern Kenya in the Turkana region. However, none of these two zones possesses infrastructures enabling to refine and transport oil downstream to the markets. Indeed, the only refinery in Kenya is based in Mombassa, and the corresponding pipeline lies along the southern border from Mombasa to Eldoret (Figure 2), leaving the whole Northern part of the country devoid of any infrastructure. An important project of a 32-berth port in Lamu together with a pipeline connecting to South Sudan and Uganda is meant to solve this lack of infrastructure, but, assuming the project goes to its end, it will not be operational before several years. Human capital is also of concern since, even though Kenya has comparatively good engineers, most of them are not trained specifically to operate in the oil and gas sectors.
4.7. Coal
Coal used to be the world’s biggest source of energy in the 19th century and the beginning of the 20th century after oil production scaled up and took the lead. Coal has been the fastest growing energy source over the 21th century, mainly because of the high economic growth rates of the developing economies which are attracted by cheap price of coal compared to other energy sources. However, coal use presents the disadvantage of emitting relatively high quantity of CO2 (twice as large as that of natural gas-based electric generation in average) and consequently has significant adverse impact on air quality and climate change. Despite the fact efforts put in improving the carbon capture and storage (CCS) technology, which is the best solution to achieve zero-emission goal, many operating plants are still relying on ancient and less efficient facilities. In addition to electricity, coal is also use in liquid fuel, cement manufacturing and steel production.
Table 12: Coal and coke consumption (‘000 of oil equivalent)
98 99 00 01 02 03 04 05 06 07 08 09 10 11 12
Consumption 73.2 71.5 66.1 66.1 98.6 92.4 108 89.3 119.7 109.5 108.8 94.6 165.2 236.3 211.3Source: Economic Survey, various
Kenya has not yet integrated coal in its electricity generation strategy, and the current consumption of this energy source that amounted 211.3tton in 2012 (Table 12) therefore corresponds to other uses, mainly for heating and cooking or in the construction sector. However important economically viable coal deposits were discovered in Mui Basin and a 400 million of tonnes coal mine is about to be operated in a close future. In this context, two coal-based electricity generation plants with a capacity of 960MW are planned to be build by the year 2017. Exploration is still under progress in different counties of Kenya but it suffers from limited skills and expertise in core drilling, limited existing coal reserve data, poor infrastructure, lack of interest from investors, and from the absence of a clear legal framework regulating coal exploration and exploitation. As Kenya struggles to satisfy its electricity demand, additional installed capacity are welcome, especially when based on reliable sources such as coal. However, even if exploration of areas potentially suited to host coal is still
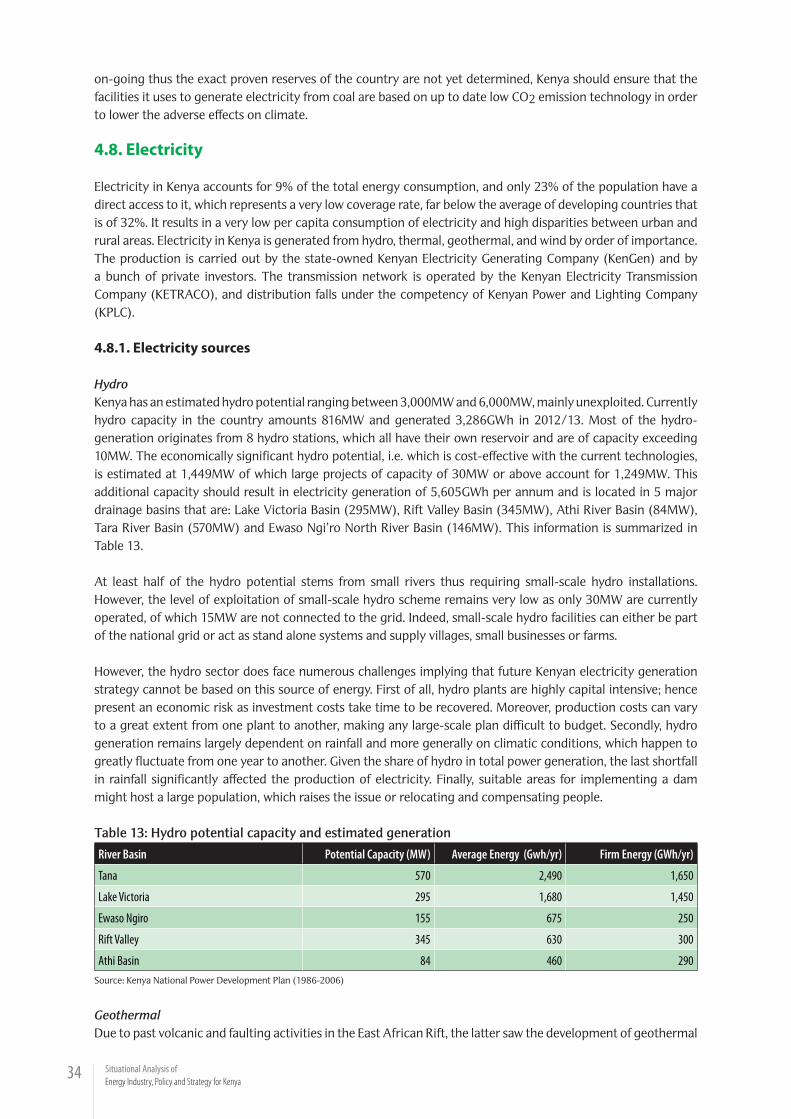
34 Situational Analysis of Energy Industry, Policy and Strategy for Kenya
on-going thus the exact proven reserves of the country are not yet determined, Kenya should ensure that the facilities it uses to generate electricity from coal are based on up to date low CO2 emission technology in order to lower the adverse effects on climate.
4.8. Electricity
Electricity in Kenya accounts for 9% of the total energy consumption, and only 23% of the population have a direct access to it, which represents a very low coverage rate, far below the average of developing countries that is of 32%. It results in a very low per capita consumption of electricity and high disparities between urban and rural areas. Electricity in Kenya is generated from hydro, thermal, geothermal, and wind by order of importance. The production is carried out by the state-owned Kenyan Electricity Generating Company (KenGen) and by a bunch of private investors. The transmission network is operated by the Kenyan Electricity Transmission Company (KETRACO), and distribution falls under the competency of Kenyan Power and Lighting Company (KPLC).
4.8.1. Electricity sources
HydroKenya has an estimated hydro potential ranging between 3,000MW and 6,000MW, mainly unexploited. Currently hydro capacity in the country amounts 816MW and generated 3,286GWh in 2012/13. Most of the hydro-generation originates from 8 hydro stations, which all have their own reservoir and are of capacity exceeding 10MW. The economically significant hydro potential, i.e. which is cost-effective with the current technologies, is estimated at 1,449MW of which large projects of capacity of 30MW or above account for 1,249MW. This additional capacity should result in electricity generation of 5,605GWh per annum and is located in 5 major drainage basins that are: Lake Victoria Basin (295MW), Rift Valley Basin (345MW), Athi River Basin (84MW), Tara River Basin (570MW) and Ewaso Ngi’ro North River Basin (146MW). This information is summarized in Table 13.
At least half of the hydro potential stems from small rivers thus requiring small-scale hydro installations. However, the level of exploitation of small-scale hydro scheme remains very low as only 30MW are currently operated, of which 15MW are not connected to the grid. Indeed, small-scale hydro facilities can either be part of the national grid or act as stand alone systems and supply villages, small businesses or farms.
However, the hydro sector does face numerous challenges implying that future Kenyan electricity generation strategy cannot be based on this source of energy. First of all, hydro plants are highly capital intensive; hence present an economic risk as investment costs take time to be recovered. Moreover, production costs can vary to a great extent from one plant to another, making any large-scale plan difficult to budget. Secondly, hydro generation remains largely dependent on rainfall and more generally on climatic conditions, which happen to greatly fluctuate from one year to another. Given the share of hydro in total power generation, the last shortfall in rainfall significantly affected the production of electricity. Finally, suitable areas for implementing a dam might host a large population, which raises the issue or relocating and compensating people.
Table 13: Hydro potential capacity and estimated generation
River Basin Potential Capacity (MW) Average Energy (Gwh/yr) Firm Energy (GWh/yr)
Tana 570 2,490 1,650
Lake Victoria 295 1,680 1,450
Ewaso Ngiro 155 675 250
Rift Valley 345 630 300
Athi Basin 84 460 290Source: Kenya National Power Development Plan (1986-2006)
GeothermalDue to past volcanic and faulting activities in the East African Rift, the latter saw the development of geothermal

35Situational Analysis of Energy Industry, Policy and Strategy for Kenya
systems, which represent an important source of energy for Kenya. 14 geothermal prospects have been identified across 3 regions for a potential ranging between 7,000MW and 1,000MW. Central Rift is estimated to host geothermal capacity of 1,800MW, South Rift of 2,450MW and North Rift of 3,450MW. Geothermal is currently the most promising source of renewable energy in Kenya as it is environmentally harmless, immune to adverse-effect of climate change, it has the highest capacity factor (95%) and the technology is fully mastered by Kenyan energy engineers. Consequently, the Government of Kenya, though the Geothermal Development Company (GDC) launched a Geothermal Development Plan aiming at installing a geothermal capacity of 1,120MW by 2018 expanding to 4,060MW by 2031.
WindAlthough wind energy is the most mature renewable energy in terms of commercial exploitation, its development in Kenya remains quite low. Currently, the 5.1MW wind farm in Ngong is the only installation relying on wind. However several projects carried by IPPs should raise the wind installed capacity to 610MW in a close future. Local production of small wind generators is in progress in Kenya, but the quantity of such systems currently operated remains marginal. A number of sites are highly suitable to host wind farms, Marsabit district, Sambaru, part of Laikipia, Meru North, Nyeri and Nyandarua, Lamu, offshore Malindi and Narok plateau among others. In total, 90000 square kilometres of land with wind speed superior to 6 meters per second (m/s) have been identified. Wind energy presents the advantage of being CO2 emission free, hence does not contribute to the global warming. Moreover, the most suitable areas for wind exploitation exhibit quite low level of population density, which represents advantages since large farms can be set up with a minimum of human disturbance, but, on the other hand, important capital investments in transmission lines need to be realized to connect these remote lands to the network. A precise estimate of the full potential of the wind-energy sector is yet to be established, but the government has already started several studies and survey that should provide some valuable information on the real potential of this industry. For instance, the Kenyan government has installed 54 wind data loggers across the country.
SolarBecause of its strategic geographic position, Kenya is particularly suited for solar energy exploitation with the whole Eastern part of the country having insolation levels of 5.5 to 10kWh/m2/day, the country average insolation lying between 4 and 6 kWh/m2/day (see Table 4 for solar energy availability). Solar energy main uses are drying, water heating or electricity generating via photovoltaic solar systems. About 200000 Photovoltaic (PV) solar systems are installed in Kenya with capacity of 10-20W for a total production of electricity of 9GWh a year. The power derived from PV installations mainly supplies telecommunication, cathodic protection of pipeline, lightening and water pumping.
Over the last few years the demand for PV system followed an increasing trend boosted by several governmental initiatives that principally targeted education and health institutions in arid and semi-arid areas. Consequently, the initial market demand for PV system grew from 500W in 2005 to an estimated 1MW peak currently, which represent a great opportunity for investors. Indeed, the 4 million of rural households of which most of them have no direct access to the national grid represent as many potential users of solar energy. Aware of the potential of such source of energy, the government issued two bills, the Energy (Solar water heating) Regulation 2012 and the Energy (Solar photovoltaic) Regulation 2012 to provide a clear legal framework to the solar energy sector and thus hastening its development. This comes in addition to the already existing tax incentives of zero import duty and zero VAT on renewable equipment.
4.8.2. Installed Capacity Generation of electricity in Kenya falls under the competency of KenGen, a state-own company, and of a bunch of private investors usually identified as independent power producers (IPPs).
KenGen was officially formed in 1998 from the re-naming of the former Kenya Power Company (KPC). It is in charge of all the public plants and facilities dedicated to electricity generation, which account for about 65% of the total installed capacity in Kenya. KenGen is the leader power producer in the country, producing 80% of the total electricity consumed in Kenya.

36 Situational Analysis of Energy Industry, Policy and Strategy for Kenya
The opening of the Kenyan electricity generation market to private investors arose in the early 1990’s, resulting from both a shifting trend of international donors toward private participation in infrastructures, and an aid embargo imposed to Kenya throughout the early and mid-1990s. The first contracts were signed in 1997 with Westmont and Iberafrica. In 2005, 7 IPPs operated in Kenya, accounting for 20% of the total generation of electricity. Currently, 6 private investors are involved in power generation in Kenya, namely Iberafrica, Tsavo, Or-power, Rabai, Imenti and Mumias. They produce electricity from hydro, thermal, geothermal and bagasse, and so participate in the diversification of power generation sources in the country.
Table 14 : installed and effective capacity
2008 2009 2010 2011 2012 2013
Installed Effective Installed Effective Installed Effective Installed Effective Installed Effective Installed Effective
Hydro 736.9 719.4 748.4 729.8 757.9 727.8 763.0 735.0 788.0 770.0 816.1 766.6
Thermal 444.7 419.0 447.9 421.7 510.6 493.9 627.1 548.8 688.1 663.5 694.8 635.7
Geothermal 128.0 128.0 172.0 158.0 198.0 189.0 198.0 189.0 209.0 198.0 250.2 244.9
Wind 0.4 0.4 0.4 0.4 5.1 5.1 5.3 4.3 5.3 5.1 5.3 5.1
KenGen 1,006 969.9 1,026.7 975.5 1,053.4 999.1 1,177.3 1,062.3 1,209.3 1,161.1 1,238.1 1,133.3
IPPs 145.0 143.0 180.3 178.3 346.5 346.5 347.0 347.0 351.0 357.0 391.2 386.7
Off-Grid 9 7.9 11.7 10.2 11.7 10.2 9.1 7.8 10.1 8.5 17.1 12.3
EPPs 150.0 146.0 150.0 146.0 60.0 60.0 60.0 60.0 120.0 120.0 120.0 120.0
TOTAL 1,310.0 1,266.8 1,368.7 1,309.9 1,471.6 1,515.8 1,593.4 1,477.1 1,690.4 1,636.6 1,766.4 1,652.3Source: KPLC
Table 14 above shows installed and effective capacity over the last 6 years. Kenyan installed capacity was of 1,765MW in June 2013 for an effective capacity of 1,652MW, which corresponds to a rate of effectiveness of 94%. KenGen is the main power producer in Kenya by operating 70% of the total capacity. Hydro is the most widespread power generation mean with installed and effective capacity of 816MW and 767MW respectively, accounting for 46% of the country’s total capacity. Then come thermal (258.9MW and 209.1MW) and geothermal (158MW and 153MW). Wind capacity remains marginal with only 5.3MW, as is off-Grid governmental capacity with 17MW. Overal IPPs’ installed capacity amounts 391MW for an effective capacity of 387MW and Emergency Power Producers (EPP) operate 120MW.
Between 2008 and 2013, total installed capacity increased by 35%, which correspond to a 6% annual growth rate. Among the three significant sources of energy, namely hydro, thermal and geothermal, it appears that the latter experience the highest growth as geothermal capacity nearly double (95% increase) over the period under review. This sizable expansion of the share of geothermal in the electricity mix is in line with the government energy strategy that aims at promoting reliable renewable energy sources. Thermal installed capacity rose by 56% and hydro by 11% over the same period. High capacity thermal projects are planned to be implemented by 2018, mainly relying on gas and coal combustible. Regarding hydro, the high investment cost required to build the infrastructure and the unreliability specific to this source of generation made it less appealing than the two other sources previously mentioned, even if hydro possess the highest rate of capacity effectiveness (96.5% against 93.4% and 95.9% for thermal and geothermal respectively).
On the electricity producers side, , KenGen installed capacity only increased by 23% over the period of interest, which is of much smaller magnitude than the increase of IPPs production capacity that rose by 170%. A direct consequence of this growth rate differential is the declining share of KenGen in the total electricity generation, which reduced from 77% to 70%. On the opposite, IPPs are becoming more and more important as electricity producers given that their share more than doubled (11% in 2008 against 23% in 2013). Large participation of private investors in the development of the electricity sector is one of the key components of the Kenyan government energy strategy, hence the current trend is likely to continue, at least in the medium run.
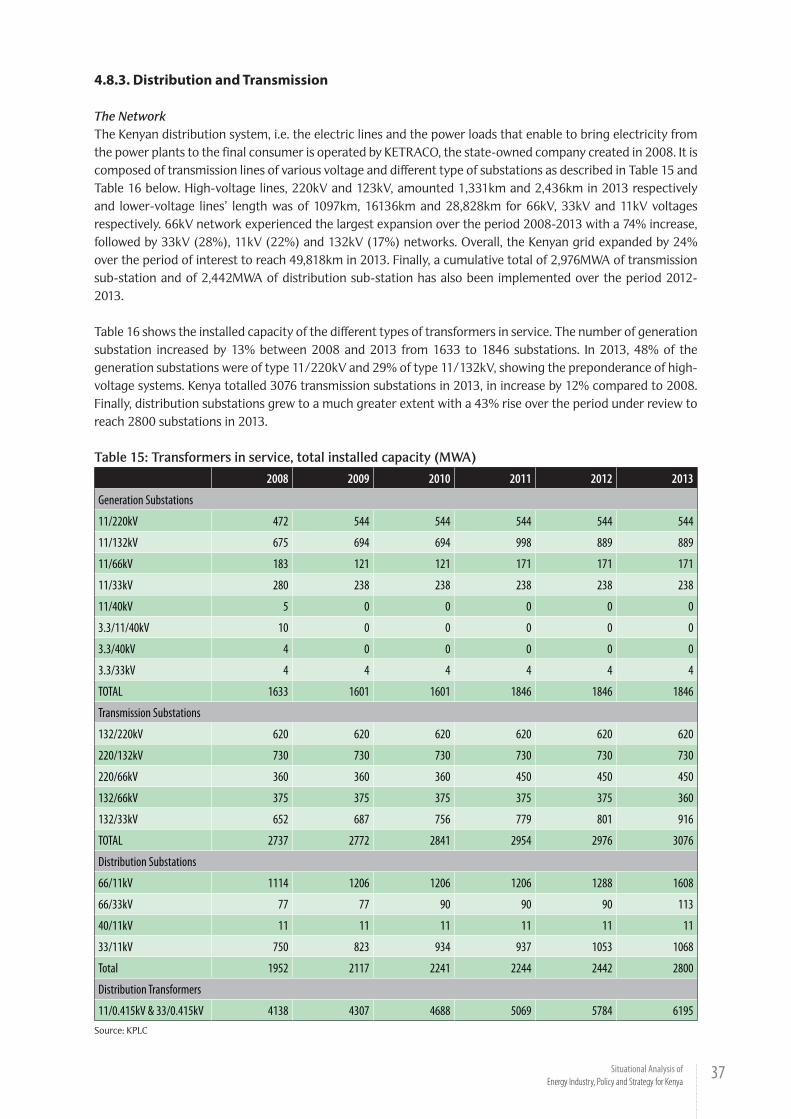
37Situational Analysis of Energy Industry, Policy and Strategy for Kenya
4.8.3. Distribution and Transmission
The NetworkThe Kenyan distribution system, i.e. the electric lines and the power loads that enable to bring electricity from the power plants to the final consumer is operated by KETRACO, the state-owned company created in 2008. It is composed of transmission lines of various voltage and different type of substations as described in Table 15 and Table 16 below. High-voltage lines, 220kV and 123kV, amounted 1,331km and 2,436km in 2013 respectively and lower-voltage lines’ length was of 1097km, 16136km and 28,828km for 66kV, 33kV and 11kV voltages respectively. 66kV network experienced the largest expansion over the period 2008-2013 with a 74% increase, followed by 33kV (28%), 11kV (22%) and 132kV (17%) networks. Overall, the Kenyan grid expanded by 24% over the period of interest to reach 49,818km in 2013. Finally, a cumulative total of 2,976MWA of transmission sub-station and of 2,442MWA of distribution sub-station has also been implemented over the period 2012-2013.
Table 16 shows the installed capacity of the different types of transformers in service. The number of generation substation increased by 13% between 2008 and 2013 from 1633 to 1846 substations. In 2013, 48% of the generation substations were of type 11/220kV and 29% of type 11/132kV, showing the preponderance of high-voltage systems. Kenya totalled 3076 transmission substations in 2013, in increase by 12% compared to 2008. Finally, distribution substations grew to a much greater extent with a 43% rise over the period under review to reach 2800 substations in 2013.
Table 15: Transformers in service, total installed capacity (MWA)
2008 2009 2010 2011 2012 2013
Generation Substations
11/220kV 472 544 544 544 544 544
11/132kV 675 694 694 998 889 889
11/66kV 183 121 121 171 171 171
11/33kV 280 238 238 238 238 238
11/40kV 5 0 0 0 0 0
3.3/11/40kV 10 0 0 0 0 0
3.3/40kV 4 0 0 0 0 0
3.3/33kV 4 4 4 4 4 4
TOTAL 1633 1601 1601 1846 1846 1846
Transmission Substations
132/220kV 620 620 620 620 620 620
220/132kV 730 730 730 730 730 730
220/66kV 360 360 360 450 450 450
132/66kV 375 375 375 375 375 360
132/33kV 652 687 756 779 801 916
TOTAL 2737 2772 2841 2954 2976 3076
Distribution Substations
66/11kV 1114 1206 1206 1206 1288 1608
66/33kV 77 77 90 90 90 113
40/11kV 11 11 11 11 11 11
33/11kV 750 823 934 937 1053 1068
Total 1952 2117 2241 2244 2442 2800
Distribution Transformers
11/0.415kV & 33/0.415kV 4138 4307 4688 5069 5784 6195Source: KPLC

38 Situational Analysis of Energy Industry, Policy and Strategy for Kenya
Table 16: Transmission and distribution lines, circuit length (km)
Voltage 2008 2009 2010 2011 2012 2013
220kV 1323 1331 1331 1331 1331 1331
132kV 2085 2112 2211 2343 2343 2436
66kV 632 649 655 655 758 1097
40kV 29 29 0 0 0 0
33kV 12633 13031 13812 15271 15384 16136
11kV 23573 24334 25485 26250 27219 28818
TOTAL 40275 41486 43494 45850 47035 49818Source: KPLC
Transmission and Distribution ProjectsStill as part of the LCPDP and align with the power generation objective of an installed capacity of 5,000MW by 2017, numerous network improvement projects are under progress at difference state of advancement and should result in the creation of additional 1161km 132KV lines, 508km 220KV lines and 1,905km 400KV lines by 2017. These projects have various specific objectives such as increasing electricity access, increasing power transfer capacity, reducing system losses, enhancing connectivity or improving the stability and the reliability of the network. In addition, 24 on-going distribution expansion projects are scheduled to be completed by 2014 (see Table 17).
Table 17: Distribution facility expansion projects
Scope of Work Project(s) Completion Date
Nairobi Region New 2x23MVA 66/11kV sub-station 8 2014
New 1x23MVA 66/11kV sub-station 1 2014
Coast Region New 1x23MVA 132/33kV sub-station & 10km 33kV line 1 2014
New 1x7.5MVA 33/11kV sub-station & 10km 33kV line 1 2014
West Region New 1x7.5 MVA 33/11 kV sub-station, 4km 33kV line, 2kms 11kV line 1 2014
New 1x7.5 MVA 33/11 kV sub-station & 20km 33kV line 1 2014
New 1x7.5 MVA 33/11 kV sub-station, 5km 33kV line,10kms 11kV line 1 2014
New 1x7.5 MVA 33/11 kV sub-station, 2km 33kV line, 2kms 11kV line 1 2014
New 1x7.5MVA sub-station 1 2014
New 1x7.5MVA 33/11 kV sub-station, 25km 33kV line 1 2014
Mont Kenya Region New 2x7.5MVA 33/11kV sub-station, 10Km 33kV line 1 2014
New 2x23 MVA 66/11kV sub-station, 5Km 66kV line, 1 2014
New 1x7.5MWA sub-station, 22km 33kV line, 5kms 11kV line 1 2014
New 1x23 MVA 66/11kV, 25Km 66kV line, 5kms 11kV line 1 2014
New 2x7.5MVA txs, 13km 33kV line and 10km 11kV line 1 2014Source: KPLC
In parallel to network expansion, numerous projects aimed at enhancing the existing installation to improve the delivery service. Indeed, the transmission and distribution system requires a continuous maintenance to ensure that consumers are provided with quality service, and to minimize losses. In this context, the Energy Sector Recovery Project (ESRP) consists in improving the efficiency, the reliability and the quality of the power supply by refurbishing and upgrading several substations in Nairobi, North Rift and Central Rift, and by commissioning new substations and power lines. The Kenyan Electricity Expansion Projects enables to work on various substations and feeders across the whole country. With a view to supply electricity not only in the main urban centers but also in the smaller more remote rural areas, the REP enables to connect 70,913 additional customers in 2012-2013.

39Situational Analysis of Energy Industry, Policy and Strategy for Kenya
Transmission losses and quality of supplyFigure 5 shows the trend in transmission and distribution losses in Kenya for the period 2002-2011. It appears that, after having steadily decreased between 2002 and 2008, the trend reversed and followed an increasing path that led 2011 to recover 2007 figures. When comparing with other countries (Figure 6), even if Kenya performed better than Tanzania and Senegal, it remains at the bottom of the pack, far behind Nigeria and South Africa. Figure 6: Power transmission and distribution losses in Kenya (% of output)
Source: World Bank
Figure 7: Power transmission and distribution losses in 2011 (% of output)
Source: World Bank
To rectify these poor performances, the Government of Kenya developed a strategy aiming at improving transmission and distribution quality and to reduce losses. Based on the N-1 criteria which consists in “the ability of the transmission system to lose a linkage without causing an overload failure elsewhere, this strategy plans more regular and rigorous inspections of the infrastructures and to reduce system disturbances among others. The principal challenges encountered to develop a more effective network are the inadequate investments on distribution upgrades and the huge costs that require funding from international or private partners among others.
Even though of lower importance, distribution losses are also significant hindrances to a better power supply. Besides intensifying maintenance, installing more capacitor at 11kV should improve the reactive power compensation as well as extending the Medium Voltage network to shorten the Low Voltage lines.

40 Situational Analysis of Energy Industry, Policy and Strategy for Kenya
4.8.4. Generation of electricity
Installed capacity and production
Table 18: Electricity generation (GWh)
2007/08 2008/09 2009/10 2010/11 2011/12 2012/13
Hydro 3,487 2,543 2,169 3,427 3,452 4,298
Thermal 1,849 2,430 3,128 2,374 2,670 2,133
Geothermal 1,021 1,179 1,339 1,453 1,498 1,600
Wind 0.2 0.3 16 18 15 14
KenGen 4,818 4,032 3,604 5,041 5,412 5,969
IPPs 969 1,190 1,933 1,943 1,819 1,788
Off-Grid 14 16 19 21 23 27
EPPs 556 914 1096 267 381 261
TOTAL 6,357 6,152 6,653 7,272 7,635 8,045Source: KPLC
Total electricity generation was of 8,044.9GWh in 2012/13 (Table 18), increasing by 26.5% between 2007/08 and 2012/13. Comparing this figure to the increase in installed capacity over the same period that averaged 35% might indicate decreasing returns to scale as output rose less than proportionally with production capacity. If confirmed, this situation would be of particular concern, as more and more investment in facilities would therefore be required to meet generation goals. Scaling-down the analysis on the different types of generation sources, hydro happens to be the only sector exhibiting increasing return to scale (11% increase in capacity led to 23% increase in production).
However, as hydro depends on climatic condition to a great extent, these impressive performances may only stem from particularly conditions, which are not representative of the usual Kenyan climate. To the opposite, thermal presents the worst efficiency ratio with a 56% rise in capacity that resulted in a 15.4% increase in power generation. These particularly bad performances seem to result from the poor ability of IPPs at generating power. Indeed, while most of the IPPs operate thermal power plants, their return to scale is inferior to 0.5, unlike that of KenGen, which is slightly above 1. This highlights the fact that, unable to attract top energy producers, Kenya has mainly hosted “second-class” power companies that are not among the most efficient at producing. Moreover, this may also reflect the numerous hindrances encountered by companies when it comes to do business in Kenya, such as red tape or corruption.
Finally, Table 19 shows the ratio Gwh/MW of the different producer that might be a good proxy for efficiency. Even if geothermal ratio decreased by 20% over the period 2007/08 – 2012/13 dropping from 7.98GWh/MW to 6.39GWh/MW, it remains by far the highest ratio among the three main electricity sources. Hydro ratio comes second and thermal last with 5.27GWh/MW and 3.07 GWh/MW in 2012/13 respectively.
Table 19: Generation efficiency rate2007/08 2008/09 2009/10 2010/11 2011/12 2012/13
Hydro 4.73 3.40 2.86 4.49 4.38 5.27Thermal 4.16 5.43 6.13 3.79 3.88 3.07Geothermal 7.98 6.85 6.76 7.34 7.17 6.39Wind 0.50 0.75 3.20 3.34 2.75 2.62KenGen 4.79 3.93 3.42 4.28 4.47 4.82IPPs 6.68 6.60 5.58 5.60 5.18 4.57Off-Grid 1.56 1.37 1.62 2.31 2.32 1.60EPPs 3.71 6.09 18.27 4.45 3.18 2.18TOTAL 4.85 4.49 4.52 4.56 4.52 5.55
Source: KPLC

41Situational Analysis of Energy Industry, Policy and Strategy for Kenya
Committed generation projects
In order to increase the generation capacity in accordance with the LCPDP, KenGen has developed a 3-stage plan sequenced into three “Horizons”: Horizon I (2008-2012), Horizon II (2013-2018), and Horizon III (2031). Horizon I aimed at stabilizing the power supply to launch the expansion of capacity on solid foundations, Horizon II should then create a sustainable power growth in Kenya to both meet the demand and establish reserves, and Horizon III is meant to drive expansion out of Kenya. As a result, to reach the 5,000MW installed capacity target in 2017 (Horizon II objective), all the main electricity producers, namely KenGen, the GDP and the IPPs, have designed different projects involving all the main source of power generation. Table 20 shows the planned generation projects for the period 2014-2017. Overall, over the period under review, 38 projects are scheduled for a total capacity of 5,098.4MW, consisting in either enhancing existing plants by implementing new units of production or building new facilities. Thermal generation is by far the most represented source with 54.6% of the total planned capacity to be based on coal or natural gas. Geothermal comes second with 32.3%, i.e. 1,646MW. Note that wind generation is not left apart with an additional 630.4MW to be set up by the end of 2016. 2016 should be the most productive year with 2,265MW planned, followed by 2017 (1,345MW), 2015 (1,038.4MW) and 2014 (450MW).
Table 20: Planned generation project
Year Type Project(s) Capacity (MW) Cumulative Total System Capacity
2014 Hydropower 1 24 2114
Diesel 4 160
Geothermal 5 266
2015 Geothermal 4 240 3152
Wind 3 80.4
Cogeneration 1 18
Natural Gas 1 700
2016 Diesel 2 -350 5417
Geothermal 5 755
Wind 5 550
Natural Gas 1 350
Coal 1 960
2017 Geothermal 4 385 6762
Coal 1 960
Source: KPLC
4.8.5. Demand
Total consumption of power increased from 3801GWh to 6581GWh between 2007/08 and 2012/13. The gap with the total generation exhibited in Table 11 result from loss in transmission that occur when power is transported from the production plant to the consumer. As losses tend to increase with the length of the line and given the relatively large size of the Kenyan territory, it explains why losses are of this magnitude. Figure 7 draws the current consumption and a forecast based on the assumption that per capita consumption remained constant since 2002. If the two curves are merged until 2005/06, indicating that the supply was more or less meeting the demand, the forecast curve then start following an exponential path leading the an estimated real demand amounting 13,538GWh in 2012/13, which is more than twice as large as the current supply. Consequently, this graph sheds light on the possibility that most of the real demand of electricity in Kenya is not satisfied.

42 Situational Analysis of Energy Industry, Policy and Strategy for Kenya
Figure 8: Consumption and demand forecast
Source: KPLC
Figure 8 and 9 show the evolution of the consumer-base for the four Kenya Power regions (Kenya Power has divided the country into four different region to enhance the distribution management, however, it should be noted that these four regions have no administrative equivalent) and the evolution of the power per capita consumption. Consumer-bases in each region experience an exponential increase from 2007. The total consumer-base increased by 253% from 618,448 to 2,184,794 over the period of interest. Consumers benefiting from the REP are those that witnessed the fastest growth with a fourfold increase to peak at 418,088 in 2012/13. West Kenya and Nairobi consumer-bases rose in similar magnitudes (238% and 231% respectively).
It is worth to note that Nairobi still ranks first in term of absolute number of consumers with a total of 981,882 in 2012/13. Finally, the Mt. Kenya region saw the number of households or companies connected to the grid increasing by 291% while the Coast region consumer-base only rose by 171%. Opposite patterns are observed on Figure 3b as all the curves are decreasing. Indeed, overall, per capita consumption declined by 49% over the 6-year period under review. This pattern is particularly surprising since, usually, per capita tends to stagnate or to increase as installed capacity and generation rise. In terms of magnitude the Coast region appears to be the biggest consumer and, conversely, REP consumers present the lowest per capita consumption. These two finding are easily explainable as Coast is a heavily industrialised region with many large infrastructures such as the Mombasa refinery, the Mombasa international port and the pumps of the pipeline network. On the opposite, the REP aims at bringing electricity to rural households, which for most of them are quite poor and thus do not possess any high power consuming appliance (the main electricity use of these rural communities is for lightening or for powering TVs).
One interpretation of the falling per capita consumption could be that the will of governmental authority to increase connection to the grid has not synchronised the increase in the consumer-base with the grid-expansion and the electricity generation paces. The direct consequence is a more segmented supply, which is likely to lead to more frequent power interruption and other disturbances for consumers. This situation suggests on one hand an important unmet demand which calls for a better integration to the network, and on the other hand installed capacity and generation that increase at a too low rate to compensate the increase in new consumers. Consequently, this situation presents two inconveniences as a share of the total demand is fully unmet and the other share which is provided with electricity has to suffer from a bad quality service.
However, another way of interpreting is to assume that the current policy aiming at increasing access to electricity mainly targets poor urban and rural households, which have very low needs in electricity. One would therefore face an income issue coupled with inadequate new consumers. Indeed, the current use of electricity by poor households restricts to lightening, cooking and electric device powering, most of them not being equipped with fridges, AC or other high-power consuming appliances.
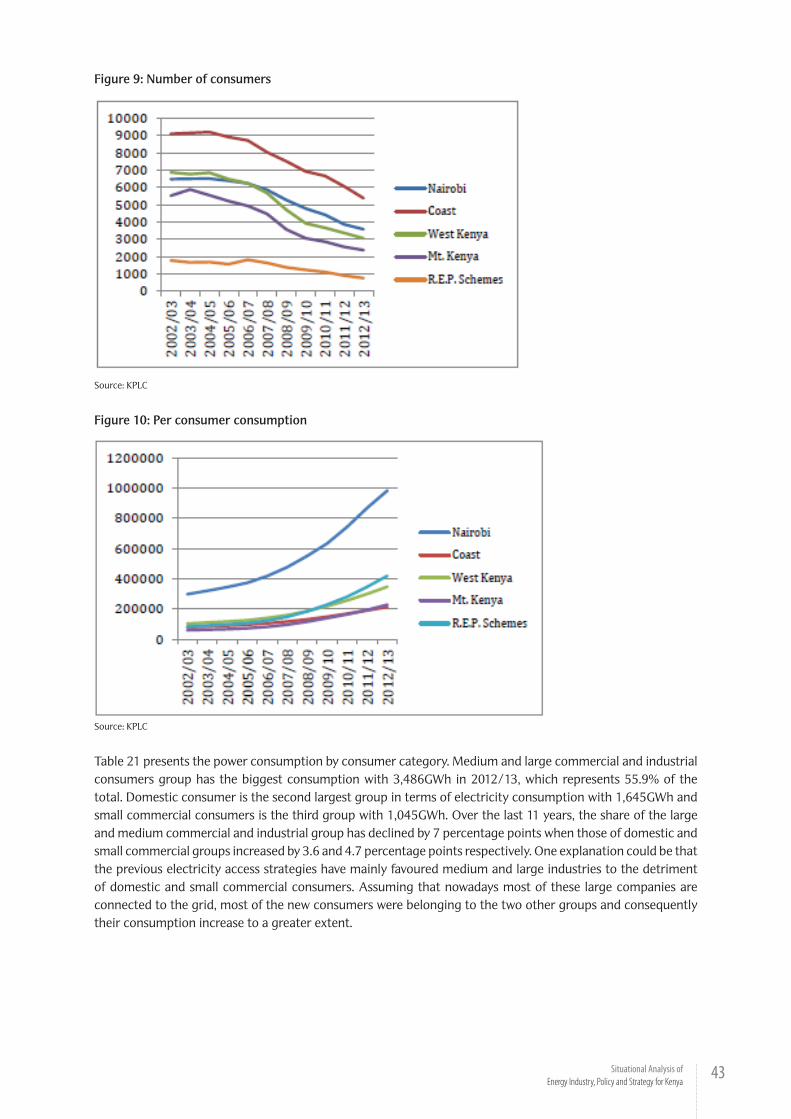
43Situational Analysis of Energy Industry, Policy and Strategy for Kenya
Figure 9: Number of consumers
Source: KPLC
Figure 10: Per consumer consumption
Source: KPLC
Table 21 presents the power consumption by consumer category. Medium and large commercial and industrial consumers group has the biggest consumption with 3,486GWh in 2012/13, which represents 55.9% of the total. Domestic consumer is the second largest group in terms of electricity consumption with 1,645GWh and small commercial consumers is the third group with 1,045GWh. Over the last 11 years, the share of the large and medium commercial and industrial group has declined by 7 percentage points when those of domestic and small commercial groups increased by 3.6 and 4.7 percentage points respectively. One explanation could be that the previous electricity access strategies have mainly favoured medium and large industries to the detriment of domestic and small commercial consumers. Assuming that nowadays most of these large companies are connected to the grid, most of the new consumers were belonging to the two other groups and consequently their consumption increase to a greater extent.
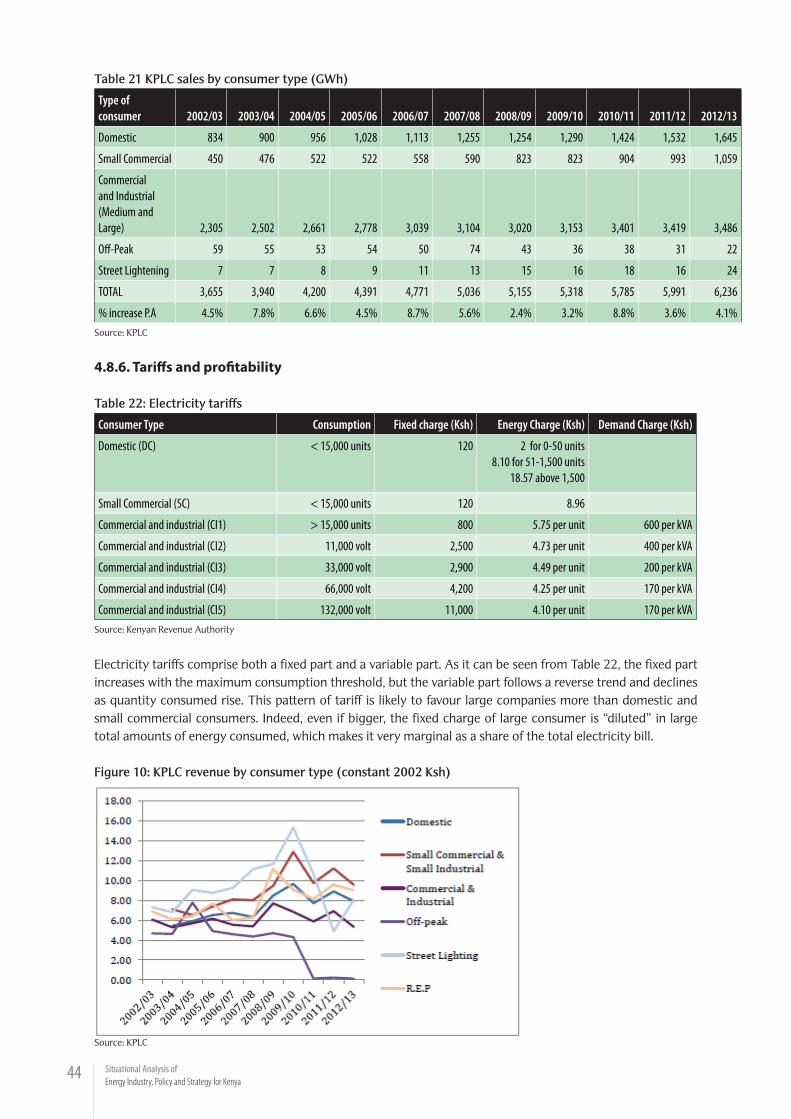
44 Situational Analysis of Energy Industry, Policy and Strategy for Kenya
Table 21 KPLC sales by consumer type (GWh)
Type of consumer 2002/03 2003/04 2004/05 2005/06 2006/07 2007/08 2008/09 2009/10 2010/11 2011/12 2012/13
Domestic 834 900 956 1,028 1,113 1,255 1,254 1,290 1,424 1,532 1,645
Small Commercial 450 476 522 522 558 590 823 823 904 993 1,059
Commercial and Industrial (Medium and Large) 2,305 2,502 2,661 2,778 3,039 3,104 3,020 3,153 3,401 3,419 3,486
Off-Peak 59 55 53 54 50 74 43 36 38 31 22
Street Lightening 7 7 8 9 11 13 15 16 18 16 24
TOTAL 3,655 3,940 4,200 4,391 4,771 5,036 5,155 5,318 5,785 5,991 6,236
% increase P.A 4.5% 7.8% 6.6% 4.5% 8.7% 5.6% 2.4% 3.2% 8.8% 3.6% 4.1%Source: KPLC
4.8.6. Tariffs and profitability
Table 22: Electricity tariffs
Consumer Type Consumption Fixed charge (Ksh) Energy Charge (Ksh) Demand Charge (Ksh)
Domestic (DC) < 15,000 units 120 2 for 0-50 units8.10 for 51-1,500 units
18.57 above 1,500
Small Commercial (SC) < 15,000 units 120 8.96
Commercial and industrial (CI1) > 15,000 units 800 5.75 per unit 600 per kVA
Commercial and industrial (CI2) 11,000 volt 2,500 4.73 per unit 400 per kVA
Commercial and industrial (CI3) 33,000 volt 2,900 4.49 per unit 200 per kVA
Commercial and industrial (CI4) 66,000 volt 4,200 4.25 per unit 170 per kVA
Commercial and industrial (CI5) 132,000 volt 11,000 4.10 per unit 170 per kVASource: Kenyan Revenue Authority
Electricity tariffs comprise both a fixed part and a variable part. As it can be seen from Table 22, the fixed part increases with the maximum consumption threshold, but the variable part follows a reverse trend and declines as quantity consumed rise. This pattern of tariff is likely to favour large companies more than domestic and small commercial consumers. Indeed, even if bigger, the fixed charge of large consumer is “diluted” in large total amounts of energy consumed, which makes it very marginal as a share of the total electricity bill.
Figure 10: KPLC revenue by consumer type (constant 2002 Ksh)
Source: KPLC

45Situational Analysis of Energy Industry, Policy and Strategy for Kenya
Finally, Figure 10 draws the revenue over sales ratio by consumer category, which might be seen as a proxy for profitability for the power producers. It should be worth noticing that the ratio of medium and large commercial and industrial consumers is the only one that decreased between 2002/03 and 2012/13 (6.06Ksh/kWh against 5.32Ksh/Kwh). The specific trend might be due to the preferential tariffs big consumers benefit from, which reduces the corresponding profitability for the producer. Such tariffs may result from intense lobbying from large electricity consumers toward the concerned agencies in charge of setting the prices. Small commercial consumers group is the most profitable for power producers with 9.54, principally because of the design of the tariffs that prevent them to dilute the fixed charge with cheap variable change (see Table 14). REP consumers are likely to be profitable because of the significant participation of the government in this programme. Indeed, the Kenyan government guarantees low electricity prices for REP subscribers by subsidising their consumption.
4.8.7. Challenges
Despite the optimistic and positive declarations of the executive members and of the electricity companies regarding the sizable improvement of the electrical situation, the latter remains quite critic and faces numerous challenges that the Government will have to overcome if it wants to achieves its ambitious vision 2030 objectives. Indeed, despite increasing installed capacity, the demand for power in Kenya keeps rising at a faster pace than supply, widening the negative impact of the lack of electricity on the economy. In 2010, 70% of Kenyan businesses reported having installed backstop generation system to overcome power interruptions, and recent estimates establish the total loss due to electricity failures at 2% of the Growth Domestic Product. However, the estimated cost of the current plan of electrification amounts USD 4 million annually over 18 years, which is unbearable for the sole Government, even after having included donors’ participation.
The solution would come from the involvement of private investors in the sector but the number of IPPs interested in investing is quite low and most of them demand enormous terms such as very high generation tariffs government guarantees and letters of credit covering several months of payment for both capital and energy charges. Other adverse effects of the inadequate power supply are the necessity for the government to depart from the rule stating that 30% of the installation must be off-line to allow proper and rigorous maintenance and to overuse emergency generation capacity, of which the price of one kilowatt hour is much higher. In addition, the over-reliance on hydropower is of concern because the high dependence of this source of energy on unreliable climatic conditions, and the conflicts between electricity producer and food security advocates regarding bio-fuels are other issues that need to be solved.
High grid and related system losses, power interruption and overstressed distribution network are the main challenges encountered by transmission and distribution systems. Adding to that, vandalism of electric network facilities is on the rise with 815 transformers vandalized in 2012/2013, costing Ksh. 700 million to KETRACO. Several solutions are under study to rectify this situation such as increase patrols or declaring important installation “protected areas”.
4.9. Infrastructure
4.9.1. Mombasa port
The port of Mombasa is the only modern port in Kenya suited to international trade with 16 deep-water berths. In 2012, it was ranked 117th of the world container port after having handled 90,300 twenty-foot equivalent unit (TEU), and the threshold of 1 million TEU should be broken in 2013. By 2020, the port should expand its stocking capacity to 1.2 million TEU. Regarding hydrocarbon, Mombasa port has two bulk oil jetties for tankers with a draft of 9.8 meters and a cased oil jetty with alongside depth of 4.3 meters. The two main oil-handling terminals are the Shimanzi Oil Terminal and the Kipevu Oil Terminal, the latter being dedicated to handle crude oil and refined oil products. Currently owned and operated by the Kenyan Port Authority, the privatization of the cargo handling service is under discussion. However, several voices has criticized the inadequate facilities for unload coal and gas imports which actually happen to be cheaper than oil-based fuels when it comes to electricity generation.

46 Situational Analysis of Energy Industry, Policy and Strategy for Kenya
4.9.2. Mombasa refineryThe refinery of Mombasa, the only oil refining facility in East Africa, has a capacity of 80,000 bpd and produces Liquefied petroleum gas, unleaded premium gasoline, regular petrol, automotive gasoil, Industrial diesel, fuel oil and special products like bitumen and grease. However, the refining operation should stop in a close future as claimed by the Ministry of Energy. The poor efficiency of the Mombasa refinery has increased the cost of refining oil in Kenya above above that of directly importing already refined products. It is planned that the refinery will be converted into a petroleum product storage facility.
4.9.3. PipelineThe Kenyan Oil Pipeline network transports petroleum products such as Motor Spirit Premium, Motor Spirit Regular, Automotive Gas Oil, Jet A-1 and Illuminating Kerosene from Mombasa to Nairobi and western Kenya towns of Nakuru, Kisumu and Eldoret. The Mombasa – Nairobi line consists of 450km long, 14 inches-diameter pipelines with an installed flow rate of 880m3/hour. 8 pumping stations are in charge of controlling the flow of products in the pipes. The Nakuru-Eldoret pipeline is 446km long and of diameters 8 and 6 inches. The flow rate is of 220m3/hour and controlled by 4 pumping stations. The total storage capacity is described in Table 23.
Table23: Storage capacity of petroleum
Depot Total Capacity (m3)
Nairobi Terminal 100,580
Jomo Kenyatta International Airport 54,141
Moi Airport Mombasa 7,349
Kipevu Oil Storage Facility 326,233
Nakuru Depot 30,553
Eldoret Depot 48,089
Kisumu Depot 45,288
TOTAL 612,332Source: KPLC
4.9.4. The LAPSSET ProjectThe Lamu Port and South Sudan Ethiopia Transport (LAPSSET) corridor project is a big infrastructure project aimed at linking East and Central African countries to global international markets. Even if the first plan were drafted in 1975, several reasons delayed the implementation of the project which was officially launched on March 2, 2012 and should be completed within the span of the Vision 2030 development plan. The project is comprised of 6 main components.
A modern 32-berth port in Lamu in the Manda Bay, of which the construction of the first 3 berths has already started, should further open up the Kenyan coast, and at the same time the whole East and Central African region to international trade. Each berth is designed to host post “panamax” vessels and has a capacity of 30,000 Dead Weight Tonnage (DWT) and 100,000 DWT for general and bulk, and container cargo respectively. Then, from Lamu, a pipeline, a railway line and a highway network should be developed to transport both goods and hydrocarbon from the inner lands to the harbour and vice versa. The oil pipeline total length should be of 2,240km, from Lamu to Isiolo and then split into two branches, one going East to South Sudan and the other North to Ethiopia. 1,260km of the pipeline are planned to transport crude oil and the 980km remaining should be dedicated to product oil.
The Lamu–Southern Sudan/Ethiopia highway network should provide 1,730km of heavy transportation routes to connect Lamu to South Sudan and Ethiopia, and thus facilitate and bolster road transportation trade. In parallele, a 1,500km standard railway line will link Lamu to Nakodok. In Bargoni (35km North from Lamu), an oil refinery of capacity 120000 bpd should be built in the bid of refining oil products for both Kenya and Ethiopia. Finally, international airports should be developed in Isiolo, Lamu and Lokichoggio.
However, although most of the stakeholders are optimistic regarding the realization and the completion of the project, funding still needs to be shored up since, even if several financial institutions, both private and

47Situational Analysis of Energy Industry, Policy and Strategy for Kenya
international, have claimed their interest in participating, nothing has been officially agreed on. Moreover, the advantageous strategic position of Kenya over landlocked Ethiopia, South Sudan and Uganda is sometime at the roots of geo-political tensions that are likely to hinder the pace of advancements of the LAPSSET.
4.9.5. Least Cost Power Development Plan – Strategy
Electricity Generation Strategy Planning
Load forecast studyIn order to properly develop a power system plan, the first step consists in constructing an accurate assessment of the future demand in electricity. As part of the LCPDP, the government of Kenya and the other stakeholders to the project developed a prediction model based on the Model for analysis of Energy Demand (MAED) designed by the International Atomic Energy Agency (IAEA). The main determinants taken into account by the model to predict the demand are the population, the household size and the specific consumption (kWh/household/year) among others.
Three forecast scenarios are considered, high, medium and low, each of them based on a different average GDP growth. The high scenario assumes a GDP growth rate consistent with Vision 2030 forecast while the other two correspond to lower expectation. As the medium scenario is the more realistic, it will be referred as the reference scenario. Including the energy needs resulting from the completion of various projects of the Vision 2030 development plan; Table 24 presents the energy and peak forecast for the period 2010-2031. However, it should be not noted that, because of a lack of available data, the way the model is designed is likely to exaggerate the load forecast.
Table 24: Energy and peak load forecast
Low Scenario Medium Scenario High Scenario
GWh MW Load Factor GWh MW Load Factor GWh MW Load Factor
2010 7,296 1,227 67.88% 7,296 1,227 67.88% 7,296 1,227 67.88%
2011 7,729 1,293 68.24% 7,775 1,302 68.16% 7,943 1,331 68.11%
2012 8,967 1,498 68.35% 9,084 1,520 68.21% 9,458 1,584 68.14%
2013 10,335 1,723 68.49% 10,560 1,765 68.32% 11,224 1,877 68.25%
2014 11,985 1,993 68.64% 12,376 2,064 68.44% 13,396 2,236 68.38%
2015 14,516 2,398 69.10% 15,155 2,511 68.90% 16,644 2,760 68.83%
2016 16,298 2,693 69.10% 17,300 2,866 68.91% 19,344 3,207 68.86%
2017 18,507 3,053 69.19% 19,902 3,292 69.02% 22,650 3,749 68.97%
2018 20,660 3,408 69.20% 22,685 3,751 69.04% 26,128 4,322 69.01%
2019 23,014 3,796 69.21% 25,512 4,216 69.08% 30,069 4,970 69.07%
2020 25,591 4,220 69.23% 28,795 4,755 69.13% 34,537 5,703 69.14%
2021 28,620 4,720 69.22% 32,651 5,388 69.18% 39,554 6,521 69.24%
2022 31,637 5,222 69.16% 36,652 6,048 69.18% 44,915 7,397 69.32%
2023 34,960 5,775 69.11% 41,130 6,784 69.21% 50,998 8,388 69.41%
2024 38,618 6,382 69.08% 46,147 7,608 69.25% 57,903 9,509 69.51%
2025 42,649 7,050 69.06% 51,771 8,528 69.30% 65,748 10,778 69.64%
2026 47,083 7,783 69.06% 58,069 9,556 69.37% 74,664 12,217 69.77%
2027 51,969 8,590 69.06% 65,133 10,706 69.45% 84,805 13,847 69.91%
2028 57,359 9,478 69.09% 73,065 11,994 69.54% 96,346 15,697 70.07%
2029 63,295 10,453 69.12% 81,964 13,435 69.65% 109,488 17,796 70.23%
2030 69,846 11,510 69.27% 91,946 15,026 69.85% 124,461 20,156 70.49%
2031 77,307 12,738 69.28% 103,518 16,905 69.90% 142,103 22,985 70.57%Source: LCPDP
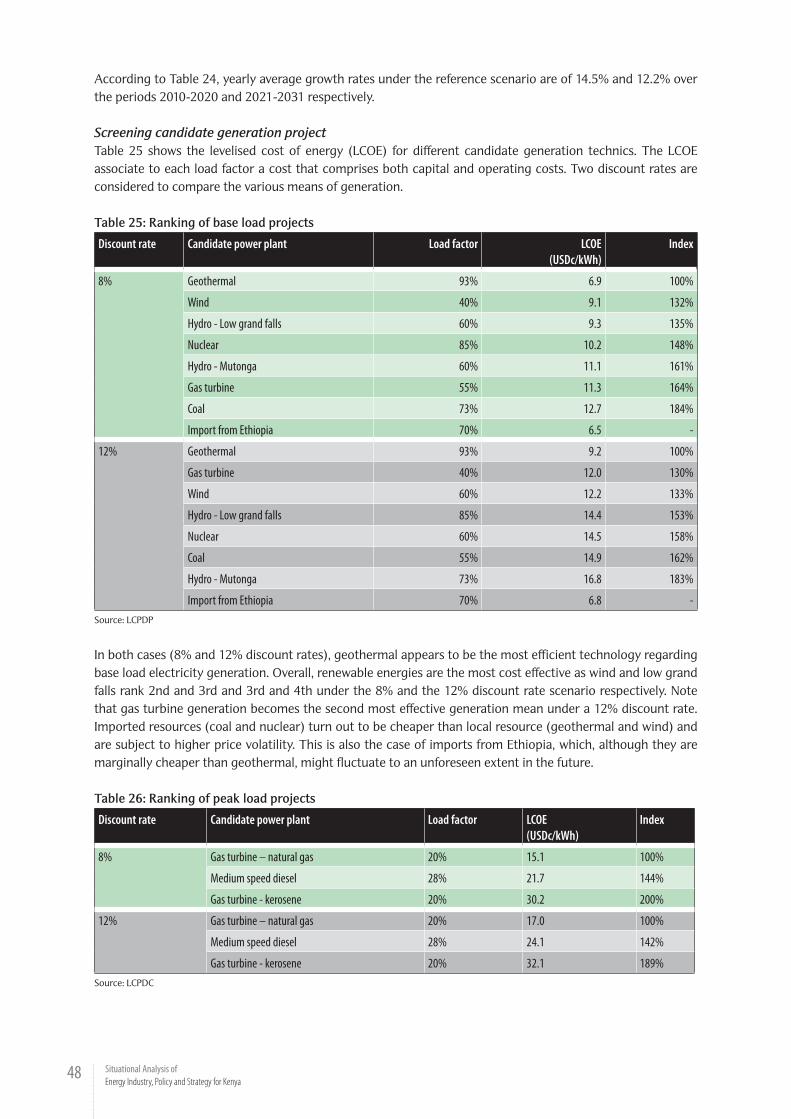
48 Situational Analysis of Energy Industry, Policy and Strategy for Kenya
According to Table 24, yearly average growth rates under the reference scenario are of 14.5% and 12.2% over the periods 2010-2020 and 2021-2031 respectively.
Screening candidate generation projectTable 25 shows the levelised cost of energy (LCOE) for different candidate generation technics. The LCOE associate to each load factor a cost that comprises both capital and operating costs. Two discount rates are considered to compare the various means of generation.
Table 25: Ranking of base load projects
Discount rate Candidate power plant Load factor LCOE (USDc/kWh)
Index
8% Geothermal 93% 6.9 100%
Wind 40% 9.1 132%
Hydro - Low grand falls 60% 9.3 135%
Nuclear 85% 10.2 148%
Hydro - Mutonga 60% 11.1 161%
Gas turbine 55% 11.3 164%
Coal 73% 12.7 184%
Import from Ethiopia 70% 6.5 -
12% Geothermal 93% 9.2 100%
Gas turbine 40% 12.0 130%
Wind 60% 12.2 133%
Hydro - Low grand falls 85% 14.4 153%
Nuclear 60% 14.5 158%
Coal 55% 14.9 162%
Hydro - Mutonga 73% 16.8 183%
Import from Ethiopia 70% 6.8 -Source: LCPDP
In both cases (8% and 12% discount rates), geothermal appears to be the most efficient technology regarding base load electricity generation. Overall, renewable energies are the most cost effective as wind and low grand falls rank 2nd and 3rd and 3rd and 4th under the 8% and the 12% discount rate scenario respectively. Note that gas turbine generation becomes the second most effective generation mean under a 12% discount rate. Imported resources (coal and nuclear) turn out to be cheaper than local resource (geothermal and wind) and are subject to higher price volatility. This is also the case of imports from Ethiopia, which, although they are marginally cheaper than geothermal, might fluctuate to an unforeseen extent in the future.
Table 26: Ranking of peak load projects
Discount rate Candidate power plant Load factor LCOE (USDc/kWh)
Index
8% Gas turbine – natural gas 20% 15.1 100%
Medium speed diesel 28% 21.7 144%
Gas turbine - kerosene 20% 30.2 200%
12% Gas turbine – natural gas 20% 17.0 100%
Medium speed diesel 28% 24.1 142%
Gas turbine - kerosene 20% 32.1 189%Source: LCPDC

49Situational Analysis of Energy Industry, Policy and Strategy for Kenya
Peak load projects differ from base load one inasmuch they are supposed to supply peak demand, which by definition might vary to a great extent. As a result, a significant quantity of electricity needs to be produced within a short period of time. In this context, thermal generation is usually the best suited for this kind of use. According to Table 26, whatever the discount rate is, the ordering of the different methods of generation remains unchanged with natural gas operated gas turbines dominating medium speed diesel and kerosene-based gas turbines. Installing gas turbines suited for both natural gas and kerosene would certainly be the most efficient. Moreover, as a matter of effectiveness, such installations should be built next to natural gas facilities. Medium speed diesel (MSD) should not be given up to as it can also be used as an intermediate facility. Indeed, it appears that MSD remains cheaper than coal up to a load factor of 35%. Moreover, small size diesel units (20MW) enable gradual implementation to the contrary of large coal plants (300MW).It results from this analysis that the energy strategy of Kenya should therefore be based on geothermal and wind energy, with coal and nuclear being used to fulfil unmet needs.
Least cost generation planning The goal of the electric power system expansion planning is to determine what is the optimal allocation of different types of generation to meet the electricity requirement over a given period. The hereunder estimation is based on the following assumptions and parameters: the planning period runs from 2011 to 2031, the real discount rate is fixed at 8%, the reference year for cost discounting is 2010 and all data are expressed in constant 2010 USD. Moreover, 3 different level of hydrological condition are considered: dry, average and wet with average condition taken taken as the reference case. The constraints applied for the candidate projects are summed up in table 27.
Table 27: Implementation constraints
Geothermal Maximum 3 x 140MW in a year
Nuclear Maximum 2 x 1,000 MWFirst plant in 2022
Coal Earliest commissioning date 2014Maximum per year 3 x 300MW
Medium speed diesel (160MW) Earliest date 2017
Hydro - Mutonga (60MW) Earliest date 2018
Hydro - Low grand falls (140MW) Earliest date 2018
Gas turbine (180MW) Earliest date 2015
Wind (100MW) Maximum 3 X 100 MW
Imports (200MW) Earliest date 2014Source: LCPDC
Only the base case plan will be considered, i.e. medium load growth scenario. The corresponding additional installed capacity is presented in Table 28 and Table 29 details the cost of the project.

50 Situational Analysis of Energy Industry, Policy and Strategy for Kenya
Table 28: Base case plan (MW)
GEOT COAL GT MSD WIND NUCL IMPO HYD1 HYD2 Total
2010 - - - - - - - - - -
2011 - - - - - - - - - -
2012 - - - - - - - - - -
2013 - - - - - - - - - -
2014 - - - - - - 200 - - 200
2015 280 - - - - - - - - 280
2016 - - - - - - 400 - - 400
2017 140 - - 320 - - - - - 460
2018 140 300 - - 100 - - 60 40 740
2019 280 - - - 100 - 200 - - 580
2020 280 360 - - - 200 - - 840
2021 280 300 180 100 - - - - 860
2022 - - - - - 1000 - - - 1,000
2023 280 300 - - 100 - - - - 680
2024 420 - 180 320 - - - - - 1,120
2025 420 360 160 200 - - - - 1,140
2026 420 - - - 200 1000 400 - - 2,020
2027 420 - - - - - 200 - - 620
2028 420 600 180 - 300 200 - - 1,700
2029 420 360 - 100 1000 - - - 1,880
2030 420 600 360 320 300 - - - - 2,000
2031 420 300 360 320 - 1000 - - - 2,400
TOTAL 5,040 2,400 2,340 1,440 1,500 4,000 2,000 60 40 18,920
Legend: NUCL – Nuclear Power, GEOT – Geothermal, GT – Gas Turbine, MSD – Medium Speed Diesel, IMPO – Import, HYD1 & HYD2 – Hydro 1 & Hydro 2
Source: LCPDC
Table 29: Least cost expansion programme
Capital Cost(Mil USD)
Type Added Capacity(MW)
Cumulative Capacity (MW)
System Peak(MW)
Reserve Margin (MW)
2011156
HydroMSD
20120 1,503 1,302 136
2012 8.0378
GeothermalHydro
721
1,531 1,520 11
2013 383552127
WindMSD
Geothermal
81332
35
1,979 1,765 214
2014 653769
115
WindGeothermalGas turbine
Hydro
350221-60232
2,852 2,064 788
2015 1022 GeothermalHydro
Coal
2352520
3,132 2,511 621
2016631.2
ImportCoal
400300
3,832 2,866 970
2017 511436.48
GeothermalMSD
185320
4,337 3,292 1,045

51Situational Analysis of Energy Industry, Policy and Strategy for Kenya
2018 631.2230766511
CoalWind
HydroGeothermal
300100200140
5,077 3,751 1,326
2019230
1070
ImportWind
GeothermalMSD
Cogeneration
200100296-56-26
5,591 4,216 1,475
2020 270
1022
Gas turbineImport
Geothermal
360200280
6,431 4,755 1,676
2021 1022
631.2135230
GeothermalMSDCoal
Gas turbineWind
200-74300180100
7,217 5,388 1,829
2022 4055 Nuclear 1000 8,217 6,048 2,169
2023 1022631.2
230
GeothermalCoal
WindMSD
280300100-60
8,837 6,784 2,053
2024436.48
1351533
ImportMSD
Gas turbineGeothermal
200320180420
9,957 7,608 2,349
2025 1533270
218.24460
GeothermalGas turbine
MSDWind
420360160200
11,097 8,528 2,569
2026 46015334055
WindGeothermal
NuclearImport
200420
1000400
13,117 9,556 3,561
2027 1533 Geothermal Import 420200
13,737 10,706 3,031
2028 1533135
6901262.4
GeothermalGas turbine
ImportWind
Coal
372180200300600
15,389 11,994 3,395
2029 270230
15334055
Gas turbineWind
GeothermalNuclear
360100350
1000
17,199 13,435 3,764
2030 15331262.4
270436.48
690
GeothermalCoal
Gas TurbineMSD
Wind
420600360320300
19,199 15,026 4,173
2031 15331262.4
270436.48
4055
GeothermalCoal
Gas turbineMSD
Nuclear
420300360320
1000
21,599 16,905 4,694
Source: LCPDC

52 Situational Analysis of Energy Industry, Policy and Strategy for Kenya
The whole expansion planning would witness the creation of an additional installed capacity 18,920MW by 2031. Geothermal would account for 5,040MW, nuclear for 4000MW, coal for 2,400MW, gas for 2,340MW, and imports for 2000MW. To a lower extent, 1,500MW would be generated from wind and 1,440 from MSD. The total cost of the project, excluding committed projects, would amount to USD 41.4 billion in constant 2010 USD. The total costs of the projects reported in Table 6 is of USD 51,75 billion. Geothermal and nuclear are the two main areas of expenditure as they account for 37% and 31% of the total respectively. The corresponding electricity generation should average 105,733GWh in 2031; the detail is presented in Table 30.
Table 30: Planned electricity generation (GWh)
Hydro Nucl MSD Import Cogen GT Geot Coal Wind Total
2010 2,299 2,602 223 379 1,640 17 7,160
2011 2,335 2,620 223 393 1,640 17 7,228
2012 2,441 3,587 223 387 1,704 17 8,359
2013 2,441 5,170 223 301 2,000 472 10,607
2014 2,504 1,994 1,410 188 5,036 1,659 12,791
2015 2,540 2,649 1,426 194 6,949 139 1,660 15,557
2016 2,540 592 4,215 172 6,957 1,821 1,660 17,957
2017 2,540 1,512 4,317 183 8,473 1,941 1,660 20,626
2018 3,338 780 4,324 187 9,615 3,285 1,973 23,502
2019 3,338 472 5,445 11,898 2,975 2,286 26,414
2020 3,338 251 6,649 247 14,184 2,839 2,286 29,794
2021 3,338 192 6,781 312 16,470 4,066 2,600 33,759
2022 3,338 7,108 84 5,766 157 16,476 2,367 2,600 37,896
2023 3,338 7,174 113 6,038 221 18,762 3,941 2,913 42,500
2024 3,338 7,198 143 7,278 347 22,191 4,259 2,913 47,667
2025 3,338 7,199 279 7,417 856 25,619 5,184 3,540 53,432
2026 3,338 13,488 51 7,975 137 29,047 1,487 4,167 59,690
2027 3,338 13,908 97 9,704 389 32,478 2,788 4,167 66,869
2028 3,338 14,197 91 11,369 434 35,511 4,864 5,108 74,912
2029 3,338 20,924 82 10,861 512 38,364 4,410 5,421 83,912
2030 3,338 21,402 158 11,600 966 41,796 8,229 6,361 93,850
2031 3,338 28,464 178 11,509 1,226 45,228 9,469 6,361 105,773Source: LCPDC
In 2031, geothermal is planned to be the main contributor to the grid by accounting for 42.8% of the total electricity production, followed by nuclear (26.9%) and imports (10.9%). Thermal energies, namely gas and coal would average 10%, which is slightly higher the share of wind and hydro (9%). Local (geothermal, wind and hydro) and imported (nuclear, gas, coal, imports) resource-based generation means would be equally distributed (51% against 49% respectively).
The resulting average discounted supply cost for the reference medium scenario would be of 13.5 USDc/kWh and 1.7USDc/kWh considering a discount rate of 8% and 12% respectively. Even the cost under both cases is higher than the current one of 9.7USDc/kWh, one should bear in mind that the latter is sizably subsidised by the government, thus it does not represent the actual cost. This increase can also result from the 25% margin for the producers that has been adopted in the development plan.
Transmission and distribution strategy planningIn line with power generation projects, the LCPDP includes a strategic plan which aims at determining the
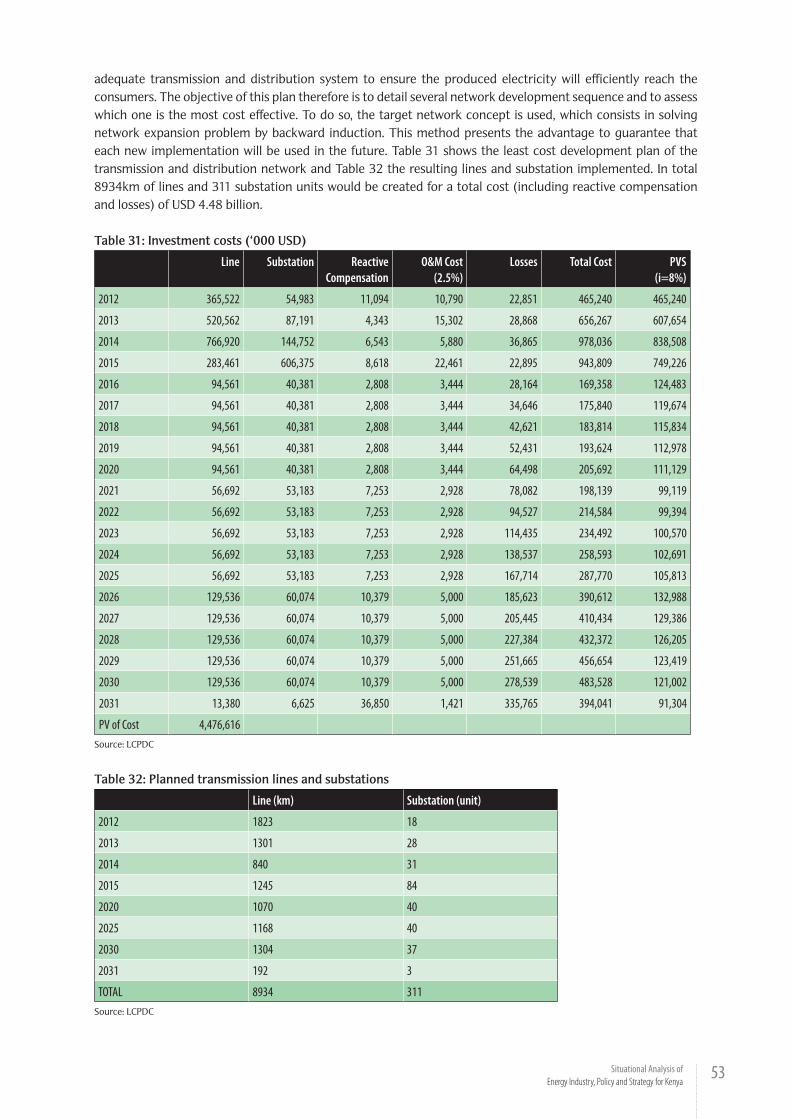
53Situational Analysis of Energy Industry, Policy and Strategy for Kenya
adequate transmission and distribution system to ensure the produced electricity will efficiently reach the consumers. The objective of this plan therefore is to detail several network development sequence and to assess which one is the most cost effective. To do so, the target network concept is used, which consists in solving network expansion problem by backward induction. This method presents the advantage to guarantee that each new implementation will be used in the future. Table 31 shows the least cost development plan of the transmission and distribution network and Table 32 the resulting lines and substation implemented. In total 8934km of lines and 311 substation units would be created for a total cost (including reactive compensation and losses) of USD 4.48 billion.
Table 31: Investment costs (‘000 USD)
Line Substation ReactiveCompensation
O&M Cost (2.5%)
Losses Total Cost PVS(i=8%)
2012 365,522 54,983 11,094 10,790 22,851 465,240 465,240
2013 520,562 87,191 4,343 15,302 28,868 656,267 607,654
2014 766,920 144,752 6,543 5,880 36,865 978,036 838,508
2015 283,461 606,375 8,618 22,461 22,895 943,809 749,226
2016 94,561 40,381 2,808 3,444 28,164 169,358 124,483
2017 94,561 40,381 2,808 3,444 34,646 175,840 119,674
2018 94,561 40,381 2,808 3,444 42,621 183,814 115,834
2019 94,561 40,381 2,808 3,444 52,431 193,624 112,978
2020 94,561 40,381 2,808 3,444 64,498 205,692 111,129
2021 56,692 53,183 7,253 2,928 78,082 198,139 99,119
2022 56,692 53,183 7,253 2,928 94,527 214,584 99,394
2023 56,692 53,183 7,253 2,928 114,435 234,492 100,570
2024 56,692 53,183 7,253 2,928 138,537 258,593 102,691
2025 56,692 53,183 7,253 2,928 167,714 287,770 105,813
2026 129,536 60,074 10,379 5,000 185,623 390,612 132,988
2027 129,536 60,074 10,379 5,000 205,445 410,434 129,386
2028 129,536 60,074 10,379 5,000 227,384 432,372 126,205
2029 129,536 60,074 10,379 5,000 251,665 456,654 123,419
2030 129,536 60,074 10,379 5,000 278,539 483,528 121,002
2031 13,380 6,625 36,850 1,421 335,765 394,041 91,304
PV of Cost 4,476,616Source: LCPDC
Table 32: Planned transmission lines and substations
Line (km) Substation (unit)
2012 1823 18
2013 1301 28
2014 840 31
2015 1245 84
2020 1070 40
2025 1168 40
2030 1304 37
2031 192 3
TOTAL 8934 311Source: LCPDC

54 Situational Analysis of Energy Industry, Policy and Strategy for Kenya
Conclusion and Recommendations
5
Biomass remains the main source of energy for a large majority of the Kenyan population, especially in rural and poor urban areas, where woodfuels are usually the only available energy source. This fact is particularly challenging since massive use of fuelwood and charcoal participate in the deforestation process, when forest areas only account for 3% of the total surface of the country. Moreover, the biomass market mainly arises in the informal sector, thus out of any legal and regulatory framework.
This situation requires two approaches that should be jointly carried out to efficiently provide appropriate responses. Firstly the current use of woodfuels must be regulated by the authorities to ensure the viability and the sustainability of the sector. This can be done by encouraging the growing of fast growing species of trees that will both satisfy the demand and guarantee the protection of the forest. Developing special plantations areas dedicated to grow fast growing species of trees or inciting farmers to reserve a share of their land to planting trees.
Secondly, it should be born in mind that the main reason of the over-reliance on woodfuels is the low income of a large majority of Kenyan who cannot afford other sources of energy. This is in addition to the fact that most of these poor urban and rural households lack a direct access to electricity, as well as the basic appliances that use power to work. Hence, expanding the power transmission network to reach those poor populations would be effective in the reduction of the use of biomass, but only if it is coupled with policies aiming at improving the revenue of those individuals.
Petroleum is the second source of energy in Kenya. Currently, Kenya has not yet joined the club of the oil exporting countries but the most recent estimations expect the process of extraction to begin within the next five years. Consequently, the consumption of petroleum product fully depends on imports of crude and refined oil, although the latter has largely overstepped the former as the unique refinery of Kenya lost in efficiency. Retail pump outlets are the principal consumers of petroleum products accounting for about 60% of the total demand. This is mainly due to the boom in motor vehicles purchases that arose in 2003, triggered by an easier access to consumption loans. This trend is likely to prevail over time as more and more Kenyan joining the middle class are eager to possess their own car.
In terms of infrastructure, the main oil-related facilities are the port of Mombasa that is specifically designed to welcome oil tankers, the Mombasa refinery, even if it might stop its refining activities to refocus on stocking petroleum products, and the Mombasa-Nairobi oil pipeline that has been extended to Eldoret. The discovery of economically viable oil deposit in the rift valley province as well as the increasing the similar discoveries in Kenya’s neighbouring countries has resolved the Kenyan government to launch a big project, the LAPSSET, comprising a new port in Lamu on the Indian Ocean coast, a new refinery in the same area and a large pipeline and road network that should link the Kenyan coast to Ethiopia and South Sudan.
However these discoveries came together with many challenges. Indeed, the current proven reserve of Kenya are not big enough to have a long-term impact on the Kenyan economy. As a result, the government needs to be very clear and transparent on this topic, in order not to arouse any too high expectation from the population. It should also commit to redistribute the oil money in a fair way to prevent any injustice feeling to develop. A strong legal and regulatory framework therefore is required to efficiently control the extraction process and the revenues it creates. Finally, regarding the LAPSSET, it should be worth noting that the majority of the project is yet to be funded. Important efforts should then be put to finalize the funding of this project, in order to enable the private companies to formulate sustainable plans in Kenya.
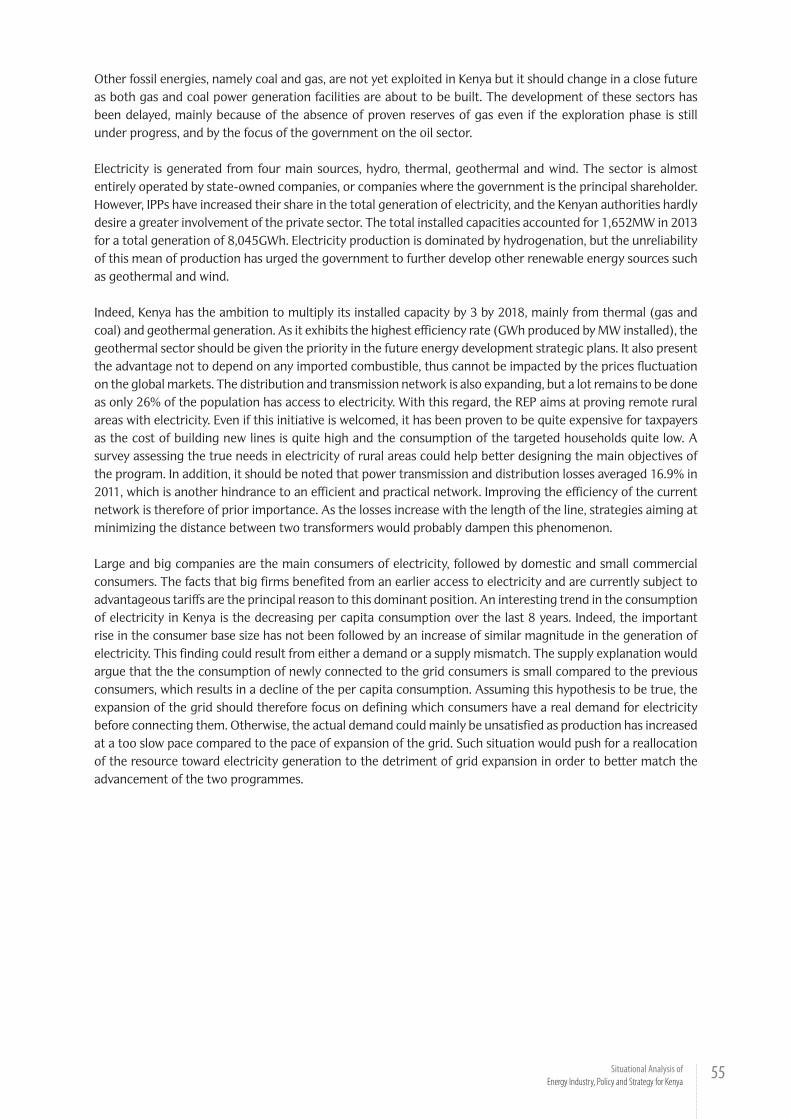
55Situational Analysis of Energy Industry, Policy and Strategy for Kenya
Other fossil energies, namely coal and gas, are not yet exploited in Kenya but it should change in a close future as both gas and coal power generation facilities are about to be built. The development of these sectors has been delayed, mainly because of the absence of proven reserves of gas even if the exploration phase is still under progress, and by the focus of the government on the oil sector.
Electricity is generated from four main sources, hydro, thermal, geothermal and wind. The sector is almost entirely operated by state-owned companies, or companies where the government is the principal shareholder. However, IPPs have increased their share in the total generation of electricity, and the Kenyan authorities hardly desire a greater involvement of the private sector. The total installed capacities accounted for 1,652MW in 2013 for a total generation of 8,045GWh. Electricity production is dominated by hydrogenation, but the unreliability of this mean of production has urged the government to further develop other renewable energy sources such as geothermal and wind.
Indeed, Kenya has the ambition to multiply its installed capacity by 3 by 2018, mainly from thermal (gas and coal) and geothermal generation. As it exhibits the highest efficiency rate (GWh produced by MW installed), the geothermal sector should be given the priority in the future energy development strategic plans. It also present the advantage not to depend on any imported combustible, thus cannot be impacted by the prices fluctuation on the global markets. The distribution and transmission network is also expanding, but a lot remains to be done as only 26% of the population has access to electricity. With this regard, the REP aims at proving remote rural areas with electricity. Even if this initiative is welcomed, it has been proven to be quite expensive for taxpayers as the cost of building new lines is quite high and the consumption of the targeted households quite low. A survey assessing the true needs in electricity of rural areas could help better designing the main objectives of the program. In addition, it should be noted that power transmission and distribution losses averaged 16.9% in 2011, which is another hindrance to an efficient and practical network. Improving the efficiency of the current network is therefore of prior importance. As the losses increase with the length of the line, strategies aiming at minimizing the distance between two transformers would probably dampen this phenomenon.
Large and big companies are the main consumers of electricity, followed by domestic and small commercial consumers. The facts that big firms benefited from an earlier access to electricity and are currently subject to advantageous tariffs are the principal reason to this dominant position. An interesting trend in the consumption of electricity in Kenya is the decreasing per capita consumption over the last 8 years. Indeed, the important rise in the consumer base size has not been followed by an increase of similar magnitude in the generation of electricity. This finding could result from either a demand or a supply mismatch. The supply explanation would argue that the the consumption of newly connected to the grid consumers is small compared to the previous consumers, which results in a decline of the per capita consumption. Assuming this hypothesis to be true, the expansion of the grid should therefore focus on defining which consumers have a real demand for electricity before connecting them. Otherwise, the actual demand could mainly be unsatisfied as production has increased at a too slow pace compared to the pace of expansion of the grid. Such situation would push for a reallocation of the resource toward electricity generation to the detriment of grid expansion in order to better match the advancement of the two programmes.

56 Situational Analysis of Energy Industry, Policy and Strategy for Kenya
Kenya Energy Scenarios6
6.1 Introduction
6.1.1 BackgroundEnergy is an indispensable prerequisite to economic activity and improving human quality of life. Households need energy for cooking, lighting while transportation is only possible through the use of energy. Essential facilities, such as hospitals, require electricity for cooling, sterilization and refrigeration.
Energy is also a major determinant of the cost of living as almost every consumed product and service has its input. Oil, the major source of energy used in the country, is subject to international price volatility, thereby having a huge impact on the economy. Energy supply and use has a significant impact on the environment through climate change effects.
Some of the overall national development objectives of the government under the country’s development blue print, the Vision 2030 include: accelerated economic growth; increasing productivity of all sectors; enhanced agricultural production; industrialization; and accelerated employment creation. These will inherently increase the demand for energy and therefore the realization of these objectives is only feasible if quality energy services are availed in a sustainable, cost effective and affordable manner to all sectors of the economy. Increasing access, sustainability, reliability and affordability of energy is crucial if the country is to attain the desired Gross Domestic Product (GDP) growth rate of 10 per cent per annum, and improving the lot of Kenyans effectively reducing poverty levels.
The government has already come up with an investment plan to modernize the energy infrastructure network, increase the share of energy generated from renewable energy sources, and provide energy that is affordable and reliable to businesses and homes by 2030. Owing to this fact, IEA conceptualized an energy scenarios project in order to evaluate the feasibility of this plan given the probable changes that might occur in the future. The scenarios exercise also sought to describe the risk on non-action. On July 24, 2013, the IEA convened energy stakeholders to participate in a scenarios exercise that would examine the energy sector more closely to determine what the energy sector would have to do to achieve the successful transition desired by the plan in Vision 2030.
6.1.2 What are scenarios?Scenarios are stories describing alternative futures and how they might come about. They are therefore plausible stories about the future. The use of scenario building exercises in Kenya seeks to have participants and the recipients of the message explore and reveal the complex and intricate inter-relationships and dynamics of the various issues related to development and the evolution of the country. It is envisaged that through this process, different interest groups find common ground and a common language that will assist and support in the building of a shared pictures of alternative possible futures as well as articulating approaches to these alternative possible futures.
This process, which has been facilitated through the development of scenarios, is also aimed at building a culture of partnership and trust amongst the different stakeholders involved. The scenarios developed are used to catalyze dialogue and debate at various levels in society and it is plausible that they could contribute to the action plans of both civil society groups and government.
Scenarios are important because they help:Anticipate and Leverage Change: Scenarios help identify surprises and discontinuities in trends and in the
57Situational Analysis of Energy Industry, Policy and Strategy for Kenya
key factors that are identified as being crucial to supporting the realization of the desired future. As such, it becomes easier to identify pitfalls and provides opportunities to leverage new opportunities as well as produce robust and resilient strategies.
Stimulate New Ways of Thinking: Scenarios encourage thinking beyond traditional approaches to problem solving and exploitation of opportunities. They have the power to break stereotypes and this new way of thinking can serve as a catalyst for radical as opposed to incremental changes. They bring a new dimension to on-going conversations on the problems and issues related to the experience and reality of the country.
Reduce Future Risk: The use of scenarios can help the government, private sector and civil society groups better determine the outcome of certain actions before they are actually taken. Further, by being able to recognize various signals, surprises can be minimized while responses and action can be made more effective.
Develop Consistent Frameworks: Within the framework of a nation, it is difficult to orchestrate a focused vision. Scenarios however, provide a common framework and language for discussing and dealing with complex conditions and options. Most importantly, they help build and expand common ground, the presence of which is essential for societies to address and seek solutions to their problems.
Scenarios are not in any way predictions. They are however an essential tool in understanding the complex and uncertain environment within which energy actors must operate, and a tool through which we can challenge our own assumptions for better preparedness of the future.
There are various scenario methodologies used depending on the purpose of the exercise. They include but are not limited to the following. i. Sense making or uncertainty scenarios help look for ways to survive in a world that one does not control.
They describe a range of uncertainties e.g. the impact of oil discovery and other minerals in Kenya or the impact of climate change etc. They help an organization to find out how that contextual environment will affect the roles and relations of various actors in the transactional space. They also enable organizations to surface assumptions, deepen causal links, re-frame the situation, and sensitize stakeholders but most of all, to anticipate change. This type of scenarios building is good for exploring organizational survival.
ii. Strategizing scenarios find out what actions the organization should take in the transactional environment like making a delicate decision thus gaining the ability to act. For example, an oil drilling company may want to expand its business to Kenya. The company would therefore seek to gain a greater understanding of the external future of oil drilling in Kenya, explore and understand the existing and emerging challenges as well as existing and potential opportunities before they make the decision to invest. These scenarios therefore help discover or invent options, map and test these options, engage others and build confidence.
iii. Normative or norm creating scenarios on the other hand helps create a common ground with which to approach the future. In other words, they push an organization or a group towards a specific perspective e.g. achieving a successful transition to a desired future. They involve different stakeholders and challenge group thinking, help build a team and help create a common language within which issues are addressed to institute change.
6.1.3 Scenarios methodology used Given the fact that an energy vision is being pursued without sufficient attention to peripheral issues or forces on the edge of the horizon that could upset the desired outcome, a methodological choice was made to use the norm creating scenarios technique. The scenarios are constructed on the basis of various images of the future as described in the vision such as clean energy provision for all that is cost effective and reliable. The work focuses on describing how the normative (desirable) future objective or end-point can be reached while testing the strategy in light of future probabilities.
To this extent, the author attempts to discern the likely outcome of a range of ‘expected’ future developments (what in the document is referred to as critical certainties) i.e. trends whose effects on future consumption of energy and greenhouse emissions are known such as population, urbanization and economic performance. The author also outlines the implications of different key drivers of the future that are critical but not certain (what

58 Situational Analysis of Energy Industry, Policy and Strategy for Kenya
in the document is referred to as critical uncertainties) i.e. trends that one cannot fully determine the direction they are likely to take and are therefore considered as game changers. These key drivers include fluctuating global prices, cost of investment on energy sources, governance of energy resources, technology (cost, uptake, access, innovation), the geopolitics related to energy, consistency in supply of energy, socio-cultural factors, cost of energy, climate change, energy sources and patterns of consumption.
The implications and also the feasibility given these conditions are then drawn up. The risks envisaged as a result of these critical uncertainties are also examined and an undesirable future drawn up. As a result, prerequisite sustainability conditions such as activities required to achieve the envisioned targets on time, current adjustments needed as well as long-term risks that could occur while implementing the energy vision are identified. The work therefore provides useful insights to technocrats and policy makers to understand the consequences of trying to achieve the desired outcomes and avoid the risks of undesirable ones. The normative scenarios also allow various stakeholders in the sector and decision-makers to anticipate their reactions
The strategic level of analysis and time horizon for the scenariosThe scenarios exercise looks at Kenya’s energy sector within the national space. The scenarios are for a period of 16 years and therefore look at the year 2030.
6.2 SWOT Analysis of the energy sector
Influential internal and external trends in the energy sector (as seen by the scenarios participants) help determine both the internal and external factors of the sector that will influence the future. The section is also used to confirm the importance of a driver or contribute to other critical drivers that will be important in determining the future of the sector.
Strengths of the energy sector Opportunities of the energy sector
• Existingandpotentialrenewableenergyreservesinvariouspartsofnorthern Kenya and other arid lands. Specific areas that have been identified for wind power generation include Marsabit, Laisamis and Samburu.
• Relativeabilityofthecountrytomeetherenergyrequirementsin comparison to her neighbours Tanzania and Uganda that have persistent power shortages.
• Governmentcommitmenttodevelopmentoftheenergysector.The sector has been factored into the Vision 2030, Kenya’s development blue print. The country has so far put forward some ambitious capacity expansion and diversification targets in the Vision 2030 and following energy policies.
• Supportivestakeholdersincludingdevelopmentpartners,producers,retailers, research institutions, project developers, non-governmental organizations, manufacturers and government agencies.
• Goodwillbydevelopmentpartnerstowardsthedevelopmentoftheenergy sector e.g. the funding of the Energy Sector Recovery Project by the World Bank.
• Increaseindemandforenergythatcanbeattributedtoincreasedinvestment by both the formal and informal sectors as well as increased demand for power by households.
• Diversificationofsourcesbeyondpetroleumproducts.• Existingandpotentialrenewableenergysourcesfor
hydroelectricity, biomass, biogas, wind in Marsabit, Turkana and coastal region, and solar power owing to the country’s position astride the equator mainly in eastern and North Eastern parts of the country that receives a lot of sunshine.
• Increasinginterestsinanddemandforrenewableenergyasaresultof increasing energy prices and climate change.
• Rapidlychangingbusinessenvironmentthatrequiremoreenergyto facilitate transport and production e.g. in manufacturing.
• Growthofthemiddleclassleadingtoanincreaseinuseoftechnology that is driven by energy.
• Therearehugeinvestmentopportunitiesintheexplorationofhydrocarbons. These opportunities provide a good potential for investment.
• Thoughtheprivatesectorseemswillingtoinvestinprojectslikewind and even geothermal power generation, their wish however is that the government provides securities and guarantees.
• TheNorthernKenyaandotheraridlandshavestrongreliablesunshine throughout the year thus providing high potential for investment in solar energy for sale to the national grid. Almost the whole of North Eastern province has this potential.
• DiscoveryofoilinTurkanaandprospectsinKerioValleywiththepotential of increasing energy production in a country which depends a lot on petroleum products for fueling transport and generation of electricity.

59Situational Analysis of Energy Industry, Policy and Strategy for Kenya
• Increaseindemandforelectricity.Totaldomesticdemandforelectricity registered a growth of 2.2 percent from 6,273.6 million KWh in 2011 to 6,414.4 million KWh in 2012.
• Vandalism,theftoftransformersandpowercablesisamajorproblem that is also escalating the cost of maintaining electricity connections.
Weaknesses of the energy sector Threats of the energy sector
• Highcostofenergyasaresultoftheriseinpriceofpetroleumproducts in the world and the domestic market. Kenya’s energy cost is far much higher than that of Egypt and South Africa.
• Highcostofenergyinvestments.TheValueAddedTax2013Actintroduced VAT on energy generating equipment and this is likely to limit investments into power generation and increase energy costs.
• Irregularelectricitysupplyaswitnessedinpoweroutagesandfluctuations that also result in the damage of equipment making the situation worse.
• Inadequatecapacityofthegovernmenttomeettheeverincreasingdemand for electricity. The government is the main investor in power generation and there is low investment by private investors in generation.
• Environmentaldegradationresultingfromincreaseduseofbiomassfuel impacting negatively on the ability of the country to generate hydroelectric power due to diminishing water sources as result of destruction of water catchment areas.
• Kenya’snaturalresourcesfordevelopmentoflowcostandaffordableenergy are currently very limited.
• Limiteddiversificationandover-relianceonhydropowerwhichconstitutes about seventy (70) percent to eighty (80) percent of the total electrical power hence this has caused the country to carry out power - rationing in times of drought, resulting in the use of very expensive energy power generation.
• Over-relianceonemergencypowerthatpointtoinefficientlongtermplanning.
• Weaktransmissionanddistributionnetworkresultinginhighpowerlosses, frequent power outages, low voltages and contributing to high tariffs.
• Weakandunderdevelopedpowergenerationanddistributioninfrastructure.
• Inadequatedataonenergy.Suchdataisnecessaryforproperplanning and development of the sector.
• Lowvoltagescontributingtohighenergytariffs.• Capacitydeficit, wherebyatpeakdemandthereisinsufficientsupply
to meet expanding consumer demand.• Lackofmajorinvestmentsinthesectorbytheprivatesector.• Thecountryseemstobeoverrelyingonpetroleumandunderrelying
on assured sources of energy such as solar or wind energy. • Unavailabilityofdataisachallengeinthecountryandmostdatais
with Civic Society Organizations. Lack of recent data on the energy sector also hampers adequate analysis of issues about the energy sector.
• AcquiringpowerpurchaseagreementsfromKenyaPowerandLightingCompany(KPLC)isdifficult.
• Regulationasachallengeduetolackofregulationstandards.Thereis no regulatory framework and recognition that there are different players in the production of charcoal. The linkages at various levels of the value chain are also weak and unrecognized.
• Climatechangesresultingpartlyfromunsustainableincreaseduseof biomass energy causing deforestation and land degradation. Climate change affects energy sources and energy sources affect climate change. Because of climate change, we have fewer water resources reducing hydro power hence climate change influences source
• Increasinginsecurity,whichispushingawaypotentialinvestorsinthe energy sector.
• Volatileworldoilpricesresultinginhighcostofenergy.• Externalinvestorsinthecountry’soilsectorandagreementsthatmakeitdifficultforthecountrytostartreapingimmediatebenefitsfrom the drilling of oil.
• Developmentpartnersinterferencee.g.concernoverWorldBankpressure on government to enter into contract with particular suppliers.

60 Situational Analysis of Energy Industry, Policy and Strategy for Kenya
6.3 Identifying the driving forces/variables
The dynamic characteristics in today’s complex operating environment of the energy sector are key in determining future trends. While some of these are new, most stem from the socio-economic changes Kenya has undergone during the past decade. The driving forces also represent common strategic concerns by the stakeholders and as enumerated in the SWOT analysis. These include both critical certainties and critical uncertainties.
6.3.1 Drivers of the future: Critical certaintiesThe future trends that will certainly influence the outcome of the energy sector are demographics, urbanization and economic performance.
6.3.1.1 DemographicsAccording to the BP Energy Outlook 2035, Africa will have 21% (1.8 billion) of the world’s population compared to 15% today. The region will also account for 44% of the global increase. As a result, energy demand is projected to grow by 93% between today and 2035, much faster than the global average of 41%. That will make Africa experience the world’s fastest regional energy demand. In Kenya, the population by 2030 will have grown by 1.7 times as shown in figure 1 thus significantly increasing the amount of energy consumed in the country
Figure 1: Kenya’s population growth by 2030
Age 2009 Population 2030 Population Increase
0 - 14 43 16,602,341.71 33 21,384,243.87 1.3 times
15 - 34 35 13,513,533.95 38 24,624,280.82 1.8 times
35 -64 18 6,949,817.46 27 17,496,199.53 2.5 times
65 - 75+ 3 1,158,302.91 4 2,592,029.56 2.2 times
38,610,097.00 64,800,739.00 1.7 timesSource: KNBS 2009
6.3.1.2 UrbanizationIn 1990, Kenya’s urbanization was 18 percent. By 2020, 40 percent of Kenyans will live in cities and by 2030, as illustrated by figure 2, 30 million Kenyans (48 percent) are expected to reside in urban areas. In 2033 half (50%) of its population will then be living in urban areas. The growth of urban sector will alter energy use among the population. It will also act as a driver for strengthening economic advancement as productivity in urban areas is double that of rural economies. That productivity increases the demand for energy.

61Situational Analysis of Energy Industry, Policy and Strategy for Kenya
Figure 2: Kenya’s urbanization by 2030
6.3.1.3 Economic performance
According to the African Development Bank (ADB), strong economic growth in the past two decades has been partlyduetoincreaseinthesizeoftheAfricanmiddleclass(definedasearningsofbetweenUS$4andUS$20per day). ADB projects that the middle class will continue to grow, from 355 million (34% of Africa’s population) in 2010 to 1.1 billion (42%) in 2060. Conversely, poverty levels are expected to fall, with the proportion of the population livingon lessthanUS$1.25adaydecliningfrom44%in2010to33.3%in2060.Thecontinentseconomy is also expected to increase as shown on table 3 due to trade and natural resource exploitation factors that will inevitably increase energy consumption.
Figure 3: Real GDP growth by sub region (%)
2000 2010 2020 2030 2050 2060
Africa 4.5 4.9 6.2 5.9 5.3 5.0
Central Africa -1.4 4.7 7.2 6.8 2.8 4.1
East Africa 7.5 6.2 7.9 9.3 8.3 6.8
North Africa 3.9 4.7 5.5 4.8 3.7 3.2
Southern Africa 5.4 3.3 3.9 5.3 4.5 4.1
West Africa 4.1 6.7 8.8 5.5 4.6 4.9
As illustrated in figure 4, an increase in population, urbanization and the economy will inevitably lead to increase in consumption of energy and greenhouse emissions
Figure 4: Critical certainties driving future energy consumption
Source: Verlag Bertelsmann Stiftung, 2012
+ + =Population Growth Urbanization Economic Growth Greater energy consumption & green house emissions

62 Situational Analysis of Energy Industry, Policy and Strategy for Kenya
6.4 Drivers of the future: Critical uncertainties
From the workshop participants stated the following variables as being key drivers of the future that are critical but not certain (as one cannot fully determine the direction they are likely to take) and are therefore considered as game changers.
Uncertain Variable Reason
Resource availability • Consumptionofmorequantitiesofnon-renewableresourceswilleventuallyaffectsupplyanddemandoftheseenergy sources
• CommerciallyviablenewresourcefindswillbeagamechangerforKenya• Energy-water-foodnexusexposingenergysupplychaintorisksregardingchangingwateravailabilityandpolicies
to combat hunger.
Geo-politics • Highorfluctuatingglobalpricese.g.ofoil• Globaleconomiccrisis• Significantworldwiderestrictionse.g.ongreenhousegasemissionswhichmaycausesharpchanges.• Thelackofglobalagreementonclimatechangemitigation• ShiftingdemandtoEast(specificallyChina)aswellascompetitionforscarceresourcesbytheEastandWestern
markets• ThePoliticalfragilityandpotentialconflictoftheMiddleEastandNorthAfrica(e.g.aroundSuezCanal),whichis
gravely affecting global security of supply.• Terrorismanditseffectonthesector
Technological developments
• Marketpricesandscarcityofresourcesinspirescreativityoftechnologiesthatwillreducecosts,increasesupplyorgive alternative energy
• Uptake,costandaccesstonewtechnologieswillbecriticalindeterminingfutureenergysourcesand• Energyefficiencythroughinnovativetechnology
Environmental impact
• Nonrenewableresourcesareattheheartofpollutionandgreenhousegasemissions.Ithasprovendifficulttofindenergy sources that are affordable and clean. In the case of liquid fuels, the energy sources that produce the lowest emissions are also the most costly.
• Changingclimaticconditions
Policy /Governance • Thecountry’swillingnessandcapabilitytoinvestinvariousenergysources• Institutions,laws,communityparticipation• Shortageoffutureengineeringorotherenergy-relevantskillsnegativelyaffectingenergyinfrastructure
development and expansion.• Levelofenergyaccesstoall• Corruptionanditseffectoneffectivedelivery/supplyofenergy• Regionalinterconnectednesswherethereisunderdevelopmentofregionalinfrastructureandpotentiallyhigh
cost implications of unequal distribution of resources. This includes overcapacity and underinvestment in energy infrastructure as a growth constraint.
• Fragmentedregulationleadingtoineffectivesolutions.• Newresourcefindswithintheboardersandamongourneighbours• Roleoftheprivatesector• Theroleofdevolution
Price/cost of energy • Aslongaseconomicgrowthanddevelopmentdependsonconsumingmorequantitiesofnonrenewableresources, the price/ cost of production will inevitably rise. This will affect demand and supply
• Fromageographicalperspective,thedemandfornonrenewableresourcesraisespricesandamonopolyoftheresources causes price volatility
• Affordabilityofenergyinhouseholds
Socio-cultural factors • Patternsofconsumptionasenabledbyculturalfactors
6.5 Impact/Uncertainty Analysis
The critical certainties and uncertainties were mapped out to determine the level of impact and the level of uncertainty. The drivers with the highest level of impact and the level of uncertainty will be the most critical in determining the future of energy in Kenya.
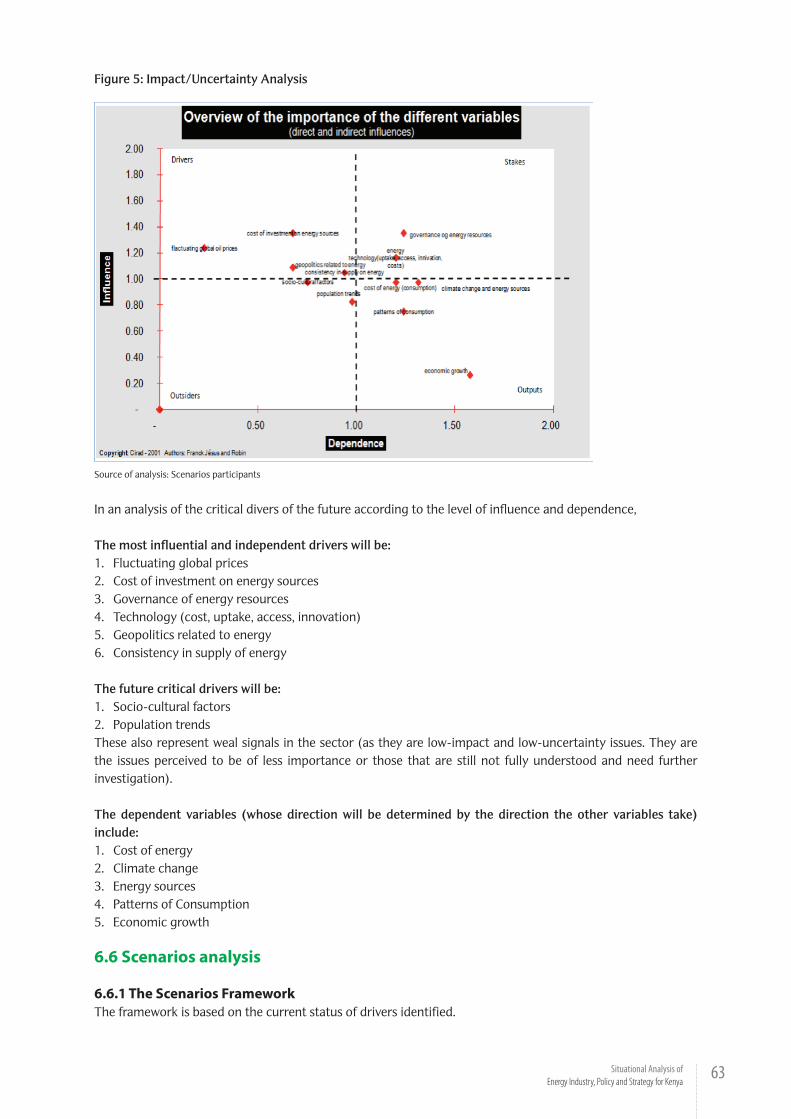
63Situational Analysis of Energy Industry, Policy and Strategy for Kenya
Figure 5: Impact/Uncertainty Analysis
Source of analysis: Scenarios participants
In an analysis of the critical divers of the future according to the level of influence and dependence,
The most influential and independent drivers will be:1. Fluctuating global prices2. Cost of investment on energy sources3. Governance of energy resources4. Technology (cost, uptake, access, innovation)5. Geopolitics related to energy6. Consistency in supply of energy
The future critical drivers will be:1. Socio-cultural factors2. Population trendsThese also represent weal signals in the sector (as they are low-impact and low-uncertainty issues. They are the issues perceived to be of less importance or those that are still not fully understood and need further investigation).
The dependent variables (whose direction will be determined by the direction the other variables take) include:1. Cost of energy2. Climate change3. Energy sources4. Patterns of Consumption5. Economic growth
6.6 Scenarios analysis
6.6.1 The Scenarios FrameworkThe framework is based on the current status of drivers identified.
64 Situational Analysis of Energy Industry, Policy and Strategy for Kenya
Uncertain Variable Status quo
Population growth and urbanization
The current population (2014) is 15.7 million Kenyans. The current electricity demand is 1,191 MW while the effective installed capacity under normal hydrology is 1,429 MW with only 23% of the population having access to electricity in Kenya. Currently, only 3 out of every 10 Kenyans live in urban areas.
Economic performance (Per capita consumption of energy)
The per capita commercial energy consumption for Kenya has been declining. The Lack of major private sector investments as most investment is dominated by the public sector contributes to the low supply of power, whichmakesitdifficultforthecountrytomeetitsenergydemand.
Affordability of energy and its impact on the competitiveness of the country as an investment destination, weak transmission and distribution network resulting in high power losses, low voltages contributing to high tariffs, low connectivity rate, vandalism, theft of transformers and power cables escalates the cost of maintaining electricity connections are some of the challenges the energy sector faces.
Additionally, the length of time it takes (approximately 66 days) to obtain electricity connection and the frequent power outages cost Kenya 1% - 5% of GDP. Low countrywide electricity access of 23% is too low compared to Africa (32%).
Price/Cost of energy Cost of electricity is 4 times that of South Africa and 3 times that of China. High cost of power from Independent Power Producers (IPPs) contributes to high cost of doing business in Kenya.
Geo-politics Kenya has currently entered into various bi-lateral and multi-lateral agreements with neighboring countries to scale up energy access, improve quality and reliability of supply as well as reduce system losses.
Resource availability Hydro-generation
Hydro-power is one of the two main components of the formal energy infrastructure in Kenya as it accounts for 46% of the country’s total energy capacity.
Oil and gas Petroleum is the other main component of the formal energy infrastructure in Kenya as it forms 25% of total Kenyan imports, both crude oil and already refined products. Currently, Kenya imports 100% of its petroleum needs. Economically exploitable oil deposits have been discovered in the Rift Valley region and should turn Kenya into an oil producer country within the next few years. Retail pump outlets and road transport continue to consume the highest share (over 60%) of petroleum.
Uganda and Tanzania have proven reserves of natural gas of 230 and 500 billion cubic feet (bcf) respectively, plus an additional 2.5 billion barrel (bb) of proven reserves of oil in Uganda.
The sector also has fluctuating cost of petroleum due to global dynamics
Biomass Biomass (mainly firewood and charcoal) constitutes the main source of primary energy in rural Kenya and poor urban households. It accounts for about 68% of the total energy use.
The demand for wood fuel is 40.5 million tonnes while the supply is 16 million tones of biomass hence a deficit of 24.5 million tones i.e. a 60.5% deficit.
The total industry use of biomass is 75%. The CO2 emissions resulting from charcoal production are 6 to 13 times higher than those resulting from firewood combustion
Coal Initial exploration activities of the Mui basin in Kitui and Mwingi districts have indicated existence of coal. Appraisal drilling projects to ascertain the commercial quality and viability of the deposits are in progress.
Geothermal Excellent geothermal resources exist in the East African Rift system and the potential is large, particularly in Kenya and Ethiopia. Only Kenya has started to exploit its potential and the technology is fully mastered by Kenyan energy engineers.
Wind There is investment of wind power generation by IPP’s at various sites.
Solar Because of its strategic geographic position, Kenya is particularly suited for solar energy exploitation with the whole Eastern part of the country having insulation levels of 5.5 to 10kWh/m2/day, the country average lying between 4 and 6 kWh/m2/day.
Technological developments Kenya experiences a weak power transmission and distribution infrastructure due to limited investments in power system upgrading. As a consequence, the economy experiences high electric power system losses, extreme voltage fluctuations and intermittent power outages, which cause material damage and losses in production.
Environmental impact The use of biomass mainly wood fuel and coal causes severe environmental damage

65Situational Analysis of Energy Industry, Policy and Strategy for Kenya
Governance There is an ambitious plan by government through vision 2030 to increase energy supply through heavy infrastructure investment and exploration of natural resources
Socio-cultural factors 68% Kenyan consumption of energy is largely dominated by biomass, 21% by petroleum products, 9% by electricity and 1% by solar and other forms of energy. Wood fuel and charcoal are the main biomass sources of energy and are mainly used in rural areas where 80% of the population lives and uses this kind of energy. Imported petroleum and electricity are the two principal components of the domestic energy market in Kenya and are mostly used by people in urban areas, supplying both households and businesses.
6.6.2 The Scenario StoriesThe scenarios seek to present a set of plausible and coherent stories of how Kenya’s future may unfold by 2030 based on a systemic analysis of critical drivers and uncertainties. The scenarios consider three main linkages. (i) The societal configuration i.e. population growth, urbanization, people’s welfare (poverty and inequality), (ii) economic configurations such as GDP growth and economic sectors driving energy like transport and manufacturing, and (iii) environmental configurations that affect or are affected by energy demand and supply as depicted in figure 6.
Figure 6: Premise of scenario stories and the energy trilemma
Source: Authors own analysis and World Energy Council, 2014
The interface of these factors - in different forms - combine to produce different outcomes, some of which result in unprecedented uncertainty for the energy sector. Creating a policy framework that simultaneously delivers secure, affordable, and environmentally sustainable energy (what is referred to as the ‘energy trilemma’ by the World Energy Council, 2014), is fundamental. In the context of this uncertainty, the framework offers a reference point against which to strengthen the foundation for developing balanced policies and taking informed and critical decisions on the future energy sector.
The analysis produced two energy futures for Kenya. The first is the possible outcome if various forward looking choices are made by 2030 towards realizing sustainable outcomes i.e. the renewable energy scenario and the second is the possible outcome if Kenya conducts business as usual i.e. the non renewable scenario as depicted in figure 7
Figure 7: Energy scenarios
Source: Authors own depiction
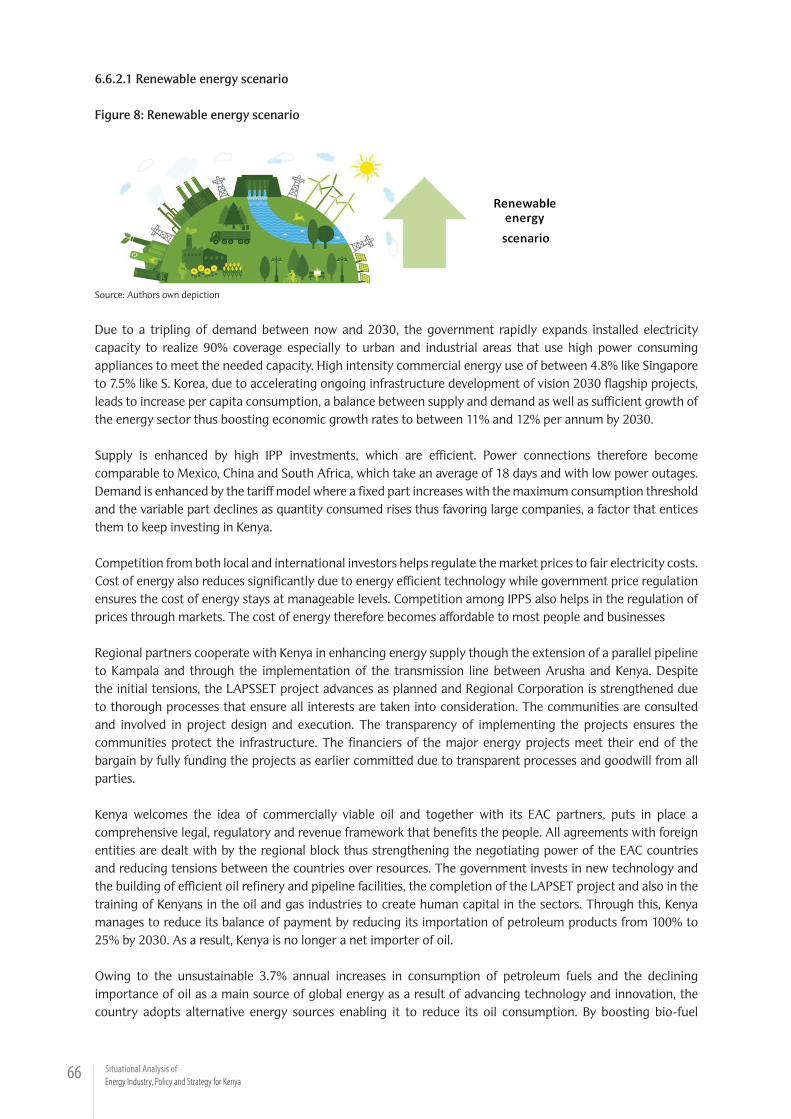
66 Situational Analysis of Energy Industry, Policy and Strategy for Kenya
6.6.2.1 Renewable energy scenario
Figure 8: Renewable energy scenario
Source: Authors own depiction
Due to a tripling of demand between now and 2030, the government rapidly expands installed electricity capacity to realize 90% coverage especially to urban and industrial areas that use high power consuming appliances to meet the needed capacity. High intensity commercial energy use of between 4.8% like Singapore to 7.5% like S. Korea, due to accelerating ongoing infrastructure development of vision 2030 flagship projects, leads to increase per capita consumption, a balance between supply and demand as well as sufficient growth of the energy sector thus boosting economic growth rates to between 11% and 12% per annum by 2030.
Supply is enhanced by high IPP investments, which are efficient. Power connections therefore become comparable to Mexico, China and South Africa, which take an average of 18 days and with low power outages. Demand is enhanced by the tariff model where a fixed part increases with the maximum consumption threshold and the variable part declines as quantity consumed rises thus favoring large companies, a factor that entices them to keep investing in Kenya.
Competition from both local and international investors helps regulate the market prices to fair electricity costs. Cost of energy also reduces significantly due to energy efficient technology while government price regulation ensures the cost of energy stays at manageable levels. Competition among IPPS also helps in the regulation of prices through markets. The cost of energy therefore becomes affordable to most people and businesses
Regional partners cooperate with Kenya in enhancing energy supply though the extension of a parallel pipeline to Kampala and through the implementation of the transmission line between Arusha and Kenya. Despite the initial tensions, the LAPSSET project advances as planned and Regional Corporation is strengthened due to thorough processes that ensure all interests are taken into consideration. The communities are consulted and involved in project design and execution. The transparency of implementing the projects ensures the communities protect the infrastructure. The financiers of the major energy projects meet their end of the bargain by fully funding the projects as earlier committed due to transparent processes and goodwill from all parties.
Kenya welcomes the idea of commercially viable oil and together with its EAC partners, puts in place a comprehensive legal, regulatory and revenue framework that benefits the people. All agreements with foreign entities are dealt with by the regional block thus strengthening the negotiating power of the EAC countries and reducing tensions between the countries over resources. The government invests in new technology and the building of efficient oil refinery and pipeline facilities, the completion of the LAPSET project and also in the training of Kenyans in the oil and gas industries to create human capital in the sectors. Through this, Kenya manages to reduce its balance of payment by reducing its importation of petroleum products from 100% to 25% by 2030. As a result, Kenya is no longer a net importer of oil.
Owing to the unsustainable 3.7% annual increases in consumption of petroleum fuels and the declining importance of oil as a main source of global energy as a result of advancing technology and innovation, the country adopts alternative energy sources enabling it to reduce its oil consumption. By boosting bio-fuel

67Situational Analysis of Energy Industry, Policy and Strategy for Kenya
energy producing industries like sugarcane and investing in technology, the increase in the production of bio fuels is realized. Government policy to give tax incentives to bio-diesel enabled cars and hybrid cars over petrol powered cars enhance the consumption of bio-fuel in Kenya thus significantly reducing the petroleum demand in the country. Caution is however taken to ensure that the bio-fuel industry in Kenya does not interfere with the food security of the country. Government ensures this through reclaiming of arid and semi-arid parts of the country that comprises of two thirds of the country’s land area to enhance food production. The continued implementation of the strategy to reduce petroleum feeding electricity generation further reduces the demand for petroleum.
By 2015, establishment of a proper afforestation policy aims at creating a forest cover of 10% by 2030. A campaign on zero tree cutting gains momentum and legislation is passed in that regard with very punitive measures on logging. The price of charcoal is also made very prohibitive thus deterring a lot of households from using it as a source of energy. Wood products such as furniture, carvings etc. are also banned. Universal access to energy efficient appliances is facilitated by the government in rural areas and poor urban households thus significantly improving the uptake of clean cooking and heating energy sources. The total industry use of biomass reduces significantly to 10% due to formalization of the sector and the incentives provided by the government. The sector not only creates a lot of employment opportunities but Kenya is also compliant with international law to reduce CO2 emissions.
Kenya has access to a lot of local coal as an energy source. Though initially it was a major contributor to high carbon emissions, the adoption of high energy efficient technologies such as Carbon Capture and Storage (CCS) makes it user friendly. It also contributes immensely in the lowering of energy costs in the country and contributes to the diversification of energy sources in Kenya as it is integrated to generate electricity
Geothermal energy exhibits the highest efficiency rate. It is environmentally harmless and immune to adverse-effects of climate change. It is thus the most promising source of renewable energy in Kenya hence a strategic move by government to have this source of energy dominating the sector. Its generation overtakes hydroelectric generation to become the main source of energy in Kenya by 2017. As a result, the composition of Kenya’s formal energy infrastructure changes by 2030 thus re-balancing the energy mix between the local and the foreign/imported to 80:20Government designs incentive packages to promote private sector investment and puts in place price regulation to make it affordable to Kenyans.
In order to meet the growing energy needs of its citizens, government funds research and innovation of new technologies to improve electricity access. It actively pursues new local and international technologies to expand and upgrade the transmission and distribution networks as well as promote the transition to a renewable-based energy system to the citizens mainly through zero rating of energy efficient technology to make it more available to citizens and through increased availability of renewable energy sources at subsidized prices. The outlawing of inefficient technology sources and a high compliance rate forced on people by the law helps with the transition to high energy efficient technology. The deliberate policies and governments massive investment in the development of renewable sources of energy such as geothermal, solar and wind among others ensure the greening of all energy significantly decreasing green house gas emissions by 2030.
County governments of Marsabit, Samburu, parts of Laikipia, Meru North, Nyeri and Nyandarua, Lamu, offshore Malindi and Narok plateau particularly invest in wind energy through PPPs i.e. Public Private Partnerships to increase electricity coverage in their counties. Adverse weather conditions lower the water table to unviable levels forcing a deliberate systemic reduction of hydro-generation by government to only 10% of the country’s total energy capacity by 2030. Other sources of electricity like solar energy provide more efficient power generation particularly due to tax incentives and technological advancements thus increasing the uptake by rural households and poor urban households for cooking, water heating and lighting purposes.

68 Situational Analysis of Energy Industry, Policy and Strategy for Kenya
Summary of the renewable energy scenario
By 2030, there is: the ability of all providers to meet the current and future energy demand; there is adequate and reliable energy infrastructure; a healthy balance between domestic and external energy supplies; diversified energy mix to reduce over-reliance on hydro and petroleum sources of energy; regional interconnectedness over resources; local technical capacity; innovation of more energy efficienttechnologies;aswellasguaranteesofeffectivemanagementofresourcesforthemutualbenefitofallhenceenergysecurity.
By 2030, there is accessible and affordable energy supply across the population hence the presence of energy equity
By 2030, there is there is technical innovation and government policies that ensure the supply and demand of renewable energies across the board and low carbon emissions hence environmental sustainability
6.6.2.2 Business as usual/ non-renewable energy scenario
Figure 9: Business as usual/ non-renewable energy scenario
Source: Authors own depiction
While demand increases exponentially due to an increase in population by 2030, the governments pace of energy expansion is slow hence supply remains quite low compared to demand which is intensified by 48% of the urban population. As a result, coverage only grows to 35% by 2030. There is low intensity commercial energy use, which stagnates economic performance due to continued government monopoly over supply. The sector continues to manifest weak financial performance thus impeding access to domestic and international money markets for the needed system reinforcement and expansion.
Production loss due to power outages is approximately 9.3% (compared with the average for Mexico, China and South Africa, which stands at 1.8 per cent) leading to increased cost of installing back up generation systems and increased production losses of 10% of the GDP. The length of time to connect electricity marginally improves to 50 days
Corruption and little investment to upgrade existing technologies still cause high electric power system losses, extreme voltage fluctuations and intermittent power outages. Lack of price regulation escalates the cost of energy causing businesses to relocate to ‘low cost of doing business’ areas. Relocation to other ‘energy efficient’ destinations is also accelerated by social factors like rising insecurity and terrorist attacks in Kenya. The uptake of electricity declines especially among urban dwellers because of prohibitive costs leading to a decrease in per capita energy consumption. However, the government guarantees low electricity prices for REP subscribers, which are not that many due to slow pace of implementing the project. The inability of small consumers to pay the set tariffs also causes them to seek other more affordable but ‘unclean’ energy sources.
Despite several waves of exploration, the unclear oil and gas legal and regulatory framework, the inability of government to effectively manage extraction and exploitation, unclear revenue distribution, corruption and tussles between the Kenya government and foreign companies prevent Kenya from being an oil and gas exporting economy by 2030 as private ownership overrides public investment into the sector.

69Situational Analysis of Energy Industry, Policy and Strategy for Kenya
The revenue from the sector encourages rent-seeking behavior, the state becomes a type of ‘honey pot’ in which competing interests try to capture a significant portion of resource rents. A vicious cycle ensues in which all actors try to gain parts of the bureaucracy while governments, in turn, reward their supporters by funneling favors their way. This greater spending on patronage weakens existing pressure for accountability. Kenya therefore remains a net importer of petroleum products, which has been increasing significantly due to population growth and is characterized by unpredictable prices. The limited expertise of local residents in operating the sectors also limits the employment opportunities they can access.
The LAPSET project is delayed and the Mombasa refinery is never refurbished thus affecting the refinery and transportation of oil to the markets. This necessitates foreign intervention and the repatriation of the resources to other countries to our disadvantage.
Indeed since the realization of oil in Uganda and natural gas in both Uganda and Tanzania, bilateral agreements between individual EAC countries and other countries increase because foreign investors prefer dealing with individual countries and not oil blocks to avoid the kind of problems they experienced in the past with other oil blocks like OPEC. These agreements eventually overshadow and weaken the EAC regional integration as Tanzania prefers to belong to SADC while Uganda prefers to deal with South Sudan.
The increase in resource conflict as a result of corruption also leads to devastating consequences on Kenya’s economy by 2030.
There continues to be a large quantity of wood required to satisfy the rising demand of biomass products for light industries, cooking and domestic lighting due to high costs and unavailability of other clean energy sources. The global economic downturn and high cost of living partly due to high cost of energy sees over 90% of Kenyans reverting to biomass as a source of energy. The unsustainable exploitation of forests and woodlands deplete the forest cover to 1% from 3% by 2030 thus provoking soil erosion, land degradation and severe food insecurity in the country. Hazardous wastes, site contamination, and the lack of sufficient protection of surface and subsurface waters, biodiversity and air quality increases environmental degradation to unacceptable global standards. The plan to develop plantation areas devoted to wood fuel production with appropriate fast growing species flops due to competition for space with agriculture and urbanization. The demand for biomass rises to 75 million tonnes while the supply reduces to 8.25 million tonnes annually thus creating a deficit of 66.75 million tonnes by 2030 i.e. 89% deficit. By 2030, total industry use of biomass escalates to 85% while CO2 emissions rise to prohibitive levels.
Kenya confirms the availability of coal, which becomes widely used due to its cheap price compared to other energy sources. It is integrated to generate electricity. However, limited skills and expertise in drilling, limited existing coal reserve data, poor infrastructure, poor technology, lack of interest from investors, and the absence of a clear legal, regulating, exploration and exploitation coal framework as well as the emission of high quantities of CO2 (which consequently has significant adverse impact on air quality and climate change) are some of the unaddressed challenges in the sector by 2030. The resource is not fully utilized thus other sources like petroleum and hydro-generation continue to dominate the energy sector.
Over reliance on hydro-generation of electricity continues even with the total water availability in Kenya fast reducingfrom~937m3/capitain2014(whichisfarbelowtheaverageforAfrica(~4,500m3/capita)andwatertransmissions losses now averaging 25% from 18.5%. The frequency of power outages escalates to even higher levels of 50% from 33%. High investment costs in hydrogenation infrastructure with the above mentioned challenges make recovery of expenditure very hard by 2030
Though it was expected that wind power will provide total power installed of about 150MW, the IPPs made it too expensive and unaffordable to many Kenyans hence an extremely low uptake of this source of energy. There is still low uptake of solar energy as it is initially costly to install for many people by 2030
Government is unable to invest in research and innovation of new technologies due to increased budget cuts resulting from the high wage bill brought about by devolution. Finances allocated to the Rural Electrification

70 Situational Analysis of Energy Industry, Policy and Strategy for Kenya
Authority for the extension of electricity supply to the rural areas and to public institutions are unaccounted for thus rural electrification programmes stall and coverage barely rises. Unfortunately, the implementation of flagship projects is carried out until 2017. Subsequent governments completely ignore vision 2030 as their development strategy. The deviation leaves many projects incomplete and the intended goals in the sector unachieved.
Summary of business as usual/ non-renewable energy scenario
By 2030, there is: the inability of all providers to meet the current and future energy demand; there is inadequate and unreliable energy infrastructure; the domination of external energy supplies; over-reliance on hydro and petroleum sources of energy; regional disharmonyoverresources;foreigntechnicalcapacity;lackofinnovationandslowuptakeofenergyefficienttechnologies;aswellasineffective management of resources by government for selfish interests thus aggravating communities hence energy insecurity.
By 2030, there is inaccessible and unaffordable energy supply across the population hence the presence of energy inequality
By 2030, there is there is low investment in technical innovation and absence of government policies thus escalating the supply and demand for non-renewable energies across the board hence environmental unsustainability
6.7 The Scenario actors• Inbothscenarios,keyindividuals,groups,and/orinstitutionsplaydifferentroles.Thechoicestheymakeor
the decisions they take often determine the kind of future we are likely to face. These actors include:• Government–isacriticalinplayerpolicyformulationandimplementationaswellasownershipandservice
provision of energy sector. The future outcomes are fundamentally based on the policy decisions made, the regulatory framework set, the level of ownership and service provision in the energy sector. The level of government financing of projects will also determine the future.
• Theprivatesector–playsthecrucialroleofprovidingindependentenergysupply.Theirrolecouldgrowovertime in power generation, distribution and supply but if the business environment is not conducive, they could slow down their investments or relocate to more business friendly environments. They also determine levels of energy cost based on level of competition
• Ordinarycitizens–formpartoftheendusersoftheenergysupply.Theyareimportantplayersinincreasingor reducing CO2 emissions based on their cultural habits, choice of energy and spending patterns on energy.
• Developmentpartners–arecriticalinfinancingenergyprojects.Theoutcomeisbasedonwhethertheygivethe resources or not as well as the conditionalities attached to their resources
• Technicalexperts–willdeterminelevelsofemployment,researchandinnovation• Foreigninvestors–technicalexpertise,repatriationofresources,providingcompetitionandthereforehelp
in regulation of market prices.• Globalpolicymakers–setglobalrulesonenvironmentalstandardswhichdeterminecountryinvestments
and direction • Countygovernments–arecrucialinensuringlevelofenergyaccesstocitizensandarethereforecriticalin
determining the level of equity in access to various forms of energy.
Figure 10: The working terrainSource: Scenarios participants

71Situational Analysis of Energy Industry, Policy and Strategy for Kenya
Policy Recommendations7Various recommendations are crucial if Kenya is to realize the renewable energy scenario in accordance to vision 2030, the constitution and the greening policy framework. The recommendations include:
1. Energy expansion at the rate of population growth, urbanization and industrial growth is crucial if the country is to increase the intensity of energy use and improve the country’s economic performance.
2. Investing in research, innovation, new technology and modern energy infrastructure that is reliable to increase capacity and efficiency as well as encourage the adoption of clean energy
3. Managing the cost of energy through price regulation or competition to reduce cost of living, improve energy equity among the citizens and attract investments
4. Reducing government control and ownership of the energy sector and increasing private sector participation for efficiency and reduction of production losses.
5. Reducing the geo-political tensions with regional neighbours and carefully/transparently negotiating bilateral and multi-lateral agreements with them to ensure mutual benefit and successful regional integration for stronger global negotiation.
6. Involving local communities and county governments along the entire energy chain as well as transparent and accountable management of resources for the mutual benefit of all to reduce tensions and enhance ownership of projects
7. Diversifying the energy mix to reduce over-reliance on finite resources like hydro-generation and petroleum sources of energy
8. Deliberately creating local capacity in the new energy areas to create employment and reduce foreign domination of labour in the sector
9. Investing in a healthy balance between domestic and external energy supplies to shield the country from price volatility and the disadvantages of being a net importer of main energy sources.
10. Improving regulatory compliance of existing provisions as well as formulation of legal and regulatory framework of resources like natural gas and oil to be able to effectively manage extraction and exploitation, have clear revenue distribution and eradicate corruption
11. Promoting energy efficiency using all available methods along the entire energy chain, from exploration to final energy use, including consumer awareness campaigns, financial incentives, standards and regulations
12. Raising public awareness of more efficient energy use, through changes in urban planning, energy efficiency measures, and technology development.
13. Fully exploiting clean and renewable energy sources that are locally available like geothermal in order to increase the energy mix and maximize on the benefits of the resource
14. Fiscal investment in greening of the economy to reduce the impact of climate change and environmental degradation

72 Situational Analysis of Energy Industry, Policy and Strategy for Kenya
References8African Development Bank. Energy Sector Policy of the AfDB Group.
Africa Oil, “Annual Information Form”, 2012
“Available charcoal production technologies in Kenya (Draft Copy)”, UNDP, Kenya Forest Service,
“A roadmap for biofuels in Kenya opportunities & obstacles”, German Technical Cooperation and Ministry of Agriculture – Government of Kenya, 2008
“Biogas Systems in Kenya: A Feasibility Study”, Biogas for Better Life An African Initiative, 2007
Biomass Energy Use in Kenya, International Institute for Environment and Development, 2010
“Charcoal production and commercialization in Kenya”, Kenyan Energy Regulatory Commission presentation
Catherine Mitchell. Energy, Climate and the Environment Series; The Political Economy of Sustainable Energy (Undated)
Christopher O., et al 2009. Regulatory and Competition-Related Reforms in Kenya’s Power and Petroleum Sectors – Final Report
Eberhard A. and Gratwick K., “The Kenyan IPP Experience”, Working Paper No 49, Nov. 2005
Eberhard et al, “Africa Infrastructure Country Diagnostic, Underpowered: The State of the Power Sector in Sub-Saharan Africa”, Background Paper, May 2008
“Energy Performance Baselines and Benchmarks and the Designation of Industrial, Commercial and Institutional Energy Users in Kenya”, Energy Regulatory Commission, Feb. 2013
Foster V. and Steinbuks J., “Paying the Price for Unreliable Power Supplies In-House Generation of Electricity by Firms in Africa”, Policy Research Working Paper, The World Bank, 2009
Githiomi J. K., Mugendi D. N. and Kung’u J. B., “Analysis of household energy sources and woodfuel utilisation technologies in Kiambu, Thika and Maragwa districts of Central Kenya”, Journal of Horticulture and Forestry, Vol. 4, pp. 43-48, Feb. 2012
Githiomi J.K and Oduor N., “Strategies for Sustainable Wood fuel Production in Kenya”, International Journal of Applied Science and Technology, Vol. 2, Dec. 2012
Githiomi J.K Oduor N. 2012. Strategies for Sustainable Wood fuel Production in Kenya. International Journal of Applied Science and Technology, Vol. 2 No. 10; December 2012. Forest Products Research Centre, Kenya Forestry Research Institute
Government of Kenya 2011. Scaling-Up Renewable Energy Program (SREP) Investment Plan for Kenya Draft. Government printer, Nairobi
Government of Kenya 2011. Updated Least Cost Power Development Plan 2011 – 2030. Vision 2030. Government printer, Nairobi
Government of Kenya 2012. National Energy Policy (Third Draft). Ministry of Energy. Government printer, Nairobi
Government of Kenya. Vision 2030 Document. Government Printers, Nairobi.
“Jatropha biofuels in Dakatcha, Kenya-The climate consequences”, Nature Kenya, RSPB, ActionAid, and BirdLife International, 2011

73Situational Analysis of Energy Industry, Policy and Strategy for Kenya
KenGen, 2012 Annual Report and Financial Statement
“Kenya’s Infrastructure: A Continental Perspective”, Africa Infrastructure Country Diagnostic, 2010
Kenya Pipeline Company Ltd, Annual Report and Financial Statement, various issues
Kenya Power, Annual Report and Financial Statement, various issues
Kenya State of Environment and Outlook 2010, National Environment Management Authority, 2010
KETRACO, Annual Report and Financial Statement, various issues
PISCES, “Policies and Regulations Affecting Biofuel Development in Kenya”, PISCES Policy Brief No. 1 Dec. 2008
Practical Action 2010. Biomass Energy Use In Kenya. Prepared for International Institute for Environment and Development (IIED) by Practical Action, Eastern Africa Office
Prepared by Gaffney, Cline & Associates, “Independent assessment of the contingent and prospective resource of Africa Oil Corp. properties in East Africa as at 31st July 2013“, www.africaoilcorp.com
“Scaling-up Renewable Energy Program: Investment plan for Kenya”, Republic of Kenya, 2011
“Stock-taking and gap analysis report on sustainable energy for all”, Ministry of Energy, Mar. 2013
“Strategies for Securing Energy Supply in Kenya”, KIPPRA, Policy Brief Jul. 2007
“Sustainable Tree Management for Charcoal Production”, PISCES, 2012
Torres-Rojal et al, “Biomass availability, energy consumption and biochar production in rural households of Western Kenya” Biomass and Bioenergy, Vol. 35, pp. 3537-3546, 2011
“Updated Least Cost Power Development Plan 2011-2031”, GoK, 2011
“Woodfuels in Kenya and Rwanda: powering and driving the economy of the rural areas”, RURAL 21, 2009

74 Situational Analysis of Energy Industry, Policy and Strategy for Kenya

�e Institute of Economic A�airs (IEA - Kenya) is a Public Policy �ink Tank and Kenya’s premier dialogue forum that seeks to promote pluralism of ideas through open,active and informed public debates on key policy issues, and to propose feasible policy back-up to policy makers including members of parliament as well as through reserach and advocacy. �rough its work, �e IEA-Kenya provides alternative public policy choices and addresses the legal and institutional constraints to economic reforms and growth.
�e IEA-Kenya is independent of political parties, pressure groups, lobbies and any other partisan interests, and its only interest is the generation of cutting edge knowledge to inform the public while contributing to the formulation of rational public policies.
Institute of Economic A�airsACK Garden House, 1st Ngong Avenue
P.O. Box 53989 - 00200Nairobi,Kenya.
Tel:+254 - 020 - 2721262,2717402Fax:+254 - 020 - 2716231
Email:[email protected]:www.ieakenya.or.ke
Twitter:@IEAKenya