six sigma icyb iassc certified lean six sigma yellow belt€¦ · due to excessive pollution, green...
TRANSCRIPT
http://www.gratisexam.com/
ICYB
Number: ICYBPassing Score: 800Time Limit: 120 min
http://www.gratisexam.com/
Six Sigma ICYB
IASSC Certified Lean Six Sigma Yellow Belt

http://www.gratisexam.com/
Exam A
QUESTION 1A Belt will occasionally do a quick experiment referred to as an OFAT which stands for ____________________.
http://www.gratisexam.com/
A. Only a Few Are Tested
B. Opposite Factors Affect Technique
C. One Factor At a Time
D. Ordinary Fractional Approach Technique
Correct Answer: CSection: (none)Explanation
Explanation/Reference:Explanation:
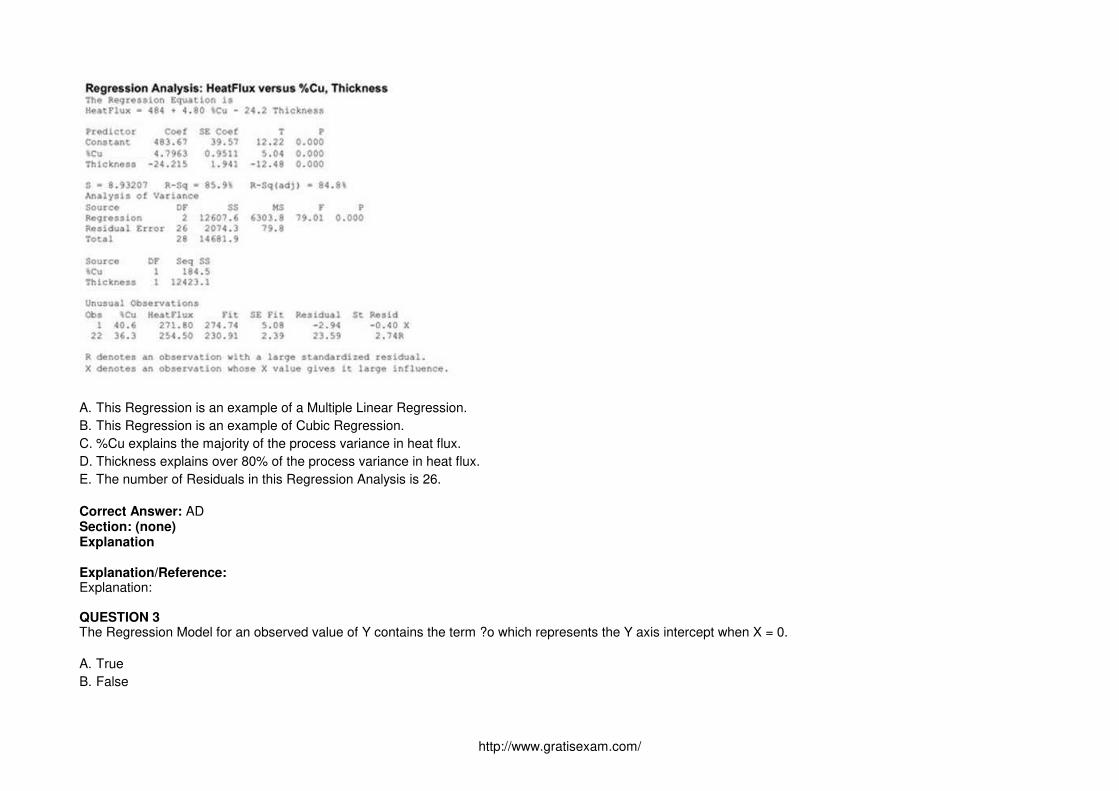
QUESTION 2Which statement(s) are correct for the Regression Analysis shown here? (Note: There are 2 correct answers).
http://www.gratisexam.com/
A. This Regression is an example of a Multiple Linear Regression.
B. This Regression is an example of Cubic Regression.
C. %Cu explains the majority of the process variance in heat flux.
D. Thickness explains over 80% of the process variance in heat flux.
E. The number of Residuals in this Regression Analysis is 26.
Correct Answer: ADSection: (none)Explanation
Explanation/Reference:Explanation:
QUESTION 3The Regression Model for an observed value of Y contains the term ?o which represents the Y axis intercept when X = 0.
A. True
B. False
http://www.gratisexam.com/
Correct Answer: ASection: (none)Explanation
Explanation/Reference:Explanation:
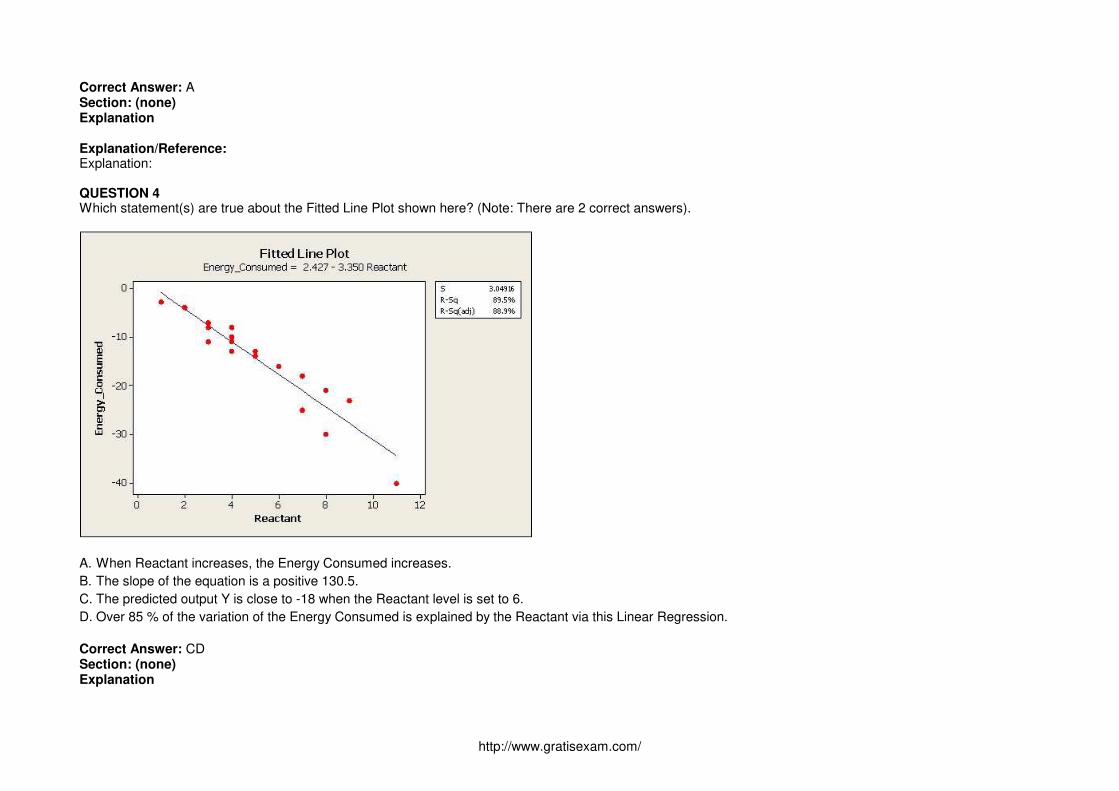
QUESTION 4Which statement(s) are true about the Fitted Line Plot shown here? (Note: There are 2 correct answers).
A. When Reactant increases, the Energy Consumed increases.
B. The slope of the equation is a positive 130.5.
C. The predicted output Y is close to -18 when the Reactant level is set to 6.
D. Over 85 % of the variation of the Energy Consumed is explained by the Reactant via this Linear Regression.
Correct Answer: CDSection: (none)Explanation
http://www.gratisexam.com/
Explanation/Reference:Explanation:
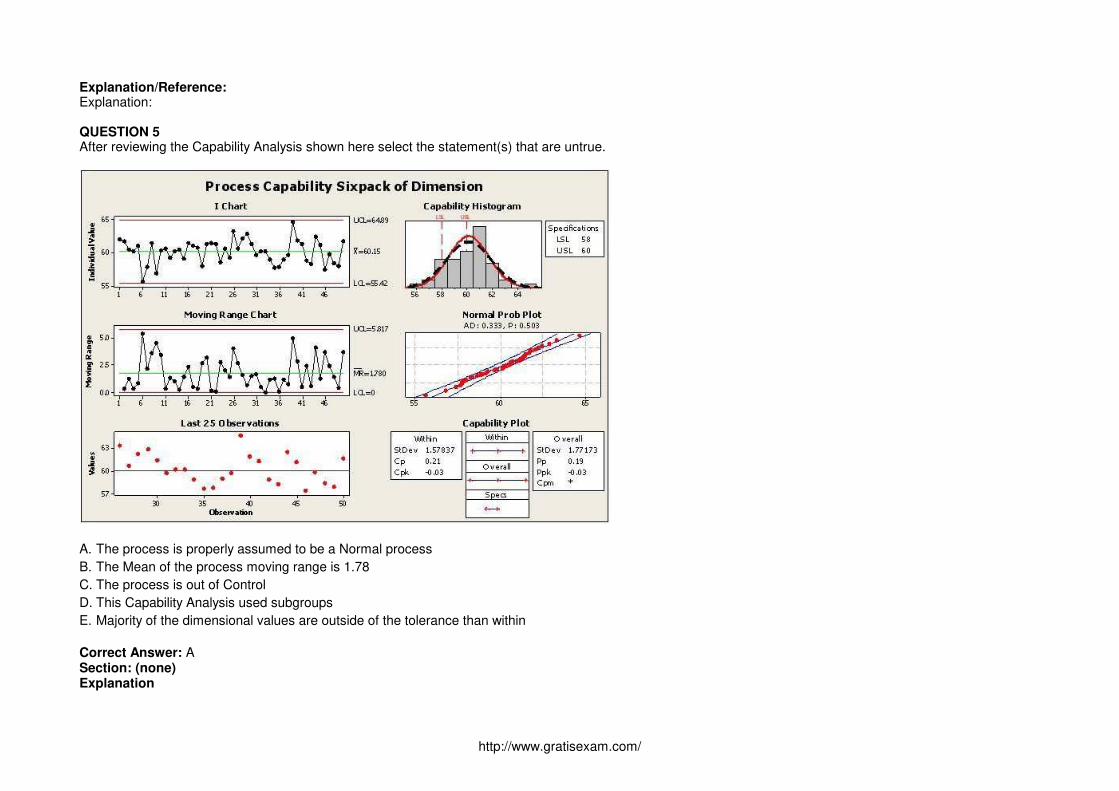
QUESTION 5After reviewing the Capability Analysis shown here select the statement(s) that are untrue.
A. The process is properly assumed to be a Normal process
B. The Mean of the process moving range is 1.78
C. The process is out of Control
D. This Capability Analysis used subgroups
E. Majority of the dimensional values are outside of the tolerance than within
Correct Answer: ASection: (none)Explanation
http://www.gratisexam.com/
Explanation/Reference:Explanation:
QUESTION 6The actual experimental response data varied somewhat from what a Belt had predicted them to be.This is the result of which of these?
A. Inefficiency of estimates
B. Residuals
C. Confounded data
D. Gap Analysis
Correct Answer: BSection: (none)Explanation
Explanation/Reference:Explanation:
QUESTION 7Multiple Linear Regressions (MLR) is best used when which of these are applicable? (Note: There are 3 correct answers).
A. Non-linear relationships between the inputs X's and output Y
B. Uncertainty in the slope of the linear relationship between an X and a Y
C. Relationships between Y (output) and more than one X (Input)
D. Preventing the use of a Designed Experiment if unnecessary
E. We assume that the X's are independent of each other
Correct Answer: CDESection: (none)Explanation
Explanation/Reference:Explanation:
QUESTION 8The generation of a Regression Equation is justified when we _____________. (Note: There are 4 correct answers).
A. Expect the relationship to be Linear between the output and inputs
http://www.gratisexam.com/
B. Know that there is a non-linear relationship between output and input(s)
C. Need to understand how to control a process output by controlling the input(s)
D. Experience several process defects and have no other way to fix hem
E. When it is very expensive or too late to measure the output
Correct Answer: ACDESection: (none)Explanation
Explanation/Reference:Explanation:
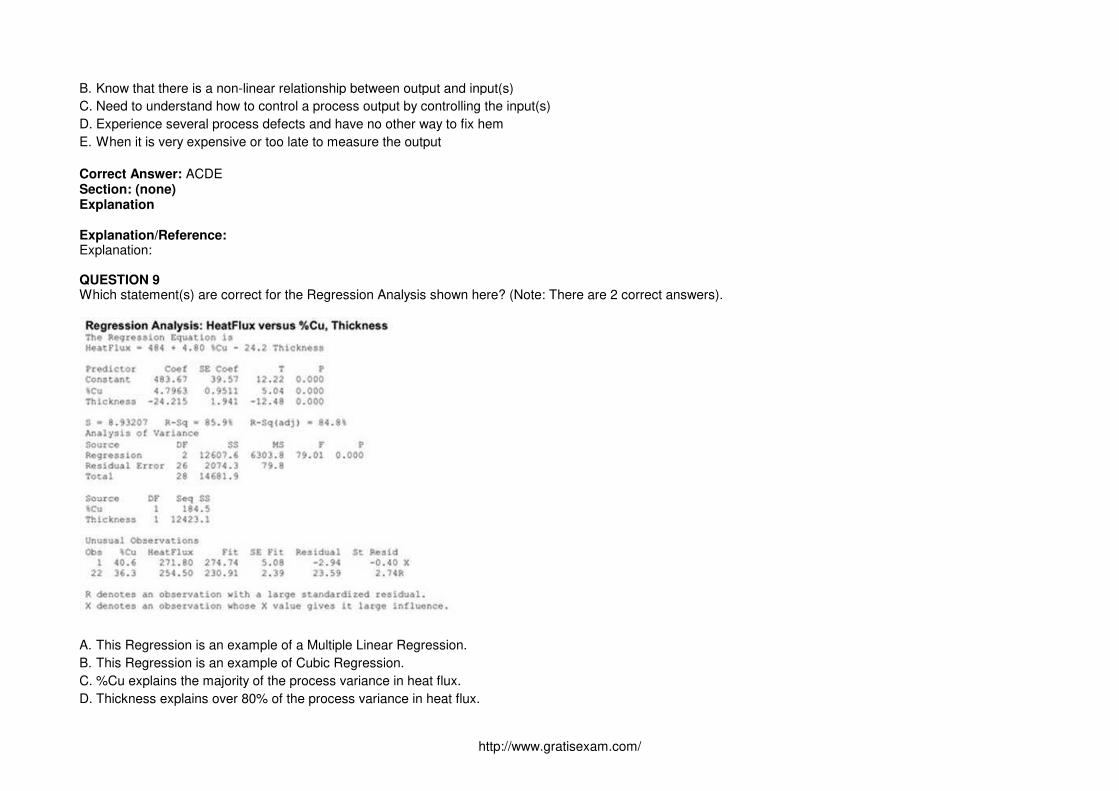
QUESTION 9Which statement(s) are correct for the Regression Analysis shown here? (Note: There are 2 correct answers).
A. This Regression is an example of a Multiple Linear Regression.
B. This Regression is an example of Cubic Regression.
C. %Cu explains the majority of the process variance in heat flux.
D. Thickness explains over 80% of the process variance in heat flux.
http://www.gratisexam.com/
E. The number of Residuals in this Regression Analysis is 26.
Correct Answer: ADSection: (none)Explanation
Explanation/Reference:Explanation:
QUESTION 10The Regression Model for an observed value of Y contains the term ?o which represents the Y axis intercept when X = 0.
http://www.gratisexam.com/
A. True
B. False
Correct Answer: ASection: (none)Explanation
Explanation/Reference:Explanation:
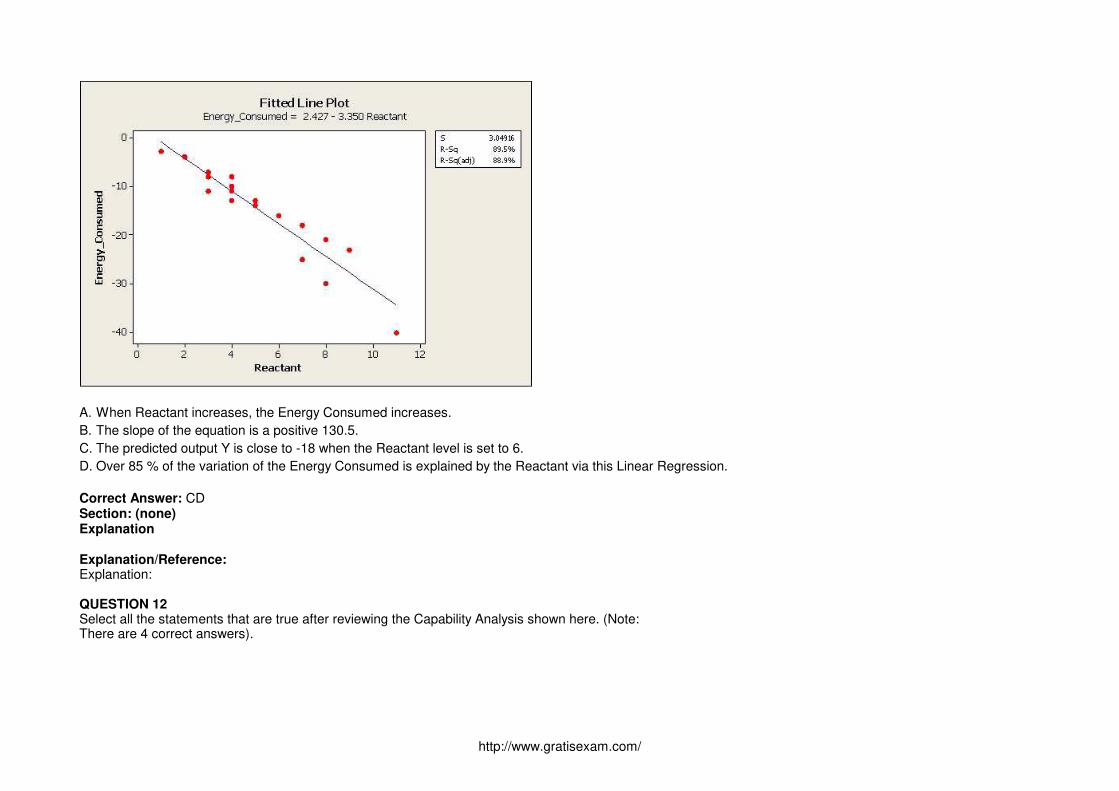
QUESTION 11Which statement(s) are true about the Fitted Line Plot shown here? (Note: There are 2 correct answers).
http://www.gratisexam.com/
A. When Reactant increases, the Energy Consumed increases.
B. The slope of the equation is a positive 130.5.
C. The predicted output Y is close to -18 when the Reactant level is set to 6.
D. Over 85 % of the variation of the Energy Consumed is explained by the Reactant via this Linear Regression.
Correct Answer: CDSection: (none)Explanation
Explanation/Reference:Explanation:
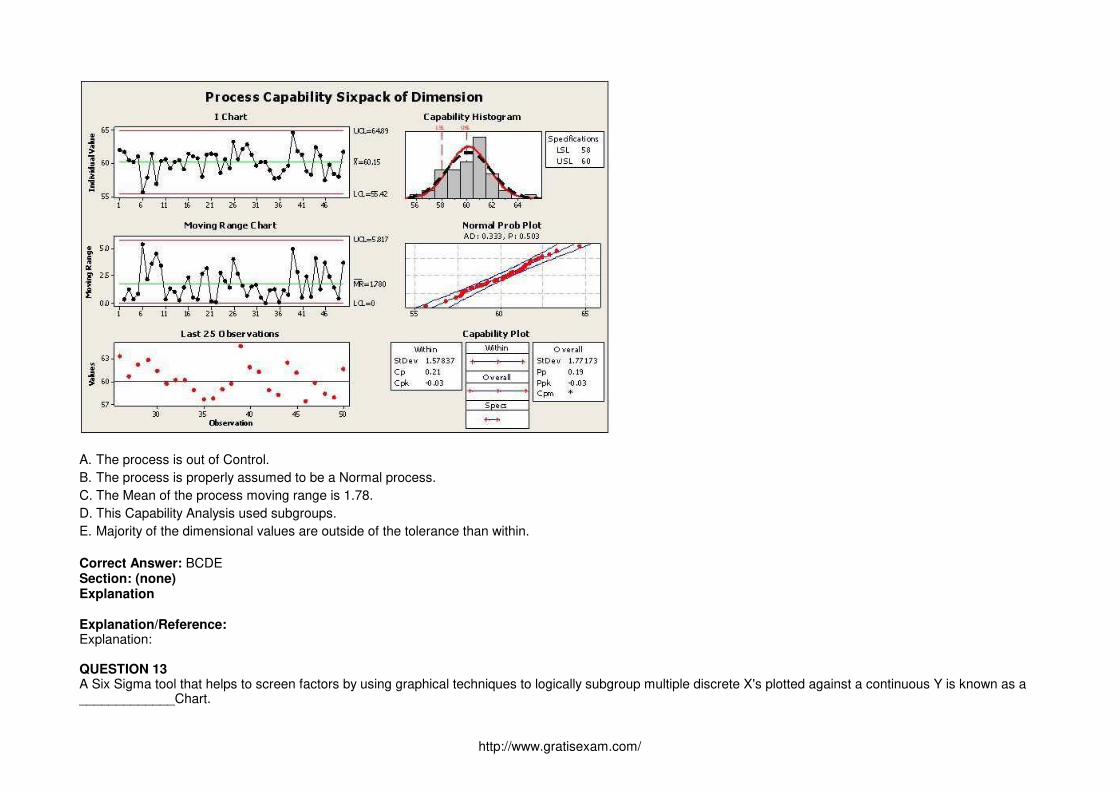
QUESTION 12Select all the statements that are true after reviewing the Capability Analysis shown here. (Note:There are 4 correct answers).
http://www.gratisexam.com/
A. The process is out of Control.
B. The process is properly assumed to be a Normal process.
C. The Mean of the process moving range is 1.78.
D. This Capability Analysis used subgroups.
E. Majority of the dimensional values are outside of the tolerance than within.
Correct Answer: BCDESection: (none)Explanation
Explanation/Reference:Explanation:
QUESTION 13A Six Sigma tool that helps to screen factors by using graphical techniques to logically subgroup multiple discrete X's plotted against a continuous Y is known as a_____________Chart.
http://www.gratisexam.com/
A. SIPOC
B. Multi-Vari
C. Box Plot
D. Whisker
Correct Answer: BSection: (none)Explanation
Explanation/Reference:Explanation:
QUESTION 14A primary benefit of using a Multi-Vari Chart is it provides a visual presentation of two-way interactions.
A. True
B. False
Correct Answer: ASection: (none)Explanation
Explanation/Reference:Explanation:
QUESTION 15__________ Distributions occur when data comes from several sources that are supposed to be the same yet are not.
A. Skewed
B. Bimodal
C. Gaussian
D. Tri-peaked
Correct Answer: ASection: (none)Explanation
Explanation/Reference:
http://www.gratisexam.com/
Explanation:
QUESTION 16Bias in Sampling is an error due to lack of independence among random samples or due to systematic sampling procedures.
A. True
B. False
Correct Answer: ASection: (none)Explanation
Explanation/Reference:Explanation:
QUESTION 17To draw inferences about a sample population being studied by modeling patterns of data in a way that accounts for randomness and uncertainty in theobservations is known as ____________________.
A. Influential Analysis
B. Inferential Statistics
C. Physical Modeling
D. Sequential Inference
Correct Answer: BSection: (none)Explanation
Explanation/Reference:Explanation:
QUESTION 18For a Normal Distribution the Mean, Median and Mode are the same data point.
A. True
B. False
Correct Answer: ASection: (none)Explanation
http://www.gratisexam.com/
Explanation/Reference:Explanation:
QUESTION 19When two Inputs have an impact on the Output together yet seem to have no or little impact on their own this is called a/an ________________.
A. Interaction
B. Oddity
C. Coincidence
D. Impossibility
Correct Answer: ASection: (none)Explanation
Explanation/Reference:Explanation:
QUESTION 20Hypothesis Testing can save time and help avoid high costs of experimental efforts by using existing data.
http://www.gratisexam.com/
A. True
B. False
Correct Answer: ASection: (none)Explanation
Explanation/Reference:Explanation:
QUESTION 21It is a Type II error if we decide to reject the Null Hypothesis when it is actually true.
http://www.gratisexam.com/
A. True
B. False
Correct Answer: BSection: (none)Explanation
Explanation/Reference:Explanation:
QUESTION 22A Belt experienced an Alpha of .05 and a Beta of .10 and knew these are the most common risk levels when running a Statistical test.
A. True
B. False
Correct Answer: ASection: (none)Explanation
Explanation/Reference:Explanation:
QUESTION 23Inferential Statistics is largely about Significance. There are both Practical and _______________ Significance to consider during an analysis of data in a Lean SixSigma project.
A. Problematic
B. Impractical
C. Usable
D. Statistical
Correct Answer: DSection: (none)Explanation
Explanation/Reference:Explanation:
http://www.gratisexam.com/
QUESTION 24The Central Limit Theorem helps us understand the ___________ we are taking and is the basis for using sampling to estimate population parameters.
A. Analysis
B. Kurtosis
C. Risk
D. Route
Correct Answer: CSection: (none)Explanation
Explanation/Reference:Explanation:
QUESTION 25Hypothesis Tests determine the probabilities of differences between observed data and the hypothesis being solely due to _________ based on the result of the P-values.
A. Human error
B. Measurement error
C. Shift differences
D. Chance
Correct Answer: DSection: (none)Explanation
Explanation/Reference:Explanation:
QUESTION 26The Alpha level of a test (level of significance) represents the yardstick against which P-values are measured and the Null Hypothesis is rejected if the P-value iswhich of these?
A. Less than the Alpha level.
B. Greater than the Alpha level.
C. Greater than the Beta and Alpha level.
D. Less than one minus Alpha.
http://www.gratisexam.com/
E. Less than the power of one minus Beta.
Correct Answer: ASection: (none)Explanation
Explanation/Reference:Explanation:
QUESTION 27A 1-Sample t-test is used when you want to compare the Median of one distribution to a target value.
A. True
B. False
Correct Answer: BSection: (none)Explanation
Explanation/Reference:Explanation:
QUESTION 28When a Belt is analyzing sample data she should keep in mind that 95% of Normally Distributed data is within +/- 2 Standard Deviations from the Mean.
A. True
B. False
Correct Answer: ASection: (none)Explanation
Explanation/Reference:Explanation:
QUESTION 29The Standard Deviation for the distribution of Means is called the ___________ and approaches zero as the sample size reaches 30.
A. Standard Error
B. Mean Deviation
http://www.gratisexam.com/
C. Mean Spread
D. Mean Error
Correct Answer: ASection: (none)Explanation
Explanation/Reference:Explanation:
QUESTION 30Due to excessive pollution, GREEN Solutions Inc. is considering subsidizing public transportation to work for its employees. According to the manager it takes anaverage weekday commute of 39 minutes with a Standard Deviation of 7 minutes for the employees to get to work while they use their personal vehicles for theiroffice commute while the management set a policy of not more than 40 minutes for their daily one-way commute. A survey conducted one day on 70 employeesshowed an average of 34 minutes commuting time using the metro public transportation system with a Standard Deviation of 21 minutes. Assuming a NormalDistribution for the commute times by either personal or public transportation, which of these is true?
http://www.gratisexam.com/
A. The probability that they would arrive on time using personal vehicles is much higher than using the metro public transportation system (MPTS)
B. The probability that they would arrive on time using the MPTS is much higher than using their personal vehicles
C. The two probabilities are about the same excepting in one case the consistency is higher than the other
D. We need to compile more data around weekends to incorporate for traffic differences
E. When Standard Deviation is higher the probability goes down and so the MPTS is worse
Correct Answer: BSection: (none)Explanation
Explanation/Reference:Explanation:
QUESTION 31According to a manager it takes an average weekday commute of 39 minutes with a Standard Deviation of 7 minutes for the employees to get to work when theyuse their personal vehicles for their office commute while management set a policy of not more than 40 minutes for their daily one-way commute. A surveyconducted one day on 70 employees showed an average of 34 minutes commuting time using the metro public transportation system with a Standard Deviation of
http://www.gratisexam.com/
21 minutes. For the employees choosing to increase their chances to come on time using personal transportation their variation should be reduced to___________?
A. 1 minute
B. 6 minutes
C. 3.5 minutes
D. Eliminate it to 0.0 minutes
Correct Answer: CSection: (none)Explanation
Explanation/Reference:Explanation:
QUESTION 32According to a manager it takes an average weekday commute of 39 minutes with a Standard Deviation of 7 minutes for the employees to get to work while theyuse their personal vehicles for their office commute while the management set a policy of not more than 40 minutes for their daily one-way commute. A surveyconducted one day on 70 employees showed an average of 34 minutes commuting time using the metro public transportation system with a Standard Deviation of21 minutes. If the Standard Deviation is uncontrollable then the other option to increase the probability of coming in on time via personal vehicles to work could be____________?
A. Increase the average time of commute
B. Maintain the average time of commute and change route to work
C. Reduce average commute time to work by departing earlier
D. Change policy at work and request for flexible times based on location
Correct Answer: CSection: (none)Explanation
Explanation/Reference:Explanation:
QUESTION 33Which of the following is used to test the significance for the analysis of a Variance Table?
A. t Test
B. F Test
http://www.gratisexam.com/
C. Chi Square Test
D. Acid Test
Correct Answer: BSection: (none)Explanation
Explanation/Reference:Explanation:
QUESTION 34Non-parametric testing is done when which of these are applicable? (Note: There are 3 correct answers).
A. When the traditional t tests don't produce the results we need
B. A Hypothesis Test for the Median of the population is in question
C. It does not require data to come from Normally Distributed populations
D. They look at the Median rather than the Mean of populations
E. When there are no parameters to measure in the process
Correct Answer: BCDSection: (none)Explanation
Explanation/Reference:Explanation:
QUESTION 35The Mann-Whitney Test is used to test if the Means for two samples are different.
A. True
B. False
Correct Answer: BSection: (none)Explanation
Explanation/Reference:Explanation:
QUESTION 36
http://www.gratisexam.com/
Contingency Tables are used to perform which of these functions?
A. Illustrate one-tail proportions
B. Analyze the "what if" scenario
C. Contrast the Outliers under the tail
D. Compare more than two sample proportions with each other
Correct Answer: DSection: (none)Explanation
Explanation/Reference:Explanation:
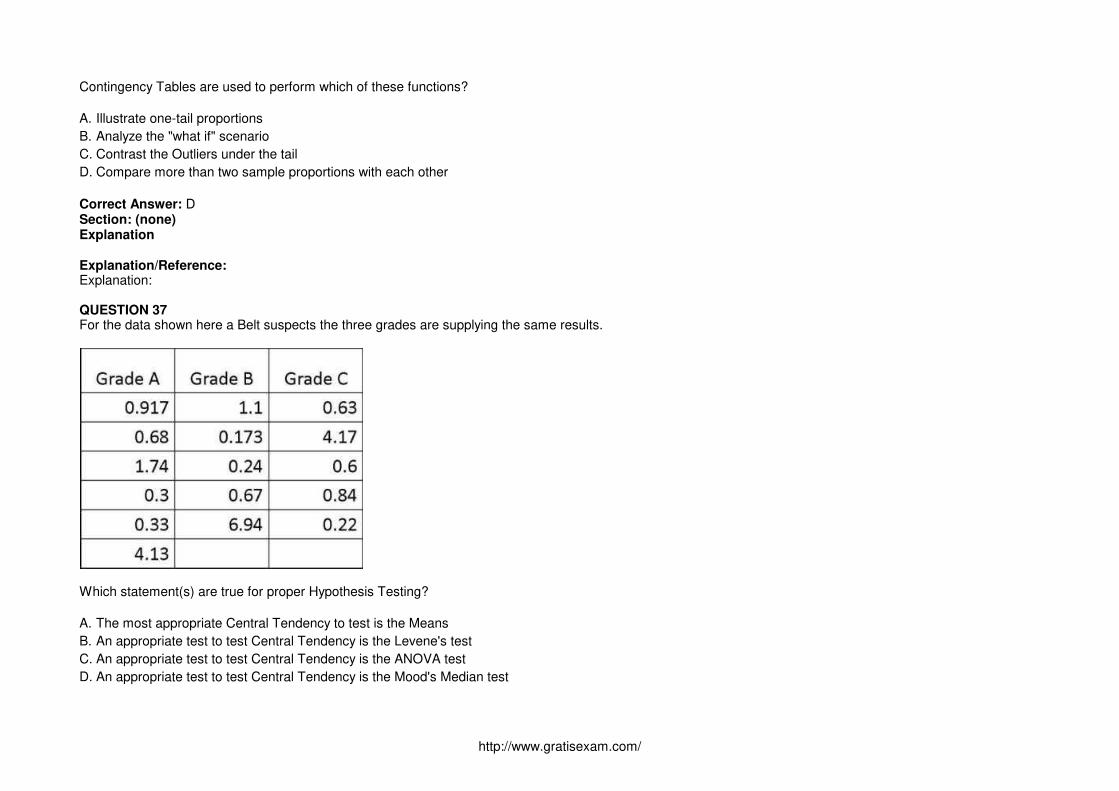
QUESTION 37For the data shown here a Belt suspects the three grades are supplying the same results.
Which statement(s) are true for proper Hypothesis Testing?
A. The most appropriate Central Tendency to test is the Means
B. An appropriate test to test Central Tendency is the Levene's test
C. An appropriate test to test Central Tendency is the ANOVA test
D. An appropriate test to test Central Tendency is the Mood's Median test
http://www.gratisexam.com/
Correct Answer: DSection: (none)Explanation
Explanation/Reference:Explanation:
QUESTION 38A Six Sigma tool that helps to screen factors by using graphical techniques to logically subgroup multiple discrete X's plotted against a continuous Y is known as a________________________Chart.
A. SIPOC
B. Multi-Vari
C. Box Plot
D. Whisker
Correct Answer: BSection: (none)Explanation
Explanation/Reference:Explanation:
QUESTION 39A primary benefit of using a Multi-Vari Chart is it provides a visual presentation of two-way interactions.
A. True
B. False
Correct Answer: ASection: (none)Explanation
Explanation/Reference:Explanation:
QUESTION 40Skewed, or Mixed, Distributions occur when data comes from several sources that are supposed to be the same yet are not.
A. True
http://www.gratisexam.com/
B. False
Correct Answer: ASection: (none)Explanation
Explanation/Reference:Explanation:
QUESTION 41When two Inputs have an impact on the Output together yet seem to have no or little impact on their own this is called a/an ________________.
http://www.gratisexam.com/
A. Interaction
B. Oddity
C. Coincidence
D. Impossibility
Correct Answer: ASection: (none)Explanation
Explanation/Reference:Explanation:
QUESTION 42To draw inferences about a sample population being studied by modeling patterns of data in a way that accounts for randomness and uncertainty in theobservations is known as ____________________.
A. Influential Analysis
B. Inferential Statistics
C. Physical Modeling
D. Sequential Inference
http://www.gratisexam.com/
Correct Answer: BSection: (none)Explanation
Explanation/Reference:Explanation:
QUESTION 43The perfect sample size is the minimum number of data points required to provide exactly 6% overlap or risk if one wants a 95% confidence level.
A. True
B. False
Correct Answer: BSection: (none)Explanation
Explanation/Reference:Explanation:
QUESTION 44Bias in Sampling is an error due to lack of independence among random samples or due to systematic sampling procedures.
A. True
B. False
Correct Answer: ASection: (none)Explanation
Explanation/Reference:Explanation:
QUESTION 45The Central Limit Theorem helps us understand the ___________ we are taking and is the basis for using sampling to estimate population parameters.
A. Analysis
B. Kurtosis
C. Risk
D. Route
http://www.gratisexam.com/
Correct Answer: CSection: (none)Explanation
Explanation/Reference:Explanation:
QUESTION 46Hypothesis Testing can help avoid high costs of experimental efforts by using existing data.
A. True
B. False
Correct Answer: ASection: (none)Explanation
Explanation/Reference:Explanation:
QUESTION 47Hypothesis Tests determine the probabilities of differences between observed data and the hypothesis being solely due to chance. This is determined based on theresult of the ______________.
A. Random acts
B. P-values
C. Standard Deviations
D. R-values
Correct Answer: BSection: (none)Explanation
Explanation/Reference:Explanation:
QUESTION 48It is a Type I error if we reject the Null Hypothesis when it is actually true.
http://www.gratisexam.com/
A. True
B. False
Correct Answer: ASection: (none)Explanation
Explanation/Reference:Explanation:
QUESTION 49Inferential Statistics is largely about Significance. There are both Practical and _______________ Significance to consider during an analysis of data in a Lean SixSigma project.
A. Problematic
B. Impractical
C. Usable
D. Statistical
Correct Answer: DSection: (none)Explanation
Explanation/Reference:Explanation:
QUESTION 50Having an Alpha of .05 and a Beta of .10 are the most common risk levels when running a Statistical test.
A. True
B. False
Correct Answer: ASection: (none)Explanation
Explanation/Reference:Explanation:
QUESTION 51
http://www.gratisexam.com/
The Alpha level of a test (level of significance) represents the yardstick against which P-values are measured and the Null Hypothesis is rejected if the P-value iswhich of these?
A. Less than the Alpha level.
B. Greater than the Alpha level.
C. Greater than the Beta and Alpha level.
D. Less than one minus Alpha.
E. Less than the power of one minus Beta.
Correct Answer: ASection: (none)Explanation
Explanation/Reference:Explanation:
QUESTION 52A 1-Sample t-test is used when you want to compare the Median of one distribution to a target value.
A. True
B. False
Correct Answer: BSection: (none)Explanation
Explanation/Reference:Explanation:
QUESTION 53A 1-Sample t-test is used to compare an expected population Mean to a target.
http://www.gratisexam.com/
A. True
http://www.gratisexam.com/
B. False
Correct Answer: ASection: (none)Explanation
Explanation/Reference:Explanation:
QUESTION 54Unequal Variances can be the result of differing types of distributions.
A. True
B. False
Correct Answer: ASection: (none)Explanation
Explanation/Reference:Explanation:
QUESTION 55Due to excessive pollution, GREEN Solutions Inc. is considering subsidizing public transportation to work for its employees. According to the manager it takes anaverage weekday commute of 39 minutes with a Standard Deviation of 7 minutes for the employees to get to work while they use their personal vehicles for theiroffice commute while the management set a policy of not more than 40 minutes for their daily one-way commute. A survey conducted one day on 70 employeesshowed an average of 34 minutes commuting time using the metro public transportation system with a Standard Deviation of 21 minutes. Assuming a NormalDistribution for the commute times by either personal or public transportation, which of these is true?
A. The probability that they would arrive on time using personal vehicles is much higher than using the metro public transportation system (MPTS)
B. The probability that they would arrive on time using the MPTS is much higher than using their personal vehicles
C. The two probabilities are about the same excepting in one case the consistency is higher than the other
D. We need to compile more data around weekends to incorporate for traffic differences
E. When Standard Deviation is higher the probability goes down and so the MPTS is worse
Correct Answer: BSection: (none)Explanation
Explanation/Reference:
http://www.gratisexam.com/
Explanation:
QUESTION 56According to a manager it takes an average weekday commute of 39 minutes with a Standard Deviation of 7 minutes for the employees to get to work when theyuse their personal vehicles for their office commute while management set a policy of not more than 40 minutes for their daily one-way commute. A surveyconducted one day on 70 employees showed an average of 34 minutes commuting time using the metro public transportation system with a Standard Deviation of21 minutes. For the employees choosing to increase their chances to come on time using personal transportation their variation should be reduced to___________?
A. 1 minute
B. 6 minutes
C. 3.5 minutes
D. Eliminate it to 0.0 minutes
Correct Answer: CSection: (none)Explanation
Explanation/Reference:Explanation:
QUESTION 57According to a manager it takes an average weekday commute of 39 minutes with a Standard Deviation of 7 minutes for the employees to get to work while theyuse their personal vehicles for their office commute while the management set a policy of not more than 40 minutes for their daily one-way commute. A surveyconducted one day on 70 employees showed an average of 34 minutes commuting time using the metro public transportation system with a Standard Deviation of21 minutes. If the Standard Deviation is uncontrollable then the other option to increase the probability of coming in on time via personal vehicles to work could be____________?
A. Increase the average time of commute
B. Maintain the average time of commute and change route to work
C. Reduce average commute time to work by departing earlier
D. Change policy at work and request for flexible times based on location
Correct Answer: CSection: (none)Explanation
Explanation/Reference:Explanation:
http://www.gratisexam.com/
QUESTION 58Which of the following is used to test the significance for the analysis of a Variance Table?
A. t Test
B. F Test
C. Chi Square Test
D. Acid Test
Correct Answer: BSection: (none)Explanation
Explanation/Reference:Explanation:
QUESTION 59Non-parametric testing is done when which of these are applicable? (Note: There are 3 correct answers).
A. When the traditional t tests don't produce the results we need
B. A Hypothesis Test for the Median of the population is in question
C. It does not require data to come from Normally Distributed populations
D. They look at the Median rather than the Mean of populations
E. When there are no parameters to measure in the process
Correct Answer: BCDSection: (none)Explanation
Explanation/Reference:Explanation:
QUESTION 60The Mann-Whitney Test is used to test if the Means for two samples are different.
A. True
B. False
Correct Answer: BSection: (none)

http://www.gratisexam.com/
Explanation
Explanation/Reference:Explanation:
http://www.gratisexam.com/