six sigma lssyb lean six sigma yellow belt · if a six sigma project was to reduce repair station...
TRANSCRIPT

http://www.gratisexam.com/
LSSYB
Number: LSSYBPassing Score: 800Time Limit: 120 min
http://www.gratisexam.com/
Six Sigma LSSYB
Lean Six Sigma Yellow Belt

http://www.gratisexam.com/
Exam A
QUESTION 1A ___________ is used primarily to track the stability of the average value of a metric of interest.
http://www.gratisexam.com/
A. NP Chart
B. Xbar-R Chart
C. I-MR Chart
D. C Chart
Correct Answer: BSection: (none)Explanation
Explanation/Reference:Explanation:
QUESTION 2For her injection molding project a Belt needed to track the percentage of defectives of a particular sample set so she used a ___________ to display the data?
A. Individual Chart
B. C Chart
C. Xbar Chart
D. P Chart
Correct Answer: DSection: (none)Explanation
Explanation/Reference:Explanation:
QUESTION 3
http://www.gratisexam.com/
Which of these graphs demonstrates conditions which would be sufficient to enable OCAP for the process?
A. Xbar Chart
B. Time Series Chart
C. Neither
D. Both
Correct Answer: ASection: (none)Explanation
Explanation/Reference:Explanation:
QUESTION 4Control Charts were developed by Dr. Shewhart to track data over time. To detect Special Cause variation the Control Charts use which of these?
A. Data shift analysis
B. Outlier analysis methods
C. Center Line and Control Limits
D. None of the above
Correct Answer: CSection: (none)Explanation
Explanation/Reference:Explanation:
QUESTION 5Common and ______________ Cause Variation are the focus of Statistical Process Control.
A. Uncommon
B. Ordinary
C. Special
D. Selective
Correct Answer: CSection: (none)

http://www.gratisexam.com/
Explanation
Explanation/Reference:Explanation:
QUESTION 6Special Cause Variation falls into which two categories?
A. Natural & Unnatural
B. Short Term & Long Term
C. Assignable & Pattern
D. Attribute & Discreet
Correct Answer: CSection: (none)Explanation
Explanation/Reference:Explanation:
QUESTION 7Range Charts are the technique used to determine if Special Causes are occurring within the subgroups of the ______________.
A. Histograms
B. SPC Charts
C. NP Charts
D. Pareto Charts
Correct Answer: BSection: (none)Explanation
Explanation/Reference:Explanation:
QUESTION 8If the production is for higher volume and monitoring and the Mean and variability is to be monitored for four machines producing product and the characteristic tobe monitored is Variable Data, which SPC Chart is best to be selected?

http://www.gratisexam.com/
http://www.gratisexam.com/
A. Xbar-R Chart
B. Individual-MR Chart
C. NP Chart
D. CUSUM Chart
Correct Answer: ASection: (none)Explanation
Explanation/Reference:Explanation:
QUESTION 9When a Belt Poka-Yoke's a defect out of the process entirely then she should track the activity with a robust SPC system on the characteristic of interest in thedefect as an early warning system.
A. True
B. False
Correct Answer: BSection: (none)Explanation
Explanation/Reference:Explanation:
QUESTION 10Following the completion of a LSS project the Belt not only creates a Control Plan he also develops a _____________ so those involved in the process know what todo when the critical metrics move out of spec.
A. Response Plan
B. Call List

http://www.gratisexam.com/
C. Chain-of-Command
D. Defect Analysis Plan
Correct Answer: ASection: (none)Explanation
Explanation/Reference:Explanation:
QUESTION 11The Control Limits width varies if the sample size varies for which type of chart?
A. P Charts
B. NP Charts
C. Xbar-R Charts
D. Time Series Charts
Correct Answer: ASection: (none)Explanation
Explanation/Reference:Explanation:
QUESTION 12Which of these elements are not included in Implementation plans?
A. Work breakdown structure
B. Risk management plans
C. Cost/Benefit ratios
D. Planned audits of work completion
Correct Answer: CSection: (none)Explanation
Explanation/Reference:Explanation:
http://www.gratisexam.com/
QUESTION 13Upon completion and validation of an improvement to a process a Belt and the Project Team create a Control Plan that contains which of these?
A. Standard operating work description of the process change
B. Description of the monitoring system in place to assure continued compliance
C. Summary of the targeted critical metrics for process performance measurement
D. All of the above
Correct Answer: DSection: (none)Explanation
Explanation/Reference:Explanation:
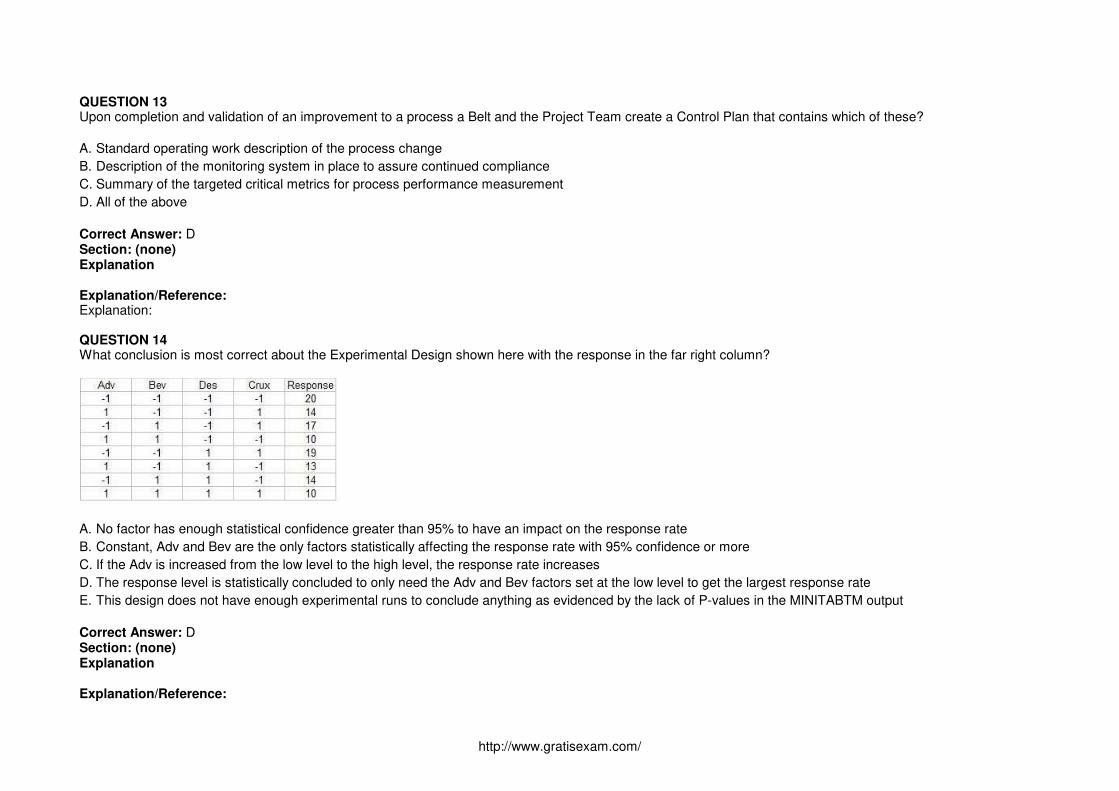
QUESTION 14What conclusion is most correct about the Experimental Design shown here with the response in the far right column?
A. No factor has enough statistical confidence greater than 95% to have an impact on the response rate
B. Constant, Adv and Bev are the only factors statistically affecting the response rate with 95% confidence or more
C. If the Adv is increased from the low level to the high level, the response rate increases
D. The response level is statistically concluded to only need the Adv and Bev factors set at the low level to get the largest response rate
E. This design does not have enough experimental runs to conclude anything as evidenced by the lack of P-values in the MINITABTM output
Correct Answer: DSection: (none)Explanation
Explanation/Reference:
http://www.gratisexam.com/
Explanation:
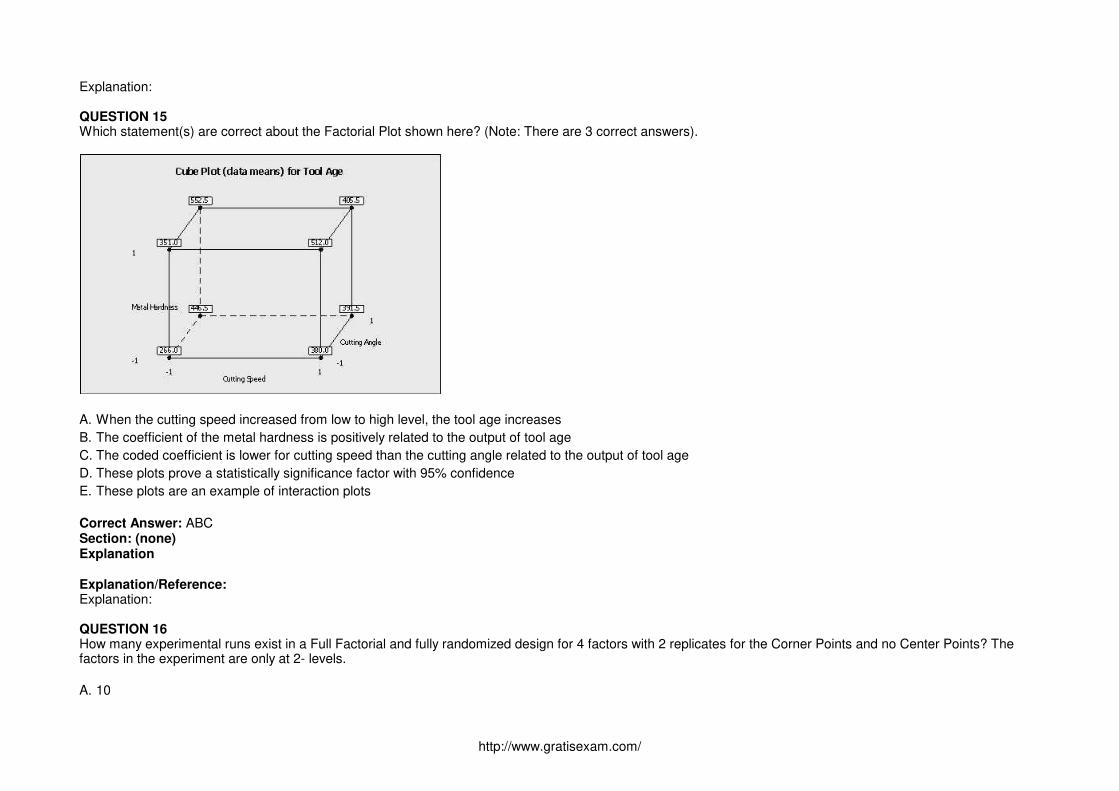
QUESTION 15Which statement(s) are correct about the Factorial Plot shown here? (Note: There are 3 correct answers).
A. When the cutting speed increased from low to high level, the tool age increases
B. The coefficient of the metal hardness is positively related to the output of tool age
C. The coded coefficient is lower for cutting speed than the cutting angle related to the output of tool age
D. These plots prove a statistically significance factor with 95% confidence
E. These plots are an example of interaction plots
Correct Answer: ABCSection: (none)Explanation
Explanation/Reference:Explanation:
QUESTION 16How many experimental runs exist in a Full Factorial and fully randomized design for 4 factors with 2 replicates for the Corner Points and no Center Points? Thefactors in the experiment are only at 2- levels.
A. 10

http://www.gratisexam.com/
B. 32
C. 256
D. 64
Correct Answer: BSection: (none)Explanation
Explanation/Reference:Explanation:
QUESTION 17If an experiment has 5 factors and no replicates for a 2-level Experimental Design with 16 experimental runs which statement is incorrect?
A. The Experimental Design is half-fractional
B. The Main Effects are confounded with only 4-way interactions
C. The Main Effects for the 5 factors are not aliased or confounded but the 2-way interactions are confounded with the 3-way interactions
D. The experiment has 8 experimental runs with the first factor at the high level
Correct Answer: CSection: (none)Explanation
Explanation/Reference:Explanation:
QUESTION 18Which statement(s) are correct about the Pareto Chart shown here for the DOE analysis? (Note: There are 2 correct answers).

http://www.gratisexam.com/
A. It is unknown from this graph how many factors were in the Experimental Design
B. The factors to keep in the mathematical model are E, D, DE, BD and B with an alpha risk equal to 2.06
C. The effects to keep in the mathematical model are E, D, DE, BD and B with an alpha risk equal to 0.05
D. The factors to keep in the mathematical model with a 5% alpha risk are BE, AB, A and AD
Correct Answer: ACSection: (none)Explanation
Explanation/Reference:Explanation:
QUESTION 19Fractional Factorial, ____________and Response Surface Method are types of planned experiments.
http://www.gratisexam.com/

http://www.gratisexam.com/
A. Multi-Vari Analysis
B. Baldridge Channels
C. One Factor at a Time or OFAT
D. Factorial Design
Correct Answer: DSection: (none)Explanation
Explanation/Reference:Explanation:
QUESTION 20Relative to a Design of Experiments the term ________________ refers to variables being a linear combination of each other.
A. Mirror Image
B. Directly Parallel
C. Collinear
D. None of the above
Correct Answer: CSection: (none)Explanation
Explanation/Reference:Explanation:
QUESTION 21Which statement(s) are incorrect about Fractional Factorial Designs?
A. A Half Fractional Design for 5 factors has the same number of experimental runs as a Full Factorial Design for 4 factors assuming no repeats or replicates orCenter Points
B. Quarter Fractional experiments can exist for those with 4 factors
C. Resolution V design is desired while controlling costs of experimentation
D. Half Fractional experiments do not exist for those designs with only 2 factors
Correct Answer: CSection: (none)Explanation
http://www.gratisexam.com/
Explanation/Reference:Explanation:
QUESTION 22If in an experiment all possible variable pairs sum to zero the design is Orthogonal.
A. True
B. False
Correct Answer: ASection: (none)Explanation
Explanation/Reference:Explanation:
QUESTION 23Which Experimental Design typically is most associated with the fewest number of input variables or factors in the design?
A. Fractional Factorial design
B. Full Factorial design
C. Simple Linear Regression
D. Response Surface Design
Correct Answer: DSection: (none)Explanation
Explanation/Reference:Explanation:
QUESTION 24The method of Steepest Ascent guides you toward a target inside the original inference space.
A. True
B. False
Correct Answer: BSection: (none)
http://www.gratisexam.com/
Explanation
Explanation/Reference:Explanation:
QUESTION 25Situations where standardized work needs to be incorporated include all of these except _____________________.
A. Machines continually operating to reduce the labor cost per piece
B. Lack of a system to assure proper inventory levels at repair stations
C. Changeover instructions incomplete
D. Process flow for the same product assembly taking various cycle time for completion
Correct Answer: ASection: (none)Explanation
Explanation/Reference:Explanation:
QUESTION 26The Lean toolbox includes all of these items except ________________.
A. Mistake Proofing
B. Visual Factory
C. Design of Experiments
D. Inventory Management
Correct Answer: CSection: (none)Explanation
Explanation/Reference:Explanation:
QUESTION 27Questions that can be best answered by a Visual Factory include all of these except _____________________.
A. Are downtime issues easily noted?

http://www.gratisexam.com/
B. Can extra inventory be seen easily?
C. Are unneeded tools or supplies easily noted?
D. Are setups optimized for lower scrap levels?
Correct Answer: DSection: (none)Explanation
Explanation/Reference:Explanation:
QUESTION 28If a Six Sigma project was to reduce repair station inventory and the team found the inventory was creeping up over time which Lean tools should be considered inthe Control Phase to reestablish and sustain the project success?
A. Review the Visual Factory to assure inventory in excess of desired visible
B. Improve the lighting to assure adequate visibility
C. Analyze data from supplier deliveries
D. Reword the standardized work instructions to use active verbs and not passive phrases
Correct Answer: ASection: (none)Explanation
Explanation/Reference:Explanation:
QUESTION 29When a Belt implements an improvement that is automated thus requiring no particular understanding for use he has applied which Lean tool?
http://www.gratisexam.com/
A. Mistake Proofing
B. Kaizen Event
http://www.gratisexam.com/
C. 5S
D. None
Correct Answer: ASection: (none)Explanation
Explanation/Reference:Explanation:
QUESTION 30Kaizens or Kaikakus and Six Sigma projects are intended to create incremental process improvements versus breakthrough, significant improvements.
A. True
B. False
Correct Answer: BSection: (none)Explanation
Explanation/Reference:Explanation:
QUESTION 31Which of these items contribute to what is necessary for successful Kaizen events?
A. Analysis tools
B. Management support
C. Operator support
D. All of these answers are correct
Correct Answer: DSection: (none)Explanation
Explanation/Reference:Explanation:
QUESTION 32Kanban establishes a means of monitoring production, conveyance and delivery information such that efficient flow is established. The method used by Kanban is to

http://www.gratisexam.com/
require a _________ before anything moves.
A. Sign-off
B. Signal
C. Bell to ring
D. Work order
Correct Answer: BSection: (none)Explanation
Explanation/Reference:Explanation:
QUESTION 33When a Belt decides to use written procedures and visual controls to improve the consistency of the tasks that must occur in the process he is improving he hasutilized the _________________ activity of 5S.
A. Sustaining
B. Sorting
C. Standardizing
D. Straightening
Correct Answer: CSection: (none)Explanation
Explanation/Reference:Explanation:
QUESTION 34SPC Charts are used extensively in different business and decision-making environments. In this example a vendor is being selected based on speed of delivery.Which of the conclusions would help you pick a vendor for your needs regarding lead-time of delivery from your vendors? (Note: There are 4 correct answers).

http://www.gratisexam.com/
A. Vendor A with a much shorter lead time in delivery
B. Vendor B as it has a better consistency (lower variance) on lead time
C. Vendor B as Vendor A shows a situation out of control as shown in red
D. Vendor B as the Control Limits are much narrower than Vendor A
E. Vendor B with higher lead time, but a process with much narrower Control Limits
Correct Answer: BCDESection: (none)

http://www.gratisexam.com/
Explanation
Explanation/Reference:Explanation:
QUESTION 35Fractional Factorial designs are used to reduce the ____________ because the number of runs has been lowered.
A. Time and cost of experiments
B. Number of people involved
C. Number of data measurement points
D. Output summary
Correct Answer: ASection: (none)Explanation
Explanation/Reference:Explanation:
QUESTION 36Fractional Factorial Designs are used to analyze factors to model the output as a function of inputs if Hypothesis Testing in the Analyze Phase was inadequate tosufficiently narrow the factors that significantly impact the output(s).
A. True
B. False
Correct Answer: ASection: (none)Explanation
Explanation/Reference:Explanation:
QUESTION 37A Factorial Experiment based on a Level 2 Design with 6 factors would require 16 runs to fully assess the interactions.
A. True
B. False

http://www.gratisexam.com/
Correct Answer: BSection: (none)Explanation
Explanation/Reference:Explanation:
QUESTION 38A Full Factorial experiment using a 3 level 3 factor approach has been proposed to test the viability of an extrusion machine experiment. How many treatmentcombinations will this approach involve?
A. 6
B. 9
C. 27
D. 54
Correct Answer: CSection: (none)Explanation
Explanation/Reference:Explanation:
QUESTION 39Screening experiments are the proper choice when a Belt is faced with the situation of highly Fractional Factorial Designs.
A. True
B. False
Correct Answer: ASection: (none)Explanation
Explanation/Reference:Explanation:
QUESTION 40A valid Multiple Linear Regression (MLR) is characterized by all of these except _______________________.
http://www.gratisexam.com/
http://www.gratisexam.com/
A. It is an assumption that the X's (inputs) are not correlated to each other
B. The X's (inputs) are assumed to be independent of each other
C. MLR is conducted based on a deliberate form of experimentation
D. The Residuals from MLR analysis have to be Normally Distributed
Correct Answer: CSection: (none)Explanation
Explanation/Reference:Explanation:
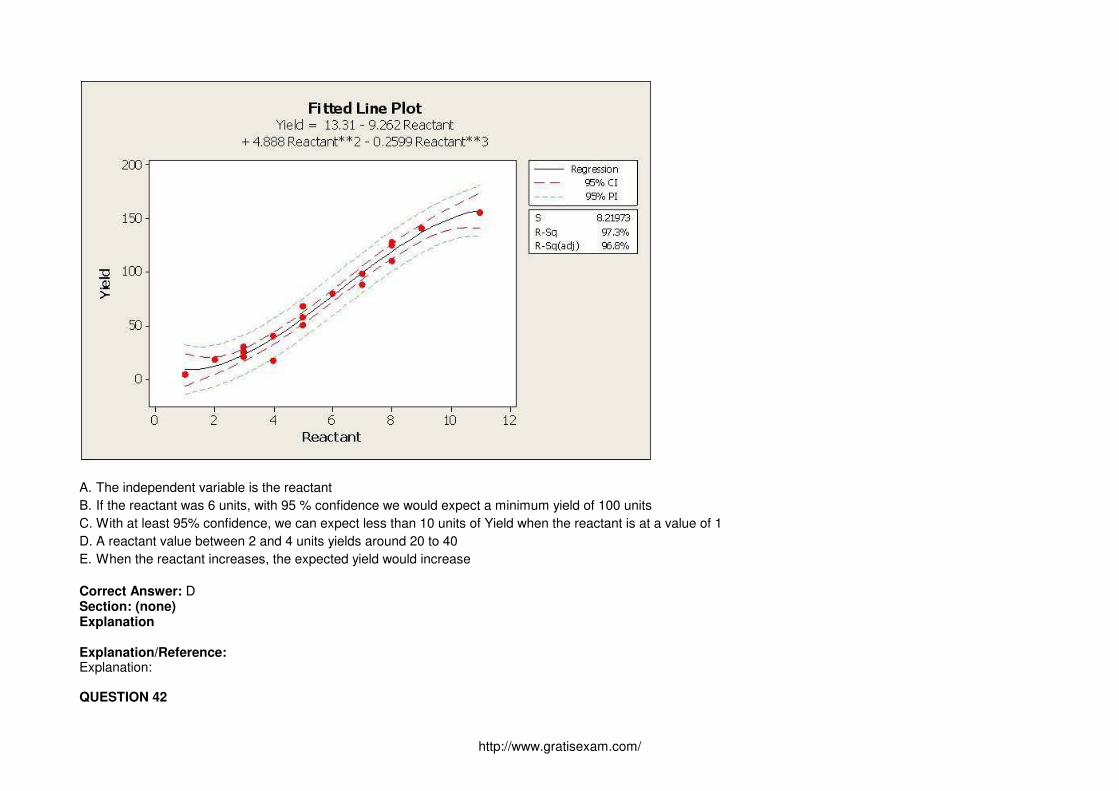
QUESTION 41Which statement is NOT correct about the Fitted Line Plot shown here?
http://www.gratisexam.com/
A. The independent variable is the reactant
B. If the reactant was 6 units, with 95 % confidence we would expect a minimum yield of 100 units
C. With at least 95% confidence, we can expect less than 10 units of Yield when the reactant is at a value of 1
D. A reactant value between 2 and 4 units yields around 20 to 40
E. When the reactant increases, the expected yield would increase
Correct Answer: DSection: (none)Explanation
Explanation/Reference:Explanation:
QUESTION 42

http://www.gratisexam.com/
When doing Hypothesis Testing on Non-normal data Belts will use a ________________ to compare more than two sample proportions to each other.
A. Z score Table
B. Sakami Table
C. Mean-to-Mode Analysis
D. Contingency Table
Correct Answer: CSection: (none)Explanation
Explanation/Reference:Explanation:
QUESTION 43It would be more likely than not for a Belt conducting a Regression Analysis to find that the _______________________.
A. r2 value is smaller than the absolute value of r
B. Correlation Coefficient equals r2
C. Coefficient of Determination is less than r2
D. Correlation Coefficient equals r divided by 2
Correct Answer: ASection: (none)Explanation
Explanation/Reference:Explanation:
QUESTION 44When a Belt properly analyzes the results of an experiment he must examine the Residuals in expectation of finding all of the following except _________.
A. Some Residuals higher than others
B. Some Residuals lower than others
C. All Residuals within 2 Standard Deviations of the Mean
D. Residuals will represent a Linear Regression
Correct Answer: DSection: (none)

http://www.gratisexam.com/
Explanation
Explanation/Reference:Explanation:
QUESTION 45Which statement(s) are correct about the Regression shown here? (Note: There are 2 correct answers).
A. The dependent variable is the outside temperature
B. The relationship between outside temperature and number of customers per hour is a Linear Regression
C. The dashed lines indicate with 95% confidence where all of the process data should fall between
D. The dashed lines indicate with 95% confidence the estimate for the Quadratic Regression Line
E. The predicted number of customers per hour is close to 5 if the outside temperature is 10 deg C
Correct Answer: DESection: (none)Explanation
Explanation/Reference:Explanation:
QUESTION 46Which of these might contribute to similar distributions having Unequal Variance?

http://www.gratisexam.com/
A. Extreme tails
B. Outliers
C. Multiple Modes
D. All of the above
Correct Answer: DSection: (none)Explanation
Explanation/Reference:Explanation:
QUESTION 47A Belt working in a supply chain environment has to make a decision to change suppliers of critical raw materials for a new product upgrade. The purchasingmanager is depending on the Belt's effort requiring that the average cost of an internal critical raw material component be less than or equal to $4,200 in order tostay within budget. Using a sample of 35 first article components, a Mean of the new product upgrade price of $4,060, and a Standard Deviation of $98 wasestimated. Select the answer that best states the Practical Problem.
A. If the average cost per component is $4,200 or less, then the purchase manager will introduce the new product upgrade with new components.
B. If the average cost per component is greater than $4,200, then the purchase manager will introduce the new product upgrade with new components.
C. Only if the average cost per product upgrade is $4,060, will the purchase manager introduce new product upgrades with new components.
D. If the average cost per new product upgrade is less than $180, then the purchase manager will introduce the new product upgrade with new components.
Correct Answer: CSection: (none)Explanation
Explanation/Reference:Explanation:
QUESTION 48A Belt working in a supply chain environment has to make a decision to change suppliers of critical raw materials for a new product upgrade. The purchasingmanager is depending on the Belt's effort requiring that the average cost of an internal critical raw material component be less than or equal to $4,200 in order tostay within budget. Using a sample of 35 first article components, a Mean of the new product upgrade price of $4,060, and a Standard Deviation of $98 wasestimated. The Alternative Hypothesis in the above example is?
A. The Standard Deviation is equal to $300.
B. The Mean is less than $4,320.
http://www.gratisexam.com/
C. The Mean is equal to $4,060.
D. The Mean is less than $4,200.
E. The Mean is greater than $ 4,200.
Correct Answer: ESection: (none)Explanation
Explanation/Reference:Explanation:
QUESTION 49A Belt working in a supply chain environment has to make a decision to change suppliers of critical raw materials for a new product upgrade. The purchasingmanager is depending on the Belt's effort requiring that the average cost of an internal critical raw material component be less than or equal to $3,600 in order tostay within budget. Using a sample of 42 first article components, a Mean of the new product upgrade price of $3,200 and a Standard Deviation of $180 wasestimated. Based on the data provided, the Z value for the data assuming a Normal Distribution is?
A. 1.11
B. 2.22
C. 4.30
D. 5.42
Correct Answer: BSection: (none)Explanation
Explanation/Reference:Explanation:
QUESTION 50A Belt working in a supply chain environment has to make a decision to change suppliers of critical raw materials for a new product upgrade. The purchasingmanager is depending on the Belt's effort requiring that the average cost of an internal critical raw material component be less than or equal to $3,800 in order tostay within budget. Using a sample of 38 first article components, a Mean of the new product upgrade price of $3,680, and a Standard Deviation of $120 wasestimated. In order to increase the Long Term Z value to 5, what is the maximum long term variation in pricing the Belt can accept for his upgraded critical rawmaterial component?
A. $6
B. $12
C. $24
D. $48

http://www.gratisexam.com/
Correct Answer: CSection: (none)Explanation
Explanation/Reference:Explanation:
QUESTION 51Sally and Sara sell flower pots at their garage sale. Sally motivates Sara mentioning that they will sell a minimum of 15 pots per day if the outside temperatureexceeds 60o F. From a sample, whose population is assumed to follow a Normal Distribution, taken for 30 days at 60 degrees or more an average of 13.6 pots perday were sold with a Standard Deviation of 0.7 pots. For the sales accomplished above, what test would validate if they met their requirements?
A. F Test
B. Test for Equal Variance
C. Chi Square Test
D. One-Sample t-Test
Correct Answer: DSection: (none)Explanation
Explanation/Reference:Explanation:
QUESTION 52Sally and Sara sell flower pots at their garage sale. Sally motivates Sara mentioning that they will sell a minimum of 15 pots per day if the outside temperatureexceeds 60o F. From a sample, whose population is assumed to follow a Normal Distribution, taken for 30 days at 60 degrees or more an average of 13.6 pots perday were sold with a Standard Deviation of 0.7 pots. The statistical Degrees of Freedom for this example are?
http://www.gratisexam.com/
A. 1
B. 29
C. 30
D. 31

http://www.gratisexam.com/
E. 2
Correct Answer: BSection: (none)Explanation
Explanation/Reference:Explanation:
QUESTION 53Sally and Sara sell flower pots at their garage sale. Martha motivates Rose mentioning that they will sell a minimum of 16 pots per day if the outside temperatureexceeds 60o F. From a sample, whose population is assumed to follow a Normal Distribution, taken for 30 days at 60 degrees or more an average of 15.2 pots perday were sold with a Standard Deviation of 0.6 pots. What is the Z value for this sales process?
A. 0.67
B. 1.13
C. 1.33
D. 2.66
Correct Answer: CSection: (none)Explanation
Explanation/Reference:Explanation:
QUESTION 54The relationship between a response variable and one or more independent variables is investigated and modeled by use of __________________.
A. X-Y Matrix
B. Baldridge Assessment
C. Analysis of Variance (ANOVA)
D. Critical X's Definition
Correct Answer: CSection: (none)Explanation
Explanation/Reference:Explanation:

http://www.gratisexam.com/
QUESTION 55An ANOVA used across many dependent variables could increase the Beta risk.
A. True
B. False
Correct Answer: BSection: (none)Explanation
Explanation/Reference:Explanation:
QUESTION 56The Mann-Whitney test is a powerful test and is unique to situations from which of the choices listed? (Note: There are 2 correct answers).
A. Testing the identity of two populations
B. Focuses on equality of the Median of the two populations
C. Less powerful than the traditional "t-test"
D. More widely applicable than the traditional "t-test"
Correct Answer: BDSection: (none)Explanation
Explanation/Reference:Explanation:
QUESTION 57Assessing process proportion as opposed to evaluating a process with respect to a set target can be done using which of these?
A. Process proportion equals some value range
B. Process proportion equals some desired value
C. Target is current
D. Proportion of the tail is equal
Correct Answer: BSection: (none)

http://www.gratisexam.com/
Explanation
Explanation/Reference:Explanation:
QUESTION 58A Non-parametric Test should be used if just one distribution is not Normal out of the two or more gathered.
A. True
B. False
Correct Answer: ASection: (none)Explanation
Explanation/Reference:Explanation:
QUESTION 59Contingency Tables are used to test for association, or dependency, between two or more classifications.
A. True
B. False
Correct Answer: ASection: (none)Explanation
Explanation/Reference:Explanation:
QUESTION 60For the data shown here which statement(s) are true? (Note: There are 2 correct answers).

http://www.gratisexam.com/
A. With 95% confidence, we cannot conclude if the samples are from three Normal Distributions.
B. With greater than 95% confidence, we conclude the samples are from Non-normal Distributions.
C. If we wanted to compare the Central Tendencies of these three samples we would use the one way ANOVA test.
D. If we wanted to compare the Central Tendencies of these three samples we could use Mood's Median test.
Correct Answer: BDSection: (none)Explanation
Explanation/Reference:Explanation:
http://www.gratisexam.com/