sixth framework programme - university of …eprints.uwe.ac.uk/11404/1/avineri-waygood_100205... ·...
TRANSCRIPT
Behavioural Inception Report dissemination level
EUROPEAN COMMISSIONDG RESEARCH
SEVENTH FRAMEWORK PROGRAMMETHEME 7 - TRANSPORT
COLLABORATIVE PROJECT – GRANT AGREEMENT N. 234094
CATCHCarbon-Aware Travel Choice in the City, Region and World of Tomorrow
Behavioural Inception Report
05/02/2010 1 University of the West of England, Bristol
Behavioural Inception Report Final Version 1.0
Deliverable no.Dissemination levelWork Package 1Author(s) Erel Avineri, E. Owen D. Waygood Co-author(s)Status (F: final, D: draft) FFile Name Inception report WP1.docProject Start Date and Duration 01 August 2009, 30 months
5/02/10 2 University of the West of England, Bristol

Behavioural Inception Report Final Version 1.0
Version historyVersion Date Main author Summary of changes
0.1 5 Nov 09 E. Owen D. WaygoodErel Avineri
0.2 1 Dec 09 E. Owen D. Waygood and Erel Avineri
Reorganization of chapters; executive summary; inclusion of work from Italian and Brazilian partners; inclusion of research from health field; expansion of discussion of influence
1.0 5 Feb 10 E. Owen D. WaygoodErel Avineri
Changes made with respect to internal reviewer comments.Examples given of how concepts could be applied. A few more websites were identified as excellent examples.
Name Date
PreparedReviewed
Authorised
5/02/10 3 University of the West of England, Bristol

Behavioural Inception Report Final Version 1.0
Executive SummaryThe Carbon-Aware Travel Choice in the City, Region and World of Tomorrow (CATCH) project was created to answer a call for proposals from the European Commission under the call FP7-TPT-2008-RT1 targeting topic TPT-2008.0.0.2 the climate friendly travel choice in the city, region, world of tomorrow. The CATCH project aims to reduce CO2 production that is related to transport by providing a platform of knowledge for travellers, businesses, planners, and other mobility stakeholders. The CATCH project will contribute to creating a new mobility culture by enabling travellers to understand climate change impacts of their mobility choices and providing guidance on how to take effective action.
The purpose of the inception report is not to design the product that will result from the CATCH project, but lend insights into behaviour change. Level one stakeholders are at the city level, such as planners, but the people that must change are individuals. Therefore, this report looks at how individuals interpret information and how information can lead to behaviour change. Without an understanding of that process, considerable resources could be wasted on good intentions that miss their target because they weren’t relevant. A project that may be appropriate and effective in one city will not necessarily be in another and it is important for level two stakeholders to understand why.
This inception report reviews existing literature related to behaviour change with consideration to providing information about carbon dioxide (CO2) production. It begins by looking at how individuals understand the risk of climate change. It then turns to information seeking and use in travel. From there it moves to a general review of behaviour change with respect to climate change and transport. Building on that, evidence from research on household energy use and transport on changing behaviour are introduced. A summary of psychological-related barriers follows. The last few chapters outline techniques used to change behaviour, reviews previous European Commission projects, and examines existing tools.
As the concept of CO2 is new, questions remain as to how it should be used to affect people’s behaviour. The first is to establish how it should be presented to increase understanding and personal responsibility to change. That issue contains a number of different problems including learning styles, conceptualizing, reducing the tendency to future discount, and presenting the information in such a way as to increase positive response. This project will examine some of these concerns in research conducted following this report.
Tools for planners and transport practitioners in general ultimately must consider how individuals behave. This report does not review how structural changes affect individuals, but focuses on changing behaviour given the current status. Other projects such as TAPESTRY and MAX-SUCCESS also considered related topics. One unique aspect of the CATCH project will be to examine what tools exist to influence people and the use of CO2 to stimulate change. The recommendations in Chapter 10 highlight the concepts and knowledge discussed in the report could be applied to a knowledge platform, but also how planners and practitioners could apply them.
The review found that although tools exist to inform individuals on the CO2 produced due to activities, uncertainty exists around use and effectiveness. To begin, use of tools such as carbon calculators and journey planners is limited to a small percentage of the population. Further, when the results are presented on CO2 they are most often presented as a weight. As CO2 is a relatively new concept to most individuals and people may not understand what is a lot, that information may not be meaningful. Finally, once information on CO2 production
5/02/10 4 University of the West of England, Bristol
Behavioural Inception Report Final Version 1.0
is shown, few sites have advice on how to change, and if there is, it is often in a general sense, not necessarily relevant to that individual.
Building on problems related to understanding CO2, literature on how people understand the risks of climate change were reviewed. Some major points here were concepts of future discounting and a feeling that the problems are not relevant. The impacts of CO2 and other GHG production are described as affecting a future climate. People consider the future in abstract terms and unfortunately discount costs and benefits. Climate change is often framed as restrictions on current behaviour to prevent losses in the future. Unfortunately, people see such restrictions as losses and they will likely seek to avoid them as the costs are not considered relevant (being in the future).
Considering social dilemmas such as climate change, people will often behave in one of three ways: denial, token behaviour change, and complete behaviour change. The first, denial, can result in no change or even behaviour in the opposite direction. Token behaviour change may occur when an individual is aware of the concerns, but only does some small token actions which may not have significant effect. A further problem with respect to climate change is that people who recycle (unrelated to climate change) may feel that they are already behaving environmentally. A full behaviour change is the desired state where individuals adjust the important aspects of their life to limit undesirable impacts.
Behaviour change in transportation faces a number of significant hurdles. These include both structural (e.g. transport network) and psychological ones (e.g. a desire to use certain modes, lack of knowledge). Research has found that using information can affect a number of the psychological barriers in a positive way. That information may affect their attitudes towards climate change or merely towards a mode, it could be advice on how to accomplish an activity without using a car, or stimulating motivation to behave in a desirable way through individually appropriate incentives.
Incentives are not limited to financial ones, and probably shouldn’t be. A couple of problems exist with financial incentives. One is that once that barrier is removed, the behaviour may return to the previous one. Second is the issue of moving from socially unacceptable to socially acceptable with a cost. Socially undesirable behaviour may become worse when a cost is assigned because it tells individuals that it is now acceptable, but for a price.
Choice architecture may be used to direct people to desirable behaviour. A number of concepts exist such as default behaviour, doing the right thing, and grass roots. If society can establish that default travel is not by a car, then individuals would be less likely to use them. People are generally prone to do the right thing as society depicts it. If barriers are properly addressed and changing to climate-friendly behaviour is valued, people will be motivated to do such behaviour. The concept of grass roots relates to the influence that family and peers can have on an individual. The people with most influence will be trusted associates and momentum can be built through those individuals.
One technique found to be useful in fields such as household energy use is the direct information feedback that relates an action to a result. This concept is contained within choice architecture in the concept of salience. People may understand that driving is related CO2 production, but how much is likely not understood. Nor, is the connection made relevant with respect to place and time.
This report discusses concepts ranging from awareness and understanding climate change and specifically CO2 production to methods from outside of traditional transport and land-use
5/02/10 5 University of the West of England, Bristol

Behavioural Inception Report Final Version 1.0
planning that can achieve behaviour change. Chapter 10 summarizes those findings, offers examples of how various concepts could be applied, gives recommendations on site design for providing CO2 information, and lists research gaps.
5/02/10 6 University of the West of England, Bristol

Behavioural Inception Report Final Version 1.0
TABLE OF CONTENTSIntroduction 11
The CATCH Project 11
The Inception Report 11
1 Responses to Information on Environmental Impacts 13
1.1 Understanding the Risk 13
1.1.1 Framing 131.1.2 Discounting 141.1.3 Perceived Resilience 151.1.4 Associative, Affect-Driven, and Analytic Processes 151.1.5 Women and Men 151.1.6 World View and Groups 151.1.7 Environmental Baseline 161.1.8 Interpreting Information in Transport 161.1.9 The Concept of CO2 16
1.2 Information Provision: The Behavioural Change Paradigm 17
1.3 Why do People Check Information? 17
1.4 Summary 18
2 Seeking and Using Information in Transport 19
2.1 Why don’t People Use Travel Information? 19
2.2 What Type of Information do People use for Transport? 19
2.3 Learning Styles 20
2.4 Path to Checking Information 20
2.5 Summary 21
3 Human Behaviour 223.1 Human Behaviour Related to Climate Change 22
3.1.1 Processes Affecting Behaviour with Respect to Climate Change 223.1.2 Behavioural Responses 22
3.2 Human Behaviour Related to Transport and CO2 23
3.3 Summary 24
4 Changing Behaviour 25
4.1 Examples from Household Energy Use 25
4.2 Information and Transportation 26
4.3 Stages of Change 29
4.4 Summary 32
5 Barriers Identified 33
5.1 Further Questions 35
5.2 Summary 35
6 Inducing Behaviour Change: Evidence from Behavioural Sciences 36
6.1 Commitment 36
6.2 Prompts 37
6.3 Norms 37
6.4 Motivation 38
6.5 Feedback 38
6.6 Incentives 38
5/02/10 7 University of the West of England, Bristol
Behavioural Inception Report Final Version 1.0
6.7 Caldini’s “Weapons of Influence” 39
6.7.1 Reciprocation 396.7.2 Commitment and Consistency (Commitment) 396.7.3 Social Proof (Norms) 396.7.4 Authority 406.7.5 Liking 406.7.6 Scarcity 406.7.7 Decision Shortcuts 40
6.8 Other Concepts 40
6.9 Summary 41
7 Lessons from Behavioural Economics: The Application of ‘Choice Architecture’ in the Design of Behavioural Change Interventions 42
7.1 The Power of Defaults 43
7.2 Framing and “Loss Aversion” 43
7.3 Salience 43
7.4 People are Motivated to ‘Do the Right Thing’ 43
7.5 Financial (dis)Incentives Might Send the Wrong Message 43
7.6 Grass roots 44
7.7 Should we Incorporate Nudges In the Design of Travel Behavioural Change Interventions? 44
8 Review of European Commission Projects 458.1 Tapestry 45
8.2 WiseTrip 46
8.3 i-Travel 46
8.4 MAX-SUCCESS 46
8.5 GREENTRANSPORT-TV 47
8.6 MIMIC 47
8.7 CAMPARIE 47
8.8 CIVITAS Initiatives 48
8.9 Summary 48
9 Review of Web-based Transport Tools 499.1 For Planners 49
9.1.1 Fostering Sustainable Behaviour (cbsm.com) 499.1.2 Tools of Change (toolsofchange.com) 499.1.3 European Local Transport Information Service (eltis.org) 499.1.4 MAX-SUCCESS developed tools 49
9.2 For Operators 50
9.2.1 For Companies 509.2.2 Mobility Manager 50
9.3 For Individuals 53
9.3.1 Carbon Calculators 549.3.2 Trip Planners 569.3.3 Recommendations on Site Design 57
9.4 Other User Sites on Transport Behaviour Change 58
9.4.1 TransportationTown.com 589.4.2 Drive $marter Challenge 589.4.3 H+T Affordability Index 58
9.5 How are Environmental Impacts Communicated? 59
5/02/10 8 University of the West of England, Bristol
Behavioural Inception Report Final Version 1.0
9.6 Summary 60
10 Summary of Research Gaps and Findings 61
10.1 Research Gaps Indentified 61
10.1.1 With respect to barriers to behaviour change in general 6110.1.2 With respect to specific barriers to behaviour change 6110.1.3 With respect to information on CO2 62
10.2 Summary of Findings and Applications 62
10.2.1 Chapter 1 6210.2.2 Chapter 2 6410.2.3 Chapter 3 6510.2.4 Chapter 4 6710.2.5 Chapter 5 6910.2.6 Chapter 6 6910.2.7 Chapter 7 7210.2.8 Chapter 8 7210.2.9 Chapter 9 7210.2.10Practitioner specific Recommendations 74
11 References 77
12 APPENDIX A: Projects Related to Reducing Car Use 84
13 APPENDIX B: Framing and “Loss Aversion” – An Example of a ‘Nudge’ in a Travel Behaviour Context 8614 APPENDIX C: Reviewed Carbon Calculators and Travel Planners 87
15 APPENDIX D: Segmentation Review 9116 APPENDIX E: Examples of Mobility Management 93
16.1 DREAMS Project 93
16.2 ATAC (Rome) web based tool 94
16.3 Other experiences 95
TABLESTable 4-1 Examples of stages of change models...................................................................29
Table 9-1 Services provided by Mobility Manager..................................................................50
Table 12-1 Examples of projects related to reducing car use.................................................82
Table 15-1: Sorting segmentation groups from various countries in the European Union......89
Table 16-1 web sites information on mobility management in United States..........................93
Table 17-2 web sites information on mobility management....................................................95
FIGURESFigure 2-1 Path to checking information based on reviewed research...................................19
Figure 4-1 Psychological Impacts of Behaviour based on the Theory of Planned Behaviour (Ajzen, 1991) and research reviewed (Appendix A)........................................................27
Figure 9-1 Structure of the Mobility Management (from Salis, 2009).....................................50
Figure 13-1 Framing effects: Three ways of presenting travel time information.....................84
Figure 16-1 DREAMS travel planner module (from Colorni et al., 2005)................................92
5/02/10 9 University of the West of England, Bristol
Behavioural Inception Report Final Version 1.0
5/02/10 10 University of the West of England, Bristol
Behavioural Inception Report Final Version 1.0
IntroductionThe CATCH ProjectThe Carbon-Aware Travel Choice in the City, Region and World of Tomorrow (CATCH) project was created to answer a call for proposals from the European Commission under the call FP7-TPT-2008-RT1 targeting topic TPT-2008.0.0.2 the climate friendly travel choice in the city, region, world of tomorrow. The CATCH project aims to reduce overall greenhouse gas (GHG) production that is related to transport by providing a platform of knowledge for travellers, businesses, planners, and other mobility stakeholders. The CATCH project will contribute to creating a new mobility culture by enabling travellers to understand climate change impacts of their mobility choices and providing guidance on how to take effective action.
To design a platform that will bring about CO2 reductions from transport the CATCH project will address two levels of target audiences:
1) Key targets for CATCH (level one): city stakeholder who influences transport such as politicians, planners, and transport operators.
2) Secondary targets (level two): city stakeholders such as citizens and businesses.
The stakeholders targeted by level one (city stakeholders) are themselves individuals and can be engaged through increased awareness. Further, by helping city stakeholders understand citizen motivations and behavioural responses it will help them design more efficacious interventions. This report focuses on individuals as in a democratic society it is necessary to engage the public and get their support. The recommendations in Chapter 10 will highlight both how the concepts discussed in this report could be incorporated in a knowledge platform, but also how they could be applied by practitioners.
The Inception ReportThe aim of CATCH is to provide a platform of knowledge for various stakeholders to reduce the CO2 produced by transport. There are a number of factors that contribute to mode choice including the built environment (e.g. road network, transit, land-use patterns, density), socio-demographics (e.g. economic status, sex), life-cycle stage (e.g. young and single, married with children, retired), knowledge, and social and psychological (e.g. personal and societal norms, attitudes, values, beliefs). Although it is important to understand what explains current mode choice, this report focuses on what theories and empirical evidence exist on behaviour change away from car use.
The purpose of the inception report is not to design the product that will result from the CATCH project, but lend insights into behaviour change. Level one stakeholders are at the city level, such as planners, but the people that must change are individuals. Therefore, this report looks at how individuals interpret information and how information can lead to behaviour change. Without an understanding of that process, considerable resources could be wasted on good intentions that miss their target because they weren’t relevant. A project that may be appropriate and effective in one city will not necessarily be in another and it is important for level two stakeholders to understand why. The behavioural research included in this report provides guidance on a number of areas:
Helping cities/operators design their own campaigns / interventions to change behaviour (rules/ideas/framework for changing behaviour).
5/02/10 11 University of the West of England, Bristol

Behavioural Inception Report Final Version 1.0
Helping the CATCH project design the CATCH site.
Helping the CATCH project elaborate certain aspects of the CATCH platform (content) to exploit opportunities we feel exist in transport and climate change behavioural change.
Helping the CATCH project develop the scope of the CATCH platform.
Helping in understanding the opportunity in presenting transport and climate change information at the city level.
Related to behaviour change the report will consider transportation projects that have led to behaviour change, interventions outside of transportation that have been effective, discuss the underlying knowledge that explains those changes, social marketing techniques related to behaviour change, research on information use in transportation, and problems related to understanding climate change.
The report begins in Chapters 1 and 2 by looking at information and climate change. It starts by discussing how people understand the risk associated with climate change, then moves onto issues with seeking information, what type of mediums are used, and learning styles.
How people react to the risks of climate change and behaviour changes that may occur with respect to transport are looked at in Chapter 3. It discusses reactions such as denial, token behaviour change, and complete behaviour change and how prospect theory and social norms may affect a desire to change.In Chapter 4, research that has shown behaviour change within household energy use and transport are shown along with psychological factors in choice and stages of change. Effective interventions from household energy use behaviour change are highlighted and their relevance to transport discussed. Information has been used to try and effect transport behaviour and research there is considered. Psychological factors in choice and stages of change discuss concepts that relate to behaviour change and barriers that may exist.
Barriers that were identified in literature are laid out in Chapter 5. These mostly focus on non-structural barriers such as mistrust in authority figures, perceived risks of change, and habit.
Techniques and concepts on behaviour change from behavioural sciences are reviewed in Chapter 6. These include commitment, prompts, norms, motivation, feedback, incentives, and techniques of influence.
Behavioural economics and choice architecture are examined in Chapter 7. Concepts here include default behaviours, framing and loss aversion, salience, doing the right thing, financial incentives, and grass roots. The chapter ends by considering whether nudges could be incorporated in this project.
Previous European Commission projects are reviewed in Chapter 8 with consideration to their relevance to this project. Some of these projects are TAPESTRY, MAX-SUCCESS, and CITIVAS.
Tools that are available for planners, operators, and individuals on the Internet are reviewed in Chapter 9. These include ELTIS, Mobility Managers, and carbon calculators. How information can change behaviour and how information is being presented is examined for individual tools.
5/02/10 12 University of the West of England, Bristol
Behavioural Inception Report Final Version 1.0
The final chapter summarizes findings and highlights recommendations. It also gives examples of how the concepts discussed in the previous chapters could be applied to transport.
5/02/10 13 University of the West of England, Bristol

Behavioural Inception Report Final Version 1.0
1 Responses to Information on Environmental ImpactsThe aim of CATCH is to provide a platform of knowledge for various stakeholders to reduce the CO2 produced by transport. To inform the design of the information platform, it is necessary to understand the connection and impact between information provision and behavioural change. This chapter reports on the findings from literature on: psychological aspects to understanding and reacting to information; the relation between information and travel behaviour.This chapter begins by looking at how information on climate change is understood by individuals. Next is a discussion on the considerations individuals have when seeking information. It is followed by a discussion on the type of information is used by people for travel. Following that learning styles are introduced and a path to checking information is shown. The chapter ends with a summary of findings.
1.1 Understanding the RiskThe concept of climate change is relatively new to mainstream understanding. The majority of adults did not have formal education on it, and how people understand (or don’t understand) climate change is an important starting point for developing tools to increase awareness on impacts. How people judge the risk of climate change will affect their motivation to act, ultimately affecting their behaviour. This section summarizes some key points from the American Psychological Association’s Task Force on the Interface between Psychology and Global Climate Change (2009) and introduces other relevant literature.
1.1.1 Framing The impact of excessive CO2 production is not immediate with a build-up over years of heat-trapping gases in the atmosphere and an interaction between the ocean water system and atmosphere takes even longer. The impacts of CO2 and other green house gases (GHG) are often presented as future weather events. However, people tend to underestimate small probability events such as weather disasters, unless the event has recently occurred, whereby it is typically overestimated1. This results in the impacts of CO2 likely being underestimated in general.Climate change may be framed mentally as a matter of weather. People see weather and climate as being out of their control, which may lead to a sense of helplessness and resignation. However, if climate change is seen to affect one’s health and wellbeing, it may increase pro-environmental behavioural norms and personal responsibility for action. Framing climate problems in terms of widely held supportive values might increase policy support. Climate change is a technological disaster (in that human behaviour contributes), but the result is a natural disaster. This relates to how people will react to the problem of climate change. For human induced problems (such as a technological disaster), people generally have a negative reaction that includes distrust of government, anger, and frustration. In
1 Hertwig et al. (2004) call for two different theories of risky choice: human decisions from description differ markedly from human decisions from experience. When people have access to information sources (e.g. weather forecasts or drug-package inserts) they can make decisions from description. When people make travel choices they typically do not have any summary description of the possible outcomes or their likelihoods (see, for example, Avineri and Prashker, 2003, 2006). For such decisions, people rely much on their own experience. Decisions from experience and decisions from description can lead to dramatically different choice behaviour. In the case of decisions from description, people make choices as if they overweight the probability of rare events, as described by prospect theory (Kahneman and Tversky, 1979; further discussed in chapter 3 of this report). Hertwig et al. (2004) found that in the case of decisions from experience, in contrast, people make choices as if they underweight the probability of rare events.
5/02/10 14 University of the West of England, Bristol
Behavioural Inception Report Final Version 1.0
response to this type of reaction, it was suggested that climate change should be framed as a “global disaster” in order to provide a clearer and more realistic picture which should lead to more immediate disaster mitigation and preparation (Swim et al., 2009). However, whether this re-labelling will continue to distance personal responsibility and impact if the problem is perceived as too large to positively affect.How people perceive the cause will affect whether they feel ethical responsible and accountable. The principle “you break it, you fix it” may be appropriate. However, the problem may be convincing people that they are indeed responsible, and that they can fix it.
The difference between seeing the problems as a threat versus a challenge will also affect how people react. If people perceive that they have little control and appraise the worry as a threat they may react with aversiveness, anxiety, and distress.
Research Gap: What is the best way to present information on CO2 production to increase awareness of personal contribution?
Research Gap: What is the appropriate framing to create positive action?
1.1.2 DiscountingClimate change will affect different places in different ways and at different times. As a result, the risk that climate change possesses is uncertain with respect to place and time. That uncertainty leads people to discount their impact. A distant, future disaster (e.g. a drought in 30 years) is considered in abstract terms, but the need to change is an immediate concern and considered in concrete terms such as potential losses to income.The cost of mitigation is often in the present, whereas the benefits are in the future. The tendency to discount future benefits and costs and the tendency to rely on present costs and benefits would lead most people to behaviour that is undesirable with respect to climate change in the current transportation context. However, as a sign of hope, the public health field was able to motivate the behavioural choice to quit smoking, despite the tendency to discount the future health impacts. Unfortunately, transport behaviour is likely more difficult to change, as investment in housing location and vehicle ownership are significant barriers.
Research Gap: How does discounting of environmental costs and benefits relate to discounting of economic or social costs and benefits?
Research with smoking and future discounting suggests a number of important points. One point is that discounting is inversely related to the magnitude and delay of the outcome for smoking (Chapman and Elstein, 1995). This could mean that even catastrophic future failures, if far enough away, can be easily discounted to the point of negligible impact by an individual. Current smokers were found to discount the value of delayed money more than non-smokers and delayed cigarettes lost subjective value more rapidly than delayed money (Bickel et al., 1999). This could relate to the impulsive and immediate nature of the “rewards” of smoking. However, other research found that with respect to monetary discounting, adolescent smokers and non-smokers did not show any difference (Reynolds et al., 2003). Reynolds et al. did find that the number of peers that smoked was higher for adolescent smokers and those who had tried smoking. This is likely related to peer or social influences discussed in later chapters.
Research Gap: Does the same occur for habitual car drivers? i.e., does the subjective value of a car trip (vs. other modes) decrease rapidly with respect to time? This would be important for achieving commitments to car reduction. If people discount the subjective value of a car trip rapidly with respect to time, then it may be easier to get a commitment to reduce car
5/02/10 15 University of the West of England, Bristol
Behavioural Inception Report Final Version 1.0
travel if it is framed in the future. The importance of commitment is discussed in a later chapter.
1.1.3 Perceived ResilienceSome individuals, in particular higher status groups, likely overestimate their resilience to the future impacts. Although they may accept that there will be future impacts, they feel that through resources available to them that they will be able to avoid them (e.g. by moving to unaffected areas, buying food even with increased prices). Creating doubt in the belief that they are resilient to the impacts may be necessary to move away from inertia.
Research Gap: How to create enough awareness of need to change without overwhelming?
1.1.4 Associative, Affect-Driven, and Analytic ProcessesRisk perception is influenced more by associative and affect-driven processes (i.e. feelings) than by analytic processes. Associative and affective responses are fast and automatic, whereas analytic processes such as statistical descriptions require skills that must be learned and require cognitive effort. Scientists should rely on analytic processes, but non-scientists will typically rely more on feelings (e.g. affective or associative responses). The use of analytical information may not be appropriate for many people.
Research Gap: How best to take advantage of associative and affect-driven processes when presenting CO2 information related to travel?
1.1.5 Women and MenUsing associative and affective information may be more effective methods of communicating. Combined with considerations to making the impacts more concrete rather than a distant abstract future, presenting climate change information linking current behaviour with future scenarios that are understood by affect-driven processes may help to increase awareness and create motivation to act.Information on climate change presented to women and men may be understood differently. For one, risk perception relates to sex. Women have a larger and “more problematic” perception of risk with respect to health, safety, financial, and ethical domains. Understanding those perceptions can help provide the appropriate information to stimulate behaviour change through motivation.
Research Gap: Should CO2 information be presented differently to women and men?
1.1.6 World View and GroupsA worldview, or distinct “culture”, can affect risk perception. Douglas and Wildavsky (1982 in Swim et al., 2009) identified five different views: hierarchical, individualist, egalitarian, fatalist, and hermitic. Leiserowitz (2006 in Swim et al., 2009) found evidence that these groupings could explain differences in people’s perceptions of risk with respect to global warming. Further, in a study of worldview, lifestyle, and sustainability, Kitamura and Sakamoto (2007) found that those groupings related to auto dependency, transit avoidance, and support of novel policies. Considering those results, it is likely necessary to provide different information to stimulate different groups of people. What is appropriate for an individualist (e.g. the benefits to you) may not be appropriate for an egalitarian (e.g. equality for all).
5/02/10 16 University of the West of England, Bristol

Behavioural Inception Report Final Version 1.0
Different communities will socially amplify some risks while ignoring, discounting, or attenuating others. Concerns over personal security may be amplified, while concerns over climate change are pushed aside. Certain communities are more inclined to react to fear as well. In the USA, people who reject climate change have lower risk perceptions than the rest of that society.
Research Gap: With respect to worldviews, should different information be provided to stimulate understanding and action?
1.1.7 Environmental BaselineAnother concern is “environmental generational amnesia” (Kahn, 1999 in Swim et al., 2009). This refers to individuals using their own experiences as a baseline and not realizing longer-term changes. This is related to the arguments made in “Collapse” (Diamond, 2005) about the inability of societies such as Easter Island and Viking settlements in Greenland which failed to see the progression of environmental destruction their behaviour was having. Unlike those local degradations though, climate change is a global problem.
Research Gap: How can information overcome this baseline understanding?
1.1.8 Interpreting Information in TransportWith respect to transportation, how a person interprets information is related to a number of factors including (Lyons et al., 2007): socio-demographic attributes; socio-psychological and cognitive factors; physical and mental processing abilities; and the extent of experience (with travel and travel decision making). As well, personal experience is typically valued over other information (Avineri and Prashker, 2006; Chorus et al., 2006), meaning that people will not necessarily accept information that differs from their personal experience. Experience is likely related to ambiguity aversion, that people simply prefer the familiar over the unfamiliar (Epstein, 1999).
1.1.9 The Concept of CO2
There are a number of issues related to understanding the concept of CO2. The concept itself is new and abstract. Without a reference point, it is difficult for people to understand what is “good” or “bad”. Similar to when the concept of calories is used, people often need the information to be contextualized with respect to something they understand. For calories, it may be a hamburger or the number of minutes of exercise. For CO2 production the equivalent may be the number of earths required if all individuals behaved the same way or the number of trees required to sequester the amount. For some people, they may desire to have an economic value (Wallace, 2009). To date, there does not appear to be any empirical research that has examined how the information on CO2 production should be presented.
Research Gap: What is the best way to present information on CO2 production to increase understanding?
The terms carbon dioxide, global warming and the more recent climate change may not be appropriate outside the scientific community. Coulter et al. (2008) found that although users of “carbon calculators” were typically familiar with the terms, non-users were not and commented that scientific terms confused them.
Research Gap: Is it necessary for individuals to understand the environmental impacts to change behaviour towards environmental travel behaviour?
5/02/10 17 University of the West of England, Bristol

Behavioural Inception Report Final Version 1.0
This section discussed issues related to information on climate change and how people interpret it. The remainder of the chapter focuses on how traditional information on travel is sought and used.
1.2 Information Provision: The Behavioural Change ParadigmProviding individuals with information about attributes of their travel choices, such as travel time, travel costs or risks might be seen not only as a service provided to the public, but as an instrument to change travel behaviour. The presumption is that individuals, provided with travel information, can make more fully informed choices which will be to their personal advantage and potentially that of the transport system as a whole. In the economic tradition, where the assumption of perfect information is a necessary part of rational decision-making, information systems are therefore a necessary part of choice. However, the design of travel information systems has often ignored the psychological, ergonomic and cognitive processes of retrieving and using information. The factors that might play a role in behavioural change processes are not always addressed in the design of such systems. Some perhaps unrealistic expectations of big effects from new information systems have remained unrealised: in practice, the detailed information tends to be sought after a decision to change behaviour (or to consider changing behaviour) for other reasons. Considering that, information provided about a trip or route supports rather than stimulates behaviour change. Many journeys are routine, familiar and predictable and correspondingly there is not a demand for information use in relation to travel choice.
1.3 Why do People Check Information?People check information when they face uncertainty with respect to their own knowledge on the trip. That uncertainty can relate to the trip as a whole or to some factor of the trip such as arrival time or cost. When a person has personal experience and are satisfied with their travel, they are unlikely to check information, especially on other modes (Farag and Lyons, 2008).
Considering greenhouse gases (GHG) like CO2, such information was not traditionally available, and likely not considered. In some countries segments of the population may consider the environment when choosing a mode (Anable, 2005; Hunecke et al., 2008; Kaufmann, 2000), however, in other countries such a group of individuals may not exist (Beirao and Cabral, 2008). To individuals who value environmentally-related information, the provision of information on the production of CO2 may be relevant and considered when making a trip. However, the majority of populations across countries in the reviewed material did not.
In the United Kingdom (UK) a study (Farag and Lyons, 2008) found that people first decide their mode, and then check information if deemed necessary. Information was most successful in changing some aspect of the trip when it was received prior to the trip, early in-trip, or for longer trips (Chorus et al., 2006). This suggests that a trip planner may not affect the current trip mode choice (as the mode will likely already be decided), but Chorus et al. (2006) suggest that information may have more of an effect on long-term travel patterns.
Although Chorus et al. (2006) summarized research that information prior or early on in-trip could affect a trip in the present, they suggest that information post-trip could affect long-term patterns. Post-trip information is considered reliable as it is based on true events, as opposed to speculation (e.g. estimates of time on trips not yet made). Considering that, immediate information feedback in combination with a comparison of other travel choices could influence future travel patterns. However, the problem would be to present appropriate information in order to influence changes towards the desired behaviour.
5/02/10 18 University of the West of England, Bristol

Behavioural Inception Report Final Version 1.0
Research Gap: Would providing people information, post-trip, of alternatives that could reduce the CO2 stimulate behaviour change? If information could be provided, how could we motivate people to check such information?
Research Gap: How to provide information on CO2 if it is not sought (e.g. metering CO2
produced while driving)? And how to stimulate people to seek such information (e.g., providing incentives)?
1.4 SummaryThis chapter included discussion on the risks of climate change and how people do or don’t understand it. As was seen, it may be difficult for individuals to not only understand the concept of CO2, but also how current actions will affect the future. Even if an amount of CO2
is understood to be “good” or “bad”, it will likely be necessary to frame the issue appropriately for individuals with different priorities. For some individuals a monetary value may be appropriate, while for others the impact on society may be more affective. Consideration to an individual’s values will help create appropriate messages to influence change.Even if an amount of CO2 is understood to be “good” or “bad”, it will likely be necessary to frame the problem appropriately for individuals with different priorities. For some individuals a monetary value may be appropriate, while for others the impact on society may be more affective. Consideration to an individual’s values will help create appropriate messages to influence change.The CATCH project should consider these concerns when addressing carbon awareness. It may be necessary to research how best to provide information to individuals to increase understanding of CO2 and impacts on the climate.
5/02/10 19 University of the West of England, Bristol
Behavioural Inception Report Final Version 1.0
2 Seeking and Using Information in TransportIn this chapter reasons why people seek out information, where they seek it from, and how learning styles may influence preferred sources are discussed.
2.1 Why don’t People Use Travel Information?Related to why people check information, there are a number of reasons why people don’t make use of information. Uncertainty is a reason a person may seek information, so conversely, if a person is satisfied with their trip and the level of knowledge that they have, they will not use information. Once a habit has been established, information seeking and behaviour change are negligible. A few authors (Gärling et al., 2001; Gärling and Axhausen, 2003) wrote that this is a form of economising on decision-making in travel behaviour. This likely relates to results that found the greater reliability of a route, the less likely an individual is to change. In order to stimulate a person to check information, it may be necessary to create uncertainty and a lack of satisfaction with their current travel. However, for car drivers, they typically underestimate the costs of using cars, while they overestimate the costs of using transit. Further individuals are likely to ignore information on modes they deem as low quality and car-users’ perception of transit is low with respect to concerns such as cost, reliability, and security.
Research Gap: How to motivate people to check information? What could create enough uncertainity about car use to investigate other options?
2.2 What Type of Information do People use for Transport?The type of information sought relies on a number of factors relating to gender, age, the context of the trip, and experience. Campbell and Lyons (2007) found that men were more visual (e.g. maps) and that women preferred written or verbal information. Older people used information sources that are more “traditional”, such as well-established road maps. Younger people, especially educated young men, were more likely to use Internet sources when seeking information. If the trip was for work, then formal written assistance combined with a road map was preferred. If the trip was social, then people in the study preferred to ask someone within their social network. Experience with a medium of information will influence use, but groups who are unfamiliar with the Internet may not use it.Farag andand Lyons (2008) found that the majority of people who checked information used the Internet as it is free, felt to be reliable, up-to-date, and easy to access from work or home. From the above, this may be related to younger people having less experience with travelling (e.g. greater uncertainty) and greater comfort using the Internet. Once an individual found a site that they were comfortable with, they typically continued to sue that site (related to satisficing).Although the Internet may be a useful information source, Lyons et al. (2007) found that there was low awareness of on-line tools, and related to that, low use. They found that the people that “needed” to be aware of sites often were, but that this percentage of the UK population was small. If on-line tools are going to affect people, they must be used. They found that there was a need to change perceptions of car users about other modes so that they would even consider those modes. Along with creating a need or desire to use a site, awareness of the site’s existence may also be necessary.Different modes have different information available. Due to the prevalence of car use, a wide variety of information sources are available for drivers. In the UK, drivers typically relied
5/02/10 20 University of the West of England, Bristol
Behavioural Inception Report Final Version 1.0
on the radio for current information on roads (Lyons et al., 2007). However, that may be changing with increased use of modern information sources such as electronic navigators and various applications on personal electronics that allow for individualised information. However, mediums such as billboards by motorways and radio advertisements could be used to motivate car drivers to investigate the site. That motivation could be stimulated through curiosity or uncertainty with respect to their perception of the superiority of cars to other modes.On the Internet, journey planners can help decide routes or modes to use. Journey planners could provide two types of information: descriptive information on the alternatives (ideally in a format that will help the user to make comparisons) or prescriptive information in a sort of ‘advice’ to highlight what might be the best travel choices for the user. For unfamiliar situations, prescriptive information was most effective. For familiar situations comparisons of choices were best. However, if an individual is highly familiar with their route and they are satisfied, they are unlikely to seek information, especially on other modes.
2.3 Learning Styles Learning styles may be related to the sensory modes of presentation by which learners’ prefer to take in new information. VARK is a perceptual, instructional preference model that categorizes learning by sensory modes of learning: visual, aural, textual (reading/writing) and kinesthetic (Fleming, 1995; VARK, 2006), depending on the neural system with which a learner prefers to receive information. It may be argued that every individual has a multimodal learning profile in which all VARK components are represented, but within that profile some have a particular set of preferences. Therefore, a multimodal information provision approach may appeal to all modalities. However, information presented in carbon calculators and web-based journey planners commonly use textual information (see Chapter 9), with limited use of visual, but not the other VARK styles.
Recommendation: Information should be presented in different mediums to address different sensory modes.
2.4 Path to Checking InformationFrom the reviewed literature, a general path to checking information can be developed (Figure 2-1)
2.5 SummaryIndividuals check information about a mode when they are uncertain about some aspect of the trip, rather than checking information to decide on the best mode, so it may be ineffective
5/02/10 21 University of the West of England, Bristol
Figure 2-1 Path to checking information based on reviewed research.
Trip context and mode experience
Mode choiceWhat medium?
Experience with medium; preferences
Check information?
Level of uncertainty

Behavioural Inception Report Final Version 1.0
at changing that particular trip. However, the potential to affect long-term travel behaviour may exist. Further, what this may point to is focusing efforts on information provision at an earlier stage so as to affect decisions such as housing location (affecting accessibility) and car ownership (affecting mode availability).Assuming that information may be able to affect long-term travel behaviour it should be in a medium relevant to the individual’s context and learning style. Information on new and abstract concepts such as CO2 require research on how best to represent it to increase understanding and impact behaviour. Further, considering the research that suggests people consult travel information after a mode choice has been made, the influence of information on earlier stages that affect behaviour such as attitude and intention (discussed in Chapter 4) may be more relevant.When producing information for individuals, level one city stakeholders should apply these findings as well as the CATCH project itself. Providing information that meet the different learning style needs and stimulating the need to check CO2 produced should both be applied.
5/02/10 22 University of the West of England, Bristol
Behavioural Inception Report Final Version 1.0
3 Human BehaviourThis chapter looks at behaviour change with respect first to climate change and then to transport specifically.
3.1 Human Behaviour Related to Climate ChangeAs mentioned in the first chapter, there are a number of factors that affect mode choice. The contextual drivers that affect how an individual behaves are related to their ability (e.g. physical environment, income) and motivation (e.g. attitudes, values, beliefs). Their behaviour will also relate to the society (e.g. cultural norms, values) within which they act.
3.1.1 Processes Affecting Behaviour with Respect to Climate ChangePeople will adapt to and cope with the threat of climate change in different ways. Some of the psychological processes are:
sense making (i.e., understanding the problem), causal and responsibility attributions to climate change (i.e., the perception of what is
causing the change and what is responsible), appraisals of impacts (i.e., the perception of whether climate change will adversely
affect the individual), resources (i.e., the perceived ability to deal with the threat), affective responses (i.e., feelings), and motivational processes related to needs for security, stability, coherence, and control.
The processes will be affected by variations between individuals and cultures. They will relate to world views, values, beliefs, and impact the individual and culture’s resilience and vulnerability. Internal responses such as denial or problem solving will be affected by those processes.
3.1.2 Behavioural ResponsesHow the individual perceives their ability to take corrective action will affect their emotional response. Further, the individual’s perceived behavioural control will also affect behaviour change. In the case of climate change, if an individual feels that they can avoid the impacts (e.g. through geographical mobility) they may not change. On the opposite end, if the individual feels that they have no control, they may deny the existence of the problem as a stress coping strategy.Maiteny (2002 in Swim et al., 2009) found that there were three main responses to chronic anxiety about ecological and social problems. One was unconscious denial to stave off anxiety resulting in no change or an increase in the undesirable behaviour. A second response was to not to make any major shifts in lifestyle, but to do some “green” actions (token behaviour change). A third response was to take responsibility, change their lifestyle, and attempt to increase awareness in others.
Key Point: Three fundamental responses: denial, token behaviour change, full behaviour change.
In response to environmental problems, there may be numbness or apathy. Numbness refers to a secondary reaction after realizing the magnitude of the problems and a perceived
5/02/10 23 University of the West of England, Bristol
Behavioural Inception Report Final Version 1.0
inability to affect them. Apathy refers to a primary response which is to avoid learning more about the problem. Another emotional response is guilt, but unlike apathy and numbness it may be effective. Although some people may not like the message, Czopp et al. (2006, in Swim et al., 2009) found that it was effective. However, Brooks and Graham (2009) caution that a “guilt appeal” can backfire if individuals do not associate self-esteem with environmental issues. This relates to using appropriate messages to different people, depending on what will motivate them.
3.2 Human Behaviour Related to Transport and CO2
In the health belief model, an individual will undertake preventative behaviour as a function of their appraisal of the severity of the threat, the perceived benefits, and the perceived barriers (Glanz et al., 2002). Put another way, an individual will change their behaviour if the benefits (of avoiding a threat) outweigh the barriers. Unfortunately, with climate change there are a number of factors that relate to an individual’s interpretation of the threat to them, knowledge of how to change to diminish the threat, and the behaviour of others. These considerations will be examined in later chapters that examine existing tools related to climate change such as carbon calculators.In order to influence desirable behaviour, one suggested path is to support a “being prepared” attitude. The change of mode use away from automobiles may be promoted as preparing for a high energy cost future. Advice could be given about the actions that one should take to protect oneself and family. Creating environmental concern may be fundamental in creating pro-environmental behaviour and the motivation to enact intentions. Creating that concern is related to increasing awareness of the dilemma and establishing a connection between individual behaviour and the problem. That understanding may require information feedback to develop the link between present behaviour and the problem. This is related to knowing what to change and receiving feedback on effects.Unfortunately, research conducted in the European Commission project, TAPESTRY (2003a), found that individuals’ perceptions about comfort, traffic safety, and personal security could be changed, but those about cost and reliability did not show much sensitivity to change. This may be related to how costs for the modes are paid. Public transit often requires an immediate time and space connection between the trip and the cost, but travelling in a car has numerous disconnected costs including gas, maintenance, licensing, and insurance. A tool that removes those disconnections should increase awareness, possibly leading to behaviour change.
Research Gap: How to remove the disconnection between car driving and impacts (e.g. CO2
production, personal costs, taxes)?
Creating concern is one aspect, but assisting pro-active coping is important as well. Informational and social support that assists people make more desirable choices might help. Information on achievable steps would help eliminate one of the barriers to change.
Recommendation: Provide advice on achievable steps, sortable by different attributes such as monetary and time.
One of the major observations of Prospect Theory (Kahneman and Tversky, 1979), a descriptive model of decision making between risky alternatives, is loss aversion. This term refers to people's tendency to prefer avoiding losses to acquiring gains. The psychological
5/02/10 24 University of the West of England, Bristol
Behavioural Inception Report Final Version 1.0
effect of a loss is, roughly, about twice the effect of a gain of the same size. Prospect theory suggests that if a certain level of behaviour is expected (e.g. car ownership and high use), any level below this would be seen as insufficient. A reduction of that behaviour may be seen as a loss. At this point, for some individuals, a reduction in car use would be seen as a loss. Again, it will be important to create messages that are tailored to people’s values. However, societal expectations can change over time and high car use may not always be valued. The effect of loss aversion is further discussed in section 7.2.
Related to prospect theory is the status quo theory (Samuelson and Zechhauser, 1988) that suggests that people prefer not to change. This tendency to stick with the current situation, or default, could be harnessed to create desirable behaviour. The key would be to establish the default as the socially desirable behaviour. The effect of framing choices as defaults is further discussed in section 7.1.
Research Gap: How to frame change away from car use to avoid feeling of “loss”?
Social norms will also dictate what desirable behaviour is. For example, in the English-speaking west, the culture of motherhood (Valentine, 1997) supports chauffeuring of children, which increases car trips. Whereas in other cultures from developed nations, the societal norm is for children to travel independently, which reduces car trip generation (Waygood, 2009).Different groups will react to information in different ways and attending to targeted audiences through social processes and networks can help tailor the message to create desirable behavioural response. What works for individualists will not necessarily work for collectivists and appropriate messages and motivation are required for distinct groups.
3.3 SummaryBehaviour change with respect to climate change and transport was considered in this chapter. Three general reactions may be denial, token environmental behaviour (e.g. recycling, but not other lifestyle behaviour), or more thorough environmentally friendly behaviour. Affecting behaviour change will likely require techniques that change social norms (such as expectations of what a good life consists of), and take advantage of social networks and focus relevant benefits (e.g. individualistic benefits for some, altruistic for others). Related to transport, issues such as not knowing what actions to take, prospect theory on avoiding “lost mobility”, and how groups and social norms will affect an individual were discussed. From this, a potential contribution of the CATCH project would be to increase awareness of the dilemma and help overcome denial. For people aware of the problems, CATCH could provide relevant information on actions that can reduce individual impacts.
5/02/10 25 University of the West of England, Bristol

Behavioural Inception Report Final Version 1.0
4 Changing Behaviour4.1 Examples from Household Energy UseOutside of the transportation field, numerous studies have looked at “soft” measures (not requiring structural changes) to change behaviour in other energy-use areas such as household energy consumption. In a related field, household energy use considers attitudes, behaviour, and information with respect to energy use. The parallels between transportation and household energy use are long-term investments (e.g. cars, heating and air conditioning units) and their use (e.g. changing habits). As there are parallels between travel behaviour and energy use behaviour, it is therefore relevant to explore the evidence on the effect of information provision to make a change in the level of individual energy consumption. Abrahamse et al. (2005) reviewed 38 studies on interventions aimed at household energy consumption. If the methods are separated, there were 26 studies that used information (e.g. why one should reduce energy use, technology that can reduce use), 23 which used direct feedback (e.g. actual energy use and cost), nine with rewards or incentives, and nine with goal setting or commitments made. Many studies looked at a combination of different methods. Feedback was found to be the most successful method with only one study out of the 23 registering no reduction. Within feedback, continuous and directly available information is best (vs. monthly for example). General information was found to be ineffective, but tailored and authorative information did have an impact. Both of those points on information were echoed by Darby (2006). Rewards alone do not often have an effect, but seem to improve the effect of feedback. Goal setting works best in combination with feedback and should be public versus private and self-set rather than assigned.
Research Gap: What better ways could feedback on costs be provided to drivers that would lead to reduced use? Could a technology that uses mobile phones provide that information?
Darby (2006) found that the impact of direct feedback ranged from 5% to a 15% reduction in energy use. Direct feedback included: self-meter-reading; direct displays; interactive feedback via a PC; pay-as-you-go/keypad meters; ‘ambient’ devices; meter reading with an adviser, as part of energy advice; or cost plugs or similar devices on appliances. Indirect feedbacks such as monthly billing had results from 0-10%. Those results depended on the type of monthly feedback. Historic (e.g. tracking ones own use over time) information was found to be more effective than comparative (e.g. what others are doing).
Research Gap: How much of an effect could direct feedback have on transport behaviour change?
Research Gap: How could historic information be provided for drivers?
The EcoTeams approach can be considered as the leading alternative to pro-environmental communications campaigns. It can be characterised as the inverse of the mass media campaign: it is small-scale, face to face, local, group-based and open-ended. In essence, it involves groups of householders coming together to discuss their resource use, and make changes to their behaviour which they monitor together. In total 3,602 UK households participated in EcoTeams from 2000 to 2008 (Nye and Burgess, 2008). The EcoTeams method has been subject to critical evaluation in a number of countries and shown to produce significant resource savings, which are sustained over time (GAP, 2008).
5/02/10 26 University of the West of England, Bristol

Behavioural Inception Report Final Version 1.0
There is a degree of consensus among many evaluations of EcoTeams over the factors contributing to their success. In most instances, the aspects of the programme which have been found most effective can be fitted into De Young’s three-part classification of the elements in successful programmes leading to sustained pro-environmental change (DeYoung, 1996; Staats et al., 2004; Hobson, 2001, cited in Avineri and Goodwin, 2009), all three of them are transferable to the design of information systems to induce behavioural change:
• a key to successful interventions is their focus on practical information and tacit know-how, rather than conceptual information;• providing personal feedback though a main activity of ongoing measuring and monitoring. The act of measuring resource flows in turn makes invisible consumption visible, and allows participants to expose it to conscious scrutiny.• supportive social element: making of plans in front of others has a pledge component which is seen as psychologically meaningful.
Research Gap: How could a transport-specific “EcoTeam” be established and be well attended? Ie what would the necessary motivations be to increase involvement?
4.2 Information and TransportationIndividuals provided with travel information can theoretically make more fully informed choices which will be to their personal advantage and potentially that of the transport system as a whole. However, “Our expectations with respects to the effects of information provision on travel choices in general may be mildly optimistic, particularly for behaviour adaption not involving changes in mode choice” (Chorus et al., 2006) . When information is consulted the result is commonly no change to travel outcome (though there may be changes to state of mind). In their review of the evidence, Lyons et al. (2007) observed that in many contexts there is little influence of information on travel choice. The limited effect travel information systems have on changing behaviour could be explained by:
1) Many travel information systems were not designed from the first place to change travellers’ behaviour, but to provide them with a service;
2) Many traveller information systems are based on a naïve model of the user as a utility maximizer who, through a cognitive process, compares alternatives by their attribute, but they do not take into account limited cognitive abilities, systematic biases in processing information, and context dependency. Our expectations with respects to the effects of information provision on travel choices made by road users are largely based on rational man theory and therefore are unrealistic;
3) Although information tools exist for transportation, awareness levels and use level are low. Most people, most of the time, do not consult travel information (see Lyons et al., 2007).
Research Gap: How could existing information systems be retro-fitted/improved to encourage behaviour change?
Research Gap: How to create motivation to seek sites that encourage behaviour change? This may involve improving the perception of other modes (vs. Private cars) or creating greater uncertainty in car-use.
Changes in travel behaviour were more likely to occur when there is flexibility in the arrival time (Chorus et al., 2006). However, if the individual changes as a result of information provided, and that information is found to be unreliable, that will result in the user losing trust
5/02/10 27 University of the West of England, Bristol

Behavioural Inception Report Final Version 1.0
in the source and they will unlikely use it again. Further with the importance of reliability, post-trip information is considered reliable and comparison of routes can lead to changes.
Research Gap: What are the best practices for improving reliability of the information on non-car mode use?
While societal awareness of environmental aspects of travel behaviour exists (i.e., the need to reduce carbon emissions), feedbacks to personal responsibilities are largely lacking. As seen in household energy-use studies (Darby, 2006; Brandon and Lewis, 1999; Hutton et al., 1986; McCalley and Midden, 2002; McClelland and Cook, 1980; Staats et al., 2004), direct feedback is likely a key tool in energy reduction and behaviour change. If individuals are unable to equate current actions with consequences, then changes may be less significant (e.g. the effect of direct feedback versus monthly bills). On-board tools could be required on vehicles that, like speedometers, give feedback to the driver on their travel behaviour. Additional functions in these tools could create behavioural change. One example would be a judgement reading such as glowing red when driving in an inefficient manner. Modern vehicles such as hybrids do allow users to monitor fuel efficiency, but the addition of a judgement feedback may increase awareness. Toledo et al. (2008) found that providing drivers with feedback on dangerous driving behaviour reduced the likelihood of crashes. The drivers all worked at one company, were non-professional drivers, and were unaware of the data-recording devices when the information was gathered. However, one could argue that once the drivers were made aware that their driving patterns were being recorded that they adjusted their driving.
Research Gap: How could such a tool be best marketed for voluntary uptake?
Tools such as carbon calculators or trip planners (see Chapter 9) can work to give feedback to individuals about their personal CO2 production. The difficulty here is getting drivers to use these tools, understand their results, and being open to receiving personalised advice on how to change.Feedback is used to improve the knowledge of an individual and help create a connection between an action (e.g. car use) and cost (e.g. GHG production) which facilitates learning. Depending on the goal of the individual, different types of feedback will be appropriate. For example, if an individual is concerned about monetary costs, then the monetary impacts of an action may be appropriate (however, if the costs are perceived to be low, it could increase use). On the other hand, if an individual is altruistic, than the impact on others would be important.
Individual level information can be both feedforward information (e.g. route information) and feedback information (e.g. results of an action). Travel behaviour programs exist that use feedforward and/or feedback information such as individualised marketing (Brög and Erl, 2008) and travel blending (Rose and Ampt, 2001). The individualised marketing technique provides feedforward information to help individuals reduce their car use through provision of relevant route information and discussing concerns related to alternative mode use. The travel blending program gives individuals feedback on their car use and GHG production along with feedforward information.
Information is best used in combination with other psychological techniques. Travel feedback programs in Japan were found to be most successful when a combination of psychological techniques were used that included motivational support, customized information, and a request to form a plan (Gärling and Fujii, 2009).
How the information is presented can also impact its influence. Chorus et al. (2006) found in their review that visual, graphical information should be used and that electronic sources
5/02/10 28 University of the West of England, Bristol
Behavioural Inception Report Final Version 1.0
were considered to be more accurate than paper ones. However, considering Campbell and Lyons (2007) work, that may be related to sex and age, where most men prefer visual and younger people prefer electronic sources. Tan (2009) suggested that computers and the Internet were good persuasion tools as they could: reduce, persuading through simplifying; tunnelling, guided persuasion; tailor, persuasion through customization; suggest: intervening at the right time; self-monitor, taking the tedium out of tracking; survey, persuasion through observation; and condition, reinforcing target behaviours.
4.3 The Effect of Information on Behavioural ChangeInformation can affect attitudes and awareness of an individual (Gärling and Fujii, 2009; Darby, 2006; Abrahamse et al., 2005), but that does not equate to behaviour change. A number of (psychological and physical) barriers must be overcome with respect to intention and finally behaviour or action.
Building on theories such as the Theory of Planned Behaviour (Ajzen, 1991) and related ones, a considerable amount of research has been done in the field of transport, psychology, and other fields. In Appendix A the influences, target, and results of a number of projects are shown. One reoccurring theme relates to pro-social values (rather than pro-self) increasing support, intention, and use of public transport. It was also found that how an individual perceives society to view a particular behaviour can affect their own personal norm. Other points were that the potential to break the habit, or default use of, car use exists through projects that create satisfactory use of public transport. Unsatisfactory, or unpleasant, use such as delays in departure or arrival or excessive crowding may reinforce negative views of public transport. Satisfactory use may vary among individuals, but it likely relates to ease-of-use (e.g. information, payment methods) and reliability (i.e. on-time).
Research Gap: What are the best methods to break habits?
In Germany, a study by Hunecke et al. (2007) found that psychological factors explained more of the ecological impact of an individual’s travel than socio-demographic or infrastructure variables. However, it may be that in Germany where considerable mixed land-use exists, structural barriers are less significant. Swim et al. (2009) summarized findings that psychological factors explained more when structural barriers were small, but had less effect when structural barriers were considerable.
Research Gap: What are the thresholds for structural and psychological factors? At what point is one more important than the other in what context?
5/02/10 29 University of the West of England, Bristol
Attitude
Intention
Behaviour
Subjective Norms
Perceived Behavioural Control
Behaviour desire
Perceived Availability
Anticipated Emotional Impacts
Experience
Level of Knowledge
Awareness
Figure 4-2 Psychological Impacts of Behaviour based on the Theory of Planned Behaviour (Ajzen, 1991) and research reviewed (Appendix A).
Behavioural Inception Report Final Version 1.0
Behaviour change can occur through “hard” (e.g. road network, mass transit level-of-service, etc.) or “soft” (e.g. knowledge, perceptions, attitudes) adjustments. In travel behaviour, programs such as “Voluntary Travel Behaviour Change (VTBC)” and “Switching to Public Transport” have used techniques developed by Individualised Marketing (IndiMark®) (Brog and Erl, 2008). “Individualised Marketing” looks at both objective (e.g. hard measures) and subjective (e.g. soft measures) constraints on individuals and develops personalized information to address barriers such as knowledge of alternatives, perceptions of alternatives, and other factors not directly connected to the built environment. These projects have been successful in Europe, North America, and Australia to reduce car use and increase use of environmentally friendly modes (e.g. walking, cycling, public transit) among individuals willing to consider alternative travel. Although these programs are admirable and successful, they are labour-intensive and aspects could be incorporated into Internet transport sites. The problem then would be motivate people to use them as mentioned before.Gärling and Fujii (2009) show “a process model of the effects of individualized communication on travel behavioural modification” that builds on the theory of planned behaviour (Ajzen, 1991), value-belief-norm theory (Stern, 2000), the theory of implementation intention (Gollwitzer, 1993) and the process mode of acquisition of script-based choice (Gärling et al., 2001). The model suggests that individualised communication can impact attitudes, perceived behavioural control, subjective norm, and moral obligation which are all theorized to affect behavioural intention. Communication is shown to also relate to behavioural intention and implementation intention.
Gärling and Fujii (2009) showed that those factors can be impacted by communication. Attitudes can be improved by relaying positive aspects of behaviour change (e.g. reducing costs, crash risk). As will be discussed later, it may be more effective to present those differences as avoiding losses rather than gains. However, that too may relate to factors such as pro-self or pro-social. Perceived behavioural control can be improved through feedforward information on routes to work, shopping, or other activities. Subjective norm can be improved through providing information on the number of people who desire a similar behaviour or (if relevant) the growing number of people who are changing. Norms can be affected by information on negative aspects of car use (e.g. GHG production, crashes, fatalities, taxes).To identify the state that individuals are at, with respect to structural and psychological barriers segmentation can be used (see Appendix D). It should not be assumed or taken for granted the attitudes, values, and beliefs that individuals hold. The population will not be uniform and different groups will require different tools to move them towards desirable travel choices. Further, depending on the city and the infrastructure, different physical barriers may exist.
Key Point: The population will not be uniform and different groups will require different tools to move them towards desirable travel choices.
4.4 Stages of ChangeBuilding the points that people are different, not only will their motivations be different, their openness to different information such as awareness raising or suggested changes will differ. The “Stages of Change” model that has been developed in a public health context (Prochaska and Norcross, 2001) has been applied to transport by the EC commissioned project TAPESTRY (Tyler and Cook, 2004) and MAX-SUCCESS (2009). The health field’s model is a transtheoretical model with over 100 empirical studies (Prochaska and Norcross, 2001) with six key stages. TAPESTRY’s model sequence has one key difference: the acceptance on the transport side of personal responsibility. MAX-SUCCESS’s model, MAX-SEM more closely follows the health model and is focused on reducing car use. The models
5/02/10 30 University of the West of England, Bristol
Behavioural Inception Report Final Version 1.0
developed for the transport field will likely help cities identify starting points and to use the appropriate tools to move towards desirable change.
The three models with their respective titles are given below (Table 4-1). MAX-SEM closely follows the health field model, though it combines “preparation” and “action” stages and eliminates the “terminates” stage. MAX-SEM also overlays the stages with transition stages: goal intention, behavioural intention, and implementation intention.
Table 4-1 Examples of stages of change models
Health Field MAX-SEM’s application
Description TAPESTRY Description
Pre-contemplation
No intention to change. Unaware of problems.
Awareness of problem
Is the problem known to the individual?
Moving towards goal intention
Aware of problem. Accepting responsibility
Do they realize their own role in it?
Contemplation Moving towards behavioural intention
Aware of problem, no commitment to act.
Perception of options
This is related to perceived behaviour control and social influence.
Evaluation of options Investigating the choices they have (or are prepared to consider).
Evaluation of options
Investigating the choices they have (or are prepared to consider).
Preparation Moving towards implementation intention
Intention and behavioural criteria
Making a choice Deciding and committing to a change.
Action Experimental behaviour
Modify behaviour, experiences, environment in order to overcome problems.
Experimental behaviour
Trying out the change.
Maintenance Establishing a habit Work to prevent relapse.
Termination Habitual behaviour Don’t have to work to prevent relapse.
Habitual behaviour Long-term adoption of the behaviour change.
In a review of health research, Prochaska and Norcross (2001) highlight two key points where practitioners fail: trying to modify behaviours through awareness; and focusing on the action stages. The first point relates to trying to jump from becoming aware of the problems straight to a behaviour change, skipping the contemplation (aware of problem, but no intention to act) and preparation (have the intention to act) stages, and to some extent the action stage where the individuals behaviour or situation is changed. The second point about focusing on the action stages is the other side of the ladder. In those cases, the practitioner is trying to skip the problem awareness stage and the stages mentioned leading up to action.
Prochaska and Norcross (2001) also mention how a stage can be determined. Precontemplation is when the individual is not considering any change in the next six months. Contemplation is considering taking an action in the next six months. Preparation is planning to take action in the next month and have not taken action in the last year. The Action stage is when some change has occurred and endured from one day to six months. At
5/02/10 31 University of the West of England, Bristol
Behavioural Inception Report Final Version 1.0
the Maintenance stage, an individual is making actions, but must continually strive not to relapse into the previous behaviour. Termination is when the individual has established that behaviour as the habit and is not fighting a relapse.
In research related to quitting smoking, Douglas (1998) argues that the use of hazard models that consider the duration of habit is important in considering the potential to quit. He argues that measurements without that consideration will result in predictive models of behaviour change having lower explanatory power. It may be important to consider how long an individual has been driving regularly when assessing their likelihood of change.
Research Gap: Does the length of time driving affect the likelihood of success for the transport intervention programs?
Related to those identifying characteristics of stages of change, the stage that individuals, and perhaps larger groups such as neighbourhoods, cities, or nations are at can be identified for transport. Problems such as congestion may enjoy high awareness as it can easily be visually observed. Unfortunately, climate change does not enjoy the same amount of salience and many people are likely unaware, or do not accept that action on their part is required. This is related to accepting responsibility. Moving forward, individuals may be both aware and accept that they should change, but structural and psychological barriers such as perceived reliability may remain and resist or prevent certain changes.
In the health field, a therapist deals with patients, but in a city, it will likely be city employees such as planners who help facilitate change. In the health field, at the precontemplation stage the therapist acts like “a nurturing parent joining with a resistant and defensive youngster who is both drawn to and repelled by the prospects of becoming more independent.” For transport, carefully tailored information campaigns will be necessary at this stage. At the contemplation stage, the therapist is described as encouraging self insight. In transport projects such as Voluntary Travel Behavior Change (Brog and Erl, 2008) a transport professional assesses the barriers to that individual and helps them overcome them. That stage in transport is also linked to the preparation stage, where a therapist would act like an experienced coach, helping to guide the individual with the appropriate training and skills. After that point, the therapist acts as an expert on actions to encourage desirable change and prevent relapse.
Transport changes may be more difficult than smoking behaviour because of factors that include societal acceptance of excessive driving behaviour, the investment in housing location and car ownership, and the possible structural barriers that make changes difficult. Although a quick change to major behaviour changes may not be possible, there are tools and actions as will be shown in this report and related material to move individuals and populations towards the goal of sustainable travel. There exists the potential for projects such as CATCH to establish information for transport behaviour change that is appropriate for different stages of change.
Research Gap: Considering that goal setting was found to be important for household energy use, what are appropriate goals for people at different stages of change for transport? E.g. a highly motivated person may be willing to change household location, but someone at a lower stage may only be willing to make very small adjustments such as maintaining air pressure in their vehicles tires.
Considering the information discusses above, practitioners should identify the different types of travellers that exist in their target population. They should investigate usage, what stage of change the individual is at, and psychological factors such as world view. Knowing this will allow them to apply appropriate information that relates to the individual in a number of ways. A content driver may need information to increase their awareness on CO2 problems or that their choice may not as good as thought (increasing uncertainty). However, a discontented
5/02/10 32 University of the West of England, Bristol
Behavioural Inception Report Final Version 1.0
driver may already be looking for other options. Depending on the motivating factors (stress, environmental concerns, costs) information related to that could be provided with consideration to pro-self or pro-social tendencies and sex (visual for men or social communication for women).
4.5 SummaryHousehold energy use reduction research found that direct feedback is effective and can benefit from other techniques such as public, self-imposed commitments to change. The feedback helps the individual understand the links between their actions and results. Commitments to change help move them from contemplation to planned goals. Although people may understand the connection between transport and climate change, the disconnection between individual current actions and CO2 production needs to be addressed. The CATCH project could assist with this by increasing the ability of individuals to understand CO2 through better presentation.Theories on behaviour and research done in transport suggest that individual characteristics such as pro-social are important with respect to public transit. Further, personal attitudes were shown to be important when structural barriers are low. Those personal norms can be influenced by societal norms. Research also found that it is possible to break car habit use as well. The CATCH project could keep a record of research done in such fields and their results. Summarizing them and highlighting the most effective (for different situations) so that city stakeholders can easily access such information should increase their use.Stages of change research suggest that to facilitate change it is beneficial to identify an individual’s current stage so that appropriate information is provided. Cities and businesses will need to identify the stages of their target subjects so that appropriate information is produced.The MAX-SUCCESS project developed a “stages of change” questionnaire for individuals which could be utilized by city stakeholders to identify their targets’ stages. The CATCH project could develop an analysis tool that would identify a city’s stage of change with respect to sustainable travel. Such a tool could help city stakeholders identify key barriers to address, but also stimulate friendly competition if cities were publicly compared.
5/02/10 33 University of the West of England, Bristol

Behavioural Inception Report Final Version 1.0
5 Barriers IdentifiedFrom the reviews in the previous changes, the following barriers to behavioural change have been identified:
• Awareness of problemo The path to desirable behaviour is unknown. It is suggested that it begins
with genuine ignorance to the problem, through increasing awareness, to intention to act, which can be facilitated or hampered by a number of other factors such as social expectations.
• Unsure of factso Uncertainty in the message about climate change can negatively affect
whether people accept it or not. The use of “level-of-confidence” phrases in the International Panel on Climate Change (IPCC) such as “likely” led to underestimation of the risk (Budescu et al., 2009 in Swim et al., 2009). There is an conflict here between the scientific community’s requirements and how non-scientists interpret information.
o Certain organized interests aim to create mistrust in the message presented by scientists or government officials on climate change. Trust is important for behaviour change that requires a cost.
o Stemming from uncertainty and mistrust, denial is a further barrier to behaviour change. The Swim et al. report (2009) for the American Psychological Association describes an example of the emotional intensity experience by some deniers.
o Research Gap: what are the emotional elements of deniers? What are the reasons for denial?
• Unsure of what to doo Ignorance can play a role here as well. Once a person is aware of the
problem, they may not know what appropriate action they should take. What is effective? What is most effective with respect to barriers such as costs or effort?
• Don’t think the problem affects themo Climate change may be seen as important, but people may think that it
affects others, and rank it in importance with foreign aid. Judging by that, it could be interpreted that people see action to mitigate climate change is honourable, but not necessary. One study in the USA found that although 75-80% of respondents thought it important, they ranked it last in comparison to other issues.
• Behavioural inertia• Think that others should change• Think that their actions are inconsequential• Societal expectations (e.g. home/car ownership, what a “good life” is)
5/02/10 34 University of the West of England, Bristol

Behavioural Inception Report Final Version 1.0
• Experience with modeso A person may never have experienced a mode, which can inhibit their use.
With respect to public transit, lack of experience should not be underrated. A person without experience may be wary of any number of factors including cost, security, comfort, and ignorance of routes.
• Habito “One of the most important obstacles” (Swim et al., 2009) is hard and slow
to change. Likely require a substantial push, priming, and attitude change. o Some researchers have used temporary structural changes (e.g. removing
the cost by providing free tickets) along with a commitment to use public transit to overcome this barrier. Gärling and Fujii (2009) summarize that it can be particularly useful in breaking habitual car use where users had little to previous experience with public transit.
• Perceived Behavioural Controlo Whether a person feels they can act differently. o How can perceived behavioural control be increased?
• Perceived risks from changeo Functional risks (e.g. whether adaption will work), physical risks (e.g. danger
involved), financial risks (e.g. do benefits outweigh costs), social risks (e.g. damage to one’s ego or reputation), psychological risks (e.g. getting teased or criticised), and lost time risks (e.g. the time spent trying to mitigate may be wasted).
o The risk to the economy is often used as justification to put off restrictions on CO2 production. It may be necessary to change the perception from risk of costs to opportunity for economic stimulation in new industries.
o How can the perception of climate change risks to change be reduced?
Tokenism o Individuals may engage in activities they perceive to be mitigating the
problem, but are not (e.g. recycling is not really related to global warming).
Rebound effecto If an individual reduces their financial expenditures on daily travel, they may
increase air travel (which may be worse).
Social comparison, norms, conformity, and perceived equityo People compare their actions to others and develop descriptive and
subjective norms which indicate to them what “appropriate” behaviour is. Peer norms are a strong influence.
o When any sort of (perceived) inequality or inequity exists, the desire to cooperate diminishes.
• Belief in solutions outside of human control
5/02/10 35 University of the West of England, Bristol

Behavioural Inception Report Final Version 1.0
o Belief that a religious power will do as they wish and that humans have no control over that.
5.1 Further Questions Which techniques are most effective for each barrier? What contributes to major decisions such as household location, vehicle purchase
(don’t/reduced environmental damage/increased environmental damage)?
5.2 SummaryMany of the psychological barriers related to climate change and travel behaviour were listed in this chapter. The CATCH project could collect and highlight research that addresses those different problems so that city stakeholders can address and overcome them.
5/02/10 36 University of the West of England, Bristol
Behavioural Inception Report Final Version 1.0
6 Inducing Behaviour Change: Evidence from Behavioural Sciences
Apart from forced changes (e.g. availability, laws restricting), an individual’s travel behaviour may change as a result of changes to their beliefs, attitudes, and/or values (Fishbein and Ajzen, 1975). A forced change may result in changes to an individual’s beliefs and attitudes, but whether those are positive or negative changes likely depends on the outcome of the forced change (Gärling and Fujii, 2006).Information can be used in a number of different ways. A number of tools exist within psychology to address barriers which use information and other techniques that affect different stages of change. A good planning site that helps individuals build projects that use these concepts is the Tools of Change site (www.toolsofchange.com; available in French and English). Those concepts are highlighted next.This chapter introduces these concepts. The following chapter, Chapter 7, will go further in discussing a number of key points. The summary chapter, Chapter 10, will suggest how these could be applied to transport.
6.1 CommitmentCommitment is appropriate when an individual is already at the stage where they have the intention to do an action, but are not performing (or infrequently) that action (e.g. contemplation). Depending on the individual’s level of knowledge on possible actions, prescriptive or descriptive information may be used. Prescriptive information is a recommendation, but the individuals should still choose their option. When applying commitment, a few key points should be followed to improve the likelihood of the desired action occurring:
1) Public (group/visible) over private commitmentsPublic commitments are stronger than private ones because people want to appear to be consistent (Caldini, 2001).
2) Written over verbal commitmentsStudies (Abrahamse, 2005) have shown that written is more effective than verbal. Again, this may relate to a person wanting to be consistent.
3) Group commitments over individual Social support such as seen in EcoTeams projects are effective through a number of mechanisms including social support, feedback, and motivation.
4) Start with small, innocuous requests/commitmentsThis can affect how a person views themselves. A second, larger request does not need to follow soon afterwards, nor does it need to be the same person (McKenzie-Mohr, 2009).
5) Don’t use coercionThis relates to how the person views themselves. If they voluntarily make the commitment it relates to consistency.
5/02/10 37 University of the West of England, Bristol
Behavioural Inception Report Final Version 1.0
6) Involve the individualThe person must feel that they are engaged, that it is representative of how they consistently behave. They should not feel that they have been force or tricked into agreeing.
6.2 PromptsThis tool is beneficial when an individual has the intention to do an action, but is not actually performing that action. The individual should be past the contemplation stage. A prompt is a visual reminder to do an action. It should be located so that an individual is aware of it as close in time and space as possible to when and where the action occurs. It should also be self-explanatory and encourage people to engage in positive behaviours rather than restricting (e.g. encourage an individual to buy fair-trade coffee with a visual cue rather than “don’t buy coffee”).An example in transportation is a seal affixed to the windshield to prompt drivers to not idle. If the individual is aware of the problem of idling, and has reached the stage that they are willing to not idle, the sticker acts as reminder to turn their car off. If designed properly, it can also act as a public indication that the driver is someone who doesn’t idle (commitment), invoking the driver’s tendency to behave consistently.
6.3 NormsIt is important to create a sense that a behaviour is “normal”, that other individuals behave likewise. This tool can work on the levels of attitudes and intention.Norms work through conformity and compliance. In compliance, an individual will do something to receive a reward or avoid punishment (incentives). Once that reward or punishment is removed, the behaviour will likely return to the original state. Conformity works through observation of how others behave and can have long-lasting effects.A norm activity must be as visible as possible. Using positive, appropriate advertising can work. Opinion leaders, especially likeable ones, can be used to further influence individuals. The norm needs to be internalized by the individual, for them to feel that the action is how they behave, regardless of others.Examples include a popular leader stating “it is positive-statement to see a growing number of people do such-and-such activity.” This involves three of the “weapons of influence” (Caldini, 2001; discussed in section 6.7): authority, liking, and social proof.Experts and individuals of high social status who give a clear and consistent case with respect to CO2 reductions would aid in changing behaviours (through minority influence). Climate change is new, scary, and abstract. Generally people are unclear about what terms mean and the urgency of the matter (Coulter et al., 2008). In such a situation, they turn to experts for information and need clear, prescriptive guidance. This information should be available and regularly relayed on popular mediums such as radio, television, newspapers, and the Internet. The Internet is particularly useful due to its interactive nature, ability to produce personalised information, present it in different forms (visually or auditory), and compare it to peers and ideals.Although it would be best if individuals voluntarily displayed information related to CO2
publically, laws may be necessary for transport. If a public display of a person’s driving patterns and the production of CO2 were required, social pressure should lead individuals to strive to social ideals. Further on this point would be the development of the tool to provide that information.
5/02/10 38 University of the West of England, Bristol

Behavioural Inception Report Final Version 1.0
6.4 MotivationThe individual may need to see the behaviour as consistent with how they behave. This can improve both attitude and intention. Depending on the individual and their stage of change, motivations to change could be related to stress, environmental concerns, costs, reducing the dangers of driving to others, improving their local area, or any number of factors. Providing motivation can be through linking current activities that an individual does with the desired behaviour, recognizing and praising such activities, and provide opportunities to progress further. It will also involve relating the behaviour to what the individual feels is important (e.g. finances, personal advancement, social harmony, environmentally beneficial behaviour, etc.). Linking the behaviour to a local “hot topic” (e.g. taxes, congestion, parking, crashes, etc.) can also improve motivation. This may be easier to identify than individual motivations, as aggregate information will likely be sufficient. Through research techniques such as focus groups cities can investigate the concerns of their citizens and then follow up with a survey of a representative sample to determine how pervasive the different concerns are.
6.5 FeedbackFeedback is an important tool to create awareness and motivation. It can assist individuals who have the intention to perform an action by giving information on progress.Feedback works best if it is specific to the individual and direct (McKenzie-Mohr, 2009; Abrahamse, 2005; Darby, 2006). It should be combined with a “judgement” so that the person understands the information with respect to desirable behaviour. This is likely especially true for a new and abstract concept like CO2.An example in household energy use are OWLs which monitor and give real time information. That information in combination with a “judgement” on usage can create awareness of the problem to an individual and allow them to actively monitor progress towards a goal.In one experiment, feedback was only in the form of a “judgement” and found to be effective (Thompson, 2007). In this experiment, individuals received an orb that would glow red if energy use was above a pre-set threshold. This feedback created awareness of the problem and acted as a prompt to reduce use.An appropriate tool in this case may be a feedback to car drivers. Due to the abstract nature of CO2 and the limited financial impact, it may be most appropriate to provide feedback on total costs of use (direct and indirect), with some other message to stimulate awareness of the problem, uncertainty in their mode choice, cognitive dissonance, motivation, and ease of change.As seen in household energy-use studies (Darby, 2006; Brandon and Lewis, 1999; Hutton et al., 1986; McCalley and Midden, 2002; McClelland and Cook, 1980; Staats et al., 2004), direct feedback is likely a key tool in energy reduction and behaviour tool. If individuals are unable to equate current actions with consequences, then changes may be less significant (e.g. the effect of direct feedback versus monthly bills). On-board tools could be required on vehicles that, like speedometers, give feedback to the driver on their behaviour (Toledo et al., 2008). Additional functions in these tools, such as judgements that would indicate undesirable behaviour (e.g. the tool glowing amber to red), could act as easy-to-understand guidance (Thomson, 2007). Societal awareness of the problem exists, but feedbacks to personal responsibilities are lacking (Coulter et al., 2008).
6.6 IncentivesIncentives are tools to encourage change, but can lose their affect when removed. If a change is caused by monetary incentives/disincentives, it will likely not create long-term
5/02/10 39 University of the West of England, Bristol
Behavioural Inception Report Final Version 1.0
changes that would continue if the intervention was removed (Gärling and Fujii, 2009). In one experiment, economic disincentives were found to have minimal effect, but that planning to reduce car use was more effective (Jakobsson et al., 2002).However, people operate in two norm worlds: the market and the social (Ariely, 2008). Putting Ariely’s concept simply, people behave within a market norms world according to financial incentives/disincentives, but people behave within a social norms world in more altruistic ways. His experiments suggest that using social norms is just as powerful as strong market norm incentives in getting people to perform actions. Another concern that he raises is that using monetary disincentives may make the actions “acceptable”, as long as one is willing to pay.Monetary changes affect an individual’s choice by changing the relative costs of using different modes. However, there are a number of factors that affect the results including a person’s sensitivity to costs and their ability to change (e.g. are there options). They can be either push or pull measures.
6.7 Caldini’s “Weapons of Influence”Related to the techniques mentioned above are Caldini’s (2001) “weapons of influence”. His concepts are only briefly mentioned here, highlighting the key aspects of each:
6.7.1 ReciprocationThe concept of reciprocation is that people will tend to return a favour they have received. There a couple of key points about the concept: tendency to reciprocate outweighs the like/dislike influence (see below); the favour does not need to be the same (e.g. receive a flower, give financial donation); the returned favour can be larger than the received one (e.g. receive food sample, purchase package of it); people are influenced by this despite claims that they are not (e.g. people do not want to be considered a free rider/moocher); making concessions with requests (starting larger than necessary).
6.7.2 Commitment and Consistency (Commitment)People want to appear to be consistent, which relates to following through with a commitment. There are a couple of key reasons here: society values consistency in character; by continuing along a consistent path, individuals can reduce the cognitive load required to consider all variables.Commitments should start small, something easily done such as signing ones name to a petition. Once that initial act is done, the person then views themselves as someone who believes or acts in a certain way. Requests for greater favours that are consistent with the first action will more likely be accepted, so as to at least appear to be consistent. Commitments that are active, public, effortful, and uncoerced (i.e. the individual believes that they have committed through their own free will) are more likely to succeed. Once set upon that path, people will justify to themselves further actions, even if erroneous.
6.7.3 Social Proof (Norms)People will tend to act as those around them do. If the people complying with a certain act are not visible, mentioning the number (the larger, the more effective) of people who act in such a way can increase compliance. This influence is most effective when there is uncertainty and when the “others” are considered by the individual to be “people like them”. Considering what others do could be considered a shortcut of information gathering. If many others are doing an action, then the
5/02/10 40 University of the West of England, Bristol

Behavioural Inception Report Final Version 1.0
assumption is that it must be the correct (or at least accepted) action. If people that one associates oneself with (or wishes to) are doing a particular action, then they will likely be influenced by that.
6.7.4 AuthorityPeople tend to obey persons of authority. Obeying an authority is a societal expectation of correct behaviour. It could also be considered a cognitive shortcut, as following an authority is to accept their word as true without having to do the mental effort oneself. The authority is considered to have knowledge and wisdom, and therefore should be trusted.Symbols can trigger authority influences. This can be any number of things within a society such as a title, clothing (e.g. well-dressed, uniform), and even automobiles.
6.7.5 LikingPeople are more easily persuaded by those they like. Making “likeable” traits apparent to individuals will increase the likelihood they will comply with a request. Those traits can be physical attractiveness, similarity, flattery (praise), talent, kindness, and intelligence. Despite ourselves, physical attractiveness may be the most important trait. Flattery itself can backfire if obviously insincere. The more someone is familiar, through repeated positive contact, the more influential they will be. Mutual and successful cooperation, such as working together to overcome a problem, will increase a sense of comradeship. If a person is associated with positive (popular) things, that can increase how likeable they are. Conversely, distancing oneself from negative things is important.
6.7.6 ScarcityA sense of scarcity (limited time, resource, etc.) will increase demand. This influence works because of two main reasons: things that are difficult to obtain are typically more valuable; avoiding the loss of freedom (of choice). An interesting finding relates to information. Information that has limited access is more highly valued and will receive more positive reactions. Something that is newly scarce will increase the effect. Further, if individuals are competing against each other, that will drive up its value (e.g. supply and demand principles).
6.7.7 Decision ShortcutsDue to increased pressures of time and possibly information overloading, people will rely on heuristics and other mechanisms to take decision shortcuts. As cognitive overloading continues (or increases) people will increasingly rely on those shortcuts to reduce cognitive effort.
6.8 Other ConceptsAlong with tools that will assist with change, there are a number of theories that relate and are mentioned here:
Social network and innovation-diffusion theories How ideas and actions spread (e.g. Rogers, 2003) Model processes of change in habits (Hobson, 2003; Maio et al., 2007) Transformational and incremental changes (Darnton, 2008)
5/02/10 41 University of the West of England, Bristol
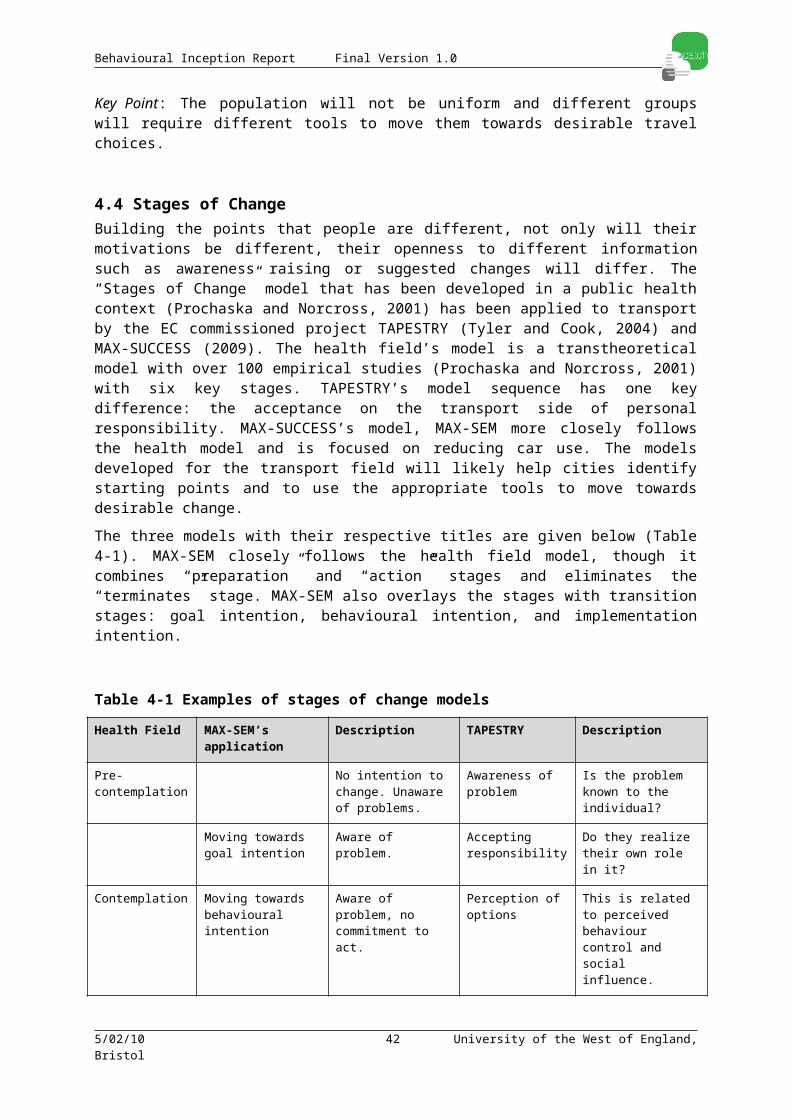
Behavioural Inception Report Final Version 1.0
6.9 SummaryEvidence from behaviour sciences that relate to behaviour change were examined in this chapter. The techniques were:
commitment (a public commitment to an action will be most effective),
prompts (a reminder as close as possible in time and space to when the action to be addressed occurs),
norms (establishing that a desirable behaviour is common),
motivation (using the appropriate stimulus for an individual to do the desired behaviour),
feedback (using feedback as close to when an action occurs with information relevant to the individual on desirable or undesirable behaviour), and
incentives (a tricky tool that may create short-term change without long-term ones).
As well, factors that influence people to behave in desired ways was also reviewed. These include reciprocation, commitment and consistency, social proof, authority, liking, and scarcity. Most of these relate to decision shortcuts that allow a person to reduce the cognitive load when making decisions.
In the final chapter, Chapter 10, illustrative examples of how these concepts could be applied in transport are provided.
5/02/10 42 University of the West of England, Bristol
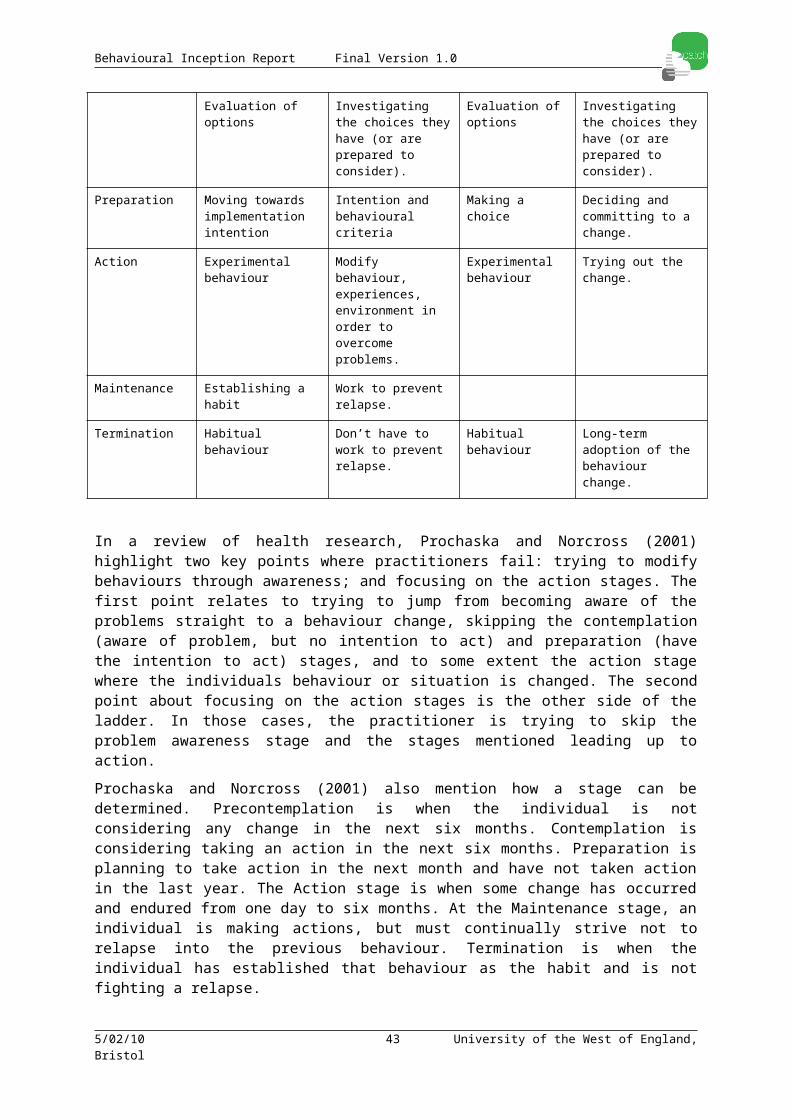
Behavioural Inception Report Final Version 1.0
7 Lessons from Behavioural Economics: The Application of ‘Choice Architecture’ in the Design of Behavioural Change Interventions
The design of travel information systems can generally be traced back to neoclassical economics and the paradigm of rational man; it is generally assumed that individuals, through choice-making, try to (and rather successfully) maximise their benefits and minimize their costs. Research in behavioural sciences indicates that individuals' choices in a wide range of contexts deviate from the predictions of rational models of economic theory. Some of these deviations are systematic, consistent, robust and largely predictable. Evidence on systematic deviations from rational models have emerged from studies on financial behaviour, consumer behaviour, health behaviour and more recently – travel behaviour . Behavioural economics is an emerging body of work seeking to understand behaviour by incorporating insights from behavioural sciences into economics. The approach differs from conventional economics mainly by giving more weight to what are sometimes called ‘irrational’ motives and behaviours.
Dawney and Shah (2005) suggest that the main characteristics of behavioural economics are shown in seven principles, namely:
• People’s behaviour is influenced by the behaviour of others;• Habits exist, and are important;• Motivations include a wish to ‘do the right thing’, in terms of social norms and expectations;• People have an image and expectations of themselves, and this influences how they behave;• Losses are treated more seriously than equivalent gains, i.e. there is loss-aversion;• People are bad at the formal, consistent, simultaneous computation of costs and benefits of many different alternatives and choices are highly influenced by the context of information, not just its content; • Changing behaviour is more likely to happen if people feel involved and effective.
The robustness of the findings from behavioural economics led to a growing recognition that the model of ‘unbounded’ rationality is of limited value as a predictor of human behaviour in complex social situations. Moreover, the “predicted irrationality” (Ariely, 2008) of individuals could (and some argue should) play a role in the design of behavioural change interventions. Brain scientists and cognitive psychologists have discovered that the brain functions as if it had two systems of decision making. One is very fast and automatic, while the other one is reflective system. In their recently published book Thaler and Sunstein (2008) advocate ‘choice architecture’, and the design of nudges, small features designed in the environment of choice making, policy makers can devise interventions that help the automatic system make better decisions, so the reflective system doesn't have to do so much work. Nudges can help individuals to overcome cognitive biases, to highlight the better choices for them, and to increase the effect of behavioural change - without restricting choices. They may also be less controversial and cheaper than larger scale interventions of the sort discussed above. Recently, mainly in the US but in some scale at the UK as well, ‘libertarian paternalism’ policies were shaped by the principles of 'nudges' that encourage citizens to act in a way that achieves benefits for themselves and for their fellow citizens.
In transport research, recent empirical studies provide evidence that in real life the behaviour of travellers is typified by limited cognitive resources and bounded rationality (Avineri and
5/02/10 43 University of the West of England, Bristol
Behavioural Inception Report Final Version 1.0
Prashker, 2003, 2004, 2006). Some of these deviations from the predictions of rational models are systematic, consistent, robust and largely predicted: they are not accounted for by the incorporation of a random variation in ‘tastes’ which cancels out at an aggregate level. Applying ‘nudges’ in the design of information systems is rather new concept; until now much of the evidence base supporting the ‘nudge’ approach is rather limited. In a recent report, Avineri and Goodwin (2009) described some examples of nudges applied to different contexts relevant to the design of travel behavioural change interventions:
7.1 The Power of DefaultsIt is often impossible for private and public institutions to avoid picking some option as the default. Well-chosen default rules are examples of helpful "choice architecture." ‘Nudges’ were successfully applied in the US to increase savings. For example, the “Save More Tomorrow” plan (Thaler and Benartzi, 2000), which allows employees to commit themselves now to increasing their savings rates later, when they get raises, has been remarkably successful. Enrolling people automatically into savings plans, while allowing them to opt out, is an example of a successful nudge (Madrian and Shea, 2001). Organ donation policies that make use of opt-in defaults are more successful than others (Thaler and Sunstein, 2008).
7.2 Framing and “Loss Aversion”People tend to feel and behave differently when information is presented (or ‘framed’) in terms of gains or losses. The emotion of loss is stronger than that of gain. Studies bring evidence that travellers exhibit aversion to loss and have a strong tendency to avoid choices associated with losses (Kahneman and Tversky, 1979). The framing of choice outcomes as gains or losses could be applied as a ‘nudge’ to encourage travellers towards a specific choice (Avineri, 2006, 2009a, 2009b) as illustrated in Appendix B.
7.3 SalienceWithout feedback, a behavioural change is less likely. Where travellers do not associate their behaviour with the relevant costs and this slows down the process of behavioural change. Many drivers have already experienced nudges; some Advanced Vehicle Control and Safety Systems (AVCSS) provide the driver with high-pitch sound alert when driving over the speed limit or when leaving a lane. This warning signal serves as a nudge to provide the driver feedback on her/his behaviour and avoid driving behaviour that leads to the sound alert. A specific challenge designers of transport systems are faced with is how to inform travellers about the environmental costs of their journeys. Carbon emissions are invisible to travellers; it is therefore difficult for them to associate their travel behaviour with environmental costs.
7.4 People are Motivated to ‘Do the Right Thing’The assumption made in classical economics that individuals act exclusively in their own self-interest, is increasingly challenged by behavioural economics. In many cases people are naturally motivated to ‘do the right thing’. People exhibit pro-environmental, pro-social, and even altruistic behaviours.
7.5 Financial (dis)Incentives Might Send the Wrong MessageThe use of financial incentives to motivate behavioural change is advocated by economists. However, recent findings from behavioural economics suggest otherwise. For example, introducing a penalty for parents who are late picking up their children from nursery
5/02/10 44 University of the West of England, Bristol
Behavioural Inception Report Final Version 1.0
increased the frequency of late arrivals (Gneezy and Rustichini, 2000). Generally, studies showed that when prices are not mentioned people apply social norms to determine their choices and effort (Heymen and Ariely, 2004). Financial incentives can crowd out feelings of civic responsibility and may actually discourage the kinds of behaviours needed to solve collective social problems such as climate change (Frey, 1997). By the same token, making ‘good’ and sustainable transport behaviour a matter for financial reward might discourage it.
7.6 Grass rootsIndividuals are influenced by ‘significant others’, people in their social networks, people who have geographical and social proximity (neighbours, work colleagues, class colleagues) and sometimes even by strangers with whom they share social identity. For example, energy bills that provide information on how energy efficient their neighbours are encouraged them to use less energy (Schultz et al., 2007).Altruistic acts are more common within smaller groups due to factors such as group identification, peer-group norms, and visibility of free-riding. Many of the behavioural insights emphasized in behavioural economics confirm the importance of self-regulatory mechanisms rather than traditional top-down command-and-control regulation. The small-scale group-based approach applied in the EcoTeams case study (see section 4.1) provided supportive social context that is accounted as one of its major success factors. Workplace and school travel plans also operate within a community which is limited in size and may encourage pro-social behaviour using ‘bottom-up’ approaches.
7.7 Should we Incorporate Nudges In the Design of Travel Behavioural Change Interventions?
Nudges can help individuals to overcome cognitive biases, to highlight the better choices for them, and to increase the effect of behavioural change - without restricting choices. In liberal democratic regimes, where the public and political acceptability of economic interventions, regulations and enforcement are low (particularly when they first introduced), the nudging of travellers through the design of information systems can be advocated as a cheap and uncontroversial alternative to more challenging public initiatives.Avineri and Goodwin (2009) argue that one of the limitations of the ‘nudge’ strategy is that being designed to influence individuals’ behaviour through intuitive and impulsive processes of the automatic system they do not address the fundamental problem of behavioural change. Nudges work best on unintentional/automatic behaviours within a controlled context, however they do not lead directly to a real change to the individual’s knowledge, attitudes or values, and they are not designed to change the decision making process in the reflective system. It is therefore difficult to maintain and achieve long-term and sustainable behavioural change. Moreover, it is not possible to control the overall context in which nudge initiatives are introduced – and behavioural change achieved by designed nudges might be offset by unintended effects. Applications of the nudge approach to transport have not been tested in a large scale or systematically analysed in transport contexts. Therefore their effectiveness remains an open question.
5/02/10 45 University of the West of England, Bristol

Behavioural Inception Report Final Version 1.0
8 Review of European Commission ProjectsOver the years European Commission (EC) projects on transport and its environmental impacts have been developed. In this section, EC projects were reviewed for their relevance to this project. Work related to the provision of information, in particular CO2 related, to impact travel behaviour at the individual level was of particular interest.
8.1 Tapestryhttp://www.max-success.eu/tapestry/www.eu-tapestry.org/
Tapestry was a three year project running from November, 2000 to October, 2003 that looked at how “soft” measures (changes other than infrastructure ones) could be applied to reducing problems caused by unrestrained car use. It researched the roles of local, regional, and national level campaigns on changing attitudes, awareness, and behaviour. Tapestry had similar goals to CATCH, in that it was intended to examine how information in the form of campaigns could generate more sustainable travel behaviour. In total there were 18 studies across Europe (TAPESTRY, 2003a). The projects were grouped into: Intermodal Transport, Mode Repositioning and Health and Environment.An abbreviated version of the results of the research which included 18 studies across Europe were:
Non-personal information campaigns, such as nationally televised advertisements, might affect awareness, but were not associated with behaviour change. This is reflected in other published research (Gärling and Fujii, 2009; Sakauye, 2004).
Individuals’ perceptions about comfort, traffic safety, and personal security could be changed, but those about cost and reliability did not show much sensitivity to change. This means that although the campaigns were successful in changing the former aspects, they were generally unable to change perceptions on cost and the reliability (e.g. on-time) of public transit.
Interactive approaches were more successful. These approaches involved the public, generating understanding of the project’s goals and the benefits expected. Greater public acceptance was developed for the project. The approaches used were focus groups (TAPESTRY, 2003b) and other more personal approaches (TAPESTRY, 2003c) which could “engage” their audience.
Individuals who were open to information on alternative modes did show mode use changes. However, individuals who were not interested in such information were not further contacted.
Women were more likely to change to environmentally friendly modes (e.g. public transit, walking, cycling) than men.
Two projects from TAPESTRY that may be particularly relevant to CATCH were: Individualised Marketing in Germany (TAPESTRY, 2003c) and Efficient Car use in Belfast (TAPESTRY, 2003d). The project in Germany found a shift towards more environmentally friendly modes after the intervention which identified the segments of the population open to such modes (over 70%). Women were more open to those modes than men. In comparison to a control group, there was 6% fewer trips in cars, with 4% greater non-motorized use, and 2% greater public transit.
5/02/10 46 University of the West of England, Bristol
Behavioural Inception Report Final Version 1.0
8.2 WiseTriphttp://www.wisetrip-eu.org/
This currently running project focuses on connecting travellers in the city, region, and the world. It aims to bring local journey planner websites together to create an international journey planner. It aims to enable (WISETRIP, 2008) “travellers to easily get real-time multi-source and multi-modal trip planning service before or on the trip, in order to satisfy their demand for a safer, faster and more cost efficient travel.”This work has research on user and system requirements. Research on users will likely aid the CATCH project in later stages related to the development of the site. The WP3 of WiseTrip references two other projects that may be of interest as they deal with transport and information: IM@GINE IT and eMOTION 9 Europe-wide Multi-modal On-trip Traffic Information). However, IM@GINE IT has not published information. eMOTION aims to specify (Transport Research Knowledge Centre, 2009) “the framework for a Europe-wide multimodal traffic information service offering real time information and special services for the road and public transport user.” WP3 reviews 25 journey planners (JP) from eight EU countries and two Asian (China and Japan). Only the Trainline.com was identified as supplying users with information on CO2. That site does provide information, but under their “Gadgets and Tools” section, and not as a regular feature. It does however compare CO2 for the same trip by other modes.The results of WiseTrip and knowledge from eMOTION will likely contribute to the knowledge platform resulting from CATCH. If WiseTrip or eMOTION are successful in producing a Europe-wide real-time, multi-modal trip planning service, then that service should be advertised to individuals. CATCH will contribute to those projects by outlining how to include information on CO2 if it is found appropriate to create travel behaviour change.
8.3 i-Travelhttp://www.i-travelproject.com/
i-Travel is an 18 month project currently running which aims to develop a mobile, real-time, context-specific travel advisor. Relevant to the CATCH project this project aims to (http://www.i-travelproject.com/, 2009) “describe a “snapshot” of existing travel and transport services, technologies and stakeholders. As well as, “identify main traveller scenarios, multi-modal use cases of i-Travel service platform and requirements.”i-Travel’s WP2 publication (i-Travel, 2008) finds that information needs vary depending on the user(s)’s needs (e.g. information and planning, navigation, etc.), travel type (e.g. leisure, commute, etc.), and highlights eight design considerations. The eight design considerations were termed: functionality, accessibility (24/7 through the Internet), user interface (clear, simple, and easy to understand), context awareness (e.g. based on individual’s needs such as walking speed, leisure trip or commute), personalisation (e.g. individual preferences), financial aspects (information providers pressed for high level of information, but users unwilling to pay), reliability (e.g. consistent and up-to-date) and secure environment.This project is relevant to CATCH as it is considering the information needs of travellers. This type of tool addresses gaps in knowledge of travel by modes other than car. CATCH’s findings on the provision of information on CO2 produced would be relevant to the tool if the aim is to improve sustainable travel behaviour.
8.4 MAX-SUCCESShttp://www.max-success.eu/index.phtml
5/02/10 47 University of the West of England, Bristol
Behavioural Inception Report Final Version 1.0
The European Union’s sixth framework programme project Successful Travel Awareness Campaigns and Mobility Management Strategies (MAX-SUCCESS) aims to bring appropriate behaviour change theory to Mobility Management. Similarly to CATCH, the project aims to incorporate lessons learned from interventions in transport, health, and other fields. MAX-SUCCESS is currently running, but a review of theory-based interventions (MAX-SUCCESS, 2008a) and a behaviour change state-of-the-art report (MAX-SUCCESS, 2008b) are available for download. The review (MAX-SUCCESS, 2008a) found that theory-based interventions were more successful, but that people must be at a stage of “commitment” or “willingness” to these changes. Reviews of literature on increasing non-motorised mode use (for health) found that individually tailored information that considers circumstances and requirements was most successful at inducing behaviour change. Their review of theory-based research found that national-level, general advertisement campaigns did not affect behaviour, however, individuals who formulate a plan of intention to do something where more likely to do it. For example, an individual who makes a plan as to how they can use public transit to get to work is more likely to do so than an individual who merely has the intention but is not encouraged to create a plan.Summaries of some tools developed by MAX-SUCCESS are included in the following chapter.
8.5 GREENTRANSPORT-TV The strategic objective of Enhancing public awareness on the results of European research actions on Climate Friendly Transport Systems through the professional use of television media GREENTRANSPORT-TV project is to contribute to the development of public awareness on the European research on Greening transport in all European countries through the professional use of television media. This objective will be achieved through the exploitation and the customisation of an acknowledged innovative TV media communication model, already successfully implemented by the GREENTRANSPORT-TV partnership over the past 5 years. In particular, GREENTRANSPORT-TV will: Highlight the key results from the Greening Transport research in FP6 and FP7. This will be done through ongoing consultation with the relevant stakeholders and in-depth research into individual RTD projects, identified by these stakeholders as being of particular interest and relevance.
8.6 MIMIC The Mobility Intermodality and Interchanges (MIMIC) project goal is to study barriers to intermodality, with ‘barriers’ defined as all those interchange-specific factors that influence travellers to choose single-mode (generally car-based) options instead of intermodal ones. The project aims to break down barriers according to how serious they are and whether they are relative or absolute, and the population to which they apply.This project relates to CATCH as it will be source of information for practitioners who want to overcome such barriers within their population.
8.7 CAMPARIE The Campaigns for Awareness using Media and Publicity to assess the responses of individuals (CAMPARIE) projects has as objectives: To identify Information Management and Awareness Campaign (IMPAC) methods and strategies aiming at influencing travel behaviour in favour of sustainable transport modes and at enhancing the awareness of the public and the image and attractiveness of these modes; To record systematically and assess the future trends and perspectives for development of transport marketing through a
5/02/10 48 University of the West of England, Bristol
Behavioural Inception Report Final Version 1.0
pan European survey of transport decision makers and of publicity and media professionals; To develop the MIRTO prototype, a computer based tool, as a guide for optimal IMPAC strategies and as a tool for evaluating the effects of the various media used therein; To test in situ and evaluate innovative strategies for IMPAC aiming at the promotion of sustainable urban transport with and without the MIRTO Prototype; To elaborate recommendations and guidelines regarding the main features of IMPAC focusing on their purpose, content, target destinations, media and displays.
8.8 CIVITAS Initiativeshttp://www.civitas-initiative.org/main.phtml?lan=en
A number of CIty-VITAlity-Sustainability (CIVITAS) projects aim to reduce car use, and through association, CO2 production. How those projects approach the goal of reduced CO2
production varied from “hard” measures (e.g. improved buses, car sharing) to “soft” measures (e.g. personalised information, awareness campaigns).No projects were found that specifically attempt to change behaviour through the provision of information on CO2 production, however a few aim to shift mode use. In the city of Malmo, Sweden, (SMILE, 2006) information was given on alternatives to car-use to new residents and those individuals were contacted directly by phone and offered assistance in understanding information relevant to them. The study found that 95% of people contacted wanted and accepted transport advice. 15% of regular car users reported that they had changed some common travel patterns.In relation to that project, Bamberg (2006) found that the provision of a free bus ticket and personalised travel information for “new” residents. In comparison to the control group, the study group had statistically higher public transit use. In his study Intention was the highest correlation to public transport use, but car habit had only low correlation. The other high correlations were Attitude, Subjective norm, and Perceived behavioural control (an individual’s perceived ease or difficulty in performing a particular). This shows the importance of considering psychological aspects to individual’s travel behaviour.
8.9 SummaryPast European Commission (EC) projects that relate to achieving green house gas (GHG) reductions, with particular interest in the use of information were reviewed in this chapter. A number of projects were identified that are developing tools to increase the ease that individuals can acquire real time information about transit travel around Europe (i-Travel, WiseTrip). Other projects such as TAPESTRY had various projects related to reducing GHG production and the ones related to information use were highlighted. General information campaigns were found to improve awareness, but not to affect behaviour. Individually tailored information was found to change behaviour though. MAX-SUCCESS is a project currently underway where relevant Mobility Management techniques are being investigated. A few CITIVAS projects that had relevant projects were also summarized. The above projects could contribute to the CATCH project in a number of ways. Projects like TAPESTRY and MAX-SUCCESS have already looked at best practice for city stakeholders with respect to public campaigns and mobility management projects. Research done through the CATCH project on carbon awareness could lead to additional tools to be incorporated into projects such as i-Travel or WiseTrip.
5/02/10 49 University of the West of England, Bristol

Behavioural Inception Report Final Version 1.0
9 Review of Web-based Transport Tools This chapter considers web-based transport tools for both level one stakeholders (planners, operators) and level two stakeholders (individuals).
9.1 For PlannersAlthough an extensive search was not conducted, some sites were identified that aim to help planners apply concepts or give examples of projects discussed in previous chapters.
9.1.1 Fostering Sustainable Behaviour (cbsm.com)This website is designed to improve the use of community-based social marketing techniques. Developed by Doug McKenzie-Mohr, co-author of Fostering Sustainable Behavior: An Introduction to Community-Based Social Marketing, the site introduces users to the concepts and tools of this marketing area. The site includes a short “book” on the concepts, articles that can be sorted by area of interest, examples of cases, forums, and an area on strategies will be developed. The site is both a good introduction to the concepts and a useful resource of tools to use.
9.1.2 Tools of Change (toolsofchange.com)The site has proven methods for promoting environmental citizenship and has a tool to help plan a project. Sections on a planning guide, tools, case studies, topic resources, as well as webinars and workshops are included. The site allows for a user to sign up (free) and use the tool to start and develop their project. The site gives advice on when the tools are appropriate and links to projects that have used it.
9.1.3 European Local Transport Information Service (eltis.org)The European Local Transport Information Service aims to gather and disseminate information of tools and case studies for practitioners. The site is operable in eight different languages. It highlights events and recent news on the main page with sections on EU initiatives and policies, tools for practitioners, case studies (including specifically focused on reducing CO2, and links to related sites. Within the case studies, it is possible to look at projects on seven different areas;
• Clean and energy-efficient vehicles• Cycling• Demand management and pricing• Public passenger transport• Transport and land use planning• Urban goods traffic / city logistics• Walking
Within each of those areas, the user can choose from suggested categories/keywords or input their own keywords. The searches can be limited to a specific language or nation as well.
9.1.4 MAX-SUCCESS developed tools (http://www.max-success.eu/wpb.phtml; http://www.epomm.org/index.phtml?ID1=2182andid=2182)The European Union’s sixth framework programme project Successful Travel Awareness Campaigns and Mobility Management Strategies (MAX-SUCCESS) has produced several tools that are likely extremely relevant and useful to practitioners.
5/02/10 50 University of the West of England, Bristol
Behavioural Inception Report Final Version 1.0
MaxExplorer is a support tool that guides users to potential mobility management techniques relevant to their particular application. The tool begins with common application sites, identifies the target for change, the general built environment structure, asks the size of the target population, and then ranks recommended measures on relevance. Further links allow the user to investigate the application of those measures further.MaxSumo provides guidance for the planning, implementation, and evaluation stages. MaxEva encourages practitioners to include their evaluation in the database to improve guidance to future users with the final goal of developing a predictive tool estimating the potential improvements that the techniques would have.
9.2 For Businesses
9.2.1 For CompaniesOne site was identified that specifically aimed at companies who were motivated to reduce the impacts of commuting. Both local (state) and national information is available about climate change, transportation demand management (TDM) policies, transport organizations, and funding sources for changes.
9.2.2 Mobility ManagerMobility management (MM) is a transportation management policy that uses ‘‘soft’’ measures to attempt to reduce car use and promote sustainable transportation modes such as public transport, bicycles, and walking. Using communication and other means, MM induces voluntarily change towards more sustainable transportation modes.
Mobility management develops (low cost) concepts, strategies and actions that safeguard a given transport need for individuals, institutions and companies through the efficient use of available transport facilities or through strategies for avoidance of trips, promoting a sustainable development. The strategies can include information on available public transport, arranging of new collective transport, co-ordination of goods transport, and coordination of car pooling and communication strategies. A mobility management centre is the operational unit.
The Mobility Manager is responsible for the introduction and development of mobility management within his/her area of responsibility. At the policy level he/she will have to promote the idea of mobility management (see Fig 9-1). Furthermore a co-ordination of all the parties involved at both level is required. As a crystallization point for mobility management an operational unit that offers a wide range of mobility management services is required. At urban/regional level this unit is a mobility centre. It offers public access to everyone.
Mobility Centres can be organised in very different ways. From a large shop located in the city centre, a small office with mainly telephone access to a temporary or mobile mobility centre for special events many forms are conceivable. An operational unit at Site Level is called mobility office. Site here can be a work site, a retail or leisure centre. Access is restricted to and all mobility management services are focused on the site users.
Both the mobility centre and the mobility office represent the extremes of a wide range of possible combinations. One form of mixture between both could be a unit that offers mobility management services for several sites in a certain district. The mobility centre and the mobility office has to be run and managed by their staff. Depending on the size their might be a hierarchy between those doing the conceptual work of how to organise and perform the offered mobility management services and those who simply offer these services to the user.
5/02/10 51 University of the West of England, Bristol
Behavioural Inception Report Final Version 1.0
Mobility management services at an urban/regional level can also be offered by a mobility consultant. A mobility consultant usually approaches users in order to offer his/her services. These users could be, for example, the general public, schools, employment sites or leisure centres. The mobility consultant is likely to be involved in encouraging the introduction of mobility plans at a number of different sites within a city or region. In contrast, at site level, a mobility coordinator's role is to set up and develop a mobility plan for one particular site or small group of linked sites. This may also include setting up a mobility office and taking responsibility for its day-to-day running.
An important instrument for the site level is the mobility plan which is a comprehensive, directive document that includes all specific mobility management measures and the way of their implementation for one or several sites. The implementation of a mobility office and/or a mobility coordinator could also be part of a mobility plan.
Figure 9-3 Structure of the Mobility Management (from Salis, 2009)
Some EU projects have analyzed the viability and given guidelines to implement Mobility Manager as such MOSAIC and MOMENTUM.
As mobility management deals mainly with information, communication, co-ordination and organisation, it is all about services to support individual mobility behaviour. These services can be initiated and implemented on different levels and to varying extents. Examples for these services are mentioned in the following table.
Table 9-2 Services provided by Mobility Manager
Information and Advice
Timetables general, personalised hard copy, CD-ROM, On-line area wide, line-wise incl. co-ordination of all modes
Information on fares regular and special tickets
Information for travel organisation information about door-to-door journeys with different public transport companies
5/02/10 52 University of the West of England, Bristol
Behavioural Inception Report Final Version 1.0
Public events information about events linked with relevant public transport information
Car Sharing conditions, fares
Maps for cyclists cycle stands, cycle ways, slopes bike rental and repair
Maps for freight transport information on freight ramps, disposal facilities
roads closed for heavy vehicles
Accessibility guides for companies, school, universities, etc.
describe how the site is accessible by all means of transport
Consulting
Job Tickets for companies how to find partners introduction and administration
Car Pooling how to find partners introduction, organisation and legal
aspects
Comparison between different transport modes commuter and ‘one of’ trips compare travel time, costs and ecological
impact
Awareness and Education
Mobility education in kindergartens and schools traffic education plus rising awareness for the impacts of traffic and travel behaviour
Campaigns for various sustainable modes awareness and publicity campaigns, action days, etc.
Ecological impacts of traffic publicise pollution content
Car free days Show them: It is possible!
Newcomers to a town rising awareness concerning the use of sustainable modes right from the start
Transport Organisation and Co-ordination
Co-ordinate various transport operators fares, schedules
Car Pool matching at regional or company level
Combined event and ride tickets negotiation between transport operators and promoters
Organise (un)loading times at freight platforms shorten waiting times in freight transport
Work busses examine the demand and introduce them
Disabled persons co-ordinate a dedicated system for their transport
Delivery service organise a city-wide goods delivery service for purchases
5/02/10 53 University of the West of England, Bristol

Behavioural Inception Report Final Version 1.0
Sales and Reservation
Public transport tickets and timetables regional, national, international regular, season and combined tickets
Bike rental public transport trip, use a bicycle at destination
Car rental journey by train, but independence at destination
Hotel reservation in combination with journey planning
Car Sharing booking and bills
Car Pooling reservation of lifts
Personal insurance appropriate for the used transport mode, e.g. third-party and theft insurance for cyclists
Pre-book railway shuttle services speed up freight transport on rail
(New) Transport-related products and services
Cost comparison analysis public transport / Car Sharing / private car
Special public transport fares at weekend or night time in order to promote them for leisure use
Guaranteed ride home Car Poolers working overtime and miss their pool car get offered a free ride home
9.3 For IndividualsThe provision and design of information on the environmental impacts of travel choices can be seen as a ‘soft’ intervention and as a way of potentially engaging travellers more directly with environmental costs. Information on carbon emissions and other environmental impacts are provided by carbon calculators, Advanced Traveller Information Systems (ATIS) (such as web-based journey planners), and other information systems. Such tools have the potential to help travellers understand the impact of their travel choices on the environment and to motivate them to change their personal travel behaviour and reduce carbon emissions.Personal awareness and acceptance of responsibility is one necessary step. Tools such as carbon calculators or trip planners can work to give feedback to individuals about their personal CO2 production. The difficulty here is getting drivers to use these tools, understand their results, and receive personalised advice on how to change. The aim of the CATCH project is to reduce overall greenhouse gas (GHG) production that is related to transport by providing a platform of knowledge for travellers, businesses, planners, and other mobility stakeholders. This section focuses on carbon calculators for individuals that are available on the Internet. A task force of the American Psychological Association recently commented carbon calculators need to be improved with consideration to determining barriers and possibilities to change (Swim et al., 2009). The review considers critiques of carbon calculators that have been carried out in previous research and consider the calculators from the view of behaviour change. Nearly 80 carbon calculators (or “environmental footprint calculators”) and trip planner sites that incorporate information on transport-related carbon emissions have been identified from
5/02/10 54 University of the West of England, Bristol
Behavioural Inception Report Final Version 1.0
Europe, North America, Brazil, and Japan. A review of literature related to carbon calculators was conducted and recommendations related to the CATCH project are being built.
9.3.1 Carbon CalculatorsCarbon calculators are tools intended to estimate ones production of carbon dioxide (CO2). The source of the carbon dioxide may be from ones dwelling, travel, or purchasing and disposal behaviour among others. The level of detail varies between calculators from general calculations based on inputs from the user such as household make-up, income level, and miles driven per year to detailed calculators that require the quantity of energy and source and track those over time. The purpose of the calculators are generally to raise awareness, with some selling carbon offsets (balancing ones production of CO2 with other activities such as growing trees, investing in renewable energy sources, and so on), and others offering a community that strive to become carbon neutral (the amount of carbon one produces is balanced by activities that reduce the amount of CO2 in the atmosphere-ocean system).
9.3.1.1 Previous ReviewsIn previous reviews of carbon calculators (Padgett et al., 2007; Bottrill, 2007; Coulter et al., 2008; Jones and Niemeier, 2009) the general findings were that the calculators did not return consistent results across the tools despite similar inputs, that there was a lack of transparency in the methods of calculation, and that feedback was limited. Bottrill (2007) commented that for the UK carbon calculators that difference could mostly be explained by aviation calculation assumptions.Behaviour change requires a number of different steps from awareness through to a maintained change in behaviour. Current users of carbon calculators are typically people who are already concerned about climate change and are using them to either assuage guilt through offsets or monitor CO2 production (Coulter et al., 2008), presumably with the goal of becoming carbon neutral. Depending on the level of commitment of the individual to the concept, different calculators are appropriate. Bottrill (2007) argued that most carbon calculators of the time were too general, that they didn’t allow sufficiently detailed input to acquire an accurate result, nor did they allow tracking over time. Her work contributed to the production of what she termed a second generation carbon calculator iMeasure (produced at Oxford University’s Centre for the Environment). That tool, along with several others, allows a user to register and track CO2 production over time, interact with other users, and some allow results to link to popular social networking sites such as Facebook. Users
Those tools are effective for the “converted” who may be willing to devote greater effort to overall CO2 reduction. Unfortunately, one study found that only 10% of the population reported (Halifax survey cited in Coulter et al., 2008) that they willing to pay for carbon offsetting. The majority of the population may not be aware of the urgency of climate change, be interested, or even consider it relevant (Coulter et al., 2008). Non-users were found to be more interested in a general amount that could be easily determined from a respectable source (Coulter et al., 2008). Understanding those general results may be enough for adjustments, but first the user must understand the results.
9.3.1.2 Interpreting the InformationOnce an amount has been calculated, either at a sophisticated level or a general one, interpretation of the result is required. The concept of CO2 is new and abstract, leading to confusion and a general lack of understanding (Coulter et al., 2008). Different users have different learning styles (VARK, 2006), but the results on how much CO2 is produced by an user should likely be at least both visual and textual form. Comparisons to equivalents such as the number of trees required to sequester the carbon, the number of running hours for a car to produce the same, or the number of “Earths” required were used by various websites to increase understanding. In Coulter et al.’s study a subject commented that the use of
5/02/10 55 University of the West of England, Bristol

Behavioural Inception Report Final Version 1.0
Earths “was quite simple for somebody like me to understand.” The use of Earths likely gave a context to the person’s outputs, enabling them to put the results in perspective. Another aspect of understanding CO2 production is comparison to others. However, this should be combined with a judgement value such as good or bad. In a study on energy use in California (Schultz et al., 2007), when only a comparison to averages was given, there was a tendency for both high and low use households to move towards the average, but when a value judgement in the form of a happy or frowning face was included, the low usage users did not tend towards the average. Berkeley’s CoolClimate carbon calculator (coolclimate.berkeley.edu) compares the individual’s household with similar households of the same state, nationally, and the world average with positive or negative comments depending on the result. The “second generation” sites typically allow comparison to other users, but often only at the initiation of the user. Comparisons such as the one used in CoolClimate’s calculator are likely beneficial and the social community can help each other through reflection, knowledge, and social influences.
9.3.1.3 Advice on ChangesMany of the web-based carbon calculators provide little to no advice other than links to other sites or to pay for carbon offsets (Jones and Niemeier, 2009). This puts a considerable burden on the individual to seek-out relevant information. The subjects of Coulter et al.’s (2008) study commented that relevant advice to their situation was best. Unfortunately, the problem here may be the balance between a low-burden on inputs and a desire for individually tailored advice. One site which linked the user to advice on how to reduce their greatest contributing factor to CO2 was Airhead.cnt.org. This site also combined witticisms into their advice, which potentially lessens the burden of reading through dry advice. Jones and Neimeier (2009) reviewed 12 carbon calculators for their feedback and found that only one, Low Impact Living, gave “specific information regarding both cost and emissions reduction,” which could be organized by reduction amount, cost, or annual savings. A problem here may be residential location. Advice should be tailored to what’s locally relevant. Where possible, the user could be prompted to enter their work places, start times, and other common trips. If a transport planner (such as transportdirect.info) is available that information could be automatically entered and the results presented to the user.
9.3.1.4 CommittmentAmong the “second generation”2 carbon calculators, MakeMeSustainable.com allows users to pledge to do an action to reduce impact and input a date. This is related to committing an individual to an action. In this instance, success rates are not known nor if long-term behaviour changes are established.
9.3.1.5 Improving the User ExperienceIf the importance of the concept can be conveyed, then the individual should be more likely to voluntarily change their behaviour. At this point, advice on how to change is important. As individuals voluntarily use carbon calculators, improvements in the design of the computer-human interaction would decrease burdens on the user and increase usage. Coulter et al. (year) recommended that a carbon calculator site should be as enjoyable as possible to lower the burden of a site, and potentially make it enjoyable enough to allow word-of-mouth promotion. Airhead.cnt.org relies primarily on text, but the text itself was enjoyable enough for this author to want to read more for potential laughs. Of course, humour can be both cultural and personal, and is thus potentially difficult. Other design considerations include flow and visually attractive.
2 Botrill (2007) defines “next generation”, termed here “second generation” as carbon calculators that allow for users to monitor, benchmark, and target their carbon emissions.
5/02/10 56 University of the West of England, Bristol

Behavioural Inception Report Final Version 1.0
9.3.1.6 Examples from BrazilSix Brazilian carbon calculators have been reviewed; five calculated how many trees would be required to offset the CO2 estimated to be produced by the user’s activities. The sites would give the estimated CO2 in kilograms and number of trees. As discussed above, the information on the weight of CO2 produced may not have much meaning for people as the concept is new and abstract, the value of trees may increase understanding by providing a concrete equivalent. However, simply estimating the number of trees does not relate to what is sustainable, but may act to put a cost to such activity. The one exception to that trend was a recent website (www.naovoudecarro.com.br) that is estimates the CO2 production avoided by making trips by modes other than car. Similar to World Commute (www.worldcommute.com), the site asks users to input trips that were made without using a car, and estimates how much CO2 was not produced. The website provides information on the number of individuals who did not use their cars that day (that use the website), the top city for that day, and ranks cities and countries for overall contributions. These features are similar to World Commute’s, and may create a sense of competition between individuals, cities, and nations to avoid CO2 production. As well, displaying the number of users and individuals who have participated may benefit from sociological concepts, first allowing people to see that they are part of community, and with sufficient growth may imply that such behaviour is the “norm”.
9.3.2 Trip PlannersThere are various web-based trip planners (or ‘journey planners’) available for different markets (e.g. national, local, mode specific). The sites are generally free to use and provide information on route and/or mode selection. The input for these sites varies, but many aim for door-to-door level information that includes multi-modal information. However, few provide information on CO2 produced by the trip, or require the user to request that information. If the information is provided, it is often in the form of the weight of CO2 produced. This likely leads to issues of comprehension and relevance (Coulter et al., 2008).At present journey planners allow travellers to make mode choices mainly assessing travel time (compared with their mode preferences). Moreover, there are journey planners incorporating carbon calculators, which allow their users to assess how much GHG emissions are likely to be released into the atmosphere for any given action (including travel). Journey planners work through inputs provided by users through a web site questionnaire. Information required concern origin and destination, by address, landmark, or post code, and the tool finds the best route.
Many web portals of public transport operators offering comprehensive mobility services within the cities are available. They include information about private transport (by car or on foot) and other public transport services to turn timetable information into door-to-door journey planning. Such systems, which include multimodal traveller information, are developed by different providers and offer different functionalities through different platforms (mobile phones, PDAs, PC, Digital TV, etc.), being therefore different from one city to another, and making difficult sometimes for the user to access them (accessing unknown interfaces).
9.3.2.1 Expanding on Traditional InformationAlthough the existing journey planners provide schedule and duration information effectively, realistic transport decisions involve constraints, such as weather, safety, fitness and environmental concerns (Hu et al., 2008). Hu et al. developed a transport journey planner by ‘multi-objective linear programming’ and ‘multi criteria analysis’, to rank all the admissible transport options from home to the university based on total disutility during the journey, considering personal energy expenditure, travel time, travel cost, CO2 emission and energy resource consumption.
5/02/10 57 University of the West of England, Bristol
Behavioural Inception Report Final Version 1.0
Among web based Personal Travel Planners the City of Brighton’s “Journey On” (www.journeyon.co.uk), online journey planner considers the four main modes of walking, cycling, public transport and car. The website calculates the number of calories burnt by an individual with respect to the mode (however, it does not give the option to enter sex or body size), gives choices such as a direct or a topographically flat route for non-motorized travel, and gives the weather forecast. When the trip information is produced, the inclusion of smiley or frowning faces gives a judgment on whether the amount of CO2 produced is “good” or “bad” and the CO2 itself is given in both weight and a “footprint”. Unfortunately, the footprint does not likely increase understanding, but only relates to the concept of an environmental footprint.
9.3.3 Recommendations on Site Design• Methods of calculation should be transparent for those users interested.• Should have a simple, easy-to-use introductory calculator with the option to
register and monitor. Accuracy and reliability of results are not main concerns, but the message on the
result (good/bad) is.• Feedback on CO2 production must be put in equivalencies (such as number of
trees to sequester CO2 produced, Earths, number of hours a car is continuously running)
• Feedback should be compared to others (locally, regionally, nationally, globally, national goals) combined with a judgement (good/bad).
• Advice must be offered on how to adjust behaviour.• Advice should be locally relevant.• Advice should show potential impact, cost, and savings (see Low Impact Living
(www.lowimpactliving.com site)• Advice should be organised from “easily accomplished” to more major changes
and sortable according to impact, cost, and savings.• Advice should be “actions” where the user can pledge a date and indicate when
accomplished (see MakeMeSustainable site) with appropriate praising (positive feedback).
• Modes: many overlook mass transit, or do not separate out modes (bus, tram, subway, diesel train, electric train); only one site included taxi (didn’t have size, fuel source)
o Further consideration to occupancy levels should be included.• Inputs: option of time scale (day, week, month, year)• Option of unit (with preference to energy source quantity)• Local average relevant to household size and income offered to ease initial
information burden.• Option to input home location, work (and number of days), frequent destinations
(and frequency) for automatic distance calculations• Flight calculations should follow Atmosfair site which allows city’s name to be
entered and allows transfers.• Long-haul train travel should follow similar input patterns to flights with station
names being offered once a city or region name is entered.• Inputs: average work/school days travel pattern, average days off travel patterns
option through visual tools such as interactive maps.
5/02/10 58 University of the West of England, Bristol
Behavioural Inception Report Final Version 1.0
In addition to the above, Coulter et al. (2008) make the following recommendations on layout design:
• Illustrative and fun graphics• Sparse and simple text• Bright, consistent colour scheme• Clear layout• Everyday language• Simple yet personalised information requirements• Meaningful and understandable results• Personal and realistic follow-on action• Succinct process
9.4 Other User Sites on Transport Behaviour ChangeThis section introduces a couple of sites that were identified by a Transportation Research Board (TRB) contest for communication transportation, energy, and climate change concepts to the public (Meyer and Weeks, 2009) and one other site on household and transport combined costs.
9.4.1 TransportationTown.comThe site transportationtown.com was developed by Whatcom County Community Transportation Advisory Group in Washington to improve accessibility to information on transport issues to the general public. The site opens with an animated cartoon-ish depiction of a city built environment with facts available if the user scrolls over various icons with the option to learn more. The facts are usually locally relevant with some more general knowledge as well. The site includes an interactive game where the goal is to keep the city mobility high, pollution low, and people happy. The user can adjust factors with each factor explaining some of the positives and negatives associated with changes. However, the use of mobility over accessibility could be contested as mobility is based on the assumption that greater travel is better, yet it could be argued that travelling more is not desirable. Through the game users should gain basic information on the connections between different aspects of the city with mobility, pollution, and people’s happiness. The sites has pages on most transport modes and land use. On those individual pages some local facts are usually provided along with the role that they play in transport and city life. Further links allow the users to investigate deeper into each area.
9.4.2 Drive $marter ChallengeThe site, drivesmarterchallenge.org, was built for the Alliance to Save Energy in Washington, DC. The user enters their vehicle make, model, year, engine size, and zip code. The site than estimates how much money could be saved over a year. The user, if motivated, would then click to find advice on how those savings could be achieved. Along with monetary savings, the site also provides information on CO2 reductions. In order to get coupons, you must “challenge” at least one friend. This both promotes the site and uses social connections to improve the likelihood of use.
9.4.3 H+T Affordability IndexThis site (htaindex.cnt.org) developed by the Centre for Neighborhood Technology compares affordability when only housing costs are consider with an affordability index of both household and transport costs. This is a good example of allowing individuals to access
5/02/10 59 University of the West of England, Bristol
Behavioural Inception Report Final Version 1.0
information on what could be considered hidden costs of dwelling location choice. The site will expand cover 330 metro areas of the United States. Along with the consideration of transportation and housing costs, the site allows users to make their own custom comparisons with 32 different choices including CO2 per acre through automobile use and CO2 per household. From a environmental justice point of view those two comparisons highlight that the locations that suffer from direct CO2 outputs (e.g. asthma) are not the people producing the problem.
Key Site: This site is an exemplary example that knowledge platforms such as CATCH should help publicize.
9.5 How are Environmental Impacts Communicated?Road users have been the key focus of most of the work in this area, and there has been little research on the provision of environmental costs to other travellers, such as rail passengers. The negative environmental impacts associated with rail transport are considered by many to be rather small when compared to road transport. Only few existing carbon calculators consider rail travel and if they do they do not allow for input that most users would have such as departure and destination stations.In the course of the review, 64 different carbon calculators and eight travel planners were investigated. Only 23 of those 64 carbon calculators included rail and only five of those 23 allowed for input on a trip scale. Of the journey planners, three planners in the UK could provide emission calculations and one in Japan (though only for subway). The majority of sites that considered rail and the associated emissions used values based on national averages. Only one site, travelfootprint.org, had developed information related to the type of train (five types), the estimated occupancy, and allowed the user to input station to station information. Although the travel planner sites typically allow for station to station input, this was not found in the carbon calculator sites. There are concerns with the travel planners and how emissions are calculated. Although average costs for train and average costs for cars are used, when the number of passengers travelling increase, the train may continue to show average costs, while the car will show marginal costs. This would imply that the car would produce less per person. In Table 9-2, we can see that in comparison to a small car, the London Underground appears no better for Transportdirect.info’s calculations which don’t differentiate different rail types. Travelfootprint.org uses a value specific for the London Underground which shows savings. Looking at long distance trains, the value that Travelfootprint.org produces is either smaller or larger than the result shown by Transportdirect.info depending on the estimated occupancy.
Table 9-2 CO2 emission calculations from two example travel planner sites in the UK
Transportdirect.info Travelfootprint.org
Ppl Origin Destination Small car
Train Avg. city car – LP
Train 1 (occupancy)
Train 2 (occupancy)
1 Green Park
Embankment 0.2 kg/ person
0.2 kg/ person
.294kg/ person
.035 kg/ person(100%)
0.084 kg/ person (40%)
4 Green Park
Embankment .05kg/ person
0.2 kg/ person
.073 kg/ person
.035 kg/ person (100%)
.084 kg/ person (40%)
1 Bristol Temple Meads
London Paddington
23.1 kg/ person
10.5 kg/ person
33 kg/ person
24 kg/ person (25%)
6 kg/ person (100%)
4 Bristol Temple
London 5.8 kg/ 10.5 kg/ 8.3 kg/ 24 kg/ person 6 kg/ person
5/02/10 60 University of the West of England, Bristol

Behavioural Inception Report Final Version 1.0
Meads Paddington person person person (25%) (25%)
The issue of occupancy for transit has another aspect to it. If there is already public transit that covers that trip, then as long as there is room for the passenger, the increased CO2
produced is likely less than adding an additional car trip. This of course is also only considering emissions and not other impacts of additional car trips such as congestion, danger, and public money through taxes to support infrastructure and services. Considering that, the comparison of public transit to car trips may only be relevant in the consideration of displaced car trips as a result of improved public transit supply. The addition of occupancy information likely increases the sense of accuracy for the users with respect to the values provided. Improving accuracy should increase the faith that the user will have in basing a decision off those values.
9.6 SummaryWeb-based resources for planners, operators, and individuals were reviewed in this chapter. A number of tools for planners were highlighted that assist them in using concepts outlined in Chapter 6. As well, the recent European Commission project MAX-SUCCESS has developed a number of tools that assist planners in choosing appropriate mobility management projects to change travel behaviour. The concept of CO2 is new and likely requires contextualisation and comparisons. For both users and non-users of carbon calculators, understanding is an issue both for the concept of CO2 production and terminology being used. Non-users are especially confused by climate change terminology and it is therefore suggested to use more “regular” language. There was a general lack of appropriate advice. Advice was either not offered, merely a link to other sites, very general in nature, or (in the case of the Coulter et al. (2008) study with non-users) irrelevant because it wasn’t thought realistic (e.g. get a hybrid car). A few sites did offer information that was specific to the largest contributing aspect of the user’s CO2 profile, and a couple of those allowed for sorting relevant to cost or ease.Although there were websites that are designed to help planners and individuals apply a number of behaviour change tools, there were few instances to suggest that such knowledge is being applied in most CO2 information sites for individuals. This chapter included a section recommending some changes that would improve sites.The CATCH project includes a research aspect that could look into how to provide information on CO2 production to better increase understanding. Such research would benefit not only the CATCH project, but numerous other tools and applications such as carbon calculators and journey planners.
5/02/10 61 University of the West of England, Bristol
Behavioural Inception Report Final Version 1.0
10Summary of Research Gaps and FindingsThis chapter summarizes research gaps and findings from the report. As well, recommendations based on those findings are also included with examples of potential applications.
10.1 Research Gaps IndentifiedThis section reports the research gaps identified through the report. It will not be possible for the CATCH project to investigate of all these questions, however they are included here so that other researchers may be inspired to conduct related work. During the next stage of the CATCH project, a few questions will be addressed.
10.1.1 With respect to barriers to behaviour change in general1. Which techniques are most effective for each barrier?
10.1.2 With respect to specific barriers to behaviour change1. What contributes to major decisions such as household location, vehicle purchase
(don’t/reduced environmental damage/increased environmental damage)?2. Which social nudges are most effective?3. How can perceived behavioural control be increased?4. How can the perception of climate change risks be reduced so an individual is not
overwhelmed, but retain enough motivation to act?5. How can trust in authority figures on climate change be increased?6. What benefits of change will increase willingness?7. What is the appropriate framing to create positive action?8. How does discounting of environmental costs and benefits relate to discounting of
economic or social costs and benefits?9. What are the emotional elements of deniers? What are the reasons for denial?10. Does the subjective value of a car trip (vs. other modes) decrease rapidly with
respect to time?11. How to create enough awareness of need to change without overwhelming?12. How can information overcome baseline understanding?13. Is it necessary for individuals to understand the environmental impacts to change
behaviour towards environmental travel behaviour?14. Would providing people information, post-trip, of alternatives that could reduce the
CO2 stimulate behaviour change?15. How to remove the disconnection between car driving and impacts (e.g. CO2
production, personal costs, taxes)?16. How to frame change away from car use to avoid feeling of “loss”?17. What better ways could feedback on costs be provided to drivers that would lead
to reduced use? Could a technology that uses mobile phones provide that information?
18. How much of an effect could direct feedback have on transport behaviour change?19. How could historic information be provided for drivers? 20. How could a transport-specific “EcoTeam” be established and be well attended? Ie
what would the necessary motivations be to increase involvement? 21. How could existing information systems be retro-fitted/improved to encourage
behaviour change?
5/02/10 62 University of the West of England, Bristol
Behavioural Inception Report Final Version 1.0
22. How to create motivation to seek sites that encourage behaviour change? 23. What are the best practices for improving reliability of the information on non-car
mode use?24. How could such a tool be best marketed for voluntary uptake?25. What are the best methods to break habits?26. What are the thresholds for structural and psychological factors? At what point is
one more important than the other in what context?27. Does the length of time driving affect the likelihood of success for the transport
intervention programs?28. What are appropriate goals for people at different stages of change for transport?
10.1.3 With respect to information on CO2
1. How do different presentation formats and measures of CO2 information affect perception and understanding of the environmental impact? How best to present information on CO2 to increase understanding?
2. Should CO2 information be presented differently to women and men?3. With respect to world views, should different information be provided to stimulate
understanding and action?4. With respect to other factors of travel (structural and psychological) such as cost,
time, and comfort does CO2 information influence travel behaviour?5. Could ‘nudges‘ have an effect on the perception and stated preferences of
sustainable travel choices? [such as loss/gain asymmetry]6. Could ‘social features’ incorporated into the knowledge platform could encourage
sustainable mobility?7. How best to take advantage of associative and affect-driven processes when
presenting CO2 information related to travel?8. How to provide information on CO2 if it is not sought (e.g. metering CO2 produced
while driving)? And how to stimulate people to seek such information (e.g., providing incentives)?
10.2 Summary of Findings and ApplicationsThis report reviewed potentials for behavioural change to support mobility and related policies on reducing green house gas (GHG) produced through transport. The findings of the report are presented here with ideas on how they could be applied to the CATCH platform or other related projects:
10.2.1 Chapter 1Research related to understanding the risk of climate change were discussed in Chapter 1. Many problems exist with people understanding the risks of climate change including framing, future discounting, perceived resilience, analytic processes versus affective ones, differences between women and men, world views, and baselines to understanding change. One of the main issues is that the future is discounted and is often considered in as an abstract. Behaviour change towards environmentally travel behaviour will be difficult if people are faced with current costs and losses and only distant future impacts. An important research gap is finding the best framing for climate change to decrease the sense of loss to avoid the tendency of “loss aversion”, and to link (or make salient) current actions with negative environmental impacts. However, the question remains whether it is necessary to create awareness, or if establishing a desirable default action or shifting social norms would be sufficient.
5/02/10 63 University of the West of England, Bristol
Behavioural Inception Report Final Version 1.0
10.2.1.1 Application Framing
o Avoid framing which is suggests some loss from the current situation. For example, the use of reduce your travel by car is a loss to the individual of their freedom of travel from the current situation. For example, “This project will improve the conditions for walking – something nearly everyone can enjoy!” As opposed to, “This project will restrict car movement, therefore improving the walking environment.”
o Use framing that is negative when referring to something to avoid. For example, use a different term other than climate change. “Global disaster” suggests something to avoid.
Future discountingo The impacts of climate change are often discussed in terms of the future and
are therefore significantly discounted. The impacts must be made more relevant, this may be highlighting health impacts such asthma or obesity.
o Another tactic would be get people to think of the type of neighbourhood they would like to live in and how those improvements relate to increased walking and cycling.
o However, future discounting can be used to help and will be discussed further along.
Perceived resilienceo Make the connections of impacts to the individuals more relevant. For
example, if their area is projected to have some stability with respect to their regional climate, then how disturbances in other areas affect them should be highlighted. Point out where food comes from or that nearby areas will suffer changes that may result in an increase of refugees. Each area will differ, but it must be made more salient.
Analytic versus Affectiveo People respond to their feelings quickly. Advertisements take advantage of
this through images and music with appropriate associations. The use of affective tools in combination with analytic information will likely increase uptake.
Women and Meno Women prefer social information (recommendations). Have a question an
expert aspect.o Women also perceive threats more than men and so the balance between
effective and overwhelming messages will likely differ. o Men prefer visual information such as maps. o Information should include both social and visual information so that no matter
a person’s learning and interaction preferences, there will be relevant mediums.
World Views
5/02/10 64 University of the West of England, Bristol
Behavioural Inception Report Final Version 1.0
o People have different world views (how they act and interpret the world around them). For individuals who are more socially oriented information on how a project helps improve equality and benefits for all citizens will receive more support. For individuals who are pro-self, projects should be framed in the benefits to that individual, possibly with wording that suggests “others” will be making the changes that benefit them.
Baseline biaso People may not perceive the changes that are occurring around them. This is
where historic information or representations of the changes would be useful. Depending on where the individual is coming from (e.g. parent, motorist, etc.) different information may be relevant. For example,
for a parent, it may be important to highlight how cars have taken the streets away from children and how a reduction in use and some landscape changes could give them back.
For a motorist, it may be important to highlight how higher use of public transit in the past allowed for better traffic flow and how projects that increase the competiveness of public transit would improve flow.
10.2.2 Chapter 2A review of why people seek information and what they use in a transport context was the foundation of Chapter 2. Individuals check information about a mode when they are uncertain about some aspect of the trip, rather than checking information to decide on the best mode, so it may be ineffective at changing that particular trip. However, the potential to affect long term travel behaviour may exist. Further, what this may point to is focusing efforts on information provision at an earlier stage so as to affect decisions such as housing location (affecting accessibility) and car ownership (affecting mode availability).Assuming that information may be able to affect long-term travel behaviour it should be in a medium relevant to the individual’s context and learning style. Information on new and abstract concepts such as CO2 require research on how best to represent it to increase understanding and impact behaviour. Further, considering the research that suggests people consult travel information after a mode choice has been made, the influence of information on earlier stages that affect behaviour such as attitude and intention may be more relevant.
10.2.2.1 Application Uncertainty
o Create doubt that the current situation is the best. Pick up on the negatives and compare to alternatives, but not necessarily on a trip-to-trip basis as a walking 5 miles versus driving will not likely highlight the benefits of development such as transit-oriented development. Comparisons between cities that show how overall trip times would reduce may be more effective. For example:
Traffic jam due to competing nature of car driving versus the unrestricted movement of bus rapid transit (BRT), dedicated lanes, rail, or non-motorized modes lower congestion problems.
Stressful/tired drivers compared with person napping or reading on public transit.
Stressful/tired drivers and link with crashes compared with low instances in public transit of crashes.
Chauffeuring children versus safe walking for children within the local area and outside it on public transport.
5/02/10 65 University of the West of England, Bristol

Behavioural Inception Report Final Version 1.0
How sure are you that things aren’t getting worse? Would you risk things getting worse rather than support changes that will make it easy for all citizens to travel without their car?
Long Term Changeso Self monitoring through an ipod application. For example, CO2 produced and
how that works on an aggregate level. If better than average, praise and support steps towards more substantial goals – but steps, not average to carbon neutral.
o Greener options found and sent to phone.
Major purchaseso Highlight combined costs of home and life-cycle costs of travel. A program has
begun to do this in the United States (http://htaindex.cnt.org) called “True Affordability and Location Efficiency”.
o City/government spending on transport (public transit, infrastructure) of various cities and the respective household costs for transport and housing in those cities.
10.2.3 Chapter 3Behaviour change with respect to climate change and transport was considered in Chapter 3. Three general reactions may be denial, token environmental behaviour (e.g. recycling, but not other lifestyle behaviour), or more thorough environmentally friendly behaviour. Affecting behaviour change will likely require techniques that change social norms (such as expectations of what a good life consists of), and take advantage of social networks and focus relevant benefits (e.g. individualistic benefits for some, altruistic for others). Related to transport, barriers such as not knowing what actions to take, prospect theory on avoiding “lost mobility”, and how groups and social norms will affect an individual were discussed.
10.2.3.1 ApplicationThree general reaction types
Denial
o As deniers will often ignore information that goes against their choice, it is important to reach them through other avenues. As mentioned in the “Attitude” example, a car driver may be more interested in reducing congestion than reducing CO2, but the two can work together. People also have different “hats”, they may simultaneously be a long-haul truck driver, parent, home owner, Sunday footballer, amongst other things. Each of those aspects will have different concerns, and allowing them to “enter into the discussion” through various avenues can increase the chance of their support and involvement.
As a long-haul truck driver, they may be interested in reducing congestion to improve their efficiency.
As a parent it may be improving pedestrian safety for their children. As a home owner (urban) they may want to decrease traffic impacts on
their neighbourhood. As a home owner (ex-urban) it may a concern over rising fuel costs leading to increased costs of access and potential de-valuation of their home. Links to information on the connection between home location and transport costs may influence a future decision on where to live.
5/02/10 66 University of the West of England, Bristol
Behavioural Inception Report Final Version 1.0
As a Sunday footballer it could be improving public transit to reduce the size of the parking lots so as to increase space available for play.
Token behaviour
o Through selecting a few behaviours that they already do, they should be praised and encouraged to make further improvements. Highlight that transport is one of the main sources of CO2 and that even if they can’t change, it’s important to help others change. They would have the option to see what changes they could make or how they could help others reduce CO2 output. Under the changes that they could make should be the ability to sort by cost, time, and impact. Again, take advantage of future discounting by allowing support or changes to be in the future. The important part will be to get some sort of commitment. If it’s support for others, then an on-line petition may be appropriate. If it’s a personal change, then a voluntarily made goal should be used. In combination with this, the person should be encouraged to join some form of social network that supports such change. See the section on social networks for more information.
Desired behaviour change
o Highlight their successes, get testimonials that encourage others, have them highlight what helped them achieve these changes. Things that help make a change should be highlighted and people who successfully make the changes should be able to vote on what helped them. The things that help people more to achieve those changes would be ranked so that someone considering the change can see how others have accomplished that task, and also that it’s possible. Giving a sense that others have done it will also create a sense of “normal”, and the influence of social norms may increase.
Social Norms
o It is important to highlight that these changes are not “alternative”. These changes are what people are doing. Phrases like, “more and more people are” gives a sense that the action is something popular, that they should consider it so as not be a laggard. Avoid the use of “green”, as it implies that it is not the “normal” behaviour, but some alternative behaviour not in keeping with how most people act. If possible, show how similar people are doing that action.
Social Networks
o Allow users to register.
o Similar to social networking sites such as Facebook, allow the users to invite others from their mailing list.
o Form networks on topics and allow users to join and create their own. Some maintenance should occur to limit duplication.
o When an individual does some action, whether it’s a sign an on-line petition, commit to a behaviour change, or successfully make a behaviour change, the site should allow them to invite or challenge other known members.
o A website that uses this well for environmental behaviour is makemesustainable.com.
5/02/10 67 University of the West of England, Bristol
Behavioural Inception Report Final Version 1.0
o Points, or rewards to indicate progress. Again, avoid the use of “green”, as this implies that it’s not normal. Perhaps something along the lines of bronze, silver, gold stars for the impact.
o The user should be able to integrate into Facebook, My Space, or other such networking sites. The default should highlight some successful actions that they are doing (starting from signing petitions, through to successfully completed actions), display how many stars or points, and some sort of slogan for the site. For the slogan, it could be their choice, or it could be set as something (for example: I’m helping to improve my neighbourhood and city.
10.2.4 Chapter 4Examples of research on behaviour change from household energy use and transport were reviewed in Chapter 4. Research on household energy use suggests that direct feedback and commitment are effective techniques, but that financial incentives are not consistently effective and may not have lasting impacts. However, part of the success of direct feedback may have been establishing the link between an action and financial costs incurred through energy use. Commitment was thought to be effective as it helps motivate the step between intention and behaviour.
For transport, pro-social (rather than pro-self) values are favourably associated with attitudes, intentions, support, and use of public transit. In Germany, psychological factors were found to explain more of the differences seen in mode use in comparison to socio-demographic and infrastructure factors. Other research found that it is possible to break people’s habitual behaviour towards car use by getting them to try public transit through various means (including temporary free tickets and commitments to use it).
Models of stages of change were also discussed in Chapter 4 from the health and transport fields. Research done with respect to the health model suggest that designing information and interacting with an individual at their appropriate stage of change will be more effective in leading towards behaviour change. When stages are skipped, even the best advice on what to change may not be accepted and transport practitioners must investigate what stages their subjects are at so as to properly tailor information.
10.2.4.1 Application Direct Feedback
o Include iphone/ipod applications. If possible, should automatically monitor movement, determine mode and give feedback on CO2 used, and suggest alternatives. On a lower scale, it would allow them to enter trips via a map and enter mode.
o Showing/hiding the financial cost of using a mobile phone is a user option as it impacts that individual only, but CO2 impacts all people, so the site could promote and show support for some form of mandatory public display of CO2 output or efficiency of mode. The information is currently available for vehicles when purchasing, but it could be required that such information remain on display, being edited through maintenance and such.
Commitment
o Choice – commit to an action now or in the future. Action should be displayed on user’s page, should have a date for completion, if they miss their date, encourage those linked to them to support the change.
5/02/10 68 University of the West of England, Bristol

Behavioural Inception Report Final Version 1.0
Financial cost
o Show the transport costs for households in different neighbourhoods, cities.
o Highlight the role of public transit investment and less NEED to use a car that leads to lower car usage and ownership irrespective of income levels.
o Difference in transport and transport related (e.g. taxes) costs for city and individuals.
Pro-social
o If an individual is pro-social, then how a project will benefit all, increasing equality, and other social benefits should be highlighted. As people avoid costs more than they seek gains, what losses are avoided could be highlighted. For example, considering the likelihood of higher fuel costs in the future, project X will increase the ability of all citizens to accomplish necessary tasks using less fuel.
Pro-self
o For pro-self individuals, how a project allows them to avoid losses or benefits them should be highlight. For example, the cost of fuel will likely rise in the future, project X will lower the impact on your travel needs.
Psychological factors in mode choice
o Hard-core drivers (those who see no problems and have no desire to change) are not the majority in the countries studied (see Appendix <>), so it may be possible to create major change without directly engaging them.
o Emphasize benefits of reducing car use in aggregate, how neighbourhoods and the city would improve.
o Instruct them how they can help the process through petitions, contacting politicians, etc. Advise on small changes would include:
Walking school buses Just being outside Information on local shops and items available at them. Local public transport information Local social contacts, places to interact with people, events Ask for feedback, help improve things! Don’t just mutter and complain.
Tax
o For citizen focused shops, the number of customers needed to support and how large a catchment area is necessary to reach that should relate to the tax paid as it impacts infrastructure needs and resource consumption. For example, a smallish local shop may only need 50 to 100 people to support it. Depending on the density of the area, those customers may live within 100-500m away. The tax required would be in lower than a large shop that would require many more customers who would need to travel greater distances to reach it.
5/02/10 69 University of the West of England, Bristol
Behavioural Inception Report Final Version 1.0
Stage of Change
o 1st stage: Low awareness – need information to increase awareness and affect attitude. They should be encouraged to make small changes such as signing petitions in support of projects rather than being asked to change their behaviour.
o 2nd stage: Some awareness, moving towards intention – commitment should be used, exposure to examples of success, easy steps, individual-specific motivation, public display of intentions.
o 3rd stage: Intention towards action – prompts, advice, support, public display of accomplished actions.
o 4th stage: Action towards promotion – communication with others, leadership, official recognition (from site, neighbourhood, city), public display of leadership level (door signs, events, neighbourhood parties supported by city).
10.2.5 Chapter 5Barriers to understanding and behaviour change were highlighted in Chapter 5. These include awareness of the problem itself, awareness of what actions to take, experience with other travel options, habit and behavioural inertia, the perception of whether one can change, doing token environmental behavioural, and comparing one’s own actions to peers and public.
10.2.6 Chapter 6Evidence from behaviour sciences that relate to behaviour change were examined in Chapter 6. The techniques were:
commitment (a public commitment to an action will be most effective),
prompts (a reminder as close as possible in time and space to when the action to be addressed occurs),
norms (establishing that a desirable behaviour is common),
motivation (using the appropriate stimulus for an individual to do the desired behaviour),
feedback (using feedback as close to when an action occurs with information relevant to the individual on desirable or undesirable behaviour), and
incentives (a tricky tool that may create short-term change without long-term ones).
As well in Chapter 6, factors that influence people to behave in desired ways was also reviewed. These include reciprocation, commitment and consistency, social proof, authority, liking, and scarcity. Most of these relate to decision shortcuts that allow a person to reduce the cognitive load when making decisions.
10.2.6.1 Application Prompts
o Combining commitment and prompts, stickers for vehicles that say “5 miles less!”, “10 miles less!” etc.
5/02/10 70 University of the West of England, Bristol

Behavioural Inception Report Final Version 1.0
o Email or send short text messages thanking and praising them for actions that they’ve done.
Norms
o The number of people supporting change, once it has passed a certain threshold. However, key question is, “what is that threshold?”
o Publicize when most people do a desired action on site. For example, a number 1 symbol indicating popularity among site users.
o If a certain desire exists publicize it and entice the user to join the discussion through a simple question. For example, perhaps most people would like more local amenities or support increased community engagement. The question could simply be, “do you?” And then lead to a list with the heading “I support it by:” The list could be:
Shopping locally Participating in local events Taking a stroll in my neighbourhood Saying hello to people on the street even if I don’t know them. Suggest more! Your ideas.
o Pictures and testimonials from people of all walks of life to improve association for the users.
o Building on the above list, there could be pictures of people saying “it’s easy – even just walking around helps improve my neighbourhood – and I burn a few calories too!”
o “More and more people are” doing some action. For example, “more and more people are increasing their trips without a car. Are you?”
Yes -> Great! What do you do without a car?
List of example trips.
Want to, but... -> Great, let’s try to help you.
Where do you live?
Family size and ages
And then link them with relevant help (information, social networks)
No, not interested -> OK. Could you help others by telling us why?
List of reasons. Should be short to imply that there are few. They would have the option of “other”. Depending on their choice, the site could ask if they are interested in helping to fix that barrier. It would potentially lead them to information related to that. For example, if the barrier was the cost of using public transport, then information household and transport costs, city-neighbourhood costs for different types of development, etc.
Motivation
o People aren’t the same and will respond to different motivations.
5/02/10 71 University of the West of England, Bristol

Behavioural Inception Report Final Version 1.0
o Improving neighbourhood, cityo Saving moneyo Saving timeo Meeting people, socializingo Exerciseo “Playing”o Quiet time alone
Reciprocation
o Free stuff that is locally relevant. For example:
Tissues during the cold/flu season. Scarfs when it’s cold. Umbrellas when it’s rainy Toys that encourage socializing or at least require more than one
individual or use outside. “Face oil sheets” when it’s hot. Hand-held fans when it’s hot.
Consistency
o Help the individual users make connections between desired neighbourhood and non-helpful behaviour.
o Noise – link with driving.o Community connections – not shopping locally, not “getting out” in local area.o Recycling - but not reducing drivingo Children – chauffeur everywhere, live where the children can’t be
independent, can’t get a friend’s home alone.
Authority
o Experts from transport, sociology, psychology, health, urban planners, etc. Give video testimonials on potential improvements.
o Should be in their professional setting for some of the interview, show problem they are discussing a bit, and show solutions (especially if they exist in other cities already – not “pie in the sky” ideas).
Liking
o Commonality – “people like me”
o Show people from all walks of life enjoying benefits of greater local travel. Also show negative alternative to avoid.
o Friendly nature of site, pictures of people smiling while enjoying changes.
Scarcity
5/02/10 72 University of the West of England, Bristol
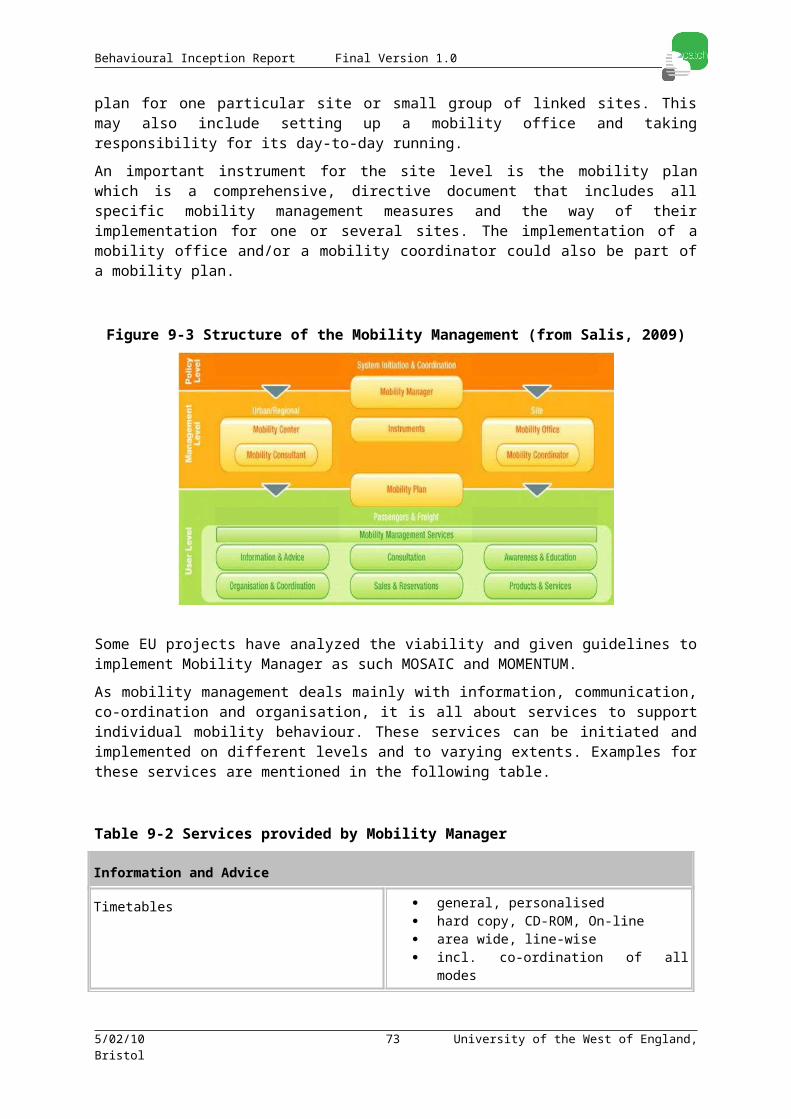
Behavioural Inception Report Final Version 1.0
o People want what’s hard to get or is for a limited time.
o Promotions with limited time – “don’t miss this opportunity”
o Demand is high, but city can’t afford to change all neighbourhoods now. Show support and help your neighbourhood enjoy these improvements by being selected.
o First X number of people to event get a free Y (umbrella, etc.)
Default
o After a person has followed a path, default should be some action.
o For example, on noise, once the person has learned a bit about causes, could move on to petition. Non-default action would be to skip that step.
Significant others
o In combination with social networks, encourage users to challenge friends and families. Set up friendly competitions that can be voluntarily joined.
10.2.7 Chapter 7Chapter 7 discussed the emerging field of behavioural economics and the application of “choice architecture”. Relevant techniques such as creating a desirable “default” behaviour (e.g. the default behaviour is to use transit rather than a car), using the technique of “loss aversion” (e.g. by driving to A, you’ll lose X Euros in parking fees), establishing desirable behaviour as the “right thing to do” through social nudges, and how “significant others” may the most effective way to reach someone.
10.2.8 Chapter 8Chapter 8 reviewed past European Commission (EC) projects that relate to achieving green house gas (GHG) reductions, with particular interest in the use of information. A number of projects were identified that are developing tools to increase the ease that individuals can acquire real time information about transit travel around Europe (i-Travel, WiseTrip). Other projects such as Tapestry had various projects related to reducing GHG production and the ones related to information use were highlighted. General information campaigns were found to improve awareness, but not to affect behaviour. Individually tailored information was found to change behaviour though. MAX-SUCCESS is a project currently underway where relevant Mobility Management techniques are being investigated. A few CITIVAS projects that had relevant projects were also summarized.
10.2.9 Chapter 9Chapter 9 reviewed Internet-based transport tools for practitioners and individuals.. A number of tools for planners were highlighted that assist them in using concepts outlined in Chapter 6. As well, the recent European Commission project MAX-SUCCESS has developed a number of tools that assist planners in choosing appropriate mobility management projects to change travel behaviour. The concept of CO2 is new and likely requires contextualisation and comparisons. For both users and non-users of carbon calculators, understanding is a concern both for the concept of CO2 production and terminology being used. Non-users are
5/02/10 73 University of the West of England, Bristol

Behavioural Inception Report Final Version 1.0
especially confused by climate change terminology and it is therefore suggested to use more “regular” language. There was a general lack of appropriate advice. Advice was either not offered, merely a link to other sites, very general in nature, or (in the case of the Coulter et al. (2008) study with non-users) irrelevant because it wasn’t thought realistic (e.g. get a hybrid car). A few sites did offer information that was specific to the largest contributing aspect of the user’s CO2 profile, and a couple of those allowed for sorting relevant to cost or ease.Although there were websites that are designed to help planners and individuals apply a number of behaviour change tools, there were few instances to suggest that such knowledge is being applied in most CO2 information sites for individuals. Recommendations for site design are listed next.
10.2.9.1 Design Recommendations for CO2 Information SitesDesign Recommendations based on this review
• Methods of calculation should be transparent for those users interested.• Should have a simple, easy-to-use introductory calculator with the option to
register and monitor.• Feedback on CO2 production must be put in equivalencies (such as number of
trees to sequester CO2 produced, Earths, number of hours a car is continuously running)
• Feedback should be compared to others (locally, regionally, nationally, globally, national goals) combined with a judgement (good/bad).
• Advice must be offered on how to adjust behaviour, and should be individual specific.
• Advice should be locally relevant.• Advice should show potential impact, cost, and savings (see
www.lowimpactliving.com)• Advice should be organised from “easily accomplished” to more major changes
and sortable according to impact, cost, and savings.• Advice should be “actions” where the user can pledge a date and indicate when
accomplished (for an example see www.makemesustainable.com) with appropriate praising (positive feedback).
• Modes: many overlook mass transit, or do not separate out modes (bus, tram, subway, diesel train, electric train); only one site included taxi (didn’t have size, fuel source)
• Option of time scale (day, week, month, year)• Option of unit (with preference to energy source quantity)• Local average relevant to household size and income offered to ease initial
information burden.• Option to input home location, work (and number of days), frequent destinations
(and frequency) for automatic distance calculations• Flight calculations should follow Atmosfair site (www.atmosfair.de) which allows
city’s name to be entered and allows transfers.• Long-haul train travel should follow similar input patterns to flights with station
names being offered once a city or region name is entered.
5/02/10 74 University of the West of England, Bristol
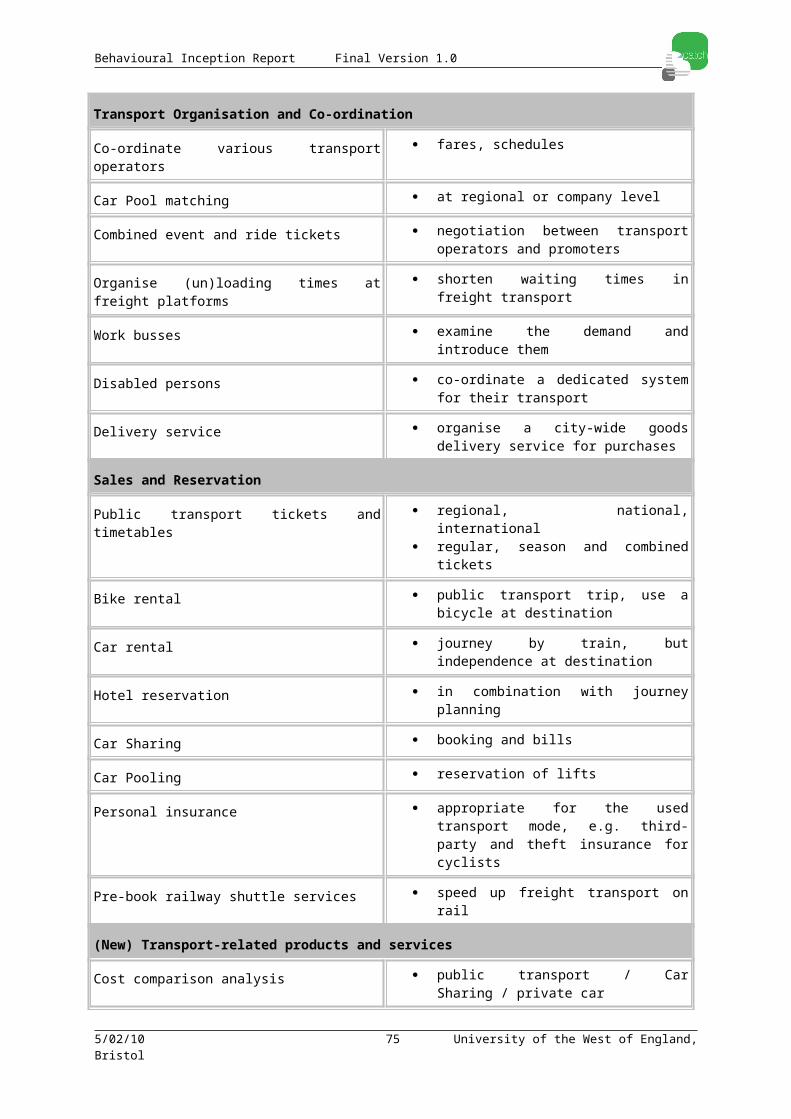
Behavioural Inception Report Final Version 1.0
Design Recommendations based from Coulter et al. (2008)3
• Illustrative and fun graphics• Sparse and simple text• Bright, consistent colour scheme• Clear layout• Everyday language• Simple yet personalised information requirements• Meaningful and understandable results• Personal and realistic follow-on action• Available but discrete calculation information• Succinct process• Accuracy and reliability of results was not a main concern
10.2.10 Practitioner specific RecommendationsThis sub-section identifies how some of the concepts highlighted in the report could be used to assist practitioners.
10.2.10.1 Stages of Change Planner/practitioner enters site.
What barriers are you facing?
1. Lack of awareness in decision makers? -> resources on impacts, how other cities are improving, esp. competitors
2. Lack of motivation in decision makers? -> learning to sell to their personal motivations (Pro-social, pro-self, etc.)
3. Want more ideas on projects?a. First project? -> greater level of detail in “walk through”, highlight projects that
are more easily accomplished and help lead into projects with greater impacts.
b. Done a few, but looking for more. -> ability to skip stages of the “walk through”, allow them to select projects they’ve done and suggest follow-on projects.
c. Accomplished many, but want to do more. -> similar to above. Prompt them to offer advice on past projects.
10.2.10.2 Projects Projects should have a title, then the option to see various parts such as:
o Introductiono Works best when...o Useful for addressing...o Applied examples/case studieso Resources
3 Coulter et al. (2008) was the only report identified that dealt specifically with design recommendations for carbon calculators and thus they are acknowledged.
5/02/10 75 University of the West of England, Bristol

Behavioural Inception Report Final Version 1.0
10.2.10.3 Support Individual users should have the option when signing up to receive (default) or not to
receive information from the city. If they accept, then the practitioners/planners could send short messages asking to show support for a project to help convince the decision makers that the public is behind them.
10.2.10.4 Reactions Decision makers are individuals too. If interest is on decreasing congestion, then sell
to those points. Interests can vary, but learning from leading cities on quality of life measures should apply to most.
10.2.10.5 Social Norms Show the number of cities that are doing/have done similar projects -> give
impression that they may be left behind if not doing such actions.
Ranking, league tables. Should be related to their stage-of-change and population size to increase relevance.
10.2.10.6 Social Networks Important for practitioners/planners as well. Build on existing ones.
10.2.10.7 Direct Feedback Have tools available on request for planners/practitioners to use with the decision
makers. Relate information on energy use, CO2 produced, and costs (with how that relates to population’s income levels).
10.2.10.8 Financial costs Compare cities on their spending for infrastructure, transport, transport-related, and
citizen costs with respect to PT investment.
10.2.10.9 Psychological factors Practitioners/planners should be aware that customers are not all the same. Pro-
social may already be inclined to ride and support PT. Depending on how many already do, they could be “low hanging-fruit” to increase ridership. However, pro-self may be less inclined and appropriate adverts and incentives should be used that speak to their focus. On the site, examples should be given of how the same projects can be sold to those different groups.
10.2.10.10 Tax Site should contain information on how city tax systems encourage development that
reduces the number of car trips and especially the distance travelled by car.
5/02/10 76 University of the West of England, Bristol

Behavioural Inception Report Final Version 1.0
10.2.10.11 Help planners use the tools of influence E.g. identify whether decision maker is pro-self or pro-social. Have guidance on how
to present the same project, but in a way that appeals to those people. Include examples of using loss avoidance and future discounting to their advantage.
10.2.10.12 Prompts Site should include examples of prompts for different projects that can be used at the
individual, neighbourhood, and city level and as use increases, suggested effectiveness of them.
10.2.10.13 Authority Leading city authorities could give testimonials.
10.2.10.14 Scarcity Include competition for inclusion in projects that help reduce the CO2 produced.
5/02/10 77 University of the West of England, Bristol
Behavioural Inception Report Final Version 1.0
11 ReferencesAbdel-Aty, M.A., Kitamura, R., and Jovanis, P. (1996). Investigating effect of Advanced
Traveller Information on commuter tendency to use transit. Transportation Research Record, 1550, 65-72
Abrahamse, W., Steg, L., Charles, V., and Rothengatter, T. (2005). A review of intervention studies aimed at household energy conservation. Journal of Environmental Psychology, 25, 273-291.
Anable, J. (2005). ‘Complacent Car Addicts’ or ‘Aspiring Environmentalists’? Identifying travel behaviour segments using attitude theory. Transport Policy, 12, 65–78.
Anable, J. (2008). Northamptonshire Modal Shift Demonstration Project: Interim Report 2: Household Survey: Attitudinal Segmentation. MRC Hazel Reports. Oct. 2008.
Ariely, D. (2008). Predictably Irrational: The Hidden Forces That Shape Our Decisions. Harper Collins, 2008.
Avineri, E. (2006), The effect of reference point on stochastic network equilibrium. Transportation Science, 40(4), 409-420.
Avineri, E. (2009a), Changing travel behaviour: Lessons from behavioural economics. Transportation Professional. The Magazine of the Institution of Highways and Transportation (IHT). July/August 2009, 28-29.
Avineri, E. (2009b). Applying prospect theory in the design of behavioural change initiatives. Under Review.
Avineri, E., and Goodwin, P. (Eds.) (2009, under review at DfT prior to publication). Individual Behaviour Change: Evidence in Transport and Public Health. For the Department for Transport, London.
Avineri, E. and Prashker, J.N. (2003). Sensitivity to uncertainty: The need for a paradigm shift. Transportation Research Record, 1854, 90-98.
Avineri, E. and Prashker, J.N. (2004). Violations of expected utility theory in route-choice stated preferences: The certainty effect and inflating of small probabilities. Transportation Research Record, 1894, 222-229.
Avineri, E. and Prashker, J.N. (2006). The impact of travel time information on travelers' learning under uncertainty. Transportation 33(4), 393-408.
Bachman, W. and Katzev, R. (1982). The effects of non-contingent free bus tickets and personal commitment on urban bus ridership. Transportation Research A, 16(2), 103-108.
Bamberg, S., Hunecke, M., and Blöbaum, A. (2007). Social context, personal norms and the use of public transportation: Two field studies. Journal of Environmental Psychology, 27(3), 190-203.
Bamberg, S., and Schmidt, P. (2003). Incentives, morality, or habit? Predicting students’ car use for university routes with the models of Ajzen, Schwartz, and Triandis. Environment and Behavior, 35(2), 264-285.
Beirão, G. and Cabral, J.S. (2008). Market segmentation analysis using attitudes toward transportation exploring the differences between men and women. Transportation Research Record, 206, 56–64.
Bottrill, C. (2007). Internet-based carbon tools for behaviour change. Environmental Change Institute, Oxford University Centre for the Environment, Nov. 2007.
Brog, W. and Erl, E. (2008). Global problems need global solutions – Behaviour change in three continents. Transportation Demand Management 2008, Vienna, July, 16-18, 2008.
Brown, B.B. Werner, C.M., and Kim, N. (2003). Personal and contextual factors supporting the switch to transit use: Evaluating a natural transit intervention. Analyses of Social Issues and Public Policy, 3(1), 139-160.
5/02/10 78 University of the West of England, Bristol
Behavioural Inception Report Final Version 1.0
Caldini, R.B. (2001). Influence: Science and Practice. Pearson Education Company, MA.Cameron, L.D., Brown, P.M. and Chapman, J.G. (1998). Social value orientations and
decisions to take proenvironmental action. Journal of Applied Social Psychology, 28(8), 675-697.
Campbell, M. and Lyons, G. (2007). Navigating the City: Supporting the Unfamiliar Traveller. Research briefing Sheet 006, Centre for Transport and Society, University of the West of England. Available online at: http://www.transport.uwe.ac.uk/research/briefings/bs006-navigating%20the%20city.pdf, accessed 25 Sept. 2009.
Carrus, G., Passafaro, P., and Bonnes, M. (2008). Emotions, habits and rational choices in ecological behaviours: The case of recycling and use of public transportation. Journal of Environmental Psychology, 28(1), 51-62.
Chatterton, T.J., Coulter, A., Musselwhite, C., Lyons, G., and Clegg, S. (2009). Understanding how transport choices are affected by the environment and health: Views expressed in a study on the use of carbon calculators. Public Health, 123, 45–49.
Chorus, C.G., Molin, E.J.E., van Wee, B. (2006). Travel information as an instrument to change car-drivers’ travel choices: A literature review. European Journal of Transport and Infrastructure Research, 6(4), 335-364.
Coogan, M.A., Karash, K.H., Adler, T., and Sallis, J. (2007). The role of personal values, urban form, and auto availability in the analysis of walking for transportation. Health Promotion hepr-21-00-12.3d 12/1/07
Cools, M., Moons, E., Janssens, B., and Wets, G. (2009). Shifting towards environment-friendly modes: profiling travelers using Q-methodology. Transportation, 36, 437–453.
Cooper, C. (2007). Successfully changing individual travel behavior: Applying community-based social marketing to travel choice. Transportation Research Record, 2021.
Colorni A., Ciccarelli D., Morrocchi V., and Rossi D. (2005). Dreams: An Integrated Information Management System for Traditional and Innovative Mobility Services in Milan, Italy. 10th EWGT Meeting and 16th Mini-EURO Conference. Poznan, 13-16 September, 2005.Corral-Verdugo, V., Bonnes, M., Tapia-Fonllem, C., Fraijo-Sing, B., Frías-Armenta, M., and
Carrus, G. (2009). Correlates of pro-sustainability orientation: The affinity towards diversity. Journal of Environmental Psychology, 29(1), 34-43.
Coulter, A., Clegg, S., Lyons, G., Chatterton, T. and Musselwhite, C. (2008). Exploring Public Attitudes to Personal Carbon Dioxide Emission Information. Final report, January. Department for Transport, London.
Darby, S. (2006). The Effectiveness of Feedback on Energy Consumption. A review for DEFRA on the literature on metering, billing and direct displays. April 2006.
Darnton, A. (2008). Reference Report: An Overview of Behaviour Change Models and Their Uses. UK: Government Social Research Behaviour Change Knowledge Review.
Dawnay, E. and Shah, H. (2005). Extending the “Rational Man” Model of Human Behaviour: Seven Key Principles. Briefing note for the Environment Agency. Bristol, UK.
DeYoung, R. (1996). Some psychological aspects of reduced consumption behavior. The role of intrinsic motivation and competence motivation. Environment and Behavior, 28, 358-409.
Diana, M., and Mokhtarian, P. (2009). Desire to change one's multimodality and its relationship to the use of different transport means. Transportation Research F, 12(2), 107-119.
Ellen, M., Klockner, C.A., Preiner, C.L. (2006). Applying a modified moral decision making model to change habitual car use: How can commitment be effective? Applied Psychology. 55(1), 91-106.
Epstein, L.G. (1999). A definition of uncertainty aversion. The Review of Economic Studies, 66(3), 579-608.
5/02/10 79 University of the West of England, Bristol

Behavioural Inception Report Final Version 1.0
Farag, S. and Lyons, G. (2008). What affects use of pretrip public transport information? Empirical results of a qualitative study. Transportation Research Record, 2069, 85–92.
Fishbein, M. and Ajzen, I. (1975). Belief, Attitude, Intention and Behavior: An Introduction to Theory and Research. Reading, MA, Addison-Wesley.
Fleming, N.D. (1995). I'm Different; Not Dumb. Modes of Presentation (VARK) in the Tertiary Classroom. In Zelmer, A. (Ed.) Research and Development in Higher Education, Proceedings of the 1995 Annual Conference of the Higher Education and Research Development Society of Australasia, 18, 308–313.
Fostering Sustainable Behaviour, http://www.cbsm.com/public/world.lasso, last accessed 12 Nov. 2009.
Frey, B. (1997). A constitution of knaves crowds out civic virtues. Economic Journal, 107, 1043–1053.
Fujii, S., and Gärling, T. (2003). Development of script-based travel mode choice after forced change. Transportation Research F, 6(2), 117-124.
Gärling, T. and Axhausen, K. (2003). Habitual travel choice. Transportation 30, 1-11.Gärling, T. and Fujii, S. (2009). Travel behavior modification: Theories, methods, and
programs. In: Kitamura, R., Yoshii, T., and Yamamoto, T. (Eds.), The Expanding Sphere of Travel Behaviour Research. Emerald Group Publishing Ltd.
Gärling, T., Fujii S., and Boe, O. (2001). Empirical tests of a model of determinants of script-based driving choice. Transportation Research F, 4, 89-102.
Gatersleben, B., and Uzzell, D. (2007). Affective appraisals of the daily commute: Comparing perceptions of drivers, cyclists, walkers, and users of public transport. Environment and Behavior, 39(3), 416-431.
Glanz, K., Rimer, B.K. and Lewis, F.M. (2002). Health Behavior and Health Education. Theory, Research and Practice. San Francisco: Wiley and Sons.
Global Action Plan (2008). EcoTeams Evaluation Report. Global Action Plan, June 2008.Gneezy, U. and Rustichini, A. (2000). A fine is a price. Journal of Legal Studies, 29(1) 1-18.Haustein, S. and Hunecke, M. (2007). Reduced use of environmentally friendly modes of
transportation caused by perceived mobility necessities: An extension of the theory of planned behavior. Journal of Applied Social Psychology, 37(8), 1856-1883.
Hertwich E., Larsen, H.N., Pettersen, I.N., and Solli, C. (2008). Climate calculators and expert systems. 2nd Conference of the Sustainable Consumption Research Exchange (SCORE!) Network, Brussels, March 2008.
Hertwig, R., Barron, G., Weber, E.U., and Erev, I. (2004). Decisions from experience and the effect of rare events in risky choice. Psychological Science, 15(8), 534-539.
Heymen, J. and Ariely, D. (2004). Effort for payment: A tale of two markets. Psychological Science.
Hobson, K. (2001). Sustainable Lifestyles: Rethinking barriers and behaviour change, Chapter 11 in Cohen and Murphy (Eds.) Exploring Sustainable Consumption: environmental policy and the social sciences. Amsterdam: Elsevier Science.
Hobson, K. (2003). Thinking habits into action: The role of knowledge and process in questioning household consumption practices. Local Environment, 8(1), 95-112.
Hu, W., Thompson, R.G., and Zaman, A.M. (2008). Active Transport Journey Planner Methodology. Conference of the Australian Institutes of Transport Research, Perth, 10-12 December, 2008.
Huddart, E., Beckley, T.M., McFarlane, B.L., and Nadeau, S. (2009). Why we don't "walk the talk": Understanding the environmental values/behaviour gap in Canada. Human Ecology Review, 16(2), 151-160.
5/02/10 80 University of the West of England, Bristol

Behavioural Inception Report Final Version 1.0
Hunecke, M., Blöbaum, A., Matthies, E., and Höger, R. (2001). Responsibility and environment: Ecological norm orientation and external factors in the domain of travel mode choice behavior. Environment and Behavior, 33(6), 830-852.
Hunecke, M., Haustein, S., Böhler, S., and Grischka, S. (2008). Attitude-Based Target Groups to Reduce the Ecological Impact of Daily Mobility Behavior. Environment and Behavior.
Hunecke, M., Haustein, S., Grischkat, S., and Böhler, S. (2007). Psychological, sociodemographic, and infrastructural factors as determinants of ecological impact caused by mobility behavior. Journal of Environmental Psychology, 27(4), 277-292
i-Travel (2008). WP2: Requirements Documentation - Use cases, traveller and suppliers requirements. Available online at: http://i-travel.odeum.com/download/wp2/itravel_wp2.pdf, accessed 12 Nov., 2009.
Jakobsson, C., Fujii, S., and Gärling, T. (2002). Effects of economic disincentives on private car use. Transportation, 29, 349-370.
Jones, E., and Niemeier, J. (2009). The Quality of Online Carbon Calculators: So you want to calculate your footprint? Transportation Research Board Annual Meeting 2009, Washington, Jan 2009.
Kahneman, D. and Tversky, A. (1979). Prospect theory: An analysis of decision under risk. Econometrica, 47(2), 263-291.
Kaiser, F., Schultz, P., Berenguer, J., Corral-Verdugo, V., and Tankha, G. (2008). Extending planned environmentalism: Anticipated guilt and embarrassment across cultures. European Psychologist, 13(4), 288-297.
Katzev, R. and Wang, T. (1994). Can commitment change behavior? A case study of environmental actions. Journal of Social Behavior and Personality. 9(1), 13-26.
Kaufmann, V. (2000). Modal Practices: From the rationales behind car and public transport use to coherent transport policies: Case studies in France and Switzerland. World Transport Policy and Practice, 6(4).
Kearney, A.R. and De Young, R. (1995). A knowledge-based intervention for promoting carpooling. Environment and Behavior, 27(5), 650-678.
Lyons, G., Avineri, E., Farag, S., and Harman, S. (2007). Strategic Review of Travel Information Brief, Department for Transport final report, Available online at: http://www.transport.uwe.ac.uk/research/projects/srti%20-%20final%20report.pdf, accessed 25 Sept 2009.
Madrian, B. and Shea, D. (2001). The power of suggestion: Inertia in 401(k) participation and saving behaviour. Quarterly Journal of Economics, 116, 1149-1525.
Maio, G.R., Verplanken, B., Manstead, A.S.R., Stroebe, W., Abraham, C.S., Sheeran, P., and Conner, M. (2007). Social Psychological Factors in Lifestyle Change and Their Relevance to Social Policy. Social Issues and Policy Review, 1, 99-138.
Marell, A., Davidsson, P. and Gärling, T. (1995). Environmentally friendly replacement of automobiles. Journal of Economic Psychology, 16(3), 513-529.
MAX-SUCCESS (2008a). Review of theory-based intervention studies. Available online at: http://www.max-success.eu/downloads/WPB_TF2_Reviewoftheory-basedinterventionstudies.pdf, accessed 12 Nov., 2009.
MAX-SUCCESS (2008b). Comprehensive State of the Art Report, Annex B1.1, Behaviour Change Models. Available online at: http://www.max-success.eu/downloads/MAX_SoA_AnnexB1_1.pdf, accessed 12 Nov. 2009.
McKenzie-Mohr, D. (2009). Fostering Sustainable Behavior: Community-Based Social Marketing. Available online at: http://www.cbsm.com/public/images/FosteringSustainableBehavior.pdf, accessed 5 Oct. 2009.
5/02/10 81 University of the West of England, Bristol
Behavioural Inception Report Final Version 1.0
Meyer, J.A. and Weeks, J.L. (2009) Communicating Transportation, Energy, and Climate Change Concepts to the Public. TR News, 264, September-October, 2009.
Möser, G. and Bamberg, S. (2008). The effectiveness of soft transport policy measures: A critical assessment and meta-analysis of empirical evidence. Journal of Environmental Psychology, 28(1), 10-26.
MRC Maclean Hazel (2009). Northamptonshire Modal Shift Demonstration Project: Report 4: Summary. Northamptonshire County Council and Department for Transport, April 2009.
Nilsson, A., von Borgstede, C., and Biel, A. (2004). Willingness to accept climate change strategies: The effect of values and norms. Journal of Environmental Psychology, 24(3), 267-277.
Nordlund, A., and Garvill, J. (2003). Effects of values, problem awareness, and personal norm on willingness to reduce personal car use. Journal of Environmental Psychology, 23(4), 339-347.
Nye, M. and Burgess, J. (2008). Making a difference? Evidence and explanations for durable proenvironmental behaviour change from Global Action Plan-UK’s EcoTeam programme. Environment and Planning A [in press].
Padgett, J.P., Steinemannb, A.C., Clarke, J.H., and Vandenbergh, M.P. (2008). A comparison of carbon calculators. Environmental Impact Assessment Review, 28, 106–115.
Pallonen, U.E., Prochaska, J.O., Velicer, W.F., Prokhorov, A.V., and Smith, N.F. (1998). Stages of acquisition and cessation for adolescent smoking: An empirical integration. Addictive Behaviors, 23(3), 303-324.
Parker, J., Harris, L., Chatterjee, K., Armitage, R., Cleary, J., and Goodwin, P. (2007). Making Personal Travel Planning Work: Research Report, Department for Transport, London. Available online at: www.dft.gov.uk/pgr/sustainable/travelplans/ptp/, accessed 21 November, 2009.
Polydoropoulou A. and Ben-Akiva, M. (1998). The effect of Advanced Traveller Information Systems (ATIS) on travellers’ behaviour, in Emmerink, R. and Nijkamp, P. (Eds.), Behavioural and Network Impacts of Driver Information Systems, Chapter 14, pages 317-352, Ashgate.
Prochaska, J.O. and Norcross, J.C. (2001). Stages of change. Psychotherapy, 38(4), 443-448.
Rogers, E.M. (2003). Diffusion of Innovations (5th ed.). New York: Free Press.Rothstein, R.N. (1980). Television feedback used to modify gasoline consumption. Behavior
Therapy, 11(5), 683-688.Sakauye, B. (2004). Towards an Idle-Free Zone in the City of Mississauga. Available online
at: http://www.tc.gc.ca/Programs/environment/utsp/docs/casestudiespdf/cs08e_idlefreezone.pdf, accessed 12 Nov. 2009.
Samuelson, W. and Zechhauser, R. (1988). Status quo bias in decision making. Journal of Risk and Uncertainty, 1, 7-59.
Salis, S. (2009). A web application as a decision support system for Mobility Management: a case study in Sardinia (Italy). 16th ITS world Congress Stockholm 2009, 21-25th September 2009.
Schultz, P., Gouveia, V., Cameron, L., Tankha, G., Schmuck, P., and Franëk, M. (2005). Values and their relationship to environmental concern and conservation behavior. Journal of Cross-Cultural Psychology, 36(4), 457-475.
Schultz, P.W., Nolan, J.M., Cialdini, R.B., Goldstein, N.J., and Griskecius, V. (2007). The constructive, destructive and reconstructive power of social norms. Psychological Science, 18, 429-434.
5/02/10 82 University of the West of England, Bristol
Behavioural Inception Report Final Version 1.0
SMILE (2006). CIVITAS SMILE - Newsletter No 2. Available online at: http://www.civitas-initiative.org/docs/CIVITAS%20SMILE%20-%20Newsletter%20No%201.pdf, accessed 12 Nov. 2009.
Staats, H., Harland, P., and Wilke, H.A.M. (2004). Effecting durable change: A Team approach to improve environmental behavior in the household. Environment and Behavior, 36(3), 341-367.
Swim, J., Clayton, S., Doherty, T., Gifford, R., Howard, G., Reser, J., Stern, P., and Weber, E. (2009). Psychology and Global Climate Change: Addressing a Multi-faceted Phenomenon and Set of Challenges. A Report by the American Psychological Association’s Task Force on the Interface between Psychology and Global Climate Change. Available online at: http://www.apa.org/science, accessed 12 Nov. 2009.
Tan, Y.B. (2009). Persuasive Technology in Motivating Household Energy Conservation. In: Florian, M. (Ed.), Business Aspects of the Internet of things, Seminar of Advanced Topics, ETH Zurich, FS2009,
TAPESTRY (2003a). TAPESTRY Deliverable 6 –Results and Recommendations Part 1: Overview. Available online at: http://www.max-success.eu/tapestry/www.eu-tapestry.org/p_dwl/d6/D6_3.pdf, accessed 16 Sept. 2009.
TAPESTRY (2003b). Interactive Marketing of Rural Buses. Available online at: http://www.max-success .eu/tapestry/www.eu-tapestry.org/p_dwl/csr/csr_c12_uk.pdf , accessed 12 Nov. 2009.
TAPESTRY (2003c). Viernheim Household Transport. Available online at: http://www.max-success .eu/tapestry/www.eu-tapestry.org/p_dwl/csr/csr_c6_germany.pdf , accessed 12 Nov. 2009.
TAPESTRY (2003d). Park and Share. Available online at: http://www.max-success.eu/tapestry/www.eu-tapestry.org/p_dwl/csr/csr_c10_n_ireland.pdf, accessed 12 Nov. 2009.
Tertoolen, G., van Kreveld, D. and Verstraten, B. (1998). Psychological resistance against attempts to reduce private car use. Transportation Research A, 32(3), 171-181.
Thaler, R. and Sunstein, C.R. (2008). Nudge: Improving Decisions about Health, Wealth and Happiness. New Haven, CT: Yale University Press.
Thaler, R.H. and Benartzi, S. (2000). Save More Tomorrow: Using Behavioral Economics to Increase Employee Saving. Mimeo, University of Chicago.
Thogersen, J. (2004). A cognitive dissonance interpretation of consistencies and inconsistencies in environmentally responsible behavior. Journal of Environmental Psychology, 24(1), 93-103.
Thogersen, J. (2006). Norms for environmentally responsible behaviour: An extended taxonomy. Journal of Environmental Psychology, 26(4), 247-261.
Thogersen, J. (2008). Social norms and cooperation in real-life social dilemmas. Journal of Economic Psychology, 29(4), 458-472.
Thogersen, J. and Ölander, F. (2003). Spillover of environment-friendly consumer behaviour. Journal of Environmental Psychology, 23(3), 225-236.
Thompson, C. (2007). Clive Thompson thinks: Desktop orb could reform energy hogs. Wired Magazine, 15(8).
Toledo, T., Musicant, O., and Lotan, T. (2008). In-vehicle data recorders for monitoring and feedback on drivers’ behavior. Transportation Research C, 16, 320-331.
Tools of Change, http://www.toolsofchange.com/en/home/, last accessed 12 Nov. 2009.Transport Research Knowledge Centre (2009). eMOTION. Available online at:
http://www.transport-research.info/web/projects/project_details.cfm?id=10982, accessed 12 Nov. 2009.
5/02/10 83 University of the West of England, Bristol

Behavioural Inception Report Final Version 1.0
Tyler, S. and Cook, A. (2004). Measuring the effectiveness of campaigns: Lessons for mobility management from the EU TAPESTRY project. ECOMM 2004, Lyon, France, 5-7 May, 2004.
Van Vugt, M., Van Lange, P.M., and Meertens, R.M. (1996). Commuting by car or public transportation? A social dilemma analysis of travel mode judgements. European Journal of Social Psychology, 26, 373-395.
VARK (2006). A Guide to Learning Styles. Available online at: http://www.vark-learn.com/english/index.asp, last accessed 12 Nov. 2009.
Wallace, A.A. (2009). Reducing Carbon Emissions by Households: The Effects of Footprinting and Personal Allowances. PhD thesis submitted to Institute of Energy and Sustainable Development, De Montfort University, Leicester, May, 2009.
Waygood, E.O.D. (2009). What is the role of mothers in Transit-Oriented Development? The case of Osaka-Kyoto-Kobe. Transportation Research Board's 4th International Conference on Women's Issues, Irvine, Ca, Oct. 27-30, 2009.
Weber, R.J. (1980). Energy conservation and feedback metering for the automobile: Ideal requirements. Bulletin of the Psychonomic Society, 16(4), 301-302.
Whitmarsh, L. (2009). Behavioural responses to climate change: Asymmetry of intentions and impacts. Journal of Environmental Psychology, 29(1), 13-23.
WISETRIP (2008). Report on the Analysis of Requirements. Available online at: http://srvweb01.softeco.it/Wisetrip/_Rainbow/Documents/WISETRIP_D2.1_V1f.pdf, accessed 12 Nov. 2009.
5/02/10 84 University of the West of England, Bristol

Behavioural Inception Report Final Version 1.0
12APPENDIX A: Projects Related to Reducing Car UseTable 12-3 Examples of projects related to reducing car use
Author(s), year Influences Target Result
Bachman and Katzev, 1982
Free bus ticket, personal commitment, information on routes and schedules.
PT bus use Commitment to ride (2/wk), unlimited free tickets, or combination of those two increased PT use vs only information on routes and schedules
Bamberg and Schmidt, 2003
Incentives, morality, habit Car use TPB, role beliefs -> intention to use car; car use habit, TPB -> car use; personal norm not significant.
Bamberg et al., 2007
Social context, personal norms, attitude, perceived behavioural control
Use of public transport (PT)
Personal norm -> PT use; feelings of guilt and perceived social norms -> personal norm
Brown et al., 2003
Personal and contextual factors
Switch to PT Enjoyment of productive and pleasant activities -> psychological satisfaction -> PT use maintained; information -> beliefs -> view that LRT enhance city livability -> PT use maintained
Cameron et al., 1998
Social value orientations Decision to take pro-environmental action
Prosocial (+), proself (-) -> support for car trip reduction
Carrus et al., 2008
Attitudes, subjective norms, perceived control, anticipated emotions, past behaviour and desire. Model of goal-directed behaviour used.
Pro-environmental behavioural intention
Negative anticipated emotions and past behaviour -> desire; Desire and past behaviour -> intention
Cooper, 2007 Community-based social marketing ( neighbourhood outreach, incentives to drive less, awareness of travel options, break habit)
Travel mode choice PT increase (20-50%) supported by overall transit ridership numbers; decrease in single occupancy vehicles (24-49%)
Fujii and Gärling 2003
Forced change (temporary road closure)
Development of script-based travel mode choice
Used PT more (+) -> script-based travel mode choice
Gatersleben and Uzzell, 2007
Affective appraisals Daily commute Car commuters more stressful than others, walking and cycling most relaxing and exciting, bus users may be more bored than stressed.
Haustein and Hunecke, 2007
Perceived mobility necessities (PMN; extended version of TPB)
Environmentally friendly mode use
PMN had negative impact
Hunecke et al. 2007
Psychological, sociodemographic, and infrastructure
Ecological impact of travel
Psychological factors most, socio-demographic 2nd, infrastructure 3rd
Hunecke et al., 2001
Ecological norm orientation, external factors (fare and
Travel mode choice Fare, personal ecological norm (strongest) –> travel mode choice;
5/02/10 85 University of the West of England, Bristol

Behavioural Inception Report Final Version 1.0
distance to subway) economy + moral (in Germany)
Kaiser et al., 2008
Planned behaviour theory, four different cultures (high vs. low individualism, English vs. Spanish-speaking), anticipated feelings of guilt
Behavioural intention Anticipated embarrassment had the same effect as guilt across all four cultures.
Katzev and Wang, 1994
Commitment Resource conservation
Behaviour change, maintenance of change
Marell et al., 1995
Aspiration, current quality of car
Environmentally friendly replacement of automobiles
Aspiration level, current quality of car -> replacement purchase intention
Matthies et al., 2006
Gift (free PT ticket), commitment plea
Try taking PT for habitual car users
Moral motivation -> travel mode choice; change situation and have commitment -> moral motivation change
Möser and Bamberg 2008
Soft transport policy measures meta-analysis
Reduce private car use
Increase in the no-car use proportion from 39% to 46%.
Nilsson et al., 2004
Values, organizational goals, norms
Willingness to accept climate change policy measures
In public sector (+) -> environmental values; not in private sector
Nordlund and Garvill, 2003
Values, problem awareness, personal norm
Willingness to reduce car use
Values -> problem awareness -> personal norms; values -> personal norms; personal norms -> willingness
Rothstein, 1980 TV news feedback on region gasoline consumption
Reducing gasoline consumption
Mass audience reduced 31.5%.
Sakauye, 2004 Advertisements on newspaper, bus tail, bus shelter, radio, posters; asked drivers to put small decal to indicate commitment to stop idling
Stop idling 3-4 times more likely not to idle vs control.
Schultz et al., 2005
Values of self-transcendence, values of self-enhancement
Concern for environmental problems
Values of self-transcendence (+), values of self-enhancement (-)
Staats et al., 2004
Information, feedback, social interaction in a group
Transport mode Behavioural intention, past habitual performance, degree of social influence
Tertoolen et al., 1998
Psychological resistance Reduce private car use
Information, commitment, feedback on finances -> NO effect on car use; feedback on finances -> OPPOSITE to expected effect on attitudes to car use
Thogersen and Ölander, 2003
Spillover of environmentally-friendly behaviour (EFB)
Other EFBs Seldom and modest in size; performance of an EFB reduced propensity in other EFB areas
Vugt et al., 1996 Immediate self-interest, long-term collective interest context; travel time, reliability, pro-social, proself
PT or car preference Combination of two: less travel time, reliability, pro-social -> PT preference; prosocial (+), proself (-) -> PT preference
5/02/10 86 University of the West of England, Bristol
Behavioural Inception Report Final Version 1.0
13APPENDIX B: Framing and “Loss Aversion” – An Example of a ‘Nudge’ in a Travel Behaviour Context
People tend to feel and behave differently when information is presented (or ‘framed’) in terms of gains or losses. The emotion of loss is stronger than that of gain. Roughly speaking, losing £100 produces a negative emotion twice as intense as the positive feeling experienced when gaining £100. Studies bring evidence that travellers exhibit aversion to loss and have a strong tendency to avoid choices associated with losses.
The framing of choice outcomes as gains or losses could be applied as a nudge to encourage travellers towards a specific choice. Figure 13-1 illustrates three ways of presenting the same information on the journey time of two options: car and cycle commuting.
Figure 13-4 Framing effects: Three ways of presenting travel time information(from Avineri, 2009a)
Under the rational choice model, the format of the information should not matter. The information presented by all three formats is of the same content; it is the difference in how it is presented that could influence the choice – in a way that cannot be explained or predicted by classical economics.
It is difficult to predict how ‘unframed’ information on the options (alternative A) will be interpreted and used by the traveller. Framing cycling as a choice that carries possible gain with it (as illustrated in alternative B), or the even stronger nudge illustrated in alternative C (in which the choice of commuting by car is framed as a loss), are ways to make cycling appear more attractive than the alternative. None of the information formats impose a restriction of the travel options for the traveller. However, he or she is encouraged or ‘nudged’ to choose the option which is considered to be preferable.
5/02/10 87 University of the West of England, Bristol
Behavioural Inception Report Final Version 1.0
14APPENDIX C: Reviewed Carbon Calculators and Travel Planners
CARBON CALCULATORS
Airhead/CNT http://airhead.cnt.org/Calculator/
American Forests www.americanforests.org/resources/ccc
An Inconvenient Truth
http://www.climatecrisis.net/takeaction/carboncalculator/
Atmosfair http://www.atmosfair.de
Be Green www.begreennow.com/calculator
BEF/Green Tags www.greentagsusa.org/greentags/calculator
Best Foot Forward http://www.envirowise.gov.uk/uk/Our-Services/Tools/Envirowise-Indicator.249257.html
BIE Cool Climate Calculator
coolclimate.berkeley.edu
BP http://www.bp.com/iframe.do?categoryId=9027929andcontentId=7050956
Carbon Account http://www.thecarbonaccount.com/
Carbon Calculator http://www.carboncalculator.com/
Carbon Calculator http://www.carboncalculator.co.uk/calculator.php
Carbon Calculators http://www.jpmorganclimatecare.com/
Carbon Footprint http://www.carbonfootprint.com/calculator.aspx
Carbon footprint calculator
http://www.thec-changetrust.org/calculators/
Carbon Footprinting http://www.carbon-clear.com/calculators.php
Carbon Fund www.carbonfund.org/site/pages/individuals/category/Carbon%20Calculators/
Carbon Indepedendent
http://www.carbonindependent.org/
Carbon Neutral (Carbono Neutro)
http://www.carbononeutro.com.br/03_calcule/calcule.htm
Carbon Neutral Calculators
http://www.carbonneutral.com/calculators/index_shop_calculator.asp
Carbon Trust (advertised)
http://www.carbontrust.co.uk/solutions/CarbonFootprinting/FootprintCalculators
CarbonLife CO2 Lifestyle Calculator
http://www.bestfootforward.com/carbonlife.htm
Chuck Wright www.chuck-wright.com/calculators/carbon.html
Climate Neutral Group
www.climateneutralgroup.com/Default.aspx
5/02/10 88 University of the West of England, Bristol

Behavioural Inception Report Final Version 1.0
Cloud Amber Carbon Calculator
http://www.carboncalculator.info/
CO2 Calculator http://www.nef.org.uk/energyadvice/co2calculator.htm
Cool The World http://www.cooltheworld.co.uk/carbon_calculator.php?gclid=CMzm6pST4pwCFd4B4wodpFG-LA
Countdown. http://www.carboncoach.com/countdown_01.html
DirectGov Act on CO2 Calculator
http://actonco2.direct.gov.uk/index.html
Earth Lab www.earthlab.com/ecp.aspx
Ecological footprint http://www.ecologicalfootprint.com/
Ecopassenger http://www.ecopassenger.org/
Envido http://www.envido.co.uk/what-we-do/opportunity/business-carbon-calculator
environmental Defense Fund
www.fightglobalwarming.com/carboncalculator.cfm
EPA Pesonal Emissions Calculator
www.epa.gov/climatechange/emissions/ind_calculator.html
Fuel Economy www.fueleconomoy.gov/feg/findacar.html
Future Forests (Florestas do Futuro)
http://www.florestasdofuturo.org.br/paginas/home.php?pg=calculadora/index
Google UK footprint http://www.google.co.uk/carbonfootprint/
Green Initiative (Iniciativa Verde)
http://iniciativaverde.org.br/pt/calculadora#reduza_seu_co2
Hybrid Cars Gas Mileage Impact Calculator
www.hypridcars.com/calculator/index.php
Imeasure http://www.imeasure.org.uk/
Infinite Power www.infinitepower.org/calc_carbon.htm
KEYASSOCIADOS – Sustainable Solutions (KEYASSOCIADOS – Soluções Sustentáveis)
http://www.keyassociados.com.br/en-us/calculadora_carbono.php
Landcare Research http://www.carbonzero.co.nz/EmissionsCalc/login.aspx
Low Impact Living www.lowimpactliving.com/projects/checklist
Makemesustainable
http://makemesustainable.com
My Climate http://www.myclimate.org/
Native Energy www.nativeenergy.com/pages/carbon_footprint_calculator/41.php
Norge 2020 http://www.nrk.no/norge2020/
Personal Stepwise http://www.bestfootforward.com/carboncalc.htm
5/02/10 89 University of the West of England, Bristol

Behavioural Inception Report Final Version 1.0
Resurgence House Energy Calculator
http://www.resurgence.org/carboncalculator/
SafeClimate Calculator
http://www.safeclimate.net/calculator/
Sustainable Travel International
http://www.sustainabletravelinternational.org/offset/index.php?c=1andgclid=CMX5oO6S4pwCFc0B4wodyDtJIg
Terrapass vehicle carbon calculator
http://www.terrapass.com/ford/index.html
The Carbon Diet http://www.carbondiet.org
The Clearwater Carbon Calculator
http://www.clearwater.org/carbon.html
The Conservation Fund
https://gozero.conservationfund.org/calc/household
The Edge Pledge spreadsheet
http://www.at-the-edge.org.uk/edgepledge/edgepledge.htm
The Nature Conservancy
www.nature.org/initiatives/climate change/calculator
The Water and Carbon Project's (Projeto Carbono e Água)
http://www.projetocarbonoeagua.com.br/carbonoeagua/pt/index.php?acesso=cadCalculadora.php
Travel Footprint http://www.travelfootprint.org/?gclid=CLPE_8GS4pwCFd4B4wodpFG-LA
Travel Matters www.travelmatters.org/calculator/individual
Urban Transportation Emission Calculator
http://wwwapps.tc.gc.ca/prog/2/UTEC-CETU/Menu.aspx?lang=eng
WWF Footprint Calculator
http://footprint.wwf.org.uk/
Yahoo! Green http://green.yahoo.com/calculator/
Your Journey Emissions Calculator
http://www.chooseclimate.org/index.html
Zero Footprint One Minute Caculator
http://earthhour.zerofootprint.net/
Zero Footprint Personal Carbon Manager
www.zerofootprint.net/profile
JOURNEY PLANNERS
“5T” project http://www.5t.torino.it/
Transport Info (NSW government)
131500.info/realtime/newjourney.asp
Adelaide Metro adelaidemetro.biz/planner.php
Ekitan ekitan.com
5/02/10 90 University of the West of England, Bristol
Behavioural Inception Report Final Version 1.0
Transport for London Journey Planner
http://journeyplanner.tfl.gov.uk/user/XSLT_TRIP_REQUEST2?language=en
Personal Travel Assistant (seoul)
http://TOPIS.seoul.go.kr/pta/.
yahoo.co.jp http://transit.map.yahoo.co.jp/
Translink (Vancouver)
http://tripplanning.translink.ca/hiwire?.a=iTripPlanningand.s={$SID}
Transport portal of City of Rome
http://www.atac.roma.it/
travelfootprint.org http://www.travelfootprint.org/journey_emissions/
Translink (Vancouver)
jp.transinfo.qld.gov.au
Metlink (Melbourne) metlinkmelbourne.com.au
Transperth transperth.wa.gov.au
Brighton and Hove City Council "Journey On"
www.journeyon.co.uk
Rakunabi (Kyoto navigation)
www.kyoto-rakunavi.jp
Mapion www.mapion.co.jp
The Train Line www.thetrainline.com
Transport Direct www.transportdirect.info
OTHER
Hoje não vou de carro (Today, I will not go by car)
http://www.naovoudecarro.com.br/
Walkit.com http://www.walkit.com
World commute www.worldcommute.com
5/02/10 91 University of the West of England, Bristol
Behavioural Inception Report Final Version 1.0
15APPENDIX D: Segmentation ReviewSegmentation is a process of analysing the population to separate into distinct groups related to some chosen metrics. It is a technique that is used frequently in marketing to target its advertising appropriately. In travel behaviour it has been used recently to separate populations based on attitudes and values. The resulting groups are then analyzed for their ability to predict mode use.
Six studies were identified (Anable, 2008; Anable, 2005; Beirao and Sarsfield, 2008; Cools et al., 2009; Hunecke et al., 2008; Kaufmann, 2000) from the UK, Portugal, Belgium, Germany, and France and Switzerland. The techniques and sample sizes varied across countries, but there were similarities in the resulting groups (if not the percentage of the population that was associated with each group). The studies typically had four to six distinct groups, depending on technique and sample size. Those groups were then arranged into related groups (Table 15-1).
Looking at Table 15-1, there are groups who are restricted by structural factors (both towards greater car use and against), and others whose attitudes play a strong role. The “I love my car” group have attitudes that lead them to use cars as much as possible, where as the “altruism” group have attitudes that lead them to use cars as little as possible. The next three groups are likely more restricted by structural factors such as car-dependent infrastructure or lack of financial means if the desire is to use cars more.
Table 15-4: Sorting segmentation groups from various countries in the European Union
General Name Name from Study (Country*) Associated attitudes/values
I love my carDie-Hard Drivers (UK); Obstinate Drivers (P); Car-preference (B); PT-rejecters (G); Exclusive motorists (F, S)
Psychologically attached to car; rarely to never use PT; low view of PT
AltruismCar-less crusaders (UK); Transit enthusiasts (P); Positive perception of PT (B); Eco-sensitized PT users (G); Civic ecologists (F,S)
Consider environment; environmental concerns > quality of mode
I wish I could use a car (more)
Reluctant riders (UK); Frugal travellers and Anxious Status Seekers (P); PT users (B); None (G); Motorists constrained to PT (F, S)
Using PT, but would prefer to use private motor if option available or conditions for it were better (e.g. Congestion, parking)
I wish I had options other than a car
Malcontent motorists (UK); Green Cruisers and Anxious Status Seekers (P); Car-dependent (B); Car Individualists (G); None (F,S)
Open to change; feel that are no alternatives to current state; may be stressed by car
Low car use is goodAspiring Environmentalists (UK); Green Cruisers and Anxious Status Seekers (P); Positive Perception of PT (B); Eco-sensitized PT (G); Civic ecologists (F,S)
Consider environment; high use of PT without dependence
Followers?Complacent car addicts (UK); PT users (B); Car individualists (G); Motorists or want-to-be motorists (F); Open (S)
Not much thought put into travel, just use what is normal, available.
* UK – United Kingdom; P – Portugal; B – Belgium; G – Germany; F – France; S – Switzerland
5/02/10 92 University of the West of England, Bristol

Behavioural Inception Report Final Version 1.0
Once segmentation has occurred, appropriate techniques should be applied to move individuals along the psychological model to more desirable mode choices. In combination with those individual changes, infrastructure and policy changes to reduce physical and financial barriers should be addressed.
5/02/10 93 University of the West of England, Bristol
Behavioural Inception Report Final Version 1.0
16APPENDIX E: Examples of Mobility Management16.1 DREAMS ProjectAn interesting web based tool for mobility managers is the DREAMS platform (Demand Responsive Extended Area Mobility Services), financed by the Italian Environment Ministry and the municipality of Milan in 2005 (web site: www.milanodreams.it). The project’s main goal is to develop a web-based integrated information and management system for traditional and innovative mobility services in urban areas. The direct objective of the system is to enable single citizens or groups of citizens to organize their trips using modes different from the private car, also in areas which are not intensively served by the public transportation service.
DREAMS connects with (or directly manages) a set of traditional transportation services, such as the municipal taxi system, the parking system, the local public transportation, and a set of innovative mobility services, such as dial-a-ride, car pooling, and car sharing services. The objective of the system is to test and to promote mobility management measures, which represent an important component of sustainable transportation strategies. Mobility management measures are generally “soft” measures that do not require new infrastructures but try to shift the users’ modal choice from the private car to more sustainable modes making use of techniques based on information, communication, coordination, and organization.
The role of DREAMS is to connect the demand side and the supply side in passenger urban transportation. The core of the system is the travel planner module, which, like a travel agency (1) receives the requests of the users, (2) looks into the available transportation services, (3) proposes a set of travel solutions taking into account the users’ preferences.
DREAMS manages the following profiles of users:
1. Citizen: a single citizen or an organized group of citizens that needs to make a trip and wants to know the available travel solutions and their expected travel times.
2. Mobility Manager: the Company Mobility Manager (CMM) and the Area Mobility Manager (AMM) are figures instituted by the Italian law. The CMM designs the company transportation plan for the homework employees’ trips; the AMM organizes the mobility management initiatives at municipal or provincial levels. In the car pooling software, the AMM of the city of Milan can identify some CMMs that have access to DREAMS and experiment the car pooling in their companies.
3. Dial a ride companies: the municipality of Milan can identify some transportation companies that can experiment the dial a ride software in some areas where the transportation demand is sparse.
The car pooling problem is to match the available drivers with car and the potential passengers, and to identify the routes to be driven in order to minimize the economic and environmental costs, subject to users’ time windows and car capacity constraints. The web based software tool focuses on the reliability of the overall system: 1) the users are provided with the expected schedule for their trip and they are informed immediately in case of delay or changes; 2) the use of the system is restricted to the employees of given companies. Using the DREAMS tool, the AMM coordinates the CMMs of the single companies, fixing the general rules of the car pooling service. The CMMs of the single companies manage the employees’ accounts and adapt the general rules to the specific situations of the companies. Each employee can define his/her car pooling preferences with the following information: 1) origin and destination of the trip, 2) the set of days when he/she is willing to carpool, 3) the earliest departure time and the latest arrival time, 4) the maximum travel time, and 5) the availability of the car.
5/02/10 94 University of the West of England, Bristol
Behavioural Inception Report Final Version 1.0
The web based software to plan and manage a dial-a-ride service is able to manage:
an off-line as well as on-line passenger demand;
several transportation companies, with different quality of service levels;
numerous territorial areas;
different categories of users (students, disabled, elderly,...).
The software communicates with the vehicles via cell phone technology (GSM/SMS, GPRS) and controls the pickup and the delivery of the customers in real time. The software is able to respond to the possible delays, due for example to traffic congestion, reassigning the customers to other vehicles. The transportation companies manage online their fleet, for instance having access to the real time situation, and modifying the buses’ compositions and schedules. In the travel planner module (see fig. 16-1), the user defines the origin, the destination, the date, and the time of the trip. The travel planner calculates the travel time and the cost of the transportation services available in the area and time requested by the user, showing also the travel time, cost and route of the car mode.
Figure 16-5 DREAMS travel planner module (from Colorni et al., 2005)
16.2 ATAC (Rome) web based toolAnother WEB based tool for mobility managers have been designed by ATAC (Public Transport Company) of ROME through the MIRACLES framework (http://www.civitas-initiative.org/), in order to support the MM in the preparation of Home to Work Trip Plans by a restricted access to internal pages of sustainable mobility in the ATAC web site. Mobility managers can submit their best practice examples, take part in thematic forums, use the available databases and download files, presentations and useful information. Home-to-Work Trip Plans have been implemented by the Origin/Destination (O/D) matrix of employees, provided by the mobility managers. Several surveys have been carried out, with specific attention on employees from the City Council, the Polyclinic Umberto I, and the University La Sapienza. A cross-evaluation with results achieved and experiences gained in other European cities, via the MOST methodology, was used to fine tune sustainable mobility strategies. Company and area bus lines have been set up and a pilot Car Pooling Project is
5/02/10 95 University of the West of England, Bristol

Behavioural Inception Report Final Version 1.0
now operative. It involves 750 users, running for major destinations (University, Polyclinic, Ministry of Public Health) with standard facilities (such as free parking).
16.3 Other experiencesIn the Nordic European Countries, many programs have been carried out to promote mobility management concepts. In Sweden Mobility Management services are often provided by a local traffic office (Trafikkontor), developed for Gothenburg and Lund. One of the largest Danish Mobility Management related projects, “The Bike Busters Århus”, was introduced as early as 1995. The commuter oriented “Pendlerkontor” in Copenhagen was established in 2002 in order to provide transport planning services to companies and public organizations. The SMART project in Norway activated several companies to carry out Mobility Management schemes in the Oslo area. In Finland a variety of local projects has been carried out and the interest in Mobility Management is growing rapidly. The Nordic Countries share a range of common features that motivate future co-operation in the field of Mobility Management, leading along the path towards sustainable transport. The common programme foresees several web sites to link the experience and the experts; for instance the environmental organization “Green everyday” (Grønn Hverdag) has developed a web-based database (Haiketorget.no) for people looking for car rides and people offering rides, also for everyday commuting purposes; companies can register closed profiles where only employees of the same company can see ads for rides. An extensive resources on the web sites information about mobility management and transportation coordination in United States is shown in the following table.
Table 16-5 web sites information on mobility management in United States
Resource TopicWI Transportation A collaborative website between WRAPP (Wisconsin
Rural and Paratransit Providers), WURTA (Wisconsin Urban and Rural Transit Association) , WATO (Wisconsin Association of Cab Owners) and SMVAW (Specialized Medical Vehicle Association of Wisconsin)
Florida's Volunteers: The Driving Force for Senior Mobility
A publication of the Winter Park (Florida) Health Foundation
Coordinating Volunteer Transportation with Public and Human Services Transportation
Community Transportation Association of America (CTAA)
Employment Transportation Resources: Transportation Voucher Programs: Facilitating Mobility in Rural Areas
Voucher Program informationCTAA
Easter Seals Project ACTION Easter Seals Project ACTION (Accessible Community Transportation In Our Nation)
Expanding Mobility Options for Persons with Disabilities, A Practitioner’s Guide to Community-Based Transportation Planning
Community-based transportation planning guideEaster Seals Project ACTION publication
Transportation Services for People with Disabilities in Rural and Small Urban Communities
Transportation services for the disabled in rural communitiesEaster Seals Project ACTION publication
Improving Public Transportation Services through Effective Statewide Coordination
National Governors Association, Center for Best Practices
Handbook for Coordinating Transportation Services and the Guide for Implementing Coordinated Transportation Systems
Published by the Ohio Department of Transportation, Office of Transit
Impact Published by the Institute on Community Integration (UCEDD) Research and Training Center on
5/02/10 96 University of the West of England, Bristol
Behavioural Inception Report Final Version 1.0
Community LivingMobility Management, A toolkit for creating an organization culture and management structure conducive to mobility management
Seattle’s Leadership APTA Class of 2005 Members
Transit Cooperative Research Program (TCRP) Report 105: Strategies to Increase Coordination of Transportation Services for the Transportation Disadvantaged
Transit Cooperative Research Program (TCRP) Report 105
Transportation Coordination – Benefits and Barriers Exist, and Planning Efforts Progress Slowly
United States General Accounting Office (GAO) Report to Congressional Committees
United We Ride United We Ride is an interagency Federal national initiative that supports States and their localities in developing coordinated human service delivery systems. United We Ride provides State and local agencies a transportation-coordination and planning self-assessment tool, help along the way, technical assistance, and other resources to help their communities succeed.
Mobility Management Strategies United We RideTechnical Assistance and Training United We RideVolunteer Drivers United We RideBuilding the Fully Coordinated Human Service Transportation System
United We Ride Informational Resources
United We Ride Useful practices from other states: Click on “Useful Practices” in the
navigation bar (far left) Click on “Search Records” in the
navigation bar (top blue bar of the screen) In the Keywords field, type ‘Mobility
management’, then click on “search”Volunteer Drivers Guide – A Guide to Best Practices
Washington State Department of Transportation
5/02/10 97 University of the West of England, Bristol

Behavioural Inception Report Final Version 1.0
Finally, some web sites concerning mobility management policies are shown in the following table.
Table 17-6 web sites information on mobility management
CULTURA Mobility Management and Travel Awareness campaigns and measures from Europe and Latin America, arguments for decision makers and approaches and checklists in English, German, Spanish and Portuguese. www.mobility-cultura.net
EMOTIONS Marketing and awareness campaigns based on an emotional approach for clean urban transport. http://www.emotional-campaigns.net/
EPOMM EPOMM provides a platform for authorities, companies, users and other interested persons search and exchange of information in the field of Mobility Management tools, support, training, marketing in Mobility Management. http://www.epommweb.org/
GOAL Graz: Health promotion, noise and emission reduction through the promotion of alternative means of transport for the citizens personal well-being. Results from a demonstration project. http://www.goal-graz.at/
MOST Mobility Strategies for the next decades. MOST aims at developing and spreading Mobility Management in several ways. Available are a monitoring and evaluation toolkit, policy recommendations and a wide range of case studies for different fields of implementations like companies, mobility centres, site development, hospitals, temporary sites etc. http://mo.st/
PROVIDER Implementing European Online Services for Mobility Education to Save Energy http://www.schoolway.net/
SMASH Events Ecological event management http://www.smash-events.net STEP BY STEP Awareness campaigns for clean urban transport from Germany, Portugal,
Czech Republic, Austria, the United Kingdom, Lithuania, Poland and the Netherlands www.eu-stepbystep.net
TAPESTRY Travel awareness, publicity and education supporting a sustainable transport strategy in Europe. Tapestry provides guidelines, recommendation and assessment tools for campaign designers and also an overview over 16 case studies. http://www.eu-tapestry.org/
5/02/10 98 University of the West of England, Bristol