size-resolved aerosol composition at an urban and a rural site in the
TRANSCRIPT
Atmos Chem Phys 16 10879ndash10897 2016wwwatmos-chem-physnet16108792016doi105194acp-16-10879-2016copy Author(s) 2016 CC Attribution 30 License
Size-resolved aerosol composition at an urban and a rural site in thePo Valley in summertime implications for secondary aerosolformationSilvia Sandrini1 Dominik van Pinxteren2 Lara Giulianelli1 Hartmut Herrmann2 Laurent Poulain2Maria Cristina Facchini1 Stefania Gilardoni1 Matteo Rinaldi1 Marco Paglione1 Barbara J Turpin3Francesca Pollini1 Silvia Bucci45 Nicola Zanca1 and Stefano Decesari11Institute for Atmospheric Sciences and Climate (ISAC) National Research Council (CNR) Bologna 40129 Italy2Leibniz-Institut fuumlr Troposphaumlrenforschung (TROPOS) Leipzig 04318 Germany3Environmental Science and Engineering Gillings School of Global Public Health University of North Carolina at ChapelHill NC 27599-7431 USA4Institute for Atmospheric Sciences and Climate (ISAC) National Research Council (CNR) Rome 00133 Italy5Dept of Physics Ferrara University Ferrara 44121 Italy
Correspondence to Silvia Sandrini (ssandriniisaccnrit)
Received 21 December 2015 ndash Published in Atmos Chem Phys Discuss 1 March 2016Revised 20 July 2016 ndash Accepted 22 July 2016 ndash Published 1 September 2016
Abstract The aerosol size-segregated chemical composi-tion was analyzed at an urban (Bologna) and a rural (SanPietro Capofiume) site in the Po Valley Italy during Juneand July 2012 by ion-chromatography (major water-solubleions and organic acids) and evolved gas analysis (total andwater-soluble carbon) to investigate sources and mecha-nisms of secondary aerosol formation during the summerA significant enhancement of secondary organic and inor-ganic aerosol mass was observed under anticyclonic con-ditions with recirculation of planetary boundary layer airbut with substantial differences between the urban and therural site The data analysis including a principal compo-nent analysis (PCA) on the size-resolved dataset of chemi-cal concentrations indicated that the photochemical oxida-tion of inorganic and organic gaseous precursors was an im-portant mechanism of secondary aerosol formation at bothsites In addition at the rural site a second formation pro-cess explaining the largest fraction (22 ) of the total vari-ance was active at nighttime especially under stagnant con-ditions Nocturnal chemistry in the rural Po Valley was as-sociated with the formation of ammonium nitrate in largeaccumulation-mode (042ndash12 microm) aerosols favored by lo-cal thermodynamic conditions (higher relative humidity andlower temperature compared to the urban site) Nocturnalconcentrations of fine nitrate were in fact on average 5 times
higher at the rural site than in Bologna The water uptake bythis highly hygroscopic compound under high RH conditionsprovided the medium for increased nocturnal aerosol uptakeof water-soluble organic gases and possibly also for aque-ous chemistry as revealed by the shifting of peak concentra-tions of secondary compounds (water-soluble organic carbon(WSOC) and sulfate) toward the large accumulation mode(042ndash12 microm) Contrarily the diurnal production of WSOC(proxy for secondary organic aerosol) by photochemistry wassimilar at the two sites but mostly affected the small accumu-lation mode of particles (014ndash042 microm) in Bologna while ashift to larger accumulation mode was observed at the ruralsite A significant increment in carbonaceous aerosol concen-tration (for both WSOC and water-insoluble carbon) at theurban site was recorded mainly in the quasi-ultrafine frac-tion (size range 005ndash014 microm) indicating a direct influenceof traffic emissions on the mass concentrations of this rangeof particles
Published by Copernicus Publications on behalf of the European Geosciences Union
10880 S Sandrini et al Size-resolved aerosol composition at an urban and a rural site
1 Introduction
The knowledge of the size-segregated chemical compositionof atmospheric aerosols ie the chemical composition asa function of particle size is key to the understanding ofseveral important characteristics of particles such as opti-cal properties hygroscopicity and reactivity which affect theatmospheric radiation budget cloud formation and humanhealth Moreover the size distribution of inorganic and or-ganic components reflects their origin and hence provides awealth of information about aerosol formation mechanismsand atmospheric processing including secondary formation(Seinfeld and Pandis 1998)
Accumulation-mode particulate matter mostly originatesfrom aerosol accretion via gas-to-particle conversion ofoxidized vapors (Seinfeld and Pandis 1998) Howeveraccumulation-mode particles can be selectively scavengedby clouds and fogs which in absence of precipitation pro-duce chemically processed particles upon evaporation of wa-ter (Meng and Seinfeld 1994) The resulting size distribu-tion is bimodal with the small mode accounting for sec-ondary aerosols produced uniquely by gas-to-particle conver-sion (ldquocondensation moderdquo) and the large mode containingparticles that underwent cloud processing (ldquodroplet moderdquo)(Hering and Friedlander 1982 John et al 1990) There-fore knowledge about the concentrations of aerosol organicand inorganic compounds in size-segregated aerosol sam-ples provides information on the nature of secondary forma-tion processes Measurements of the size-segregated chem-ical composition of aerosols are traditionally performed us-ing multi-stage impactors followed by offline chemical anal-ysis Recently the development of online mass spectromet-ric techniques offered new opportunities for size-segregatedchemical observations with a much greater time resolutionwith respect to impactors (Jimenez et al 2003) Howeveraerosol mass spectrometers (AMSs) generally suffer frompoor sensitivity for thermally refractory compounds andcould not be deployed for the analysis of coarse particles(gt 25 microm) chemical composition Therefore multistage im-pactors are still unsurpassed in terms of the number of chemi-cal determinations that can be performed on the samples andthe range of particle sizes that can be probed An exampleof comparison of aerosol chemical measurements performedusing a five-stage impactor and AMS is provided by our pre-vious study focusing on the 2009 field campaign in the PoValley Italy (Decesari et al 2014)
The Po Valley is a region in Europe characterized by highlevels of pollution due to the concurrent high density ofanthropogenic sources and its orographic and meteorologi-cal characteristics particularly unfavorable for pollutant dis-persion In particular several studies have shown how thisarea is dominated by secondary material during the summer(Crosier et al 2007) with a large presence of secondary in-organic aerosol (SIA) On an annual average SIA accountsfor 40 of PM10 mass at the urban site of Bologna (Matta et
al 2003 Putaud et al 2010) while a 50 contribution hasbeen evaluated at the rural site of San Pietro Capofiume overshorter observation periods during winter and summer (Car-bone et al 2010) Crosier et al (2007) observed that mostof the time during the summer aerosol over the Po Valleywas composed of regional ammonium sulfate and organicmaterial while under anticyclonic conditions with recircu-lation of air over the region the composition was dominatedby ammonium nitrate close to ammonia emission sources
The present study focuses on the chemical size-resolvedcomposition of aerosol determined by two five-stage low-pressure Berner impactors during a field campaign per-formed in the summer 2012 in the Po Valley With respectto the previous campaigns in this area this is the first experi-ment where a two-site approach was used One-month inten-sive observations were performed at an urban site (BolognaBO) and at a nearby rural site (San Pietro Capofiume SPC)The goal of this paper is to provide insights into factorscontrolling the variability of aerosol composition and to ex-plore possible formation pathways of secondary compoundsin this region during the summer under different meteorolog-ical conditions and air-mass history The two-site approachwas adopted to estimate the contribution and composition ofrural background particles with respect to the urban contri-bution according to the Lenschow perspective (Lenschow etal 2001) based on the assumption that PM concentrationmeasured at an urban location is the result of the sum of re-gional background urban contribution given by the sourcesinside the agglomeration and road traffic for roadside sites
Source attribution was addressed through the analysis ofthe time series of the main aerosol species together withmeteorological parameters and by the statistical approach ofprincipal component analysis (PCA) applied to the differentsize classes as independent variables The study also takesinto account the comparison between an urban and a ruralsite to assess the impact of traffic and other urban sourceson the regional background to explore differences in sec-ondary aerosol formation resulting from different meteoro-logical conditions and to assess the regional and local vari-ability of secondary aerosol formation processes Finally thefact that sampling was performed separately during day andnight allowed analysis of the concentrations of aerosol con-stituents together with the dynamics of the boundary layer(Gietl et al 2008)
2 Experimental
21 Sampling sites
Size-segregated aerosol sampling was performed during thePEGASOS field campaign in the Po Valley (Italy) from12 June to 9 July 2012 at the urban site of BO (4429prime N1120prime E 54 m asl) and at the rural site of SPC (4439prime N1137prime E 11 m asl) 30 km northeast from the city of
Atmos Chem Phys 16 10879ndash10897 2016 wwwatmos-chem-physnet16108792016
S Sandrini et al Size-resolved aerosol composition at an urban and a rural site 10881
Bologna Both sites are located in the eastern part of the PoValley (Fig 1) Bologna is a city of 400 000 inhabitants themost populous in the southern Po Valley with a surround-ing area characterized by widespread agricultural and in-dustrial activities and by the presence of several high-trafficroads Sampling was performed in the northern outskirts ofBologna on the roof of the Institute of Atmospheric Sciencesand Climate of the National Research Council at about 20 mabove ground San Pietro Capofiume is a rural site charac-terized by a flat terrain and by croplands extending in alldirections and can be considered an ideal receptor site forregional-scale air pollution in the Po Valley In SPC aerosolsamplers were positioned on a platform at about 8 m aboveground level
The westndasheast orientation of the valley favors westerly oreasterly circulations hence from either the inner Po Valley(including Lombardy and Milan) or the Adriatic Sea In thepresence of SW winds SPC can be located downwind of BOand an influence from the urban area cannot be excludedUnder the same conditions a possible inflow of marine airfrom the Ligurian Sea is also possible
22 Aerosol sampling
Two five-stage Berner impactors (flow rate 80 L minminus1) with50 particle cut points at 014 042 12 35 and 10 micromaerodynamic diameter (Dp) were used at the two sites Theparticles were collected on aluminium and Tedlar foils Alu-minium foils for carbonaceous aerosol analysis were placedon each stage of the impactor with Tedlar half foils for ion-chromatographic analysis placed on top of them covering50 of the aluminium substrates (Matta et al 2003) A12 h time resolution was adopted for sampling one nighttimeand one daytime sample collected every day from 2100 to0900 LT and from 0900 to 2100 LT respectively Howeverit is worth noting that nocturnal sampling actually includedseveral hours of light from dawn (which in this period of theyear occurs at approximately 0530) to 0900
In order to evaluate the presence of sampling artifacts inthe Berner impactor sampling the size-integrated (PM12sum of the first three stages) impactor concentrations for sul-fate nitrate and ammonium were compared with those ob-tained by another offline system a high-volume Digitel PM1sampler and by integrated HR-ToF-AMS (PM lt 1) measure-ments See Sect S1 in the Supplement for a detailed discus-sion
23 Analytical measurements
The Tedlar substrates were extracted in 10 mL of mQ wa-ter for 30 min in an ultrasonic bath The extracts were ana-lyzed by ion chromatography for the quantification of water-soluble inorganic species and organic acids (acetate for-mate methanesulfonate (MSA) oxalate) A TOC analyzer(Shimadzu Japan) was used for the determination of water-
soluble organic carbon (WSOC) An aliquot of each samplewas analyzed for total carbon (TC) by combustion at 680 Cin the presence of a catalyst while another aliquot was acid-ified in a reaction vessel to determine IC which was decom-posed to CO2 In both cases the evolved CO2 was measuredby a nondispersive infrared gas analyzer (NDIR) and the or-ganic fraction (WSOC) was obtained by difference betweenTC and IC
Fractions of the aluminium foils were used for the quantifi-cation of TC by evolved gas analysis with a Multi NC2100analyzer (Analytik Jena Germany) equipped with a modulefor solid samples Portions of the aluminium foils were ex-posed to increasing temperature (up to 950 C) in pure oxy-gen carrier gas Under these conditions all carbonaceous mat-ter (organic carbonate and elemental carbon EC) is con-verted to CO2 (Gelencser et al 2000) and TC is measuredas total evolved CO2 by an NDIR analyzer
Aluminium foils in SPC were also used for the gravimet-ric determination of aerosol mass by weighing the substratesbefore and after sampling on a UMT-2 microbalance with areading precision of 01 microg and a standard deviation of ca1
24 Back-trajectory calculation
Air-mass back trajectories are a useful tool when studyingthe aerosol composition as a function of the air-mass historyFor every hour during each sampling interval (12 h duringnight and 12 h during day) 96 h back trajectories arriving at500 m agl were calculated by the HYSPLIT model (HY-brid Single-Particle Lagrangian Integrated Trajectory ver-sion 4) (Draxler and Rolph 2003) in the ensemble modeusing input field from the global 1 GDAS archive (httpwwwarlnoaagovsstransportarchiveshtml) Ensembles of27 trajectories for a given starting time for all possible offsetsin X Y and Z dimensions (ca 250 m offset in Z one grid celloffset in X and Y ) were calculated for every hour resultingin a total of 324 trajectories describing the air-mass history ofeach 12 h sample In addition to the endpoints of the trajec-tories other HYSPLIT output parameters (sun flux mixinglayer depth) were stored and averaged along the trajectories(sun flux) and at the receptor site (sun flux and mixing layerdepth) during the sampling intervals Even though the mixinglayer height provided by the HYSPLIT model might be quiteinaccurate the trend of this parameter was taken as a proxyof the boundary layer dynamics for the campaign In addi-tion residence time indices (RTIs) were calculated by GISanalysis reflecting the time the sampled air masses residedabove certain land cover categories (water natural vegeta-tion agricultural lands bare areas and urban areas) Detailsof this method are given in van Pinxteren et al (2010)
wwwatmos-chem-physnet16108792016 Atmos Chem Phys 16 10879ndash10897 2016
10882 S Sandrini et al Size-resolved aerosol composition at an urban and a rural site
Figure 1 Location of the sampling sites in the Po Valley
25 Aerosol liquid water content (ALWC) calculation
Hourly ALWC was calculated by the online version of theExtended Aerosol Inorganic Model III (E-AIM httpwwwaimenvueaacukaimaimphp Clegg et al 1998 Wexlerand Clegg 2002) The inorganic concentrations for sulfateammonium nitrate and chloride measured by two HR-ToF-AMSs placed in BO and in SPC during the campaign wereused as inputs in conjunction with RH while temperaturewas kept fixed at 29815 K by this model Sodium was notmeasured by AMS and it is here ignored in the calculationSodium represents only 2 of the total equivalents of to-tal ionic species used as inputs of E-AIM on the basis of theimpactor composition The size-segregated concentrations ofthe inorganic components collected by the Berner impactorscould not be used for this purpose due to their low tempo-ral resolution (12 h) resulting in a flattening of RH valuesaveraged over the sampling time which prevented accuratecalculation of ALWC on particles Particulate water retainedby polar organic matter was neglected in the calculations be-cause the inclusion of ionic organic compounds (oxalic glu-taric and maleic carboxylic acids) had been shown to playonly a minor role in water uptake during the campaign (Ho-das et al 2014) The formation of solids was allowed inthe model because in the absence of hygroscopicity mea-surements it was not possible to know whether aerosols ef-floresced or not in this environment The ALWC calculatedfrom AMS relates to the fine fraction (lt 1 microm diameter) ofaerosol
26 Principal component analysis
Source categories for the five impactor size intervals of par-ticulate matter were studied by means of PCA using theXLStat software (Addinsoft version 2013204) Besides theconcentrations of particle constituents chloride sulfate ni-trate sodium ammonium magnesium calcium and WSOCthe database for PCA also included the modeled meteorolog-
ical parameters from the HYSPLIT model listed in the previ-ous section the measured meteorological parameters temper-ature and relative humidity (RH) and the modeled residencetimes from GIS analysis
The values below detection limits were replaced by halfthe respective value of detection limit (Farnham et al 2002)in the final dataset
Since a prerequisite of PCA is the normal distribution ofthe variables used in the analysis the normal distribution ofconcentration data has been checked by the ShapirondashWilknormality test Data that were not normally distributed werelog-10 transformed before the analysis
The orthogonal transformation method with Varimax rota-tion of principal components was applied to redistribute thevariance in order to generate more interpretable factor load-ings and scores (Vandeginste 1998) As there are no definedcriteria for the number of factors which are used in the Vari-max rotation we performed several PCAs with varying num-bers of rotated factors (4ndash9) and judged the interpretability ofthe results by trying to assign a physical meaning to the ex-tracted factors The number of rotated factors was regardedas too high if factors showed very low contribution to theoverall variance and no distinct physical meaning Contrar-ily the number was regarded too low if previously resolvedsources were now folded into one principal component Themost reasonable results were obtained by rotating the first sixfactors
3 Results
31 Back-trajectory patterns
The PEGASOS summer campaign was characterized by theoccurrence of different meteorological patterns with the firstpart characterized by days of very perturbed weather fol-lowed by stable anticyclonic conditions and the second partexperiencing more variable meteorological conditions Dur-ing the study period weak westerly breezes affected the sam-
Atmos Chem Phys 16 10879ndash10897 2016 wwwatmos-chem-physnet16108792016
S Sandrini et al Size-resolved aerosol composition at an urban and a rural site 10883
pling sites at night and in the morning hours while shortintense easterly breezes dominated during the late afternoon(Fig 2 in Wolf et al 2015) However in days of strongersynoptic forcing a wind pattern characterized by strong east-erly winds persisting all day was observed (especially in thesecond half of June) while a wind pattern characterized bySW winds from the Apennines was also common in June andaccounted for most of the days in July until the end of thecampaign An overview of the main air-mass transport pat-terns intersecting the area during the campaign from back-trajectory analysis is reported in a parallel paper (Decesariet al 2016) A hierarchical cluster analysis (Dorling et al1992) of the obtained back trajectories was performed to re-duce the number of ldquoorigins of air massesrdquo appointing everycalculated individual back trajectory to the most appropriatecluster roughly corresponding to a specific synoptic situa-tion At each step of the process the appropriate number ofclusters was selected by looking at the variations of the totalspatial variance (TSV ndash defined as the sum of the squared dis-tances between the endpoints of the single trajectory and themean of the trajectories in that cluster) The optimum numberof clusters was selected in correspondence with the numberafter which the TSV did not vary substantially The analysisled to identification of five main patterns affecting the Po Val-ley during the experimental campaign A map with the meantrajectories for each cluster and the corresponding percent-age of occurrence for trajectories calculated over 96 h andarriving at 500 m agl is shown in Fig 2
Clusters 1 and 3 defined respectively as ldquoWEST lowrdquoand ldquoEAST lowrdquo according to their low traveling altitude(below 1000 m agl) and prevalent direction were character-ized by short trajectory lengths and corresponded to a higherresidence time of air masses in the basin Cluster 1 in partic-ular had the highest occurrence and accounted for 38 ofthe total trajectories Both included a smaller number of veryshort trajectories which were defined as ldquoWEST-low localldquoand ldquoEAST-low localldquo occurring during the days character-ized by stagnant conditions and low wind speed and wereassociated with the accumulation of pollutants
Under stagnant conditions weak winds were accompaniedby a shallower boundary layer as observed from lidar mea-surements and from radiosoundings in SPC (see SupplementFig S1) The planetary boundary layer (PBL) was around1000 m or lower at noon under stagnant conditions com-pared to 1600ndash1700 m observed during other periods of thecampaign at the same hour of the day
32 Bulk PM10 aerosol composition
The size cut between fine and coarse particles in the Bernerimpactor size distributions is set to a 12 microm aerodynamicdiameter (ie the size cut between the third and the fourthimpactor stage) therefore in this study PM12 and PM12minus10represent the fine and the coarse aerosol fractions respec-tively Figure 3 shows the time series of PM12 and PM12minus10
Figure 2 Map with average trajectories for each obtained clus-ter with in brackets corresponding percentage of occurrence Thenumbers outside the brackets identify each cluster Figure refers to96 h trajectories arriving at 500 m agl
mass concentrations and of the contribution of PM12 on to-tal PM10 for the rural site SPC together with air-mass cate-gories and back-trajectory length The aerosol mass was notavailable for BO Air-mass categories indicate the prevalentdirection of air masses during each sampling day
During the campaign the days showing the lowest aerosolmass concentrations were characterized by the longest tra-jectories which corresponded to air masses transported overlong range from the North Atlantic Ocean (WEST) at the be-ginning and at the end of the sampling period The aerosolmass increased from 15 to 18 June with an enhanced contri-bution of the PM12 fraction to the total PM10 together with asharp decrease of the trajectories length following the onsetof an anticyclonic period with low wind and air stagnationover the Po Valley An episode of Saharan dust transport wasobserved during a period of air transport from south startingon 19 June at 5 km height with maximum on 20 June whenit reached the PBL resulting in an increase of PM10 mass atground level (Bucci et al 2016) The highest contributionsof PM12 to PM10 were observed most of the times when4-day trajectories were very short (lt 1500 km) During thefirst persistent stagnation period lasting from 16 to 19 Junethe PM12 contribution to PM10 was the highest with max-ima during the night peaking at 67 of total PM10 mass on17 June
Table 1 lists the concentrations of the aerosol chemicalconstituents separately for PM12 and PM12minus10 fractions
wwwatmos-chem-physnet16108792016 Atmos Chem Phys 16 10879ndash10897 2016
10884 S Sandrini et al Size-resolved aerosol composition at an urban and a rural site
Figure 3 Time series of PM12 and PM10 mass concentrations (in microg mminus3) and of the PM12 to PM10 ratio () for SPC Four-day (96 h)back-trajectory length (km) is plotted superimposed to the graph while air-mass classification (in colors) is reported on top of it The samplesare labeled according to collection starting date with ldquoDrdquo and ldquoNrdquo denoting respectively daytime and nighttime samples
Table 1 Fine (PM12) coarse (PM12minus10) and PM10 mean concentrations (in microg mminus3 from integrated impactor mass size distributions) formain inorganic ions water-soluble organic carbon (WSOC) and total carbon (TC) separately for day (D) and night (N) samples during thePEGASOS summer campaign
PM12 PM12minus10 PM10
BO (urban) SPC (rural) BO (urban) SPC (rural) BO (urban) SPC (rural)
D N D N D N D N D N D N
Sulfate 21 26 17 23 027 032 016 028 23 28 18 26Nitrate 024 047 032 24 16 17 085 15 18 21 12 39Chloride 0023 0043 00047 0041 017 027 0053 014 013 027 0058 019Ammonium 083 11 069 15 0055 0068 0021 015 088 11 069 16Magnesium 00077 00089 00070 00064 0069 0073 0038 0045 0066 0081 0045 0051Calcium 0073 0067 0064 0073 050 048 035 041 056 053 040 047Sodium 0040 0051 0026 0021 037 048 020 022 041 053 023 024WSOC 14 19 094 16 054 053 028 044 19 24 12 21TC 25 35 13 22 15 15 08 14 41 52 21 35
and for day and night samples All the chemical species con-centrations were higher at the urban compared to the ruralsite but with small differences in most of the cases The sig-nificantly higher concentrations of fine TC in BO can resultfrom a higher contribution of EC and organic carbon (OC)from vehicular traffic at the urban site Coarse-mode Mg2+
and Ca2+ also occurred at higher concentrations at the ur-ban site suggesting a source from road dust resuspension forthese mineral elements The only exception was representedby the nocturnal concentrations of fine-mode nitrate on av-erage 5 times higher at SPC compared to BO and so for thecounter-ion ammonium
The concentrations of many species were higher at nightcompared to daytime (Table 1) The nocturnal enhancementcan be due either to the accumulation of pollutants in a shal-low boundary layer or to enhanced formationemission ofspecific aerosol species at nighttime Figure 4 shows the av-erage PM10 composition at the urban and at the rural siteseparately for day and night with indication of the percent-age contributions of each species on the total mass of themeasured compounds The change in PM10 chemical com-
position between day and night at the rural site indicatesthat the enhanced mean concentrations found at night werenot purely an effect of atmospheric dynamics but were im-pacted by chemical processes that led to the formation of spe-cific aerosol compounds especially ammonium nitrate in thedark hours of the day The lower average nocturnal tempera-tures (22 C vs 25 C) and the higher average nocturnal RH(70 vs 48 ) of SPC with respect to BO probably playedan important role
Water-insoluble carbon (WINC) was calculated as the dif-ference between TC and WSOC (WINC=TCminusWSOC)(Matta et al 2003) In order to obtain the mass of water-soluble organic material and water-insoluble carbonaceousmaterial conversion factors were applied to include elementsdifferent from carbon in the organic molecules Two distinctfactors were used respectively for the soluble and the insol-uble fraction of OC WSOC was multiplied by 19 at the ruralsite and by 17 at the urban site applying the two factors de-rived from AMS measurements performed at the two sitesduring the same campaign (Gilardoni et al 2014) WINC
Atmos Chem Phys 16 10879ndash10897 2016 wwwatmos-chem-physnet16108792016
S Sandrini et al Size-resolved aerosol composition at an urban and a rural site 10885
Figure 4 Average day and night PM10 composition at BO and SPCduring the campaign ldquoOther ionsrdquo include chloride nitrite potas-sium and magnesium WSOM stands for water-soluble organic mat-ter while WINCM for water-insoluble carbonaceous matter Aver-age mass ALWC RH and temperature are indicated below eachpie The size of each pie chart is proportional to the total measuredmass reported
was multiplied by 12 as found in the literature (Zappoli etal 1999)
The total mass concentration of the chemical species deter-mined on impactor samples averaged 122 microg mminus3 at the ur-ban and 82 microg mminus3 at the rural site during daytime and 151and 159 at nighttime respectively It is interesting to notethat in daytime the aerosol loading was higher at the urbancompared to the rural site indicating a higher contributionfrom urban sources though the chemical composition was tosome extent homogeneous By contrast at night the aerosolmass was similar at the two sites but the chemical composi-tion was different with an enrichment of ammonium nitrateat the rural site probably also favored by the high ammoniaconcentrations from agricultural sources which during thecampaign were only observed at the rural site and not in BO(Sullivan et al 2015)
The measured mass of PM10 at the urban site consisted onaverage of 42 and 40 SIA in daytime and nighttime respec-tively At the rural site SIA represented 46 in daytime and50 at night due to a higher contribution from fine-modeammonium nitrate Carbonaceous matter was the dominantfraction at the urban site with 48 and 49 of the measured
mass in daytime and nighttime respectively and with the sol-uble fraction accounting for 26 and 27 of the mass in thetwo cases
Finally it is worth reminding that the above results aresensitive to sampling artifacts which can affect aerosol col-lection with low-pressure impactors (eg evaporative lossesof semivolatile compounds) Figures S8 and S9 report thecomparison between SIA measurements with the Berner im-pactor at SPC and co-located measurements using a differ-ent offline system (a HiVol sampler) and an online method(HR-ToF-AMS) The results show that the Berner impactorobservations are generally in line with the parallel measure-ments and especially that the main features of the time trend(eg the sharp diurnal variations in nitrate concentrations)are reproduced by all the instruments
33 Size-resolved aerosol composition
The time series of size-resolved sulfate nitrate and WSOCconcentrations are shown in Fig 5 (similar plots for addi-tional chemical components and RH are reported in the Sup-plement Figs S2ndashS8) The figure highlights significant dif-ferences between the urban and the rural site in the formationof secondary inorganic and organic aerosol especially duringthe two periods of stagnant conditions ie 16ndash19 June and5ndash7 July which favored the accumulation of aerosol com-pounds from local sources During the first of such eventsthe sulfate concentrations increased in BO and SPC to asimilar extent in daytime while higher concentrations weremeasured in SPC at night Fine-mode nitrate consisting pri-marily in ammonium nitrate was virtually absent during theday throughout the campaign particularly in BO as a con-sequence of the high summer temperatures which favoredthe thermal decomposition of NH4NO3 into gas-phase am-monia and nitric acid Higher fine-mode nitrate concentra-tions were instead measured in SPC reaching high levels atnight For both sulfate and nitrate the most prominent en-hancements affected the accumulation mode ie size bins2 (014ndash042 microm) and especially 3 (042ndash12 microm) of the im-pactor which correspond to small and large accumulationmode
Aerosol WSOC exhibited higher concentrations understagnant conditions similarly to SIAs During the first stag-nation event in particular higher nocturnal concentrationsin the accumulation mode were measured in SPC comparedto BO (Fig 5) Conversely WSOC concentrations were ingeneral higher in BO than in SPC in the quasi-ultrafine(005ndash014 microm) fraction with an average concentration of039 microg mminus3 (17 of total WSOC in the PM10 fraction) com-pared to 019 microg mminus3 (11 of total WSOC in PM10) Sincesecondary formation is believed to represent the major sourceof WSOC in the absence of biomass burning (Weber et al2007) the quasi-ultrafine WSOC excess at the urban sitecould result from the increased condensation of secondaryproducts on the large surface area of a higher number of very
wwwatmos-chem-physnet16108792016 Atmos Chem Phys 16 10879ndash10897 2016
10886 S Sandrini et al Size-resolved aerosol composition at an urban and a rural site
0
1
2
3
4
5
6
SO42‐(g m
‐3)
005ndash014 microm 014ndash042 microm 042ndash12 microm 12ndash35 microm 35ndash10 microm
BO Stagnant 1Stagnant 2
0
1
2
3
4
5
6
D N D N D N D N D N D N D N D N D N D N D N D N D N D N D N D N D N D N D N D N D N D N D N D N D N D N D N D N
126 136 146 156 166 176 186 196 206 216 226 236 246 256 266 276 286 296 306 17 27 37 47 57 67 77 87 97
SO42‐(g m
‐3)
SPC Stagnant 1
Stagnant 2
0
1
2
3
4
5
6
7
NO
3‐(
g m
-3)
005ndash014 microm 014ndash042 microm 042ndash12 microm 120ndash35 microm 35ndash10 microm
BO Stagnant 2Stagnant 1BO
0
2
4
6
8
10
12
14
D N D N D N D N D N D N D N D N D N D N D N D N D N D N D N D N D N D N D N D N D N D N D N D N D N D N D N D N
126 136 146 156 166 176 186 196 206 216 226 236 246 256 266 276 286 296 306 17 27 37 47 57 67 77 87 97
NO
3‐(g m
‐3)
SPCSPC
Sstagnant 2
SPCStagnant 1
0
1
2
3
WSO
C (g
m‐3)
005ndash014 microm 014ndash042 microm 042ndash12 microm 12ndash35 microm 35ndash10 microm
Stagnant 1Stagnant 2BO
0
1
2
3
4
5
6
D N D N D N D N D N D N D N D N D N D N D N D N D N D N D N D N D N D N D N D N D N D N D N D N D N D N D N D N
126 136 146 156 166 176 186 196 206 216 226 236 246 256 266 276 286 296 306 17 27 37 47 57 67 77 87 97
WSO
C (g
m‐3)
SPCStagnant 1
Stagnant 2
Figure 5 Time series of sulfate nitrate and WSOC size-segregated concentrations in BO and SPC Please note the different scale for nitrateand WSOC in BO
small particles found at the urban site In addition to freshlynucleated particles in fact this aerosol fraction twice as highin number at urban sites compared to rural areas (Westerdahlet al 2005) includes particles released by anthropogenicsources such as combustion emissions from vehicular trafficIn addition this quasi-ultrafine mode excess of WSOC masscould also reflect a direct contribution from anthropogenicprimary emissions (Zhang et al 2012)
On 5 and 6 July the Po Valley was again influenced bystagnant conditions with low wind speeds and short air-masstrajectories However the stagnation event in early July was
considerably shorter than that of 16ndash19 June During suchevent high concentrations of fine-mode sulfate were simulta-neously observed in BO and SPC with the 6 July experienc-ing the highest diurnal concentration of the whole campaign(49 microg mminus3 in PM10 in BO) Nitrate similarly increased atboth sites at night persisting in daytime in BO only andreaching the diurnal maximum of 42 microg mminus3 on PM10 Sim-ilarly WSOC increased at both sites though more signifi-cantly in BO where it reached the highest average diurnalconcentration on 6 July This day was characterized by thehighest daytime RH (478 and 604 in BO and SPC re-
Atmos Chem Phys 16 10879ndash10897 2016 wwwatmos-chem-physnet16108792016
S Sandrini et al Size-resolved aerosol composition at an urban and a rural site 10887
spectively averaged over the time span of Berner impactorsamplings) and a relatively lower temperature (27 C at bothsites) Clouds were present on the sampling sites and a lightrain was recorded in the afternoon Such conditions appar-ently favored the formation of secondary organic (WSOC)and inorganic aerosol compounds in the Po Valley basin
Figure 6 shows the size-segregated concentrations of sul-fate nitrate ammonium and WSOC during one day charac-terized by background conditions (15 June) and one day char-acterized by stagnant conditions (18 June) separately for di-urnal and nocturnal hours On the background day (panels aand c) fine particles in BO exhibited a maximum in the spe-ciated aerosol mass in the small accumulation mode (014ndash042 microm) with a relative increase in the large accumulationmode (042ndash12 microm) at night The speciated aerosol mass inSPC was almost evenly distributed between the two modesat night and during the day Nitrate was always present inthe coarse mode where nonvolatile nitrate salts can formthrough reaction of gaseous nitric acid with alkaline soil par-ticles or resuspended dust (Harrison and Pio 1983 Laskinet al 2005) Under stagnant conditions (panels b and d)the speciated particle mass concentrations increased but thepeak in the size distribution which for BO was again ob-served in the small accumulation mode shifted to the largeaccumulation mode in SPC both in daytime and at nightThe nocturnal increase of large accumulation-mode partic-ulate matter concentration was much more evident at the ru-ral site (SPC) than at the urban site (BO) mostly becauseof an increase of ammonium nitrate (showing more than 3times higher concentrations with respect to background con-ditions) but also accompanied by increases in WSOC andsulfate concentrations The SIA mass (ie the sum of sul-fate nitrate and ammonium) reached 67 of the total PM12mass in the night of 16 June during the first event of stagna-tion The increase of SIA (and to a lesser extent of WSOC)in large accumulation-mode aerosols under stagnant condi-tions was therefore the main process modulating the impactorsize distribution of submicron aerosol during the experimentOur data seem to exclude that this shift in diameter of SIA-containing aerosols from the small to the large accumulation-mode size range is due to impactor sampling artifacts (seeSect S1 in the Supplement Fig S11)
34 Secondary aerosol formation under stagnantconditions
341 Secondary inorganic components
The processes responsible for the accumulation of sulfatenitrate and secondary organic aerosol (SOA) on stagnationdays were further investigated by analyzing the relationshipbetween the (size-segregated) concentrations of secondaryinorganic compounds and RH as well as with ALWC SPCwas characterized by higher levels of RH than Bologna es-pecially at night During the campaign RH and temperature
profiles at the two sites showed substantial dayndashnight vari-ations as a consequence of diabatic processes at the surface(nocturnal radiative cooling vs daytime heating from solarirradiation) As a consequence the highest RH occurred atboth sites just before dawn from 0400 to 0500 and the low-est in the afternoon from 1300 to 1500 During the diurnalsampling periods (from 0900 to 2100) hourly RH rangedfrom 15 to 66 in BO and from 19 to 73 in SPC whileduring the nocturnal sampling periods (from 2100 to 0900)RH ranged from 24 to 82 in BO and from 35 to 92 inSPC A plot of RH averaged on the time intervals of theBerner impactor is reported in the Supplement (Fig S8)
Since the equilibrium constant for the reaction of NH4NO3formation is both RH and temperature dependent (Stelsonand Seinfeld 1982) thermodynamic conditions were morefavorable in SPC than in BO for the existence of condensed-phase nitrate Both temperature and RH affect the equi-librium of NH4NO3 but the changes in RH were moremarked During the campaign the hourly nocturnal tem-peratures and corresponding relative humidity of deliques-cence (RHD) for ammonium nitrate and ammonium sul-fate (in brackets) ranged from 12 C (693 for ammo-nium nitrate and 807 for ammonium sulfate) to 30 C(586 for ammonium nitrate and 795 for ammonium sul-fate) in SPC and from 16 C (671 for ammonium nitrateand 803 for ammonium sulfate) to 30 C in BO (Watson etal 1994 E-AIM model httpwwwaimenvueaacukaimmodel2mod2rhwphp) Nocturnal periods of time with RHgreater than the RHD of hygroscopic salts were consider-ably longer in SPC than in BO and therefore deliquescedparticles were common at the rural and very rare at the ur-ban site This was confirmed by the simultaneous enhance-ments of the ALWC calculated from hourly averaged AMSdata at the two sites (see the experimental section) by the E-AIM model (Fig 7) While the ALWC in SPC showed a con-sistent average diurnal trend with a maximum before dawnwhen both RH and the concentrations of hygroscopic saltswere the highest (Hodas et al 2014) the diurnal variationin Bologna was less marked and nighttime ALWC concen-trations were 1 order of magnitude smaller than at the ruralstation (Fig 7) Considering the Berner impactor samplingperiods ALWC averaged 033 microg mminus3 in daytime in BO(min 0 max 112 microg mminus3) and 076 microg mminus3 at night (min 0max 166 microg mminus3) while in SPC it averaged 021 microg mminus3
during day (min 0 max 104 microg mminus3) and 655 microg mminus3 dur-ing night conditions (min 0 max 593 microg mminus3) The 12 h av-eraged ALWC data show concentrations increasing rapidlyfor RH above 60 (Fig 8) There is a considerable variabil-ity in ALWC levels that must be attributed to the availabilityof hygroscopic material in the aerosol as particulate waterin subsaturated condition is a function not only of RH butalso of the molar concentration of dissolved material in theaerosol
Figure 8 (panels b c) shows the relation between nitrateand sulfate concentrations separately in the small accumula-
wwwatmos-chem-physnet16108792016 Atmos Chem Phys 16 10879ndash10897 2016
10888 S Sandrini et al Size-resolved aerosol composition at an urban and a rural site
8
6
4
2
0
dCd
logD
p (
g m
-3)
6 8
1022 4 6 8
1032 4 6 8
104
Diameter of particle (m)
SO42-
NO3-
NH4+
WSOC
BO day 156 8
6
4
2
0
dCd
logD
p (
g m
-3)
6 8
1022 4 6 8
1032 4 6 8
104
Diameter of particle (m)
BO day stagnation 186 SO4
2-
NO3-
NH4+
WSOC
8
6
4
2
0
dCd
logD
p (
g m
-3)
6 8
1022 4 6 8
1032 4 6 8
104
Diameter of particle (m)
SO42-
NO3-
NH4+
WSOC
BO night stagnation 186
8
6
4
2
0
dCd
logD
p (
g m
-3)
6 8
1022 4 6 8
1032 4 6 8
104
Diameter of particle (m)
BO night 156 SO42-
NO3-
NH4+
WSOC
8
6
4
2
0
dCd
logD
p (
g m
-3)
6 8
1022 4 6 8
1032 4 6 8
104
Diameter of particle (m)
SO42-
NO3-
NH4+
WSOC
SPC day 156
20
15
10
5
0
dCd
logD
p (
g m
-3)
6 8
1022 4 6 8
1032 4 6 8
104
Diameter of particle (nm)
SPC night 156
SO42-
NO3-
NH4+
WSOC
20
15
10
5
0
dCd
logD
p (
g m
-3)
6
1022 4 6
1032 4 6
104
Diameter of particle (nm)
SPC night stagnation 186
SO42-
NO3-
NH4+
WSOC
8
6
4
2
0
dCd
logD
p (
g m
-3)
6 8
1022 4 6 8
1032 4 6 8
104
Diameter of particle (m)
SPC day stagnation 186 SO4
2-
NO3-
NH4+
WSOC
Figure 6 Size-resolved aerosol composition for BO and SPC during day (top) and night (bottom) respectively during one day characterizedby background conditions (156) and during one day under stagnant conditions (186) (notice the different scale for concentrations in thebottom right panel)
0
10
20
30
40
50
60
70
80
90
0
10
20
30
40
50
60
1 2 3 4 5 6 7 8 9 10 11 12 13 14 15 16 17 18 19 20 21 22 23 24
RH
ALW
C (g
m‐3)
Time (LT)
SPC
0
10
20
30
40
50
60
70
80
90
0
2
4
6
8
10
12
14
16
18
1 2 3 4 5 6 7 8 9 10 11 12 13 14 15 16 17 18 19 20 21 22 23 24
RH
ALW
C (g
m‐3)
q1 MinMedian Maxq3 RH
BO
Figure 7 Box plot of average diurnal variation of aerosol liquid wa-ter content (ALWC) with superimposed diurnal variation of relativehumidity (RH) during the campaign Please note the different scaleof ALWC at the two sites The labels q1 and q3 in the box plotrespectively denote the first and the third quartiles
tion mode (condensation mode) and in the large accumula-tion mode (droplet mode) vs ALWC for the two sites Thecorrelation between particulate nitrate and ALWC was strong
for both modes in SPC where ALWC levels above 1 microg mminus3
were frequentOur data are in agreement with the findings of Hodas et
al (2014) indicating that particulate nitrate was the primarydriver of ALWC observed at night in the rural Po Valleyin summertime The same study suggested that ALWC en-hanced the particle-phase partitioning of water-soluble or-ganic gases and provided a medium for aqueous-phase or-ganic reactions that can form SOA More generally ALWCcan favor ndash and sometimes can be necessary for ndash the forma-tion of SOA and SIA in large accumulation-mode aerosols(the droplet mode) Figure 8c shows that no relationship wasobserved between sulfate and the local estimates of ALWC ateither site with the exception of a moderate positive correla-tion for the droplet mode in SPC but not in BO These resultsindicate that most sulfate was formed at the regional scaleduring this study (through cloud chemistry in the larger ac-cumulation mode or gas-phase chemistry in the smaller accu-mulation mode) However a small but nonzero increment ofdroplet-mode sulfate concentration in SPC can be attributedto the greater ALWC characterizing the rural site with respectto the urban site
As a final remark in this discussion we attributed the highconcentrations of ammonium nitrate at the rural site to themore favorable thermodynamic conditions respect to the ur-ban site This process was amplified by a positive feedbackof ammonium nitrate itself that by increasing the ALWCin the aerosol phase further promotes the uptake of precur-sors (NH3 HNO3 N2O5) from the gas phase (Bertram et al
Atmos Chem Phys 16 10879ndash10897 2016 wwwatmos-chem-physnet16108792016
S Sandrini et al Size-resolved aerosol composition at an urban and a rural site 10889
1E‐04
1E‐03
1E‐02
1E‐01
1E+00
1E+01
1E+02
10 100
ALW
C (g
m‐3)
RH
BO
SPC
001
010
100
1000
00001 0001 001 01 1 10 100
Nitrate‐CD (g
m‐3)
ALWC (g m‐3)
01
10
100
00001 0001 001 01 1 10 100
Sulfate‐CD
g m
‐3)
ALWC (g m‐3)
01
10
100
00001 0001 001 01 1 10 100
WSO
C‐CD (g
m‐3)
ALWC (g m‐3)
00
01
10
100
00001 0001 001 01 1 10 100
Nitrate‐DL (g m
‐3)
ALWC (g m‐3)
01
10
100
00001 0001 001 01 1 10 100
Sulfate‐DL g m
‐3)
ALWC (g m‐3)
01
10
100
00001 0001 001 01 1 10 100
WSO
C‐DL (g m
‐3)
ALWC (g m‐3)
(a)
(b)
(c)
(d)
Figure 8 Relationship between ALWC and RH (a) relationship between nitrate (b) sulfate (c) and WSOC (d) in the condensation (CDleft panel) and in the droplet (DL right panel) mode of particles and ALWC averaged over the sampling periods of the Berner impactors
2009 Schaap et al 2004) We do not consider here the effectof the different distribution of gaseous precursors of ammo-nium nitrate in the Po Valley especially of ammonia whichis enriched in the rural areas (Sullivan et al 2016) whichwill be object of a future study
342 Carbonaceous species
The distribution of the carbonaceous components of aerosol(WSOC WINC=TCminusWSOC) over the Berner impactorsize intervals with emphasis on accumulation-mode parti-cles (condensation and droplet modes) is hereby discussedThe dependence of WSOC on ALWC is also investigatedanalogously to the case of SIA treated in the previous sec-tion
PM10 WSOC concentrations in this study ranged from013 to 46 microg C mminus3 (average 21 microg C mminus3) in BO and from028 to 52 microg C mminus3 (average 16 microg C mminus3) in SPC On av-erage 79 and 77 of this PM10 WSOC concentration was inthe fine (PM12) fraction in BO and SPC respectively withonly slightly higher contributions at night than in daytime atboth sites
The water-soluble fraction of total carbon (WSOC TC) inPM12 was 52 on average in BO and 61 in SPC The
WSOC fraction in SPC was comparable to what observedat other rural sites eg 57 in PM1 in K-puszta (Hungary)during the summer (Krivacsy et al 2001) The greater water-soluble fraction of carbon found at SPC with respect to BOis in line with literature results showing higher WSOC frac-tions in rural areas as a consequence of the concurrent higherinput of SOA and the reduced fraction of insoluble carbona-ceous particles from traffic sources (Weber et al 2007)
The left panels in Fig 9 show the linear regressions ofWSOC vs TC in submicron particles (impactor stages 1to 3) at the two sites separately for day and night condi-tions At the urban site a higher slope was observed in day-time (071plusmn 010 at 95 confidence level) than at nighttime(057plusmn 008) pointing to the effect of a daytime source forWSOC (consistent with photochemical SOA formation) Indaytime the WSOC fraction of TC in BO overlaps well withthat observed in SPC (072plusmn 005) Contrary to BO how-ever WSOC fractions in SPC were similar between nightand day (070plusmn 007 at night) Figure 9 shows in fact thatWSOC and TC occurred in similar proportions in daytimebetween SPC and BO but with smaller concentrations inSPC (which were therefore ldquodilutedrdquo with respect to BO)In addition carbonaceous aerosol concentrations increased
wwwatmos-chem-physnet16108792016 Atmos Chem Phys 16 10879ndash10897 2016
10890 S Sandrini et al Size-resolved aerosol composition at an urban and a rural site
Figure 9 Linear regressions between WSOC and TC (left) and WSOC and SO2minus4 (right) in the size intervals (1) 005ndash014 microm (2) 014ndash
042 microm and (3) 042ndash12 microm in daytime and at night for BO (top) and SPC (bottom)
at night in SPC and in similar proportions between WSOCand WINC thus producing an aerosol with different charac-teristics in SPC with respect to BO
The correlation of WSOC with a nonvolatile SIA compo-nent (sulfate) in PM12 is shown in the right panels of Fig 9A good correlation (R2
= 07) was observed at both stationsin daytime suggesting that WSOC shared a photochemi-cal source with sulfate The correlation in BO was muchsmaller at nighttime (R2
= 04) than in daytime which is ex-pected because particulate organic compounds have multiplesources other than photochemistry Interestingly the correla-tion between WSOC and sulfate remained high (07) at nightin SPC pointing to a common nocturnal source for WSOCand sulfate at the rural site
Figure 10 shows for the two sites the size-resolvedconcentration time series of WSOC and WINC for quasi-ultrafine mode (005ndash014 microm) condensation-mode (014ndash042 microm) and droplet-mode (042ndash12 microm) particles Thequasi-ultrafine fraction provided the smallest contribution toaerosol mass but with significantly higher concentrations atthe urban compared to the rural site for both WSOC andWINC This feature was observed also in previous studies(Sardar et al 2005 Snyder et al 2010 Zhang et al 2012)The urban excess of WINC witnesses the effect of local emis-sions of insoluble primary carbonaceous particles On aver-age WSOC accounted for 52 of quasi-ultrafine TC in SPCand only 42 in BO with the lower WSOC fraction at theurban site caused by the higher concentrations of WINC Anurban increment for WSOC in quasi-ultrafine particles canbe observed although smaller than for WINC and can be ex-plained by local sources of fresh SOA and by condensationon a greater number of ultrafine particles WINC in this size
range displayed nocturnal excess compared to WSOC par-ticularly in BO without a clear relation with the trajectorylengths We argue that the nocturnal peaks in quasi-ultrafineWINC concentrations could be related to the morning traf-fic rush hours which during the summer had a maximumat 0800ndash0900 before the breakup of the nocturnal bound-ary layer and were therefore included in the nocturnal sam-pling periods The evening traffic rush time between 1900and 2000 had apparently a minor effect since it occurredwhile the boundary layer was still well mixed
The distribution of carbonaceous fractions in the accumu-lation mode (condensation and droplet modes) showed thatWSOC was in general dominant over WINC more at the ru-ral than at the urban site The average WSOC TC ratio in thecondensation mode was 65 in SPC and 60 in BO whileshowing a greater difference between the two stations in thedroplet mode (66 in SPC and 56 in BO) The WSOCconcentrations were inversely related to trajectory length in-dicating an effect of stagnation on oxidized organic aerosolproduction Interestingly the increase of WSOC levels dur-ing the stagnation periods did not affect the same size frac-tions to the same extent at the two sites During the firstepisode the maximum daytime WSOC concentration in thecondensation mode recorded on 19 June corresponded toa 185 increase in BO and 150 in SPC compared to15 June the last day under the influence of North Atlanticcirculation before the onset of the local recirculation Theenhancement of WSOC in daytime for droplet-mode parti-cles amounted to 150 in BO and 195 in SPC There-fore the accumulation of water-soluble organic compoundsoccurred approximately to the same extent at the two sites indaytime but the increase was more marked in droplet-mode
Atmos Chem Phys 16 10879ndash10897 2016 wwwatmos-chem-physnet16108792016
S Sandrini et al Size-resolved aerosol composition at an urban and a rural site 10891
0
500
1000
1500
2000
2500
3000
3500
00
02
04
06
08
10
12
14 SPC (005ndash014 microm)
0
500
1000
1500
2000
2500
3000
3500
00
02
04
06
08
10
12
14BO (005ndash014 microm)
0
500
1000
1500
2000
2500
3000
3500
0
05
1
15
2
25
DNDNDNDNDNDNDNDNDNDNDNDNDNDNDNDNDNDNDNDNDNDNDNDNDNDNDNDN
12Jun
13Jun
14Jun
15Jun
16Jun
17Jun
18Jun
19Jun
20Jun
21Jun
22Jun
23Jun
24Jun
25Jun
26Jun
27Jun
28Jun
29Jun
30Jun
1Jul
2Jul
3Jul
4Jul
5Jul
6Jul
7Jul
8Jul
9Jul
SPC (042ndash12 microm)
0
500
1000
1500
2000
2500
3000
3500
0
05
1
15
2
25
DNDNDNDNDNDNDNDNDNDNDNDNDNDNDNDNDNDNDNDNDNDNDNDNDNDNDNDN
12Jun
13Jun
14Jun
15Jun
16Jun
17Jun
18Jun
19Jun
20Jun
21Jun
22Jun
23Jun
24Jun
25Jun
26Jun
27Jun
28Jun
29Jun
30Jun
1Jul
2Jul
3Jul
4Jul
5Jul
6Jul
7Jul
8Jul
9Jul
BO (042ndash12 microm)
0
500
1000
1500
2000
2500
3000
3500
0
04
08
12
16
2
WSO
C W
INC (g m‐3)
SPC (014ndash042 microm)
0
500
1000
1500
2000
2500
3000
3500
0
04
08
12
16
2
Traj
ecto
ry le
ngth
(km
)BO (014ndash042 microm)
Figure 10 Time series of WSOC and WINC (=TCminusWSOC) concentrations in the size intervals (1) 005ndash014 microm (2) 014ndash042 microm and(3) 042ndash12 microm Four-day back-trajectory length is superimposed to each graph Results for the urban (BO) and for the rural (SPC) stationare shown
Dayy = 088x ‐ 005
Rsup2 = 088Night
y = 065x + 022Rsup2 = 037
0
05
1
15
2
25
3
0 05 1 15 2 25 3 35 4
Sulfa
te SPC
(g m
‐3)
Sulfate BO (g m‐3)
St1 day
St1 night
St2 day
St2 night
St3 day
St3 night
St3 16ndash19 Jun night
St2 16ndash19 Jun night
Day all
Figure 11 Scatterplot of sulfate concentration at SPC vs BO dur-ing day and night for the impactor stages 1 (005ndash014 microm) 2 (014ndash042 microm) and 3 (042ndash12 microm) The regression lines are referred tothe diurnal (gray line) and nocturnal (black line) concentrations inthe three stages as a whole Condensation- and droplet-mode sam-ples for the stagnant nights during 16ndash19 June are filled in red
particles in SPC and in the condensation mode in BO Themaximum nocturnal WSOC concentration found on 18 Junecorresponded to an enhancement in the condensation modeof 140 and 325 in BO and SPC respectively with re-spect to the background conditions of 15 June The same in-crease in the droplet mode amounted to 115 (BO) and 440 (SPC) Therefore the change in WSOC concentrations be-tween background and stagnating conditions was more het-erogeneous between sites for nocturnal samples than for thediurnal ones which is expected because the atmosphere ismuch more stratified at night and atmospheric compositionat ground level is more impacted by local conditions In thiscase a nocturnal enhancement of WSOC concentrations dur-
ing the first stagnation period occurred only in SPC with amaximum in the droplet mode
During the second stagnant period on 5ndash6 July WSOCincreased considerably in daytime in BO in both size rangeswhile only a small increase was observed in SPC and limitedto the droplet mode
The behavior of accumulation-mode WSOC after the on-set of stagnating conditions was therefore reversed duringthe (short) July event with respect to the first episode of 16ndash20 June with a marked increase in the droplet mode occur-ring in BO in July while interesting the SPC site in June(especially at night) The days (and nights) of maximum in-crease of droplet-mode WSOC were in fact those showingthe highest submicron nitrate concentrations and were al-ways humid days (or nights) Figure 8d shows that WSOCwas positively correlated with ALWC only in the dropletmode and only in SPC The lack of correlation for BO sam-ples can be explained by the very short duration of the hu-mid stagnation period in July Clearly the increase of WSOCin droplet-mode aerosols in the stagnation periods was nothomogeneous in the Po Valley and was associated locally tothe presence of deliquesced particles These findings indicatethat the enrichment of WSOC was contributed by aqueousprocesses including condensation in the aerosol liquid wa-ter which were active preferentially during colder nighttimehours Figure 8c and d also show that the behavior of WSOCreflects that of sulfate in SPC for droplet-mode aerosolswhich explains the good correlation between WSOC and sul-fate for nighttime samples observed only at the rural sitewhere ALWC was high (Fig 9 right panels)
wwwatmos-chem-physnet16108792016 Atmos Chem Phys 16 10879ndash10897 2016
10892 S Sandrini et al Size-resolved aerosol composition at an urban and a rural site
35 Principal component analysis
In the previous section we focused on the time trends andsize distributions of major carbonaceous and inorganic ionicspecies and we concluded that at least two secondary forma-tion processes were active in the Po Valley the first proba-bly photochemical is active throughout the campaign at bothstations affecting the concentrations of all species and par-ticularly in the condensation mode during stagnation periodsthe second one is associated with deliquesced particles andis selectively important for nitrate (both condensation anddroplet mode) and to a lesser extent for sulfate and WSOC indroplet-mode particles In this section we will extract sourceinformation from all the chemical datasets and from ancil-lary information PCA was used to analyze the variability ofthe main variables of interest (the concentration of main SIAsand WSOC) in conjunction with the variability of the concen-trations of minor species and tracers as well as of the physi-cal parameters of the atmosphere Six principal componentswere retained for interpretation of the SPC and BO datasetsexplaining respectively 79 and 77 of the total varianceIncreasing the number of factors progressively raises the ex-plained variance but each additional factor contributes onlya small fractional increase and interpretation of the additionalfactors is also challenging For the above reasons a six-factorsolution was chosen as the best one The results of the PCAare summarized in Table 2 as factor loadings which repre-sent the correlation of each variable with each factor andhence suggest possible sources formation mechanisms andsource regions For better clarity loadings with absolute val-ues below 02 (|x| le 02) were omitted and only those withabsolute values larger than 06 (|x| ge 06) were consideredldquohighrdquo (in bold in the table)
The first rotated component (RC1) explained the largestfraction of the dataset variance (22 ) in SPC It involvedhigh loadings of nitrate and ammonium for all the sizeclasses Among the meteorological parameters the fac-tor was strongly positively correlated with RH (082) andnegatively with temperature (minus085) Thus RC1 describesthe local meteorology and the nighttime condensation ofammonium nitrate in large accumulation-mode particles(042ndash12 microm) Ammonium nitrate condensation in SPC wasmoderately positively correlated with droplet-mode sulfateWSOC and oxalate compounds (sulfate and oxalate) thatshare a source in aqueous secondary formation processes Asimilar source was identified in the Bologna dataset in RC6which compared to SPC explained only a smaller fraction(9 ) of the total variance The relationship with temperatureand RH was weaker in BO than in SPC though in the samedirection and no clear relation was observed with droplet-mode WSOC and sulfate
RC2 was the second-most important factor in SPC ex-plaining 15 of the total variance in the dataset Sulfateoxalate ammonium and WSOC were the species which cor-related most with this factor especially in the small (014ndash
042 microm) and large (042ndash12 microm) accumulation mode Thisfactor was positively correlated with the sun flux integratedalong the air-mass trajectory This factor can therefore ac-count for SIA and SOA photochemical production An anal-ogous factor in BO (RC2) explained a similar contributionto the total variance (17 ) A positive correlation (06) withRH was observed in BO which was not significant in SPCThe significant contribution represented by this source onthe total variance described for the two datasets highlightsthe importance of regional-scale secondary aerosol forma-tion processes for the Po Valley environment
The third factor in SPC is RC3 accounting for 14 of thetotal variance This rotated component showed high loadingsparticularly for Ca2+ but also for Mg2+ in size bins 3 to 5corresponding to particles from 042 to 10 microm Oxalate alsoshowed a significant loading in size bin 5 (35ndash10 microm) whichsuggested the uptake of gas-phase carboxylic acids by min-eral particles in agreement with past observations (Laongsriand Harrison 2013 van Pinxteren et al 2014) This factor isanalogous to RC4 in the BO dataset which explains 11 ofthe total variance and was attributed to road dust resuspen-sion High loadings in BO were shifted toward larger diame-ters of particles (12 to 10 microm)
The fourth rotated component in SPC (RC4) which ex-plained another 12 of the total variance displayed thehighest loadings for magnesium in coarse-mode particles andsodium in size bins 3 to 5 (from 042 to 10 microm) Sulfate insize bin 5 (35ndash10 microm) was also moderately correlated withthis factor and nitrate too but to a lesser extent This fac-tor can be interpreted as a contribution from sea salt compo-nents The corresponding rotated component in BO was RC1which explained 19 of the total variance and compared toSPC displayed higher loadings for sulfate and nitrate in sizebin 4 (12 to 35 microm)
The fifth rotated component (RC5) in SPC explaining 8 of the total variability only included high loadings for RTIswithout any relevant correlation with other parameters Thisfactor was identified both in SPC and in BO (RC5) explain-ing respectively 8 and 10 of the total variance While thisfactor does not represent an aerosol source it indicates thatduring this campaign the impact of air-mass history (long-range transport) was likely small as compared to other im-pacts such as daynight variability or local impacts
Finally the last rotated component which explained an ad-ditional 8 of the total variance in SPC (RC6) and 11 in BO (RC3) contained high loadings only in the first sizerange (005ndash014 microm) for sulfate ammonium and to a lesserextent WSOC The significant loading of sulfate and am-monium in quasi-ultrafine particles together with a mod-erate positive correlation with solar radiation and temper-ature suggests a possible source for this component inultrafine particle nucleation The role of these chemicalspecies in the formation of new particles and their con-densationcoagulation on smaller particulate matter are wellknown as is the influence of solar radiation on this aerosol
Atmos Chem Phys 16 10879ndash10897 2016 wwwatmos-chem-physnet16108792016
S Sandrini et al Size-resolved aerosol composition at an urban and a rural site 10893
Table 2 Factor loadings of PCA after Varimax rotation Only absolute values larger than 02 are shown Absolute values larger than 060 areconsidered significant and printed in bold The number beside each chemical species in the first column indicates the impactor stage
Site SPC BO
Rotated component RC1 RC2 RC3 RC4 RC5 RC6 RC1 RC2 RC3 RC4 RC5 RC6Assigned Conden- Photochem Dust Sea RTI gasSIA+ Sea Photochem gasSIA+ Resusp RTI Conden-source sation SIA+ salt var gasSOA salt SIA+ gasSOA var sation
SOA SOA
Nitrate_1 081 minus024 024 069Sulfate_1 minus032 028 079 026 084Oxalate_1 minus034 025 minus024 045 037 minus053 024 042Ammonium_1 021 023 084 079 029WSOC_1 023 035 minus040 029 046 minus045 037 041 030 038Nitrate_2 079 036 028 084Sulfate_2 083 030 042 075 022Oxalate_2 028 081 031 minus022 071 043 034Sodium_2 025 minus023 033 043 minus021 056 023 minus029Ammonium_2 056 069 024 039 077 038WSOC_2 030 071 046 072 043 030Nitrate_3 082 040 021 036 minus025 078Sulfate_3 036 079 032 086Oxalate_3 045 073 032 076Sodium_3 minus027 021 084 087Ammonium_3 067 067 029 081 032Magnesium_3 minus024 022 080 033 062 024 042 028Calcium_3 092 050 minus037 027WSOC_3 050 075 032 086 023Chloride_4 057 032 minus029 051 022 minus045 031Nitrate_4 082 043 079 028 028 033Sulfate_4 069 032 039 minus023 075 045 024 minus030Oxalate_4 050 035 038 minus023 031 024 024 036 minus037Sodium_4 094 090 minus021Ammonium_4 089 027 034 030 024 070Magnesium_4 057 077 088 021 029Calcium_4 093 041 064 minus028 029WSOC_4 047 031 052 067 042 minus028Chloride_5 057 029 023 047 minus066 026Nitrate_5 056 037 037 046 054 065Sulfate_5 047 033 064 minus030 069 060 minus022Oxalate_5 029 064 021 029 055 minus046Sodium_5 minus023 075 071 minus050 032Ammonium_5 080 029 026 023 054 050Magnesium_5 029 060 066 069 minus031 056Calcium_5 087 024 033 089WSOC_5 032 030 065 021 048 055 minus027RT_waterandice minus095 minus093RT_naturalveg 070 minus047 082 minus021RT_agriculture 081 039 minus033 084RT_urbanareas 090 091RT_bareareas 043 064 minus053 029 025Sunflux_alongtraj 068 050 minus022 024 068 minus025Temperature minus085 030 minus029 069 minus026 minus023RH 082 minus031 060 minus049 034Explained variance () 22 15 14 12 8 8 19 17 11 11 10 9Cumulative variance () 22 37 51 63 71 79 19 36 47 58 68 77
generation process (Hamed et al 2010) The negative rela-tion with RH confirmed that this source was active during theday when RH was at minimum
In summary the PCA analysis provides a synthetic analy-sis of the main sources of variability in the chemical datasetbut it is not intended to resolve all of them It should be no-ticed for instance that the five factors in BO do not recoverthe local sources of small carbonaceous particles (Fig 10)which increase at night at the urban site lowering the noctur-nal correlation between WSOC and sulfate (Fig 9)
4 Discussion and conclusions
The PCA results indicate that several factors determined thevariability in the size-segregated chemical composition in theregion during the PEGASOS Po Valley field campaign buteach of them affected preferentially specific size intervalswith an overall effect of shaping the aerosol mass distribu-tion at the two sites Two factors corresponding to sea saltand mineral dust with absorbed nitrate regulated the con-centrations and composition of coarse particles (PM12minus10)while only one factor was found to determine an enrich-
wwwatmos-chem-physnet16108792016 Atmos Chem Phys 16 10879ndash10897 2016
10894 S Sandrini et al Size-resolved aerosol composition at an urban and a rural site
ment of ammonium sulfate in the quasi-ultrafine range Fi-nally the variability in composition of accumulation-modeaerosol could be reduced to two factors with one related toregional-scale photochemical formation of SOA and SIA anda second one more dependent on local conditions at surfacelevel and causing a nocturnal increase of SOA and SIA in thedroplet mode However when the factor for photochemicalsecondary aerosols was equally represented at the two sitesthe other one (for nighttime condensation) was much moreimportant at the rural station (SPC) than in BO The effect ona simple nonvolatile SIA component sulfate is exemplifiedin the scatter plot in Fig 11 A good correlation (R2
= 09)was indeed observed between the accumulation-mode sul-fate concentrations at the two sites in daytime (Fig 11) withonly a slight dilution (minus12 ) of the concentrations at thebackground site with respect to the urban site which is ex-pected for an aerosol component that is typically associatedwith regional-scale photochemical pollution By contrast thecorrelation between the concentration trends at the two sitesis much lower at night especially as regards the dropletmode when significantly higher sulfate concentrations oc-curred in SPC compared to BO during the stagnant periodfrom 16 to 20 June Clearly stagnating conditions and theonset of thermal inversions at night favored a partial ldquochemi-cal segregationrdquo of air masses in the surface atmospheric lay-ers within the Po Valley and the size-segregated chemicalcomposition evolved separately at the urban sites close to theApennine foothills with respect to the rural areas in the innerPo Valley during dark hours Specifically rural areas werecharacterized by the presence of ammonium nitrate and byALWC levels above 10 microg mminus3 Deliquesced aerosols couldhost aqueous-phase formation of sulfate (via reaction of SO2with H2O2)
Similarly to SIAs in the droplet mode water-soluble prod-ucts of volatile organic compound (VOC) oxidation couldreadily be taken up by deliquesced particles in SPC atnight A meaningful fraction of the newly formed (1ndash3 hold) WSOC mass in fact has been shown to possess sim-ilar semi-volatile properties to NH4NO3 (Hennigan et al2008 Wilson et al 2006) and can rapidly partition toaerosol water or cloudfog droplets The nature of the noc-turnal enrichment of WSOC in the droplet mode depend-ing on the reactivity in the aqueous phase can be describedby either a reversible mechanism (condensation of water-soluble organic compounds triggered by the change in RHand ALWC) or an irreversible reaction (oxidation of VOCsor oxygenated VOCs with production of stable compounds)Hodas et al (2014) based on measurements performed dur-ing the same campaign in SPC observed an exponential de-crease in gas-phase glyoxal concentrations with increasingALWC and a local nocturnal production of aqueous SOAwas indeed observed by parallel near-real-time WSOC sam-pled with a particle into liquid sampler (PILS) at the samesite (Sullivan et al 2016) The analysis of impactor sam-ples provides only a few clues to disentangle the two effects
The only two organic markers for SOA that were quanti-tatively determined in all samples were oxalate and MSAThe robust correlation between WSOC oxalate and sulfateboth in daytime and at nighttime in SPC indicates that theaccumulation of particulate polar organic compounds con-tributed to the (irreversible) production of stable (oxidized)species Oxalate is generally known to share with sulfate animportant aqueous-phase oxidation pathway (Sorooshian etal 2006) MSA is a more specific marker than oxalate be-ing related to the atmospheric processing of dimethyl sul-fide (DMS) whose emissions are unevenly distributed on theEarth surface and can be intense in biogenically rich marinewaters Our data indeed showed that fine-mode MSA wasmaximum in the days between 26 June and 1 July charac-terized by an easterly or a south-southwesterly circulationbringing marine air masses into the Po Valley basin Suchincrease from long-range transport affected particularly thesize intervals 005ndash014 microm and 014ndash042 microm MSA concen-trations in the droplet mode (042ndash12 microm) showed instead anenhancement at night under stagnant conditions similarly toammonium nitrate (see Supplement) particularly marked inSPC during both episodes and in BO only during 5ndash6 JulyThe increase of MSA in droplet-mode particles under stag-nating conditions points to a DMS (or other reduced sulfurspecies) source other than from the marine boundary layerIn inland areas DMS has sometimes been reported as dom-inantly from terrestrial sources (vegetation and soils) andanthropogenic sources (manure and livestock) with highertemperatures and solar radiation enhancing its emission (Per-raud et al 2015) These findings suggest that the VOCs par-ticipating to the formation of WSOC in the Po Valley also in-cluded organic compounds emitted by agricultural activitiesor even by natural sources and that ALWC in the atmosphericnocturnal surface layer acted as a medium for their formationduring summer time
In conclusion the characteristics of the size-segregatedaerosol composition and its variability at a rural and an ur-ban background site in the Po Valley could be explained bya limited number of factors reflecting main physicochem-ical processes andor transport patterns in the atmosphereFor accumulation-mode particles in particular our analysispoints to two main processes (1) The first is the photochem-ical production of SIA and SOA which occur at comparableconcentrations at the two sites this process is particularlyevident in daytime hours when the lower atmosphere is wellmixed indicating that a major fraction of background sub-micron aerosol concentrations in the Po Valley actually orig-inates from regional-scale sources which can extend overvast continental areas (see also Fig S12 in Decesari et al2014) This has implications for air quality mitigation be-cause this photochemical component is expected to show lit-tle sensitivity to local-scale (city-level) regulations (2) Thesecond is nocturnal SIA and SOA formation enhanced in theshallow cool and humid boundary layer and favored by thepresence of aerosol liquid water Such component of the rural
Atmos Chem Phys 16 10879ndash10897 2016 wwwatmos-chem-physnet16108792016
S Sandrini et al Size-resolved aerosol composition at an urban and a rural site 10895
background aerosol appears more volatile (hence labile) andmore heterogeneously distributed across the Po Valley withthe inner part (where most agricultural activity occurs) actingas a source region especially in terms of agricultural NH3emissions with respect to its southern periphery (more ur-banized) The rural background concentration level is there-fore variable with a positive gradient from the Apenninesborder to the central valley at least for half of the day Theseresults represent an example of a limitation of the classicalLenschow model
5 Data availability
Data are available on request by contacting the correspond-ing author by e-mail
The Supplement related to this article is available onlineat doi105194acp-16-10879-2016-supplement
Acknowledgements This research was conducted as part of theldquoSupersitordquo Project supported by Emilia Romagna Region andRegional Agency for Prevention and Environment (ARPA EmiliaRomagna) under Deliberation Regional Government n 42810The work was also made possible by the European Commissionunder the Framework Programme 7 (FP7) projects PEGASOS(grant agreement 265148) BACCHUS (grant agreement 603445)and by the CNR Joint Lab Project AirndashSea Lab which are highlyacknowledged
Edited by E NemitzReviewed by two anonymous referees
References
Bertram T H Thornton J A Riedel T P Middlebrook A MBahreini R Bates T S Quinn P K and Coffman D J Directobservations of N2O5 reactivity on ambient aerosol particlesGeophys Res Lett 36 L19803 doi1010292009gl0402482009
Bucci S Cairo F Cristofanelli P Decesari S Groess J andFierli F Transport regimes analysis over the Po Valley duringsummer 2012 impacts on Planetary Boundary Layer variabilityand aerosol content in preparation 2016
Carbone C Decesari S Mircea M Giulianelli L Finessi ERinaldi M Fuzzi S Marinoni A Duchi R Perrino C Sar-golini T Varde M Sprovieri F Gobbi G P Angelini Fand Facchini M C Size-resolved aerosol chemical composi-tion over the Italian Peninsula during typical summer and winterconditions Atmos Environ 44 5269ndash5278 2010
Clegg S L Brimblecombe P and Wexler A S Thermodynamicmodel of the system H+-NH+4 -SO2minus
4 -NOminus3 -H2O at tropospherictemperatures J Phys Chem A 102 2137ndash2154 1998
Crosier J Allan J D Coe H Bower K N Formenti P andWilliams P I Chemical composition of summertime aerosol inthe Po Valley (Italy) northern Adriatic and Black Sea Q J RoyMeteor Soc 133 61ndash75 2007
Decesari S Allan J Plass-Duelmer C Williams B J PaglioneM Facchini M C OrsquoDowd C Harrison R M Gietl JK Coe H Giulianelli L Gobbi G P Lanconelli C Car-bone C Worsnop D Lambe A T Ahern A T Moretti FTagliavini E Elste T Gilge S Zhang Y and DallrsquoOsto MMeasurements of the aerosol chemical composition and mixingstate in the Po Valley using multiple spectroscopic techniquesAtmos Chem Phys 14 12109ndash12132 doi105194acp-14-12109-2014 2014
Decesari S Facchini M C Sandrini S Paglione M Gilar-doni S Rinaldi M Cristofanelli P Cairo F Gobbi G PPoluzzi V Morgillo A Bonafegrave G Mentel T Kindler-SchaarA Manninen H Poulain L Wolf F Baltensperger UGanzeveld L Nemitz E and Pandis S The 2012 PEGASOS-SUPERSITO Po Valley campaign an overview in preparation2016
Dorling S R Davies T D and Pierce C E Cluster Analysis ndashA technique for estimating the synoptic meteorological controlson air and precipitation chemistry ndash Method and applicationsAtmos Enviro A-Gen 26 2575ndash2581 1992
Draxler R R and Rolph G D HYSPLIT (HYbrid Single-ParticleLagrangian Integrated Trajectory) Model access via NOAA ARLREADY Website available at httpwwwarlnoaagovreadyhysplit4html NOAA Air Resources Laboratory Silver SpringMD 2003 (last access September 2015)
Farnham I M Singh A K Stetzenbach K J and Johannes-son K H Treatment of nondetects in multivariate analysis ofgroundwater geochemistry data Chemometr Intell Lab 60265ndash281 2002
Gelencser A Meszaros T Blazso M Kiss G Krivacsy ZMolnar A and Meszaros E Structural characterisation oforganic matter in fine tropospheric aerosol by pyrolysis-gaschromatography-mass spectrometry J Atmos Chem 37 173ndash183 2000
Gietl J K Tritscher T and Klemm O Size-segregated analysisof PM10 at two sites urban and rural in Munster (Germany) us-ing five-stage Berner type impactors Atmos Environ 42 5721ndash5727 2008
Gilardoni S Massoli P Giulianelli L Rinaldi M Paglione MPollini F Lanconelli C Poluzzi V Carbone S Hillamo RRussell L M Facchini M C and Fuzzi S Fog scavengingof organic and inorganic aerosol in the Po Valley Atmos ChemPhys 14 6967ndash6981 doi105194acp-14-6967-2014 2014
Hamed A Birmili W Joutsensaari J Mikkonen S Asmi AWehner B Spindler G Jaatinen A Wiedensohler A Korho-nen H Lehtinen K E J and Laaksonen A Changes in theproduction rate of secondary aerosol particles in Central Europein view of decreasing SO2 emissions between 1996 and 2006Atmos Chem Phys 10 1071ndash1091 doi105194acp-10-1071-2010 2010
Harrison R M and Pio C A Size-differentiated composition ofinorganic atmospheric aerosols of both marine and polluted con-tinental origin Atmos Environ 17 1733ndash1738 1983
Hennigan C J Bergin M H Dibb J E and Weber RJ Enhanced secondary organic aerosol formation due to wa-
wwwatmos-chem-physnet16108792016 Atmos Chem Phys 16 10879ndash10897 2016
10896 S Sandrini et al Size-resolved aerosol composition at an urban and a rural site
ter uptake by fine particles Geophys Res Lett 35 L18801doi1010292008gl035046 2008
Hering S V and Friedlander S K Origins of aerosol sulfur sizedistributions in the Los-Angeles Basin Atmos Environ 162647ndash2656 1982
Hodas N Sullivan A P Skog K Keutsch F N Collett J LDecesari S Facchini M C Carlton A G Laaksonen A andTurpin B J Aerosol Liquid Water Driven by Anthropogenic Ni-trate Implications for Lifetimes of Water-Soluble Organic Gasesand Potential for Secondary Organic Aerosol Formation Envi-ron Sci Technol 48 11127ndash11136 2014
Jimenez J L Jayne J T Shi Q Kolb C E Worsnop D RYourshaw I Seinfeld J H Flagan R C Zhang X F SmithK A Morris J W and Davidovits P Ambient aerosol sam-pling using the Aerodyne Aerosol Mass Spectrometer J Geo-phys Res-Atmos 108 8425 doi1010292001jd001213 2003
John W Wall S M Ondo J L and Winklmayr W Modes inthe size distributions of atmospheric inorganic aerosol AtmosEnviron A-Gen 24 2349ndash2359 1990
Krivacsy Z Hoffer A Sarvari Z Temesi D Baltensperger UNyeki S Weingartner E Kleefeld S and Jennings S GRole of organic and black carbon in the chemical composition ofatmospheric aerosol at European background sites Atmos Env-iron 35 6231ndash6244 2001
Laongsri B and Harrison R M Atmospheric behaviour of par-ticulate oxalate at UK urban background and rural sites AtmosEnviron 71 319ndash326 2013
Laskin A Wietsma T W Krueger B J and Grassian VH Heterogeneous chemistry of individual mineral dust par-ticles with nitric acid A combined CCSEMEDX ESEMand ICP-MS study J Geophys Res-Atmos 110 D10208doi1010292004jd005206 2005
Lenschow P Abraham H J Kutzner K Lutz M Preuss J Dand Reichenbacher W Some ideas about the sources of PM10Atmos Environ 35 S23ndashS33 2001
Matta E Facchini M C Decesari S Mircea M Cavalli FFuzzi S Putaud J-P and DellrsquoAcqua A Mass closure onthe chemical species in size-segregated atmospheric aerosol col-lected in an urban area of the Po Valley Italy Atmos ChemPhys 3 623ndash637 doi105194acp-3-623-2003 2003
Meng Z Y and Seinfeld J H On the source of the submicrometerdroplet mode of urban and regional aerosols Aerosol Sci Tech20 253ndash265 1994
Perraud V Horne J R Martinez A S Kalinowski J MeinardiS Dawson M L Wingen L M Dabdub D Blake D RGerber R B and Finlayson-Pitts B J The future of airbornesulfur-containing particles in the absence of fossil fuel sulfurdioxide emissions P Natl Acad Sci USA 112 13514ndash135192015
Putaud J P Van Dingenen R Alastuey A Bauer H Birmili WCyrys J Flentje H Fuzzi S Gehrig R Hansson H C Har-rison R M Herrmann H Hitzenberger R Hueglin C JonesA M Kasper-Giebl A Kiss G Kousa A Kuhlbusch T A JLoeschau G Maenhaut W Molnar A Moreno T PekkanenJ Perrino C Pitz M Puxbaum H Querol X RodriguezS Salma I Schwarz J Smolik J Schneider J Spindler Gten Brink H Tursic J Viana M Wiedensohler A and RaesF A European aerosol phenomenology-3 Physical and chemi-cal characteristics of particulate matter from 60 rural urban and
kerbside sites across Europe Atmos Environ 44 1308ndash13202010
Sardar S B Fine P M and Sioutas C Seasonal and spatialvariability of the size-resolved chemical composition of partic-ulate matter (PM10) in the Los Angeles Basin J Geophys Res-Atmos 110 D07S08 doi1010292004jd004627 2005
Schaap M van Loon M ten Brink H M Dentener F J andBuiltjes P J H Secondary inorganic aerosol simulations forEurope with special attention to nitrate Atmos Chem Phys 4857ndash874 doi105194acp-4-857-2004 2004
Seinfeld J H and Pandis S N (Eds) Atmospheric Chemistry andPhysics from Air Pollution to Climate Change John Wiley andSons New York 1998
Snyder D C Rutter A P Worley C Olson M Plourde ABader R C Dallmann T and Schauer J J Spatial variabil-ity of carbonaceous aerosols and associated source tracers intwo cites in the Midwestern United States Atmos Environ 441597ndash1608 2010
Sorooshian A Varutbangkul V Brechtel F J Ervens B Fein-gold G Bahreini R Murphy S M Holloway J S AtlasE L Buzorius G Jonsson H Flagan R C and SeinfeldJ H Oxalic acid in clear and cloudy atmospheres Analysis ofdata from International Consortium for Atmospheric Researchon Transport and Transformation 2004 J Geophys Res-Atmos111 D23S45 doi1010292005jd006880 2006
Stelson A W and Seinfeld J H Relative-humidity andtemperature-dependence of the ammonium-nitrate dissociationconstant Atmos Environ 16 983ndash992 1982
Sullivan A P Hodas N Turpin B J Skog K Keutsch F NGilardoni S Paglione M Rinaldi M Decesari S FacchiniM C Poulain L Herrmann H Wiedensohler A Nemitz ETwigg M M and Collett Jr J L Evidence for ambient darkaqueous SOA formation in the Po Valley Italy Atmos ChemPhys 16 8095ndash8108 doi105194acp-16-8095-2016 2016
Vandeginste B G M Data mining of water quality data by chemo-metrical methods in Monitoring of Water Quality the Contri-bution of Advanced Technologies Colin and Quevauviller Else-vier 49ndash53 doi101016b978-008043340-050005-9 1998
van Pinxteren D Brueggemann E Gnauk T Mueller K ThielC and Herrmann H A GIS based approach to back trajectoryanalysis for the source apportionment of aerosol constituents andits first application J Atmos Chem 67 1ndash28 2010
van Pinxteren D Neusuumlszlig C and Herrmann H On the abun-dance and source contributions of dicarboxylic acids in size-resolved aerosol particles at continental sites in central EuropeAtmos Chem Phys 14 3913ndash3928 doi105194acp-14-3913-2014 2014
Watson J G Chow J C Lurmann F W and Musarra SP Ammonium-nitrate nitric-acid and ammonia equilibrium inwintertime Phoenix Arizona J Air Waste Manage 44 405ndash412 1994
Weber R J Sullivan A P Peltier R E Russell A Yan BZheng M de Gouw J Warneke C Brock C Holloway JS Atlas E L and Edgerton E A study of secondary or-ganic aerosol formation in the anthropogenic-influenced south-eastern United States J Geophys Res-Atmos 112 D13302doi1010292007jd008408 2007
Westerdahl D Fruin S Sax T Fine P M and Sioutas C Mo-bile platform measurements of ultrafine particles and associated
Atmos Chem Phys 16 10879ndash10897 2016 wwwatmos-chem-physnet16108792016
S Sandrini et al Size-resolved aerosol composition at an urban and a rural site 10897
pollutant concentrations on freeways and residential streets inLos Angeles Atmos Environ 39 3597ndash3610 2005
Wexler A S and Clegg S L Atmospheric aerosol mod-els for systems including the ions H+ NH+4 Na+ SO2minus
4 NOminus3 Clminus Brminus and H2O J Geophys Res-Atmos 107doi1010292001jd000451 2002
Wilson W E Grover B D Long R W Eatough N L andEatough D J The measurement of fine-particulate semivolatilematerial in urban aerosols J Air Waste Manage 56 384ndash3972006
Wolf R El Haddad I Crippa M Decesari S Slowik J GPoulain L Gilardoni S Rinaldi M Carbone S CanonacoF Huang R J Baltensperger U and Prevot A S H Marineand urban influences on summertime PM25 aerosol in the Pobasin using mobile measurements Atmos Environ 120 447ndash454 2015
Zappoli S Andracchio A Fuzzi S Facchini M C GelencserA Kiss G Krivacsy Z Molnar A Meszaros E Hansson HC Rosman K and Zebuhr Y Inorganic organic and macro-molecular components of fine aerosol in different areas of Europein relation to their water solubility Atmos Environ 33 2733ndash2743 1999
Zhang X Liu Z Hecobian A Zheng M Frank N H Edger-ton E S and Weber R J Spatial and seasonal variationsof fine particle water-soluble organic carbon (WSOC) overthe southeastern United States implications for secondary or-ganic aerosol formation Atmos Chem Phys 12 6593ndash6607doi105194acp-12-6593-2012 2012
wwwatmos-chem-physnet16108792016 Atmos Chem Phys 16 10879ndash10897 2016
- Abstract
- Introduction
- Experimental
-
- Sampling sites
- Aerosol sampling
- Analytical measurements
- Back-trajectory calculation
- Aerosol liquid water content (ALWC) calculation
- Principal component analysis
-
- Results
-
- Back-trajectory patterns
- Bulk PM10 aerosol composition
- Size-resolved aerosol composition
- Secondary aerosol formation under stagnant conditions
-
- Secondary inorganic components
- Carbonaceous species
-
- Principal component analysis
-
- Discussion and conclusions
- Data availability
- Acknowledgements
- References
-
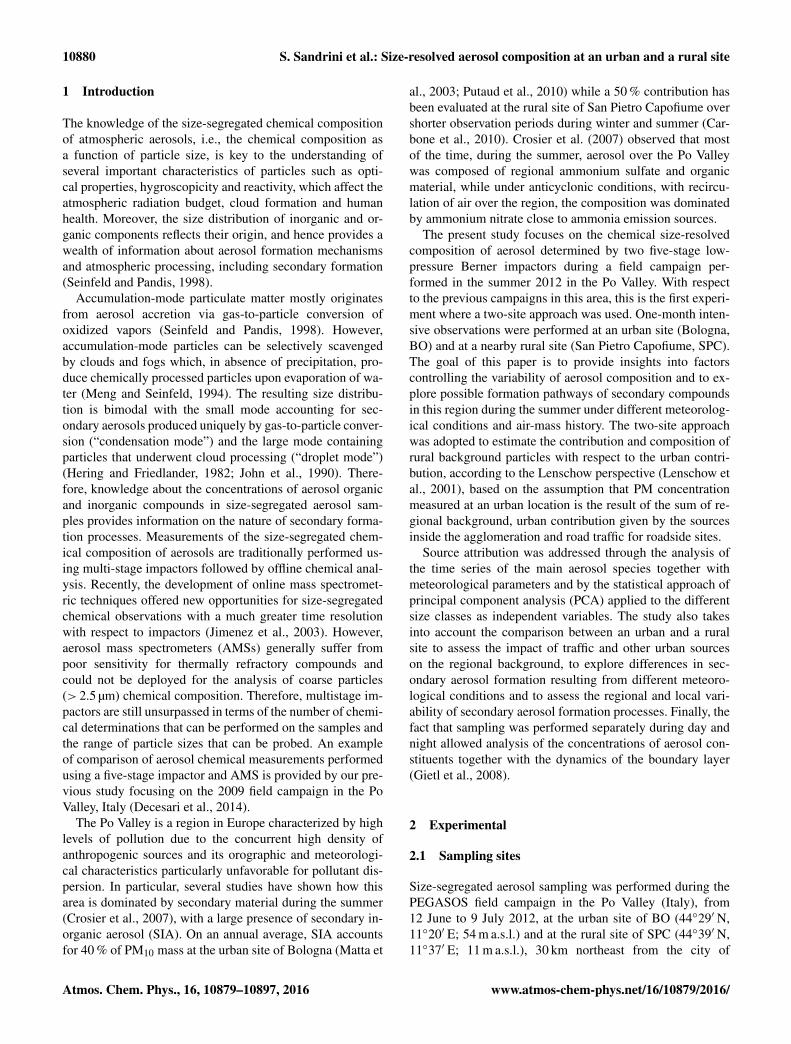
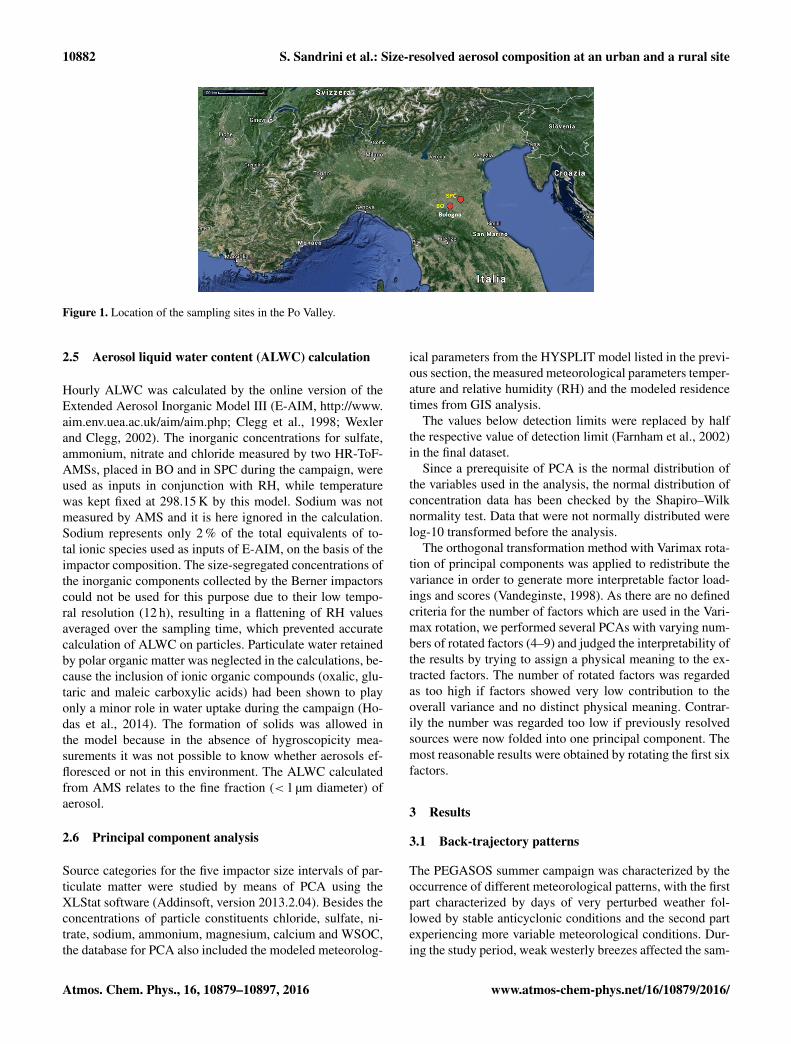
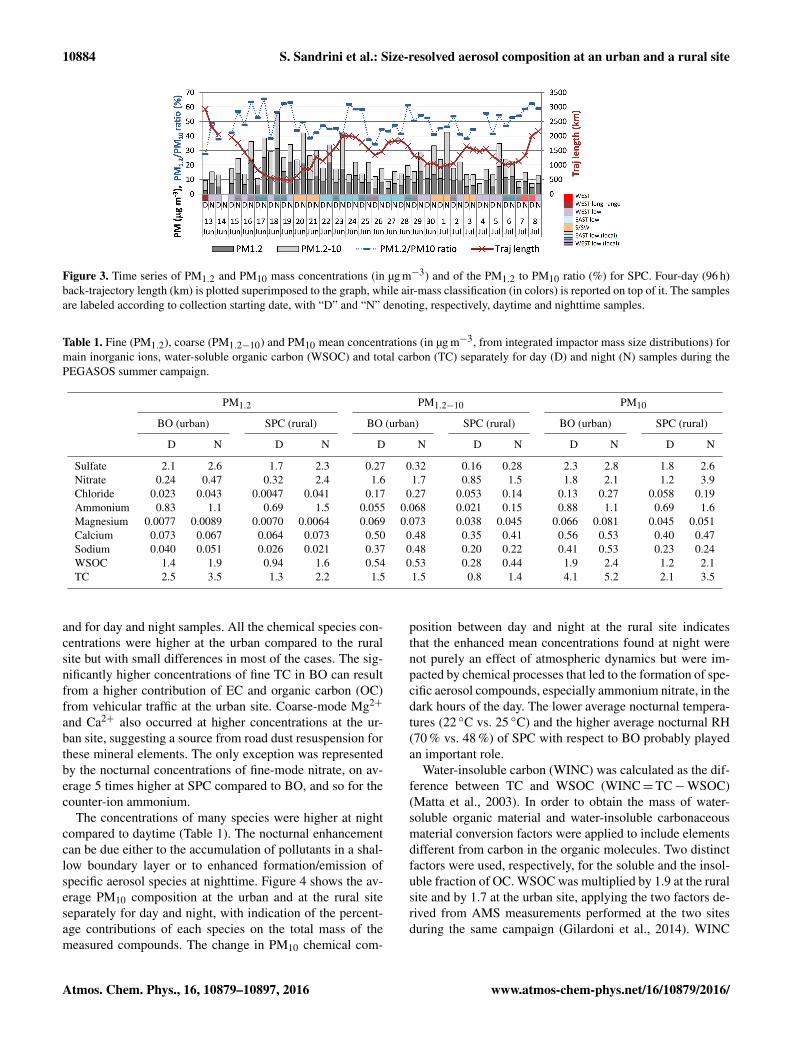
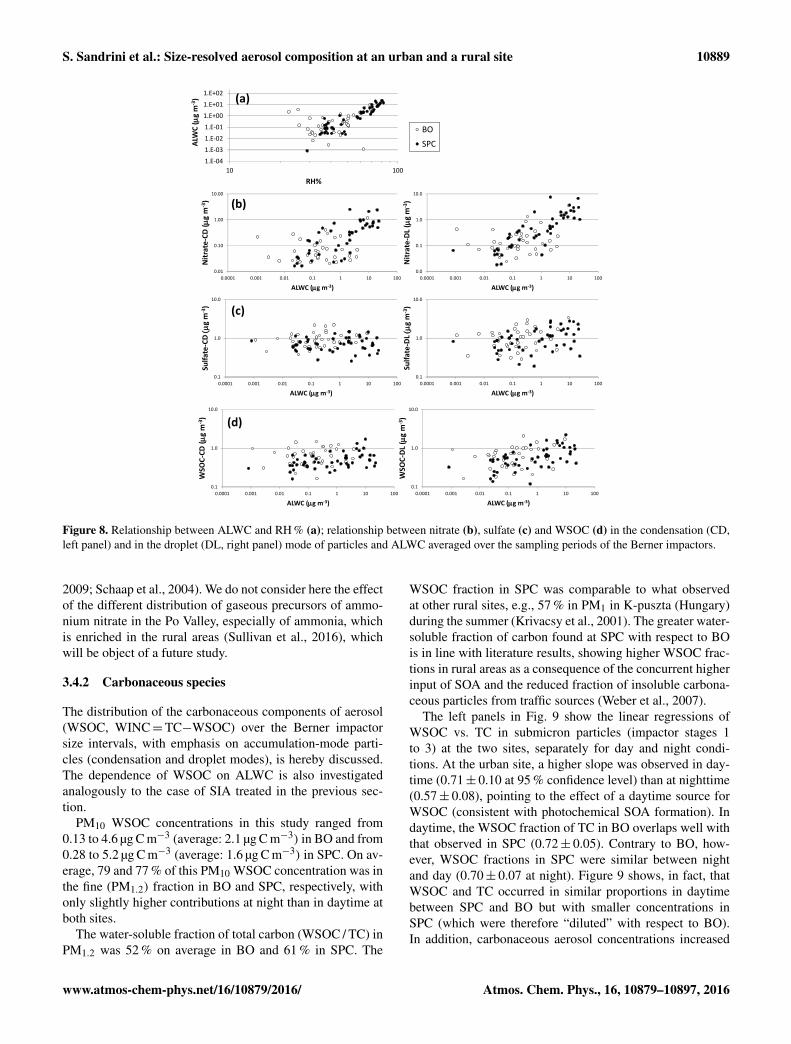