size-scale effects on minimum flexural reinforcement in rc ...framcos.org/framcos-7/01-30.pdf ·...
TRANSCRIPT
Size-scale effects on minimum flexural reinforcement in RC beams: application of the cohesive crack model
E. Cadamuro, M. Corrado & A. Carpinteri Politecnico di Torino, Torino, Italy
ABSTRACT: The prescriptions provided by the codes of practice for the assessment of the minimum rein-forcement amount in reinforced concrete beams usually disregard the nonlinear contribution of concrete in tension and the size-scale effects. In the present paper, these phenomena are correctly taken into account in the description of the flexural failure in lightly reinforced concrete beams by means of a numerical algorithm based on Nonlinear Fracture Mechanics. In this context, the application of Dimensional Analysis permits a reduction in the number of the governing parameters. In particular, it is analytically demonstrated that only two nondimensional parameters, NP and s, are responsible for the brittle-to-ductile transition in the mechani-cal response. According to this approach, a new formula suitable for the evaluation of the minimum rein-forcement in practical applications is proposed. A comparison with experimental results demonstrates the ef-fectiveness of the proposed model.
1 INTRODUCTION
1.1 Standard Codes Provisions
The Limit Analysis of reinforced concrete (RC) beams usually assumes that stretched concrete is not bearing load and so the cracking phenomenon is not taken into account in the evaluation of the load car-rying capacity. This assumption not always yields to a safe design condition, as for instance in the case of lightly reinforced concrete beams, where the tensile concrete contribution determines a hyper-strength with respect to the ultimate loading condition, with a consequent possible instability in the overall me-chanical response. In this case, in fact, the resistant bending moment after the peak cracking moment is a monotonic decreasing function of the crack length, due to an unstable fracture propagation. For this rea-son, all national and international standard codes of practice provide empirical formulas for the determi-nation of the minimum reinforcement amount which enables RC members to prevent unstable crack propagation. Most of them consider only two pa-rameters: the concrete grade and the steel yield strength, whereas other important parameters, such as the size-scale, are completely neglected. As an example, Model Code 90 (1993) and British Stan-dards BS 8110-1 (1997) give values of minimum re-inforcement depending only on the steel grade, whereas Eurocode 2 (2004) and ACI 318-05 (2005) provide values of minimum reinforcement propor-tional to the concrete compressive strength and in inverse relation to the steel yield strength. Only the
Norwegian Standards NS 3473 E (1989) accounts for the effect of the member size, by means of the size-effect factor, kw, equal to 1.5-h/h1 ≥ 1, where h is the beam depth in m, and h1 is equal to 1 m. Fi-nally, the Australian Standards AS 3600 (2001) con-sider the minimum reinforcement as a function of the ratio of overall to effective beam depth, D/d.
1.2 Models for Computing Minimum Reinforcement
A more accurate assessment of the minimum rein-forcement taking into account the size-scale effects should be accomplished in order to save steel rein-forcement and money in case of large structures. To this aim, most of the models available in the litera-ture propose detailed analysis taking into account the complex behavior due to fracture propagation in tension, on the basis of Linear and Nonlinear Frac-ture Mechanics approaches (Ghali et al. 1986, Baluch et al. 1992, Gerstle et al. 1992, Fantilli et al. 1999, Ruiz et al. 1999, Appa Rao et al. 2007).
In this context, significant contributions derive from the application of the Bridged Crack Model (Carpinteri 1981a, 1984, Bosco & Carpinteri 1992), which is based on Linear Elastic Fracture Mechan-ics, to the study of the crack propagation in presence of a reinforcement. According to this model, the overall response of RC beams can be described by means of the reinforcement brittleness number, NP, obtained through Dimensional Analysis on the basis of the mechanical and geometrical properties (Carpinteri 1981a, 1984):
Fracture Mechanics of Concrete and Concrete Structures -Recent Advances in Fracture Mechanics of Concrete - B. H. Oh, et al.(eds)
ⓒ 2010 Korea Concrete Institute, Seoul, ISBN 978-89-5708-180-8
0.5
y
P
IC
hN
K
σρ=
(1)
where σy is the steel yield strength, h is the beam depth, KIC is the concrete toughness, and ρ is the re-inforcement percentage. A ductile behavior is pre-dicted for high values of NP, whereas a brittle re-sponse is expected for low values of NP. In particular, it is possible to define NPC, as the critical value which separates the brittle response from the ductile one, corresponding to the minimum rein-forcement amount condition. The value NPC = 0.26 was experimentally obtained by Bosco et al. (1990) for high strength concrete beams, and, subsequently, the following empirical equation has been proposed by Bosco & Carpinteri (1992) to express the de-pendence of NPC on the concrete grade σc:
c0.1 0.0023
PCN σ= +
(2)
Equating the expression of NP (Eq. (1)) to that of
NPC (Eq. (2)) and solving with respect to ρ, the fol-lowing formula for the minimum reinforcement amount is obtained:
( )min c0.5
y
0.1 0.0023IC
K
hρ σ
σ= + (3)
In the present paper, Dimensional Analysis is ap-
plied to the algorithm proposed by Carpinteri et al. (2007) based on the Cohesive and the Overlapping Crack models in the specific case of lightly rein-forced concrete beams in bending. It will be demon-strated that two nondimensional parameters, NP and s, are responsible for the mechanical behavior, and not NP only, as considered so far. Finally, on the ba-sis of these two brittleness number a new formula will be proposed for the evaluation of the minimum reinforcement amount.
2 THE INTEGRATED COHESIVE AND OVERLAPPING CRACK MODEL
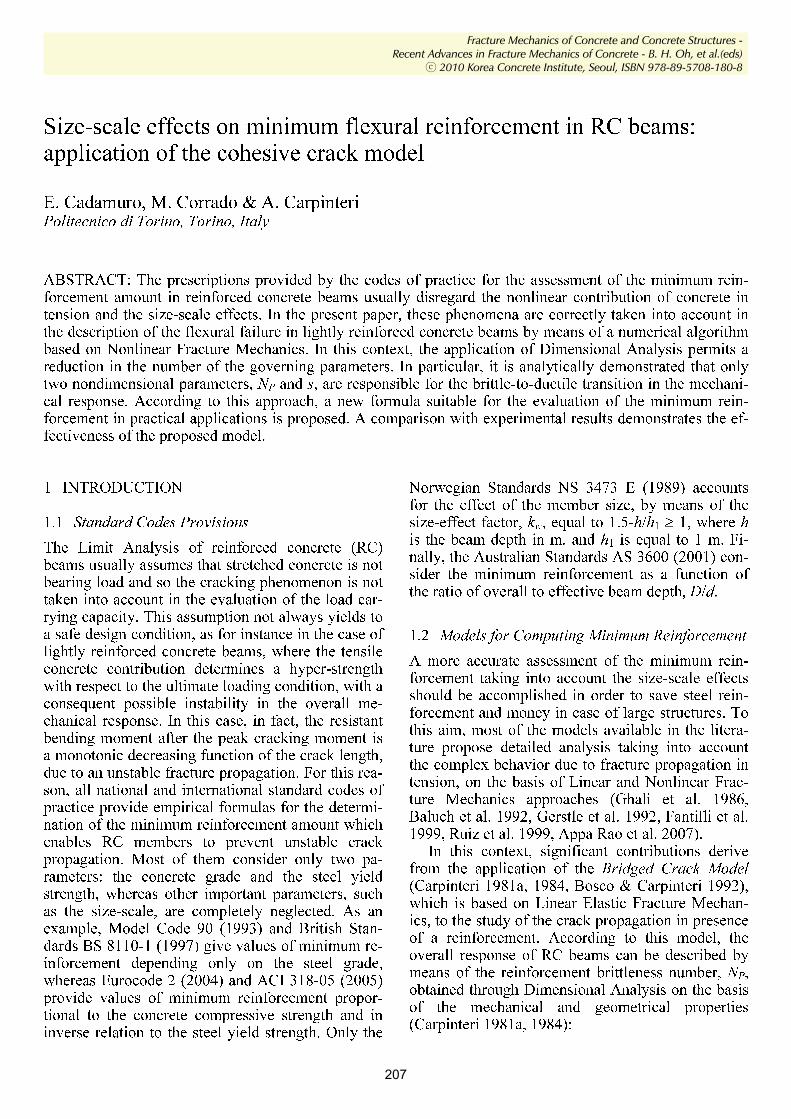
Let us consider the reinforced concrete beam ele-ment in Figure 1 with a rectangular cross-section of thickness b and depth h, a steel reinforcement layer distant c from the lower edge and a crack length a. The beam segment has a length l equal to the depth and is subjected to the external bending moment M. We assume that the middle cross-section can be con-sidered as representative of the mechanical behavior of the whole element, since all the mechanical nonlinearities due to cracking in tension, steel yield-ing and crushing of concrete in compression, are lo-
calized in this section, whereas the outside parts ex-hibit an elastic response.
Figure 1. Scheme of the reinforced concrete element.
2.1 Constitutive Models
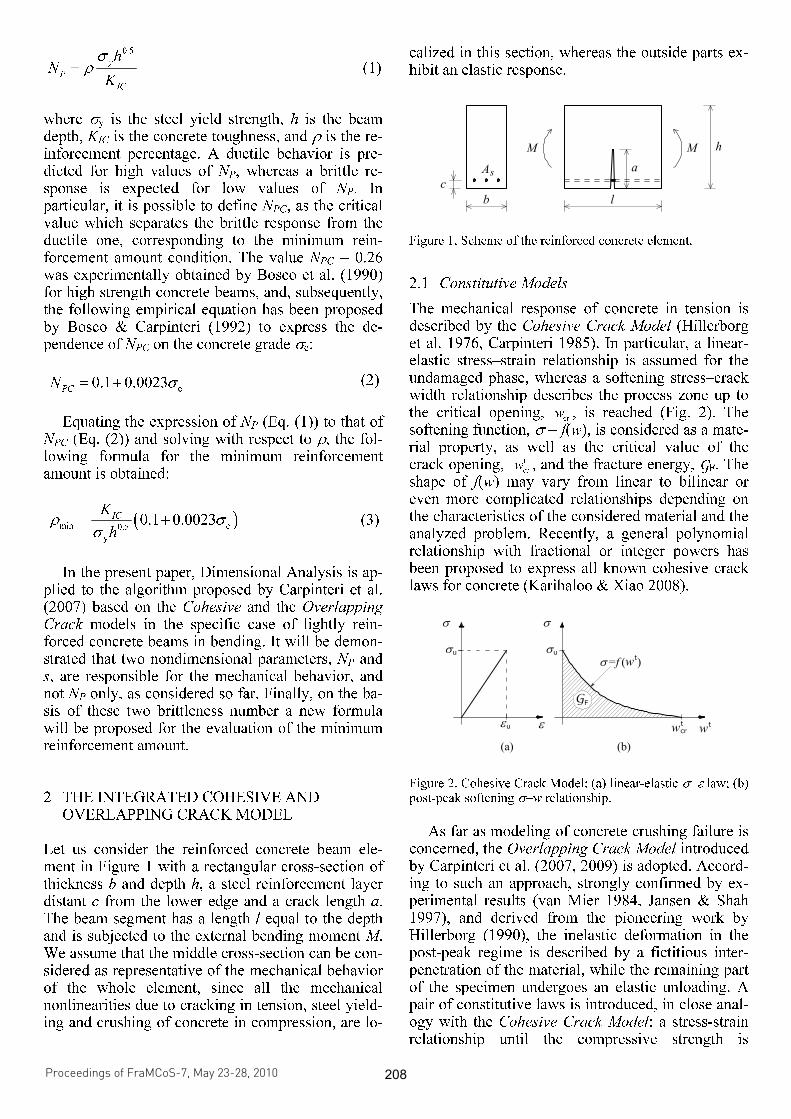
The mechanical response of concrete in tension is described by the Cohesive Crack Model (Hillerborg et al. 1976, Carpinteri 1985). In particular, a linear-elastic stress–strain relationship is assumed for the undamaged phase, whereas a softening stress–crack width relationship describes the process zone up to the critical opening, t
crw , is reached (Fig. 2). The
softening function, σ = f(w), is considered as a mate-rial property, as well as the critical value of the crack opening, t
crw , and the fracture energy, GF. The
shape of f(w) may vary from linear to bilinear or even more complicated relationships depending on the characteristics of the considered material and the analyzed problem. Recently, a general polynomial relationship with fractional or integer powers has been proposed to express all known cohesive crack laws for concrete (Karihaloo & Xiao 2008).
Figure 2. Cohesive Crack Model: (a) linear-elastic σ−ε law; (b) post-peak softening σ−w relationship.
As far as modeling of concrete crushing failure is
concerned, the Overlapping Crack Model introduced by Carpinteri et al. (2007, 2009) is adopted. Accord-ing to such an approach, strongly confirmed by ex-perimental results (van Mier 1984, Jansen & Shah 1997), and derived from the pioneering work by Hillerborg (1990), the inelastic deformation in the post-peak regime is described by a fictitious inter-penetration of the material, while the remaining part of the specimen undergoes an elastic unloading. A pair of constitutive laws is introduced, in close anal-ogy with the Cohesive Crack Model: a stress-strain relationship until the compressive strength is
Proceedings of FraMCoS-7, May 23-28, 2010
hThD ∇−= ),(J (1)
The proportionality coefficient D(h,T) is called moisture permeability and it is a nonlinear function of the relative humidity h and temperature T (Bažant & Najjar 1972). The moisture mass balance requires that the variation in time of the water mass per unit volume of concrete (water content w) be equal to the divergence of the moisture flux J
J•∇=∂
∂−
t
w (2)
The water content w can be expressed as the sum
of the evaporable water we (capillary water, water vapor, and adsorbed water) and the non-evaporable (chemically bound) water wn (Mills 1966, Pantazopoulo & Mills 1995). It is reasonable to assume that the evaporable water is a function of relative humidity, h, degree of hydration, αc, and degree of silica fume reaction, αs, i.e. we=we(h,αc,αs) = age-dependent sorption/desorption isotherm (Norling Mjonell 1997). Under this assumption and by substituting Equation 1 into Equation 2 one obtains
nscw
s
ew
c
ew
hh
Dt
h
h
ew
&&& ++∂
∂
∂
∂
=∇•∇+∂
∂
∂
∂
− αα
αα
)(
(3)
where ∂we/∂h is the slope of the sorption/desorption isotherm (also called moisture capacity). The governing equation (Equation 3) must be completed by appropriate boundary and initial conditions.
The relation between the amount of evaporable water and relative humidity is called ‘‘adsorption isotherm” if measured with increasing relativity humidity and ‘‘desorption isotherm” in the opposite case. Neglecting their difference (Xi et al. 1994), in the following, ‘‘sorption isotherm” will be used with reference to both sorption and desorption conditions. By the way, if the hysteresis of the moisture isotherm would be taken into account, two different relation, evaporable water vs relative humidity, must be used according to the sign of the variation of the relativity humidity. The shape of the sorption isotherm for HPC is influenced by many parameters, especially those that influence extent and rate of the chemical reactions and, in turn, determine pore structure and pore size distribution (water-to-cement ratio, cement chemical composition, SF content, curing time and method, temperature, mix additives, etc.). In the literature various formulations can be found to describe the sorption isotherm of normal concrete (Xi et al. 1994). However, in the present paper the semi-empirical expression proposed by Norling Mjornell (1997) is adopted because it
explicitly accounts for the evolution of hydration reaction and SF content. This sorption isotherm reads
( ) ( )( )
( ) ( )⎥⎥
⎦
⎤
⎢⎢
⎣
⎡
⎥⎥⎥
⎦
⎤
⎢⎢⎢
⎣
⎡
−
−∞
+
−∞
−=
1110
,1
110
11,
1,,
hcc
ge
scK
hcc
ge
scG
sch
ew
αα
αα
αα
αααα
(4)
where the first term (gel isotherm) represents the physically bound (adsorbed) water and the second term (capillary isotherm) represents the capillary water. This expression is valid only for low content of SF. The coefficient G1 represents the amount of water per unit volume held in the gel pores at 100% relative humidity, and it can be expressed (Norling Mjornell 1997) as
( ) ss
s
vgkc
c
c
vgk
scG αααα +=,1
(5)
where k
cvg and k
svg are material parameters. From the
maximum amount of water per unit volume that can fill all pores (both capillary pores and gel pores), one can calculate K1 as one obtains
( )1
110
110
11
22.0188.00
,1
−⎟⎠
⎞⎜⎝
⎛−∞
⎥⎥⎥
⎦
⎤
⎢⎢⎢
⎣
⎡⎟⎠
⎞⎜⎝
⎛−∞
−−+−
=
hcc
ge
hcc
geGs
ssc
w
scK
αα
αα
αα
αα
(6)
The material parameters k
cvg and k
svg and g1 can
be calibrated by fitting experimental data relevant to free (evaporable) water content in concrete at various ages (Di Luzio & Cusatis 2009b).
2.2 Temperature evolution
Note that, at early age, since the chemical reactions associated with cement hydration and SF reaction are exothermic, the temperature field is not uniform for non-adiabatic systems even if the environmental temperature is constant. Heat conduction can be described in concrete, at least for temperature not exceeding 100°C (Bažant & Kaplan 1996), by Fourier’s law, which reads
T∇−= λq (7)
where q is the heat flux, T is the absolute temperature, and λ is the heat conductivity; in this
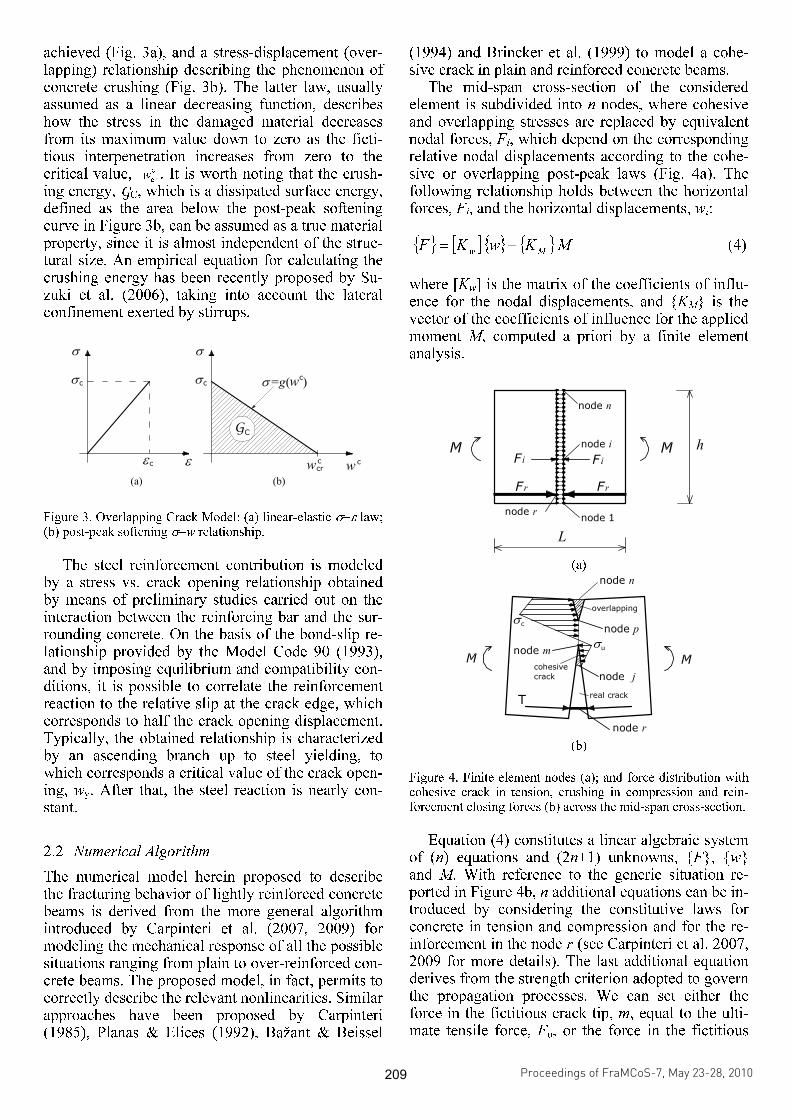
achieved (Fig. 3a), and a stress-displacement (over-lapping) relationship describing the phenomenon of concrete crushing (Fig. 3b). The latter law, usually assumed as a linear decreasing function, describes how the stress in the damaged material decreases from its maximum value down to zero as the ficti-tious interpenetration increases from zero to the critical value, c
crw . It is worth noting that the crush-
ing energy, GC, which is a dissipated surface energy, defined as the area below the post-peak softening curve in Figure 3b, can be assumed as a true material property, since it is almost independent of the struc-tural size. An empirical equation for calculating the crushing energy has been recently proposed by Su-zuki et al. (2006), taking into account the lateral confinement exerted by stirrups.
Figure 3. Overlapping Crack Model: (a) linear-elastic σ−ε law; (b) post-peak softening σ−w relationship.
The steel reinforcement contribution is modeled
by a stress vs. crack opening relationship obtained by means of preliminary studies carried out on the interaction between the reinforcing bar and the sur-rounding concrete. On the basis of the bond-slip re-lationship provided by the Model Code 90 (1993), and by imposing equilibrium and compatibility con-ditions, it is possible to correlate the reinforcement reaction to the relative slip at the crack edge, which corresponds to half the crack opening displacement. Typically, the obtained relationship is characterized by an ascending branch up to steel yielding, to which corresponds a critical value of the crack open-ing, wy. After that, the steel reaction is nearly con-stant.
2.2 Numerical Algorithm
The numerical model herein proposed to describe the fracturing behavior of lightly reinforced concrete beams is derived from the more general algorithm introduced by Carpinteri et al. (2007, 2009) for modeling the mechanical response of all the possible situations ranging from plain to over-reinforced con-crete beams. The proposed model, in fact, permits to correctly describe the relevant nonlinearities. Similar approaches have been proposed by Carpinteri (1985), Planas & Elices (1992), Bažant & Beissel
(1994) and Brincker et al. (1999) to model a cohe-sive crack in plain and reinforced concrete beams.
The mid-span cross-section of the considered element is subdivided into n nodes, where cohesive and overlapping stresses are replaced by equivalent nodal forces, Fi, which depend on the corresponding relative nodal displacements according to the cohe-sive or overlapping post-peak laws (Fig. 4a). The following relationship holds between the horizontal forces, Fi, and the horizontal displacements, wi:
{ } [ ]{ } { }MKwKFMw
+= (4)
where [Kw] is the matrix of the coefficients of influ-ence for the nodal displacements, and {KM} is the vector of the coefficients of influence for the applied moment M, computed a priori by a finite element analysis.
(a)
(b)
Figure 4. Finite element nodes (a); and force distribution with cohesive crack in tension, crushing in compression and rein-forcement closing forces (b) across the mid-span cross-section.
Equation (4) constitutes a linear algebraic system
of (n) equations and (2n+1) unknowns, {F}, {w} and M. With reference to the generic situation re-ported in Figure 4b, n additional equations can be in-troduced by considering the constitutive laws for concrete in tension and compression and for the re-inforcement in the node r (see Carpinteri et al. 2007, 2009 for more details). The last additional equation derives from the strength criterion adopted to govern the propagation processes. We can set either the force in the fictitious crack tip, m, equal to the ulti-mate tensile force, Fu, or the force in the fictitious
Proceedings of FraMCoS-7, May 23-28, 2010
hThD ∇−= ),(J (1)
The proportionality coefficient D(h,T) is called moisture permeability and it is a nonlinear function of the relative humidity h and temperature T (Bažant & Najjar 1972). The moisture mass balance requires that the variation in time of the water mass per unit volume of concrete (water content w) be equal to the divergence of the moisture flux J
J•∇=∂
∂−
t
w (2)
The water content w can be expressed as the sum
of the evaporable water we (capillary water, water vapor, and adsorbed water) and the non-evaporable (chemically bound) water wn (Mills 1966, Pantazopoulo & Mills 1995). It is reasonable to assume that the evaporable water is a function of relative humidity, h, degree of hydration, αc, and degree of silica fume reaction, αs, i.e. we=we(h,αc,αs) = age-dependent sorption/desorption isotherm (Norling Mjonell 1997). Under this assumption and by substituting Equation 1 into Equation 2 one obtains
nscw
s
ew
c
ew
hh
Dt
h
h
ew
&&& ++∂
∂
∂
∂
=∇•∇+∂
∂
∂
∂
− αα
αα
)(
(3)
where ∂we/∂h is the slope of the sorption/desorption isotherm (also called moisture capacity). The governing equation (Equation 3) must be completed by appropriate boundary and initial conditions.
The relation between the amount of evaporable water and relative humidity is called ‘‘adsorption isotherm” if measured with increasing relativity humidity and ‘‘desorption isotherm” in the opposite case. Neglecting their difference (Xi et al. 1994), in the following, ‘‘sorption isotherm” will be used with reference to both sorption and desorption conditions. By the way, if the hysteresis of the moisture isotherm would be taken into account, two different relation, evaporable water vs relative humidity, must be used according to the sign of the variation of the relativity humidity. The shape of the sorption isotherm for HPC is influenced by many parameters, especially those that influence extent and rate of the chemical reactions and, in turn, determine pore structure and pore size distribution (water-to-cement ratio, cement chemical composition, SF content, curing time and method, temperature, mix additives, etc.). In the literature various formulations can be found to describe the sorption isotherm of normal concrete (Xi et al. 1994). However, in the present paper the semi-empirical expression proposed by Norling Mjornell (1997) is adopted because it
explicitly accounts for the evolution of hydration reaction and SF content. This sorption isotherm reads
( ) ( )( )
( ) ( )⎥⎥
⎦
⎤
⎢⎢
⎣
⎡
⎥⎥⎥
⎦
⎤
⎢⎢⎢
⎣
⎡
−
−∞
+
−∞
−=
1110
,1
110
11,
1,,
hcc
ge
scK
hcc
ge
scG
sch
ew
αα
αα
αα
αααα
(4)
where the first term (gel isotherm) represents the physically bound (adsorbed) water and the second term (capillary isotherm) represents the capillary water. This expression is valid only for low content of SF. The coefficient G1 represents the amount of water per unit volume held in the gel pores at 100% relative humidity, and it can be expressed (Norling Mjornell 1997) as
( ) ss
s
vgkc
c
c
vgk
scG αααα +=,1
(5)
where k
cvg and k
svg are material parameters. From the
maximum amount of water per unit volume that can fill all pores (both capillary pores and gel pores), one can calculate K1 as one obtains
( )1
110
110
11
22.0188.00
,1
−⎟⎠
⎞⎜⎝
⎛−∞
⎥⎥⎥
⎦
⎤
⎢⎢⎢
⎣
⎡⎟⎠
⎞⎜⎝
⎛−∞
−−+−
=
hcc
ge
hcc
geGs
ssc
w
scK
αα
αα
αα
αα
(6)
The material parameters k
cvg and k
svg and g1 can
be calibrated by fitting experimental data relevant to free (evaporable) water content in concrete at various ages (Di Luzio & Cusatis 2009b).
2.2 Temperature evolution
Note that, at early age, since the chemical reactions associated with cement hydration and SF reaction are exothermic, the temperature field is not uniform for non-adiabatic systems even if the environmental temperature is constant. Heat conduction can be described in concrete, at least for temperature not exceeding 100°C (Bažant & Kaplan 1996), by Fourier’s law, which reads
T∇−= λq (7)
where q is the heat flux, T is the absolute temperature, and λ is the heat conductivity; in this
crushing tip, p, equal to the ultimate compressive force, Fc. It is important to note that cracking and crushing phenomena are physically independent of each other. As a result, the situation which is closer to one of these two possible conditions is chosen to establish the prevailing phenomenon. The driving parameter of the process is the position of the ficti-tious tip that in the considered step has reached the limit resistance. Finally, at each step, we can com-pute the rotation, ϑ:
{ } { }T
w MD w D Mϑ = + (5)
where {Dw} is the vector of the coefficients of influ-ence for the nodal displacements, and DM is the co-efficient of influence for the applied bending mo-ment, M. The size-scale effects are taken into account by means of relationships of proportionality that affect the coefficients of influence entering Eqs. (4) and (5).
3 APPLICATION OF DIMENSIONAL ANALYSIS TO LIGHTLY RC BEAMS
The most relevant applications of Dimensional Analysis in Solids Mechanics have concerned com-plete and incomplete physical similarity of strength and toughness in disordered materials (Carpinteri 1980, 1981b, 1984, Phatak & Dhonde 2003, Phatak & Deshpande 2005), as well as the study of the in-complete self-similarity in fatigue crack growth (Barenblatt & Botvina 1980, Ciavarella et al. 2008).
When the flexural behavior of reinforced concrete beams is studied, according to the numerical model proposed in the previous section, the functional rela-tionship among the quantities that characterize the phenomenon is the following:
M = Φ (σu, GF, σc, GC, Ec, σy, ρt, h; b/h, l/h, ϑ) (6)
where M is the resistant bending moment, σu, GF, σc, GC, Ec are, respectively, the tensile strength, the frac-ture energy, the compressive strength, the crushing energy, and the elastic modulus of concrete, σy and ρt represent the yielding strength and the percentage of the tensile reinforcement, h is the characteristic size of the body, b/h and l/h define the geometry of the sample according to Figure 1, and ϑ is the local rotation of the element. Since we are interested in the mechanical response of lightly reinforced con-crete beams, the set of variables can be reduced as follows:
M = Φ (σu, GF, Ec, σy, ρt, h; ϑ) (7)
where the parameters describing the behavior of concrete in compression, σc and GC, are not explic-itly considered, since the crushing failure is not in-volved in the failure mechanism. On the other hand, only the beam depth, h, is considered if the geomet-rical ratios of the samples, b/h and L/h, are assumed to be constant. The application of Buckingham’s Π-Theorem (Buckingham 1915) for physical similitude and scale modeling permits to minimize the dimen-sion space of the primary variables by combining them into dimensionless groups, as follows:
1 21 2 1 2
yu c1 t5 2
F c F c F c F c
, ,
hh E hM
h E E E E
σσρ ϑΦ
⎛ ⎞⎜ ⎟=⎜ ⎟⎝ ⎠G G G G
(8)
if h and
F cEG are assumed as the dimensionally
independent variables. It is worth noting that the former parameter is representative of the size-scale of the specimen, whereas the latter is a material property. In particular, the term
F cEG corre-
sponds to the concrete fracture toughness, KIC, ac-cording to the fundamental relationship proposed by Irwin (1957). As a consequence, the dimensionless functional relation for the proposed model becomes:
( )2 P n, ,M s N ϑΦ%
= (9)
where:
1 2
u
ICK
shσ
= (10)
and
1 2
y
tP
IC
hN
K
σρ= (11)
are the governing nondimensional numbers, M% is the nondimensional bending moment, and ϑn is the normalized local rotation. It is worth noting that Eq. (10), which represents the stress brittleness number introduced by Carpinteri (1981b, 1982), includes only the mechanical properties of the matrix and the size scale of the problem. On the other hand, Eq. (11) represents the reinforcement brittleness number introduced again by Carpinteri (1984) contextually with the Bridged Crack Model, and containing the properties of the reinforcement. As a result of the Dimensional Analysis, according to Eq. (9), the structural response, in terms of M% versus ϑn, is a function of NP and s.
Proceedings of FraMCoS-7, May 23-28, 2010
hThD ∇−= ),(J (1)
The proportionality coefficient D(h,T) is called moisture permeability and it is a nonlinear function of the relative humidity h and temperature T (Bažant & Najjar 1972). The moisture mass balance requires that the variation in time of the water mass per unit volume of concrete (water content w) be equal to the divergence of the moisture flux J
J•∇=∂
∂−
t
w (2)
The water content w can be expressed as the sum
of the evaporable water we (capillary water, water vapor, and adsorbed water) and the non-evaporable (chemically bound) water wn (Mills 1966, Pantazopoulo & Mills 1995). It is reasonable to assume that the evaporable water is a function of relative humidity, h, degree of hydration, αc, and degree of silica fume reaction, αs, i.e. we=we(h,αc,αs) = age-dependent sorption/desorption isotherm (Norling Mjonell 1997). Under this assumption and by substituting Equation 1 into Equation 2 one obtains
nscw
s
ew
c
ew
hh
Dt
h
h
ew
&&& ++∂
∂
∂
∂
=∇•∇+∂
∂
∂
∂
− αα
αα
)(
(3)
where ∂we/∂h is the slope of the sorption/desorption isotherm (also called moisture capacity). The governing equation (Equation 3) must be completed by appropriate boundary and initial conditions.
The relation between the amount of evaporable water and relative humidity is called ‘‘adsorption isotherm” if measured with increasing relativity humidity and ‘‘desorption isotherm” in the opposite case. Neglecting their difference (Xi et al. 1994), in the following, ‘‘sorption isotherm” will be used with reference to both sorption and desorption conditions. By the way, if the hysteresis of the moisture isotherm would be taken into account, two different relation, evaporable water vs relative humidity, must be used according to the sign of the variation of the relativity humidity. The shape of the sorption isotherm for HPC is influenced by many parameters, especially those that influence extent and rate of the chemical reactions and, in turn, determine pore structure and pore size distribution (water-to-cement ratio, cement chemical composition, SF content, curing time and method, temperature, mix additives, etc.). In the literature various formulations can be found to describe the sorption isotherm of normal concrete (Xi et al. 1994). However, in the present paper the semi-empirical expression proposed by Norling Mjornell (1997) is adopted because it
explicitly accounts for the evolution of hydration reaction and SF content. This sorption isotherm reads
( ) ( )( )
( ) ( )⎥⎥
⎦
⎤
⎢⎢
⎣
⎡
⎥⎥⎥
⎦
⎤
⎢⎢⎢
⎣
⎡
−
−∞
+
−∞
−=
1110
,1
110
11,
1,,
hcc
ge
scK
hcc
ge
scG
sch
ew
αα
αα
αα
αααα
(4)
where the first term (gel isotherm) represents the physically bound (adsorbed) water and the second term (capillary isotherm) represents the capillary water. This expression is valid only for low content of SF. The coefficient G1 represents the amount of water per unit volume held in the gel pores at 100% relative humidity, and it can be expressed (Norling Mjornell 1997) as
( ) ss
s
vgkc
c
c
vgk
scG αααα +=,1
(5)
where k
cvg and k
svg are material parameters. From the
maximum amount of water per unit volume that can fill all pores (both capillary pores and gel pores), one can calculate K1 as one obtains
( )1
110
110
11
22.0188.00
,1
−⎟⎠
⎞⎜⎝
⎛−∞
⎥⎥⎥
⎦
⎤
⎢⎢⎢
⎣
⎡⎟⎠
⎞⎜⎝
⎛−∞
−−+−
=
hcc
ge
hcc
geGs
ssc
w
scK
αα
αα
αα
αα
(6)
The material parameters k
cvg and k
svg and g1 can
be calibrated by fitting experimental data relevant to free (evaporable) water content in concrete at various ages (Di Luzio & Cusatis 2009b).
2.2 Temperature evolution
Note that, at early age, since the chemical reactions associated with cement hydration and SF reaction are exothermic, the temperature field is not uniform for non-adiabatic systems even if the environmental temperature is constant. Heat conduction can be described in concrete, at least for temperature not exceeding 100°C (Bažant & Kaplan 1996), by Fourier’s law, which reads
T∇−= λq (7)
where q is the heat flux, T is the absolute temperature, and λ is the heat conductivity; in this

4 COMPARISON OF NUMERICAL PREDICTIONS AND EXPERIMENTAL RESULTS
The experimental investigation herein considered was carried out in the Materials and Structures Laboratory of the Department of Structural and Geo-technical Engineering of the Politecnico di Torino, by Bosco et al. (1990) with the main purpose of veri-fying the existence of size effects in the structural behavior. Thirty three-point-bending tests were per-formed on reinforced high-strength concrete beams. Three different size-scales have been considered, characterized by a depth, h, equal to 0.1, 0.2 and 0.4 m, and a constant thickness, b, equal to 0.15 m. The span to depth ratio was set equal to 6. The concrete properties were the following: cylindrical compres-sive strength σc = 76 MPa, secant elastic modulus Ec = 34300 MPa, and fracture energy GF = 0.090 N/mm. As regards the reinforcement, the nominal diameters of the adopted steel bars were 4, 5, 8 and
10 mm. The corresponding yield strengths were: 637, 569, 441 and 456 MPa. It is worth noting that the percentages were not assumed constant by vary-ing the specimen size. On the contrary, they were varied keeping constant the brittleness number NP, defined in Eq. (1).
Some of the numerical simulations compared to the corresponding experimental results, in terms of applied load vs. mid-span deflection curves, are shown in Figures 5 to 7. In the numerical simula-tions the RC element of Figure 1 is assumed to be representative of the mid-span portion of the beam subjected to the three-point-bending test. Hence, the mid-span deflection is obtained as the sum of the lo-calized rotation contribution given by Eq. (5) and the elastic contribution, according to the following expression:
3
loc el
c
1
4 48
l Pl
E J
ϑδ δ δ= + = + (12)
(a) ρ = 0.085 % (NP = 0.10) (b) ρ = 0.256 % (NP = 0.26) (c) ρ = 0.653 % (NP = 0.53)
Figure 5. Comparison between numerical and experimental applied load vs. mid-span deflection curves for beam depth h = 0.2 m.
(a) ρ = 0.064 % (NP = 0.10) (b) ρ = 0.190 % (NP = 0.26) (c) ρ = 0.490 % (NP = 0.53)
Figure 6. Comparison between numerical and experimental applied load vs. mid-span deflection curves for beam depth h = 0.4 m.
(a) ρ = 0.043 % (NP = 0.10) (b) ρ = 0.128 % (NP = 0.26) (c) ρ = 0.327 % (NP = 0.53)
Figure 7. Comparison between numerical and experimental applied load vs. mid-span deflection curves for beam depth h = 0.6 m.
Proceedings of FraMCoS-7, May 23-28, 2010
hThD ∇−= ),(J (1)
The proportionality coefficient D(h,T) is called moisture permeability and it is a nonlinear function of the relative humidity h and temperature T (Bažant & Najjar 1972). The moisture mass balance requires that the variation in time of the water mass per unit volume of concrete (water content w) be equal to the divergence of the moisture flux J
J•∇=∂
∂−
t
w (2)
The water content w can be expressed as the sum
of the evaporable water we (capillary water, water vapor, and adsorbed water) and the non-evaporable (chemically bound) water wn (Mills 1966, Pantazopoulo & Mills 1995). It is reasonable to assume that the evaporable water is a function of relative humidity, h, degree of hydration, αc, and degree of silica fume reaction, αs, i.e. we=we(h,αc,αs) = age-dependent sorption/desorption isotherm (Norling Mjonell 1997). Under this assumption and by substituting Equation 1 into Equation 2 one obtains
nscw
s
ew
c
ew
hh
Dt
h
h
ew
&&& ++∂
∂
∂
∂
=∇•∇+∂
∂
∂
∂
− αα
αα
)(
(3)
where ∂we/∂h is the slope of the sorption/desorption isotherm (also called moisture capacity). The governing equation (Equation 3) must be completed by appropriate boundary and initial conditions.
The relation between the amount of evaporable water and relative humidity is called ‘‘adsorption isotherm” if measured with increasing relativity humidity and ‘‘desorption isotherm” in the opposite case. Neglecting their difference (Xi et al. 1994), in the following, ‘‘sorption isotherm” will be used with reference to both sorption and desorption conditions. By the way, if the hysteresis of the moisture isotherm would be taken into account, two different relation, evaporable water vs relative humidity, must be used according to the sign of the variation of the relativity humidity. The shape of the sorption isotherm for HPC is influenced by many parameters, especially those that influence extent and rate of the chemical reactions and, in turn, determine pore structure and pore size distribution (water-to-cement ratio, cement chemical composition, SF content, curing time and method, temperature, mix additives, etc.). In the literature various formulations can be found to describe the sorption isotherm of normal concrete (Xi et al. 1994). However, in the present paper the semi-empirical expression proposed by Norling Mjornell (1997) is adopted because it
explicitly accounts for the evolution of hydration reaction and SF content. This sorption isotherm reads
( ) ( )( )
( ) ( )⎥⎥
⎦
⎤
⎢⎢
⎣
⎡
⎥⎥⎥
⎦
⎤
⎢⎢⎢
⎣
⎡
−
−∞
+
−∞
−=
1110
,1
110
11,
1,,
hcc
ge
scK
hcc
ge
scG
sch
ew
αα
αα
αα
αααα
(4)
where the first term (gel isotherm) represents the physically bound (adsorbed) water and the second term (capillary isotherm) represents the capillary water. This expression is valid only for low content of SF. The coefficient G1 represents the amount of water per unit volume held in the gel pores at 100% relative humidity, and it can be expressed (Norling Mjornell 1997) as
( ) ss
s
vgkc
c
c
vgk
scG αααα +=,1
(5)
where k
cvg and k
svg are material parameters. From the
maximum amount of water per unit volume that can fill all pores (both capillary pores and gel pores), one can calculate K1 as one obtains
( )1
110
110
11
22.0188.00
,1
−⎟⎠
⎞⎜⎝
⎛−∞
⎥⎥⎥
⎦
⎤
⎢⎢⎢
⎣
⎡⎟⎠
⎞⎜⎝
⎛−∞
−−+−
=
hcc
ge
hcc
geGs
ssc
w
scK
αα
αα
αα
αα
(6)
The material parameters k
cvg and k
svg and g1 can
be calibrated by fitting experimental data relevant to free (evaporable) water content in concrete at various ages (Di Luzio & Cusatis 2009b).
2.2 Temperature evolution
Note that, at early age, since the chemical reactions associated with cement hydration and SF reaction are exothermic, the temperature field is not uniform for non-adiabatic systems even if the environmental temperature is constant. Heat conduction can be described in concrete, at least for temperature not exceeding 100°C (Bažant & Kaplan 1996), by Fourier’s law, which reads
T∇−= λq (7)
where q is the heat flux, T is the absolute temperature, and λ is the heat conductivity; in this
where l is the beam span, and J is the moment of in-ertia of the cross-section. The curves in Figures 5 to 7 evidence a general good agreement between nu-merical and experimental results, although a linear softening law has been introduced in the cohesive model instead of a more complex relationship.
5 NUMERICAL RESULTS AND DISCUSSION
5.1 Parametric Analysis
In this section, according to the results of the dimen-sional analysis, the ductile-to-brittle transition in the structural response is analyzed on the basis of the two nondimensional numbers defined by Eqs. (10) and (11). The yielding strength and the elastic modulus of the steel reinforcement, as well as its relative distance from the tensile edge, c/h, are as-sumed, respectively, equal to 600 MPa, 200000 N/mm
2, and 0.10, for all the numerical simulations.
Also the beam width, b, is assumed to be constant and equal to 0.15 m. In this case, since the geometri-cal ratio b/h is no longer a constant, the expression of the nondimensional moment becomes:
3 2
F c
MM
bh E=
%
G (13)
The dimensionless moment versus normalized ro-
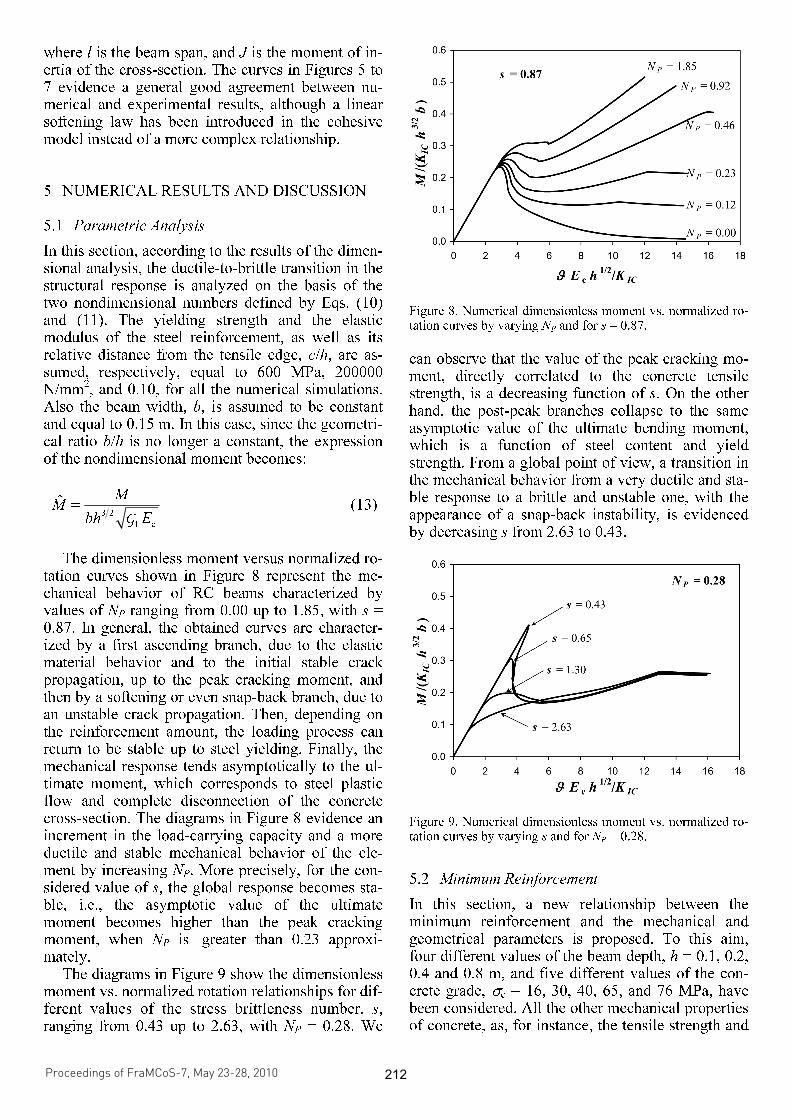
tation curves shown in Figure 8 represent the me-chanical behavior of RC beams characterized by values of NP ranging from 0.00 up to 1.85, with s = 0.87. In general, the obtained curves are character-ized by a first ascending branch, due to the elastic material behavior and to the initial stable crack propagation, up to the peak cracking moment, and then by a softening or even snap-back branch, due to an unstable crack propagation. Then, depending on the reinforcement amount, the loading process can return to be stable up to steel yielding. Finally, the mechanical response tends asymptotically to the ul-timate moment, which corresponds to steel plastic flow and complete disconnection of the concrete cross-section. The diagrams in Figure 8 evidence an increment in the load-carrying capacity and a more ductile and stable mechanical behavior of the ele-ment by increasing NP. More precisely, for the con-sidered value of s, the global response becomes sta-ble, i.e., the asymptotic value of the ultimate moment becomes higher than the peak cracking moment, when NP is greater than 0.23 approxi-mately.
The diagrams in Figure 9 show the dimensionless moment vs. normalized rotation relationships for dif-ferent values of the stress brittleness number, s, ranging from 0.43 up to 2.63, with NP = 0.28. We
Figure 8. Numerical dimensionless moment vs. normalized ro-tation curves by varying NP and for s = 0.87.
can observe that the value of the peak cracking mo-ment, directly correlated to the concrete tensile strength, is a decreasing function of s. On the other hand, the post-peak branches collapse to the same asymptotic value of the ultimate bending moment, which is a function of steel content and yield strength. From a global point of view, a transition in the mechanical behavior from a very ductile and sta-ble response to a brittle and unstable one, with the appearance of a snap-back instability, is evidenced by decreasing s from 2.63 to 0.43.
Figure 9. Numerical dimensionless moment vs. normalized ro-tation curves by varying s and for NP = 0.28.
5.2 Minimum Reinforcement
In this section, a new relationship between the minimum reinforcement and the mechanical and geometrical parameters is proposed. To this aim, four different values of the beam depth, h = 0.1, 0.2, 0.4 and 0.8 m, and five different values of the con-crete grade, σc = 16, 30, 40, 65, and 76 MPa, have been considered. All the other mechanical properties of concrete, as, for instance, the tensile strength and
Proceedings of FraMCoS-7, May 23-28, 2010
hThD ∇−= ),(J (1)
The proportionality coefficient D(h,T) is called moisture permeability and it is a nonlinear function of the relative humidity h and temperature T (Bažant & Najjar 1972). The moisture mass balance requires that the variation in time of the water mass per unit volume of concrete (water content w) be equal to the divergence of the moisture flux J
J•∇=∂
∂−
t
w (2)
The water content w can be expressed as the sum
of the evaporable water we (capillary water, water vapor, and adsorbed water) and the non-evaporable (chemically bound) water wn (Mills 1966, Pantazopoulo & Mills 1995). It is reasonable to assume that the evaporable water is a function of relative humidity, h, degree of hydration, αc, and degree of silica fume reaction, αs, i.e. we=we(h,αc,αs) = age-dependent sorption/desorption isotherm (Norling Mjonell 1997). Under this assumption and by substituting Equation 1 into Equation 2 one obtains
nscw
s
ew
c
ew
hh
Dt
h
h
ew
&&& ++∂
∂
∂
∂
=∇•∇+∂
∂
∂
∂
− αα
αα
)(
(3)
where ∂we/∂h is the slope of the sorption/desorption isotherm (also called moisture capacity). The governing equation (Equation 3) must be completed by appropriate boundary and initial conditions.
The relation between the amount of evaporable water and relative humidity is called ‘‘adsorption isotherm” if measured with increasing relativity humidity and ‘‘desorption isotherm” in the opposite case. Neglecting their difference (Xi et al. 1994), in the following, ‘‘sorption isotherm” will be used with reference to both sorption and desorption conditions. By the way, if the hysteresis of the moisture isotherm would be taken into account, two different relation, evaporable water vs relative humidity, must be used according to the sign of the variation of the relativity humidity. The shape of the sorption isotherm for HPC is influenced by many parameters, especially those that influence extent and rate of the chemical reactions and, in turn, determine pore structure and pore size distribution (water-to-cement ratio, cement chemical composition, SF content, curing time and method, temperature, mix additives, etc.). In the literature various formulations can be found to describe the sorption isotherm of normal concrete (Xi et al. 1994). However, in the present paper the semi-empirical expression proposed by Norling Mjornell (1997) is adopted because it
explicitly accounts for the evolution of hydration reaction and SF content. This sorption isotherm reads
( ) ( )( )
( ) ( )⎥⎥
⎦
⎤
⎢⎢
⎣
⎡
⎥⎥⎥
⎦
⎤
⎢⎢⎢
⎣
⎡
−
−∞
+
−∞
−=
1110
,1
110
11,
1,,
hcc
ge
scK
hcc
ge
scG
sch
ew
αα
αα
αα
αααα
(4)
where the first term (gel isotherm) represents the physically bound (adsorbed) water and the second term (capillary isotherm) represents the capillary water. This expression is valid only for low content of SF. The coefficient G1 represents the amount of water per unit volume held in the gel pores at 100% relative humidity, and it can be expressed (Norling Mjornell 1997) as
( ) ss
s
vgkc
c
c
vgk
scG αααα +=,1
(5)
where k
cvg and k
svg are material parameters. From the
maximum amount of water per unit volume that can fill all pores (both capillary pores and gel pores), one can calculate K1 as one obtains
( )1
110
110
11
22.0188.00
,1
−⎟⎠
⎞⎜⎝
⎛−∞
⎥⎥⎥
⎦
⎤
⎢⎢⎢
⎣
⎡⎟⎠
⎞⎜⎝
⎛−∞
−−+−
=
hcc
ge
hcc
geGs
ssc
w
scK
αα
αα
αα
αα
(6)
The material parameters k
cvg and k
svg and g1 can
be calibrated by fitting experimental data relevant to free (evaporable) water content in concrete at various ages (Di Luzio & Cusatis 2009b).
2.2 Temperature evolution
Note that, at early age, since the chemical reactions associated with cement hydration and SF reaction are exothermic, the temperature field is not uniform for non-adiabatic systems even if the environmental temperature is constant. Heat conduction can be described in concrete, at least for temperature not exceeding 100°C (Bažant & Kaplan 1996), by Fourier’s law, which reads
T∇−= λq (7)
where q is the heat flux, T is the absolute temperature, and λ is the heat conductivity; in this

the fracture energy, have been evaluated according to the relationships provided by the Model Code 90. As regards the steel reinforcement, a yield strength σy = 600 MPa, and an elastic modulus Es = 200000 MPa have been assumed. For each of the considered beams, several simulations have been carried out by varying the steel percentage, in order to find the minimum reinforcement amount. In particular, such a value is determined when the peak cracking load, Pcr, is equal to the ultimate load, Pu, as shown in Figure 10.
The values of s and NP –in this case NPC, since it contains the critical value of the reinforcement amount– corresponding to the critical conditions are shown in Figure 11. The obtained trend can be de-scribed with a very good approximation (goodness of fit r
2 = 0.999) by the following hyperbolic curve:
Figure 10. Definition of minimum reinforcement.
Figure 11. Best-fit relationship of numerical results (not filled-in symbols) between NPC and s. Filled-in symbols refer to the experimental results from Bosco et al. (1990).
0.71
0.26PC
N s−
= (14)
By substituting Eqs. (10) and (11) into (14), the
following relationship between the minimum rein-forcement and the mechanical and geometrical prop-erties of the beam is obtained:
0.710.5 0.71 0.29
u umin 0.5 0.15
y y
0.26 0.26
IC IC
IC
h K K
K h h
σ σρ
σ σ
⎛ ⎞= =⎜ ⎟
⎝ ⎠. (15)
The minimum reinforcement percentage vs. beam
depth curves according to the different models avail-able in the literature are compared to Eq. (15) in Figure 12. All the curves refer to fck = 36.90 MPa and σy = 450 MPa. The relative distance between the reinforcement layer and the tensile cross-section edge has been kept constant and equal to 0.10 at any scale. Most of the curves clearly highlight a decrease in the minimum steel amount as the beam depth in-creases. The proposed curve is very close to that by Ruiz et al. (1999), but Eq. (15) is of easier practical applicability. The new proposed formula is also compared to the prescriptions of the design codes in Figure 13.
6 CONCLUSIONS
The application of Dimensional Analysis to the flex-ural behavior of lightly reinforced concrete beams permits the overall mechanical response to be gov-erned only by two nondimensional numbers, NP and s. In particular, the physical similitude in the nondi-mensional moment versus normalized rotation dia-gram predicted in the case the brittleness numbers are kept constant, is profitably used to select the minimum reinforcement amount. A new formula, in fact, is obtained a best-fitting the numerical results in terms of NPC and s. In Eq. (15), the main me-chanical and geometrical parameters affecting the phenomenon being studied are correctly taken into account by means of the Nonlinear Fracture Me-chanics based model adopted for the numerical simulations. As a result, the minimum reinforcement amount is an increasing function of the concrete ten-sile strength and toughness, whereas it decreases as the steel yielding strength and the beam depth in-crease. The effect of the bond-slip between concrete and reinforcing bars pointed out by previous stud-ies
15,16 is disregarded, since, with reference to Figure
10, it influences the value of the applied load and of the mid-span deflection corresponding to steel yield-ing, Py, whereas Pcr and Pu do not considerably change.
As far as the size-scale effects are concerned, it has to be noted that the presence of cohesive closing stresses determines a variation in ρmin with the beam size less pronounced than that predicted by the Bridged Crack Model. An exponent equal to –0.15, in fact, is obtained instead of –0.50, typical of Linear Elastic Fracture Mechanics. Such a difference is clearly shown in Figure 12, where the curve from Bosco & Carpinteri (1992) is compared to the new proposal.
NPC = 0.26s−0.71
r2 = 0.999
Proceedings of FraMCoS-7, May 23-28, 2010
hThD ∇−= ),(J (1)
The proportionality coefficient D(h,T) is called moisture permeability and it is a nonlinear function of the relative humidity h and temperature T (Bažant & Najjar 1972). The moisture mass balance requires that the variation in time of the water mass per unit volume of concrete (water content w) be equal to the divergence of the moisture flux J
J•∇=∂
∂−
t
w (2)
The water content w can be expressed as the sum
of the evaporable water we (capillary water, water vapor, and adsorbed water) and the non-evaporable (chemically bound) water wn (Mills 1966, Pantazopoulo & Mills 1995). It is reasonable to assume that the evaporable water is a function of relative humidity, h, degree of hydration, αc, and degree of silica fume reaction, αs, i.e. we=we(h,αc,αs) = age-dependent sorption/desorption isotherm (Norling Mjonell 1997). Under this assumption and by substituting Equation 1 into Equation 2 one obtains
nscw
s
ew
c
ew
hh
Dt
h
h
ew
&&& ++∂
∂
∂
∂
=∇•∇+∂
∂
∂
∂
− αα
αα
)(
(3)
where ∂we/∂h is the slope of the sorption/desorption isotherm (also called moisture capacity). The governing equation (Equation 3) must be completed by appropriate boundary and initial conditions.
The relation between the amount of evaporable water and relative humidity is called ‘‘adsorption isotherm” if measured with increasing relativity humidity and ‘‘desorption isotherm” in the opposite case. Neglecting their difference (Xi et al. 1994), in the following, ‘‘sorption isotherm” will be used with reference to both sorption and desorption conditions. By the way, if the hysteresis of the moisture isotherm would be taken into account, two different relation, evaporable water vs relative humidity, must be used according to the sign of the variation of the relativity humidity. The shape of the sorption isotherm for HPC is influenced by many parameters, especially those that influence extent and rate of the chemical reactions and, in turn, determine pore structure and pore size distribution (water-to-cement ratio, cement chemical composition, SF content, curing time and method, temperature, mix additives, etc.). In the literature various formulations can be found to describe the sorption isotherm of normal concrete (Xi et al. 1994). However, in the present paper the semi-empirical expression proposed by Norling Mjornell (1997) is adopted because it
explicitly accounts for the evolution of hydration reaction and SF content. This sorption isotherm reads
( ) ( )( )
( ) ( )⎥⎥
⎦
⎤
⎢⎢
⎣
⎡
⎥⎥⎥
⎦
⎤
⎢⎢⎢
⎣
⎡
−
−∞
+
−∞
−=
1110
,1
110
11,
1,,
hcc
ge
scK
hcc
ge
scG
sch
ew
αα
αα
αα
αααα
(4)
where the first term (gel isotherm) represents the physically bound (adsorbed) water and the second term (capillary isotherm) represents the capillary water. This expression is valid only for low content of SF. The coefficient G1 represents the amount of water per unit volume held in the gel pores at 100% relative humidity, and it can be expressed (Norling Mjornell 1997) as
( ) ss
s
vgkc
c
c
vgk
scG αααα +=,1
(5)
where k
cvg and k
svg are material parameters. From the
maximum amount of water per unit volume that can fill all pores (both capillary pores and gel pores), one can calculate K1 as one obtains
( )1
110
110
11
22.0188.00
,1
−⎟⎠
⎞⎜⎝
⎛−∞
⎥⎥⎥
⎦
⎤
⎢⎢⎢
⎣
⎡⎟⎠
⎞⎜⎝
⎛−∞
−−+−
=
hcc
ge
hcc
geGs
ssc
w
scK
αα
αα
αα
αα
(6)
The material parameters k
cvg and k
svg and g1 can
be calibrated by fitting experimental data relevant to free (evaporable) water content in concrete at various ages (Di Luzio & Cusatis 2009b).
2.2 Temperature evolution
Note that, at early age, since the chemical reactions associated with cement hydration and SF reaction are exothermic, the temperature field is not uniform for non-adiabatic systems even if the environmental temperature is constant. Heat conduction can be described in concrete, at least for temperature not exceeding 100°C (Bažant & Kaplan 1996), by Fourier’s law, which reads
T∇−= λq (7)
where q is the heat flux, T is the absolute temperature, and λ is the heat conductivity; in this

Figure 12. Minimum reinforcement vs. beam depth according to various models.
Figure 13. Minimum reinforcement vs. beam depth according to various design codes.
REFERENCES
ACI-318 2005. Building Code Requirements for Reinforced Concrete. Detroit.
Appa Rao, G., Aravind, J. & Eligehausen, R. 2007 Evaluation of minimum flex. reinforcement in RC beams using ficti-tious crack approach. Journal of Structural Engineering (Madras) 34(4): 277-283.
Baluch, M., Azad, A. & Ashmawi, W. 1992. Fracture mechan-ics application to reinforced concrete members in flexure. In A. Carpinteri (ed), Applications of Fracture Mechanics to Reinforced Concrete: 413-436. London: Elsevier Ap-plied Science.
Barenblatt, G.I. & Botvina, L.R. 1980. Incomplete self-similarity of fatigue in the linear range of fatigue crack growth. Fatigue of Engineering Materials and Structures 3(3): 193-202.
Bažant, Z.P. & Beissel, S. 1994. Smeared-tip superposition method for cohesive fracture with rate effect and creep,” International Journal of Fracture 65(3): 277-290.
Brincker, R., Henriksen, M.S., Christensen, F.A. & Heshe, G. 1999. Size effects on the bending behaviour of reinforced concrete beams. In A. Carpinteri (ed), Minimum Rein-
forcement in Concrete Members: 127-180. Oxford (UK): Elsevier Science Ltd.
BSI, BS 8110. 1997. Code of practice for structural use of concrete. London.
Buckingham, E. 1915. Model experiments and the form of em-pirical equations. ASME Transaction 37: 263-296.
Bosco, C. & Carpinteri, A. 1992. Fracture mechanics evalua-tion of minimum reinforcement in concrete structures. In A. Carpinteri (ed), Applications of Fracture Mechanics to Re-inforced Concrete: 347-377. London: Elsevier Applied Sci-ence.
Bosco, C., Carpinteri, A. & Debernardi, P.G. 1990. Minimum reinforcement in high-strength concrete. Journal of Struc-tural Engineering 116(2): 427-437.
Carpinteri, A. 1980. Size effect in fracture toughness testing: A dimensional analysis approach. In G.C. Sih, & M. Mirabile (eds), Proceedings of an International Conference on Ana-lytical and Experimental Fracture Mechanics:_785-797. Alphen an den Rijn. Sijthoff & Noordhoff.
Carpinteri, A. 1981a. A fracture mechanics model for rein-forced concrete collapse. In Proceedings of a IABSE Collo-quium: 17-30. Delft: Delft University Press.
Carpinteri, A. 1981b. Static and energetic fracture parameters for rocks and concretes. Materials & Structures 14(81): 151-162.
Carpinteri, A. 1982. Notch sensitivity in fracture testing of ag-gregative materials. Engineering Fracture Mechanics 16: 467-481.
Carpinteri, A. 1984. Stability of fracturing process in RC beams. Journal of Structural Engineering 110(3): 544-558.
Carpinteri, A. 1985. Interpretation of the Griffith instability as a bifurcation of the global equilibrium. In S.P. Shah (ed), Application of Fracture Mechanics to Cementitious Com-posites: 287-316. Dordrecht: Martinus Nijhoff Publishers.
Carpinteri, A., Corrado, M., Paggi, M. & Mancini, G. 2007. Cohesive versus overlapping crack model for a size effect analysis of RC elements in bending. In A. Carpinteri, P. Gambarova, G. Ferro, & G. Plizzari (eds), Fracture Me-chanics of Concrete Structures: 655-663. London: Taylor & Francis.
Carpinteri, A., Corrado, M., Paggi, M. & Mancini, G. 2009. New model for the analysis of size-scale effects on the duc-tility of reinforced concrete elements in bending. Journal of Engineering Mechanics 135(3): 221-229.
CEN TC/250 2004. Eurocode 2: Design of Concrete Struc-tures, Part 1-1: General Rules and Rules for Buildings. Brussels.
Ciavarella, M., Paggi, M. & Carpinteri, A. 2008. One, no one, and one hundred thousand crack propagation laws: a gener-alized Barenblatt and Botvina dimensional analysis ap-proach to fatigue crack growth. Journal of the Mechanics and Physics of Solids 56(12): 3416-3432.
Comité Euro-International du Béton. 1993. CEB-FIP Model Code 1990. In Bulletin No. 213/214. Thomas Telford Ltd, Lausanne.
Fantilli, A.P., Ferretti, D., Iori, I. & Vallini, P. 1999. Behaviour of R/C elements in bending and tension: the problem of minimum reinforcement ratio. In A. Carpinteri (ed), Mini-mum Reinforcement in Concrete Members: 99-126. Oxford (UK): Elsevier Science Ltd.
Gerstle, W.H., Dey, P.P., Prasad, N.N.V., Rahulkumar, P. & Xie, M. 1992. Crack growth in flexural members-A frac-ture mechanics approach. ACI Structural Journal: 89(6) 617-625.
Ghali, A., Favre, R. & Elbadry, M. 1986. Concrete structures: stresses and deformations, J. W. Arrowsmith Ltd., Bristol, UK, 1986.
Proceedings of FraMCoS-7, May 23-28, 2010
hThD ∇−= ),(J (1)
The proportionality coefficient D(h,T) is called moisture permeability and it is a nonlinear function of the relative humidity h and temperature T (Bažant & Najjar 1972). The moisture mass balance requires that the variation in time of the water mass per unit volume of concrete (water content w) be equal to the divergence of the moisture flux J
J•∇=∂
∂−
t
w (2)
The water content w can be expressed as the sum
of the evaporable water we (capillary water, water vapor, and adsorbed water) and the non-evaporable (chemically bound) water wn (Mills 1966, Pantazopoulo & Mills 1995). It is reasonable to assume that the evaporable water is a function of relative humidity, h, degree of hydration, αc, and degree of silica fume reaction, αs, i.e. we=we(h,αc,αs) = age-dependent sorption/desorption isotherm (Norling Mjonell 1997). Under this assumption and by substituting Equation 1 into Equation 2 one obtains
nscw
s
ew
c
ew
hh
Dt
h
h
ew
&&& ++∂
∂
∂
∂
=∇•∇+∂
∂
∂
∂
− αα
αα
)(
(3)
where ∂we/∂h is the slope of the sorption/desorption isotherm (also called moisture capacity). The governing equation (Equation 3) must be completed by appropriate boundary and initial conditions.
The relation between the amount of evaporable water and relative humidity is called ‘‘adsorption isotherm” if measured with increasing relativity humidity and ‘‘desorption isotherm” in the opposite case. Neglecting their difference (Xi et al. 1994), in the following, ‘‘sorption isotherm” will be used with reference to both sorption and desorption conditions. By the way, if the hysteresis of the moisture isotherm would be taken into account, two different relation, evaporable water vs relative humidity, must be used according to the sign of the variation of the relativity humidity. The shape of the sorption isotherm for HPC is influenced by many parameters, especially those that influence extent and rate of the chemical reactions and, in turn, determine pore structure and pore size distribution (water-to-cement ratio, cement chemical composition, SF content, curing time and method, temperature, mix additives, etc.). In the literature various formulations can be found to describe the sorption isotherm of normal concrete (Xi et al. 1994). However, in the present paper the semi-empirical expression proposed by Norling Mjornell (1997) is adopted because it
explicitly accounts for the evolution of hydration reaction and SF content. This sorption isotherm reads
( ) ( )( )
( ) ( )⎥⎥
⎦
⎤
⎢⎢
⎣
⎡
⎥⎥⎥
⎦
⎤
⎢⎢⎢
⎣
⎡
−
−∞
+
−∞
−=
1110
,1
110
11,
1,,
hcc
ge
scK
hcc
ge
scG
sch
ew
αα
αα
αα
αααα
(4)
where the first term (gel isotherm) represents the physically bound (adsorbed) water and the second term (capillary isotherm) represents the capillary water. This expression is valid only for low content of SF. The coefficient G1 represents the amount of water per unit volume held in the gel pores at 100% relative humidity, and it can be expressed (Norling Mjornell 1997) as
( ) ss
s
vgkc
c
c
vgk
scG αααα +=,1
(5)
where k
cvg and k
svg are material parameters. From the
maximum amount of water per unit volume that can fill all pores (both capillary pores and gel pores), one can calculate K1 as one obtains
( )1
110
110
11
22.0188.00
,1
−⎟⎠
⎞⎜⎝
⎛−∞
⎥⎥⎥
⎦
⎤
⎢⎢⎢
⎣
⎡⎟⎠
⎞⎜⎝
⎛−∞
−−+−
=
hcc
ge
hcc
geGs
ssc
w
scK
αα
αα
αα
αα
(6)
The material parameters k
cvg and k
svg and g1 can
be calibrated by fitting experimental data relevant to free (evaporable) water content in concrete at various ages (Di Luzio & Cusatis 2009b).
2.2 Temperature evolution
Note that, at early age, since the chemical reactions associated with cement hydration and SF reaction are exothermic, the temperature field is not uniform for non-adiabatic systems even if the environmental temperature is constant. Heat conduction can be described in concrete, at least for temperature not exceeding 100°C (Bažant & Kaplan 1996), by Fourier’s law, which reads
T∇−= λq (7)
where q is the heat flux, T is the absolute temperature, and λ is the heat conductivity; in this

Hillerborg, A. 1990. Fracture mechanics concept applied to moment capacity and rotational capacity of reinforced con-crete beams. Engineering Fracture Mechanics 35: 233-240.
Hillerborg, A., Modeer, M. & Petersson, P.E. 1976. Analysis of crack formation and crack growth in concrete by means of fracture mechanics and finite elements. Cement and Concrete Research 6: 773-782.
Jansen, D.C. & Shah, S.P. 1997. Effect of length on compres-sive strain softening of concrete. Journal of Engineering Mechanics 123(1): 25-35.
Karihaloo, B.L. & Xiao, Q.Z. 2008. Asymptotic fields at the tip of a cohesive crack. International Journal of Fracture 150(1-2): 55-74.
Norwegian Standard, NS 3473 E. 1989. Concrete Structures, Design Rules. (English Translation). Norwegian Council for Building Standardization, Olso, Norway.
Planas, J. & Elices, M. 1992. Asymptotic analysis of a cohe-sive crack: 1. Theoretical background. International Jour-nal of Fracture 55(2): 153-177.
Phatak, D.R. & Deshpande, N.P. 2005. Prediction of 28 days compressive strength of 53-grade cements using dimen-
sional analysis. Journal of Materials in Civil Engineering 17(6): 733-735.
Phatak, D.R. & Dhonde, H.B. 2003. Dimensional analysis of reinforced concrete beams subjected to pure torsion. Jour-nal of Structural Engineering 129(11): 1559-1563.
Ruiz, G., Elices, M. & Planas, J. 1999. Size effects and bond-slip dependence of lightly reinforced concrete beams. In A. Carpinteri (ed), Minimum Reinforcement in Concrete Mem-bers: 127-180. Oxford (UK): Elsevier Science Ltd.
Standards Australia, AS-3600. 2001. Australian Standard for Concrete Structures. Sydney.
Suzuki, M., Akiyama, M., Matsuzaki, H. & Dang, T.H. 2006. Concentric loading test of RC columns with normal- and high-strength materials and averaged stress-strain model for confined concrete considering compressive fracture energy. In Proceedings of the 2nd fib Congress, Naples, Italy, June 5-8, 2006, (CD-ROM).
van Mier, J.G.M. 1984. Strain-softening of Concrete under Multiaxial Loading Conditions. PhD Thesis, Eindhoven University of Technology.
Proceedings of FraMCoS-7, May 23-28, 2010
hThD ∇−= ),(J (1)
The proportionality coefficient D(h,T) is called moisture permeability and it is a nonlinear function of the relative humidity h and temperature T (Bažant & Najjar 1972). The moisture mass balance requires that the variation in time of the water mass per unit volume of concrete (water content w) be equal to the divergence of the moisture flux J
J•∇=∂
∂−
t
w (2)
The water content w can be expressed as the sum
of the evaporable water we (capillary water, water vapor, and adsorbed water) and the non-evaporable (chemically bound) water wn (Mills 1966, Pantazopoulo & Mills 1995). It is reasonable to assume that the evaporable water is a function of relative humidity, h, degree of hydration, αc, and degree of silica fume reaction, αs, i.e. we=we(h,αc,αs) = age-dependent sorption/desorption isotherm (Norling Mjonell 1997). Under this assumption and by substituting Equation 1 into Equation 2 one obtains
nscw
s
ew
c
ew
hh
Dt
h
h
ew
&&& ++∂
∂
∂
∂
=∇•∇+∂
∂
∂
∂
− αα
αα
)(
(3)
where ∂we/∂h is the slope of the sorption/desorption isotherm (also called moisture capacity). The governing equation (Equation 3) must be completed by appropriate boundary and initial conditions.
The relation between the amount of evaporable water and relative humidity is called ‘‘adsorption isotherm” if measured with increasing relativity humidity and ‘‘desorption isotherm” in the opposite case. Neglecting their difference (Xi et al. 1994), in the following, ‘‘sorption isotherm” will be used with reference to both sorption and desorption conditions. By the way, if the hysteresis of the moisture isotherm would be taken into account, two different relation, evaporable water vs relative humidity, must be used according to the sign of the variation of the relativity humidity. The shape of the sorption isotherm for HPC is influenced by many parameters, especially those that influence extent and rate of the chemical reactions and, in turn, determine pore structure and pore size distribution (water-to-cement ratio, cement chemical composition, SF content, curing time and method, temperature, mix additives, etc.). In the literature various formulations can be found to describe the sorption isotherm of normal concrete (Xi et al. 1994). However, in the present paper the semi-empirical expression proposed by Norling Mjornell (1997) is adopted because it
explicitly accounts for the evolution of hydration reaction and SF content. This sorption isotherm reads
( ) ( )( )
( ) ( )⎥⎥
⎦
⎤
⎢⎢
⎣
⎡
⎥⎥⎥
⎦
⎤
⎢⎢⎢
⎣
⎡
−
−∞
+
−∞
−=
1110
,1
110
11,
1,,
hcc
ge
scK
hcc
ge
scG
sch
ew
αα
αα
αα
αααα
(4)
where the first term (gel isotherm) represents the physically bound (adsorbed) water and the second term (capillary isotherm) represents the capillary water. This expression is valid only for low content of SF. The coefficient G1 represents the amount of water per unit volume held in the gel pores at 100% relative humidity, and it can be expressed (Norling Mjornell 1997) as
( ) ss
s
vgkc
c
c
vgk
scG αααα +=,1
(5)
where k
cvg and k
svg are material parameters. From the
maximum amount of water per unit volume that can fill all pores (both capillary pores and gel pores), one can calculate K1 as one obtains
( )1
110
110
11
22.0188.00
,1
−⎟⎠
⎞⎜⎝
⎛−∞
⎥⎥⎥
⎦
⎤
⎢⎢⎢
⎣
⎡⎟⎠
⎞⎜⎝
⎛−∞
−−+−
=
hcc
ge
hcc
geGs
ssc
w
scK
αα
αα
αα
αα
(6)
The material parameters k
cvg and k
svg and g1 can
be calibrated by fitting experimental data relevant to free (evaporable) water content in concrete at various ages (Di Luzio & Cusatis 2009b).
2.2 Temperature evolution
Note that, at early age, since the chemical reactions associated with cement hydration and SF reaction are exothermic, the temperature field is not uniform for non-adiabatic systems even if the environmental temperature is constant. Heat conduction can be described in concrete, at least for temperature not exceeding 100°C (Bažant & Kaplan 1996), by Fourier’s law, which reads
T∇−= λq (7)
where q is the heat flux, T is the absolute temperature, and λ is the heat conductivity; in this