sizing battery storage for islanded microgrid systems to enhance … · 2019-04-18 · sizing...
TRANSCRIPT

Sizing battery storage for islanded microgrid systems to enhancerobustness against attacks on energy sources
Kexing LAI1,2, Yishen WANG1, Di SHI1 , Mahesh S. ILLINDALA2,
Yanming JIN3, Zhiwei WANG1
Abstract Power system security against attacks is drawing
increasing attention in recent years. Battery energy storage
systems (BESSs) are effective in providing emergency
support. Although the benefits of BESSs have been
extensively studied earlier to improve the system eco-
nomics, their role in enhancing the system robustness in
overcoming attacks has not been adequately investigated.
This paper addresses the gap by proposing a new battery
storage sizing algorithm for microgrids to limit load
shedding when the energy sources are attacked. Four par-
ticipants are considered in a framework involving interac-
tions between a robustness-oriented economic dispatch
model and a bilevel attacker-defender model. The proposed
method is tested with the data from a microgrid system in
Kasabonika Lake of Canada. Comprehensive case studies
are carried out to demonstrate the effectiveness and merits
of the proposed approach.
Keywords Battery storage sizing, Bilevel optimization,
Economic dispatch (ED), Microgrids, Attack-defender
(AD), Robustness
1 Introduction
Secure electric power supply is facing great threats
nowadays. Authorities and policy makers express their
concerns and establish preventive measures in recent years.
In 2014, the North American Energy Reliability Corpora-
tion staged a simulated attack on the power system to
address the potential threats before they become reality [1].
In the same year, the ranking member of the U.S. House
Committee on Energy and Commerce flagged the grid as
‘‘not adequately protected’’ from either cyber or physical
attacks at a hearing [2]. In 2015, a group of eight US
transmission operators established warehouses to speed up
their response to major physical attacks [3]. Likewise, US
Department of Energy also released a report detailing how
Western Area Power Administration ‘‘had not always
established adequate physical security measures and prac-
tices for its critical assets’’ [4]. Such concerns and actions
were motivated by frequent occurrences of attacks in recent
years. For instance, in 2005, the power delivery to 2 mil-
lion customers was interrupted by malicious explosion
occurred at a substation in Moscow [1]. Another example is
that 17 transformers in Metcalf substation were damaged
maliciously causing 15 million dollars loss [5]. Cyber-at-
tacks on Ukraine power system occurred in 2015 and
caused power interruption to 225000 customers [6].
CrossCheck date: 27 November 2018
Received: 30 December 2017 / Accepted: 27 November 2018
� The Author(s) 2019
& Di SHI
Kexing LAI
Yishen WANG
Mahesh S. ILLINDALA
Yanming JIN
Zhiwei WANG
1 GEIRI North America, San Jose, USA
2 Department of ECE, Ohio State University, Columbus, USA
3 State Grid Energy Research Institute, Beijing, China
123
J. Mod. Power Syst. Clean Energy
https://doi.org/10.1007/s40565-019-0501-1

To prevent excessive unserved customers under mali-
cious attacks, exploring adequate backup energy sources is
one of the key issues. In December 2017, a Tesla battery
energy storage system (BESS) raced to save the Australia
grid from coal plant crash by injecting megawatts of power
in milliseconds [7]. This event reveals the advantage of
BESS on supporting power system under contingencies by
providing backup power supply. In recent years, several
utility-scale batteries were installed in electric power sys-
tems. Until 2017, about 722 MW batteries have been
installed on the U.S. electric grid [8]. China plans to put
120 GWh of BESS capacity into the power market by 2021
[9]. Some other advantages of batteries, including peak
shaving [10], smoothing renewable generation [11],
deferring infrastructure expansion [12], and profit maxi-
mization [13], have been investigated extensively in the
existing literature. However, the advantage of BESS on
enhancing power system robustness against attacks has not
been properly addressed yet. Therefore, this paper aims to
fill this gap by proposing a BESS sizing model for islanded
microgrids to limit load shedding when energy sources are
attacked.
To investigate the negative effects of attacks on power
systems, many studies were conducted on the vulnerability
analysis of power systems based on robust programming.
Bilevel optimization is used to obtain the worst-case attack
strategy that leads to the highest amount of load shedding
under certain attack budget. Bilevel optimization model
was earlier employed in [14, 15] to identify the most vul-
nerable components in power systems and find the
unserved energy in the worst-case physical configuration.
A bilevel optimization model was used in [16] to explore
the power system vulnerability under redistribution attacks.
Moreover, the effects of coordinated attacks, incorporating
both physical and cyber-attacks, on the power system
network were discussed [17]. Recognizing the extent of
severe damage caused by malicious attacks on power
systems, a number of publications have proposed power
system defending models to hedge against deliberate
attacks. Reference [18] evaluated various defending
strategies for power networks against antagonistic attacks.
A comprehensive game framework was proposed to
explore the reliable defending strategies on power systems
against attacks [19]. Tri-level optimization models were
used in [20, 21] to determine optimal defending strategy
which minimizes load shedding under attacks in the worst-
case scenario. The uncertainty of offensive resources in the
tri-level optimization model was formulated by a proba-
bility distribution function in [22] when determining the
optimal defending strategy. Apart from defending strategy,
power system planning for minimizing effects of attacks
was also investigated. For instance, transmission lines
intentional attacks were considered when deciding
transmission expansion strategy using stochastic program-
ming approach [23]. A five-level MILP model was pro-
posed for transmission network planning considering
transmission lines outages [24].
Few papers have studied the BESS for enhancement of
the power system robustness against attacks. For instance,
attacks on shipboard power systems were considered when
optimizing energy storage sizing and siting [25]. However,
it does not accurately model the post-attack scenario.
Besides, the aforementioned literatures consider just one
specific time-period of operation, which limits the scope of
applications in real power systems. By contrast, this paper
specifically takes multi-time operation into account.
This paper models a game among four players: planner,
operator during normal operation, attacker, and the opera-
tor during restoration. For the planner, the investment on
the BESS is justified by the reduced load shedding under
worst-case attacks on energy sources that can be restrained
below a threshold. The worst-case scenario here refers to
highest amount of load shedding under attack. Therefore,
the planner is seeking to reach this goal by deploying
minimum capacity of BESS. The objective of operator
during normal operation is simply minimizing operation
cost by applying economic dispatch (ED) model. The
objectives of attacker and operator during restoration are
maximizing and minimizing load shedding during
restoration, respectively. Objectives of planner and opera-
tor during normal operation are not related to the objectives
of attacker and operator during restoration. Thus, using
multi-level optimization to model described situation is
infeasible. Therefore, an iterative algorithm is proposed.
Further, we improve the conventional ED formulation into
a robustness-oriented ED formulation and demonstrate its
merits on enhancing microgrid robustness against attacking
energy sources.
The contributions of this paper are mainly three-fold.
1) A new mathematical model is proposed to simulate the
interactions among different players, namely the BESS
planner, system operator, and attacker. In addition, this
paper analyzes the storage sizing requirements under
various AT cases in the multi-time-period operation,
which is rarely addressed in existing attack-defend
models.
2) Regarding solution technique, an iterative algorithm is
proposed which can find the near-optimal solution for
this problem.
3) This paper compared the basic ED model and
proposed robustness-oriented ED model. The test
cases demonstrate that when the proposed ED model
is applied, the required BESS capacity is reduced, at
the cost of higher operation cost.
Kexing LAI et al.
123

The remainder of paper is organized as follows. Sec-
tion 2 gives potential attack scenarios on power systems
and its basic assumptions are given. Section 3 presents the
problem formulation and the solution algorithm. Basic ED
model, robustness-oriented ED model and bi-level AD
model are shown. The proposed iterative solution algo-
rithm is introduced as well. Section 4 analyzes a case study
based on a remote microgrid system in Kasabonika Lake,
Canada. Finally, Section 5 draws the conclusion.
2 Power system attacks and assumptions
The modern power system can be characterized as a
complicated cyber-physical human-in-the-loop system
[17]. The physical part, cyber part, and human part are all
critical for secure power delivery to loads. The failure of
any part could cause major negative consequences.
As a critical component in an islanded microgrid sys-
tem, energy sources are targeted by war attackers, terror-
ists, and sabotage activities. Reference [17] summarizes
potential physical, cyber, and human attacks, which can
disable the energy sources. The proposed model deals with
the situation after disabling energy sources, and the specific
cause will not be explicated for the remainder of paper.
We assume that attackers can simultaneously attack
multiple energy sources at any time in the 24-h horizon. In
addition, when attacked energy sources are repaired, the
system is assumed to return back to normal operation, thus
no load shedding. The timeline is illustrated in Fig. 1. In
addition, the proposed model aims to deal with attacks
which would cause energy sources outages for several
hours. The restoration durations used in the model can be
adjusted according to specific applications. Attack strate-
gies presented in [17] might be addressed by the proposed
model. For instance, when the energy sources are tripped
due to the cyber-attack on supervisory control and data
acquisition (SCADA), once data manipulation is identified,
energy sources are reconnected. Another example is that
when the lines interconnecting the energy sources are
short-circuited due to grounding or insulator damage, fol-
lowing the completion of repair by lineman crew on the
attacked lines, disconnected energy sources return to work.
3 Problem formulation and solution techniques
The BESS sizing decisions strongly influence the
microgrid dispatch outcomes. In other words, system
operation will be different under different sizes of BESS.
These conditions lead to various levels of system robust-
ness against attacks. To evaluate the influence of BESS
sizing on energy resources attacks and system operations,
and to obtain the minimum BESS size to meet the
requirement, the proposed framework incorporates two
parts, an ED model and an AD model. The problem is
solved iteratively by interfacing these two models.
3.1 ED model
The ED is used for centralized energy management
during normal operation. The objective is to minimize the
operation costs subject to physical constraints as shown
from (1) to (10).
minpi;t ;pdbt ;pcbt ;Lsht ;C
Bt
XT
t¼1
XI
i¼1
FCi � li½f ðpi;tÞ� þ
XT
t¼1
VollLsht ð1Þ
s:t:
XI
i¼1
pi;t þ pdbt gb � pcbtgb
� �þ Ps
t þ Pwt ¼ plt � Lsht
8t 2 T
ð2Þ
Pmini � pi;t �Pmax
i 8t 2 T ; 8i 2 I ð3Þ
pi;tþ1 � pi;t �RU;maxi 8t 2 T ; 8i 2 I ð4Þ
pi;t � pi;tþ1 �RD;maxi 8t 2 T ; 8i 2 I ð5Þ
Sn;minEB;max �CBt � Sn;maxEB;max 8t 2 T ð6Þ
0� pcbt �PB;max 8t 2 T ð7Þ
0� pdbt �PB;max 8t 2 T ð8Þ
CBt24 ¼ CB
t1 ð9Þ
CBtþ1 ¼ CB
t þ pcbtþ1 � pdbtþ1
� �T i 8t 2 T ð10Þ
The microgrid operator aims to minimize the total fuel
costs of diesel generators and loss-of-load penalty costs.
The fuel cost of each diesel generator f(pi,t) is obtained as
product of marginal fuel cost FCi and input power pi,t. The
efficiency curve of diesel generators which is used to
derive the relation between the input power and output
power is presented in [26]. To linearize operation cost
functions, piecewise linearization technique is applied [27].
The presence of BESS provides bidirectional, controllable
power into the system, which regulates the operation of
diesel generators. As a result, the fuel cost reduction is
RestorationNormal operation Normal operation
Attack(restoration starts)
Repair (restoration ends)
Fig. 1 Timeline of system status throughout 24 h
Sizing battery storage for islanded microgrid systems to enhance robustness against attacks…
123

expected [28]. The priority of ED model is to secure energy
supply to loads, so the value of lost-loads Voll is set to be
sufficiently high. Equation (2) implies the system power
balance equation, indicating that power generated should
be equal to power consumption. In specific, the generated
power is obtained by summing the power outputs of diesel
generators pi,t, discharging power of BESS pdbt , and power
generations of the photovoltaic (PV) panel Pst and the wind
turbine Pwt . The power consumptions are composed by load
demand plt and charging power of BESS pcbt . Constraint (3)
imposes the upper bound Pimax and the lower bound Pi
min of
output powers of diesel generators. Constraints (4) and (5)
represent the ramping up RU;maxi and ramping down R
D;maxi
limits of the diesel generators. Constraint (6) imposes the
upper bound EB;maxSn;max and the lower bound EB;maxSn;min
of stored energy of the BESS CBt . Constraints (7) and (8)
enforce the BESS charging and discharging power
constraints. Constraint (9) indicates that stored energy in
BESS at the end of the operation horizon should return to
the level at the beginning of the day to reach an energy
neutral position. Energy balance equation of the BESS is
formulated in (10). In the equations, li(�) is piecewise
linearization function; gb is efficiency of the battery; PB,max
is power rating of the battery and Ti is time interval.
3.2 Robustness-oriented ED model
In the ED model presented above, the objective function
only aims to reduce the fuel cost and loss-of-load penalty.
This section introduces an enhanced operation strategy to
improve the system robustness against energy deficiency
due to energy sources attacks.
Not only reducing fuel cost and loss-of-load cost,
increasing the stored energy inBESS tohedge against attack is
also included in the objective function. Equation (11) shows
the objective function of the proposed model where the
coefficient w is the weighting factor for increasing stored
energy in BESS. Higher value of w indicates higher weight
imposed on robustness enhancement. This coefficient indi-
cates trade-offs between economic benefits and robustness.
Besides, to improve ability of intact energy sources to save
loads, each dispatchable energy source cannot be restrained by
ramping up limit during restoration process. Constraint (12)
ensures output power of diesel generators will not be limited by
ramping limits. The proposed model is formulated as:
minpi;t ;p
dbt ;pcbt ;Lsht ;C
Bt
XT
t¼1
XI
i¼1
FCi � li½f ðpi;tÞ� � w
XT
t¼1
CBt
þXT
t¼1
VollLsht ð11Þ
s:t:
pi;t �Pmaxi � R
U;maxi
ð2Þ�ð10Þð12Þ
To demonstrate the proposed robustness-oriented
operation strategy, it will replace the basic ED model in
the solution algorithm proposed in the following for
comparison.
3.3 Attacker-defender (AD) model
To derive the worst-case of energy sources attacks in
terms of caused load shedding, this paper uses the AD
model. The attacker intends to maximize the load curtail-
ment Lsht by simultaneously and strategically disabling
energy sources within the attack budget. During restoration
process, the operator re-dispatch the system to save more
loads. Figure 2 illustrates AD model which is formulated
from (13) to (27).
maxxi;y;z
XATþADC�1
t¼AT
Lshct ð13Þ
s:t:
XI
i¼1
xi þ yþ z� de;maxð14Þ
ðxi; y; zÞ 2 f0; 1g ð15Þ
minpci;t ;p
dbct ;pcbct ;Lshct ;CBc
t
XATþADC�1
t¼AT
Lshct ð16Þ
s:t:
XI
i¼1
pci;t þ pdbct gb þ pcbct
gb
� �þ Ps
i ð1� yÞþ
Pwi ð1� zÞ ¼ plt � Lshct 8t 2 ðAT;AT þ ADC � 1Þ; ðotÞ
ð17Þ
Maximize Load shedding during restoration Determine: energy sources to be attacked
Minimize Load shedding during restorationDetermine: charging and discharging of battery, generation,load shedding after attack
Attacker
Operator
Fig. 2 Diagram of AD model
Kexing LAI et al.
123

Sc;minEB;max �CBct
� Sc;maxEB;max
8t 2 AT;AT þ ADC � 1� �
; bmaxt ;bmin
t
� � ð18Þ
CBctþ1
¼ CBct þ pcbc
tþ1� pdbc
tþ1
� �T i
8t 2 AT;AT þ ADC � 2� �
; ðdtÞð19Þ
CBcAT�1 ¼ CB
AT�1; ðetÞ ð20Þ
pci;AT�1 ¼ pi;AT�1; ðpi;tÞ ð21Þ
0� pcbct �PB;max 8t 2 ðAT;AT þ ADC � 1Þ;ðhmax
t ; hmint Þ
ð22Þ
0� pdbct �PB;max 8t 2 ðAT;AT þ ADC � 1Þ;ðlmax
t ; lmint Þ
ð23Þ
Pmini ð1� xiÞ� pci;t �Pmax
i ð1� xiÞ8t 2 ðAT;AT þ ADC � 1Þ; 8i 2 I; ðfmax
i;t ; fmini;t Þ
ð24Þ
pci;tþ1
� pci;t�R
U;maxi þ xiN
8t 2 ðAT � 1;AT þ ADC � 2Þ; 8i 2 I; ðsmaxi;t Þ
ð25Þ
pci;t� pc
i;tþ1�R
D;maxi þ xiN
8t 2 ðAT � 1;AT þ ADC � 2Þ; 8i 2 I; ðsmini;t Þ
ð26Þ
0� Lshct � plt 8t 2 ðAT;AT þ ADC � 1Þ; ðktÞ ð27Þ
In the equations above, AT is the attack time; ADC is
duration of restoration process; bmaxt and bmin
t are
maximum and minimum stored energy of battery
constraint at time t; ot is power balance constraint at time
t during restoration; dt is energy balance equation of
battery at time t during restoration; et is initial stored
energy of battery at time t during restoration; pi,t is initialpower output of diesel generator i at time t during
restoration; hmaxt and hmin
t are the maximum and
minimum charging power of battery constraint at time
t during restoration; lmaxt and lmin
t are the maximum and
minimum discharging power of battery constraint at time
t during restoration; fmaxi; t and fmin
i; t are maximum/minimum
output power of diesel generator i at time t during
restoration; smaxi; t and smin
i; t are ramping up and down limit
of diesel generator i at time t during restoration; kt is loadshedding constraint at time t during restoration; N is a
sufficient large number; plt is demand level at time t. AD
model is formulated with bilevel programming to model
the interactions of an attacker and the operator during the
restoration process. Upper level stands from the
perspective of attacker to maximize load curtailment
during the restoration process after the attack, as shown
in (13). Constraint (14) enforces limits on maximum
number de,max of simultaneously attacked energy sources.
The attack statuses of diesel generators xi, photovoltaic
generation y and wind turbine z are binary as shown in (15),
where 1 means the energy source is disabled and 0 means
the energy source is well-functioning. At lower level, the
actions of operator are modeled to minimize load shedding
during restoration Lshct as shown in (16). Constraint (17)
represents the power balance of the system during
restoration. In specific, the generated power during
restoration is obtained by summing the power outputs of
diesel generators pci;t, discharging power of BESS pdbct , and
power generations of the PV panel Pst ð1� yÞ and the wind
turbine Pwt ð1� zÞ during restoration. The power
consumptions are obtained by adding load demand, and
charging power of BESS pcbct . Constraint (18) denotes
limits on stored energy of BESS during restoration CBct . It
is worth mentioning that minimal state-of-charge (SoC)
Sc,min of battery is lower during restoration process since
the priority is to recover more loads. Energy balance
equation of BESS during restoration process is indicated in
(19). Constraints (20) and (21) show initial values of output
power of diesel generators and stored energy in the battery
for restoration process which are passed from the ED
model. Constraints (22) and (23) enforce limits on charging
and discharging power of BESS during restoration. Output
power, ramping up and ramping down constraints of diesel
generators during restoration are shown in (24), (25) and
(26), which depend on the decision of the attacker. When
the energy source is attacked, corresponding output power
is enforced to zero and ramping limits no longer hold. Load
shedding cannot be higher than the demand level during
restoration period as shown in (27).
The link between AD model and ED model can be
observed in constraints (20) and (21). Specifically, the
output of diesel generators and stored energy in battery at
the hour before the attack are determined by ED model
which will affect the load shedding during restoration.
Constraints (17), (24), (25) and (26) reveal the links
between lower-level problem and upper-level problem of
AD model. Attack strategies are known for the operator,
thus they are constants in the lower-level problem.
Therefore, the lower-level problem is a linear programming
(LP).
To solve this bilevel problem, strong duality theorem or
Karush-Kuhn-Tucker (KKT) optimality conditions [29] are
applied to recast it into a single-level equivalent. Equa-
tions (28) to (48) present the AD model after reformulation
in which the lower-level problem is replaced by its primal
constraints, dual constraints, and complementarity
conditions:
Sizing battery storage for islanded microgrid systems to enhance robustness against attacks…
123

maxxi;y;z;p
ci;t ;p
dbct ;pcbct ;Lshct ;CBc
t;D
XATþADC�1
t¼AT
Lshct ð28Þ
s.t. (14–15), (17)–(27)
bmaxt � bmin
t � dt þ dt�1 ¼ 0 8t 2 ðAT;AT þ ADC � 2Þð29Þ
bmaxAT�1 � bmin
AT�1 � dAT�1 þ eAT�1 ¼ 0 ð30Þ
bmaxATþADC�1 � bmin
ATþADC�1 þ dATþADC�2 ¼ 0 ð31Þ
ot þ fmaxi;t � fmin
i;t þ smaxi;t�1 � smax
i;t þ smini;t � smin
i;t�1 ¼ 0
8t 2 ðAT þ ADC � 2Þ; 8i 2 Ið32Þ
oAT�1 � smaxi;AT�1 þ smin
i;AT�1 þ pi;AT�1 ¼ 0 8i 2 I ð33Þ
oATþADC�1 þ fmaxi;ATþADC�1 � fmin
i;ATþADC�1 þ smaxi;ATþADC�2
� smini;ATþADC�2 ¼ 0 8i 2 I
ð34Þ
otgb þ T idt�1 þ lmax
t � lmint ¼ 0
8t 2 ðAT;AT þ ADC � 1Þ; 8i 2 Ið35Þ
�ot
gb� T idt�1 þ hmax
t � hmint ¼ 0
8t 2 ðAT;AT þ ADC � 1Þ; 8i 2 I
ð36Þ
1þ ot þ kt ¼ 0 8t 2 ðAT;AT þ ADC � 1Þ ð37Þ
0� bmaxt ?EB;max � C
Bc
t� 0
8t 2 ðAT;AT þ ADC � 1Þð38Þ
0� bmint ?CBc
t � EB;max � 0
8t 2 ðAT;AT þ ADC � 1Þð39Þ
0� hmaxt ?PB;max � pcbct � 0
8t 2 ðAT;AT þ ADC � 1Þð40Þ
0� hmint ?pcbct � 0 8t 2 ðAT;AT þ ADC � 1Þ ð41Þ
0�lmaxt ?PB;max � pdbct �0 8t 2 ðAT;ATþADC� 1Þ ð42Þ
0� lmint ?pdbct � 0 8t 2 ðAT;AT þ ADC � 1Þ ð43Þ
0� nmaxi;t ?Pmax
i ð1� xiÞ � pci;t � 0
8t 2 ðAT;AT þ ADC � 1Þð44Þ
0� smaxi;t ?R
U;maxi þ xi �N � ðpci;tþ1 � pci;tÞ� 0
8t 2 ðAT;AT þ ADC � 2Þ; 8i 2 Ið45Þ
0� fmini;t ?pc
i;t� Pmin
i ð1� xiÞ� 0
8t 2 ðAT;AT þ ADC � 1Þð46Þ
0� smini;t ?R
D;maxi þ xi �N � ðpc
i;t� pc
i;tþ1Þ� 0
8t 2 ðAT;AT þ ADC � 2Þ; 8i 2 Ið47Þ
0� kt?plt � Lshct � 0
8t 2 ðAT;AT þ ADC � 1Þð48Þ
0�EB;max � CBt � u �N 8t 2 ðAT;AT þ ADC � 1Þ ð49Þ
0� bmaxt �ð1� uÞ �N 8t 2 ðAT;AT þ ADC � 1Þ ð50Þ
Constraints (29)–(37) are dual constraints and
complementarity conditions are shown from (38) to (48).
The linearization method of the complementarity constraint
(38) is shown in (49) and (50) where u is a dummy
variable. The linearization method for other
complementarity conditions are similar.
Thus, the AD model is merged to a single-level mixed-
integer linear programming (MILP) after linearization.
Using commercial solvers such as CPLEX, the global
optimal solution can be obtained.
3.4 Solution algorithm
The proposed algorithm deliberately size BESS to limit
the load curtailment below a threshold when there are
attacks on energy sources. To formulate the actions from
the planner, operator and attacker, tri-level model has been
applied in the existing literature, such as [20]. In these
models, the objective functions of the planner and the
operator are interconnected. For instance, in [20], mini-
mizing load shedding is the common objective for both
planner and operator. However, in the situation of this
paper, players are not sharing the objectives. To find the
minimal capacity of BESS to meet the requirement, this
paper developed an iterative algorithm containing both ED
and AD models.
Fig. 3 Illustration of iteration process
Kexing LAI et al.
123
Step 1: Initialization: set EB,max = PB,max = 0.
Step 2: Run ED model with current EB,max and
PB,max.
Step 3: Run AD model with current EB,max, PB,max, and
obtained values of CBt , Pt from the ED model.
Step 4: Check if the requirement is met. If the require-
ment is met, the algorithm will stop. Otherwise, go to Step
5.
Step 5: Update EB,max and PB,max, then go to Step 2.
Figure 3 illustrates the proposed algorithm. BESS
planners choose attack times (ATs) based on the specific
conditions to avoid over-conservative solutions. In Fig. 3,
PEr is power-to-energy ratio of the battery, and r is
resolution.
4 Case studies
The proposed BESS sizing strategy will be applied in a
remote microgrid in Kasabonika Lake, Canada [30], as
shown in Fig. 4. In the studied case, power-to-energy ratio
PEr of the battery is assumed to be 2 which approximates
the U.S. storage installation in the third quarter of 2015
[31]. Resolution r is set to 1 kWh, and initial SoC, maxi-
mum SoC, minimum SoC at normal hours and restoration
are set to 0.9, 0.95, 0.2, and 0.1, respectively. The charg-
ing/discharging efficiency of BESS is 88% [32]. It assumes
that the price of battery is $227/kWh and $150/kW [33].
The model is implemented in general algebraic modeling
system (GAMS) using a laptop with an Intel Core i7 CPU
and 16 GB RAM. IBM CPLEX is selected as the solver. In
numerical studies, we will first analyze microgrid vulner-
ability under energy sources attack. After that, the obtained
results on battery sizing using the basic ED model and
robust-oriented ED model are compared, assuming
w = 0.05. Finally, effects of the value of w, and constraint
(12) on model performance will be evaluated. The heaviest
net demand day is chosen to ensure the sizing is adequate
for other less loaded conditions.
4.1 System description
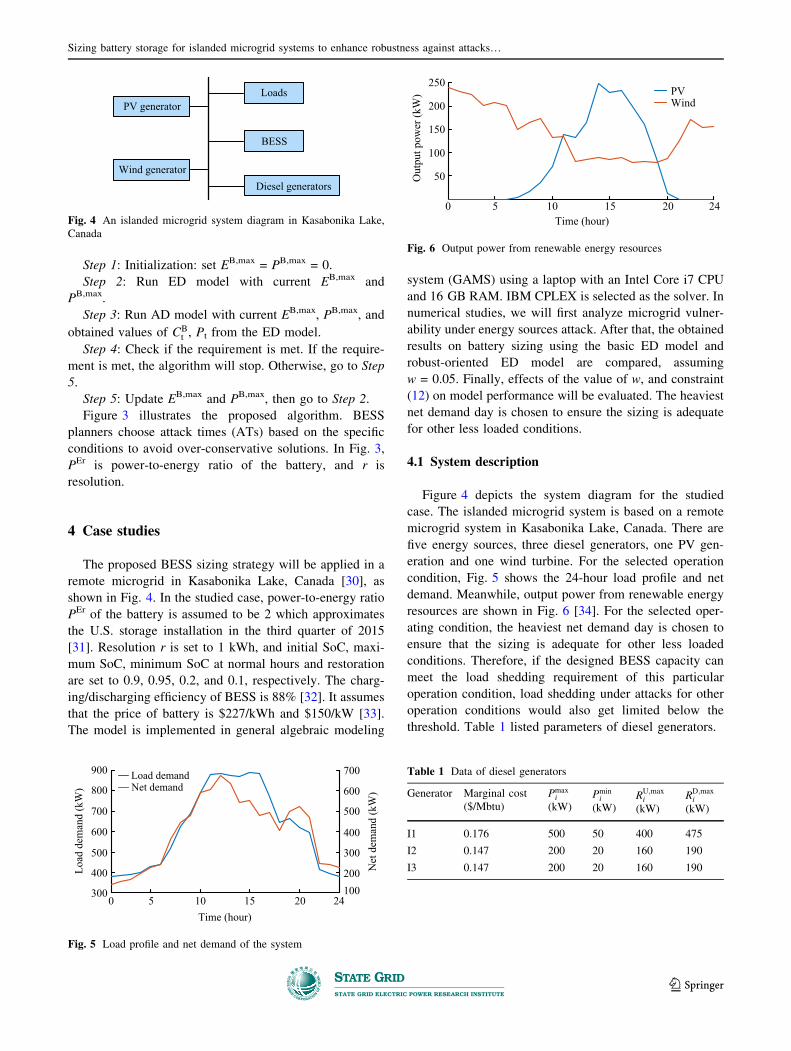
Figure 4 depicts the system diagram for the studied
case. The islanded microgrid system is based on a remote
microgrid system in Kasabonika Lake, Canada. There are
five energy sources, three diesel generators, one PV gen-
eration and one wind turbine. For the selected operation
condition, Fig. 5 shows the 24-hour load profile and net
demand. Meanwhile, output power from renewable energy
resources are shown in Fig. 6 [34]. For the selected oper-
ating condition, the heaviest net demand day is chosen to
ensure that the sizing is adequate for other less loaded
conditions. Therefore, if the designed BESS capacity can
meet the load shedding requirement of this particular
operation condition, load shedding under attacks for other
operation conditions would also get limited below the
threshold. Table 1 listed parameters of diesel generators.
Wind generator
PV generatorLoads
Diesel generators
BESS
Fig. 4 An islanded microgrid system diagram in Kasabonika Lake,
Canada
Table 1 Data of diesel generators
Generator Marginal cost
($/Mbtu)
Pmaxi
(kW)Pmini
(kW)RU;maxi
(kW)
RD;maxi
(kW)
I1 0.176 500 50 400 475
I2 0.147 200 20 160 190
I3 0.147 200 20 160 190
Time (hour)
Load
dem
and
(kW
)
Net
dem
and
(kW
)
5 10 15 20300
400
500
600
700
800
900
100200
300
400
500
600
700Load demandNet demand
0 24
Fig. 5 Load profile and net demand of the system
5 10 15 20
50
100
150
200
250PVWind
Time (hour)
Out
put p
ower
(kW
)
240
Fig. 6 Output power from renewable energy resources
Sizing battery storage for islanded microgrid systems to enhance robustness against attacks…
123
4.2 Vulnerability analysis of microgrid
under energy sources attacks
Before investigating effects of integrating BESS on
limiting load curtailment, it is necessary to find out the
attack strategy which leads to maximum load curtailment
under different ATs.
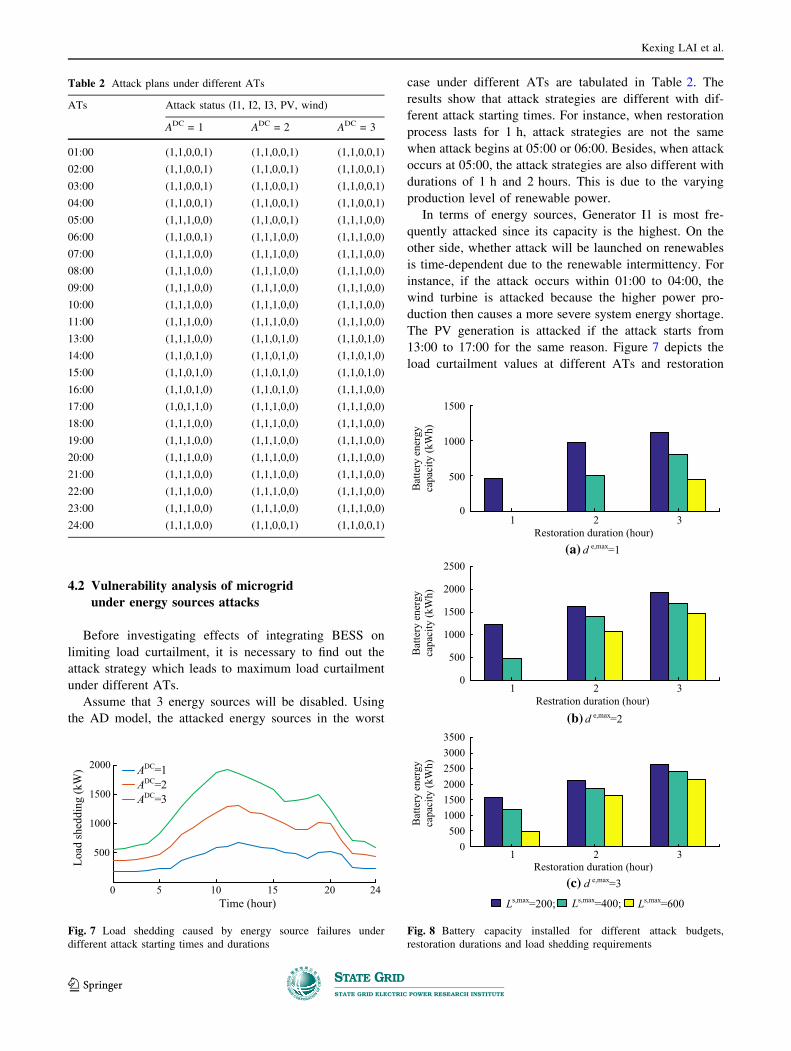
Assume that 3 energy sources will be disabled. Using
the AD model, the attacked energy sources in the worst
case under different ATs are tabulated in Table 2. The
results show that attack strategies are different with dif-
ferent attack starting times. For instance, when restoration
process lasts for 1 h, attack strategies are not the same
when attack begins at 05:00 or 06:00. Besides, when attack
occurs at 05:00, the attack strategies are also different with
durations of 1 h and 2 hours. This is due to the varying
production level of renewable power.
In terms of energy sources, Generator I1 is most fre-
quently attacked since its capacity is the highest. On the
other side, whether attack will be launched on renewables
is time-dependent due to the renewable intermittency. For
instance, if the attack occurs within 01:00 to 04:00, the
wind turbine is attacked because the higher power pro-
duction then causes a more severe system energy shortage.
The PV generation is attacked if the attack starts from
13:00 to 17:00 for the same reason. Figure 7 depicts the
load curtailment values at different ATs and restoration
Time (hour)
Load
shed
ding
(kW
)
5 10 15 20
500
1000
1500
2000 ADC=1ADC=2ADC=3
240
Fig. 7 Load shedding caused by energy source failures under
different attack starting times and durations
Table 2 Attack plans under different ATs
ATs Attack status (I1, I2, I3, PV, wind)
ADC = 1 ADC = 2 ADC = 3
01:00 (1,1,0,0,1) (1,1,0,0,1) (1,1,0,0,1)
02:00 (1,1,0,0,1) (1,1,0,0,1) (1,1,0,0,1)
03:00 (1,1,0,0,1) (1,1,0,0,1) (1,1,0,0,1)
04:00 (1,1,0,0,1) (1,1,0,0,1) (1,1,0,0,1)
05:00 (1,1,1,0,0) (1,1,0,0,1) (1,1,1,0,0)
06:00 (1,1,0,0,1) (1,1,1,0,0) (1,1,1,0,0)
07:00 (1,1,1,0,0) (1,1,1,0,0) (1,1,1,0,0)
08:00 (1,1,1,0,0) (1,1,1,0,0) (1,1,1,0,0)
09:00 (1,1,1,0,0) (1,1,1,0,0) (1,1,1,0,0)
10:00 (1,1,1,0,0) (1,1,1,0,0) (1,1,1,0,0)
11:00 (1,1,1,0,0) (1,1,1,0,0) (1,1,1,0,0)
13:00 (1,1,1,0,0) (1,1,0,1,0) (1,1,0,1,0)
14:00 (1,1,0,1,0) (1,1,0,1,0) (1,1,0,1,0)
15:00 (1,1,0,1,0) (1,1,0,1,0) (1,1,0,1,0)
16:00 (1,1,0,1,0) (1,1,0,1,0) (1,1,1,0,0)
17:00 (1,0,1,1,0) (1,1,1,0,0) (1,1,1,0,0)
18:00 (1,1,1,0,0) (1,1,1,0,0) (1,1,1,0,0)
19:00 (1,1,1,0,0) (1,1,1,0,0) (1,1,1,0,0)
20:00 (1,1,1,0,0) (1,1,1,0,0) (1,1,1,0,0)
21:00 (1,1,1,0,0) (1,1,1,0,0) (1,1,1,0,0)
22:00 (1,1,1,0,0) (1,1,1,0,0) (1,1,1,0,0)
23:00 (1,1,1,0,0) (1,1,1,0,0) (1,1,1,0,0)
24:00 (1,1,1,0,0) (1,1,0,0,1) (1,1,0,0,1)Restoration duration (hour)
Bat
tery
ene
rgy
capa
city
(kW
h)
(a) d e,max=1
1 2 30
500
1000
1500
0
500
1000
1500
2000
2500
0500
100015002000250030003500
Bat
tery
ene
rgy
capa
city
(kW
h)B
atte
ry e
nerg
y ca
paci
ty (k
Wh)
Restration duration (hour)
(b) d e,max=2
1 2 3
Restoration duration (hour)(c) d e,max=3
1 2 3
Ls,max=200; Ls,max=400; Ls,max=600
Fig. 8 Battery capacity installed for different attack budgets,
restoration durations and load shedding requirements
Kexing LAI et al.
123

durations. It shows that if energy sources are attacked
around the peak hours, more severe load shedding is
expected. However, the worst case is not necessarily the
peak load hour as restoration duration is also critical.
Additionally, shorter restoration duration leads to less load
shedding. Therefore, accelerating repair process will be
helpful in reducing load shedding.
4.3 BESS sizing using proposed model
This section will investigate obtained results of BESS
capacity to limit load shedding. First, the obtained size of
BESS to meet different requirements of maximum load
curtailment Ls,max using basic ED model are discussed. As
shown in Fig. 8, the required capacity of BESS installation
is higher with harsher requirement, longer restoration
duration, and more attacked energy sources de,max. Figure 9
depicts the required sizes of BESS with robustness-oriented
ED model. The same conclusion can be drawn as Fig. 8.
However, compared with Fig. 8, the required capacity of
BESS is significantly reduced. This is because using the
proposed robust ED model, abundant energy stored in
BESS can save more loads when there is an energy defi-
ciency. At the same time, the operation of intact diesel
generators will not be restrained by ramping limits.
So far, the paper discussed required capacity of BESS
when all the times are potential ATs. When the attacks on
energy sources regularly occur, i.e. attack starting time is
predictable, the sizing of BESS may change. Figure 10
shows the installed capacities of BESS for different ATs,
and maximum load curtailment thresholds using two ED
models assuming two energy sources are attacked for 2 h.
The results show that BESS can be sized more strategically
with the knowledge of ATs. In other words, required
capacity of BESS is higher if the worst case, in terms of
ATs, is considered. Additionally, using the proposed robust
0
200
400
600
800
0
500
1000
1500
0
500
1000
1500
2000
2500
Bat
tery
ene
rgy
capa
city
(kW
h)B
atte
ry e
nerg
y ca
paci
ty (k
Wh)
Bat
tery
ene
rgy
capa
city
(kW
h)
Restoration duration (hour)(a) d e,max=1
1 2 3
Restoration duration (hour)(b) d e,max=2
1 2 3
1 2 3Restoration duration (hour)
(c) d e,max=3Ls,max=200; Ls,max=400; Ls,max=600
Fig. 9 Battery capacity installed for different attack budgets,
restoration durations and load shedding requirements with robust-
oriented ED model
5 10 15 200
500
1000
1500
2000
0
500
1000
1500
0
500
1000
1500
24Time (hour)
Time (hour)
Time (hour)
(a) Ls,max=200 kWh
5 10 15 20 24
(b) Ls,max=400 kWh
5 10 15 20 24
(c) Ls,max=600 kWh
Batte
ry e
nerg
y ca
pacit
y (k
Wh)
Batte
ry e
nerg
y ca
pacit
y (k
Wh)
Batte
ry e
nerg
y ca
pacit
y (k
Wh)
ED modelRobustness-oriented ED model;
Fig. 10 Battery capacity installed for different attack beginning
times, load shedding requirements, and ED models
Sizing battery storage for islanded microgrid systems to enhance robustness against attacks…
123

operation strategy, required capacity BESS is lower for all
AT.
Another observation is that the trend of required BESS
capacity is more consistent with net demand if robustness-
oriented ED model is applied. This is because SoC of the
battery is always maintained at a high level and diesel
generators can save loads at full capacity during the
restoration process. Thus, the battery sizing mainly
depends on net demand. However, using basic ED model,
the operator is not considering potential energy deficiency
due to energy sources attacks. Required size of BESS,
therefore, is also related with the status of BESS and diesel
generators, so net demand is not the only factor.
Previous simulations show that applying the proposed
robust ED model reduces the required BESS capacities
which saves investment and O&M costs of BESS. How-
ever, the operation cost during normal operation using
robustness-oriented ED model is higher since fuel cost of
diesel generators is higher without fully usage of BESS.
When 1552 kWh BESS is installed, which is the required
capacity for load curtailment for less than 600 kW when
three energy sources are disabled for 2 hours, the SoC
values during normal operation with different weight fac-
tors w are depicted in Fig. 11. If operation strategy imposes
higher weight on robustness enhancement, more energy
will be stored in BESS.
However, more stored energy in BESS impair the
advantage of BESS in reducing operation cost. Therefore,
higher value of w leads to higher operation cost, as shown
in Table 3. Additionally, the added constraint (12) will also
influence the operation cost during normal operation.
Table 3 reveals the increased cost by adding constraint
(12). This is because with constraint (12), the diesel gen-
erator with higher marginal cost will produce more during
normal operation time to ensure the operation of generators
will not limited by ramping limits. Further, Table 4 tabu-
lates the investment costs on BESS when Ls,max = 600 kW,
de,max = 3 and ADC = 2 with various values of w. A larger
size BESS is necessary to meet the requirements, if the
system is more vulnerable to attacks. Thus, lower invest-
ment cost on BESS indicates that the system is more robust
against energy deficiency caused by attacks. Table 4 shows
that higher value of w leads to lower battery capacity.
Therefore, we can conclude that higher weight on
increasing stored energy of battery leads to higher robust-
ness against energy deficiency due to attacks. This is
because with more stored energy in BESS, its ability of
supporting the microgrid under attack is enhanced, thus
leads to higher robustness.
Based on results in Table 3 and Table 4, we can conclude
that operation cost increases with higher value ofw. However,
robustness is enhanced with higher value of w which in turn
reduces the investment cost onBESS. In addition, the influence
of constraint (12) on investment cost of battery is revealed in
Table 4. Lower investment cost on battery is observed with
(12) which indicates higher robustness when the system is
operated by the ED model with constraint (12).
Finally, the computation burden is analyzed. Table 5 lists
total computation times and iteration numbers of different
Table 3 Operation costs using different w
w Daily operation cost ($)
Without (12) With (12)
0 605.59 625.61
0.05 612.23 630.51
0.10 613.99 631.82
0.15 614.69 632.29
0.30 614.69 632.29
Table 4 Investment costs using different w
w Investment cost
Without (12) With (12)
0 817.90 780.61
0.05 672.23 640.51
0.10 553.99 531.82
0.15 444.69 420.55
0.30 444.69 420.55
Table 5 Computation time and iteration (iter) number for various
requirements with ED models
Model Ls,max = 200 kW Ls,max = 400 kW Ls,max = 600 kW
Basic ED
model
16526/1633 13230/1398 10319/1066
Robustness-
oriented
model
9209/841 5850/606 3647/369
5 10 15 200.2
0.4
0.6
0.8
1.0So
C
0 24Time (hour)
w1=0; w1=0.05; w1=0.1; w1=0.15
Fig. 11 SOC through 24 hours using different w for stored energy in
BESS
Kexing LAI et al.
123

requirements and ED models where restoration duration is
assumed to be 2 hours with 2 attacked energy sources. The
computation times of all iterations are similar which are
about 10 s, so the total computation effort mainly depends on
the iteration number. Therefore, computation time for cases
with lower required capacity of BESS is less.
5 Conclusion
In this paper, an optimization model is proposed aiming
at sizing BESS in an islanded microgrid to limit load
shedding when several energy sources are attacked. A
model is formulated to represent the game among four
players without shared objective: planner, operator during
normal operation period, attacker, and operator during
restoration process. The model incorporates two parts: an
ED model and an AD model. Besides, we propose a
robustness-oriented ED model, which increases the stored
energy in BESS and ensures diesel generators is capable of
running at full capacity when there is energy insufficiency.
The model lowers required BESS capacity investment at
the expense of increased daily operation costs. AD model is
a bilevel optimization problem whose upper level repre-
sents the actions of the attacker and lower level represents
the behaviors of defender. The proposed algorithm applies
AD model to determine the worst-case attacks.
By interfacing ED model and AD model iteratively, we
obtain the minimum BESS capacity, which limits the load
shedding below a certain threshold under the energy
sources attacks. BESS planners can flexibly choose
potential ATs to avoid an over-conservative solution. In
addition, the impacts of ATs, restoration duration, weight
for maintaining storage SoC and load shedding thresholds
were also analyzed to demonstrate the advantages of the
proposed model.
Acknowledgements This work was supported by State Grid Com-
pany Corporation Science and Technology Program under project
Hybrid Energy Storage Management Platform for Integrated Energy
System.
Open Access This article is distributed under the terms of the Crea-
tive Commons Attribution 4.0 International License (http://
creativecommons.org/licenses/by/4.0/), which permits unrestricted
use, distribution, and reproduction in any medium, provided you give
appropriate credit to the original author(s) and the source, provide a link
to the Creative Commons license, and indicate if changes were made.
References
[1] Attacks on the electricity grid_US vulnerable to physical and
cyberthreats (2014) https://www.cnbc.com/2014/01/03/attacks-
on-the-electricity-grid-us-vulnerable-to-physical-and-
cyberthreats.html. Accessed 6 January 2014
[2] Gergely K (2014) Cybersecurity update. https://
cybersecuritydialogue.org/2014/01/10/cybersecurity-update-10-
01-2014/. Accessed 10 January 2014
[3] McCray J (2016) Physical security threats to the transmission
and distribution grid, part 1 navigant research. https://www.
navigantresearch.com/blog/physical-security-threats-to-the-
transmission-and-distribution-grid-part-2. Accessed 11 February
2016
[4] Protection C (2016) Followup on western area power adminis-
tration’s critical asset protection. https://www.oversight.gov/
report/doe/followup-western-area-power-administration%E2%
80%99s-critical-asset-protection. Accessed 4 April 2016
[5] Parfomak P (2014) Physical security of the U.S. power grid:
high-voltage transformer substations. https://fas.org/sgp/crs/
homesec/R43604.pdf. Accessed 17 January 2014
[6] Lee R, Assante M, Conway T (2016) Analysis of the cyber-
attack on the Ukrainian power grid. https://www.nerc.com/pa/
CI/ESISAC/Documents/E-ISAC_SANS_Ukraine_DUC_
18Mar2016.pdf. Accessed 18 March 2016
[7] Weaver J (2017) Tesla battery races to save Australia grid from coal
plant crash—injecting 7 MW in milliseconds. https://electrek.co/
2017/12/19/tesla-battery-save-australia-grid-from-coal-plant-crash/.
Accessed 19 December 2017
[8] Preliminary Monthly Electric Generator Inventory (2018)
https://www.eia.gov/electricity/data/eia860m/ Assessed 24
April 2018
[9] Ryan J (2017) China set to put 120 GWh of battery capacity into
the market by 2021—renewable energy world. https://www.
renewableenergyworld.com/articles/2017/06/china-set-to-put-
120-gwh-of-battery-capacity-into-the-market-by-2021.html.
Accessed 29 June 2017
[10] Alam M, Muttaqi K, Sutanto D (2015) A controllable local
peak-shaving strategy for effective utilization of PEV battery
capacity for distribution network support. IEEE Trans Ind Appl
51(3):2030–2037
[11] Fernandez-Blanco R, Dvorkin Y, Xu B et al (2017) Optimal
energy storage siting and sizing: a WECC case study. IEEE
Trans Sustain Energy 8(2):733–743
[12] Aguado J, Torre S, Trivino A (2017) Battery energy storage
systems in transmission network expansion planning. Electr
Power Syst Res 145:63–72
[13] Wang Y, Dvorkin Y, Fernandez-Blanco R et al (2017) Look-
ahead bidding strategy for energy storage. IEEE Trans Sustain
Energy 8(3):1106–1117
[14] Arroyo J (2010) Bilevel programming applied to power system
vulnerability analysis under multiple contingencies. IET Gener
Transm Distrib 4(2):178–190
[15] Salmeron J, Wood K, Baldick R (2004) Analysis of electric grid
security under terrorist threat. IEEE Trans Power Syst
19(2):905–912
[16] Xiang Y, Ding Z, Zhang Y et al (2017) Power system reliability
evaluation considering load redistribution attacks. IEEE Trans
Smart Grid 8(2):889–901
[17] Xiang Y, Wang L, Liu N (2017) Coordinated attacks on electric
power systems in a cyber-physical environment. Electr Power
Syst Res 149:156–168
[18] Holmgren A, Jenelius E, Westin J (2007) Evaluating strategies
for defending electric power networks against antagonistic
attacks. IEEE Trans Power Syst 22(1):76–84
[19] Chen G, Dong Z, Hill D (2011) Exploring reliable strategies for
defending power systems against targeted attacks. IEEE Trans
Power Syst 26(3):1000–1009
[20] Wu X, Conejo A (2017) An efficient tri-level optimization
model for electric grid defense planning. IEEE Trans Power
Syst 32(4):2984–2994
Sizing battery storage for islanded microgrid systems to enhance robustness against attacks…
123

[21] Lai K, Illindala M, Subramaniam K (2019) A tri-level opti-
mization model to mitigate coordinated attacks on electric
power systems in a cyber-physical environment. Appl Energy
235:204–218
[22] Xiang Y, Wang L (2018) An improved defender-attacker-de-
fender model for transmission line defense considering offen-
sive resource uncertainties. IEEE Trans Smart Grid. https://doi.
org/10.1109/TSG.2018.2803783
[23] Carrion M, Arroyo J, Alguacil N (2007) Vulnerability-con-
strained transmission expansion planning: a stochastic pro-
gramming approach. IEEE Trans Power Syst 22(4):1436–1445
[24] Moreira A, Strbac G, Moreno R et al (2018) A five-level MILP
model for flexible transmission network planning under uncer-
tainty: a min-max regret approach. IEEE Trans Power Syst
33(1):486–501
[25] Lai K, Illindala M (2017) Design and planning strategy for
energy storage system in a shipboard DC hybrid power system.
In: Proceedings of the 2017 IEEE/IAS 53rd industrial and
commercial power systems technical conference, Niagara Falls,
Canada, 6–11 May 2017, 9 pp
[26] Nour M, Rohani G (2014) Prospect of stand-alone PV-diesel
hybrid power system for rural electrification in UAE. Int J
Renew Energy Res 4:749–758
[27] Eriksson K, Estep D, Johnson C (2004) Piecewise linear
approximation. Applied mathematics: body and soul. Springer,
Heidelberg
[28] Jin Z, Sulligoi G, Cuzner R et al (2016) Next-generation ship-
board DC power system: introduction smart grid and DC
microgrid technologies into maritime electrical networks. IEEE
Electr Mag 4(2):45–57
[29] Gabriel S, Conejo A, Fuller J et al (2013) Optimality and
complementarity. Complementarity modeling in energy mar-
kets. Springer, Heidelberg
[30] Canizares C (2015) Remote microgrids in canada. https://
building-microgrid.lbl.gov/sites/all/files/santiago_canizares.pdf.
Accessed 11 April 2012
[31] Mclaren J (2016) Batteries 101 series: how to talk about batteries
and power-to-energy ratios. https://www.navigantresearch.com/blog/
physical-security-threats-to-the-transmission-and-distribution-grid-
part-2. Accessed 13 April 2016
[32] Farzin H, Fotuhi-Firuzabad M, Moeini-Aghtaie M (2017) A
stochastic multi-objective framework for optimal scheduling of
energy storage systems in microgrids. IEEE Trans Smart Grid
8(1):117–127
[33] Lambert F (2017) Electric vehicle battery cost dropped 80% in
6 years down to $227/kWh—Tesla claims to be below $190/
kWh.https://electrek.co/2017/01/30/electric-vehicle-battery-
cost-dropped-80-6-years-227kwh-tesla-190kwh/. Accessed 30
January 2017
[34] Mohan V, Suresh R, Singh J (2017) Microgrid energy man-
agement combining sensitivities, interval and probabilistic
uncertainties of renewable generation and loads. IEEE J Emerg
Sel Top Circuits Syst 7(2):262–270
Kexing LAI received the B.S. degree in electrical engineering from
Central South University, Changsha, China, in 2014. He is currently
pursuing the Ph.D. degree in electrical and computer engineering with
The Ohio State University, Columbus, USA. He served as an Intern
with the PMU and System Analytics Group, GEIRI North America,
San Jose, USA, in 2017. His current research interests include
microgrid protection, power system planning and operation, and
power system resilience analysis.
Yishen WANG received the B.S. degree in electrical engineering
from Tsinghua University, Beijing, China, in 2011, and the Ph.D.
degree in electrical engineering from the University of Washington,
Seattle, USA, in 2017. He is currently a Power System Research
Engineer with GEIRI North America, San Jose, USA. His research
interests include power system economics and operation, energy
storage, microgrids, and PMU data analytics.
Di SHI received the Ph.D. degree in electrical engineering from
Arizona State University, Tempe, USA, in 2012. He currently leads
the PMU and System Analytics Group, GEIRI North America, San
Jose, USA. He was a Researcher with NEC Laboratories America,
Cupertino, USA, and the Electric Power Research Institute, Palo Alto,
USA. He served as a Senior/Principal Consultant for eMIT and RM
Energy Marketing from 2012 to 2016. He has published over 100
journal and conference papers and holds over 20 U.S. patents/patent
applications. He received the IEEE PES General Meeting Best Paper
Award in 2017. One energy management and control technology he
developed has been commercialized in 2014 into product that helps
customers achieve significant energy savings. He is an Editor of the
IEEE Transactions on Smart Grid.
Mahesh S. ILLINDALA received the B.Tech. degree in electrical
engineering from the National Institute of Technology, Calicut, India,
in 1995, the M.Sc. (Eng.) degree in electrical engineering from the
Indian Institute of Science, Bangalore, India, in 1999, and the Ph.D.
degree in electrical engineering from the University of Wisconsin,
Madison, WI, USA, in 2005. Since 2011, he has been a Faculty
Member of electrical and computer engineering with The Ohio State
University, Columbus, USA. He was a recipient of the 2016 Office of
Naval Research Young Investigator Program Award. His research
interests include microgrids, distributed energy resources, electrical
energy conversion and storage, power system applications of
multiagent systems, protective relaying, and advanced electric drive
transportation systems.
Yanming JIN received the Ph.D. degree from Guanghua School of
Management, Peking University, Beijing, China, in 2007. She is
currently with the State Grid Energy Research Institute, Beijing,
China. Her research interests include energy related strategy,
planning, and environmental policy.
Zhiwei WANG received the B.S. and M.S. degrees in electrical
engineering from Southeast University, Nanjing, China, in 1988 and
1991, respectively. He is currently the President of GEIRI North
America, San Jose, USA. His research interests include power system
operation and control, relay protection, power system planning, and
WAMS.
Kexing LAI et al.
123