sketching quadratic equations by hand…no calculator 1.decide if the parabola opens up or down. –...
TRANSCRIPT
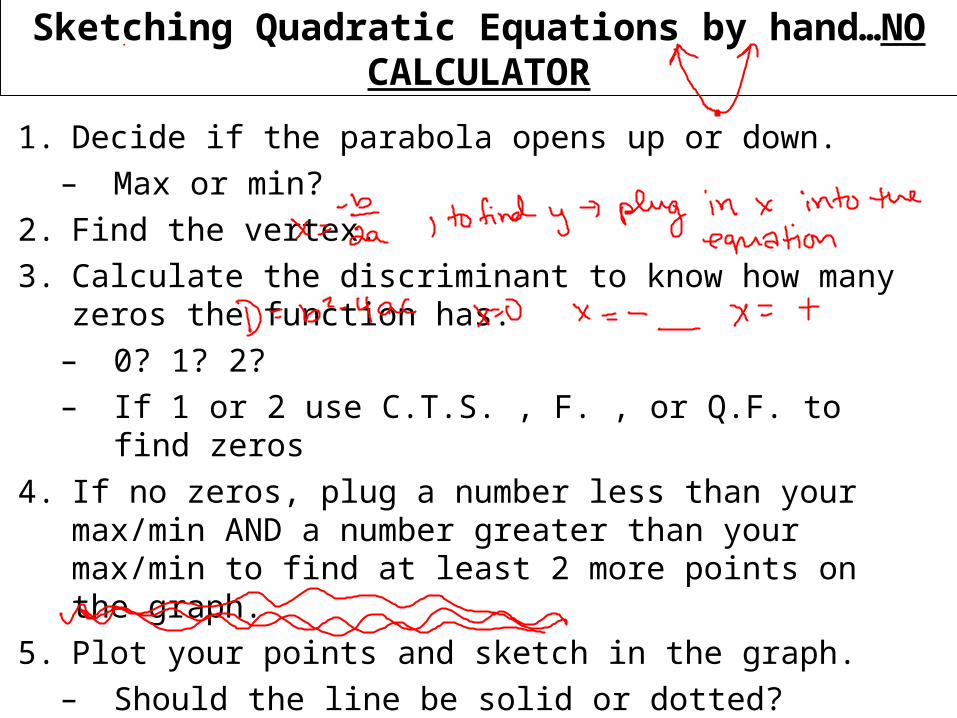
Sketching Quadratic Equations by hand…NO CALCULATOR
1. Decide if the parabola opens up or down.– Max or min?
2. Find the vertex.3. Calculate the discriminant to know how many zeros the function
has.– 0? 1? 2?– If 1 or 2 use C.T.S. , F. , or Q.F. to find zeros
4. If no zeros, plug a number less than your max/min AND a number greater than your max/min to find at least 2 more points on the graph.
5. Plot your points and sketch in the graph.– Should the line be solid or dotted?

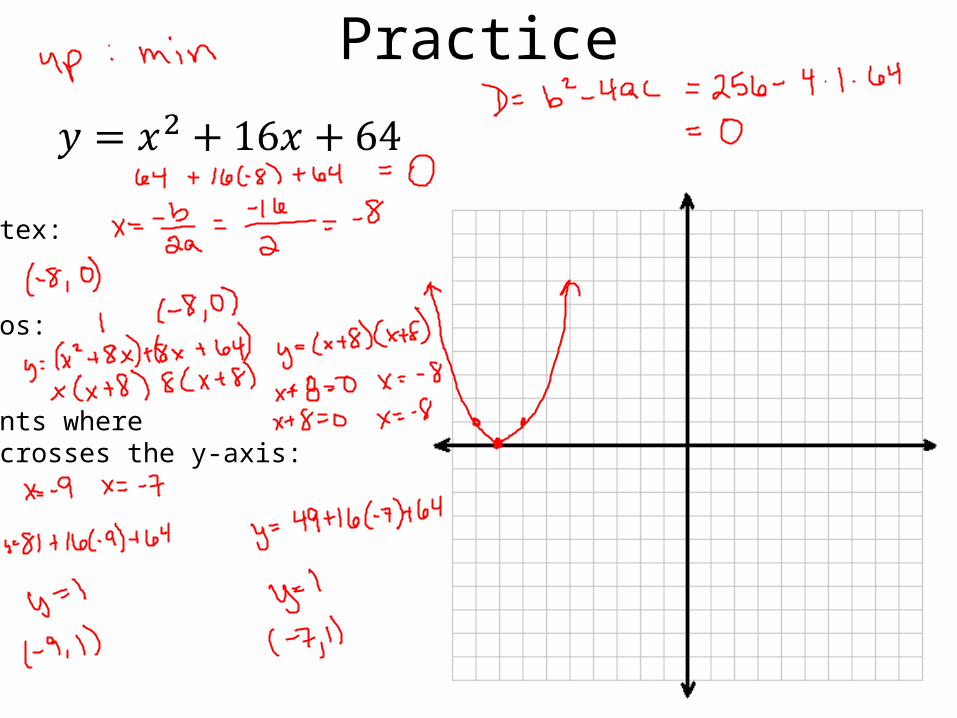
Practice
Vertex:
Zeros:
Points where it crosses the y-axis:
Practice
Vertex:
Zeros:
Points where it crosses the y-axis:

5.8 Solving Quadratic Inequalities
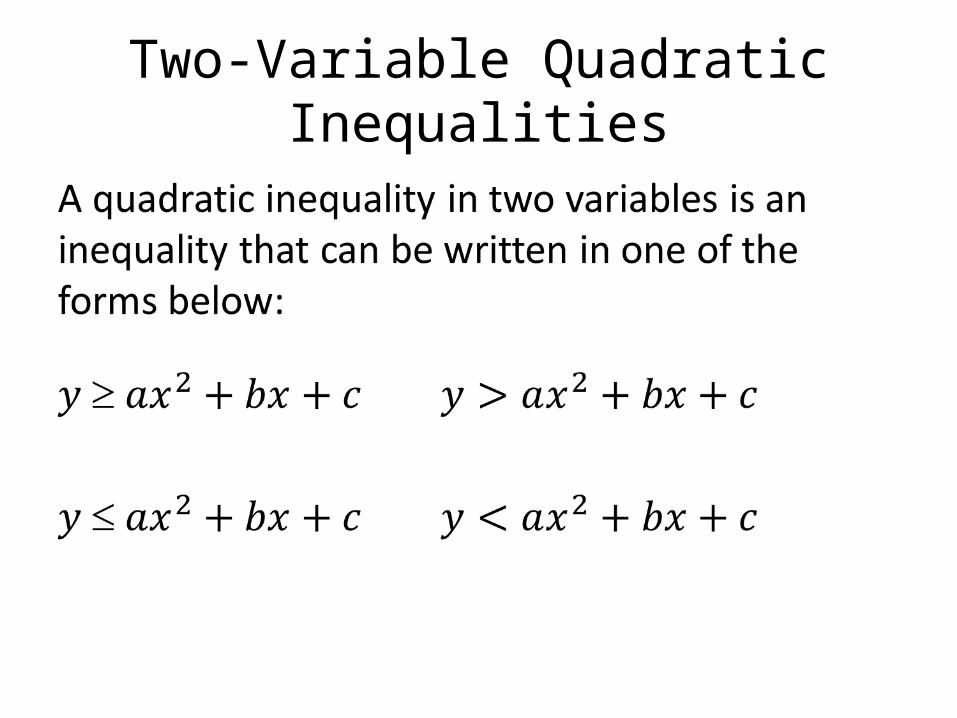
Two-Variable Quadratic Inequalities

Sketching Quadratic Inequalities by hand…NO CALCULATOR
1. Follow all the steps for graphing a quadratic equation by hand.
2. Choose a point outside the parabola to test.– If statement is true shade outside the parabola– If statement is false move on to step 7.
3. Choose a point inside the parabola to test.– If statement is true shade inside the parabola

Important InformationOpens up/down? # of zeros?
Maximum/Minimum? Actual zeros?
Vertex? Other points on the graph?
Discriminant? Where to shade?
Solid Line? Dotted Line?
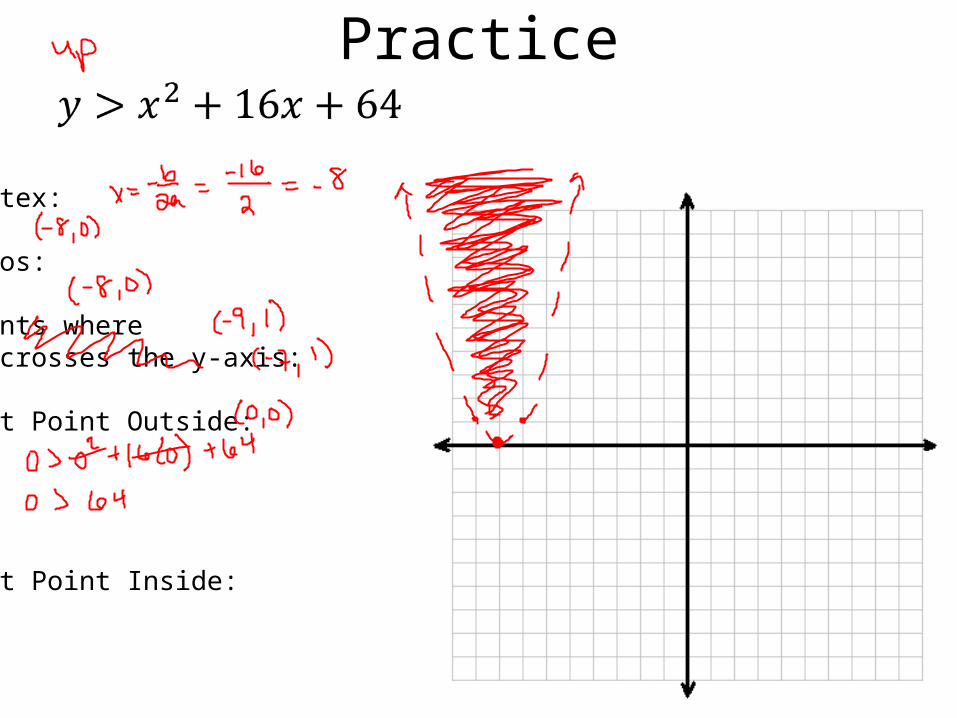
Practice
Vertex:
Zeros:
Points where it crosses the y-axis:
Test Point Outside:
Test Point Inside:

Practice
Vertex:
Zeros:
Points where it crosses the y-axis:
Test Point Outside:
Test Point Inside:

Sketching Quadratic Inequalities Using Your Calculator
1. Graph the related equation using your calculator2. Decide if the parabola opens up or down.
– Max or min?
3. Find the max or min.4. Find the zeros if the graph crosses the x-axis.5. If no zeros, trace to the left of the max/min until you get a “good” point,
then do the same to the right.6. Plot your points and sketch in the graph.
– Should your line be solid or dotted?
7. Choose a point outside the parabola to test.– If statement is true shade outside the parabola– If statement is false move on to step 7.
8. Choose a point inside the parabola to test.– If statement is true shade inside the parabola

Practice
Vertex:
Zeros:
Points where it crosses the y-axis:
Test Point Outside:
Test Point Inside:

Practice
Vertex:
Zeros:
Points where it crosses the y-axis:
Test Point Outside:
Test Point Inside: