skf microlog gx series12-247572/mlog_gx... · machine condition indicators (mci), all transmitters,...
TRANSCRIPT
SKF Microlog® GX Series Data Collector/Analyzer
Supports the GX Series Microlog System CMXA 75 Firmware Version 4.03
User Manual Part No. 32298500-EN
Revision D
User Manual
Read this manual before using this product. Failure to follow the instructions and safety precautions in this manual can result in serious injury, damage to the product, or incorrect readings. Keep this manual in a safe location for future reference.
Copyright 2015 by SKF USA Inc. All rights reserved. 5271 Viewridge Court, San Diego, CA 92123-1841 USA Telephone: (858) 496-3400, Fax: (858) 496-3531 Customer Service: 1-800-523-7514
SKF USA Inc.
® SKF is a registered trademark of the SKF Group. All other trademarks are the property of their respective owners. © SKF 2015
The contents of this publication are the copyright of the publisher and may not be reproduced (even extracts) unless prior written permission is granted. Every care has been taken to ensure the accuracy of
the information contained in this publication but no liability can be accepted for any loss or damage whether direct, indirect or consequential arising out of the use of the information contained herein. SKF reserves the right to alter any part of this publication without prior notice.
Patents: US 4,768,380 • US 5,633,811 • US 5,679,900 • US 5,845,230 • US 5,852,351 •
US 5,854,553 • US 5,854,994 • US 5,870,699 • US 5,907,491 • US 5,992,237 • US 6,006,164 • US 6,124,692 • US 6,138,078 • US 6,199,422 • US 6,202,491 • US 6,275,781 • US 6,301,514 • US 6,437,692 • US 6,489,884 • US 6,513,386 • US 6,633,822 • US 6,789,025 • US 6,792,360 •
US 7,103,511 • US 7,697,492 • WO/2003/048714
Product Support – Contact Information
Product Support – To request a Return Authorization, Product Calibration or a Product Support Plan, use the web page links for direct contact and support.
Product Sales - For information on purchasing condition monitoring products, services or customer support, contact your local SKF sales office.
General Product Information
For general product information (i.e., product data sheet, accessories catalog, etc.), visit the Condition Monitoring Products page on SKF.com and select the appropriate product link.
Technical Support Group
Discuss/review issues of specific interest with maintenance and reliability specialists from around the world at the SKF Knowledge Centre. For technical support on issues like troubleshooting product installation, troubleshooting product performance, etc., use our technical support web page to contact one of our Technical Support Groups.
Product Registration
Please take a moment to register your product at www.skf.com/cm/register to receive exclusive benefits offered only to our registered customers, including receiving technical support, tracking your proof of ownership, and staying informed about upgrades and special offers. (Please visit our website for more details on these benefits.)
Tell us how we’re doing!
It’s important that you’re satisfied with the quality of our product user manuals. We appreciate your feedback; if you have comments or suggestions for improvement, please tell us how we’re doing!
072915jg
SKF USA Inc. – Limited Warranty
WARRANTY Subject to the terms and conditions contained herein, SKF warrants to the Buyer that for the warranty period indicated below the products sold by SKF that are listed below (the “Products”), when properly installed, maintained and operated, will be free from defects in material and workmanship and shall be fit for the ordinary purposes for which the Products are designed. BUYER’S LIMITED REMEDIES This limited warranty defines SKF’s sole and exclusive liability and Buyer’s sole and exclusive remedy for any claim arising out of, or related to, any alleged deficiency in any Product sold by SKF, even if such claim is based on tort (including negligence or strict liability), breach of contract, or any other legal theory. If the Product does not conform to this limited warranty, Buyer must notify SKF or SKF’s authorized service representative within thirty (30) days of discovery of the nonconformity; provided, however, that SKF shall not be liable for any claim for which notice is received by SKF more than thirty (30) days following the expiration of the applicable warranty period for the Product. Upon receipt of timely notification from Buyer, SKF may, at its sole option, modify, repair, replace the Product, or reimburse Buyer for any payment made by Buyer to SKF for the purchase price of the Product, with such reimbursement being pro-rated over the warranty period. WARRANTY PERIOD Except as expressly provided below, the warranty period for each Product shall commence on the date the Product is shipped by SKF to Buyer.
90-DAY WARRANTY Products warranted for ninety (90) days by SKF are as follows: cable assemblies, MARLIN QuickConnect (MQC), magnetic temperature probes, and all refurbished equipment. ONE-YEAR WARRANTY Products warranted for one (1) year by SKF are as follows: all Microlog products and accessories, all Microlog Inspector applications including hand-held computers, all MARLIN data managers (MDM), all MARLIN Condition Detectors (MCD), all Wireless Machine Condition Detectors (WMCD), all Multilog On- line Systems (IMx), all Multilog Condition Monitoring Units (CMU, TMU), Multilog Local Monitoring Units (LMU), all Multilog Wireless Monitoring Units (WMx), Multilog On-line System Wireless Vibration Transmitter ISA100, all Wireless Monitoring Systems V/T, all Vibration PenPlus, all Machine Condition Advisors (MCA), all Machine Condition Indicators (MCI), all transmitters, all Monitor Interface Modules (MIM), all Machine Condition Transmitters (MCT), all MicroVibes and Custom Products with the prefix of CMCP (with the exception of any consumable or expendable items), Shaft Alignment Systems TKSA 60 and TKSA 80 including hand-held computer, measuring units and accessories. TWO-YEAR WARRANTY Products warranted for two (2) years by SKF are as follows: all standard Eddy Probes, Eddy Probe Drivers, and Eddy Probe Extension Cables, all Multilog On-line Systems (DMx), all Wireless Machine Condition Sensors, and all M800A and VM600 Machinery Monitoring Systems. For all On-line Systems that have satisfied Criteria 1 and 2 below, the warranty period shall be either thirty (30) months from the date the On-line System is shipped by SKF to Buyer, two (2) years from the date the On-line System is installed and commissioned by SKF, or two (2) years from the date on which the installation of
the On-line System has been audited and commissioned by SKF or its authorized service representative, whichever period ends first. Criteria 1. Devices used with a Multilog On-line System (IMx), Multilog Condition Monitoring Unit (CMU), Multilog Local Monitoring Unit (LMU), including, but not limited to, the sensing device, the interconnect cabling, junction boxes, if any, and the communications interface, must consist only of SKF-supplied or SKF-approved devices and/or components. The computer provided by Buyer must meet the requirements stipulated by SKF. Criteria 2. SKF or its authorized service representative has installed the On-line System or has audited the installation and commissioned the On-line System. “On-line Systems” are defined as systems consisting of Multilog On-line System (IMx), Multilog Condition Monitoring Unit(s) (CMU), Multilog Local Monitoring Unit(s) (LMU), and any sensing or input devices, the interconnect cabling between the sensing or input devices and the Multilog On-line System (IMx), Multilog Condition Monitoring Unit(s) (CMU), Multilog Local Monitoring Unit(s) (LMU), and the cabling between the Multilog On-line System (IMx), Multilog Condition Monitoring Unit (CMU), Multilog Local Monitoring Unit (LMU) and the proprietary SKF communications interface with the host computer. FIVE-YEAR WARRANTY Products warranted for five (5) years by SKF are as follows: special seismic sensors. LIMITED LIFETIME WARRANTY Products covered under this Limited Lifetime Warranty (as set forth below) are as follows: standard seismic sensors of the CMSS 2XXX and CMSS 7XX series (accelerometers and
velocity transducers) as marked and published in the SKF Vibration Sensor Catalogue. (A) Subject to the terms herein, SKF will
provide a “Limited Lifetime Warranty” for the products specified above sold by SKF USA Inc. after April 15, 2014. Under the Limited Lifetime Warranty, those products shall, at the time of shipment, be free from defects in material and workmanship. If any of these products fail to meet the terms of this Limited Lifetime Warranty during the life of such products, SKF USA Inc., in its sole discretion, will repair, replace or exchange the products for the same model if the necessary components for the products are still available to SKF USA Inc. on a commercially reasonable basis. SKF USA Inc. will not provide a Limited Lifetime Warranty on products damaged by accident, abuse, misuse, neglect, improper installation, problems with electrical power, natural disaster, or by any unauthorized disassembly, repair or modification.
(B) Upon receipt of any product covered by
the Limited Lifetime Warranty, SKF USA Inc. will pay all shipping charges to send the repaired, replaced or exchanged product to the original point of shipment. SKF USA Inc. reserves the right to decline repair or replacement if no fault is found in the product.
(C) For any warranty claim, the original
Buyer must provide SKF USA Inc. with the applicable model and serial numbers, the date of purchase, the nature of the problem, and proof of purchase. SKF USA Inc., in its sole discretion, will determine if the Buyer must return the product covered under this warranty to SKF USA Inc.
(D) The express warranty set forth in the
Limited Lifetime Warranty is in lieu of and excludes any and all other warranties express or implied, including, but not
limited to, the implied warranties of merchantability and fitness for a particular purpose.
(E) SKF USA Inc.’s sole obligations under this
Limited Lifetime Warranty are set forth in paragraphs (A) and (B), and SKF USA Inc.’s liability under this Limited Lifetime Warranty shall not exceed the purchase price of the product, plus any shipping and handling charges that SKF USA Inc. may be obligated to pay pursuant to paragraph (B).
(F) IN NO EVENT SHALL SKF USA INC. BE
LIABLE OR OBLIGATED TO THE BUYER
OR ANY OTHER PERSON FOR SPECIAL,
EXEMPLARY, PUNITIVE, INCIDENTAL,
DIRECT, INDIRECT, GENERAL OR
CONSEQUENTIAL DAMAGES
(INCLUDING, BY WAY OF EXAMPLE
ONLY, LOST PROFITS OR SAVINGS,
LOSS OF BUSINESS OR LOSS OF USE)
OR ANY OTHER LOSS, COST OR
EXPENSE IN CONNECTION WITH THE
PRODUCTS REGARDLESS OF
WHETHER OR NOT ANY OF THE
FOREGOING WERE FORESEEABLE OR
THAT SKF USA INC. WAS ADVISED AS
TO THE POSSIBILITY OF SUCH
DAMAGES, LOSS, COST, OR EXPENSE.
(G) The Limited Lifetime Warranty applies
solely to the original Buyer and is non-transferrable.
OTHER SKF PRODUCTS Any SKF product supplied hereunder but not covered by this limited warranty shall be either covered by the applicable SKF limited warranty then in place for such product or, if no such warranty exists, shall be covered by the 90-day warranty stated above. THIRD PARTY PRODUCT WARRANTIES For any third party products sold to Buyer by SKF, SKF will transfer to Buyer any warranties
made by the applicable third party product vendor to the extent such warranties are transferable. CONDITIONS As a condition to SKF’s warranty obligations hereunder and if requested or authorized in writing by SKF, Buyer shall forward to SKF any Product claimed by Buyer as being defective. Buyer shall prepay all transportation charges to SKF’s factory or authorized service center. SKF will bear the cost of shipping any replacement Products to Buyer. Buyer agrees to pay SKF’s invoice for the then-current price of any replacement Product furnished to Buyer by SKF, if the Product that was replaced is later determined by SKF to conform to this limited warranty. SKF shall not be obligated under this limited warranty or otherwise for normal wear and tear or for any Product which, following shipment and any installation by SKF (if required by the contract with the Buyer), has, in SKF’s sole judgment, been subjected to accident, abuse, misapplication, improper mounting or remounting, improper lubrication, improper repair or alteration, or maintenance, neglect, excessive operating conditions or for defects caused by or attributable to the Buyer, including without limitation Buyer’s failure to comply with any written instructions provided to Buyer by SKF. SKF shall be free to conduct such tests, investigations and analysis of the Products returned to SKF, as it deems reasonable and proper in the exercise of its sole judgment. As a further condition to SKF’s obligations hereunder, Buyer shall offer its reasonable cooperation to SKF in the course of SKF’s review of any warranty claim, including, by way of example only, Buyer’s providing to SKF any and all information as to service, operating history, mounting, wiring, or re-lubrication of the Product which is the subject of the Buyer’s warranty claim.
EXCEPT WARRANTY OF TITLE AND FOR THE
WARRANTIES EXPRESSLY SET FORTH IN
HEREIN, IT IS UNDERSTOOD AND AGREED
THAT:
(A) SKF MAKES NO OTHER WARRANTY,
REPRESENTATION OR
INDEMNIFICATION, EITHER EXPRESS
OR IMPLIED, INCLUDING WITHOUT
LIMITATION ANY IMPLIED WARRANTY
OF MERCHANTABILITY, FITNESS FOR
A PARTICULAR PURPOSE, OR NON-
INFRINGEMENT;
(B) IN NO EVENT SHALL SKF BE LIABLE
OR OBLIGATED FOR SPECIAL,
EXEMPLARY, PUNITIVE, INCIDENTAL,
DIRECT, INDIRECT, GENERAL OR
CONSEQUENTIAL DAMAGES
(INCLUDING, BY WAY OF EXAMPLE
ONLY, LOST PROFITS OR SAVINGS,
LOSS OF BUSINESS OR LOSS OF USE)
OR ANY OTHER LOSS, COST OR
EXPENSE IN CONNECTION WITH THE
PRODUCTS AND RELATED SERVICES,
IF ANY, PROVIDED BY SKF, AND THIS
DISCLAIMER SHALL EXTEND AS WELL
TO ANY LIABILITY FOR
NONPERFORMANCE CAUSED BY SKF’S
GROSS OR ORDINARY NEGLIGENCE,
AND IN ALL CASES REGARDLESS OF
WHETHER OR NOT ANY OF THE
FOREGOING WERE FORESEEABLE OR
THAT SKF WAS ADVISED AS TO THE
POSSIBILITY OF SUCH DAMAGES,
LOSS, COST, OR EXPENSE; AND
(C) NO PERSON HAS BEEN AUTHORIZED
BY SKF TO MAKE ANY FURTHER OR
CONTRARY INDEMNITIES,
REPRESENTATIONS OR WARRANTIES
ON BEHALF OF SKF. THE FOREGOING
LIMITATIONS AND DISCLAIMERS OF
LIABILITY SHALL BE MADE
APPLICABLE TO THE SALE OF ANY
PRODUCT BY SKF TO THE FURTHEST
EXTENT PERMITTED BY APPLICABLE
LAW.
The exclusive remedies provided in this limited warranty shall not be deemed to have failed of their essential purpose so long as SKF is willing and able to perform to the extent and in the manner prescribed in this limited warranty. ® SKF, MICROLOG and MULTILOG are registered trademarks of the SKF Group. CM-F0001 EN Revision X, March 2015
SKF Microlog - GX Series TOC - 1 User Manual
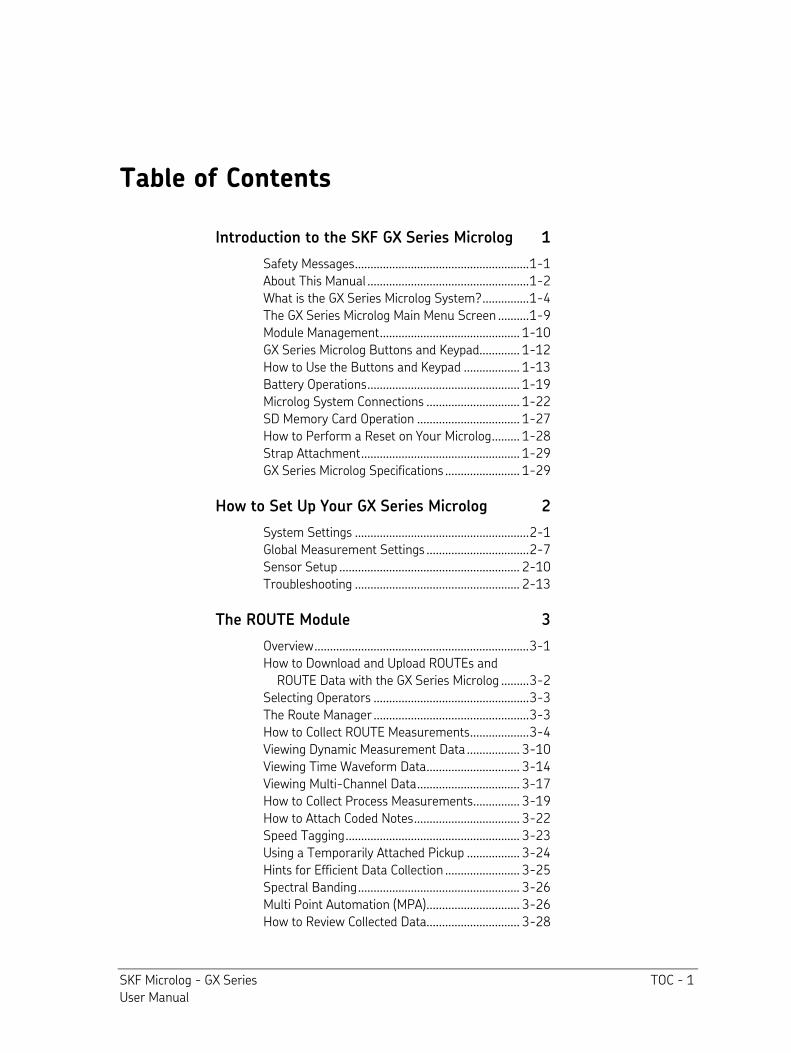
Table of Contents
Introduction to the SKF GX Series Microlog 1
Safety Messages ........................................................ 1-1
About This Manual .................................................... 1-2
What is the GX Series Microlog System? ............... 1-4
The GX Series Microlog Main Menu Screen .......... 1-9
Module Management ............................................. 1-10
GX Series Microlog Buttons and Keypad............. 1-12
How to Use the Buttons and Keypad .................. 1-13
Battery Operations ................................................. 1-19
Microlog System Connections .............................. 1-22
SD Memory Card Operation ................................. 1-27
How to Perform a Reset on Your Microlog ......... 1-28
Strap Attachment ................................................... 1-29
GX Series Microlog Specifications ........................ 1-29
How to Set Up Your GX Series Microlog 2
System Settings ........................................................ 2-1
Global Measurement Settings ................................. 2-7
Sensor Setup .......................................................... 2-10
Troubleshooting ..................................................... 2-13
The ROUTE Module 3
Overview ..................................................................... 3-1
How to Download and Upload ROUTEs and ROUTE Data with the GX Series Microlog ......... 3-2
Selecting Operators .................................................. 3-3
The Route Manager .................................................. 3-3
How to Collect ROUTE Measurements ................... 3-4
Viewing Dynamic Measurement Data ................. 3-10
Viewing Time Waveform Data .............................. 3-14
Viewing Multi-Channel Data ................................. 3-17
How to Collect Process Measurements ............... 3-19
How to Attach Coded Notes .................................. 3-22
Speed Tagging ........................................................ 3-23
Using a Temporarily Attached Pickup ................. 3-24
Hints for Efficient Data Collection ........................ 3-25
Spectral Banding .................................................... 3-26
Multi Point Automation (MPA) .............................. 3-26
How to Review Collected Data.............................. 3-28
TOC - 2 SKF Microlog - GX Series User Manual
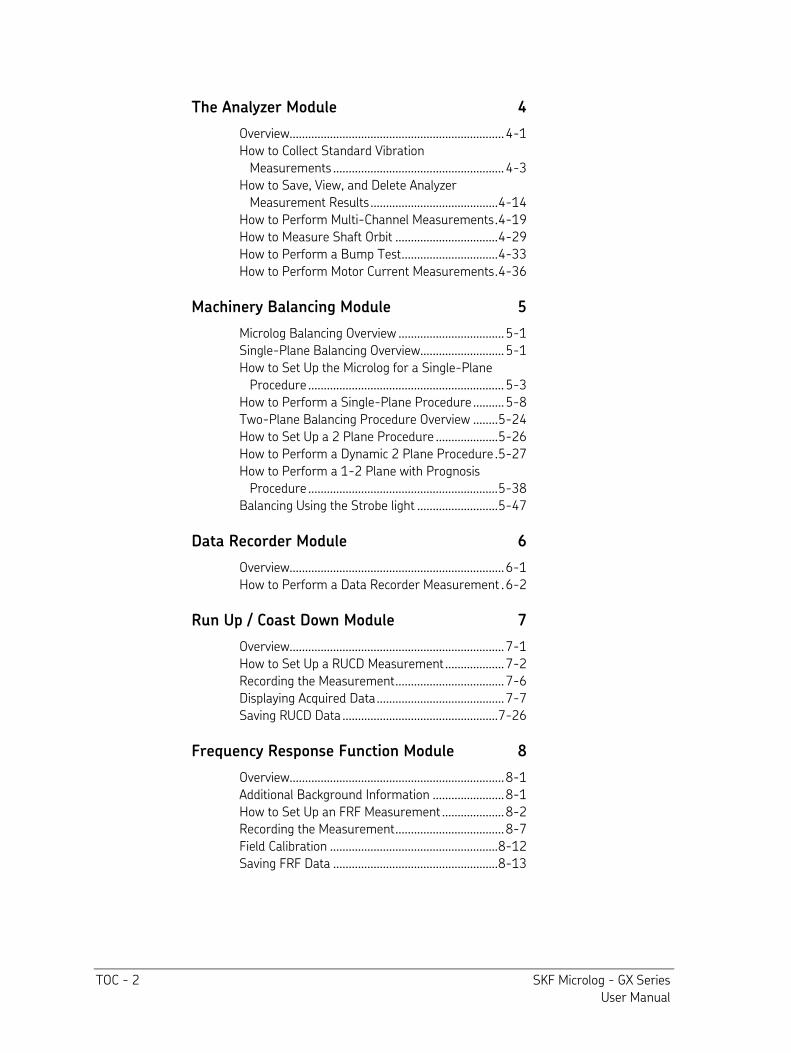
The Analyzer Module 4
Overview..................................................................... 4-1
How to Collect Standard Vibration Measurements ....................................................... 4-3
How to Save, View, and Delete Analyzer Measurement Results ......................................... 4-14
How to Perform Multi-Channel Measurements . 4-19
How to Measure Shaft Orbit ................................. 4-29
How to Perform a Bump Test ............................... 4-33
How to Perform Motor Current Measurements . 4-36
Machinery Balancing Module 5
Microlog Balancing Overview .................................. 5-1
Single-Plane Balancing Overview........................... 5-1
How to Set Up the Microlog for a Single-Plane Procedure ............................................................... 5-3
How to Perform a Single-Plane Procedure .......... 5-8
Two-Plane Balancing Procedure Overview ........ 5-24
How to Set Up a 2 Plane Procedure .................... 5-26
How to Perform a Dynamic 2 Plane Procedure . 5-27
How to Perform a 1-2 Plane with Prognosis Procedure ............................................................. 5-38
Balancing Using the Strobe light .......................... 5-47
Data Recorder Module 6
Overview..................................................................... 6-1
How to Perform a Data Recorder Measurement . 6-2
Run Up / Coast Down Module 7
Overview..................................................................... 7-1
How to Set Up a RUCD Measurement ................... 7-2
Recording the Measurement ................................... 7-6
Displaying Acquired Data ......................................... 7-7
Saving RUCD Data .................................................. 7-26
Frequency Response Function Module 8
Overview..................................................................... 8-1
Additional Background Information ....................... 8-1
How to Set Up an FRF Measurement .................... 8-2
Recording the Measurement ................................... 8-7
Field Calibration ...................................................... 8-12
Saving FRF Data ..................................................... 8-13
SKF Microlog - GX Series TOC - 3 User Manual
Conformance Check Module 9
Overview ..................................................................... 9-1
How to Transfer Test Templates to the Microlog GX ............................................................. 9-2
How to Set Up or Customize Conformance Test Templates ........................................................ 9-4
How to Perform a Conformance Survey ............. 9-16
Saving Conformance Check Data ......................... 9-22
Spindle Test Module 10
Overview .................................................................. 10-1
How to Transfer Test Templates to the Microlog ................................................................ 10-2
How to Perform a Survey ..................................... 10-2
Spindle Tests Overview ......................................... 10-6
Survey Warning Messages ................................. 10-23
How to View Stored Test Results ...................... 10-24
How to Backup Stored Survey Results ............. 10-25
How to Delete Stored Surveys ........................... 10-26
Idler Sound Monitor Module 11
Overview .................................................................. 11-1
Hardware Setup ..................................................... 11-5
How to Set Up a Conveyor Idler Survey ............ 11-11
How to Perform a Conveyor Idler Roller Survey ................................................................ 11-14
Transferring, Reviewing, and Deleting Survey Data Files ........................................................... 11-19
Resetting Measurement Alarm Thresholds ...... 11-22
Non ROUTE A
Overview ..................................................................... A-1
Non ROUTE Mode Operations ................................. A-1
How to Collect Pre-set Non ROUTE Measurements ....................................................... A-3
How to Collect “User” Defined Non ROUTE Data ....................................................................... A-10
How to Set Up HFD Measurements .................... A-15
How to Set Up Multi-Channel Measurements ... A-16
How to Set Up a Cross Channel Phase Measurements .................................................... A-22
Multi Channel Cursor, Display Expand, and Full Scale Adjustments ....................................... A-24
How to Review Non ROUTE Measurement Data ...................................................................... A-25
TOC - 4 SKF Microlog - GX Series User Manual
Field Upgrades and Accessories B
Overview..................................................................... B-1
Using the Headphones and Strobe Light C
How to Use the Headphones with the GX ............. C-1
How to Use the Strobe Light with the GX .............. C-2
Safety Instructions D
Instrument Installation Drawing (090-22600-1 Rev B) .......................................... D-1
Safety Instructions (090-22861-1 Rev C) ............ D-4
Glossary of Terms
Index
SKF Microlog - GX Series 1 - 1 User Manual
1
Introduction to the SKF GX Series Microlog
Safety Messages
WARNING! Your safety is extremely important. Read and follow all warnings in this document before handling and operating the equipment. You can be seriously injured, and equipment and data can be damaged if you do not follow the safety warnings.
WARNING! - Warning messages can alert you to an operating procedure, practice, condition, or statement that must be strictly observed to prevent equipment damage or destruction, or corruption or loss of data.
IMPORTANT: Important messages means that there is a risk of product or property damage if the instruction is not heeded.
Personnel Safety
Dress properly. Do not wear loose clothing or jewelry. Keep your hair, clothing, and gloves away from moving parts.
Do not overreach. Keep proper footing and balance at all times to enable better control of the device during unexpected situations.
Use safety equipment. Always wear eye protection. Non-skid safety shoes, hard hat, or hearing protection must be used for appropriate conditions.
Do not repair or adjust energized equipment alone, under any circumstances. Someone capable of providing first aid must always be present for your safety.
To work on or near high voltage, you should be familiar with approved industrial first aid methods.
Always obtain first aid or medical attention immediately after an injury. Never neglect an injury, no matter how slight it seems.
Device Safety
Use only accessories that are recommended by the manufacturer.
Do not attempt to open the device.
Device service must be performed only by qualified SKF repair personnel.
Use only accessories recommended or provided by SKF.
Energized equipment
Never work on energized equipment unless authorized by a responsible authority. Energized electrical equipment is dangerous. Electrical shock from energized equipment can cause death. If you must perform authorized emergency work on energized equipment, be sure that you comply strictly with approved safety regulations.
Introduction to the SKF GX Series Microlog About This Manual
1 - 2 SKF Microlog - GX Series User Manual
Hazardous Locations
Hazardous instructions are included with this product.
Avoid Submerging in Water
This equipment has been designed to be splash and dust resistant. However, avoid direct contact with water, wet surfaces, or condensing humidity. If the instrument is subjected to these conditions, adverse operation may result, and there is a risk of serious injury or damage should electrical shock or fire occurs. Allow the instrument to dry thoroughly before operation. Avoid opening the card slot door in locations where contact with water or other contaminants may occur.
Avoid Damage and Injury
To avoid costly damage to the instrument or injury from a falling instrument, place the instrument on a solid stable surface when not in use and do not place any heavy objects on it.
Use a damp, clean cloth for cleaning. Do not use cleaning fluids, abrasives, or aerosols. They could cause damage, fire, or electrical shock.
Avoid Battery Compartment Exposure
Do not open the battery compartment in a hazardous area, or in locations where contact with water or other contaminants may occur.
About This Manual
This manual introduces you to SKF’s GX-R, -M, -F, and -A series Microlog models. It offers complete and detailed reference to GX-R, -M, -F, and -A model setup screens, data collection displays, and data review options. This information is essential when setting up the GX Series Microlog and when using the Microlog to collect and display machinery data.
User Manual Conventions
As you use this manual, you'll discover certain conventions used:
Bold type is used to indicate text that appears in a Microlog menu or data screen.
Italics are used to emphasize important information.
- are used to indicate notes to the reader.
Step by step procedures are sequenced using bullets, •. Text specific to the GX-R model is identified with blue colored text and this GX-R symbol.
The Microlog firmware is available on a Microlog unit with either a Class 1, Div2, Groups A, B, C, D certification, or an ATEX Zone 2 certification.
Introduction to the SKF GX Series Microlog About This Manual
SKF Microlog - GX Series 1 - 3 User Manual
Throughout this manual, text specific to the ATEX Zone 2 unit is denoted with this symbol.
Chapter Overview
This manual's chapters are organized to help the new GX Series Microlog user quickly set up his Microlog, and to quickly begin to utilize the Microlog for machinery vibration data collection purposes. Chapters are arranged in a logical sequence as described below:
Chapter 1, Introduction – Describes this user manual, and overviews the GX –R, –M, -F and –A Series Microlog systems. Important “getting started” information is detailed, including how to get around using the Microlog’s buttons and menus, and how to utilize the Microlog’s connectors.
Chapter 2, How to Set Up Your GX Series Microlog – Describes how to use the Setup and Sensor Setup modules to set up system and sensor preferences and global measurement settings to prepare for Microlog data collection.
Chapter 3, ROUTE Module – Describes how to collect and review ROUTE measurements downloaded from SKF @ptitude Analyst host software.
Chapter 4, Analyzer Module – Describes how to set up, collect, and review measurement data for POINTs not previously downloaded from @ptitude Analyst software. Also describes how to set up and perform bump test procedures that determine the natural frequencies of a machine or a structure, shaft orbit measurements, and motor current measurements.
Chapter 5, Balancing Module – Describes how to perform machinery balancing procedures for resolving single-plane, two-plane, and static-couple balances with high precision.
Chapter 6, Data Recorder Module – Describes how to use the data recorder to record a machine’s raw vibration signal (time waveform).
Chapter 7, Run Up / Coast Down Module – Describes how to set up, record, and analyze run up / coast down data, intermittent events, and transient vibration signals from non-steady state machinery using the GX series Microlog.
Chapter 8, Frequency Response Function Module – Describes how to set up and use the Frequency Response Function Module using the GX series Microlog.
Chapter 9, Conformance Check Module – Describes how to set up your test measurements for download to the GX series Microlog, and how to perform conformance surveys with the Microlog.
Chapter 10, Spindle Test Module – Overviews how to set up and perform Spindle test measurements.
Chapter 11, Idler Sound Monitor Module – Describes how to set up and use acoustic measurements for early detection of faults in conveyor belt support and return idler rollers.
Appendix A, Non ROUTE - Describes how to set up, perform, and review measurements not downloaded from SKF @ptitude Analyst host software.
Introduction to the SKF GX Series Microlog What is the GX Series Microlog System?
1 - 4 SKF Microlog - GX Series User Manual
Appendix B, Field Upgrades and Accessories – Describes available Microlog module upgrades and provides a link to the SKF Microlog Accessories Catalog.
Appendix C, Using the Headphones and Strobe Light – Describes how to connect the headphones and strobe light to the GX.
Appendix D, Safety Instructions – Describes limitations and precautions for Cls I Div 2 hazardous areas and when using the CMXA 75-SL-Z2 Microlog in an ATEX Zone 2 restricted area.
What is the GX Series Microlog System?
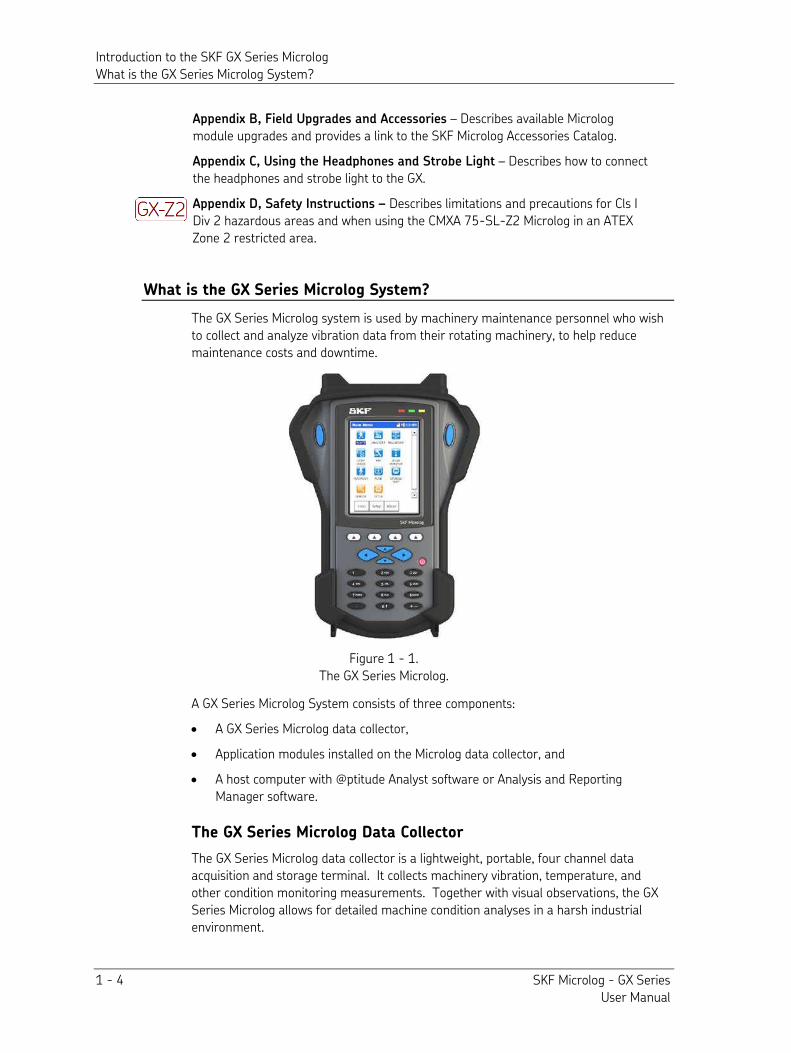
The GX Series Microlog system is used by machinery maintenance personnel who wish to collect and analyze vibration data from their rotating machinery, to help reduce maintenance costs and downtime.
Figure 1 - 1. The GX Series Microlog.
A GX Series Microlog System consists of three components:
• A GX Series Microlog data collector,
• Application modules installed on the Microlog data collector, and
• A host computer with @ptitude Analyst software or Analysis and Reporting Manager software.
The GX Series Microlog Data Collector
The GX Series Microlog data collector is a lightweight, portable, four channel data acquisition and storage terminal. It collects machinery vibration, temperature, and other condition monitoring measurements. Together with visual observations, the GX Series Microlog allows for detailed machine condition analyses in a harsh industrial environment.
Introduction to the SKF GX Series Microlog What is the GX Series Microlog System?
SKF Microlog - GX Series 1 - 5 User Manual
The Microlog, with its preinstalled and licensed modules, performs all the tasks required for machinery predictive maintenance. It automatically collects both dynamic (vibration) and static (process) measurements from almost any source, it provides easy to use setup screens for quickly capturing data related to specific applications, such as balancing, etc., and it allows the user to configure up to twelve measurements for automatic data collection at one sensor location.
A variety of input devices may be used with your Microlog. Vibration measurements are collected with a handheld probe, magnetically mounted probe, permanently mounted sensors, or from an installed monitoring system. Temperature measurements are collected with a non contact infrared sensor or with a contact probe.
Refer to Appendix D of this manual for important restrictions when using the CMXA 75-SL-Z2 Microlog in a Zone 2 restricted area.
Values read from other indicators may be entered into the Microlog by pressing the appropriate alpha/numeric keys on the Microlog keypad. You can also enter your observations as coded notes.
In addition to its function as a data collector, the Microlog has all the features and performances of a powerful analyzer to capture and display high resolution spectra for detailed analysis. A Fast Fourier Transform (FFT) frequency spectrum is available for display on the color LCD (Liquid Crystal Display) screen. LED Indicators
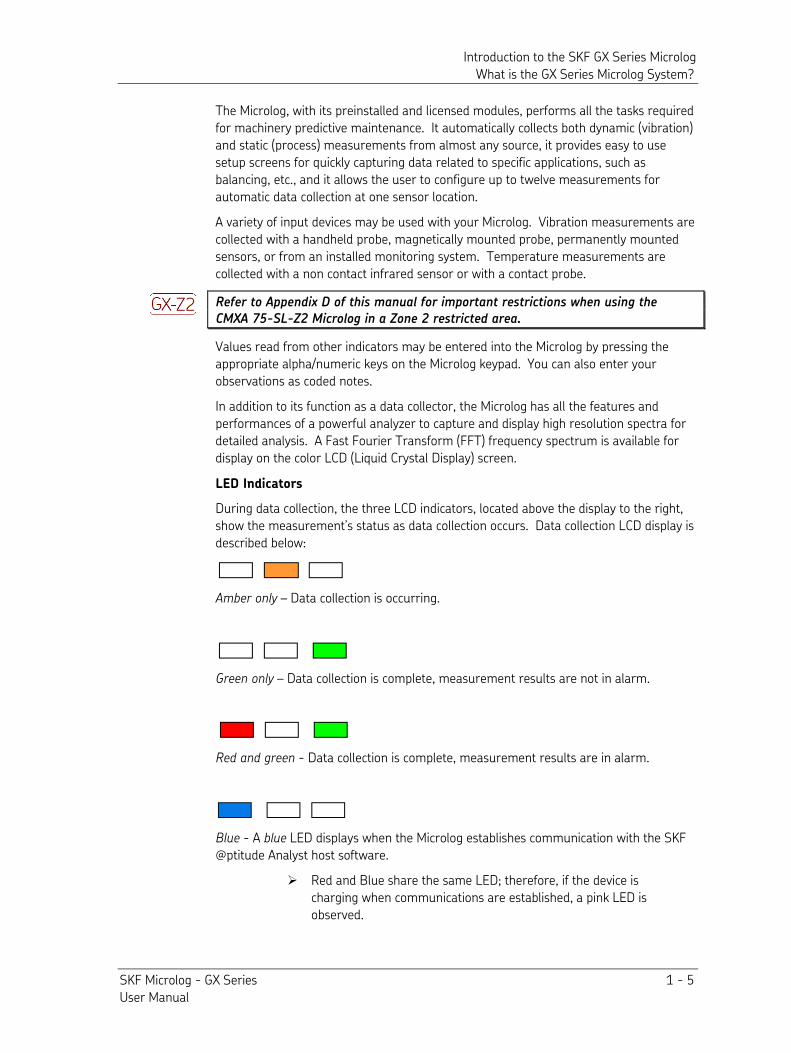
During data collection, the three LCD indicators, located above the display to the right, show the measurement’s status as data collection occurs. Data collection LCD display is described below:
Amber only – Data collection is occurring.
Green only – Data collection is complete, measurement results are not in alarm.
Red and green - Data collection is complete, measurement results are in alarm.
Blue - A blue LED displays when the Microlog establishes communication with the SKF @ptitude Analyst host software.
Red and Blue share the same LED; therefore, if the device is charging when communications are established, a pink LED is observed.
Introduction to the SKF GX Series Microlog What is the GX Series Microlog System?
1 - 6 SKF Microlog - GX Series User Manual
Microlog Application Modules
The GX Series Microlog utilizes application modules installed on the unit to perform various machinery monitoring needs. Each module performs a specific vibration monitoring task. Current modules include:
• Setup • Sensor Setup • Route • Analyzer • Balancing • Data Recorder • Run Up / Coast Down • Frequency Response Function • Check to Conformance • Spindle Test • Idler Sound Monitor
All of the above modules are preinstalled at the SKF factory on all Microlog models. However, not all modules are pre-licensed on all Microlog models. A module must be licensed for it to be active (i.e., unlicensed modules are inactive, and display dimmed module icons). The various GX Series Microlog models (GX-R, -M, and –F) have specific modules pre-licensed at the SKF factory. However, if you require a module that is not pre-licensed for any Microlog model, you may purchase the license and activate the module at your site. This allows you to customize your GX Series Microlog for your specific needs.
ROUTE Based Microlog Models
The GX-R, -M, and -F series Microlog systems are pre-licensed for ROUTE based data collection purposes. That is, they facilitate the collection and review of ROUTE measurements downloaded from SKF @ptitude Analyst host software.
The GX-R Microlog
The GX-R model is an entry level ROUTE based data collector that provides basic data collection and reviewing functionality, but does not provide off-ROUTE analysis capabilities. Also, the GX R is limited to one channel data collection. This Microlog model has the following modules pre-licensed from the SKF factory:
• Setup • Route
The GX-M Microlog
The GX-M model is a mid to high-level ROUTE based data collector / analyzer that has the following modules pre-licensed from the SKF factory:
• Setup • Sensor Setup • Route • Analyzer • Balancing
Introduction to the SKF GX Series Microlog What is the GX Series Microlog System?
SKF Microlog - GX Series 1 - 7 User Manual
The GX-F Microlog
The GX-F model is a fully loaded high-level ROUTE based data collector / analyzer that has all the current modules pre-licensed from the SKF factory:
• Setup • Sensor Setup • Route • Analyzer / Bump Test • Balancing • Run Up / Coast Down • Frequency Response Function • Spindle Test • Data Recorder • Check to Conformance • Idler Sound Monitor
GX-A – The Base Model Microlog
Whereas the previously described GX-R, -M, and –F Microlog models all arrive with the ROUTE module pre-licensed and so communicate with SKF @ptitude Analyst to provide ROUTE based data collection, the GX-A model has only the Setup modules pre-licensed, and is therefore described as the “base model” Microlog. Modules pre-licensed on the GX-A model include:
• Setup • Sensor Setup
Additional module licenses are then purchased for the GX-A to provide a customized GX-A setup for specific machinery monitoring needs. For example, vibration analysts in a motor repair shop might purchase the GX-A model Microlog with the Check to Conformance, Analyzer, and Balancing module licenses. If they then expand their operation and need to conduct ROUTE based condition monitoring, they can purchase the ROUTE module’s license (or any other module license) as needed.
@ptitude Analyst Host Software
SKF’s @ptitude Analyst support software works with the Microlog to help machinery maintenance personnel set up ROUTE measurements and manage machine condition data.
@ptitude Analyst host software helps maintenance personnel to understand the true condition of their rotating machinery and to base maintenance decisions on actual machinery condition.
@ptitude Analyst host software facilitates easy measurement set up and presents collected machinery data in statistical, report, and graphic plot format to obtain useful analysis data.
Introduction to the SKF GX Series Microlog What is the GX Series Microlog System?
1 - 8 SKF Microlog - GX Series User Manual
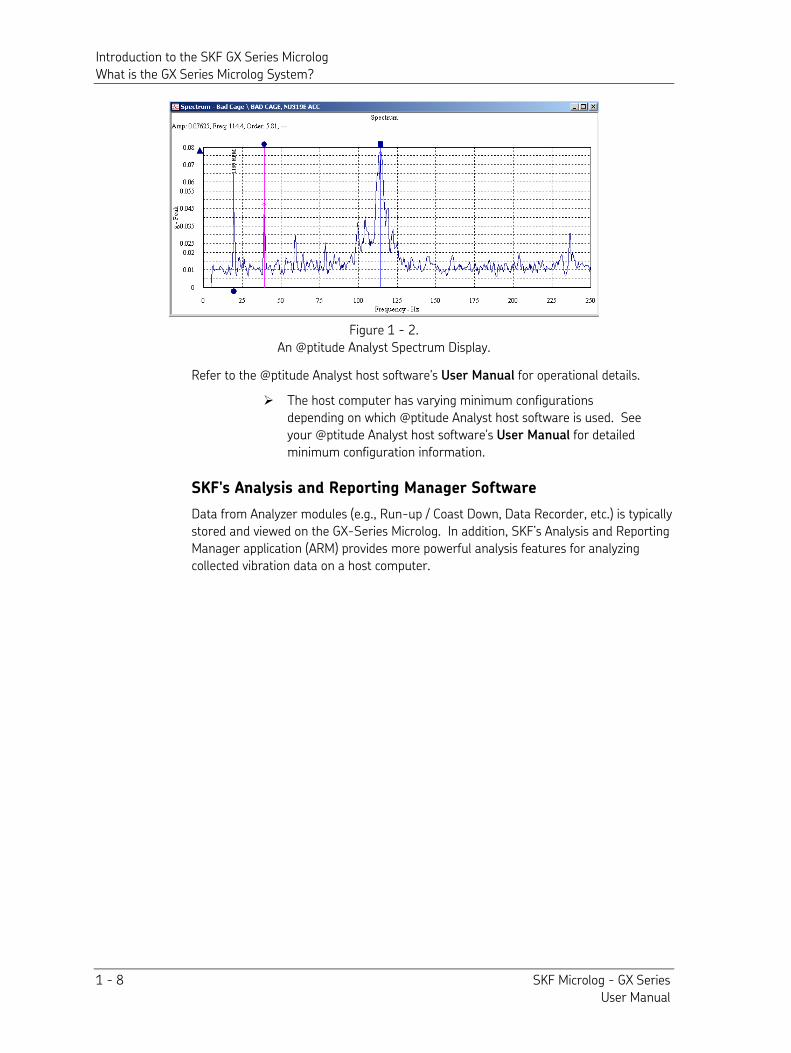
Figure 1 - 2. An @ptitude Analyst Spectrum Display.
Refer to the @ptitude Analyst host software's User Manual for operational details.
The host computer has varying minimum configurations depending on which @ptitude Analyst host software is used. See your @ptitude Analyst host software's User Manual for detailed minimum configuration information.
SKF's Analysis and Reporting Manager Software
Data from Analyzer modules (e.g., Run-up / Coast Down, Data Recorder, etc.) is typically stored and viewed on the GX-Series Microlog. In addition, SKF’s Analysis and Reporting Manager application (ARM) provides more powerful analysis features for analyzing collected vibration data on a host computer.
Introduction to the SKF GX Series Microlog The GX Series Microlog Main Menu Screen
SKF Microlog - GX Series 1 - 9 User Manual
The GX Series Microlog Main Menu Screen
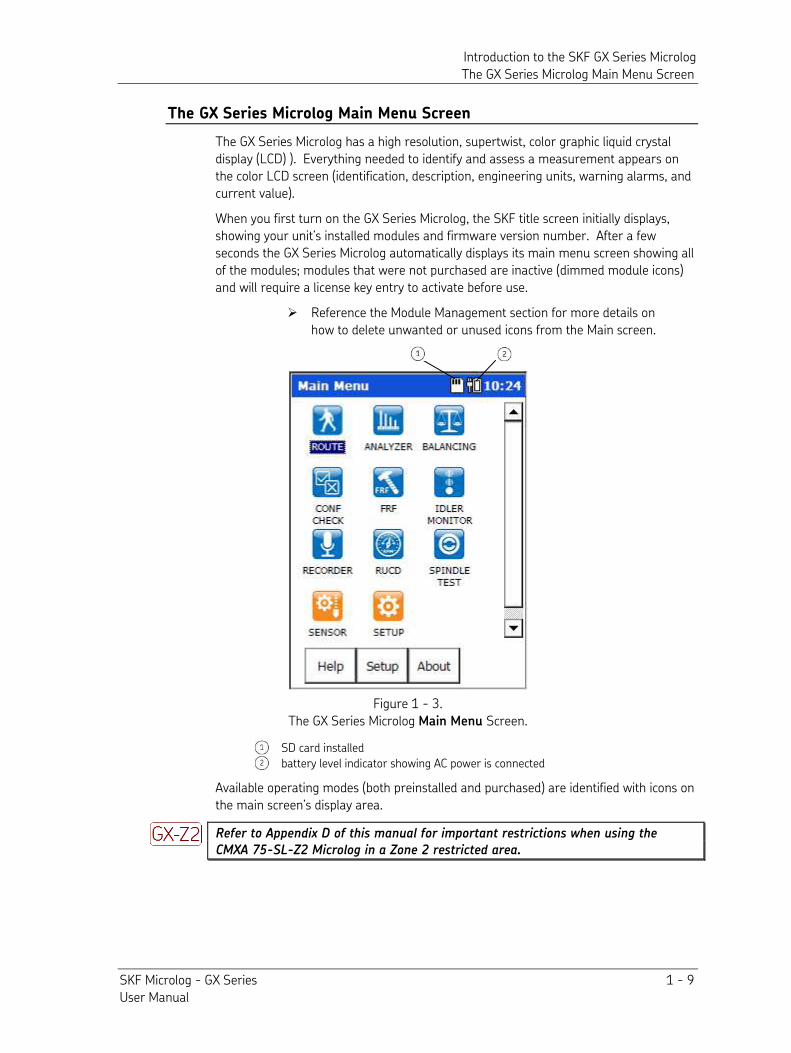
The GX Series Microlog has a high resolution, supertwist, color graphic liquid crystal display (LCD) ). Everything needed to identify and assess a measurement appears on the color LCD screen (identification, description, engineering units, warning alarms, and current value).
When you first turn on the GX Series Microlog, the SKF title screen initially displays, showing your unit’s installed modules and firmware version number. After a few seconds the GX Series Microlog automatically displays its main menu screen showing all of the modules; modules that were not purchased are inactive (dimmed module icons) and will require a license key entry to activate before use.
Reference the Module Management section for more details on how to delete unwanted or unused icons from the Main screen.
Figure 1 - 3. The GX Series Microlog Main Menu Screen.
SD card installed
battery level indicator showing AC power is connected
Available operating modes (both preinstalled and purchased) are identified with icons on the main screen’s display area.
Refer to Appendix D of this manual for important restrictions when using the CMXA 75-SL-Z2 Microlog in a Zone 2 restricted area.
Introduction to the SKF GX Series Microlog Module Management
1 - 10 SKF Microlog - GX Series User Manual
Module Management
As previously described, the Microlog is always shipped with all available modules preinstalled, whether purchased or not. However, modules that were not purchased are inactive (dimmed module icons) and require a license key entry to activate before use.
Module management consists of:
• Using the Module Manager to hide or show module icons (e.g., hide inactive module icons)
• Uninstalling modules you do not intend to use (e.g., to free up internal disk space, uninstall inactive modules)
• Activating modules with a license key (e.g., after purchase, activate a pre-installed module)
• Installing Modules (e.g., reinstall a module you previously uninstalled)
Installing modules is documented in the Module Manager and
Firmware Installation Procedure document on the Product CD.
Hiding and Showing Icons
Icons for modules that are not activated appear dimmed.
The Microlog Module Manager allows you to hide pre-installed module icons. For example you may choose to hide all the inactive (dimmed) icons. You can also use the Module Manager to show previously hidden icons. For example, if you decide to purchase and activate a module whose icon has been hidden, you first need to “show” the icon.
You may hide and show icons for both active and inactive modules.
Once an icon is hidden, its module is not represented on the Main Menu, in the About box, or on the splash screen when the unit is powered on or the application is restarted.
To hide or show module icons:
• From the Main Menu screen, select the Setup icon.
• Press 0 / up (Shift) and the Modules function button. The Module Manager displays a list of installed modules. Modules with hidden icons are shown in [square brackets]. The second function button displays Hide if the highlighted module’s icon is not hidden, or Show if the highlighted module’s icon is hidden.
Introduction to the SKF GX Series Microlog Module Management
SKF Microlog - GX Series 1 - 11 User Manual
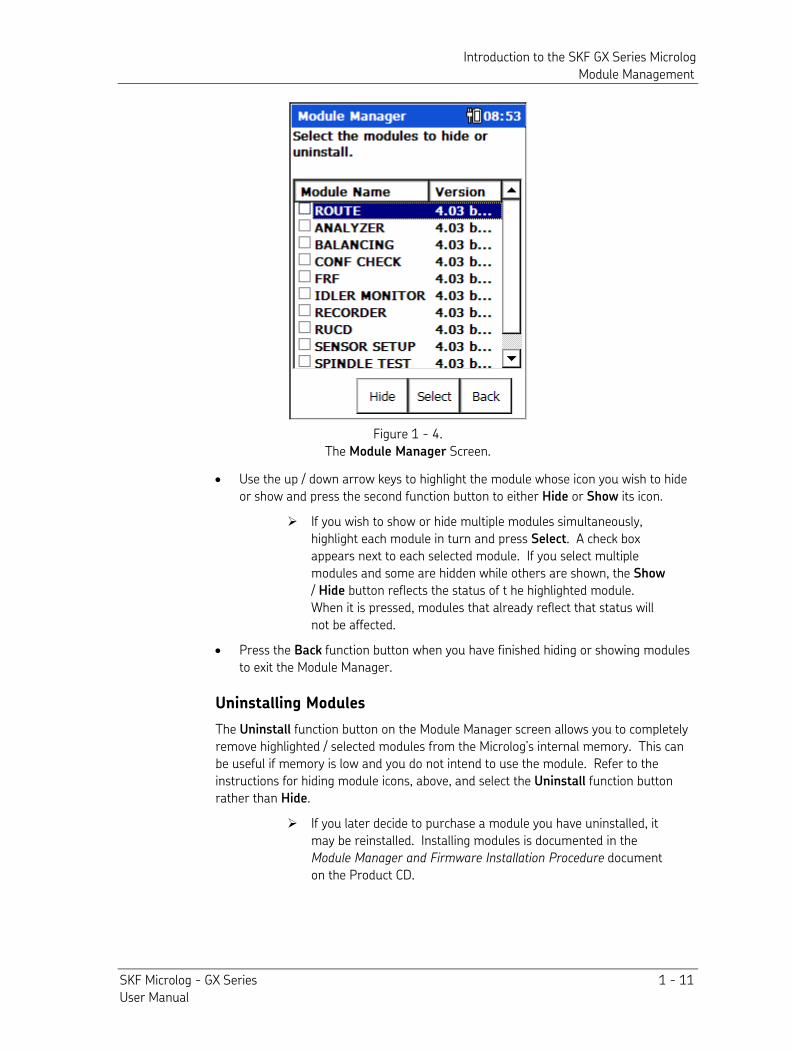
Figure 1 - 4. The Module Manager Screen.
• Use the up / down arrow keys to highlight the module whose icon you wish to hide or show and press the second function button to either Hide or Show its icon.
If you wish to show or hide multiple modules simultaneously, highlight each module in turn and press Select. A check box appears next to each selected module. If you select multiple modules and some are hidden while others are shown, the Show / Hide button reflects the status of t he highlighted module. When it is pressed, modules that already reflect that status will not be affected.
• Press the Back function button when you have finished hiding or showing modules to exit the Module Manager.
Uninstalling Modules
The Uninstall function button on the Module Manager screen allows you to completely remove highlighted / selected modules from the Microlog’s internal memory. This can be useful if memory is low and you do not intend to use the module. Refer to the instructions for hiding module icons, above, and select the Uninstall function button rather than Hide.
If you later decide to purchase a module you have uninstalled, it may be reinstalled. Installing modules is documented in the Module Manager and Firmware Installation Procedure document on the Product CD.
Introduction to the SKF GX Series Microlog GX Series Microlog Buttons and Keypad
1 - 12 SKF Microlog - GX Series User Manual
Purchasing Additional Modules
If you purchase an additional module, you will receive a license key that is used to activate the pre-installed module on the Microlog.
To purchase a module license key, contact your local SKF office and provide your Microlog’s serial number and unit ID. The serial number is located on the asset label on the rear of the unit. The unit ID is displayed on the Help menu’s About box.
Once you have received a 7-digit license key, you can activate the module.
To activate a preinstalled module:
• If necessary, unhide the module that you have purchased using the steps described under Hiding and Showing Icons, above. This places the module’s icon on the Main Menu.
• Select the module’s icon on the Main Menu and press an Enter button. If the module is unlicensed, a prompt appears asking for the license key.
• Enter the 7-digit license key for this module and press OK.
Once the module is activated successfully, you can then run it again without having to re-enter the license key.
GX Series Microlog Buttons and Keypad
Function Buttons
The bottom of the main screen displays command words that describe the current functions of the Microlog’s four function buttons. Each command word describes the current use of the function button beneath it. The functions of these buttons change as you operate in various Microlog modes and displays. When you first turn on your GX Series Microlog, three functions become available, two of which are: Help and About.
The Help Function
• Press the Help function button to access the Microlog’s context sensitive help. The help screen displays and the help topic associated with your current Microlog activity highlights.
• Press the Goto function button to access the highlighted help topic, or use the arrow keys to access help on other topics.
The About Dialog
• Press the About function button to view the About dialog.
The About dialog lists all installed modules and displays your Microlog’s Firmware
Version number and Unit ID number. Identify these numbers if you call customer support. The internal memory and the SD card (if applicable) memory status levels are available by scrolling down.
If you call customer support, you will also be asked for your Microlog’s serial number located on the back of the Microlog.
Introduction to the SKF GX Series Microlog How to Use the Buttons and Keypad
SKF Microlog - GX Series 1 - 13 User Manual
How to Use the Buttons and Keypad
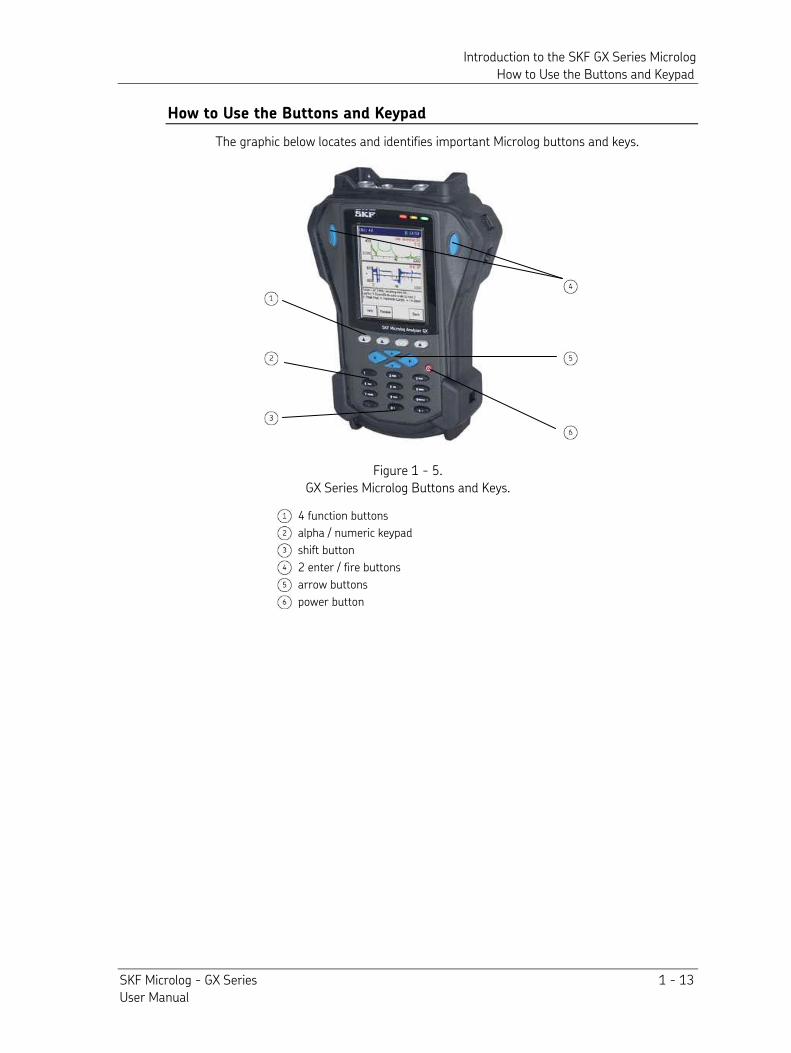
The graphic below locates and identifies important Microlog buttons and keys.
Figure 1 - 5. GX Series Microlog Buttons and Keys.
4 function buttons
alpha / numeric keypad
shift button
2 enter / fire buttons
arrow buttons
power button
Introduction to the SKF GX Series Microlog How to Use the Buttons and Keypad
1 - 14 SKF Microlog - GX Series User Manual
Power Button
The red Power button powers the Microlog on and off. After the initial power on, the Microlog is seldom turned completely “off.” Instead, the Microlog is turned off and on using a “suspend / resume” process. When you press the Microlog’s red power button, it seems as if you are turning the Microlog “off.” However, in reality you are placing the Microlog in “suspend” mode. Suspend mode conserves battery power by stopping almost all activity, but leaves the Microlog immediately ready to resume operations where it left off.
• Press the red power button to turn the Microlog on (e.g., initial power on), the SKF title screen initially displays, showing your unit’s firmware version number. After a few seconds, the Microlog automatically displays its Home screen showing the available operating modes.
• Press the power button for two seconds to turn the Microlog off (suspend mode).
To free up internal memory, when powered off in Route, Analyzer, Setup or from the Home screen, the Microlog automatically power cycles the instrument on the first power on of the next day. This power cycle is similar to a soft reboot, where all memory and resources are freed up, all ROUTEs are closed, and you are returned to the Home screen.
Enter / Fire Buttons
The two enter / fire buttons are located on either side of the LCD display. In any screen, press one of the enter / fire buttons to select the highlighted option, or to progress through data collection screens.
Function Buttons
The bottom of the main screen displays up to four command words that describe the current functions of the Microlog’s four function buttons. Each command word on the display represents the function of the button beneath it. The functions of these buttons change as you operate in various Microlog modes and displays, to allow quick access to often used Microlog features.
In all non-setup displays, the 0 / up arrow (shift) button provides alternate functions for the four function buttons.
• Press the 0 / up arrow button, alternate functions display and are available for approximately three seconds, then revert back to original functions.
Arrow Buttons
The four buttons in the center of the Microlog are identified as the up, down, left, and right arrow buttons. Use of these buttons depends on your Microlog activity:
Main Screen – On the main screen, use all four arrow buttons to highlight the desired Microlog operating mode option, then press an Enter button to initiate the mode.
Introduction to the SKF GX Series Microlog How to Use the Buttons and Keypad
SKF Microlog - GX Series 1 - 15 User Manual
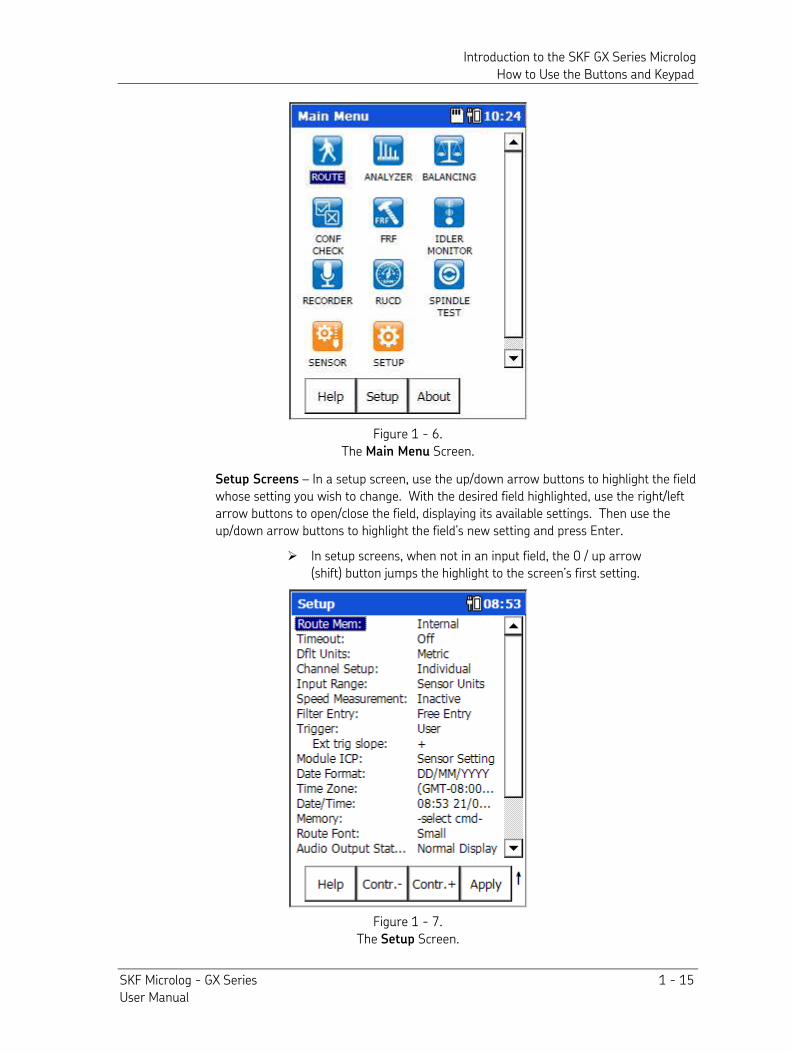
Figure 1 - 6. The Main Menu Screen.
Setup Screens – In a setup screen, use the up/down arrow buttons to highlight the field whose setting you wish to change. With the desired field highlighted, use the right/left arrow buttons to open/close the field, displaying its available settings. Then use the up/down arrow buttons to highlight the field’s new setting and press Enter.
In setup screens, when not in an input field, the 0 / up arrow (shift) button jumps the highlight to the screen’s first setting.
Figure 1 - 7. The Setup Screen.
Introduction to the SKF GX Series Microlog How to Use the Buttons and Keypad
1 - 16 SKF Microlog - GX Series User Manual
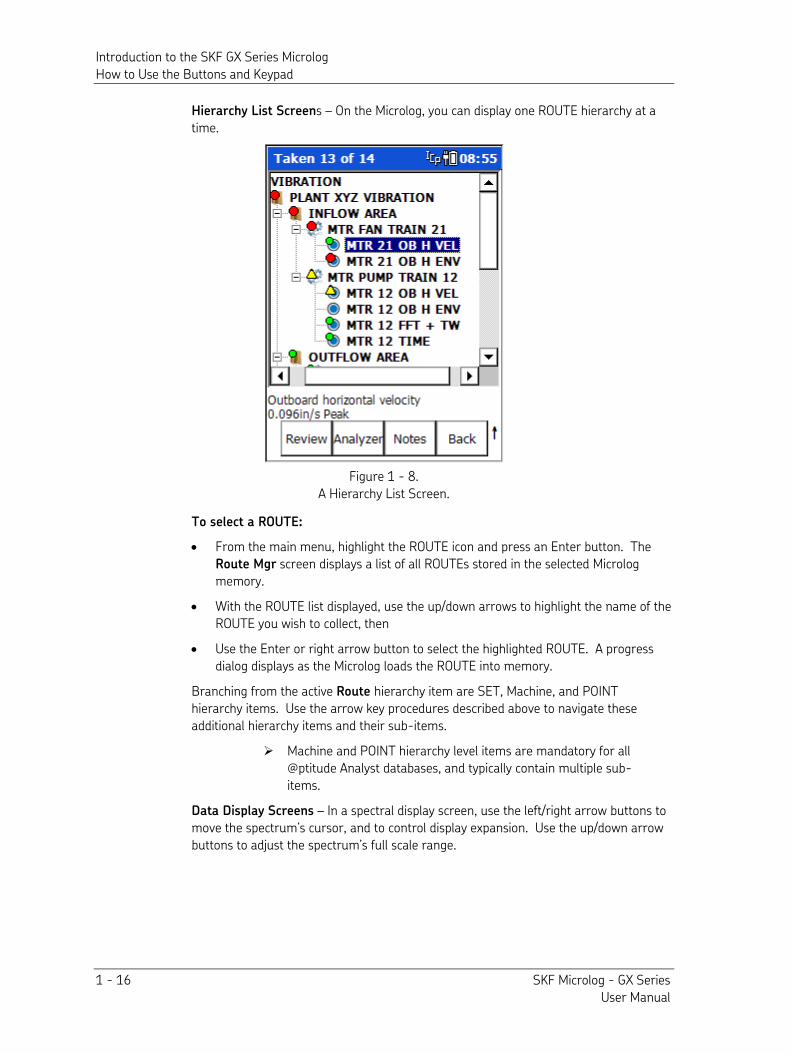
Hierarchy List Screens – On the Microlog, you can display one ROUTE hierarchy at a time.
Figure 1 - 8. A Hierarchy List Screen.
To select a ROUTE:
• From the main menu, highlight the ROUTE icon and press an Enter button. The Route Mgr screen displays a list of all ROUTEs stored in the selected Microlog memory.
• With the ROUTE list displayed, use the up/down arrows to highlight the name of the ROUTE you wish to collect, then
• Use the Enter or right arrow button to select the highlighted ROUTE. A progress dialog displays as the Microlog loads the ROUTE into memory.
Branching from the active Route hierarchy item are SET, Machine, and POINT hierarchy items. Use the arrow key procedures described above to navigate these additional hierarchy items and their sub-items.
Machine and POINT hierarchy level items are mandatory for all @ptitude Analyst databases, and typically contain multiple sub-items.
Data Display Screens – In a spectral display screen, use the left/right arrow buttons to move the spectrum’s cursor, and to control display expansion. Use the up/down arrow buttons to adjust the spectrum’s full scale range.
Introduction to the SKF GX Series Microlog How to Use the Buttons and Keypad
SKF Microlog - GX Series 1 - 17 User Manual
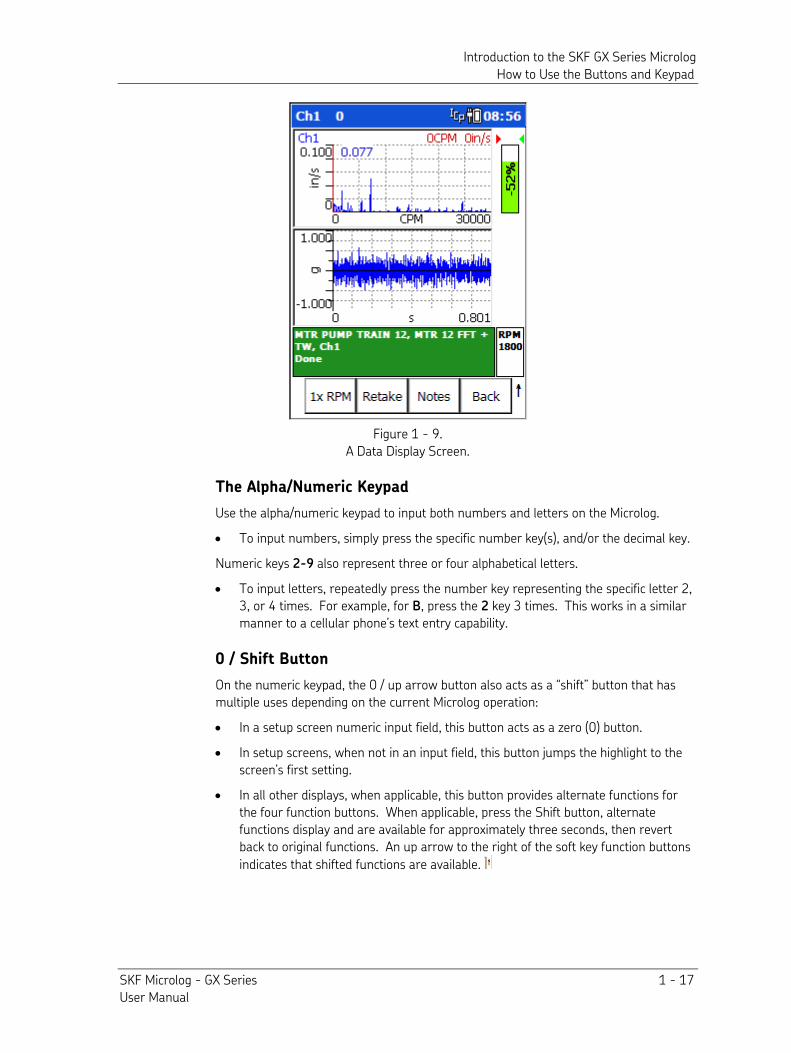
Figure 1 - 9. A Data Display Screen.
The Alpha/Numeric Keypad
Use the alpha/numeric keypad to input both numbers and letters on the Microlog.
• To input numbers, simply press the specific number key(s), and/or the decimal key.
Numeric keys 2-9 also represent three or four alphabetical letters.
• To input letters, repeatedly press the number key representing the specific letter 2, 3, or 4 times. For example, for B, press the 2 key 3 times. This works in a similar manner to a cellular phone’s text entry capability.
0 / Shift Button
On the numeric keypad, the 0 / up arrow button also acts as a “shift” button that has multiple uses depending on the current Microlog operation:
• In a setup screen numeric input field, this button acts as a zero (0) button.
• In setup screens, when not in an input field, this button jumps the highlight to the screen’s first setting.
• In all other displays, when applicable, this button provides alternate functions for the four function buttons. When applicable, press the Shift button, alternate functions display and are available for approximately three seconds, then revert back to original functions. An up arrow to the right of the soft key function buttons
indicates that shifted functions are available.
Introduction to the SKF GX Series Microlog How to Use the Buttons and Keypad
1 - 18 SKF Microlog - GX Series User Manual
Saving Microlog Screens Using the Keypad
The Microlog enables you to save display screens as graphic files on an SD card, for printing or use on a host computer.
If you wish to save and print dynamic data screens, you must first set the Config menu’s Acquisition field to Single Shot. Reference the How to Set Up Your GX Series Microlog chapter’s Global Measurement Settings section for more information.
To save screens to the Microlog’s SD card:
• If there is not an SD memory card already in the Microlog’s SD card slot, insert one.
Refer to Appendix D of this manual for important restrictions when using the CMXA 75-SL-Z2 Microlog in a Zone 2 restricted area.
• Press the shift key (zero / up arrow) then the P alphanumeric key. The Print Setup dialog displays.
• Use the function buttons to specify the file be saved to the SD Card. A bitmap (.bmp) file is saved to the SD card, and a confirmation dialog displays. Note the file name assigned to the bitmap for further use.
You may also select to save the image to the Microlog’s internal memory by selecting Internal. The bitmap image is saved in the
\InternalDisk folder. It may then be copied to a host PC using ActiveSync.
To print your saved Microlog screen bitmap:
• Press the back of the SD card to release it. Remove the SD card.
• Insert your SD card into a laptop or desktop computer with SD card slots. The SD card’s bitmap will be available in the external drive directory of your computer.
Headphone Control Using the Keypad
The GX Series Microlog offers headphone support. The data collection screen’s title bar indicates the monitored channel (CH:1 to CH:4) and the headphone volume (0 to +10, or MUTE).
Volume and channel are controlled using the alphanumeric keypad as follows:
• 6 ("M") - toggle Mute status for the selected channel
• 0 / up arrow or 0 / down arrow – adjust the volume (from 0 to 10)
• 0 / left arrow or 0 / right arrow - change the channel being monitored (from Ch:1 to Ch:4)
Introduction to the SKF GX Series Microlog Battery Operations
SKF Microlog - GX Series 1 - 19 User Manual
Battery Operations
Power Adapter/Battery Charger
The Microlog's Power Adapter/Battery Charger (CMAC 5090) converts AC power to DC power required by the GX Series Microlog. The Power Adapter/Battery Charger kit includes a USB/Power Splitter Cable (CMAC 5095) that provides connections between the Microlog, the Power Adapter/Battery Charger, and an external device’s USB communications port.
You can connect the Power Adapter/Battery Charger with your Microlog turned on or off. The Power Adapter/Battery Charger works with AC power sources worldwide. However, verify that you have a power cable designed for use in your country.
If you are running your Microlog on AC power with a battery installed, the AC Power Adapter/Battery Charger charges the battery (if needed), then maintains the battery's charge.
WARNING! The Power Adapter/Battery Charger should be placed in a ventilated area (i.e., on a desktop) when used to power the Microlog or charge the battery. Do not use the Power Adapter/Battery Charger in a poorly ventilated area, as overheating may occur, possibly resulting in a fire.
Install and Charge the Microlog Battery
Prior to using the Microlog for the first time, place the Lithium-Ion battery pack (CMAC 5031) in the Microlog and charge the Lithium Ion battery for at least 24 hours to ensure the battery is fully charged. The Microlog's battery charges when the Microlog is connected to its AC power adapter/battery charger.
You can operate the Microlog from the external power adapter/battery charger while waiting for the battery to charge.
Once the Microlog battery is fully charged (or the Microlog is connected to the Power Adapter/Battery Charger), it is ready for operation.
Battery Life
Primary power for Microlog is provided by battery packs. The battery packs operate for 8 hours in typical operating environments, although the actual per-charge life can vary drastically depending on conditions, equipment options, and usage patterns.
The battery status displays in the top right corner of the title bar.
• Press the (.) key to display the amount of battery power remaining. A dialog displays battery status.
Good – Approximately 25% or more of battery life remains (i.e., approximately 4 hours of normal usage).
Low - Less than 25% of battery life remaining (approximately 2 hours), charge the battery as soon as possible.
Introduction to the SKF GX Series Microlog Battery Operations
1 - 20 SKF Microlog - GX Series User Manual
Critical – Very limited battery life remaining (less than 45-60 minutes). Charge the battery immediately, it is not recommended to continue work when the battery status is Critical.
Charging – Indicates the battery is charging.
IMPORTANT: Connect the Microlog to its Power Supply/Battery Charger whenever you do not intend to resume operations in the immediate future. Database damage may occur if battery power is completely discharged while the unit is in operation or in suspend mode.
How to Install the Battery Pack
IMPORTANT: To ensure proper and safe Microlog operation, ONLY use the supplied battery pack.
To install the Lithium-Ion battery pack in your Microlog:
• Remove the two screws on the battery cover located on the underside of your device and lift the battery cover away from the device.
• The main battery is removed by sliding the cell to the left and lifting it out of the device.
• Insert the replacement lithium-ion battery in the battery compartment and slide to the right to fit into place.
• Replace the battery cover and press down firmly on the cover while re-securing the latches.
WARNING! To minimize the risk of serious injury or damage:
Do not expose the battery pack to temperatures in excess of 140 °F (60 °C). Do not disassemble, incinerate, or short-circuit the battery pack.
Danger of explosion if battery is incorrectly replaced.
Replace the battery only with the same or equivalent type recommended by the manufacturer. Dispose of used batteries according to the manufacturer’s instructions.
Do not open battery compartment in a hazardous / explosive area.
Replacing the Battery in an Active Microlog
If the Microlog is running from battery power only, removing the battery causes the Microlog to shut off power to the LCD display and to the SD card. The Microlog may lose any data stored in RAM. This could result in database errors!
To avoid these problems, use the following procedure to replace the battery pack in an active Microlog running on battery power:
• Press the Power button for two seconds to suspend the Microlog.
• Unlatch the battery and remove the pack.
Introduction to the SKF GX Series Microlog Battery Operations
SKF Microlog - GX Series 1 - 21 User Manual
• Replace with a fully charged battery pack and re-latch.
• Press the Power button.
The CMXA 75-SL-Z2 Microlog requires you to re-enter the Microlog’s date and time when the main battery is disconnected.
How to Charge the Battery Pack
The Microlog's Lithium-Ion battery packs (CMAC 5031) charge fully in 3-5 hours in the Microlog. To prevent overcharging, an internal monitoring circuit shuts power off to the battery once it reaches full capacity.
IMPORTANT - Charge the battery fully before using the Microlog.
The battery is charged in the Microlog using the power supply. The Microlog is usable while the battery is charging.
To charge a battery pack in the Microlog:
• Ensure the power source is plugged into a wall outlet.
• Insert the power source into the POWER connector at the top of the Microlog.
Battery Maintenance
Dispose your SKF Microlog Analyzer battery according to your local regional requirements. If you are unable to dispose the battery locally, contact an SKF Certified Repair depot to request a Return Authorization (RA) number to return the battery to SKF for recycling. You may obtain an RA number from the SKF website at www.skf.com/cm.
Use the following recommendations to prolong the life of your battery:
• If a GX unit is temporarily not in use (and therefore not being regularly charged), it is important that it is recharged at least every 25 to 30 days to prevent damage to the cells.
• If the GX battery pack is left outside the GX unit, it is important that it is recharged every 12 months to prevent damage to the cells.
• It is recommended to recalibrate the electronic "fuel gauge" (i.e., State Of Charge meter) after approximately every 30th recharge. This prevents the fuel gauge from showing an incorrect battery charge percentage. To do this, fully discharge the GX battery pack and then fully charge it without any interruptions, ideally with the unit in suspend mode (off).
• It will take longer to charge the battery if the GX unit is switched on during charging. Recharge the instrument while the unit is in suspend mode (off) for the quickest recharge time.
• The battery capacity (the length of unit's operational / run time) will be reduced at temperature extremes (i.e., both high and low operating temperatures will reduce the amount of time the unit runs from the battery pack).
Introduction to the SKF GX Series Microlog Microlog System Connections
1 - 22 SKF Microlog - GX Series User Manual
Microlog System Connections
WARNING! Refer to Appendix D of this manual for important restrictions when using the CMXA 75-SL-Z2 Microlog in a Zone 2 restricted area.
Communication Set Up
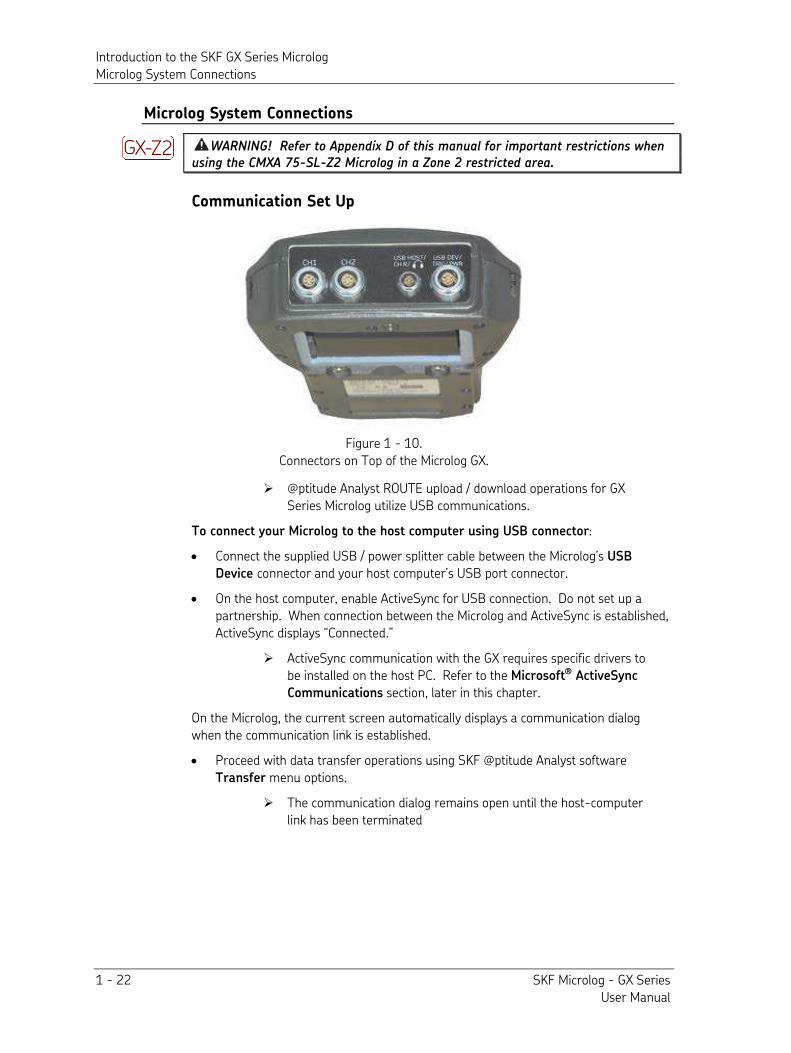
Figure 1 - 10. Connectors on Top of the Microlog GX.
@ptitude Analyst ROUTE upload / download operations for GX Series Microlog utilize USB communications.
To connect your Microlog to the host computer using USB connector:
• Connect the supplied USB / power splitter cable between the Microlog’s USB
Device connector and your host computer’s USB port connector.
• On the host computer, enable ActiveSync for USB connection. Do not set up a partnership. When connection between the Microlog and ActiveSync is established, ActiveSync displays “Connected.”
ActiveSync communication with the GX requires specific drivers to be installed on the host PC. Refer to the Microsoft ActiveSync
Communications section, later in this chapter.
On the Microlog, the current screen automatically displays a communication dialog when the communication link is established.
• Proceed with data transfer operations using SKF @ptitude Analyst software Transfer menu options.
The communication dialog remains open until the host-computer link has been terminated
Introduction to the SKF GX Series Microlog Microlog System Connections
SKF Microlog - GX Series 1 - 23 User Manual
CH1, CH2, USB Device/Power/Trigger, and USB Host Connectors
Sensor input signals are connected through the CHannel 1 and CHannel 2 Fischer connectors and the USB Host/CH 4 connector at the top of the Microlog.
With CH1 and CH2, no cable identification takes place to achieve the flexibility of accepting signals from different sensors; including accelerometers, velocity and displacement sensors, process inputs, etc. Therefore, the GX Series Microlog proceeds to take data when the measurement is started, even though there may not be a sensor or cable attached.
CH1 – Provides input capabilities for CH1, CH2, CH3, and CH4 signal input channels.
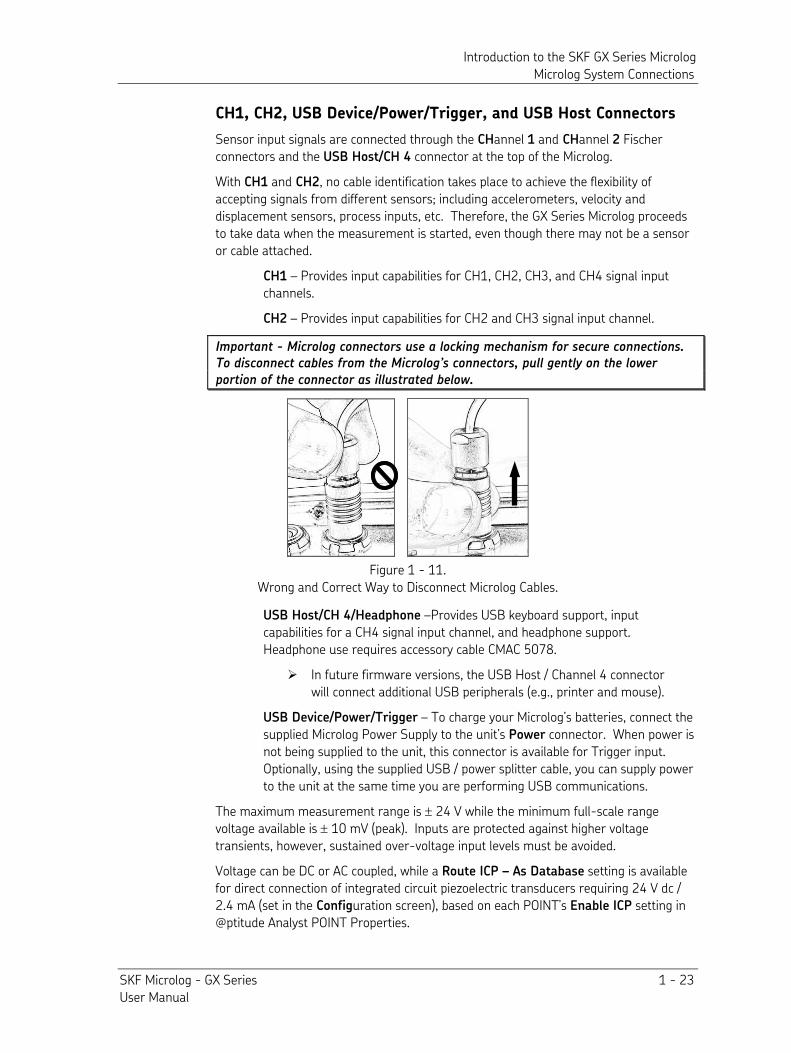
CH2 – Provides input capabilities for CH2 and CH3 signal input channel. Important - Microlog connectors use a locking mechanism for secure connections. To disconnect cables from the Microlog’s connectors, pull gently on the lower portion of the connector as illustrated below.
Figure 1 - 11. Wrong and Correct Way to Disconnect Microlog Cables.
USB Host/CH 4/Headphone –Provides USB keyboard support, input capabilities for a CH4 signal input channel, and headphone support. Headphone use requires accessory cable CMAC 5078.
In future firmware versions, the USB Host / Channel 4 connector will connect additional USB peripherals (e.g., printer and mouse).
USB Device/Power/Trigger – To charge your Microlog’s batteries, connect the supplied Microlog Power Supply to the unit’s Power connector. When power is not being supplied to the unit, this connector is available for Trigger input. Optionally, using the supplied USB / power splitter cable, you can supply power to the unit at the same time you are performing USB communications.
The maximum measurement range is ± 24 V while the minimum full-scale range voltage available is ± 10 mV (peak). Inputs are protected against higher voltage transients, however, sustained over-voltage input levels must be avoided.
Voltage can be DC or AC coupled, while a Route ICP – As Database setting is available for direct connection of integrated circuit piezoelectric transducers requiring 24 V dc / 2.4 mA (set in the Configuration screen), based on each POINT’s Enable ICP setting in @ptitude Analyst POINT Properties.
Introduction to the SKF GX Series Microlog Microlog System Connections
1 - 24 SKF Microlog - GX Series User Manual
If the instrument is configured to take ICP measurements and no ICP sensor is attached, and error message appears on the screen.
In the event that the Enable ICP setting has not been configured in @ptitude Analyst (for example, if a ROUTE was downloaded from an older version of Machine Analyst that did not support this setting), you can set the Route ICP setting to Never.
When Route ICP is set to Never, a reminder prompt will display when you attempt data collection for the first POINT in a ROUTE. If you press OK, the prompt will appear at the beginning of each POINT. If you select OK to All, the prompt will not appear again until another ROUTE is selected from the Route Manager.
External input signals can be taken from “buffered” outputs like those on permanently mounted rack systems, process signals, or from a signal generator.
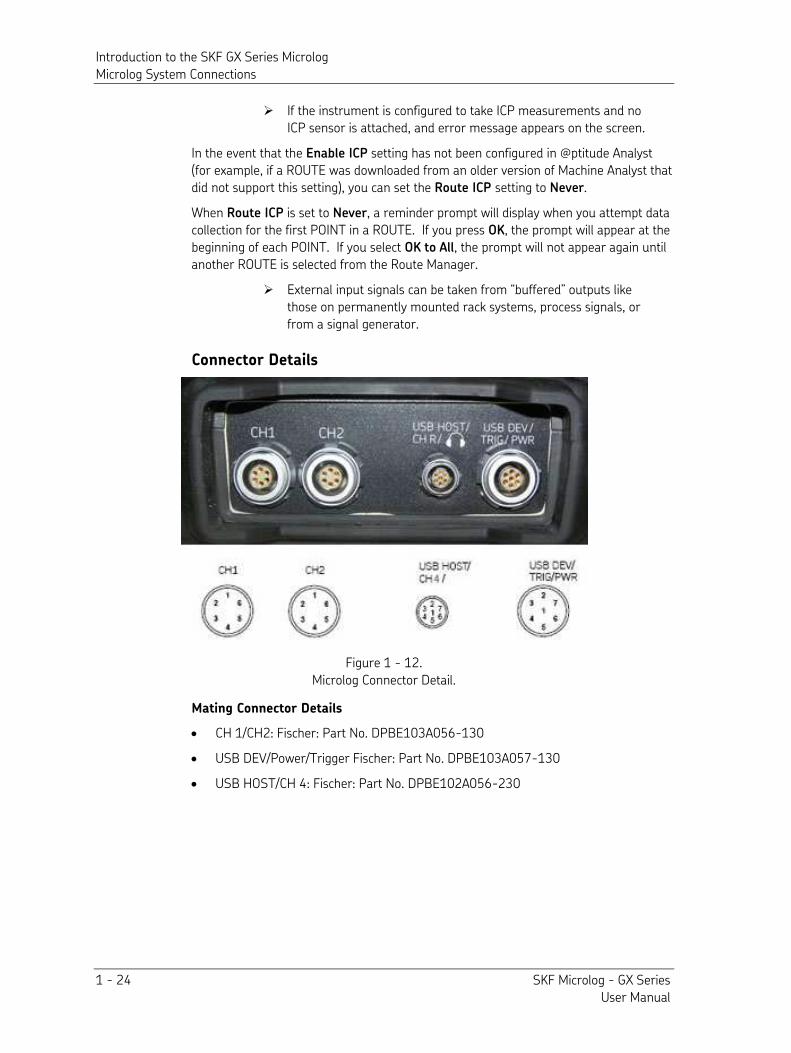
Connector Details
Figure 1 - 12. Microlog Connector Detail.
Mating Connector Details
• CH 1/CH2: Fischer: Part No. DPBE103A056-130
• USB DEV/Power/Trigger Fischer: Part No. DPBE103A057-130
• USB HOST/CH 4: Fischer: Part No. DPBE102A056-230
Introduction to the SKF GX Series Microlog Microlog System Connections
SKF Microlog - GX Series 1 - 25 User Manual
Pin-out CH1 Pin-out CH2 USB H/CH R USB DEV/TRIG/PWR
1 CHANNEL 1 1 CHANNEL 2 1 CHANNEL 4 1 EXT-DC-IN
2 CHANNEL 2 2 NC 2 USB VBUS 2 USB Device D +
3 Strobe Out 3 Digital Gnd 3 USB Host D+ 3 USB Device D-
4 CHANNEL 4 4 CHANNEL 3 4 USB Host D- 4 Digital Gnd
5 Analog Gnd 5 Analog Gnd 5 Gnd 5 EXT-TRIG-AUX
6 CHANNEL 3 6 +5V-Tacho Out 6 Audio Out 6 USBV
7 Analog Gnd 7 +5V-Tacho Out
Microsoft ActiveSync Communications
The procedures in this document require a USB connection between your Microlog and host PC. If you have not previously connected to your Microlog, you should first verify that ActiveSync (Win XP) or Mobile Device Centre (Win 7) is installed on your PC. If it is not, you must download and install it. There are also specific drivers that must be installed for communication with the Microlog. (See below for details.)
Installing ActiveSync, or Mobile Device Centre
To download a free version of Microsoft ActiveSync (XP), or Mobile Device Centre (Win 7) and for details on how to use them, contact the Microsoft Corporation via their website at www.microsoft.com. Run the installation program and follow the on-screen instructions.
Once installed, you must configure ActiveSync, or Mobile Device Centre to communicate through the USB port. To do so, select the File menu’s Connection Settings option and enable the Allow USB connection… option.
USB Drivers for Microlog
To facilitate communication between the Microlog and a host PC, you must first install specific Windows driver files onto the host PC. To install the driver files:
• Run the SKF USB Driver Installer v#.##.###.msi installer from the Product CD’s USB Driver folder to copy the driver files to the PC in a known location.
• Once installed, connect the Microlog to the PC using the CMAC 5095/CA-38 USB/Power Splitter Cable or by placing the unit on the docking station.
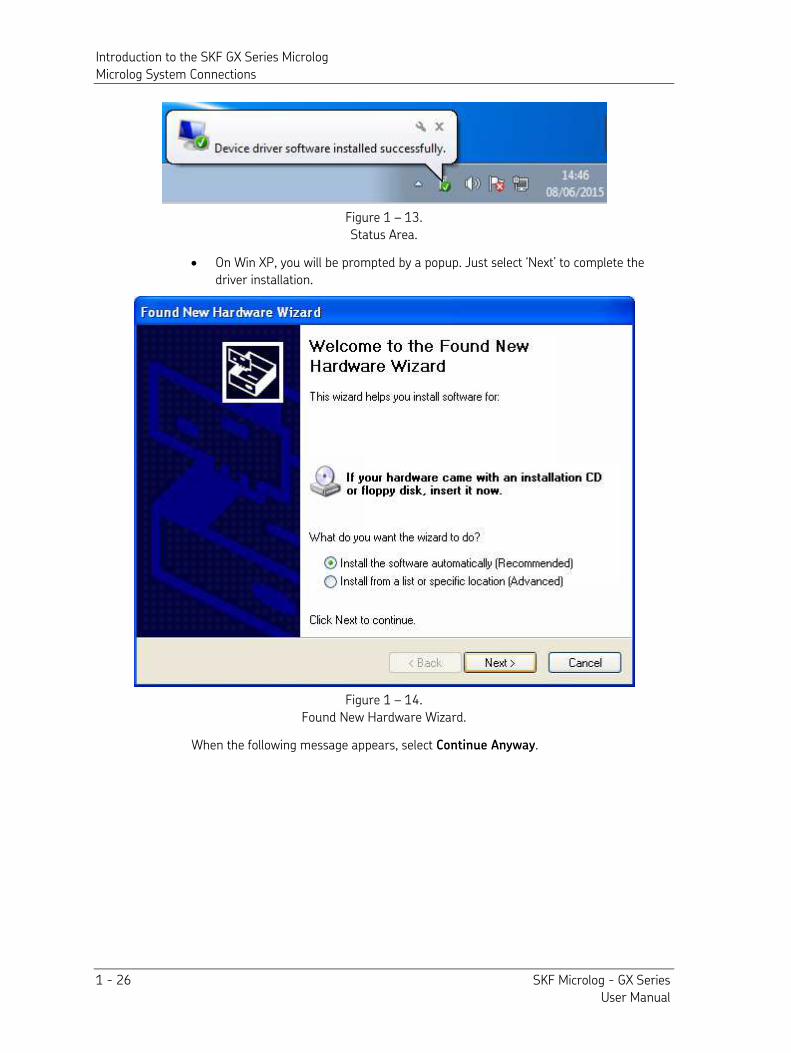
• Windows will now complete the device installation. • On Win 7, you will be notified of driver installation completion in the status area.
Introduction to the SKF GX Series Microlog Microlog System Connections
1 - 26 SKF Microlog - GX Series User Manual
Figure 1 – 13. Status Area.
• On Win XP, you will be prompted by a popup. Just select ‘Next’ to complete the driver installation.
Figure 1 – 14. Found New Hardware Wizard.
When the following message appears, select Continue Anyway.
Introduction to the SKF GX Series Microlog SD Memory Card Operation
SKF Microlog - GX Series 1 - 27 User Manual
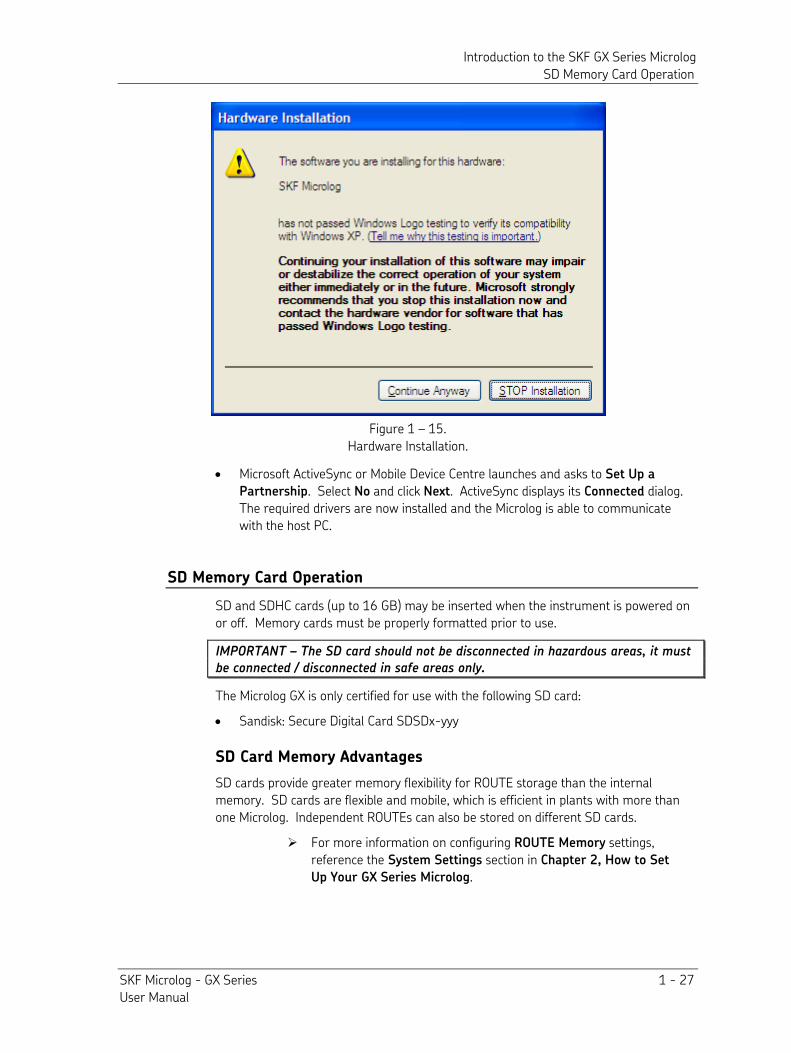
Figure 1 – 15. Hardware Installation.
• Microsoft ActiveSync or Mobile Device Centre launches and asks to Set Up a
Partnership. Select No and click Next. ActiveSync displays its Connected dialog. The required drivers are now installed and the Microlog is able to communicate with the host PC.
SD Memory Card Operation
SD and SDHC cards (up to 16 GB) may be inserted when the instrument is powered on or off. Memory cards must be properly formatted prior to use.
IMPORTANT – The SD card should not be disconnected in hazardous areas, it must be connected / disconnected in safe areas only.
The Microlog GX is only certified for use with the following SD card:
• Sandisk: Secure Digital Card SDSDx-yyy
SD Card Memory Advantages
SD cards provide greater memory flexibility for ROUTE storage than the internal memory. SD cards are flexible and mobile, which is efficient in plants with more than one Microlog. Independent ROUTEs can also be stored on different SD cards.
For more information on configuring ROUTE Memory settings, reference the System Settings section in Chapter 2, How to Set
Up Your GX Series Microlog.
Introduction to the SKF GX Series Microlog How to Perform a Reset on Your Microlog
1 - 28 SKF Microlog - GX Series User Manual
How to Perform a Reset on Your Microlog
Should you need to reset your Microlog, you have the option to perform either a hard or soft reset. A hard reset resets the date, time, and time zone to their default values. A soft reset preserves these values.
A reset will not delete data or ROUTEs. The Setup mode’s Memory field provides several memory operations that may delete data or ROUTE memory. Reference Chapter 2, How to
Set Up Your GX Series Microlog, for more information on memory operations.
To perform a soft reset:
• With the Microlog ON, simultaneously hold down the 2, 7, 8, and 9 keys on the Microlog keypad for approximately 1 second.
• The Microlog application reboots and the LCD screen loads the SKF title screen, then the main screen.
To hard reset your Microlog:
• With the Microlog OFF, unscrew the battery cover on the back of the unit.
• Using a 1/16th inch pin or a straightened paper clip, press the reset button located in the lower left corner of the battery compartment, below the battery.
• The LCD screen loads the SKF title screen, then the main screen. The Microlog’s memory may also be initialized using the Setup
mode’s Memory/Initialize option. Reference the How to Set Up
your Microlog chapter for more information.
Introduction to the SKF GX Series Microlog Strap Attachment
SKF Microlog - GX Series 1 - 29 User Manual
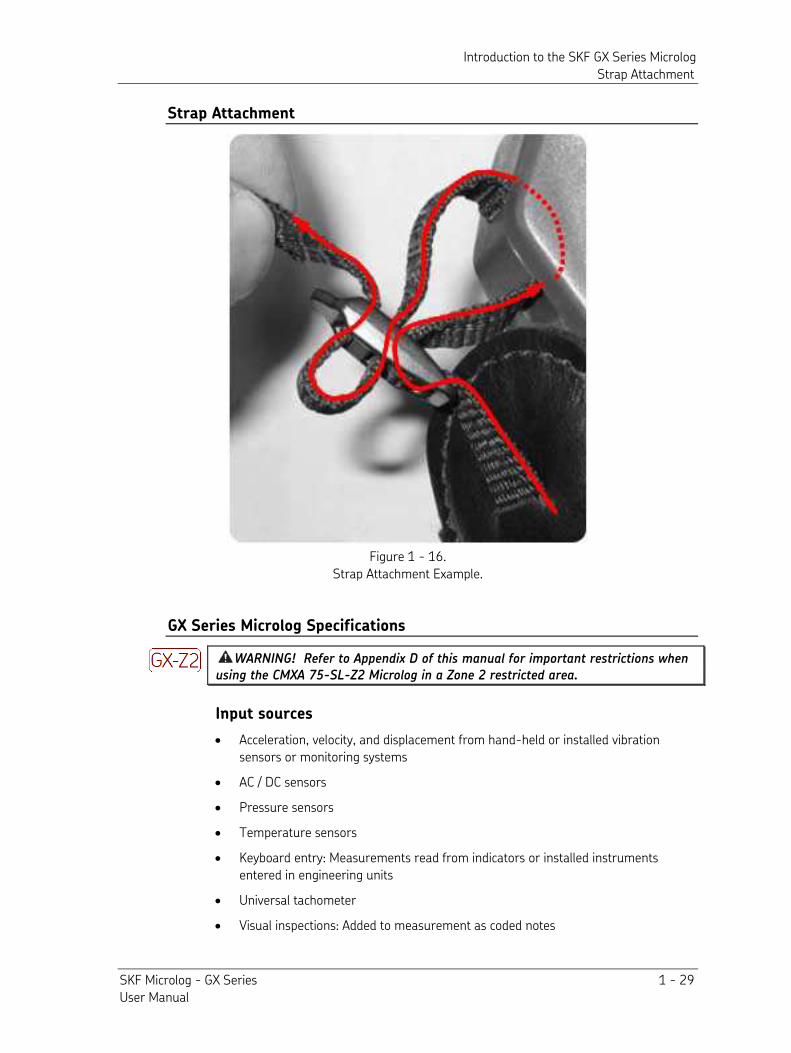
Strap Attachment
Figure 1 - 16. Strap Attachment Example.
GX Series Microlog Specifications
WARNING! Refer to Appendix D of this manual for important restrictions when using the CMXA 75-SL-Z2 Microlog in a Zone 2 restricted area.
Input sources
• Acceleration, velocity, and displacement from hand-held or installed vibration sensors or monitoring systems
• AC / DC sensors
• Pressure sensors
• Temperature sensors
• Keyboard entry: Measurements read from indicators or installed instruments entered in engineering units
• Universal tachometer
• Visual inspections: Added to measurement as coded notes
Introduction to the SKF GX Series Microlog GX Series Microlog Specifications
1 - 30 SKF Microlog - GX Series User Manual
Preprocessing
• Enveloper (demodulator): With four selectable input filters for enhanced bearing and gear mesh fault detection
• Filter selection: – 5 Hz to 100 Hz – 50 Hz to 1 kHz – 500 Hz to 10 kHz – 5 kHz to 40 kHz
• Input parameters: – Tachometer: TTL / analogue programmable to ±25 V – RPM range 1 to 99 999 – Tachometer power supply output +5 V at 100 mA
• Input over-voltage protection: – AC ±50 V peak – DC ±50 V sustained
• Dynamic range: >90 dB (24 bit ADC sigma-delta)
• Input connectors: – CH1: Six pin Fischer, CH1, CH2, CH3 – CH2: Six pin Fischer, CH2, CH3 – USB host / CHR / headphone: USB keyboard, CHR, headphones – USB Device / power / trigger: Seven pin Fischer trigger in, trigger tachometer
power supply, USB COMMS, charger
• Input signal range: ±25 V maximum
Data processing and storage
• Microprocessor: Marvell 806 MHz PXA320
• Internal storage: 128 MB (capable of storing approximately 4 000 spectra)
• SD card: SD memory card up to 16 GB
Measurement
• Range: – Route measurements: DC to 80 kHz – Analyzer measurements: DC to 80 kHz
• Averaging: 1 to 255 time averages, 1 to 4 096 spectral averages
• Averaging type: RMS, Exponential, Peak Hold, and Time Sync
• Cursor: Fixed and cursor lock. Single, harmonic and peak pick.
• Trigger modes: Free run or external trigger (trigger slope and amplitude)
• Resolution: Programmable 100, 200, 400, 800, 1 600, 3 200, 6 400, 12 800, and 25 600 lines
• Measurement windows: Hanning, flat top and rectangular
Introduction to the SKF GX Series Microlog GX Series Microlog Specifications
SKF Microlog - GX Series 1 - 31 User Manual
• Multi-point automation: Up to 12 measurements can be listed for one button push automated data collection at each measurement location
Data displays
• Single and dual channel spectrum, single and dual channel time, phase table, process, orbit, cross channel phase
• Simultaneous spectrum, time waveform, peak hold averaging
• Up to 12 bands (fixed or order base) downloadable from host software
Power
• Battery: Li-ion smart battery pack
• Eight hours continuous operation minimum
Physical data
• Dedicated keys: Up, down, right, and left two enter keys for right and left hand operation, four function buttons
• Hot keys: Peak find, harmonic, expand
• LCD screen: Color 1/4 VGA 320 x 240 pixels (54 x 72 mm) viewable
• Case: High impact ABS with IP 65 dust and splash rating
• Weight: 715 g (1.6 lb.)
• Size (height x width): – Narrowest point: 186 x 93 mm (7.4 x 3.7 in.) – Widest point: 186 x 134 mm (7.4 x 5.4 in.)
• Drop test: 2 m (6.6 ft.), to MIL STD 810 specifications
Environmental
• Hazardous locations: – CSA, Class I, Division 2, Groups A, B, C, D (special conditions per installation
drawing 090-22600, reference Appendix D, Safety Instructions)
– ATEX: II 3 G Ex ic IIC T4 Gc (Ta = -10 °C to +50 °C) (special conditions per installation drawing 090-22861-1, reference Appendix D, Safety Instructions)
– IECEx: Ex ic IIC T4 Gc (Ta = -10 °C to +50 °C)
• CE rated – Special conditions per certifications
• IP Rating: IP 65
• Temperature ratings: – Operating temperature: –10 to +50 °C (14 to 122 °F) – Storage temperature: –20 to +60 °C (–4 to +140 °F)
• Humidity: 95% non-condensing
Introduction to the SKF GX Series Microlog GX Series Microlog Specifications
1 - 32 SKF Microlog - GX Series User Manual
Communications
• USB communication
Host software
The SKF Microlog GX series communicates with SKF @ptitude Analyst software for ROUTE measurement data collection and analysis, and also to SKF’s Analysis and Reporting Manager software for analysis of Non ROUTE data.
SKF Microlog - GX Series 2 - 1 User Manual
2
How to Set Up Your GX Series Microlog
System Settings
Overview
This section describes Setup, Configuration and Sensor Setup options that determine various Microlog system preferences.
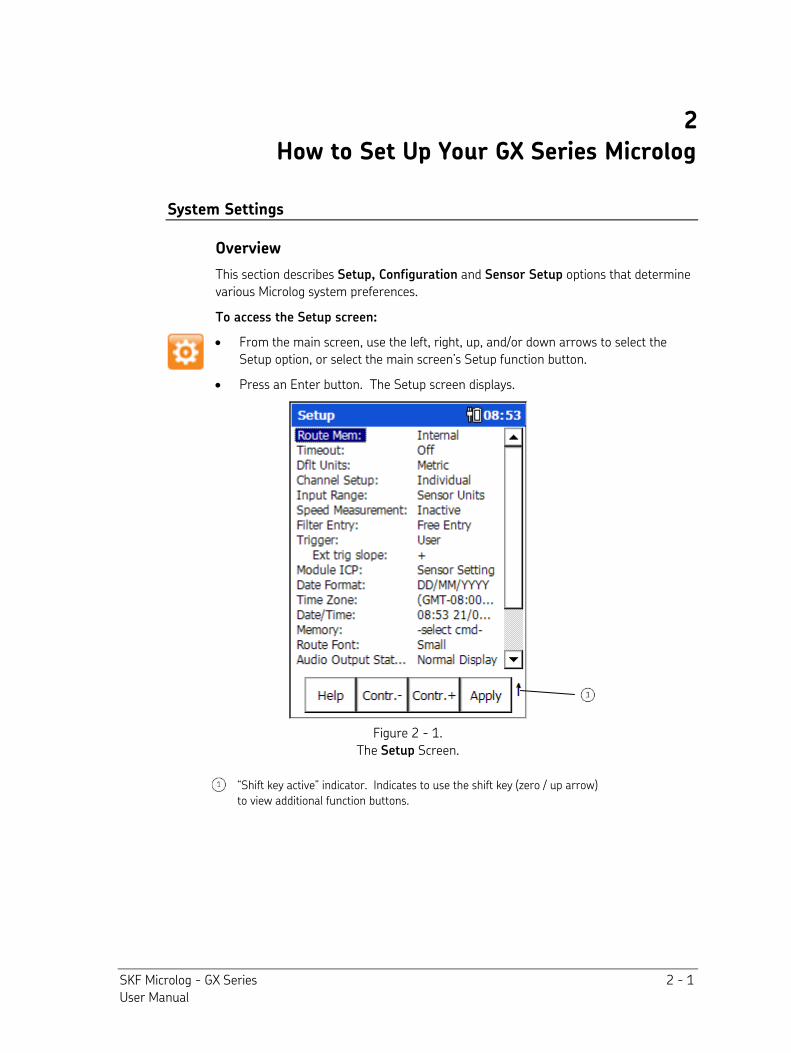
To access the Setup screen:
• From the main screen, use the left, right, up, and/or down arrows to select the Setup option, or select the main screen’s Setup function button.
• Press an Enter button. The Setup screen displays.
Figure 2 - 1. The Setup Screen.
“Shift key active” indicator. Indicates to use the shift key (zero / up arrow) to view additional function buttons.
How to Set Up Your GX Series Microlog System Settings
2 - 2 SKF Microlog - GX Series User Manual
The Setup Screen
Function Buttons
Help – Press the Help function button to quickly view on-line help for Microlog data collection.
[Cont. -] – Press the Cont.- function button to decrease graphic display contrast.
[Cont. +] – Press the Cont. + function button to increase graphic display contrast.
Apply – Press the Apply function button to save all changes to Setup screen fields and return to the main screen.
Modules – Press the Shift button (0 / up arrow) and the Modules button to open the Module Manager.
The following system preferences are configured from the Setup screen:
Press an Enter button to accept the highlighted selection in all drop-down lists.
A scroll bar in a drop-down list indicates there are more options than visible. Use the up and down arrow buttons to scroll through all options.
ROUTE Memory – Internal or Card. Specify whether to store measurement data on the Microlog’s Internal flash memory chip, on its PC memory Card, or on an SD Card.
Card memory has more memory than Internal. The Microlog has 128 MB internal memory. SD cards offer up to 16 GB memory. (Storage on SD cards is subject to available Microlog RAM. You may or may not be able to utilize all of the memory on the card.)
Timeout – 5 min, 10 min, 15 min, 20 min, or Off. Select the inactivity time period after which the Microlog shuts down to conserve battery life, or disable this feature.
Default Units – English or Metric. Determines the system's units of measurement. For example, select English to measure velocity measurements in in/sec, or select Metric to measure velocity measurements in mm/sec.
Channel Setup – Individual or Copy to All. (Applicable to modules that support multi-channel measurements.) For multi-channel measurements, determines whether all channels share the same sensor settings or whether each individual channel may be configured with specific sensor settings.
Individual – When Individual is selected, then in a module’s multi-channel measurement setup, each channel may be configured with channel specific sensor settings.
Copy to All – When Copy to All is selected, then in a module’s multi-channel measurement setup, all channels use channel 1’s sensor setup.
Input Range – Autorange, Maximum, or Sensor Units. Specify whether to use autoranging, or to use a fixed range set by the Microlog, or to use a fixed range set by the sensor setting.
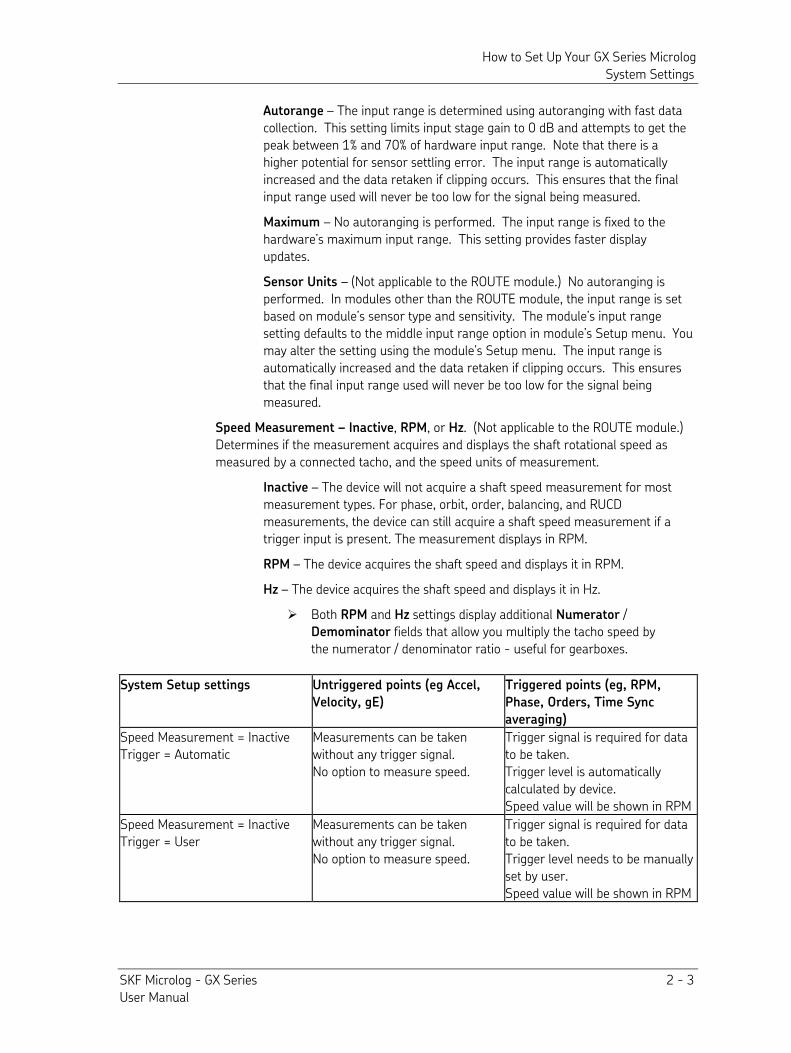
How to Set Up Your GX Series Microlog System Settings
SKF Microlog - GX Series 2 - 3 User Manual
Autorange – The input range is determined using autoranging with fast data collection. This setting limits input stage gain to 0 dB and attempts to get the peak between 1% and 70% of hardware input range. Note that there is a higher potential for sensor settling error. The input range is automatically increased and the data retaken if clipping occurs. This ensures that the final input range used will never be too low for the signal being measured.
Maximum – No autoranging is performed. The input range is fixed to the hardware’s maximum input range. This setting provides faster display updates.
Sensor Units – (Not applicable to the ROUTE module.) No autoranging is performed. In modules other than the ROUTE module, the input range is set based on module’s sensor type and sensitivity. The module’s input range setting defaults to the middle input range option in module’s Setup menu. You may alter the setting using the module’s Setup menu. The input range is automatically increased and the data retaken if clipping occurs. This ensures that the final input range used will never be too low for the signal being measured.
Speed Measurement – Inactive, RPM, or Hz. (Not applicable to the ROUTE module.) Determines if the measurement acquires and displays the shaft rotational speed as measured by a connected tacho, and the speed units of measurement.
Inactive – The device will not acquire a shaft speed measurement for most measurement types. For phase, orbit, order, balancing, and RUCD measurements, the device can still acquire a shaft speed measurement if a trigger input is present. The measurement displays in RPM.
RPM – The device acquires the shaft speed and displays it in RPM.
Hz – The device acquires the shaft speed and displays it in Hz.
Both RPM and Hz settings display additional Numerator / Demominator fields that allow you multiply the tacho speed by the numerator / denominator ratio - useful for gearboxes.
System Setup settings Untriggered points (eg Accel,
Velocity, gE)
Triggered points (eg, RPM,
Phase, Orders, Time Sync
averaging)
Speed Measurement = Inactive Trigger = Automatic
Measurements can be taken without any trigger signal. No option to measure speed.
Trigger signal is required for data to be taken. Trigger level is automatically calculated by device. Speed value will be shown in RPM
Speed Measurement = Inactive Trigger = User
Measurements can be taken without any trigger signal. No option to measure speed.
Trigger signal is required for data to be taken. Trigger level needs to be manually set by user. Speed value will be shown in RPM
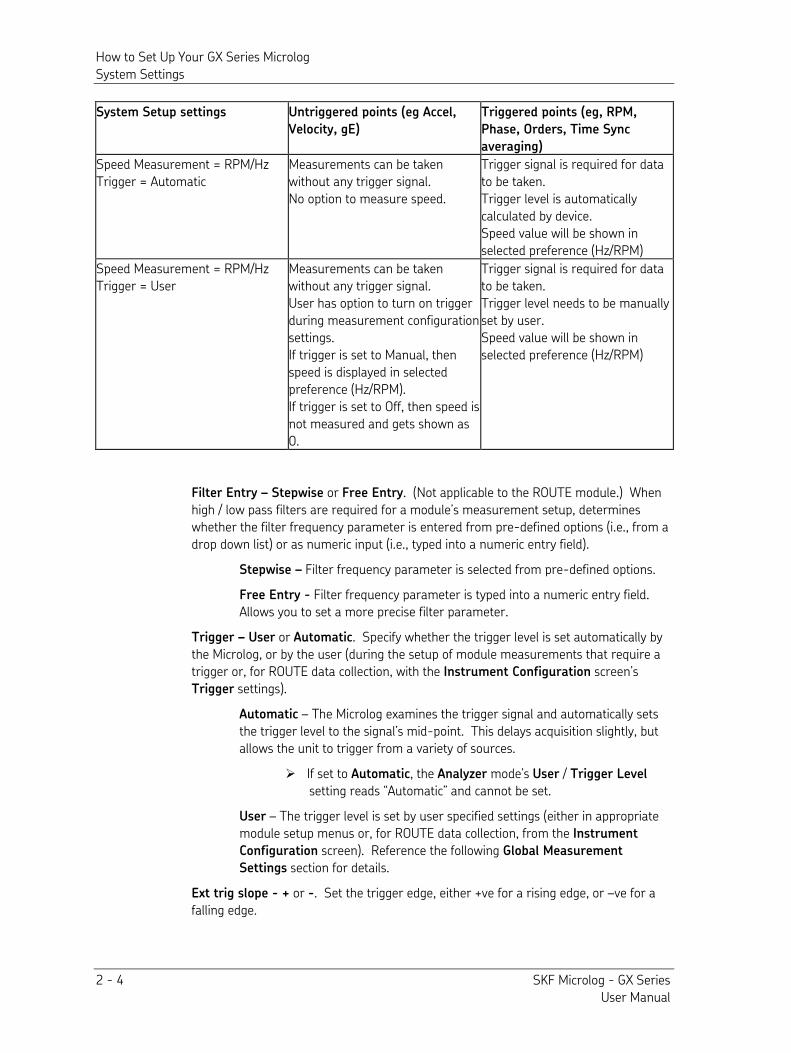
How to Set Up Your GX Series Microlog System Settings
2 - 4 SKF Microlog - GX Series User Manual
System Setup settings Untriggered points (eg Accel,
Velocity, gE)
Triggered points (eg, RPM,
Phase, Orders, Time Sync
averaging)
Speed Measurement = RPM/Hz Trigger = Automatic
Measurements can be taken without any trigger signal. No option to measure speed.
Trigger signal is required for data to be taken. Trigger level is automatically calculated by device. Speed value will be shown in selected preference (Hz/RPM)
Speed Measurement = RPM/Hz Trigger = User
Measurements can be taken without any trigger signal. User has option to turn on trigger during measurement configuration settings. If trigger is set to Manual, then speed is displayed in selected preference (Hz/RPM). If trigger is set to Off, then speed is not measured and gets shown as 0.
Trigger signal is required for data to be taken. Trigger level needs to be manually set by user. Speed value will be shown in selected preference (Hz/RPM)
Filter Entry – Stepwise or Free Entry. (Not applicable to the ROUTE module.) When high / low pass filters are required for a module’s measurement setup, determines whether the filter frequency parameter is entered from pre-defined options (i.e., from a drop down list) or as numeric input (i.e., typed into a numeric entry field).
Stepwise – Filter frequency parameter is selected from pre-defined options.
Free Entry - Filter frequency parameter is typed into a numeric entry field. Allows you to set a more precise filter parameter.
Trigger – User or Automatic. Specify whether the trigger level is set automatically by the Microlog, or by the user (during the setup of module measurements that require a trigger or, for ROUTE data collection, with the Instrument Configuration screen’s Trigger settings).
Automatic – The Microlog examines the trigger signal and automatically sets the trigger level to the signal’s mid-point. This delays acquisition slightly, but allows the unit to trigger from a variety of sources.
If set to Automatic, the Analyzer mode’s User / Trigger Level
setting reads “Automatic” and cannot be set.
User – The trigger level is set by user specified settings (either in appropriate module setup menus or, for ROUTE data collection, from the Instrument
Configuration screen). Reference the following Global Measurement
Settings section for details.
Ext trig slope - + or -. Set the trigger edge, either +ve for a rising edge, or –ve for a falling edge.
How to Set Up Your GX Series Microlog System Settings
SKF Microlog - GX Series 2 - 5 User Manual
Module ICP – Sensor Setting, Off, or Always On. (Not applicable to the ROUTE module.) For measurement purposes, always set to Sensor Setting, which uses each module’s pre-selected sensor ICP setting (as defined in the Sensor Settings module). The Off and Always On settings are used for troubleshooting sensor problems. Off turns sensor ICP off for all modules and Always On turns sensor ICP on for all modules, regardless of each module’s pre-defined sensor ICP setting.
Date Format – Both European date (Day/Month/Year) and American date (Month/Day/Year) conventions are available. Select the appropriate format:
DD/MM/YYYY; MM/DD/YYYY; YYYY/MM/DD
Time Zone – For use with Microsoft ActiveSync operations. Select your time zone from the drop down list. When ActiveSync synchronizes data between the Microlog and PC, it synchronizes the date / time on the Microlog to the PC’s date / time. To prevent the date / time being set incorrectly, the Microlog’s Time Zone setting should match that of the PC.
Date/Time – Set the current date and time from the appropriate areas.
• Use the right and left arrow buttons to scroll between fields.
• Use the up and down arrow buttons or the numeric keypad to adjust the setting in each field.
• Press an Enter button to accept your Date/Time changes.
Memory – Performs an operation on the active memory selected in the Route Memory option. Options are:
-select cmd- – A placeholder: leave this option selected if you do not wish to perform any Memory commands at this time.
Delete all ROUTEs – Clears all ROUTEs from the Microlog’s ROUTE hierarchy list. This option preserves your system preferences, but deletes ROUTE measurements and data (and non-ROUTE measurements and data if you are in Legacy Nonroute mode). Initialize – Formats the active memory, and deletes all ROUTEs, ROUTE POINTs, and Analyzer POINTs (and non-ROUTE measurements and data if you are in Legacy Nonroute mode) stored within the GX Series Microlog. This process erases all stored data, but preserves the system settings and parameters and also refreshes the active memory if the Microlog is experiencing memory related problems.
Route Font – Big or Small.
Small - the ROUTE hierarchy is displayed in a smaller font.
Big - the ROUTE hierarchy is displayed in a larger font.
How to Set Up Your GX Series Microlog System Settings
2 - 6 SKF Microlog - GX Series User Manual
Audio Output Status – Normal Display, Auto Hide Display, or Control Off.
Normal Display – The audio output volume always appears in the title bar of applicable data collection screens
Auto Hide Display – The audio output volume appears in the title bar of applicable data collection screens only while one is adjusting the volume
Control Off – Volume is not adjustable
Transducer Change – Do not warn or Warn. Determines whether a warning message appears on the Microlog’s display when the next measurement uses a different ICP setting than the previous measurement. This warning helps make the data collection person aware that the upcoming measurement requires a sensor change (e.g., temperature sensor to vibration sensor, or vice-versa).
Bias Check – Manual or Automatic
Manual - Within the ROUTE hierarchy, press Shift+B to check the bias voltage for ICP measurements. This turns on the ICP supply (if it wasn't already) and measures the DC bias voltage for each channel used by this measurement (CH1 for single channel POINTs, typically CH1 and CH2 for two-channel POINTs, and CH1, CH2, and CH3 for Triax POINTs). A Bias check results screen displays.
This screen shows the voltage(s) for each channel, along with a red / green indication: green if the bias voltage is between 2 V and 18 V, which is regarded as normal, and red if it is outside this range.
This can be useful to troubleshoot a potential cable or accelerometer problem.
Automatic – Automatically checks sensor bias at the start of each measurement.
Nonroute – Use Analyzer Module or Use Legacy Nonroute. Determines which nonroute mode is available from within a ROUTE. From either the Analyzer module or the legacy Nonroute mode, you can collect measurement data for POINTs not previously downloaded to the Microlog from your @ptitude Analyst host software. Data collected in either mode can be subsequently uploaded to @ptitude Analyst as nonroute data.
Language – Use the drop down list to select the language for GX Series Microlog displays. After entering your selection, press Apply to return to the main screen, all display text appears in the specified language.
• After specifying changes to Setup screen settings, press the Apply function button to store your new settings in the GX Series Microlog. The main screen displays.
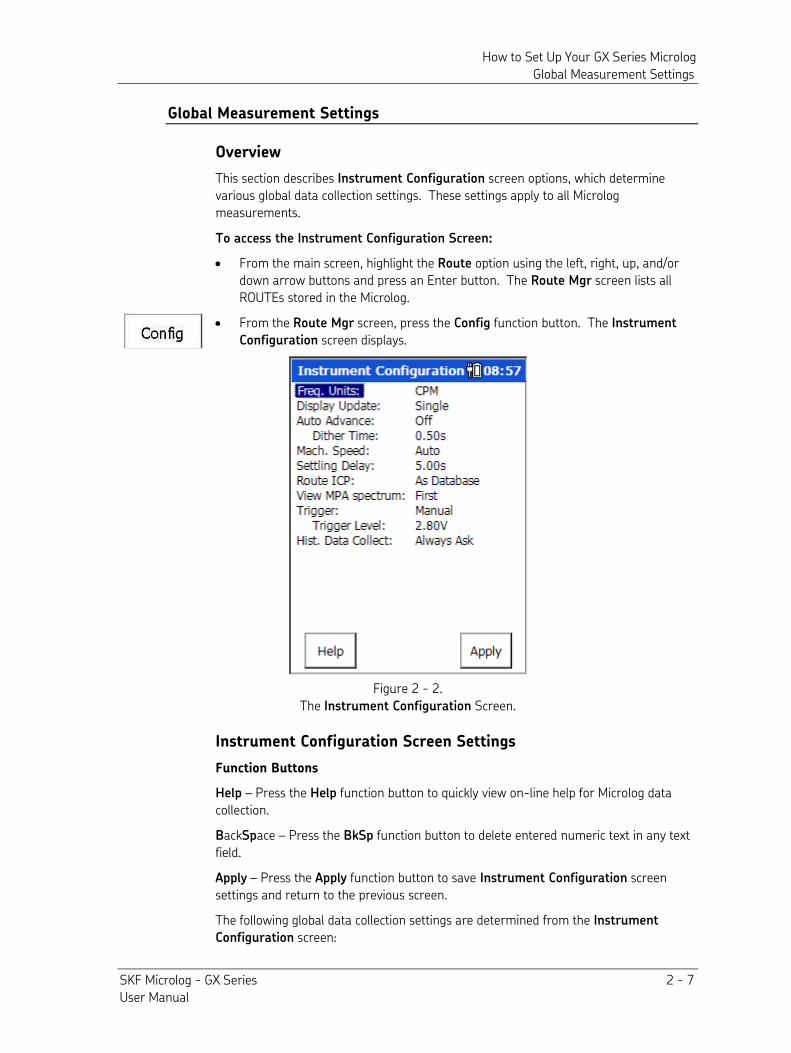
How to Set Up Your GX Series Microlog Global Measurement Settings
SKF Microlog - GX Series 2 - 7 User Manual
Global Measurement Settings
Overview
This section describes Instrument Configuration screen options, which determine various global data collection settings. These settings apply to all Microlog measurements.
To access the Instrument Configuration Screen:
• From the main screen, highlight the Route option using the left, right, up, and/or down arrow buttons and press an Enter button. The Route Mgr screen lists all ROUTEs stored in the Microlog.
• From the Route Mgr screen, press the Config function button. The Instrument Configuration screen displays.
Figure 2 - 2. The Instrument Configuration Screen.
Instrument Configuration Screen Settings
Function Buttons
Help – Press the Help function button to quickly view on-line help for Microlog data collection.
BackSpace – Press the BkSp function button to delete entered numeric text in any text field.
Apply – Press the Apply function button to save Instrument Configuration screen settings and return to the previous screen.
The following global data collection settings are determined from the Instrument
Configuration screen:
How to Set Up Your GX Series Microlog Global Measurement Settings
2 - 8 SKF Microlog - GX Series User Manual
A scroll bar in a drop-down list indicates more options are available than visible. Use the up and down arrow buttons to scroll through all options.
Press an Enter button to accept your selection in all drop-down lists.
Freq. Units – Hz, CPM, or Orders of running speed. Specify frequency units for all appropriate input fields and graphic displays.
Display Update – Single, Multiple, or Continuous. This setting determines whether to stop spectral measurements after the averaging process, or to continuously repeat measurements until Enter is pressed, and also determines whether to apply fast “spectral” averaging during data collection.
Single – Stops measurements after one averaging process and enables fast spectral averaging. When fast averaging is enabled, only the final averaged spectrum displays.
Multiple – Stops measurements after one averaging process and disables fast spectral averaging. When fast averaging is disabled, the display is updated as often as possible while the DSP is collecting and averaging the data (e.g., if the number of averages is set to 20, data might be displayed for averages 1, 6, 12, 18, and 20).
Continuous - Continuously repeats the averaged measurements until Enter is pressed. Fast averaging is enabled.
Auto Advance – On / Off. Determines how resulting spectra display during ROUTE data collection. Options are:
On – Quickly and automatically advance through ROUTE data collection, displaying each spectral measurement result for a designated Dither Time.
Off – Manually advance through ROUTE data collection, displaying each spectral measurement result until the fire key is pressed to stop the measurement and Continue is pressed to move to the next POINT in the hierarchy.
Dither Time – Time, in seconds, for which spectral results are to be displayed before Auto Advance moves to the next POINT in the hierarchy. Machine Speed – Normal, Slow or Auto. Helps collect better quality data on slower speed machinery. Specify the overall speed of the machine in order to collect accurate data.
Normal – Select for measurements on shafts rotating at or above 600 RPM.
Slow – Select if ski slope or settling problems occur on shafts rotating below 600 RPM.
Auto - Select to have the Microlog automatically select Normal or Slow depending on the POINT’s speed setting specified in @ptitude Analyst.
Settling Delay – Specify (in seconds) an additional settling delay to allow ICP transducers to power up. The specified delay applies only to the first ICP measurement after turning ICP on, (e.g., the first measurement at the start of a ROUTE or a
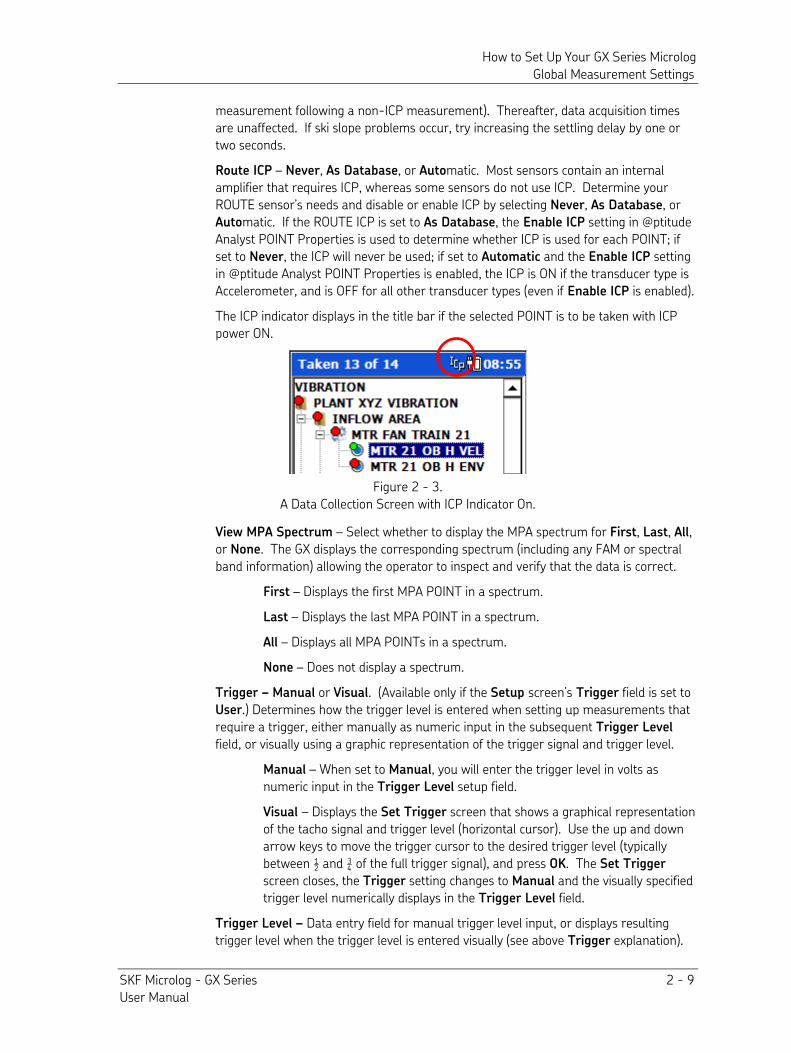
How to Set Up Your GX Series Microlog Global Measurement Settings
SKF Microlog - GX Series 2 - 9 User Manual
measurement following a non-ICP measurement). Thereafter, data acquisition times are unaffected. If ski slope problems occur, try increasing the settling delay by one or two seconds.
Route ICP – Never, As Database, or Automatic. Most sensors contain an internal amplifier that requires ICP, whereas some sensors do not use ICP. Determine your ROUTE sensor’s needs and disable or enable ICP by selecting Never, As Database, or Automatic. If the ROUTE ICP is set to As Database, the Enable ICP setting in @ptitude Analyst POINT Properties is used to determine whether ICP is used for each POINT; if set to Never, the ICP will never be used; if set to Automatic and the Enable ICP setting in @ptitude Analyst POINT Properties is enabled, the ICP is ON if the transducer type is Accelerometer, and is OFF for all other transducer types (even if Enable ICP is enabled).
The ICP indicator displays in the title bar if the selected POINT is to be taken with ICP power ON.
Figure 2 - 3. A Data Collection Screen with ICP Indicator On.
View MPA Spectrum – Select whether to display the MPA spectrum for First, Last, All, or None. The GX displays the corresponding spectrum (including any FAM or spectral band information) allowing the operator to inspect and verify that the data is correct.
First – Displays the first MPA POINT in a spectrum. Last – Displays the last MPA POINT in a spectrum. All – Displays all MPA POINTs in a spectrum.
None – Does not display a spectrum.
Trigger – Manual or Visual. (Available only if the Setup screen’s Trigger field is set to User.) Determines how the trigger level is entered when setting up measurements that require a trigger, either manually as numeric input in the subsequent Trigger Level field, or visually using a graphic representation of the trigger signal and trigger level.
Manual – When set to Manual, you will enter the trigger level in volts as numeric input in the Trigger Level setup field.
Visual – Displays the Set Trigger screen that shows a graphical representation of the tacho signal and trigger level (horizontal cursor). Use the up and down arrow keys to move the trigger cursor to the desired trigger level (typically between ½ and ¾ of the full trigger signal), and press OK. The Set Trigger screen closes, the Trigger setting changes to Manual and the visually specified trigger level numerically displays in the Trigger Level field.
Trigger Level – Data entry field for manual trigger level input, or displays resulting trigger level when the trigger level is entered visually (see above Trigger explanation).
How to Set Up Your GX Series Microlog Sensor Setup
2 - 10 SKF Microlog - GX Series User Manual
Hist. Data Collect – Always Append, Always Overwrite, or Always Ask. When new data is collected for a POINT that already has a stored measurement, you have the option to append or overwrite the older data with the new data.
Always Append – New data that is collected is appended to the existing data, allowing you to collect multiple measurements for the same POINT. Previous measurements become part of a historical data file that can be reviewed and uploaded to @ptitude Analyst.
Always Overwrite – New data that is collected overwrites the existing data, ensuring that only the most recent measurement is retained.
Always Ask – Each time a measurement is taken for a POINT that has historical data, a prompt appears asking whether you wish to append or overwrite the current measurement.
If historical data is already stored for the POINT, overwriting only overwrites the most recent measurement.
• After specifying changes to Instrument Configuration screen settings, press the Apply function button to store your new settings in the Microlog and return to the Route Mgr screen.
Sensor Setup
The Sensor Setup module provides a master list of preconfigured sensors. The default sensor list is configured at the SKF factory and contains SKF sensors used for most machinery monitoring needs. These default sensor configurations can not be edited or deleted from the list. However, you may add sensors to the sensor list as required. When a module or application requires a specific sensor, instead of having to define the sensor’s parameters during the measurement setup, you simply select the appropriate preconfigured sensor from the measurement’s context sensitive sensor list (i.e., only sensors relevant to the measurement type display during measurement setup). This significantly reduces measurement setup time.
To access the Sensor Setup screen:
• From the main screen, use the left, right, up, and/or down arrows to select the Sensor Setup module.
• Press an Enter button. The Sensor Setup screen displays.
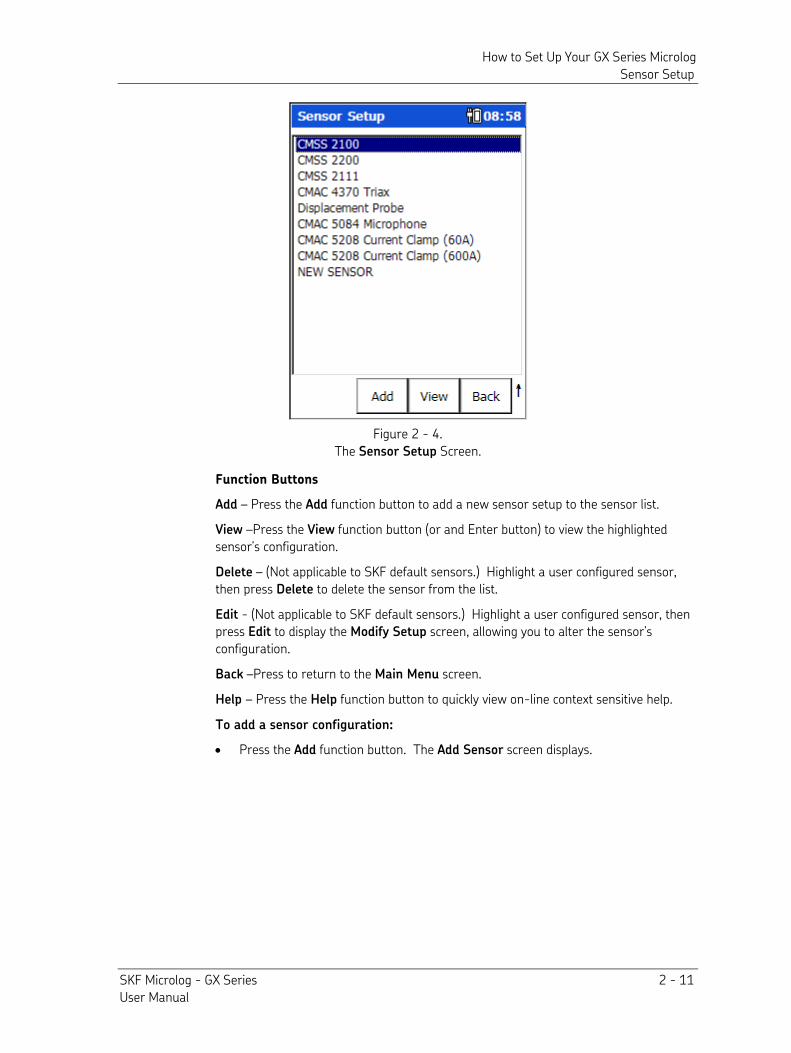
How to Set Up Your GX Series Microlog Sensor Setup
SKF Microlog - GX Series 2 - 11 User Manual
Figure 2 - 4. The Sensor Setup Screen.
Function Buttons
Add – Press the Add function button to add a new sensor setup to the sensor list.
View –Press the View function button (or and Enter button) to view the highlighted sensor’s configuration.
Delete – (Not applicable to SKF default sensors.) Highlight a user configured sensor, then press Delete to delete the sensor from the list.
Edit - (Not applicable to SKF default sensors.) Highlight a user configured sensor, then press Edit to display the Modify Setup screen, allowing you to alter the sensor’s configuration.
Back –Press to return to the Main Menu screen.
Help – Press the Help function button to quickly view on-line context sensitive help.
To add a sensor configuration:
• Press the Add function button. The Add Sensor screen displays.
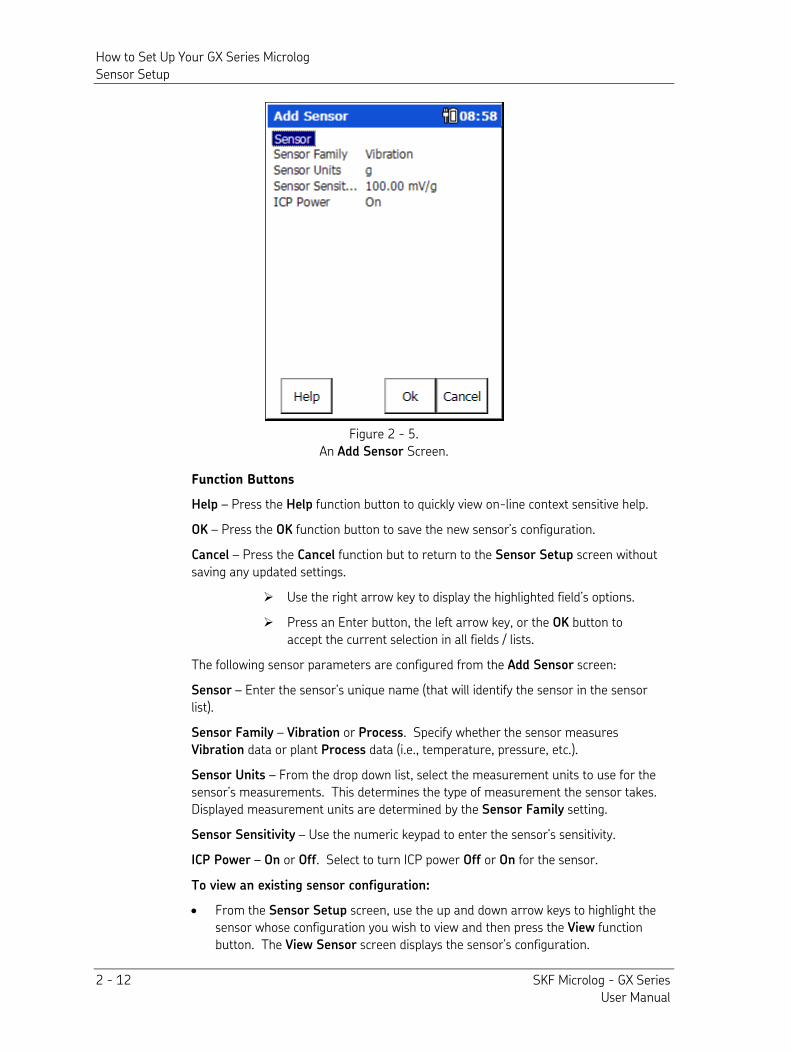
How to Set Up Your GX Series Microlog Sensor Setup
2 - 12 SKF Microlog - GX Series User Manual
Figure 2 - 5. An Add Sensor Screen.
Function Buttons
Help – Press the Help function button to quickly view on-line context sensitive help.
OK – Press the OK function button to save the new sensor’s configuration.
Cancel – Press the Cancel function but to return to the Sensor Setup screen without saving any updated settings.
Use the right arrow key to display the highlighted field’s options.
Press an Enter button, the left arrow key, or the OK button to accept the current selection in all fields / lists.
The following sensor parameters are configured from the Add Sensor screen:
Sensor – Enter the sensor’s unique name (that will identify the sensor in the sensor list).
Sensor Family – Vibration or Process. Specify whether the sensor measures Vibration data or plant Process data (i.e., temperature, pressure, etc.).
Sensor Units – From the drop down list, select the measurement units to use for the sensor’s measurements. This determines the type of measurement the sensor takes. Displayed measurement units are determined by the Sensor Family setting.
Sensor Sensitivity – Use the numeric keypad to enter the sensor’s sensitivity.
ICP Power – On or Off. Select to turn ICP power Off or On for the sensor.
To view an existing sensor configuration:
• From the Sensor Setup screen, use the up and down arrow keys to highlight the sensor whose configuration you wish to view and then press the View function button. The View Sensor screen displays the sensor’s configuration.
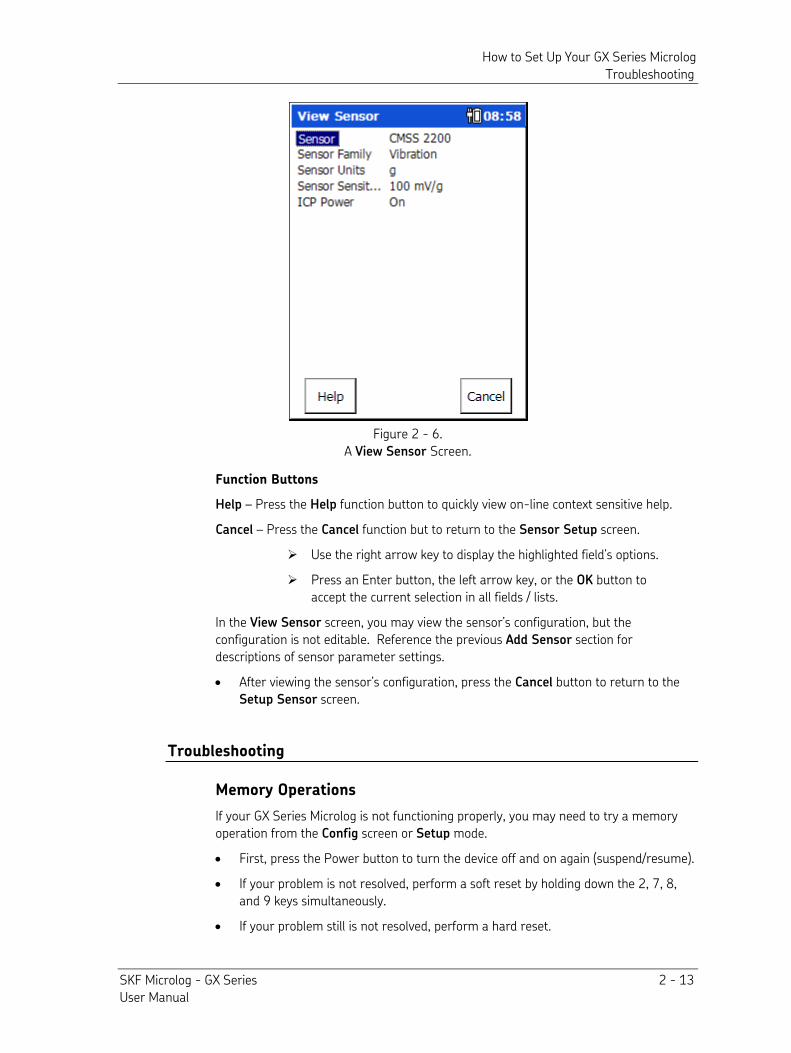
How to Set Up Your GX Series Microlog Troubleshooting
SKF Microlog - GX Series 2 - 13 User Manual
Figure 2 - 6. A View Sensor Screen.
Function Buttons
Help – Press the Help function button to quickly view on-line context sensitive help.
Cancel – Press the Cancel function but to return to the Sensor Setup screen.
Use the right arrow key to display the highlighted field’s options.
Press an Enter button, the left arrow key, or the OK button to accept the current selection in all fields / lists.
In the View Sensor screen, you may view the sensor’s configuration, but the configuration is not editable. Reference the previous Add Sensor section for descriptions of sensor parameter settings.
• After viewing the sensor’s configuration, press the Cancel button to return to the Setup Sensor screen.
Troubleshooting
Memory Operations
If your GX Series Microlog is not functioning properly, you may need to try a memory operation from the Config screen or Setup mode.
• First, press the Power button to turn the device off and on again (suspend/resume).
• If your problem is not resolved, perform a soft reset by holding down the 2, 7, 8, and 9 keys simultaneously.
• If your problem still is not resolved, perform a hard reset.
How to Set Up Your GX Series Microlog Troubleshooting
2 - 14 SKF Microlog - GX Series User Manual
Reference the How to Reset Your Microlog section in the Introduction chapter for more information on hard resets.
Ensure that the device is plugged into the battery charger / line power.
• If your problem is not resolved, upload your data (if available) and perform a Memory/Initialize operation to initialize your GX Series Microlog.
SKF Microlog - GX Series 3 - 1 User Manual
3
The ROUTE Module
Overview
Your @ptitude Analyst host software's ROUTE feature allows you to build measurement collection sequences (ROUTEs) to help you perform the most efficient data collection. When you originally constructed your @ptitude Analyst database by the hierarchy method, you more than likely organized the hierarchy by area, by machine type, or by some similar grouping. If you download POINTs to the GX Series Microlog collector in hierarchy order, a person collecting data will have to “skip around” in the ROUTE, or would have to retrace steps to get to the next data collection POINT in the ROUTE. Even if you design your database using a “most efficient ROUTE” method, during data collection you may want to make changes to a ROUTE list or have a POINT appear in more than one ROUTE.
When creating ROUTEs in the host software, it is recommended that the user write process data and dynamic data in separate ROUTEs, to reduce frequent ROUTE ICP setting changes.
What is a ROUTE?
A ROUTE is a list of measurement POINTs arranged in sequence for the most efficient data collection.
The advantage of ROUTE data collection is that measurements can be sequenced for the most efficient data collection regardless of their location in your measurement database hierarchy. This method also allows a measurement POINT or POINTs to appear in many different ROUTEs, and provides for a ROUTE Statistics Report.
Refer to your @ptitude Analyst software's User Manual for help with building and transferring @ptitude Analyst ROUTEs to the GX Series Microlog.
The CMXA 75-SL-Z2 Microlog has restrictions on the types of accessories that may be used with the instrument in ATEX Zone 2 areas, in some cases limiting the types of POINTs that may be collected.
Refer to Appendix D of this manual for important restrictions when using the CMXA 75-SL-Z2 Microlog in a Zone 2 restricted area.
The ROUTE Module How to Download and Upload ROUTEs and ROUTE Data with the GX Series Microlog
3 - 2 SKF Microlog - GX Series User Manual
How to Download and Upload ROUTEs and ROUTE Data with the GX
Series Microlog
Microlog Transfer Overview
The Microlog transfer function allows you to download measurement POINT setups to the Microlog, upload collected data from the Microlog, check the Microlog status, and configure, clear, or reset the Microlog.
The Microlog uses USB communications to communicate with @ptitude Analyst.
To set up the Microlog for data transfer using the USB communication type:
• Connect the supplied USB cable between the host computer’s USB port connector and the Microlog.
• On the host computer, enable ActiveSync or Windows Mobile Device Center for USB connection. Do not set up a partnership. When connection between the Microlog and ActiveSync is established, ActiveSync displays “Connected.”
Reference Microsoft ActiveSync / Windows Mobile Device Center help for more information.
ActiveSync communication with the GX requires specific drivers to be installed on the host PC. Refer to the Microsoft ActiveSync
Communications section in Chapter 1 – Introduction to the SKF GX
Series Microlog for details.
• In the software, select the Transfer menu’s Microlog Analyzer option to open the Microlog Analyzer dialog. On the Communication tab, select USB from the Communication type drop-down list. When the connection between @ptitude Analyst and the Microlog is established, the Microlog displays a generic communications indicator on its screen and the blue LED lights up.
Important: Do not disconnect the Microlog from the host computer while the generic communications indicator displayed on the Microlog. If you disconnect the Microlog before the process is complete, data may be lost, and you will need to do the transfer procedure again. In some extreme cases, early disconnection may cause the firmware to be corrupted.
• Proceed with data transfer operations using SKF @ptitude Analyst software Transfer menu options.
Download all desired ROUTEs to the Microlog at the same time to avoid multiple restarts to the Microlog.
• After you have finished your transfer procedure, close the Microlog Analyzer dialog.
• The Microlog automatically restarts and is ready for data collection. Once the generic communication indicator screen disappears, you may safely disconnect the Microlog from the host computer.
• From the Microlog main screen, use the left/right/up/down arrow buttons to highlight the ROUTE option.
The ROUTE Module Selecting Operators
SKF Microlog - GX Series 3 - 3 User Manual
• Press an Enter button. The ROUTE will momentarily update and you are placed in the Route Mgr. screen. The ROUTE list will display the downloaded ROUTEs.
If more than one operator is downloaded from the @ptitude Analyst host software, the Select Operator screen displays.
A Note about Host Software Fmax values
Fmax values entered are adjusted to the next highest valid Fmax value available in the Microlog. The adjusted (actual) value appears on the collected spectrum’s x-axis.
Selecting Operators
The Microlog enables you to associate an operator and the data that he or she collected on a specific date and instrument, if more than one Microlog is used.
After selecting the Route option from the main screen, the Select Operator screen displays.
• Use the up/down arrow buttons to highlight the desired operator and press the OK function button.
You are placed in the Route Mgr screen with a list of available ROUTEs displayed.
The Route Manager
The Route Mgr screen displays all ROUTEs that have been downloaded to the Microlog from @ptitude Analyst. Use the up/down arrows to select a ROUTE in the list. Press an Enter or right arrow button to open the highlighted ROUTE’s hierarchy. Function buttons on the Route Mgr screen include:
Config – Press the Config button to open the Instrument Configuration screen, which provides access to various global data collection settings. (See the Global
Measurement Settings section in Chapter 2 for details.)
Reset – Press the Reset button to delete all stored data records for the highlighted ROUTE, as well as all Non-ROUTE data. Delete – Press the Delete button to remove the highlighted ROUTE. Back – Press the Back button to close the Route Mgr and return to the Main Menu screen.
Help – Press the Help function button to quickly view on-line help for Microlog data collection.
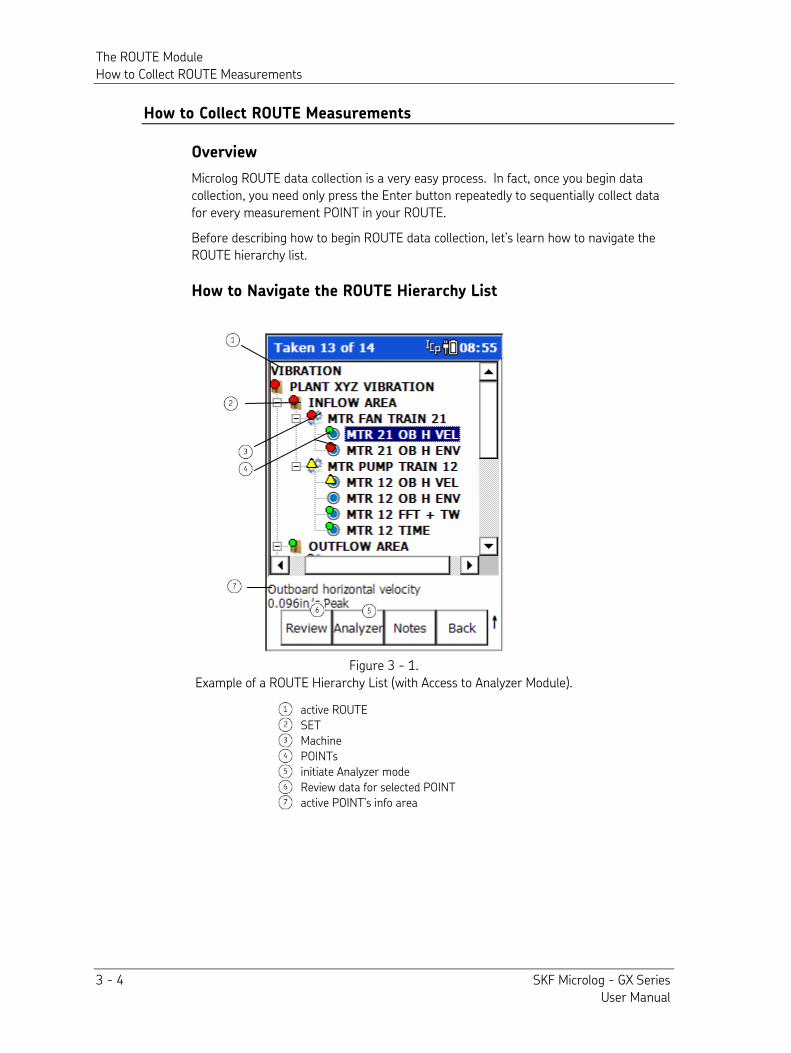
The ROUTE Module How to Collect ROUTE Measurements
3 - 4 SKF Microlog - GX Series User Manual
How to Collect ROUTE Measurements
Overview
Microlog ROUTE data collection is a very easy process. In fact, once you begin data collection, you need only press the Enter button repeatedly to sequentially collect data for every measurement POINT in your ROUTE. Before describing how to begin ROUTE data collection, let’s learn how to navigate the ROUTE hierarchy list. How to Navigate the ROUTE Hierarchy List
Figure 3 - 1. Example of a ROUTE Hierarchy List (with Access to Analyzer Module).
active ROUTE
SET
Machine
POINTs
initiate Analyzer mode
Review data for selected POINT
active POINT’s info area
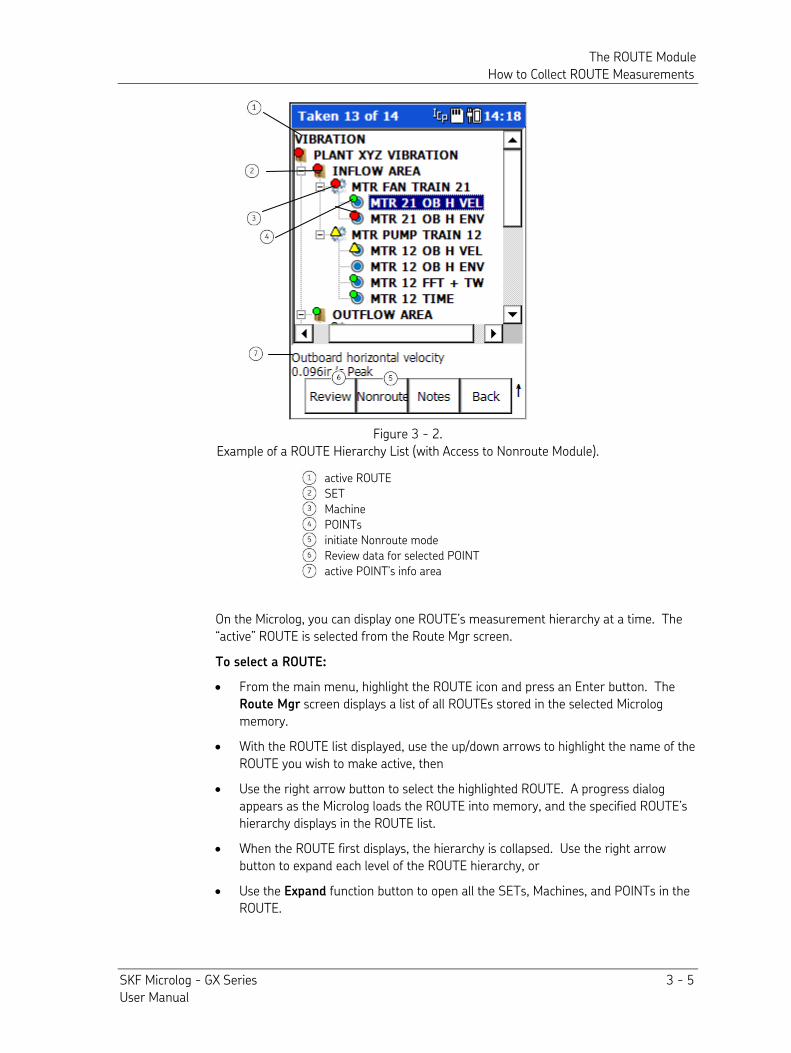
The ROUTE Module How to Collect ROUTE Measurements
SKF Microlog - GX Series 3 - 5 User Manual
Figure 3 - 2. Example of a ROUTE Hierarchy List (with Access to Nonroute Module).
active ROUTE
SET
Machine
POINTs
initiate Nonroute mode
Review data for selected POINT
active POINT’s info area
On the Microlog, you can display one ROUTE’s measurement hierarchy at a time. The “active” ROUTE is selected from the Route Mgr screen. To select a ROUTE:
• From the main menu, highlight the ROUTE icon and press an Enter button. The Route Mgr screen displays a list of all ROUTEs stored in the selected Microlog memory.
• With the ROUTE list displayed, use the up/down arrows to highlight the name of the ROUTE you wish to make active, then
• Use the right arrow button to select the highlighted ROUTE. A progress dialog appears as the Microlog loads the ROUTE into memory, and the specified ROUTE’s hierarchy displays in the ROUTE list.
• When the ROUTE first displays, the hierarchy is collapsed. Use the right arrow button to expand each level of the ROUTE hierarchy, or
• Use the Expand function button to open all the SETs, Machines, and POINTs in the ROUTE.
The ROUTE Module How to Collect ROUTE Measurements
3 - 6 SKF Microlog - GX Series User Manual
Branching from the active Route hierarchy item are SET, Machine, and Point hierarchy level items.
SET hierarchy level items are optional. Machine and Point hierarchy level items are mandatory for all @ptitude Analyst databases.
A “SET” can only hold other SETs and Machines. A “Machine” can only hold measurement POINTs.
• Use the same arrow button procedures described above to navigate these additional hierarchy items and their sub-items. In short:
Left/Right arrows - navigate up and down hierarchy levels.
Up/Down arrows - navigate sub-items in drop down lists branching from a hierarchy level.
When on the last or first POINT in a Machine, use the down or up arrow keys to progress to the next or previous machine, respectively.
Function buttons
Function and Enter button operations for the Route screen include:
Enter – Initiates data collection for the highlighted POINT. Expand / Collapse – Use depends on whether the highlighted hierarchy Machine / SET is open or closed. Expand / Collapse all sets, machines, and POINTs branching from the active Machine / SET hierarchy item.
Review – Available only when the hierarchy pointer is on a POINT with stored data. Opens the Review Data screen where you can review past measurement data for the selected POINT. Analyzer – Available when the Nonroute setting (on the Setup screen) is “Use Analyzer Module.” Accesses Analyzer module, where you can collect measurement data for POINTs not previously downloaded to the Microlog from your @ptitude Analyst host software. However, note that data stored in Analyzer mode, when accessed in this manner, can be uploaded to @ptitude Analyst as Non ROUTE data. Nonroute – Available when the Nonroute setting (on the Setup screen) is “Use Legacy Nonroute.” Accesses Nonroute mode, where you can collect measurement data for POINTs not previously downloaded to the Microlog from your @ptitude Analyst host software. However, note that data stored in Nonroute mode, when accessed in this manner, can be uploaded to @ptitude Analyst as Non ROUTE data. Notes – Opens the Notes screen where you may view or add coded or type-in notes for the current POINT. Back – Press the Back button to exit the selected ROUTE and return to the Route Mgr screen.
Shifted Function buttons include:
Help – Press the Help function button to quickly view on-line help for Microlog data collection.
The ROUTE Module How to Collect ROUTE Measurements
SKF Microlog - GX Series 3 - 7 User Manual
Skip M/C – When the hierarchy pointer is on a Machine, or a Machine’s first POINT, press the Skip M/C function button to skip that Machine’s POINTs and move to the next. When you press Skip M/C, before skipping to the next machine, the Microlog displays the Notes screen, allowing you to select a coded note to indicate the reason for skipping the machine (i.e., Machine Not Operating). A Note about the Auto Advance Setting
In the Configuration screen, the Auto Advance setting determines how resulting spectra display during ROUTE data collection. Options are:
On – Quickly and automatically advance through ROUTE data collection, displaying each spectral measurement result for a designated Dither Time.
Off – Manually advance through ROUTE data collection, displaying each spectral measurement result until the fire key is pressed to stop the measurement and Continue is pressed to move to the next POINT in the hierarchy.
Dither Time – Time, in seconds, for which spectral results are to be displayed before Auto Advance moves to the next POINT in the hierarchy. How to Begin Route Data Collection
To begin ROUTE data collection:
• From the main screen, select the ROUTE mode option. The Route Mgr screen displays a list of all ROUTEs stored on the Microlog.
• With the ROUTE list displayed, use the up/down arrows to highlight the name of the ROUTE you wish to make active, then use the Enter or right arrow button to select the highlighted ROUTE. A progress dialog appears as the Microlog loads the ROUTE into memory, and the specified ROUTE’s hierarchy displays in the ROUTE list.
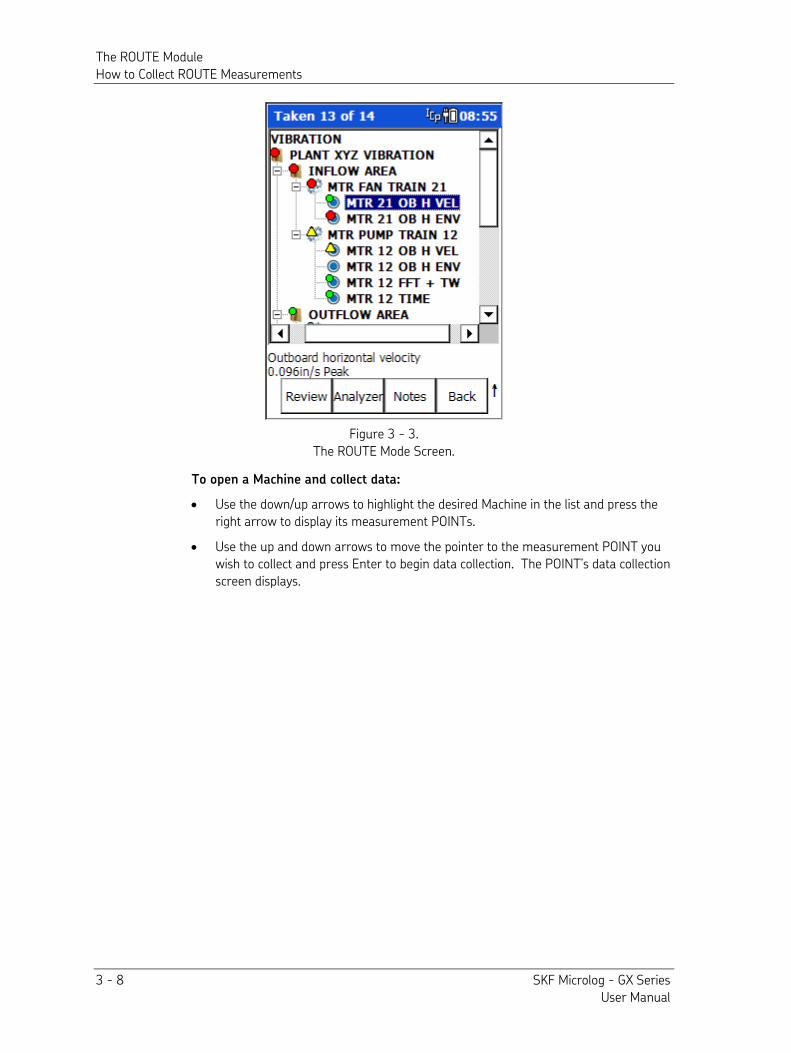
The ROUTE Module How to Collect ROUTE Measurements
3 - 8 SKF Microlog - GX Series User Manual
Figure 3 - 3. The ROUTE Mode Screen.
To open a Machine and collect data:
• Use the down/up arrows to highlight the desired Machine in the list and press the right arrow to display its measurement POINTs.
• Use the up and down arrows to move the pointer to the measurement POINT you wish to collect and press Enter to begin data collection. The POINT’s data collection screen displays.
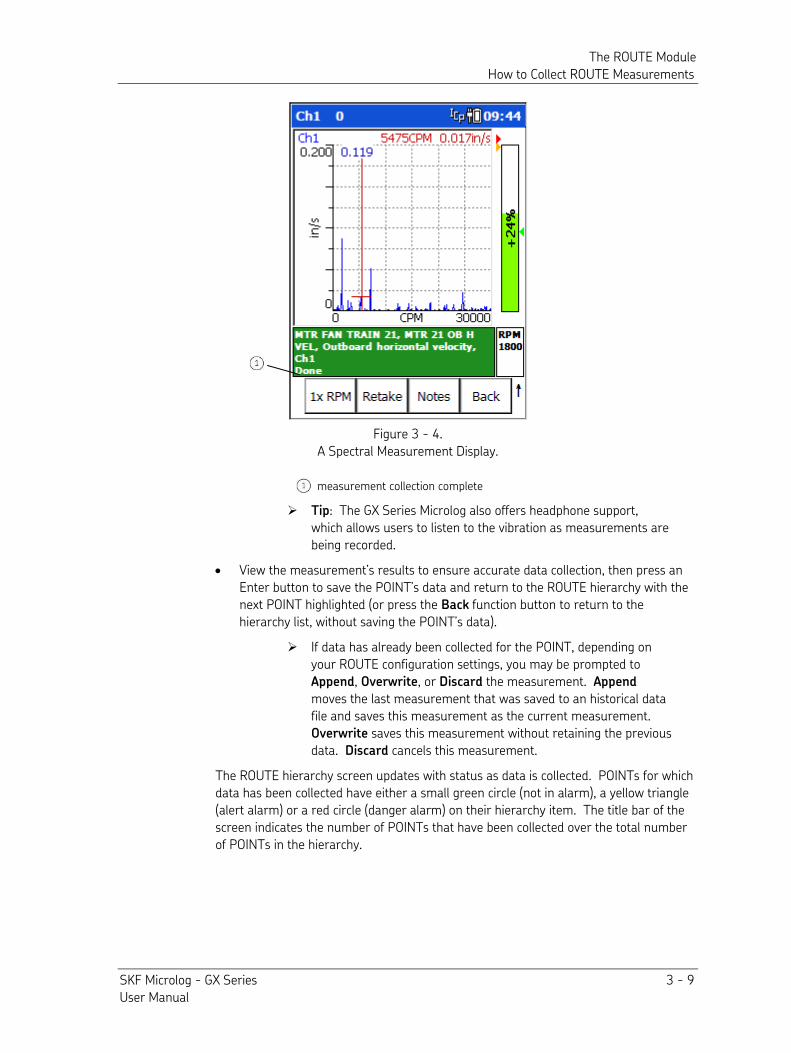
The ROUTE Module How to Collect ROUTE Measurements
SKF Microlog - GX Series 3 - 9 User Manual
Figure 3 - 4. A Spectral Measurement Display.
measurement collection complete
Tip: The GX Series Microlog also offers headphone support, which allows users to listen to the vibration as measurements are being recorded.
• View the measurement’s results to ensure accurate data collection, then press an Enter button to save the POINT’s data and return to the ROUTE hierarchy with the next POINT highlighted (or press the Back function button to return to the hierarchy list, without saving the POINT’s data).
If data has already been collected for the POINT, depending on your ROUTE configuration settings, you may be prompted to Append, Overwrite, or Discard the measurement. Append moves the last measurement that was saved to an historical data file and saves this measurement as the current measurement. Overwrite saves this measurement without retaining the previous data. Discard cancels this measurement.
The ROUTE hierarchy screen updates with status as data is collected. POINTs for which data has been collected have either a small green circle (not in alarm), a yellow triangle (alert alarm) or a red circle (danger alarm) on their hierarchy item. The title bar of the screen indicates the number of POINTs that have been collected over the total number of POINTs in the hierarchy.
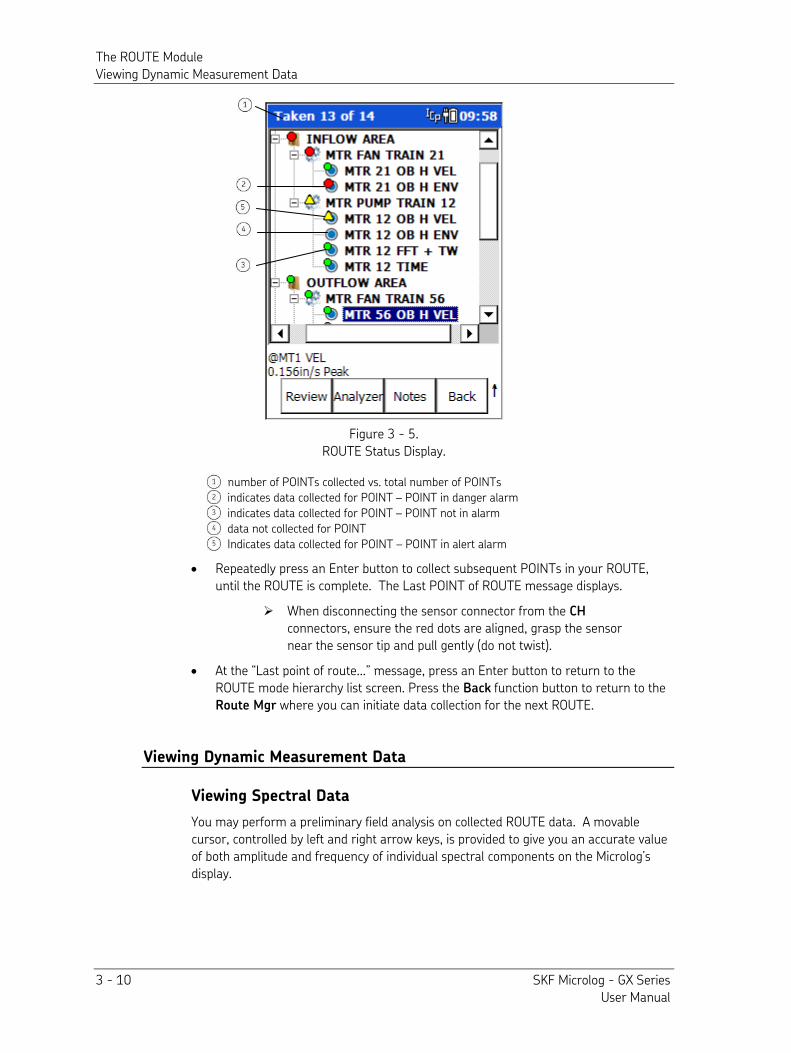
The ROUTE Module Viewing Dynamic Measurement Data
3 - 10 SKF Microlog - GX Series User Manual
Figure 3 - 5. ROUTE Status Display.
number of POINTs collected vs. total number of POINTs
indicates data collected for POINT – POINT in danger alarm
indicates data collected for POINT – POINT not in alarm
data not collected for POINT
Indicates data collected for POINT – POINT in alert alarm
• Repeatedly press an Enter button to collect subsequent POINTs in your ROUTE, until the ROUTE is complete. The Last POINT of ROUTE message displays.
When disconnecting the sensor connector from the CH connectors, ensure the red dots are aligned, grasp the sensor near the sensor tip and pull gently (do not twist).
• At the “Last point of route…” message, press an Enter button to return to the ROUTE mode hierarchy list screen. Press the Back function button to return to the Route Mgr where you can initiate data collection for the next ROUTE.
Viewing Dynamic Measurement Data
Viewing Spectral Data
You may perform a preliminary field analysis on collected ROUTE data. A movable cursor, controlled by left and right arrow keys, is provided to give you an accurate value of both amplitude and frequency of individual spectral components on the Microlog’s display.
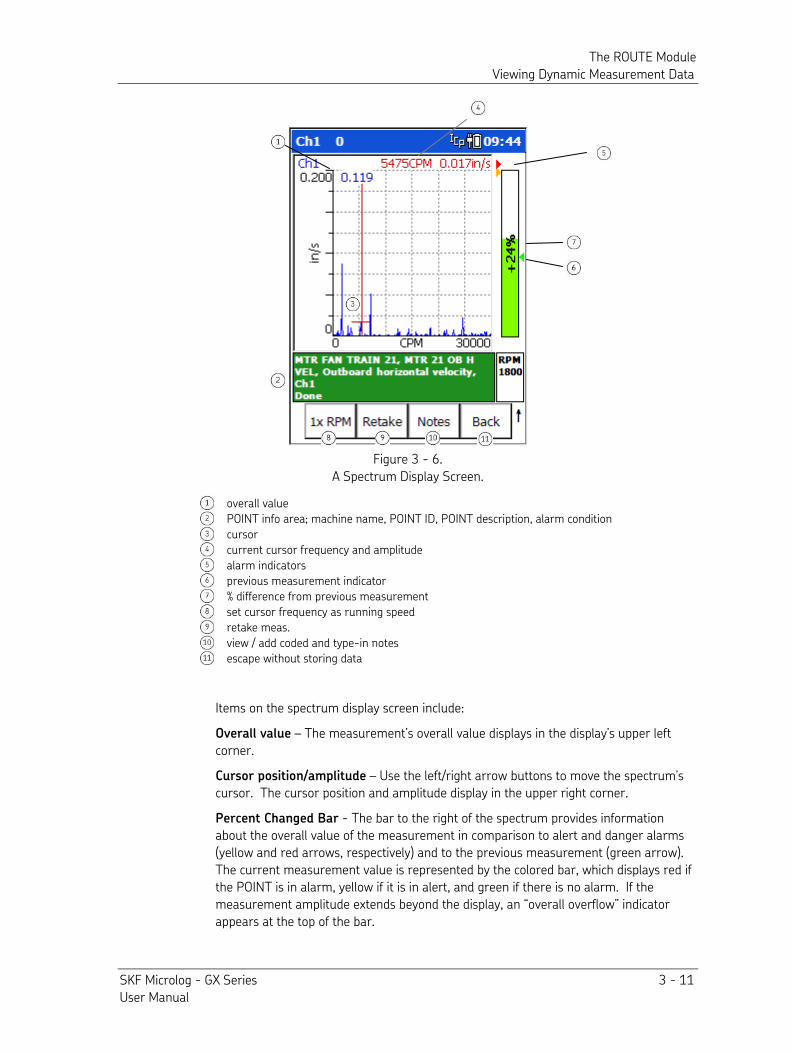
The ROUTE Module Viewing Dynamic Measurement Data
SKF Microlog - GX Series 3 - 11 User Manual
Figure 3 - 6. A Spectrum Display Screen.
overall value
POINT info area; machine name, POINT ID, POINT description, alarm condition
cursor
current cursor frequency and amplitude
alarm indicators
previous measurement indicator
% difference from previous measurement
set cursor frequency as running speed
retake meas.
view / add coded and type-in notes
escape without storing data
Items on the spectrum display screen include:
Overall value – The measurement’s overall value displays in the display’s upper left corner.
Cursor position/amplitude – Use the left/right arrow buttons to move the spectrum’s cursor. The cursor position and amplitude display in the upper right corner.
Percent Changed Bar - The bar to the right of the spectrum provides information about the overall value of the measurement in comparison to alert and danger alarms (yellow and red arrows, respectively) and to the previous measurement (green arrow). The current measurement value is represented by the colored bar, which displays red if the POINT is in alarm, yellow if it is in alert, and green if there is no alarm. If the measurement amplitude extends beyond the display, an “overall overflow” indicator appears at the top of the bar.
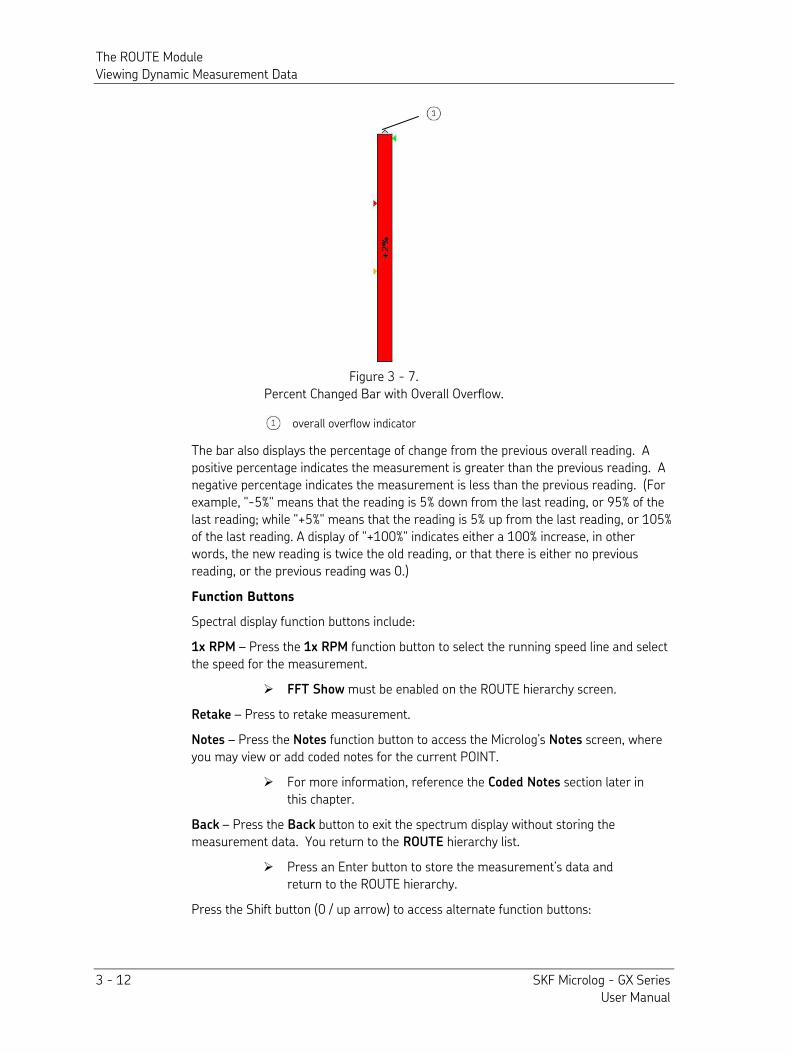
The ROUTE Module Viewing Dynamic Measurement Data
3 - 12 SKF Microlog - GX Series User Manual
Figure 3 - 7. Percent Changed Bar with Overall Overflow.
overall overflow indicator
The bar also displays the percentage of change from the previous overall reading. A positive percentage indicates the measurement is greater than the previous reading. A negative percentage indicates the measurement is less than the previous reading. (For example, "-5%" means that the reading is 5% down from the last reading, or 95% of the last reading; while "+5%" means that the reading is 5% up from the last reading, or 105% of the last reading. A display of "+100%" indicates either a 100% increase, in other words, the new reading is twice the old reading, or that there is either no previous reading, or the previous reading was 0.)
Function Buttons
Spectral display function buttons include:
1x RPM – Press the 1x RPM function button to select the running speed line and select the speed for the measurement.
FFT Show must be enabled on the ROUTE hierarchy screen. Retake – Press to retake measurement.
Notes – Press the Notes function button to access the Microlog’s Notes screen, where you may view or add coded notes for the current POINT.
For more information, reference the Coded Notes section later in this chapter.
Back – Press the Back button to exit the spectrum display without storing the measurement data. You return to the ROUTE hierarchy list.
Press an Enter button to store the measurement’s data and return to the ROUTE hierarchy.
Press the Shift button (0 / up arrow) to access alternate function buttons:
The ROUTE Module Viewing Dynamic Measurement Data
SKF Microlog - GX Series 3 - 13 User Manual
Help – Press the Help function button to quickly view on-line help for Microlog data collection.
Reference the How to View POINT Setup Information later in this chapter for more information.
View – Press to access the display’s View Options dialog where you are provided data viewing options specific to the type of measurement displayed. For spectral measurements, view options include;
Grid View – On / Off. Toggle the display grid On and Off.
Fill Spectrum – On / Off. Enable to fill the area beneath the spectrum contour to enhance viewing contrast.
Cursor Mode – Use harmonic markers to rapidly locate integral orders in relation to their fundamental (1X). The three harmonic cursor modes are: Simple, Harmonic, and Fixed. The default is Simple (off).
Simple – No harmonic cursors. Harmonic – Harmonics of the current cursor position are displayed. The spectral cursor acts as the fundamental marker, and is re-positioned using the left/right arrow buttons.
Fixed – Harmonics remain fixed, and cursor can be moved independently.
View – Provides additional view options relevant to the displayed data type. For a single spectrum display, options are;
FFT: Default View – Displays the POINT’s FFT spectrum and the percent change bar. Beneath the spectrum, an info area displays the machine name from which the POINT branches, and the POINT’s ID, Description and alarm status.
Point Info – No FFT spectrum displays, instead the POINT’s overall reading and percent change bar display. In addition, a Point Information area detailing POINT Id information, the last (previous) data collection date/time, and the last (previous) overall reading for the POINT displays to the right. POINT Id information and alarm status are again repeated beneath the overall display.
FFT: No Overall – Displays only the FFT spectrum and POINT Id information beneath the spectrum.
Apply – Press this function button to return to the previous screen.
View settings are lost when the Microlog is reset (i.e., after a soft or hard reboot, after communication with @ptitude Analyst, after the automatic daily power cycle).
Microlog Field Analysis Features
Spectral analysis tools are available for more in-depth field analysis. Spectral analysis tools include:
The ROUTE Module Viewing Time Waveform Data
3 - 14 SKF Microlog - GX Series User Manual
Y-Axis Graph Scaling Adjustment – Use the up/down arrow buttons to manually adjust the y-axis graph scaling on the spectrum. This allows you to re-scale the plot to get a closer look at low amplitude components.
Up arrow button – Decreases the Y-axis graph scale setting by ½ of its current setting.
Down arrow button – Doubles the Y-axis graph scale setting.
Harmonic Markers – “H” key – In a spectral display, press the “H” alphanumeric key to display harmonic markers for the current cursor position. Use harmonic markers to rapidly locate integral orders in relation to their fundamental (1X). The H key cycles the three harmonic cursor modes: Simple, Harmonic, and Fixed.
Simple – No harmonic cursors. Harmonic – Harmonics of the current cursor position are displayed. The spectral cursor acts as the fundamental marker, and is re-positioned using the left/right arrow buttons.
Fixed – Harmonics remain fixed, and cursor can be moved independently. The default is Simple (off).
Peak Cursor – “P” key – In a spectral display, press the “P” alphanumeric key to quickly jump the cursor to the next highest peak to the right of the cursor.
Display Expansion - +/- key – This function graphically expands or compresses the frequency domain display range horizontally around the cursor position to use the full dynamic range of the Microlog. It reveals characteristics that may be hidden by the display mode or by the resolution without changing data collection parameters.
• With a spectrum displayed, press the keypad’s +/- key. The spectrum’s fmax setting expands and the spectrum reforms to the new fmax. Repeat to continue to expand up to the maximum resolution (based on the number of lines of resolution for the spectrum), after which the function switches to compression.
Dot (.) key – Immediately toggles the +/- key between display expansion and compression.
Viewing Time Waveform Data
Time waveform plots display a short time sample of a raw vibration signal with vibration amplitude plotted over the time scale. Time waveform data displays on a plot similar to the spectrum display screen.
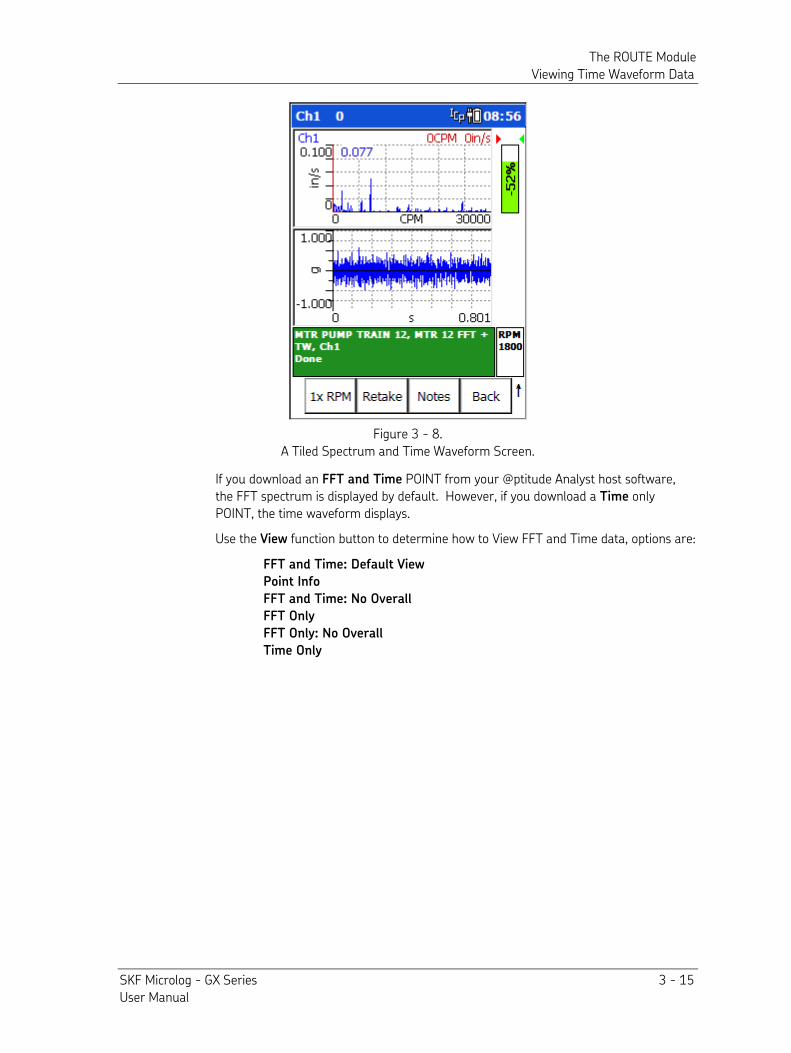
The ROUTE Module Viewing Time Waveform Data
SKF Microlog - GX Series 3 - 15 User Manual
Figure 3 - 8. A Tiled Spectrum and Time Waveform Screen.
If you download an FFT and Time POINT from your @ptitude Analyst host software, the FFT spectrum is displayed by default. However, if you download a Time only POINT, the time waveform displays.
Use the View function button to determine how to View FFT and Time data, options are:
FFT and Time: Default View
Point Info
FFT and Time: No Overall
FFT Only
FFT Only: No Overall
Time Only
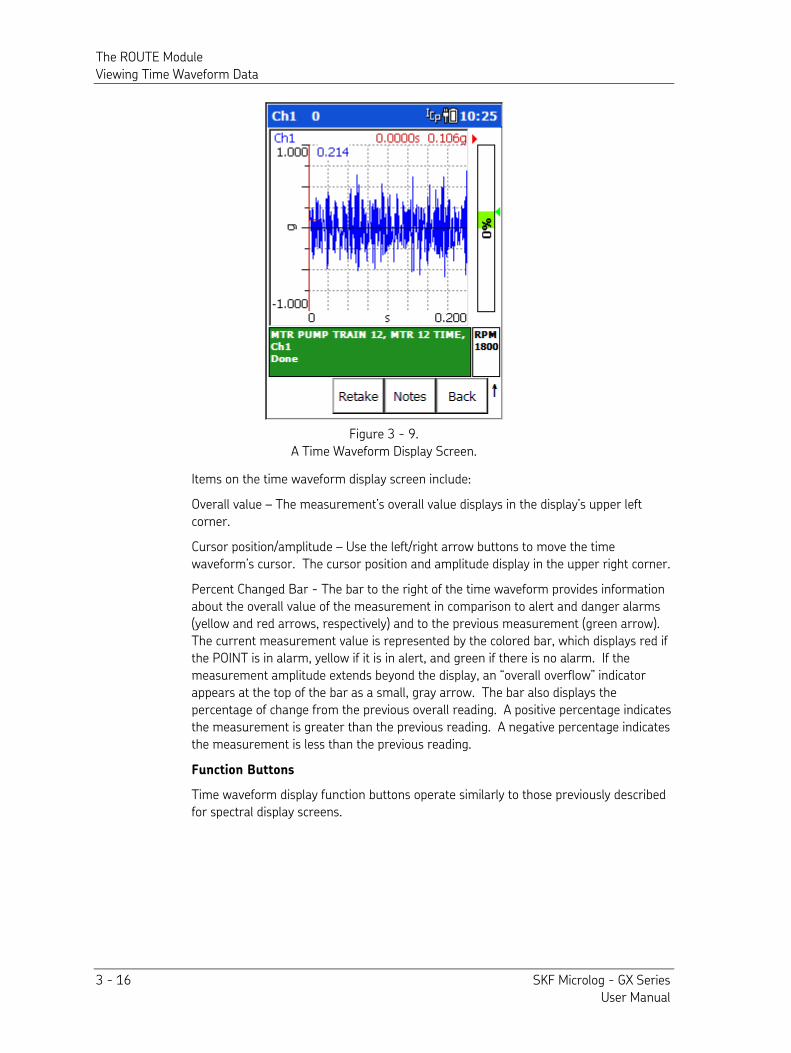
The ROUTE Module Viewing Time Waveform Data
3 - 16 SKF Microlog - GX Series User Manual
Figure 3 - 9. A Time Waveform Display Screen.
Items on the time waveform display screen include:
Overall value – The measurement’s overall value displays in the display’s upper left corner.
Cursor position/amplitude – Use the left/right arrow buttons to move the time waveform’s cursor. The cursor position and amplitude display in the upper right corner.
Percent Changed Bar - The bar to the right of the time waveform provides information about the overall value of the measurement in comparison to alert and danger alarms (yellow and red arrows, respectively) and to the previous measurement (green arrow). The current measurement value is represented by the colored bar, which displays red if the POINT is in alarm, yellow if it is in alert, and green if there is no alarm. If the measurement amplitude extends beyond the display, an “overall overflow” indicator appears at the top of the bar as a small, gray arrow. The bar also displays the percentage of change from the previous overall reading. A positive percentage indicates the measurement is greater than the previous reading. A negative percentage indicates the measurement is less than the previous reading.
Function Buttons
Time waveform display function buttons operate similarly to those previously described for spectral display screens.
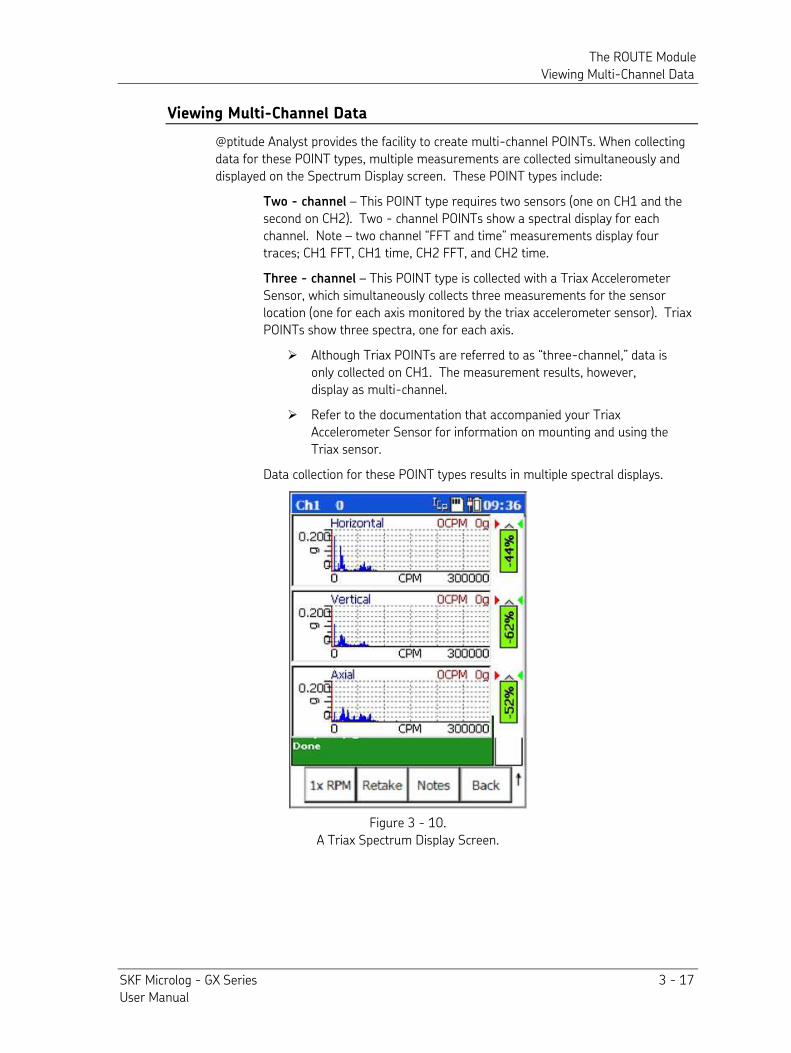
The ROUTE Module Viewing Multi-Channel Data
SKF Microlog - GX Series 3 - 17 User Manual
Viewing Multi-Channel Data
@ptitude Analyst provides the facility to create multi-channel POINTs. When collecting data for these POINT types, multiple measurements are collected simultaneously and displayed on the Spectrum Display screen. These POINT types include:
Two - channel – This POINT type requires two sensors (one on CH1 and the second on CH2). Two - channel POINTs show a spectral display for each channel. Note – two channel “FFT and time” measurements display four traces; CH1 FFT, CH1 time, CH2 FFT, and CH2 time.
Three - channel – This POINT type is collected with a Triax Accelerometer Sensor, which simultaneously collects three measurements for the sensor location (one for each axis monitored by the triax accelerometer sensor). Triax POINTs show three spectra, one for each axis.
Although Triax POINTs are referred to as “three-channel,” data is only collected on CH1. The measurement results, however, display as multi-channel.
Refer to the documentation that accompanied your Triax Accelerometer Sensor for information on mounting and using the Triax sensor.
Data collection for these POINT types results in multiple spectral displays.
Figure 3 - 10. A Triax Spectrum Display Screen.
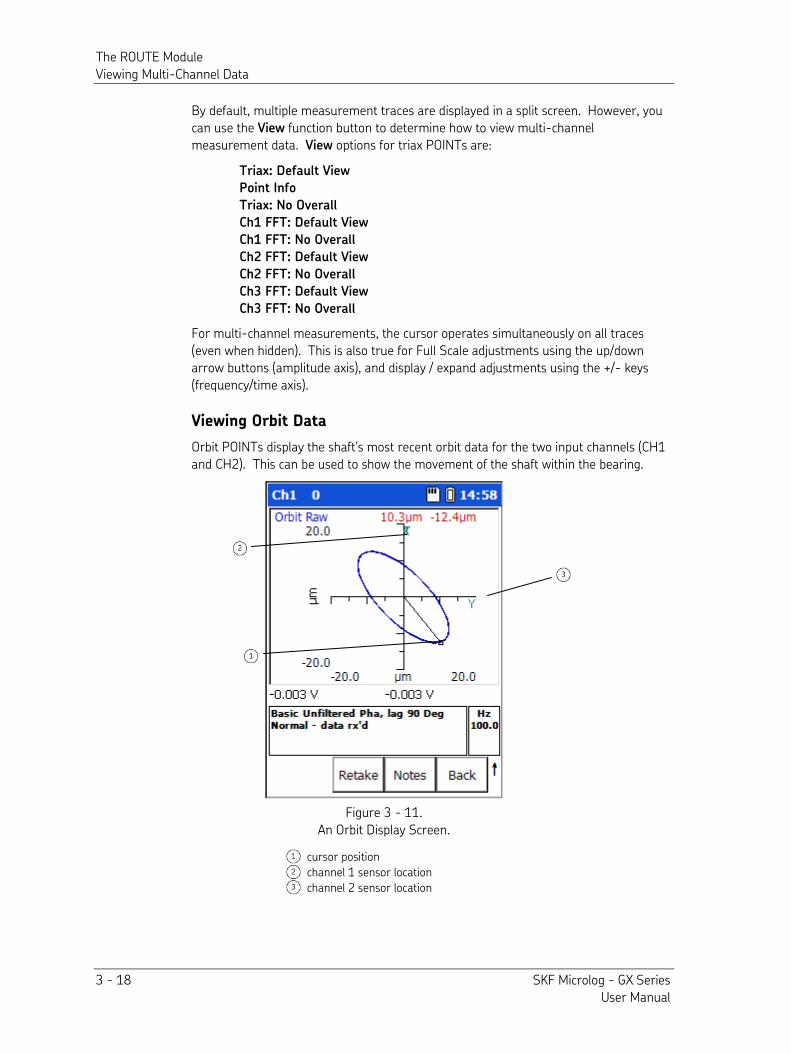
The ROUTE Module Viewing Multi-Channel Data
3 - 18 SKF Microlog - GX Series User Manual
By default, multiple measurement traces are displayed in a split screen. However, you can use the View function button to determine how to view multi-channel measurement data. View options for triax POINTs are:
Triax: Default View
Point Info
Triax: No Overall
Ch1 FFT: Default View
Ch1 FFT: No Overall
Ch2 FFT: Default View
Ch2 FFT: No Overall
Ch3 FFT: Default View
Ch3 FFT: No Overall
For multi-channel measurements, the cursor operates simultaneously on all traces (even when hidden). This is also true for Full Scale adjustments using the up/down arrow buttons (amplitude axis), and display / expand adjustments using the +/- keys (frequency/time axis).
Viewing Orbit Data
Orbit POINTs display the shaft’s most recent orbit data for the two input channels (CH1 and CH2). This can be used to show the movement of the shaft within the bearing.
Figure 3 - 11. An Orbit Display Screen.
cursor position
channel 1 sensor location
channel 2 sensor location
The ROUTE Module How to Collect Process Measurements
SKF Microlog - GX Series 3 - 19 User Manual
By default, orbit measurements display in the orbit trace. However, you can use the View function button to determine how to view orbit measurements. View options for orbit POINTs are:
Orbit: Default View
Point Info
Orbit View
Time X Time Y
1x
2x
3x
• Use the left/right arrows to move the cursor between individual data points on the orbit display.
How to Collect Process Measurements
Process measurements are static measurements, such as temperature, pressure, flow, pH, etc. Process measurement POINTs are configured in your @ptitude Analyst host software and downloaded in the same manner as dynamic measurement POINTs. Process Measurement Pickup Entry
Process measurements collected from a pickup (such as temperature) display on the process measurement data screen.
To access the process measurement data screen:
• Use the left, right, up, and down arrow buttons to select the desired process measurement POINT from the ROUTE list, and press an Enter button to begin data collection. The process measurement data screen displays.
The data value and the subsequent bar indicator update automatically as averaging occurs.
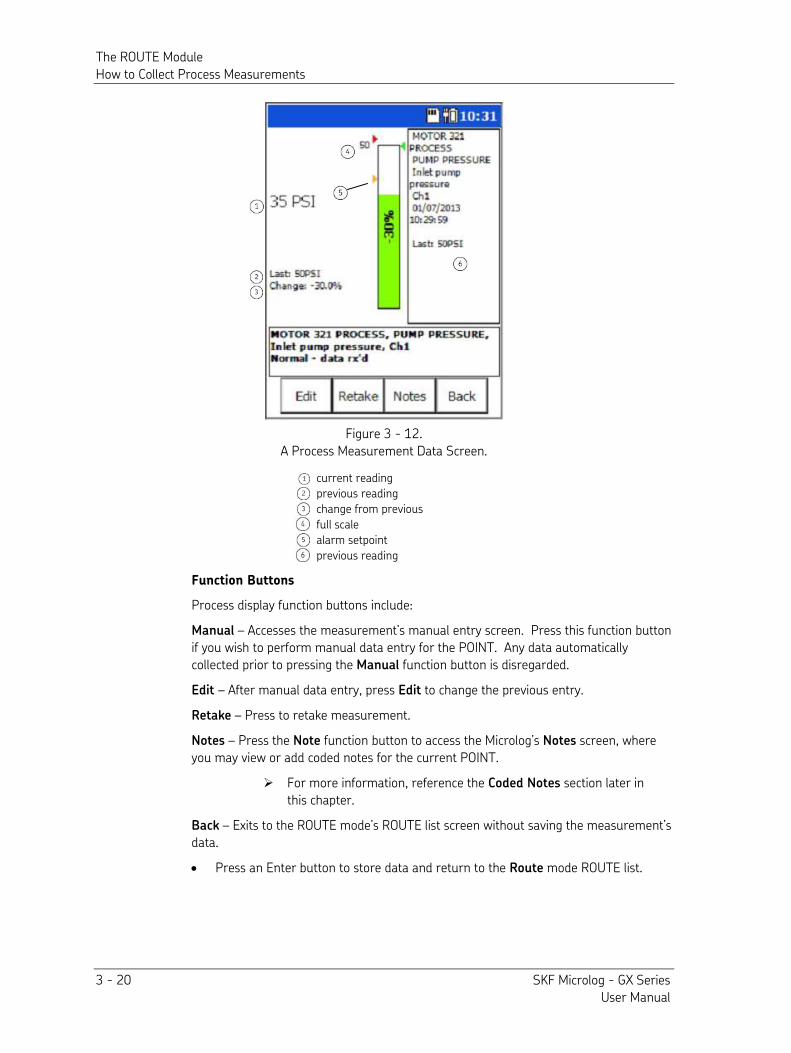
The ROUTE Module How to Collect Process Measurements
3 - 20 SKF Microlog - GX Series User Manual
Figure 3 - 12. A Process Measurement Data Screen.
current reading
previous reading
change from previous
full scale
alarm setpoint
previous reading
Function Buttons
Process display function buttons include:
Manual – Accesses the measurement’s manual entry screen. Press this function button if you wish to perform manual data entry for the POINT. Any data automatically collected prior to pressing the Manual function button is disregarded.
Edit – After manual data entry, press Edit to change the previous entry.
Retake – Press to retake measurement.
Notes – Press the Note function button to access the Microlog’s Notes screen, where you may view or add coded notes for the current POINT.
For more information, reference the Coded Notes section later in this chapter.
Back – Exits to the ROUTE mode’s ROUTE list screen without saving the measurement’s data.
• Press an Enter button to store data and return to the Route mode ROUTE list.
The ROUTE Module How to Collect Process Measurements
SKF Microlog - GX Series 3 - 21 User Manual
Manual Process Measurement Entry
Process measurements can also be entered manually. For example, you can manually type in numeric data for readings read from machinery or control panel gauges and indicators.
To manually enter process POINT data:
• Use the left, right, up, and down arrow buttons to select the desired process measurement POINT from the ROUTE list, and press an Enter button. The process measurement data screen displays.
• Press the Manual function button or start typing on the numeric keypad. The manual entry screen displays, and any data automatically collected prior to pressing the Manual function button is disregarded.
• Use the numeric keypad to enter the appropriate reading into the text entry field. If you make a mistake, use the Clear or Bksp (backspace) buttons to erase entered text.
• After correctly entering the measurement’s reading, press an Enter button. The entered value displays on the bar indicator. A new function button becomes available; Edit, and the measurement’s alarm setpoints display as arrows.
If the Configuration screen’s Auto Advance setting is set to On, pressing Enter stores the measurement. To enter notes, use the Notes function button on the ROUTE Hierarchy screen.
Function Buttons
Manual data entry display function buttons include:
Backspace – Deletes the entry to the left of the cursor in the text entry field, enabling you to quickly edit the entry.
Clear – Erases all text in the numeric text entry field.
Notes – Accesses the Notes screen, allowing you to store coded notes for the POINT. Back – Exits to the ROUTE mode’s ROUTE list screen without saving the measurement’s data.
• Press an Enter button again to store the measurement data and continue collecting data for your ROUTE.
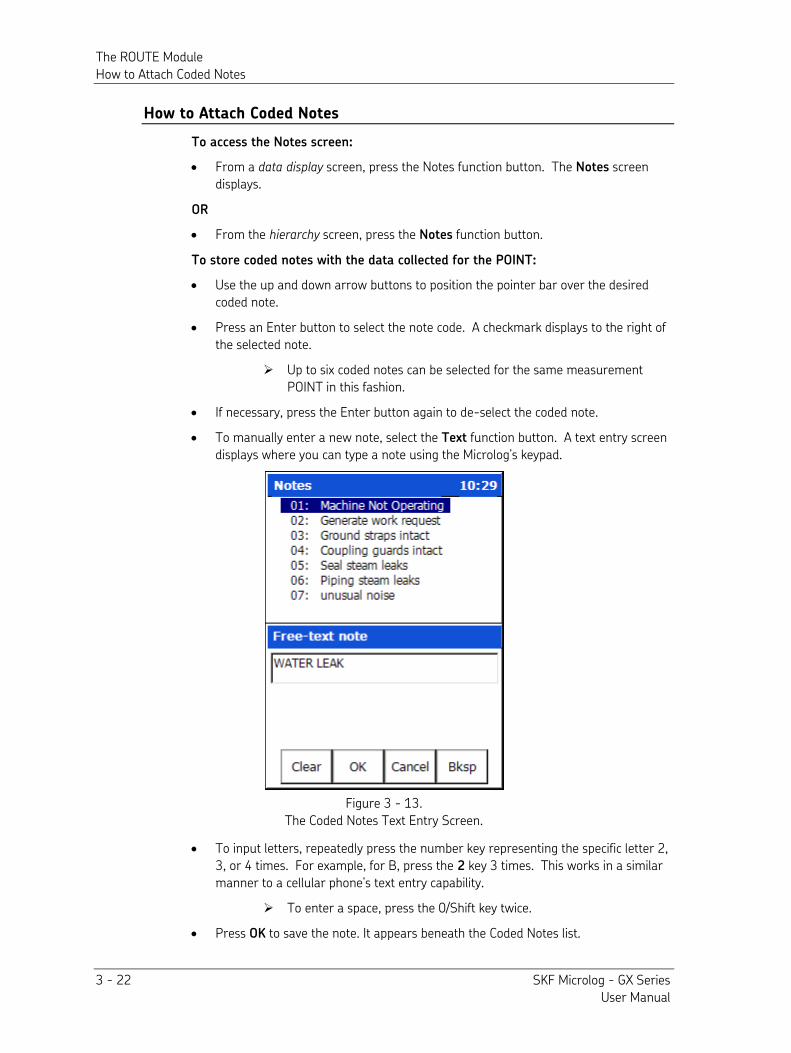
The ROUTE Module How to Attach Coded Notes
3 - 22 SKF Microlog - GX Series User Manual
How to Attach Coded Notes
To access the Notes screen:
• From a data display screen, press the Notes function button. The Notes screen displays.
OR
• From the hierarchy screen, press the Notes function button.
To store coded notes with the data collected for the POINT:
• Use the up and down arrow buttons to position the pointer bar over the desired coded note.
• Press an Enter button to select the note code. A checkmark displays to the right of the selected note.
Up to six coded notes can be selected for the same measurement POINT in this fashion.
• If necessary, press the Enter button again to de-select the coded note.
• To manually enter a new note, select the Text function button. A text entry screen displays where you can type a note using the Microlog’s keypad.
Figure 3 - 13. The Coded Notes Text Entry Screen.
• To input letters, repeatedly press the number key representing the specific letter 2, 3, or 4 times. For example, for B, press the 2 key 3 times. This works in a similar manner to a cellular phone’s text entry capability.
To enter a space, press the 0/Shift key twice.
• Press OK to save the note. It appears beneath the Coded Notes list.
The ROUTE Module Speed Tagging
SKF Microlog - GX Series 3 - 23 User Manual
• When all applicable notes have been selected, press the OK function button.
Press the Cancel function button to abort the process without saving any coded notes.
Notes can only be attached to the first POINT in an MPA group of POINTs. Reference the Multi Point Automation section later in this chapter for details on MPA POINTs.
Speed Tagging
Speed tagging allows for very accurate speed values for dynamic GX Series Microlog measurements, even in variable speed machinery.
Using @ptitude Analyst software, you can quickly select multiple POINTs (Microlog dynamic POINTs) from the hierarchy list (these POINTs are referred to as speed tagged POINTs) to associate with (link to) a specific Microlog dynamic or manual input speed reference POINT. The speed reference POINT can be a tachometer POINT, dynamic data POINT, or manually input speed value. Data collected for the speed tagged POINTs reflect the rotating speed of their associated speed reference POINT. Refer to Appendix D of this manual for important restrictions when using the CMXA 75-SL-Z2 Microlog in a Zone 2 restricted area.
IMPORTANT: The speed reference POINT (Speed POINT Id) must be collected (by the Microlog) prior to collecting its speed tagged dynamic data POINTs. Set up your @ptitude Analyst ROUTE or database hierarchy to facilitate data collection of speed POINTs prior to data collection of POINTs associated with speed POINTs.
The speed reference POINT cannot be included in an MPA group of POINTs, however, dynamic data POINTs linked to the speed reference POINT may be (see the Multi POINT Automation section later in this chapter).
Speed Ratio
The Microlog determines the actual running speed for a linked measurement by multiplying its associated speed reference POINT's speed value by the speed tagged measurement's Speed Ratio (specified in @ptitude Analyst).
IMPORTANT: The dynamic measurement's Speed Ratio setting must be greater than zero (0). A zero setting disables speed tagging. In this case, the measurement's speed value is established using the measurement's Speed field setting (manually input in the POINT Setup dialog).
The ROUTE Module Using a Temporarily Attached Pickup
3 - 24 SKF Microlog - GX Series User Manual
Error Message
If the linked speed reference POINT does not precede the speed tagged dynamic data POINT in the GX Series Microlog's ROUTE list, speed tagging is disabled. Speed tagging is also disabled if the speed reference POINT has been downloaded to the GX Series Microlog in the proper hierarchy position but no data has been taken on it. In both cases, the following message appears when attempting to collect data for the speed tagged dynamic data POINT. Microlog
Speed control point: >>Speed Tagging not taken.
Please take data.
Measurement aborted. Press OK to continue.
• Press the OK function button to return to the ROUTE list. Take data for the speed reference POINT before continuing, or reconfigure the ROUTE in the @ptitude Analyst host software and re-download.
Ensure that the speed reference POINT falls before any speed tagged POINTs in the ROUTE list, and that data has been taken for the speed referenced POINT prior to any speed tagged POINTs.
Speed reference POINT data (RPM) can be re-collected as often as the user chooses, however, speed tagged POINTs linked to the speed reference POINT are not updated with a new speed value unless they too are re-collected after the speed reference POINT is re-collected.
Using a Temporarily Attached Pickup
Refer to Appendix D of this manual for important restrictions when using the CMXA 75-SL-Z2 Microlog in a Zone 2 restricted area.
If a magnetic or permanently mounted sensor is not used, the pickup should be placed in contact with the machine before you initiate a measurement with an Enter button. If the vibration probe is placed in contact with the machine after the measurement is initiated, press the Retake function button and re-take data for the same POINT again. When using a hand-held probe, it is important that you hold the probe steady and with even pressure. The GX Series Microlog's high-speed acquisition requires only a few seconds to collect an averaged FFT spectrum.
If the Configuration screen’s Display Update setting is set to Multiple and the vibration probe loses contact or you are forced to discontinue collecting averages for other reasons, such as an ambient temperature too hot to continue holding the probe in place, the averaging process can be stopped at any time by pressing the enter button. Recognizing this possibility, the GX Series Microlog divides by the number of averages actually collected rather than by the number specified. Thus, as an FFT spectrum is being averaged, the values stored and displayed are accurate for the number of averages collected up to that point. If the averaging process has to be stopped after three or four averages, the reduction in accuracy is usually minimal.
The ROUTE Module Hints for Efficient Data Collection
SKF Microlog - GX Series 3 - 25 User Manual
If you have already saved data for the POINT, averaged data can be erased at any time and the averaging process restarted from zero by simply taking data for the same POINT again. When you save the new measurement, you will be prompted to either Append, Overwrite, or Discard the measurement (depending on the Hist. Data Collect setting in Configuration). Select Overwrite to replace the last measurement.
In most instances, magnetic coupling to the structure is used. Data collected with hand-held probes are affected by the angular orientation and pressure provided by the user.
The GX Series Microlog indicates auto-ranging prior to collecting data. The collection display does not indicate the current average number.
When disconnecting the sensor connector from the CH connectors, ensure the red dots are aligned, grasp the sensor
near the sensor tip and pull gently (do not twist).
Hints for Efficient Data Collection
Input Range
The GX Series Microlog reports input signals too large for the display with an Input
Overrange banner on the plot. If a signal overload is indicated, the full-scale amplitude increases to prevent amplitude errors, and data is collected.
Bias Check
Within the ROUTE hierarchy, press Shift+B to check the bias voltage for ICP measurements. This turns on the ICP supply (if it wasn't already) and measures the DC bias voltage for each channel used by this measurement (CH1 for single channel POINTs, typically CH1 and CH2 for two-channel POINTs, and CH1, CH2, and CH3 for Triax POINTs). A Bias check results screen displays.
This screen shows the voltage(s) for each channel, along with a red / green indication: green if the bias voltage is between 2 V and 18 V, which is regarded as normal, and red if it is outside this range.
This can be useful to troubleshoot a potential cable or accelerometer problem.
The ROUTE Module Spectral Banding
3 - 26 SKF Microlog - GX Series User Manual
Spectral Banding
Spectral Banding provides alert and danger alarms on both peak and overall spectral values within a defined frequency band.
The GX Series Microlog has the capability to process and display up to 12 spectral bands that have been pre defined and downloaded from an @ptitude Analyst host software database.
On the Microlog, defined spectral bands appear on the displayed spectrum as dashed lines.
To view spectral bands, set the Config menu’s Auto Advance option to Off (or to On with a sufficient Dither Time setting).
The overall for each band is calculated using the same detection method (RMS, Peak to Peak, or Peak) as specified for the POINT's overall.
Alarm indicators - If a POINT is in alarm, a banner message will display on the screen, indicating the type of alarm.
There is no distinction between alert and danger alarms on the Microlog.
An uppercase A indicates an overall alarm. A lowercase a indicates a peak alarm. Band alarms are displayed with a subscript number indicating the specific band number in alarm.
When alarm levels are exceeded, spectral band alarms are displayed and saved for reviewing in Review mode. The host software recalculates the spectral bands from the uploaded spectral data and the original spectral band setpoints.
Multi Point Automation (MPA)
The GX Series Microlog data collector allows the user to configure up to 12 measurements for automatic data collection at one measurement point. Using the same sensor, the user need press only one button to sequentially collect all pre-configured MPA measurements.
MPA POINT Rules
MPA POINTs in an MPA group of POINTs should all adhere to the following: • There must be more than two POINTs in an MPA group
• All POINTs must have less than 10 kHz Fmax
• All POINTs must have the same coupling
• No double integration allowed
• Only the first envelope band is collected
• The same sensor must be used for all points
• Single display updates
The ROUTE Module Multi Point Automation (MPA)
SKF Microlog - GX Series 3 - 27 User Manual
MPA ROUTE Setup
To set up an MPA ROUTE:
• In your @ptitude Analyst host software, access the Point Setup screen. The Point
Setup screen's Description field is used to identify MPA POINTs. The first 4 characters in the Description field identify the MPA group to which the POINT being configured belongs. For MPA POINTs, the first character in the Description field is always "@.” The @ character must be followed by three alpha/numeric characters that identify the group of MPA POINTs.
The first four characters of the Description must be identical for each POINT in the MPA group.
For example;
@MT1 VELOCITY @MT1 ACCEL @MT1 ACC ENV
are legal Descriptions for three MPA POINTs collected at the same location on a motor. For three additional POINTs collected at a second location on the motor,
@MT2 VELOCITY @MT2 ACCEL @MT2 ACC ENV
might be appropriate Descriptions.
If more than 12 POINTs are defined, the Microlog collects data for the first 12 MPA POINTs and the remaining MPA POINTS are ignored.
MPA Group Data Collection
To begin MPA Group Data Collection:
• Using the arrow buttons, select the desired MPA machine from the ROUTE list’s Machine level.
• Highlight an MPA POINT, and press an Enter button. Data collection begins at the first MPA POINT, regardless of the
POINT that is selected. After the Microlog collects data for the first MPA POINT in the MPA group, it displays the POINT’s spectral results. This allows you to verify good cable connections and a good sensor signal, and verifies integrity for the remaining MPA POINTs in the MPA group (whose spectra are not displayed for increased data collection speed purposes).
Select whether to display the MPA spectrum for first, last, all, or no POINTs on the global measurement Config screen.
• When the first POINT’s spectrum displays, press an Enter button to continue taking data for all the remaining MPA POINTs, indicated by the Collecting Data screen.
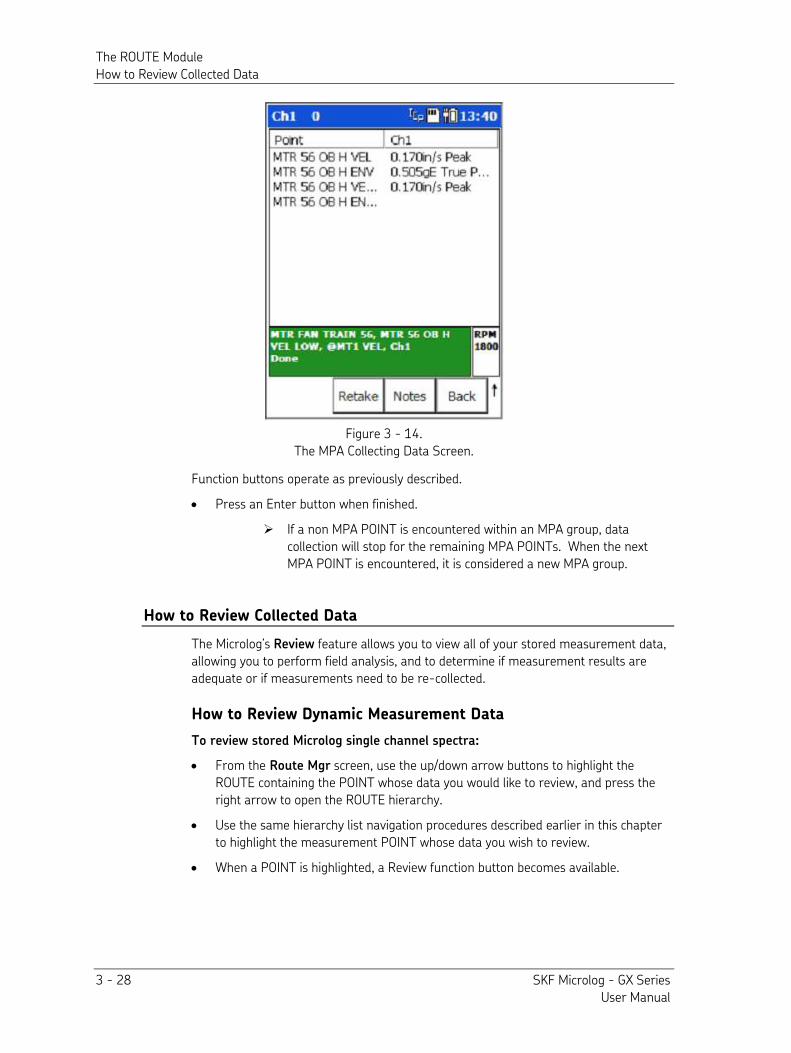
The ROUTE Module How to Review Collected Data
3 - 28 SKF Microlog - GX Series User Manual
Figure 3 - 14. The MPA Collecting Data Screen.
Function buttons operate as previously described.
• Press an Enter button when finished.
If a non MPA POINT is encountered within an MPA group, data collection will stop for the remaining MPA POINTs. When the next MPA POINT is encountered, it is considered a new MPA group.
How to Review Collected Data
The Microlog’s Review feature allows you to view all of your stored measurement data, allowing you to perform field analysis, and to determine if measurement results are adequate or if measurements need to be re-collected.
How to Review Dynamic Measurement Data
To review stored Microlog single channel spectra:
• From the Route Mgr screen, use the up/down arrow buttons to highlight the ROUTE containing the POINT whose data you would like to review, and press the right arrow to open the ROUTE hierarchy.
• Use the same hierarchy list navigation procedures described earlier in this chapter to highlight the measurement POINT whose data you wish to review.
• When a POINT is highlighted, a Review function button becomes available.
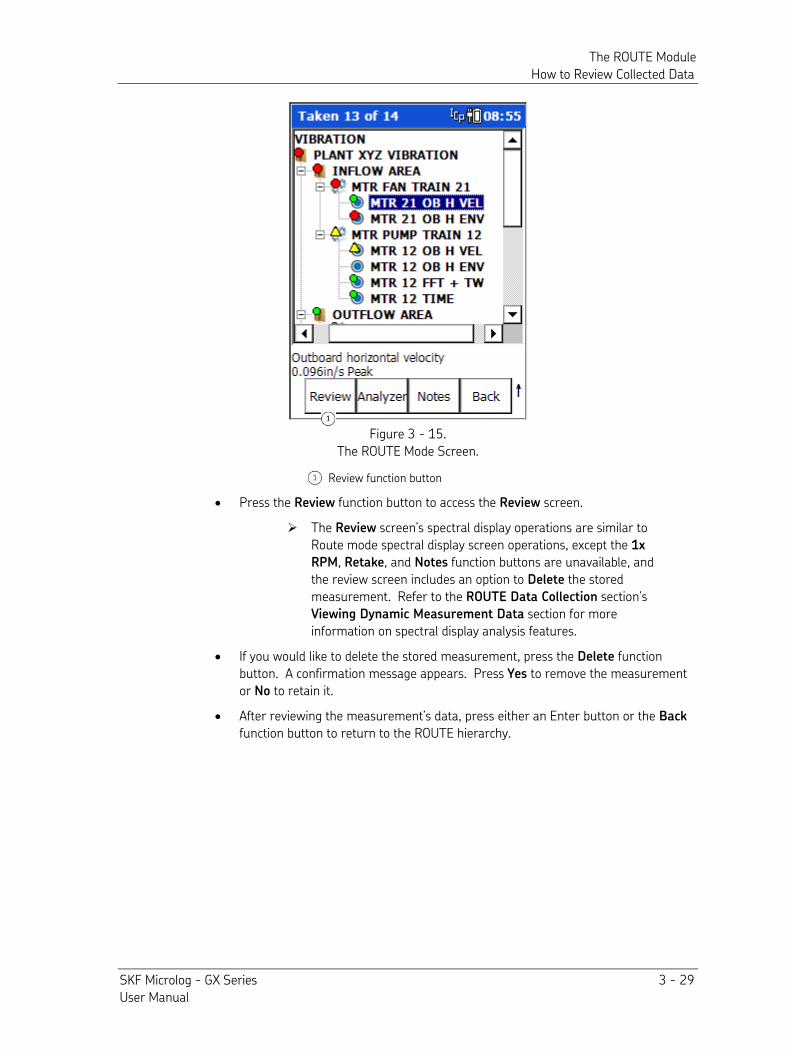
The ROUTE Module How to Review Collected Data
SKF Microlog - GX Series 3 - 29 User Manual
Figure 3 - 15. The ROUTE Mode Screen.
Review function button
• Press the Review function button to access the Review screen.
The Review screen’s spectral display operations are similar to Route mode spectral display screen operations, except the 1x
RPM, Retake, and Notes function buttons are unavailable, and the review screen includes an option to Delete the stored measurement. Refer to the ROUTE Data Collection section’s Viewing Dynamic Measurement Data section for more information on spectral display analysis features.
• If you would like to delete the stored measurement, press the Delete function button. A confirmation message appears. Press Yes to remove the measurement or No to retain it.
• After reviewing the measurement’s data, press either an Enter button or the Back function button to return to the ROUTE hierarchy.
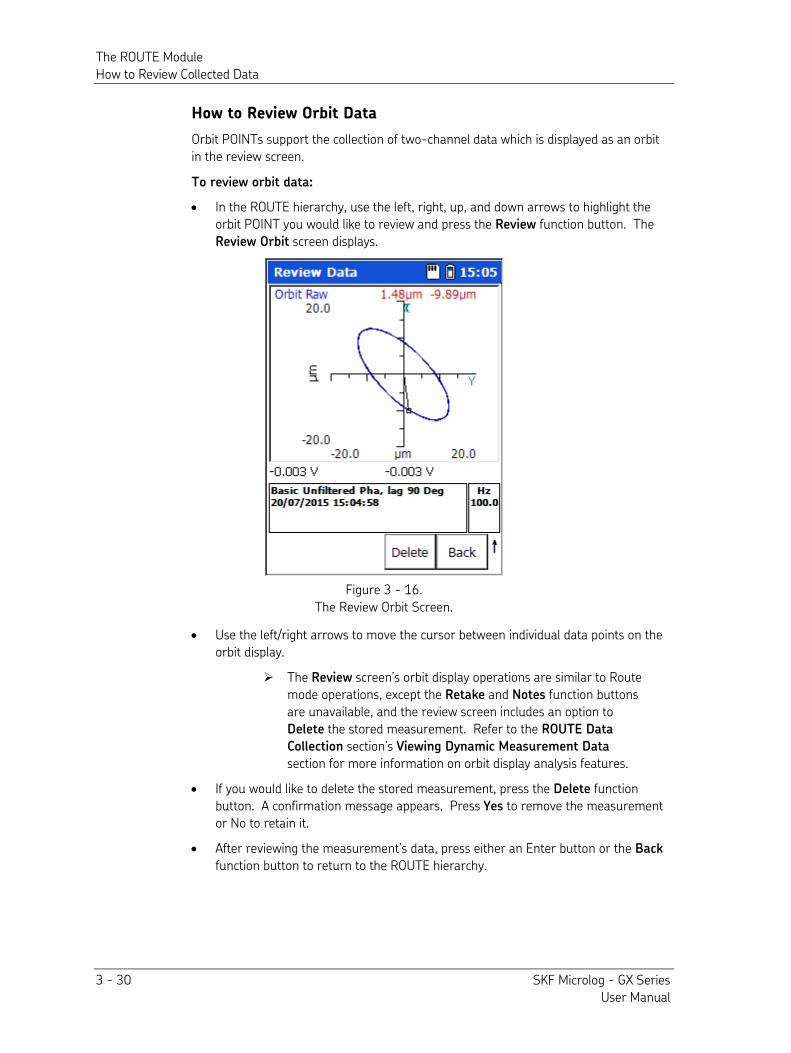
The ROUTE Module How to Review Collected Data
3 - 30 SKF Microlog - GX Series User Manual
How to Review Orbit Data
Orbit POINTs support the collection of two-channel data which is displayed as an orbit in the review screen.
To review orbit data:
• In the ROUTE hierarchy, use the left, right, up, and down arrows to highlight the orbit POINT you would like to review and press the Review function button. The Review Orbit screen displays.
Figure 3 - 16. The Review Orbit Screen.
• Use the left/right arrows to move the cursor between individual data points on the orbit display.
The Review screen’s orbit display operations are similar to Route mode operations, except the Retake and Notes function buttons are unavailable, and the review screen includes an option to Delete the stored measurement. Refer to the ROUTE Data
Collection section’s Viewing Dynamic Measurement Data
section for more information on orbit display analysis features.
• If you would like to delete the stored measurement, press the Delete function button. A confirmation message appears. Press Yes to remove the measurement or No to retain it.
• After reviewing the measurement’s data, press either an Enter button or the Back function button to return to the ROUTE hierarchy.
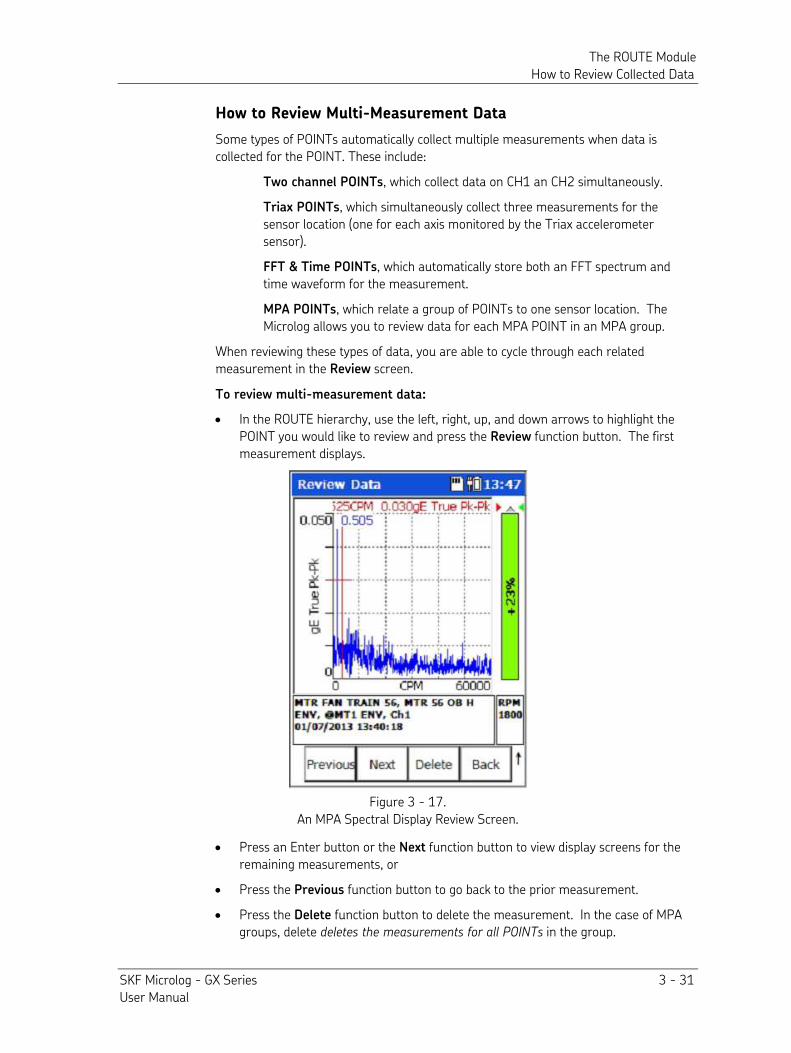
The ROUTE Module How to Review Collected Data
SKF Microlog - GX Series 3 - 31 User Manual
How to Review Multi-Measurement Data
Some types of POINTs automatically collect multiple measurements when data is collected for the POINT. These include:
Two channel POINTs, which collect data on CH1 an CH2 simultaneously. Triax POINTs, which simultaneously collect three measurements for the sensor location (one for each axis monitored by the Triax accelerometer sensor).
FFT & Time POINTs, which automatically store both an FFT spectrum and time waveform for the measurement.
MPA POINTs, which relate a group of POINTs to one sensor location. The Microlog allows you to review data for each MPA POINT in an MPA group.
When reviewing these types of data, you are able to cycle through each related measurement in the Review screen.
To review multi-measurement data:
• In the ROUTE hierarchy, use the left, right, up, and down arrows to highlight the POINT you would like to review and press the Review function button. The first measurement displays.
Figure 3 - 17. An MPA Spectral Display Review Screen.
• Press an Enter button or the Next function button to view display screens for the remaining measurements, or
• Press the Previous function button to go back to the prior measurement.
• Press the Delete function button to delete the measurement. In the case of MPA groups, delete deletes the measurements for all POINTs in the group.
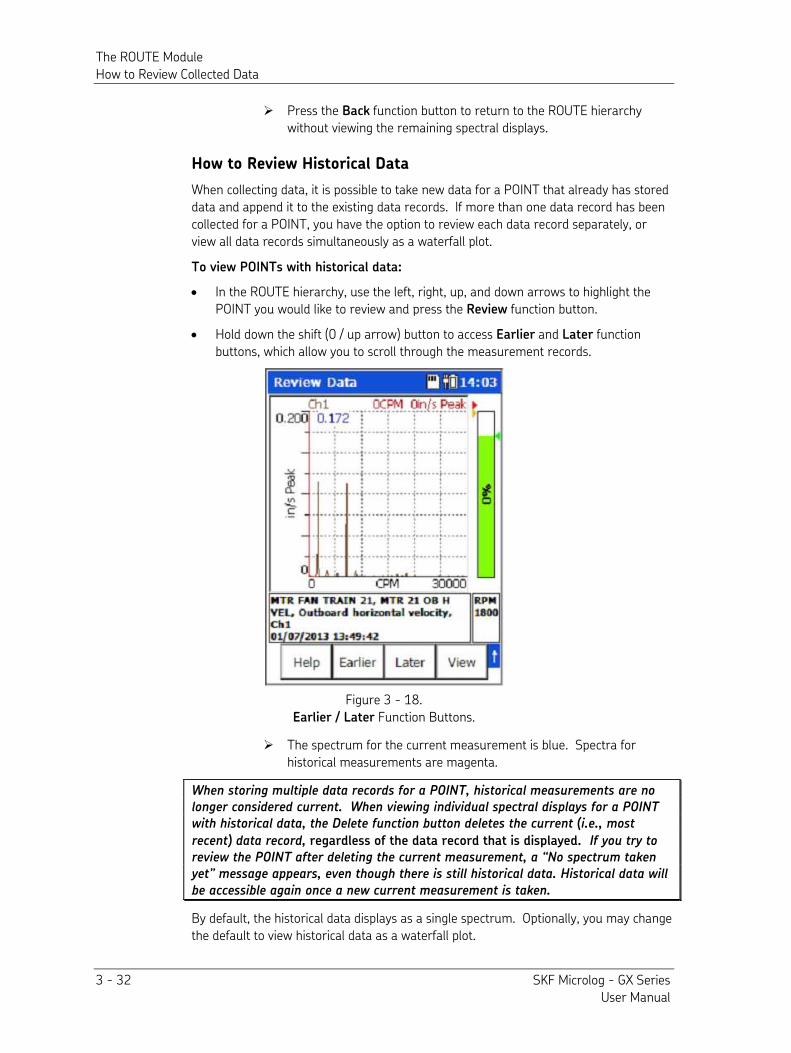
The ROUTE Module How to Review Collected Data
3 - 32 SKF Microlog - GX Series User Manual
Press the Back function button to return to the ROUTE hierarchy without viewing the remaining spectral displays.
How to Review Historical Data
When collecting data, it is possible to take new data for a POINT that already has stored data and append it to the existing data records. If more than one data record has been collected for a POINT, you have the option to review each data record separately, or view all data records simultaneously as a waterfall plot.
To view POINTs with historical data:
• In the ROUTE hierarchy, use the left, right, up, and down arrows to highlight the POINT you would like to review and press the Review function button.
• Hold down the shift (0 / up arrow) button to access Earlier and Later function buttons, which allow you to scroll through the measurement records.
Figure 3 - 18. Earlier / Later Function Buttons.
The spectrum for the current measurement is blue. Spectra for historical measurements are magenta.
When storing multiple data records for a POINT, historical measurements are no longer considered current. When viewing individual spectral displays for a POINT with historical data, the Delete function button deletes the current (i.e., most
recent) data record, regardless of the data record that is displayed. If you try to review the POINT after deleting the current measurement, a “No spectrum taken yet” message appears, even though there is still historical data. Historical data will be accessible again once a new current measurement is taken.
By default, the historical data displays as a single spectrum. Optionally, you may change the default to view historical data as a waterfall plot.
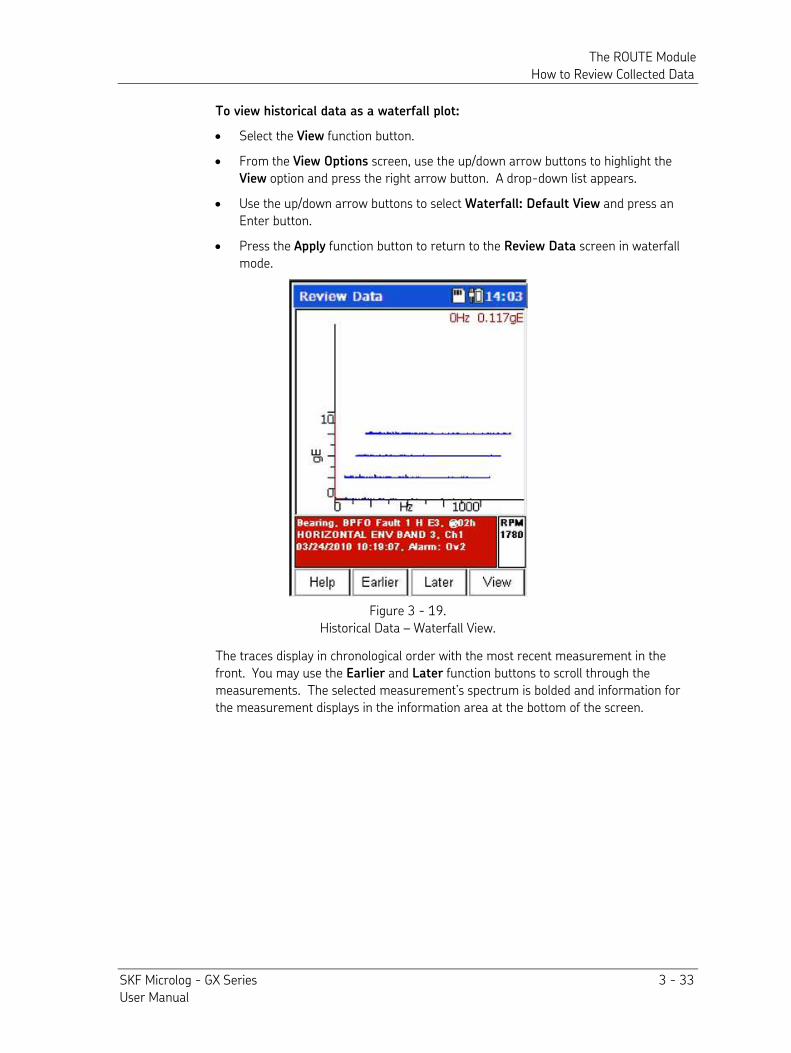
The ROUTE Module How to Review Collected Data
SKF Microlog - GX Series 3 - 33 User Manual
To view historical data as a waterfall plot:
• Select the View function button.
• From the View Options screen, use the up/down arrow buttons to highlight the View option and press the right arrow button. A drop-down list appears.
• Use the up/down arrow buttons to select Waterfall: Default View and press an Enter button.
• Press the Apply function button to return to the Review Data screen in waterfall mode.
Figure 3 - 19. Historical Data – Waterfall View.
The traces display in chronological order with the most recent measurement in the front. You may use the Earlier and Later function buttons to scroll through the measurements. The selected measurement’s spectrum is bolded and information for the measurement displays in the information area at the bottom of the screen.
The ROUTE Module How to Review Collected Data
3 - 34 SKF Microlog - GX Series User Manual
How to Review Process (Static) Measurement Data
The Microlog enables you to display a Review Process screen for stored process measurement data.
To review a process measurement POINT’s data:
• In the ROUTE hierarchy, use the right, left, up, and down arrows to highlight the desired process POINT and press the Review function button. The Review Process screen displays.
Review Process display screen functions are similar to process measurement data collection screens, except the Manual and Notes function buttons are unavailable, and the review screen includes an option to Delete the stored measurement. Refer to chapter’s How to Collect Process Measurements section for more information.
• If you would like to delete the stored process measurement, press the Delete function button. A confirmation message appears. Press Yes to remove the measurement or No to retain it.
• After reviewing your stored measurement data, press the Review screen’s Back function button to return to the ROUTE hierarchy screen.
SKF Microlog - GX Series 4 - 1 User Manual
4
The Analyzer Module
Overview
The Microlog’s Analyzer module allows you to collect measurement data for POINTs not previously downloaded to the Microlog from your @ptitude Analyst host software. Since these measurements are not downloaded to the Microlog as part of your data collection ROUTEs, they are often referred to as “Analyzer” measurements.
In Analyzer mode, you can quickly apply one of the pre-defined “standard” type vibration measurements, or you can set up a new “user defined” measurement and immediately collect the new measurement’s data for in-the-field analysis purposes. After data collection, the Analyzer measurement’s data may be stored in the Microlog for future review, and can be transferred to the host computer and viewed with SKF’s Analysis and Reporting Manager (ARM) software.
Your customized Analyzer measurement setups can also be stored in the Microlog and quickly recalled for future use.
The Analyzer module is intended for steady state machinery analysis. Use the Microlog’s Data Recorder module for analysis of machinery that is changing in speed.
The CMXA 75-SL-Z2 Microlog has restrictions on the types of accessories that may be used with the instrument in ATEX Zone 2 areas, in some cases limiting the types of POINTs that may be collected.
Refer to Appendix D of this manual for important restrictions when using the CMXA 75-SL-Z2 Microlog in a Zone 2 restricted area.
All Analyzer measurements are initiated from the Microlog’s Analyzer screen.
• From the main menu screen, use arrow keys to highlight the Analyzer icon, and press an Enter button. The Analyzer screen displays.
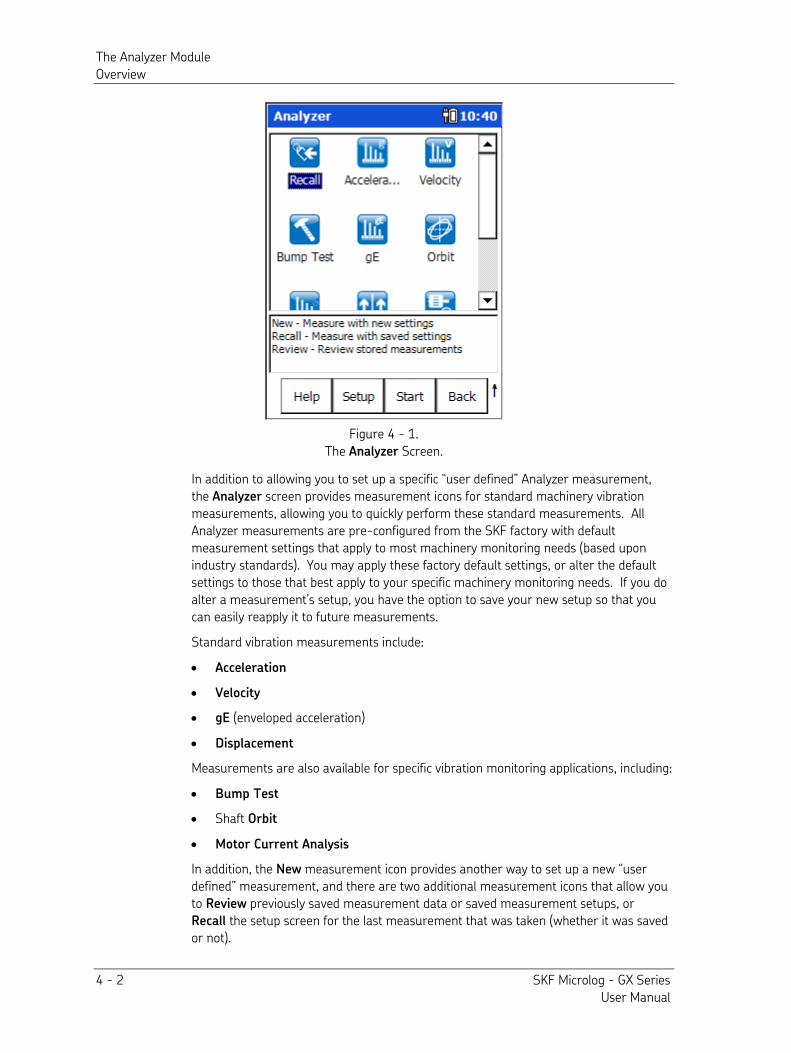
The Analyzer Module Overview
4 - 2 SKF Microlog - GX Series User Manual
Figure 4 - 1. The Analyzer Screen.
In addition to allowing you to set up a specific “user defined” Analyzer measurement, the Analyzer screen provides measurement icons for standard machinery vibration measurements, allowing you to quickly perform these standard measurements. All Analyzer measurements are pre-configured from the SKF factory with default measurement settings that apply to most machinery monitoring needs (based upon industry standards). You may apply these factory default settings, or alter the default settings to those that best apply to your specific machinery monitoring needs. If you do alter a measurement’s setup, you have the option to save your new setup so that you can easily reapply it to future measurements.
Standard vibration measurements include:
• Acceleration
• Velocity
• gE (enveloped acceleration)
• Displacement
Measurements are also available for specific vibration monitoring applications, including:
• Bump Test
• Shaft Orbit
• Motor Current Analysis
In addition, the New measurement icon provides another way to set up a new “user defined” measurement, and there are two additional measurement icons that allow you to Review previously saved measurement data or saved measurement setups, or Recall the setup screen for the last measurement that was taken (whether it was saved or not).
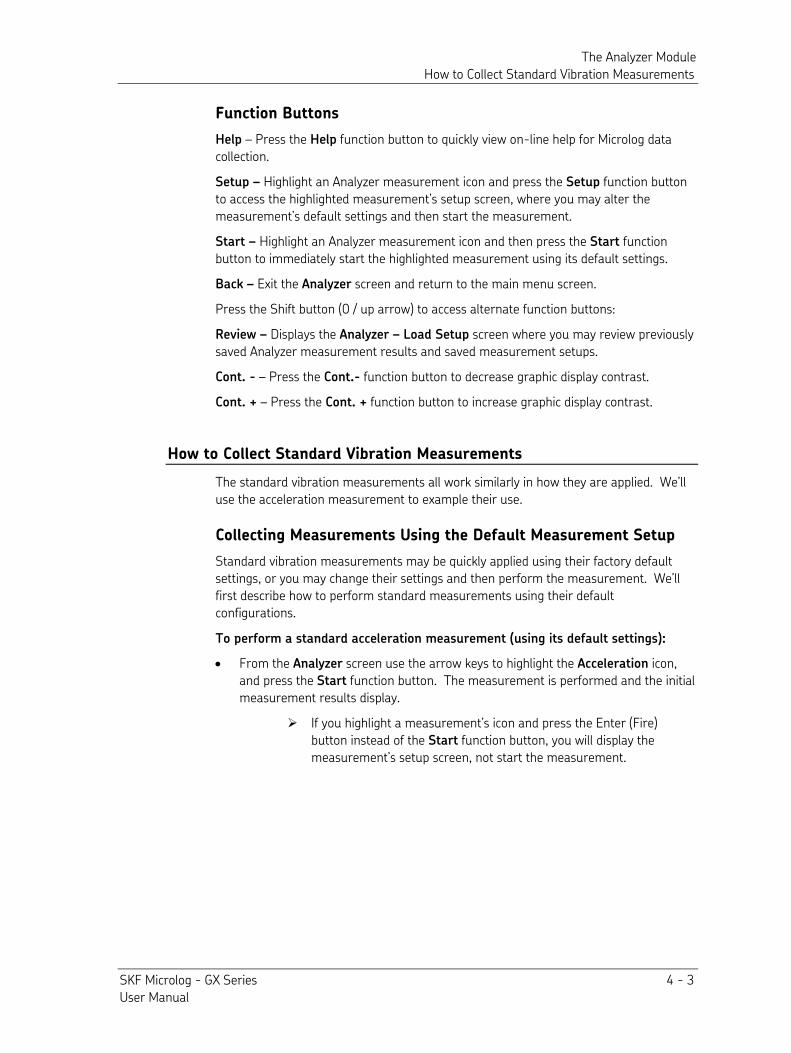
The Analyzer Module How to Collect Standard Vibration Measurements
SKF Microlog - GX Series 4 - 3 User Manual
Function Buttons
Help – Press the Help function button to quickly view on-line help for Microlog data collection.
Setup – Highlight an Analyzer measurement icon and press the Setup function button to access the highlighted measurement’s setup screen, where you may alter the measurement’s default settings and then start the measurement.
Start – Highlight an Analyzer measurement icon and then press the Start function button to immediately start the highlighted measurement using its default settings.
Back – Exit the Analyzer screen and return to the main menu screen.
Press the Shift button (0 / up arrow) to access alternate function buttons:
Review – Displays the Analyzer – Load Setup screen where you may review previously saved Analyzer measurement results and saved measurement setups.
Cont. - – Press the Cont.- function button to decrease graphic display contrast.
Cont. + – Press the Cont. + function button to increase graphic display contrast.
How to Collect Standard Vibration Measurements
The standard vibration measurements all work similarly in how they are applied. We’ll use the acceleration measurement to example their use.
Collecting Measurements Using the Default Measurement Setup
Standard vibration measurements may be quickly applied using their factory default settings, or you may change their settings and then perform the measurement. We’ll first describe how to perform standard measurements using their default configurations.
To perform a standard acceleration measurement (using its default settings):
• From the Analyzer screen use the arrow keys to highlight the Acceleration icon, and press the Start function button. The measurement is performed and the initial measurement results display.
If you highlight a measurement’s icon and press the Enter (Fire) button instead of the Start function button, you will display the measurement’s setup screen, not start the measurement.
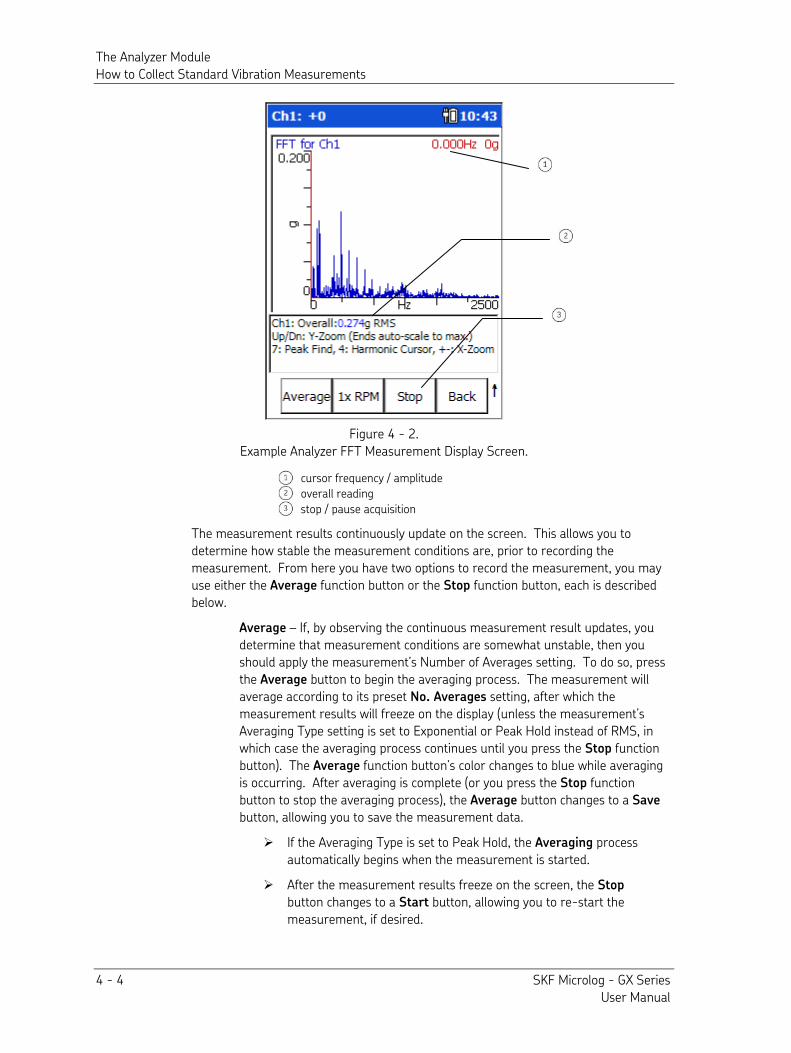
The Analyzer Module How to Collect Standard Vibration Measurements
4 - 4 SKF Microlog - GX Series User Manual
Figure 4 - 2. Example Analyzer FFT Measurement Display Screen.
cursor frequency / amplitude
overall reading
stop / pause acquisition
The measurement results continuously update on the screen. This allows you to determine how stable the measurement conditions are, prior to recording the measurement. From here you have two options to record the measurement, you may use either the Average function button or the Stop function button, each is described below.
Average – If, by observing the continuous measurement result updates, you determine that measurement conditions are somewhat unstable, then you should apply the measurement’s Number of Averages setting. To do so, press the Average button to begin the averaging process. The measurement will average according to its preset No. Averages setting, after which the measurement results will freeze on the display (unless the measurement’s Averaging Type setting is set to Exponential or Peak Hold instead of RMS, in which case the averaging process continues until you press the Stop function button). The Average function button’s color changes to blue while averaging is occurring. After averaging is complete (or you press the Stop function button to stop the averaging process), the Average button changes to a Save button, allowing you to save the measurement data.
If the Averaging Type is set to Peak Hold, the Averaging process automatically begins when the measurement is started.
After the measurement results freeze on the screen, the Stop button changes to a Start button, allowing you to re-start the measurement, if desired.
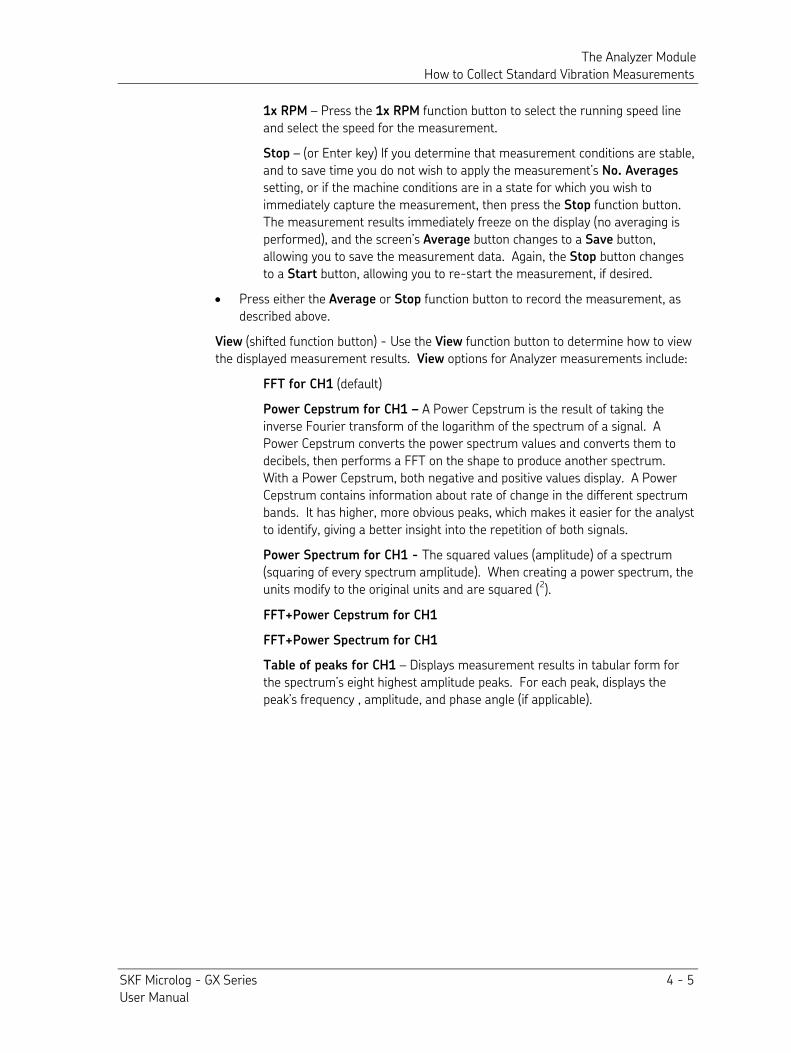
The Analyzer Module How to Collect Standard Vibration Measurements
SKF Microlog - GX Series 4 - 5 User Manual
1x RPM – Press the 1x RPM function button to select the running speed line and select the speed for the measurement.
Stop – (or Enter key) If you determine that measurement conditions are stable, and to save time you do not wish to apply the measurement’s No. Averages setting, or if the machine conditions are in a state for which you wish to immediately capture the measurement, then press the Stop function button. The measurement results immediately freeze on the display (no averaging is performed), and the screen’s Average button changes to a Save button, allowing you to save the measurement data. Again, the Stop button changes to a Start button, allowing you to re-start the measurement, if desired.
• Press either the Average or Stop function button to record the measurement, as described above.
View (shifted function button) - Use the View function button to determine how to view the displayed measurement results. View options for Analyzer measurements include:
FFT for CH1 (default)
Power Cepstrum for CH1 – A Power Cepstrum is the result of taking the inverse Fourier transform of the logarithm of the spectrum of a signal. A Power Cepstrum converts the power spectrum values and converts them to decibels, then performs a FFT on the shape to produce another spectrum. With a Power Cepstrum, both negative and positive values display. A Power Cepstrum contains information about rate of change in the different spectrum bands. It has higher, more obvious peaks, which makes it easier for the analyst to identify, giving a better insight into the repetition of both signals.
Power Spectrum for CH1 - The squared values (amplitude) of a spectrum (squaring of every spectrum amplitude). When creating a power spectrum, the units modify to the original units and are squared (2).
FFT+Power Cepstrum for CH1
FFT+Power Spectrum for CH1
Table of peaks for CH1 – Displays measurement results in tabular form for the spectrum’s eight highest amplitude peaks. For each peak, displays the peak’s frequency , amplitude, and phase angle (if applicable).
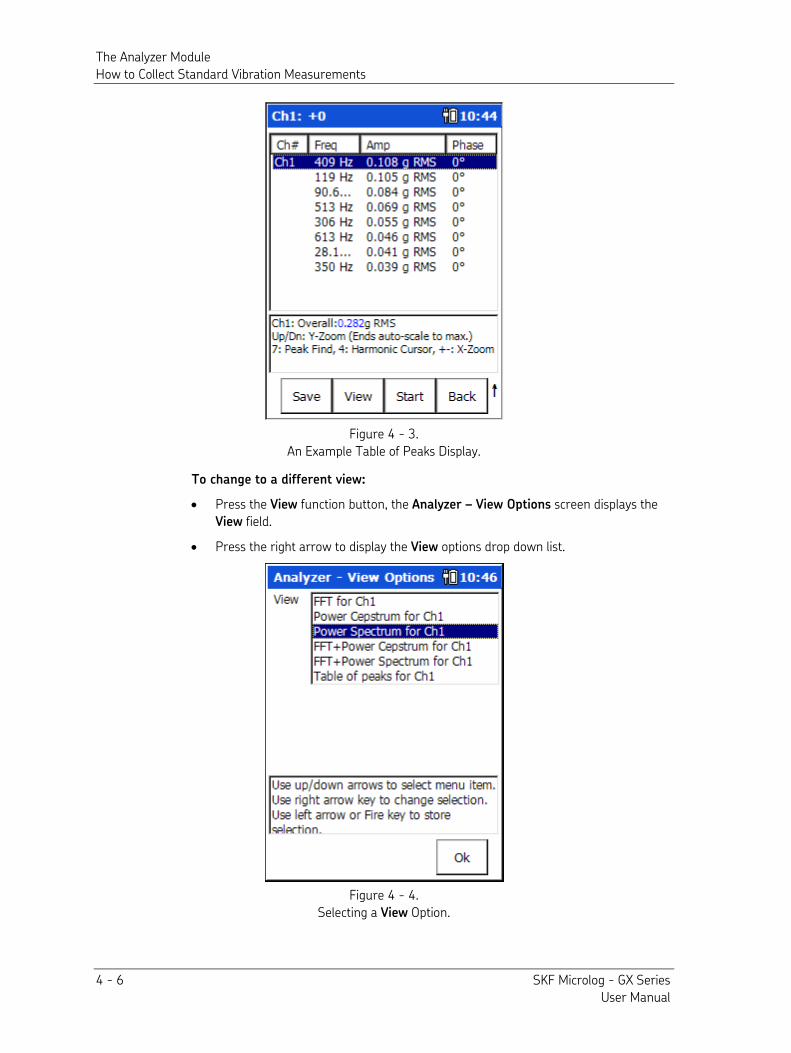
The Analyzer Module How to Collect Standard Vibration Measurements
4 - 6 SKF Microlog - GX Series User Manual
Figure 4 - 3. An Example Table of Peaks Display.
To change to a different view:
• Press the View function button, the Analyzer – View Options screen displays the View field.
• Press the right arrow to display the View options drop down list.
Figure 4 - 4. Selecting a View Option.
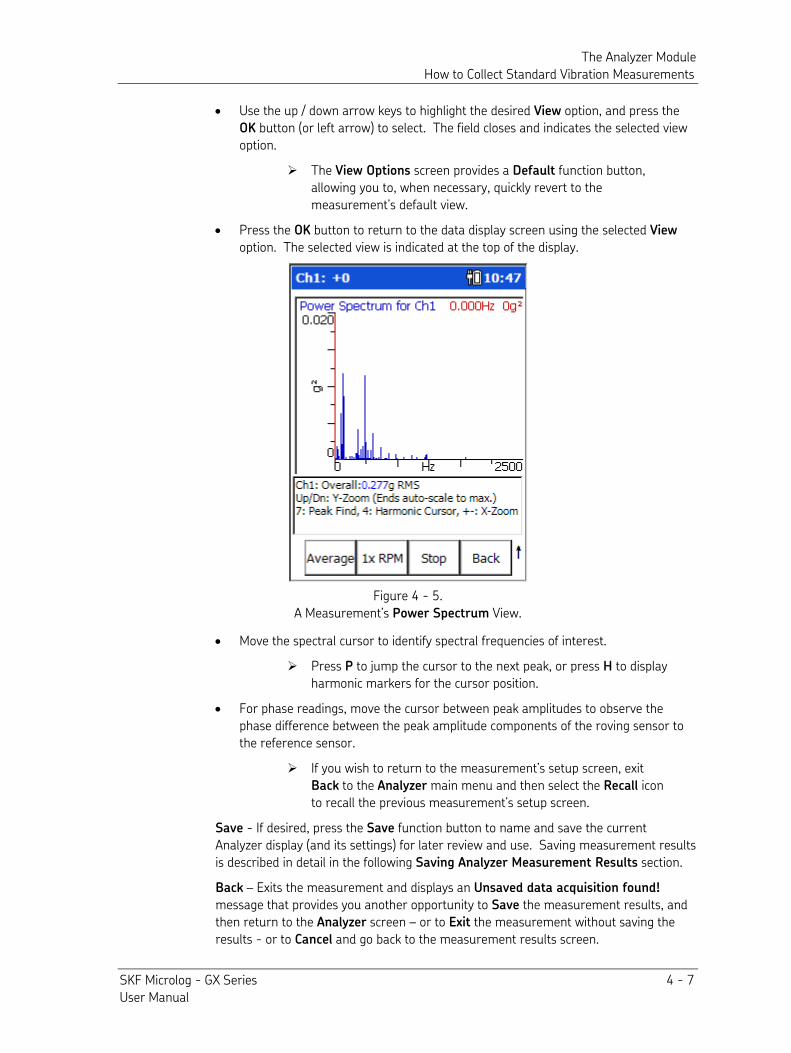
The Analyzer Module How to Collect Standard Vibration Measurements
SKF Microlog - GX Series 4 - 7 User Manual
• Use the up / down arrow keys to highlight the desired View option, and press the OK button (or left arrow) to select. The field closes and indicates the selected view option.
The View Options screen provides a Default function button, allowing you to, when necessary, quickly revert to the measurement’s default view.
• Press the OK button to return to the data display screen using the selected View option. The selected view is indicated at the top of the display.
Figure 4 - 5. A Measurement’s Power Spectrum View.
• Move the spectral cursor to identify spectral frequencies of interest.
Press P to jump the cursor to the next peak, or press H to display harmonic markers for the cursor position.
• For phase readings, move the cursor between peak amplitudes to observe the phase difference between the peak amplitude components of the roving sensor to the reference sensor.
If you wish to return to the measurement’s setup screen, exit Back to the Analyzer main menu and then select the Recall icon to recall the previous measurement’s setup screen.
Save - If desired, press the Save function button to name and save the current Analyzer display (and its settings) for later review and use. Saving measurement results is described in detail in the following Saving Analyzer Measurement Results section.
Back – Exits the measurement and displays an Unsaved data acquisition found! message that provides you another opportunity to Save the measurement results, and then return to the Analyzer screen – or to Exit the measurement without saving the results - or to Cancel and go back to the measurement results screen.
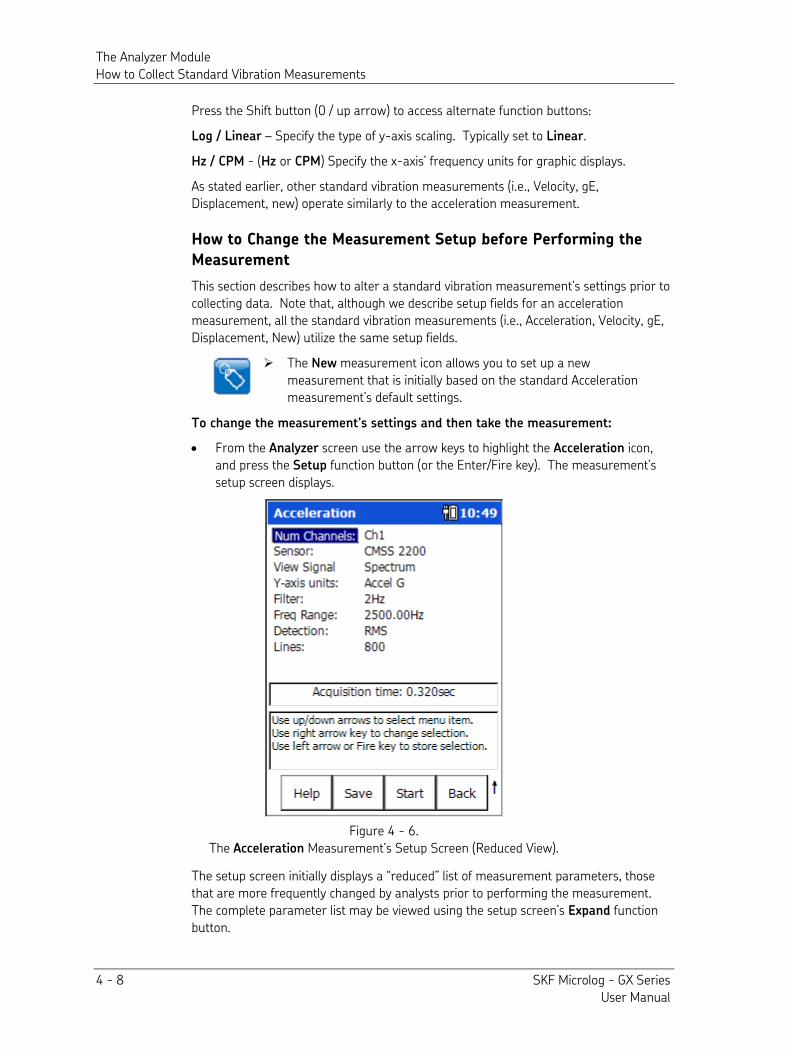
The Analyzer Module How to Collect Standard Vibration Measurements
4 - 8 SKF Microlog - GX Series User Manual
Press the Shift button (0 / up arrow) to access alternate function buttons:
Log / Linear – Specify the type of y-axis scaling. Typically set to Linear.
Hz / CPM - (Hz or CPM) Specify the x-axis’ frequency units for graphic displays.
As stated earlier, other standard vibration measurements (i.e., Velocity, gE, Displacement, new) operate similarly to the acceleration measurement.
How to Change the Measurement Setup before Performing the
Measurement
This section describes how to alter a standard vibration measurement’s settings prior to collecting data. Note that, although we describe setup fields for an acceleration measurement, all the standard vibration measurements (i.e., Acceleration, Velocity, gE, Displacement, New) utilize the same setup fields.
The New measurement icon allows you to set up a new measurement that is initially based on the standard Acceleration measurement’s default settings.
To change the measurement’s settings and then take the measurement:
• From the Analyzer screen use the arrow keys to highlight the Acceleration icon, and press the Setup function button (or the Enter/Fire key). The measurement’s setup screen displays.
Figure 4 - 6. The Acceleration Measurement’s Setup Screen (Reduced View).
The setup screen initially displays a “reduced” list of measurement parameters, those that are more frequently changed by analysts prior to performing the measurement. The complete parameter list may be viewed using the setup screen’s Expand function button.
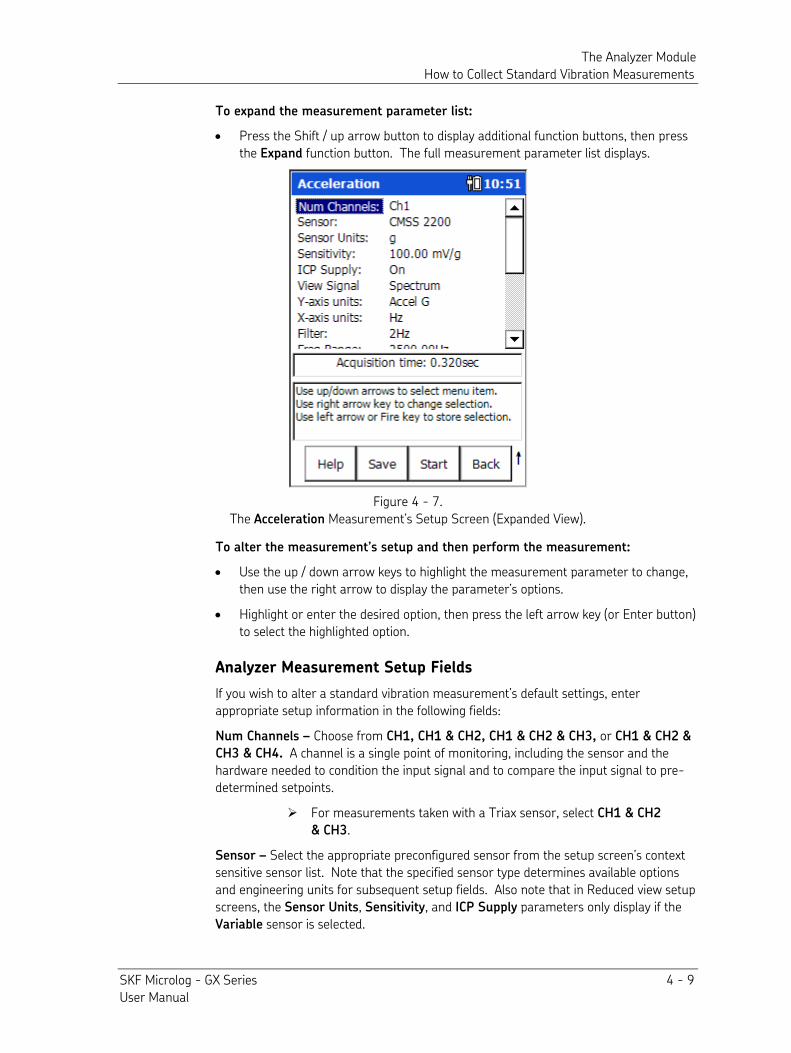
The Analyzer Module How to Collect Standard Vibration Measurements
SKF Microlog - GX Series 4 - 9 User Manual
To expand the measurement parameter list:
• Press the Shift / up arrow button to display additional function buttons, then press the Expand function button. The full measurement parameter list displays.
Figure 4 - 7. The Acceleration Measurement’s Setup Screen (Expanded View).
To alter the measurement’s setup and then perform the measurement:
• Use the up / down arrow keys to highlight the measurement parameter to change, then use the right arrow to display the parameter’s options.
• Highlight or enter the desired option, then press the left arrow key (or Enter button) to select the highlighted option.
Analyzer Measurement Setup Fields
If you wish to alter a standard vibration measurement’s default settings, enter appropriate setup information in the following fields:
Num Channels – Choose from CH1, CH1 & CH2, CH1 & CH2 & CH3, or CH1 & CH2 &
CH3 & CH4. A channel is a single point of monitoring, including the sensor and the hardware needed to condition the input signal and to compare the input signal to pre-determined setpoints.
For measurements taken with a Triax sensor, select CH1 & CH2
& CH3.
Sensor – Select the appropriate preconfigured sensor from the setup screen’s context sensitive sensor list. Note that the specified sensor type determines available options and engineering units for subsequent setup fields. Also note that in Reduced view setup screens, the Sensor Units, Sensitivity, and ICP Supply parameters only display if the Variable sensor is selected.
The Analyzer Module How to Collect Standard Vibration Measurements
4 - 10 SKF Microlog - GX Series User Manual
The Variable sensor option allows you to configure settings for a sensor that is not on the sensor list.
Sensor Units – (Not editable if a preconfigured sensor is selected in the Sensor field.) When the Variable sensor is selected, select the measurement units to use for the type of sensor being used. Options include g, in/s, mil, V, psi, lbf, A, and mil.
Sensitivity – (Not editable if a preconfigured sensor is selected in the Sensor field.) When the Variable sensor is selected, use the alphanumeric keypad to enter transducer sensitivity in millivolts (mV) per Engineering Unit (EU).
ICP Supply – On or Off, (Not editable if a preconfigured sensor is selected in the Sensor field.) When the Variable sensor is selected, select to turn ICP power Off or On for the sensor.
View Signal – From the drop down list, specify the format in which to display the measured signal. Options are Spectrum, Time, Spectrum+Time, or Spectrum &
Phase.
For phase measurements, connect a sensor similar to the one connected to CH1 to the Microlog’s CH2 connector.
Y-axis units – Derives the measurement type and units. Options vary depending on the previous Sensor Units setting.
If Y-axis units is set to gE, then the previous View Signal option should be set to Spectrum. If View Signal is set to Spectrum
and Phase, invalid gE data occurs.
X – axis units (Hz or CPM), Specify frequency units for graphic displays. Note that the specified X-axis units setting determines frequency units for subsequent setup fields.
Filter / gE Band – As determined by the Y-axis units setting, the drop-down list displays two types of filter settings, high-pass filter settings and enveloper band pass filter settings. The Microlog’s real analog high-pass filter affects both the time and FFT domains.
The Microlog’s high-pass filter filters the time domain with a real analog filter, which attenuates based on the selected value.
• When setting up a measurement other than an enveloped acceleration
measurement. The range for normal measurements is from approximately 200 CPM to 600 CPM, or the equivalent in Hz.
• With enveloped acceleration measurements, the enveloping process automatically performs a low frequency cut off.
Freq Range (Fmax)– Use the drop down list to specify the FFT upper full-scale frequency, up to 80,000 Hz (4,800,000 CPM) for single and 2 channel measurements, 40,000Hz (2,400,000cpm) for 3 and 4 channel measurements.
The Freq Range setting may be entered from the numeric keypad if the Setup / Filter Entry / Free Entry setting is selected.
Display Y-axis – (Linear, Logarithmic, or dB) Specify the type of y-axis scaling.
If dB is selected for the Y-axis display, additional dB Reference and dB Ref
Units fields display.
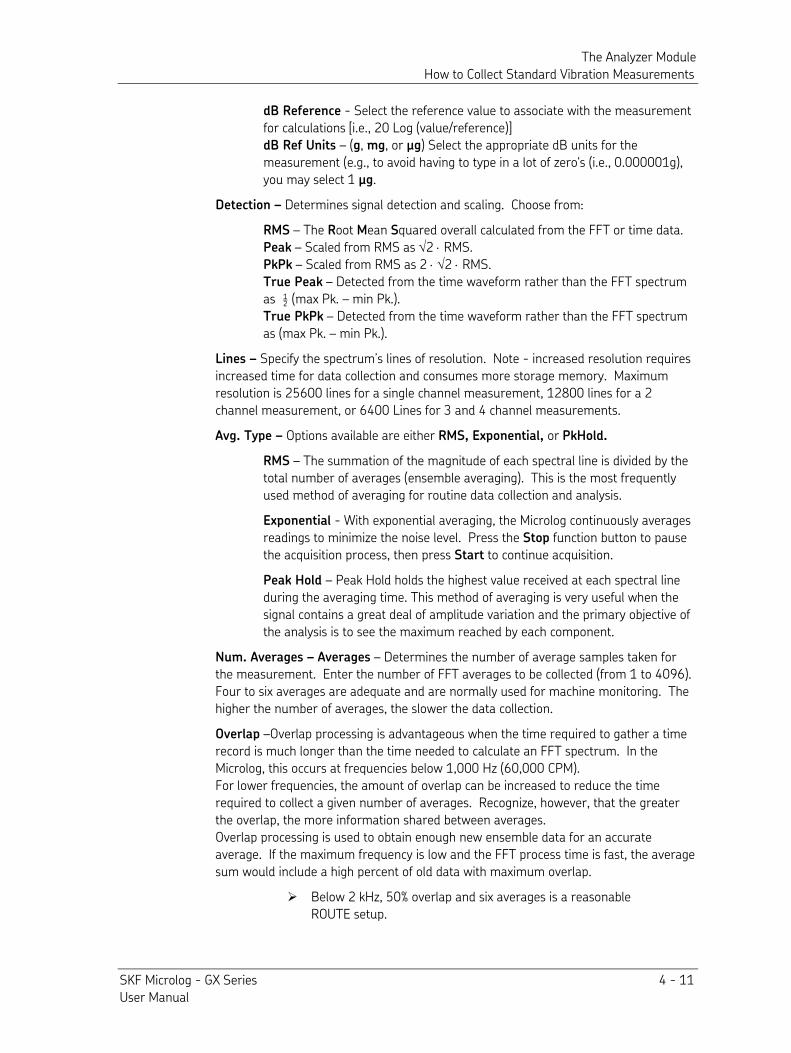
The Analyzer Module How to Collect Standard Vibration Measurements
SKF Microlog - GX Series 4 - 11 User Manual
dB Reference - Select the reference value to associate with the measurement for calculations [i.e., 20 Log (value/reference)] dB Ref Units – (g, mg, or μg) Select the appropriate dB units for the measurement (e.g., to avoid having to type in a lot of zero's (i.e., 0.000001g), you may select 1 μg.
Detection – Determines signal detection and scaling. Choose from:
RMS – The Root Mean Squared overall calculated from the FFT or time data. Peak – Scaled from RMS as √2 ⋅ RMS. PkPk – Scaled from RMS as 2 ⋅ √2 ⋅ RMS. True Peak – Detected from the time waveform rather than the FFT spectrum as ½ (max Pk. – min Pk.). True PkPk – Detected from the time waveform rather than the FFT spectrum as (max Pk. – min Pk.).
Lines – Specify the spectrum’s lines of resolution. Note - increased resolution requires increased time for data collection and consumes more storage memory. Maximum resolution is 25600 lines for a single channel measurement, 12800 lines for a 2 channel measurement, or 6400 Lines for 3 and 4 channel measurements. Avg. Type – Options available are either RMS, Exponential, or PkHold.
RMS – The summation of the magnitude of each spectral line is divided by the total number of averages (ensemble averaging). This is the most frequently used method of averaging for routine data collection and analysis.
Exponential - With exponential averaging, the Microlog continuously averages readings to minimize the noise level. Press the Stop function button to pause the acquisition process, then press Start to continue acquisition.
Peak Hold – Peak Hold holds the highest value received at each spectral line during the averaging time. This method of averaging is very useful when the signal contains a great deal of amplitude variation and the primary objective of the analysis is to see the maximum reached by each component.
Num. Averages – Averages – Determines the number of average samples taken for the measurement. Enter the number of FFT averages to be collected (from 1 to 4096). Four to six averages are adequate and are normally used for machine monitoring. The higher the number of averages, the slower the data collection.
Overlap –Overlap processing is advantageous when the time required to gather a time record is much longer than the time needed to calculate an FFT spectrum. In the Microlog, this occurs at frequencies below 1,000 Hz (60,000 CPM). For lower frequencies, the amount of overlap can be increased to reduce the time required to collect a given number of averages. Recognize, however, that the greater the overlap, the more information shared between averages. Overlap processing is used to obtain enough new ensemble data for an accurate average. If the maximum frequency is low and the FFT process time is fast, the average sum would include a high percent of old data with maximum overlap.
Below 2 kHz, 50% overlap and six averages is a reasonable ROUTE setup.
The Analyzer Module How to Collect Standard Vibration Measurements
4 - 12 SKF Microlog - GX Series User Manual
Window – The type of window used in the FFT processing. A window function must be applied to any periodic time record prior to performing an FFT to minimize leakage errors. The Hanning and Flat Top window functions attenuate to zero both the leading and trailing edges of the time domain buffer (to prevent leakage error caused by discontinuities in the time record). Press the right arrow to view the choices:
Hanning - A dynamic signal analyzer window function that provides better frequency resolution than Flat Top, but with reduced amplitude accuracy. Useful for machine vibration measurements, general purpose measurements, and measurements containing random noise.
Hamming - A dynamic signal analyzer window function that is commonly used in narrowband applications. The window is optimized to minimize the maximum (nearest) side lobe, giving it a height of about one-fifth that of the Hanning window. Flat Top - A dynamic signal analyzer window function that provides the best amplitude accuracy for measuring discrete frequency components. Useful for calibration or machine vibration measurements using displacement probes in fluid film bearings.
Rectangular – A dynamic signal analyzer window function with uniform weighting across time. Useful for measuring transients or mechanical response measurements and in tracking mode.
Save – If desired, from the measurement setup screen, you may press the Save function button to save the measurement setup for easy reuse in the future. Reference the following How to Save, View, and Delete Analyzer Measurement Results section for details on how to save your measurement setup.
• After you are finished with your measurement setup changes, press the Start function button to begin the measurement using the new settings. The measurement is performed and the initial measurement results display.
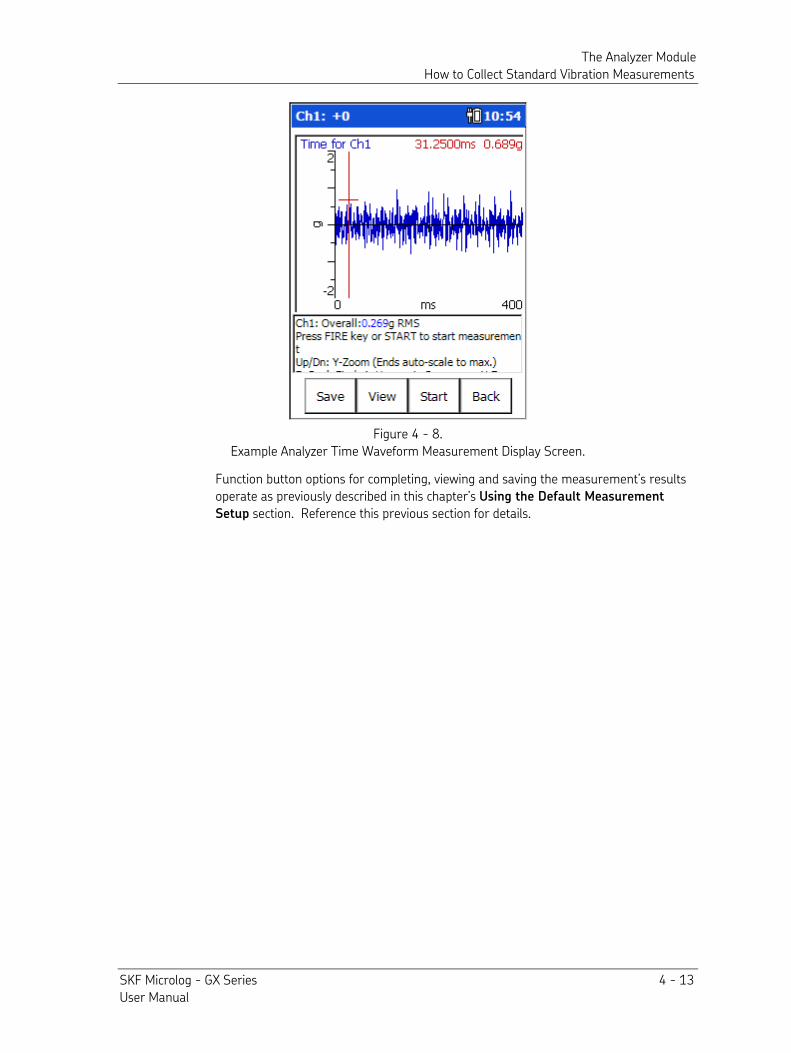
The Analyzer Module How to Collect Standard Vibration Measurements
SKF Microlog - GX Series 4 - 13 User Manual
Figure 4 - 8. Example Analyzer Time Waveform Measurement Display Screen.
Function button options for completing, viewing and saving the measurement’s results operate as previously described in this chapter’s Using the Default Measurement
Setup section. Reference this previous section for details.
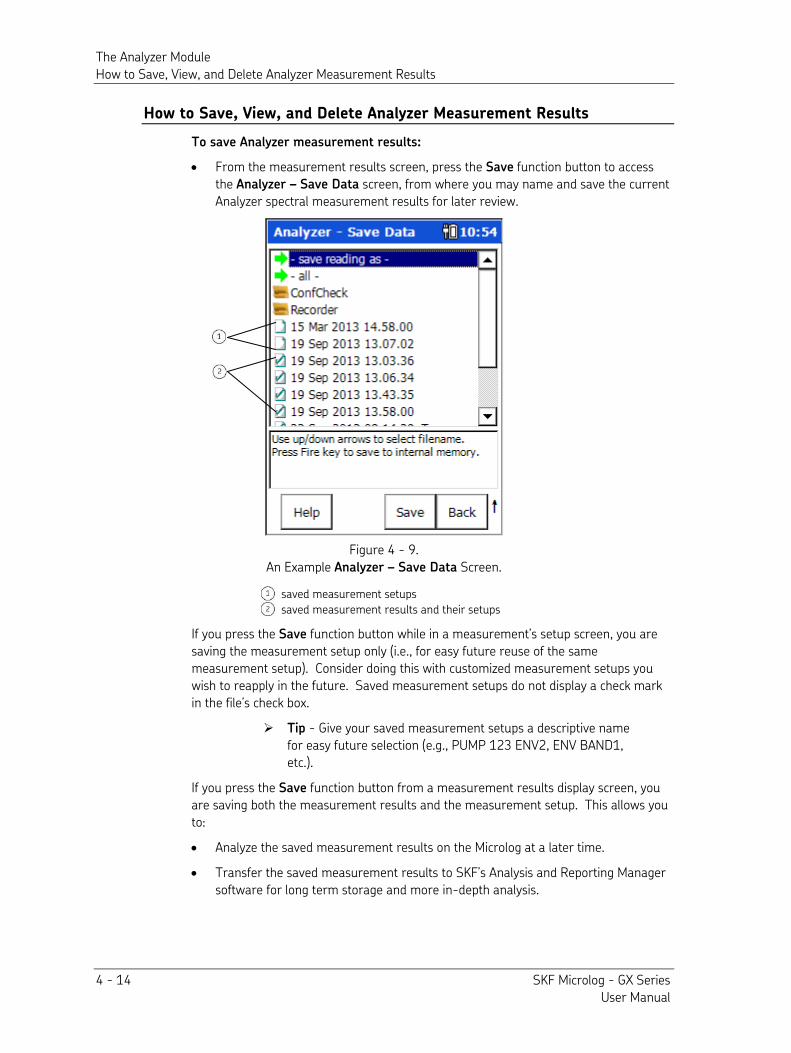
The Analyzer Module How to Save, View, and Delete Analyzer Measurement Results
4 - 14 SKF Microlog - GX Series User Manual
How to Save, View, and Delete Analyzer Measurement Results
To save Analyzer measurement results:
• From the measurement results screen, press the Save function button to access the Analyzer – Save Data screen, from where you may name and save the current Analyzer spectral measurement results for later review.
Figure 4 - 9. An Example Analyzer – Save Data Screen.
saved measurement setups
saved measurement results and their setups
If you press the Save function button while in a measurement’s setup screen, you are saving the measurement setup only (i.e., for easy future reuse of the same measurement setup). Consider doing this with customized measurement setups you wish to reapply in the future. Saved measurement setups do not display a check mark in the file’s check box.
Tip - Give your saved measurement setups a descriptive name for easy future selection (e.g., PUMP 123 ENV2, ENV BAND1, etc.).
If you press the Save function button from a measurement results display screen, you are saving both the measurement results and the measurement setup. This allows you to:
• Analyze the saved measurement results on the Microlog at a later time.
• Transfer the saved measurement results to SKF’s Analysis and Reporting Manager software for long term storage and more in-depth analysis.
The Analyzer Module How to Save, View, and Delete Analyzer Measurement Results
SKF Microlog - GX Series 4 - 15 User Manual
• At some later time, open the saved measurement on the Microlog and retake the measurement with its original settings, or you may alter the original settings and then reapply the measurement with new settings.
Saved measurement results / setups display a check mark in the file’s check box.
• Highlight the –save reading as- line and press the Save function button to display the Save As dialog. The current date timestamp is the default filename.
You may also overwrite / update an existing measurement result file using arrow buttons and the Save function button.
• Press the OK function button to accept the date timestamp as the filename, or use the Microlog’s alpha-numeric keypad to enter a descriptive filename, then press OK. Spectral results are stored and you are returned to the Analyzer screen.
Tip - with the date timestamp displayed, press the right/left arrow button to move the cursor to the end/beginning of the timestamp and type the tested machine’s ID. This naming convention identifies both the machine and the date timestamp of the test.
Analyzer measurement spectral results are stored in comma separated value format (.csv) in the Microlog’s Mobile
Device/Internal Disk/Analyzer folder.
Back - The Analyzer – Save Data screen’s Back function button brings you back to the Analyzer screen, from where you may choose to perform another analyzer measurement.
Press the Shift button (0 / up arrow) to access alternate function buttons:
Delete – Highlight the .csv spectral results file to delete and press the Delete function button to permanently delete the saved measurement results.
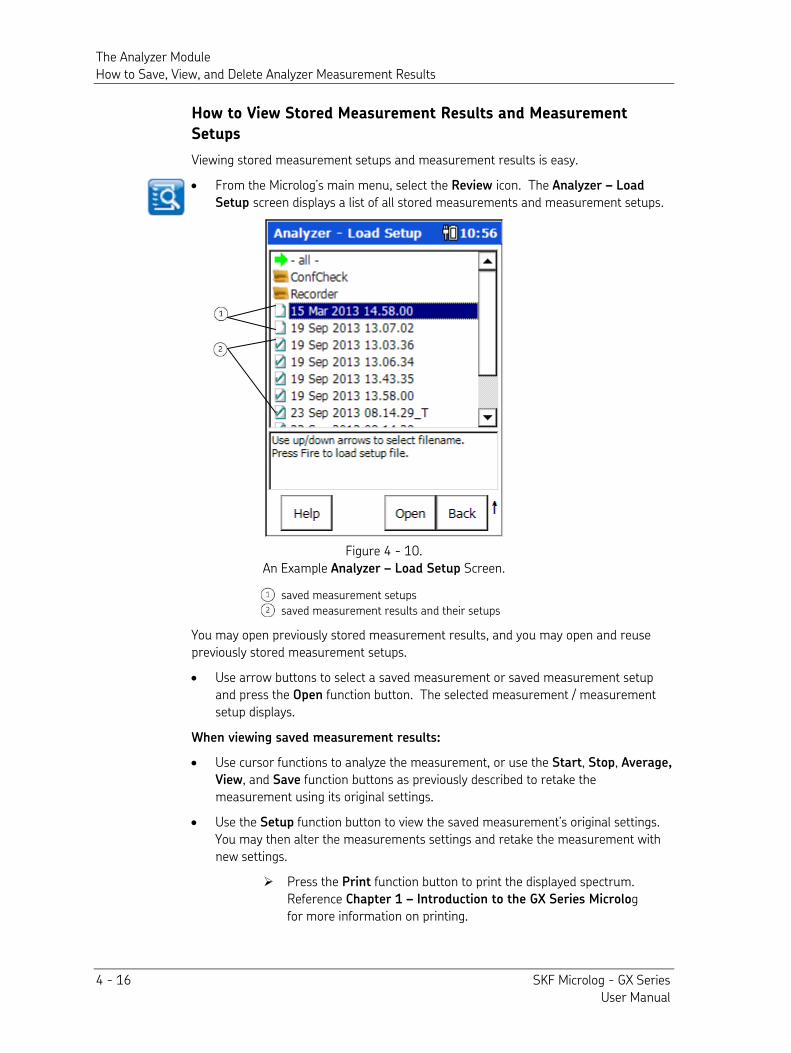
The Analyzer Module How to Save, View, and Delete Analyzer Measurement Results
4 - 16 SKF Microlog - GX Series User Manual
How to View Stored Measurement Results and Measurement
Setups
Viewing stored measurement setups and measurement results is easy.
• From the Microlog’s main menu, select the Review icon. The Analyzer – Load
Setup screen displays a list of all stored measurements and measurement setups.
Figure 4 - 10. An Example Analyzer – Load Setup Screen.
saved measurement setups
saved measurement results and their setups
You may open previously stored measurement results, and you may open and reuse previously stored measurement setups.
• Use arrow buttons to select a saved measurement or saved measurement setup and press the Open function button. The selected measurement / measurement setup displays.
When viewing saved measurement results:
• Use cursor functions to analyze the measurement, or use the Start, Stop, Average, View, and Save function buttons as previously described to retake the measurement using its original settings.
• Use the Setup function button to view the saved measurement’s original settings. You may then alter the measurements settings and retake the measurement with new settings.
Press the Print function button to print the displayed spectrum. Reference Chapter 1 – Introduction to the GX Series Microlog for more information on printing.
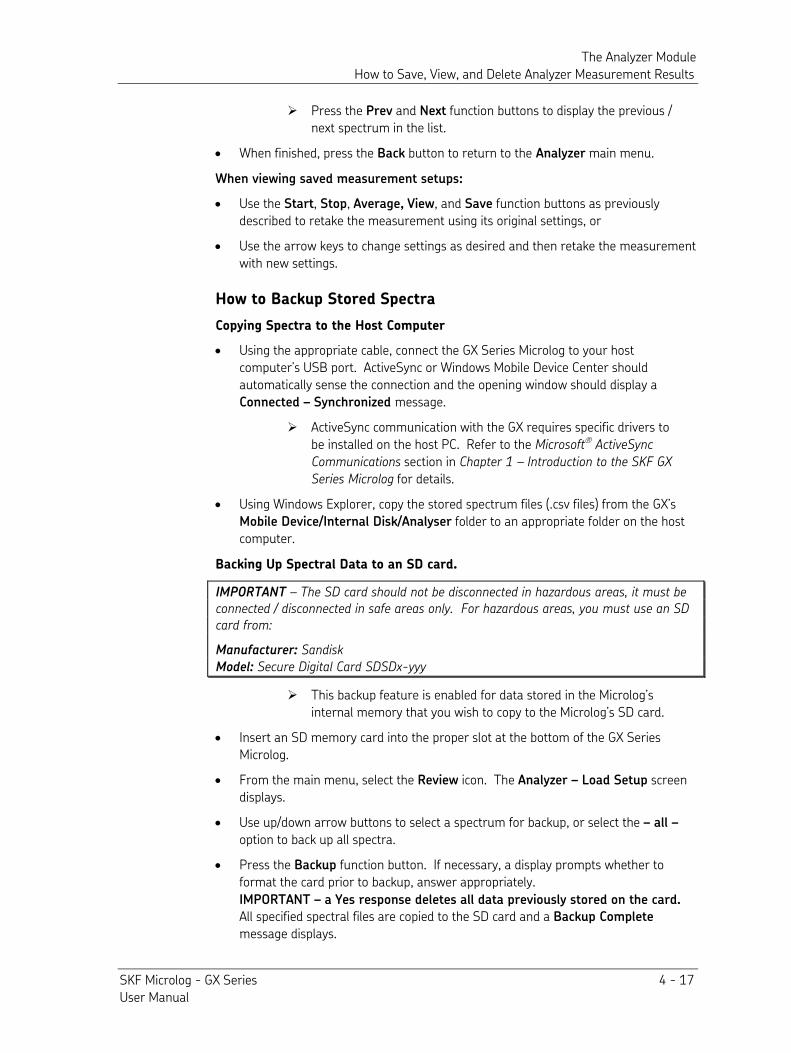
The Analyzer Module How to Save, View, and Delete Analyzer Measurement Results
SKF Microlog - GX Series 4 - 17 User Manual
Press the Prev and Next function buttons to display the previous / next spectrum in the list.
• When finished, press the Back button to return to the Analyzer main menu.
When viewing saved measurement setups:
• Use the Start, Stop, Average, View, and Save function buttons as previously described to retake the measurement using its original settings, or
• Use the arrow keys to change settings as desired and then retake the measurement with new settings.
How to Backup Stored Spectra
Copying Spectra to the Host Computer
• Using the appropriate cable, connect the GX Series Microlog to your host computer’s USB port. ActiveSync or Windows Mobile Device Center should automatically sense the connection and the opening window should display a Connected – Synchronized message.
ActiveSync communication with the GX requires specific drivers to be installed on the host PC. Refer to the Microsoft ActiveSync
Communications section in Chapter 1 – Introduction to the SKF GX
Series Microlog for details.
• Using Windows Explorer, copy the stored spectrum files (.csv files) from the GX’s Mobile Device/Internal Disk/Analyser folder to an appropriate folder on the host computer.
Backing Up Spectral Data to an SD card.
IMPORTANT – The SD card should not be disconnected in hazardous areas, it must be
connected / disconnected in safe areas only. For hazardous areas, you must use an SD
card from:
Manufacturer: Sandisk
Model: Secure Digital Card SDSDx-yyy
This backup feature is enabled for data stored in the Microlog’s internal memory that you wish to copy to the Microlog’s SD card.
• Insert an SD memory card into the proper slot at the bottom of the GX Series Microlog.
• From the main menu, select the Review icon. The Analyzer – Load Setup screen displays.
• Use up/down arrow buttons to select a spectrum for backup, or select the – all –
option to back up all spectra.
• Press the Backup function button. If necessary, a display prompts whether to format the card prior to backup, answer appropriately.
IMPORTANT – a Yes response deletes all data previously stored on the card.
All specified spectral files are copied to the SD card and a Backup Complete message displays.
The Analyzer Module How to Save, View, and Delete Analyzer Measurement Results
4 - 18 SKF Microlog - GX Series User Manual
• Eject the card and store in a safe place, or insert the card into the host computer and copy the backed up files to the host computer’s hard drive.
How to Delete Stored Files
To delete a single stored file (either measurement results or measurement
settings):
• From the Analyzer – Load Setup screen, use up/down arrow buttons to select a file for deletion.
• Press the Delete function button. You are prompted to confirm the deletion.
• Answer Yes, the file is deleted and you remain in the Analyzer – Load Setup screen.
To delete all files / folders:
• From the Analyzer – Load Setup screen, use up/down arrow buttons to select the – all –option. The Delete All screen displays.
Figure 4 - 11. The Delete All Screen.
Files – Deletes all saved files (both measurement results and measurement settings files). You are prompted to confirm the deletion. Folders – Deletes all folders and their contents. You are prompted to confirm the deletion.
All – Deletes all saved folders and files. You are prompted to confirm the deletion. Cancel – Cancels the deletion process and returns you to the Analyzer – Load Setup screen.
• Select one of the above deletion options to perform the deletion.
The Analyzer Module How to Perform Multi-Channel Measurements
SKF Microlog - GX Series 4 - 19 User Manual
How to Perform Multi-Channel Measurements
Multi-channel Analyzer measurements allow you to monitor multi-spectrum, multi-time, spectrum+time, spectrum & phase, spectrum+cross-channel phase measurements, and orbit measurements.
Unfiltered and order filtered Orbit measurements may also be more easily performed using the Analyzer’s Orbit icon. Orbit measurements are detailed in the following How to Measure
Shaft Orbit section.
Multi Channel Measurement View Signal Options
Spectrum Spectra, cepstrum, or power spectrum of all input channels, captured and viewed simultaneously or viewed independently.
Time Time waveforms of all input channels captured and viewed simultaneously or viewed independently.
Spectrum+Time Spectra, cepstrum, or power spectrum plus time waveform for each input channel, viewed simultaneously or viewed independently.
Spectrum & Phase Spectra, cepstrum, or power spectrum plus phase angle for each input channel, viewed simultaneously or viewed independently.
Spectrum+Cross-
Channel Phase
Spectra plus cross-channel phase angle (phase of input CH1 relative to input CH2) for each input channel, viewed simultaneously. Both spectra are stored and relative phase is displayed on FFT and as a table of magnitude/phase pairs with up to 8 orders.
Orbit Unfiltered orbit, or the time waveform for each input channel, viewed simultaneously or view independently.
Notes about Phase Measurements
When using two channels to take cross phase measurements, channel one should be used as the phase reference (static sensor), the roaming sensor should be attached to channel two, this prevents negative results from being generated.
For phase readings, move the cursor between peak amplitudes to observe the phase difference between the peak amplitude components of the roving sensor to the reference sensor.
The phase difference between channel 1 and channel 2 are displayed in the top right hand corner of the screen. It is shown as a vector and a numerical value.
The phase reading is only valid when the cursor is moved to a specific peak in the spectrum (i.e., the 1 X peak).
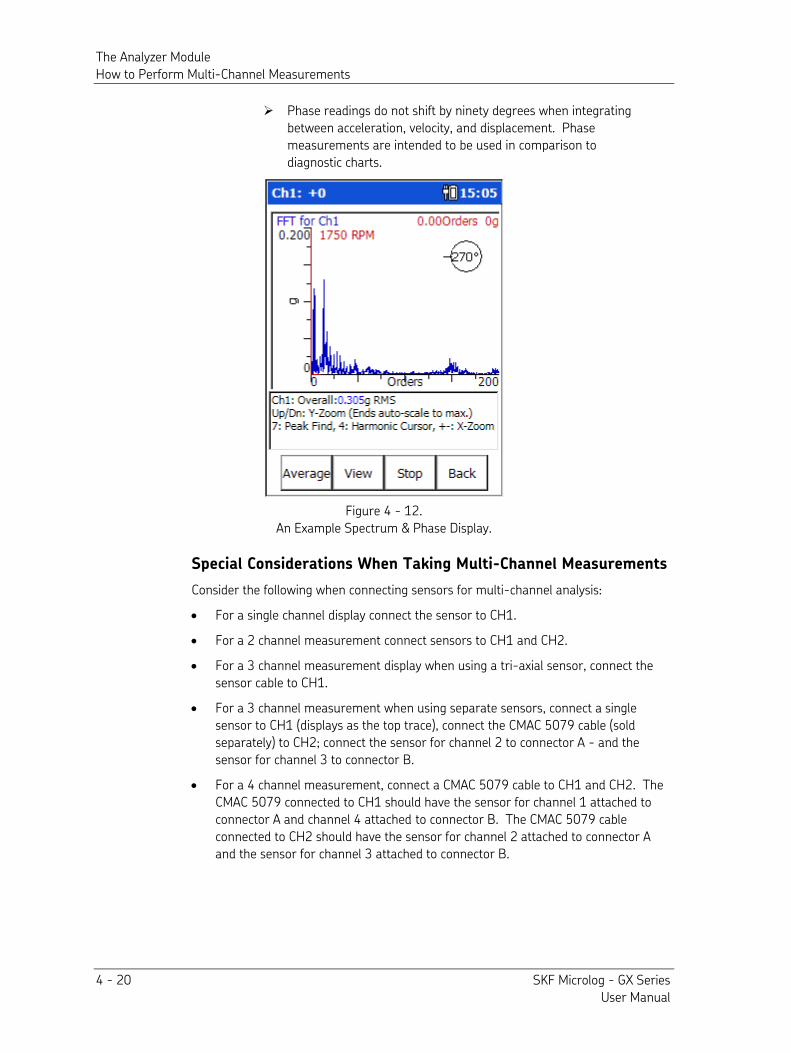
The Analyzer Module How to Perform Multi-Channel Measurements
4 - 20 SKF Microlog - GX Series User Manual
Phase readings do not shift by ninety degrees when integrating between acceleration, velocity, and displacement. Phase measurements are intended to be used in comparison to diagnostic charts.
Figure 4 - 12. An Example Spectrum & Phase Display.
Special Considerations When Taking Multi-Channel Measurements
Consider the following when connecting sensors for multi-channel analysis:
• For a single channel display connect the sensor to CH1. • For a 2 channel measurement connect sensors to CH1 and CH2. • For a 3 channel measurement display when using a tri-axial sensor, connect the
sensor cable to CH1. • For a 3 channel measurement when using separate sensors, connect a single
sensor to CH1 (displays as the top trace), connect the CMAC 5079 cable (sold separately) to CH2; connect the sensor for channel 2 to connector A - and the sensor for channel 3 to connector B.
• For a 4 channel measurement, connect a CMAC 5079 cable to CH1 and CH2. The CMAC 5079 connected to CH1 should have the sensor for channel 1 attached to connector A and channel 4 attached to connector B. The CMAC 5079 cable connected to CH2 should have the sensor for channel 2 attached to connector A and the sensor for channel 3 attached to connector B.
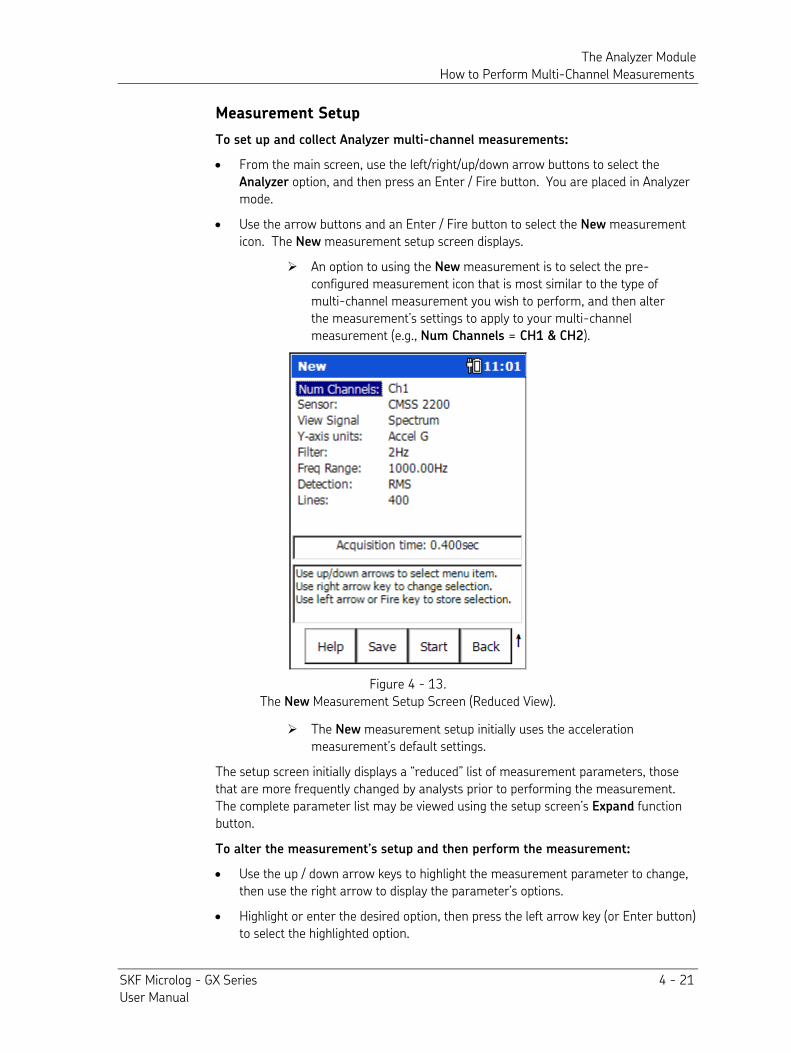
The Analyzer Module How to Perform Multi-Channel Measurements
SKF Microlog - GX Series 4 - 21 User Manual
Measurement Setup
To set up and collect Analyzer multi-channel measurements:
• From the main screen, use the left/right/up/down arrow buttons to select the Analyzer option, and then press an Enter / Fire button. You are placed in Analyzer mode.
• Use the arrow buttons and an Enter / Fire button to select the New measurement icon. The New measurement setup screen displays.
An option to using the New measurement is to select the pre-configured measurement icon that is most similar to the type of multi-channel measurement you wish to perform, and then alter the measurement’s settings to apply to your multi-channel measurement (e.g., Num Channels = CH1 & CH2).
Figure 4 - 13. The New Measurement Setup Screen (Reduced View).
The New measurement setup initially uses the acceleration measurement’s default settings.
The setup screen initially displays a “reduced” list of measurement parameters, those that are more frequently changed by analysts prior to performing the measurement. The complete parameter list may be viewed using the setup screen’s Expand function button.
To alter the measurement’s setup and then perform the measurement:
• Use the up / down arrow keys to highlight the measurement parameter to change, then use the right arrow to display the parameter’s options.
• Highlight or enter the desired option, then press the left arrow key (or Enter button) to select the highlighted option.
The Analyzer Module How to Perform Multi-Channel Measurements
4 - 22 SKF Microlog - GX Series User Manual
Multi-Channel Measurement Setup Fields
With two exceptions (i.e., Num Channels and View Signal), multi-channel setup fields operate as previously described in the Analyzer Measurement Setup Fields section. Reference this previous section for details.
Num Channels – For multi-channel measurements, use the up/down arrow buttons to specify your input channels, CH1 & CH2, CH1 & CH2 & CH3, or CH1 & CH2 & CH3 &
CH4.
View Signal – Because you set the measurement’s Num Channels parameter to more than one channel, View Signals options relate to those for multi-channel measurements. From the drop down list, specify the format in which to display the measured signals. Options are:
Spectrum
Time
Spectrum+Time
Spectrum & Phase
Spectrum+Cross Channel Phase
• Configure other measurement parameters as described in this chapter’s Analyzer
Measurement Setup Fields section.
Save – If desired, from the measurement setup screen, you may press the Save function button to save the measurement setup for easy reuse in the future. Reference the previous How to Save, View, and Delete Analyzer Measurement Results section for details on how to save your measurement setup.
• After you are finished with your measurement setup changes, press the Start function button to begin the measurement using the new settings. The measurement is performed and the initial measurement results display.
In all multi-channel measurement results displays, Average, Stop, Start, and Save function button options operate as previously described in the Using the Default Measurement
Setup section. Reference this previous section for details.
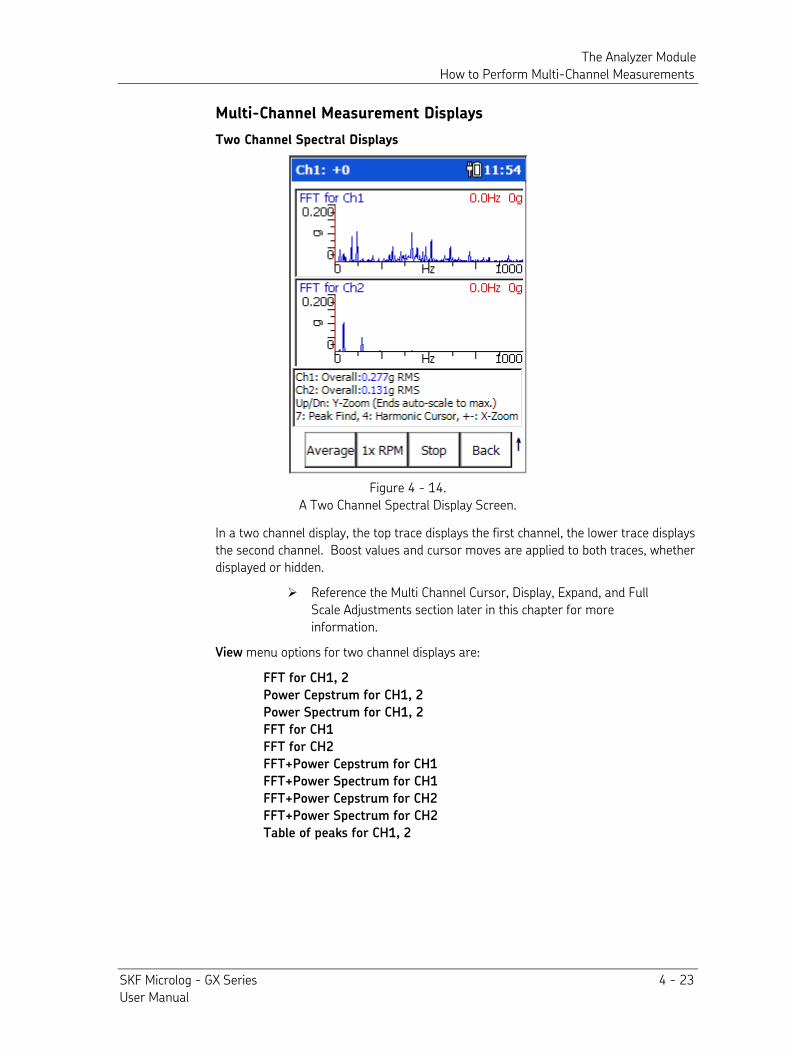
The Analyzer Module How to Perform Multi-Channel Measurements
SKF Microlog - GX Series 4 - 23 User Manual
Multi-Channel Measurement Displays
Two Channel Spectral Displays
Figure 4 - 14. A Two Channel Spectral Display Screen.
In a two channel display, the top trace displays the first channel, the lower trace displays the second channel. Boost values and cursor moves are applied to both traces, whether displayed or hidden.
Reference the Multi Channel Cursor, Display, Expand, and Full Scale Adjustments section later in this chapter for more information.
View menu options for two channel displays are:
FFT for CH1, 2
Power Cepstrum for CH1, 2
Power Spectrum for CH1, 2
FFT for CH1
FFT for CH2
FFT+Power Cepstrum for CH1
FFT+Power Spectrum for CH1
FFT+Power Cepstrum for CH2
FFT+Power Spectrum for CH2
Table of peaks for CH1, 2
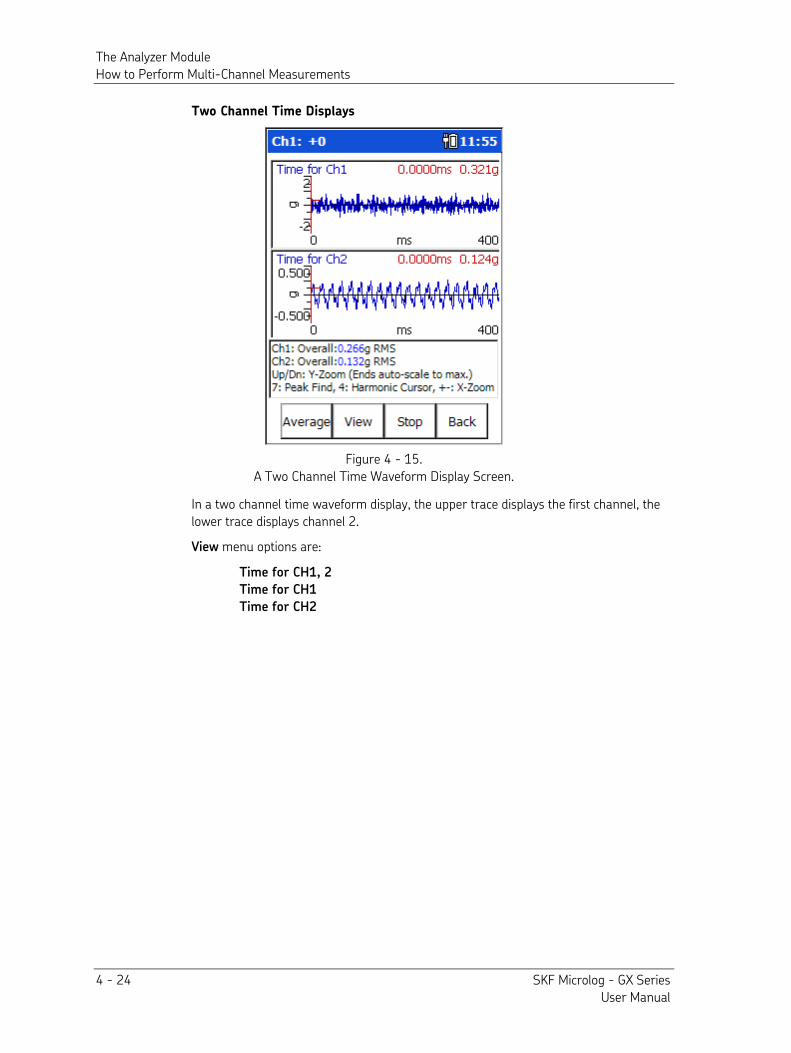
The Analyzer Module How to Perform Multi-Channel Measurements
4 - 24 SKF Microlog - GX Series User Manual
Two Channel Time Displays
Figure 4 - 15. A Two Channel Time Waveform Display Screen.
In a two channel time waveform display, the upper trace displays the first channel, the lower trace displays channel 2.
View menu options are:
Time for CH1, 2
Time for CH1
Time for CH2
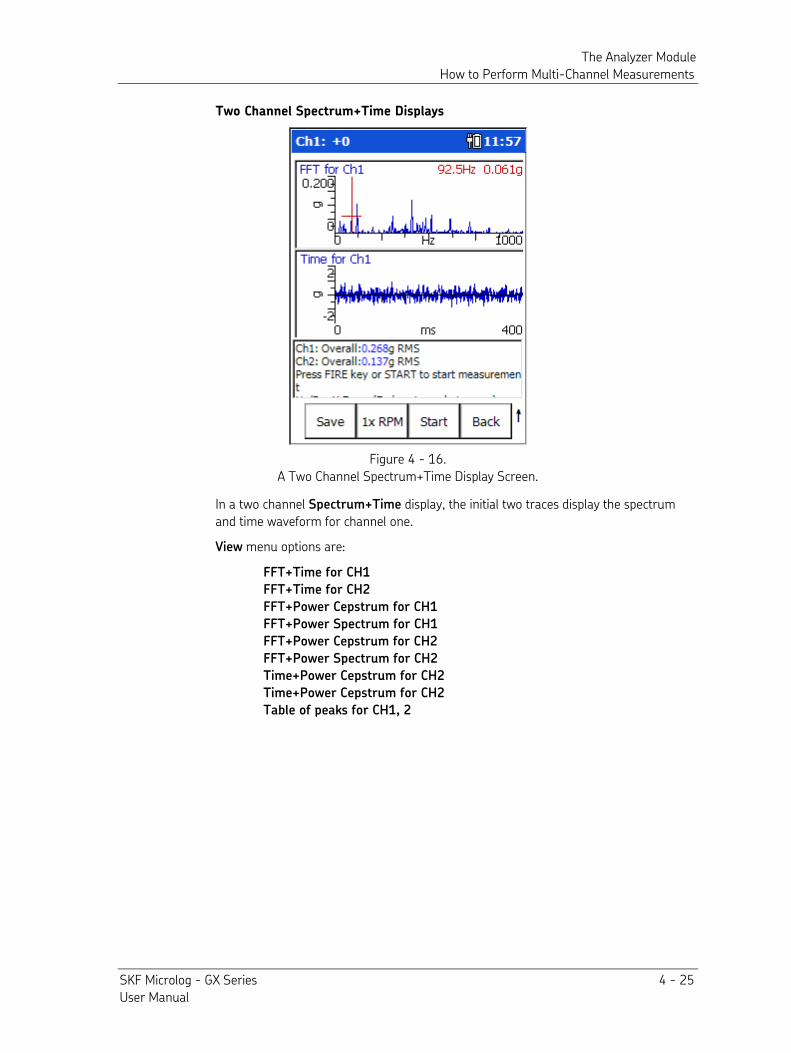
The Analyzer Module How to Perform Multi-Channel Measurements
SKF Microlog - GX Series 4 - 25 User Manual
Two Channel Spectrum+Time Displays
Figure 4 - 16. A Two Channel Spectrum+Time Display Screen.
In a two channel Spectrum+Time display, the initial two traces display the spectrum and time waveform for channel one.
View menu options are:
FFT+Time for CH1
FFT+Time for CH2
FFT+Power Cepstrum for CH1
FFT+Power Spectrum for CH1
FFT+Power Cepstrum for CH2
FFT+Power Spectrum for CH2
Time+Power Cepstrum for CH2
Time+Power Cepstrum for CH2
Table of peaks for CH1, 2
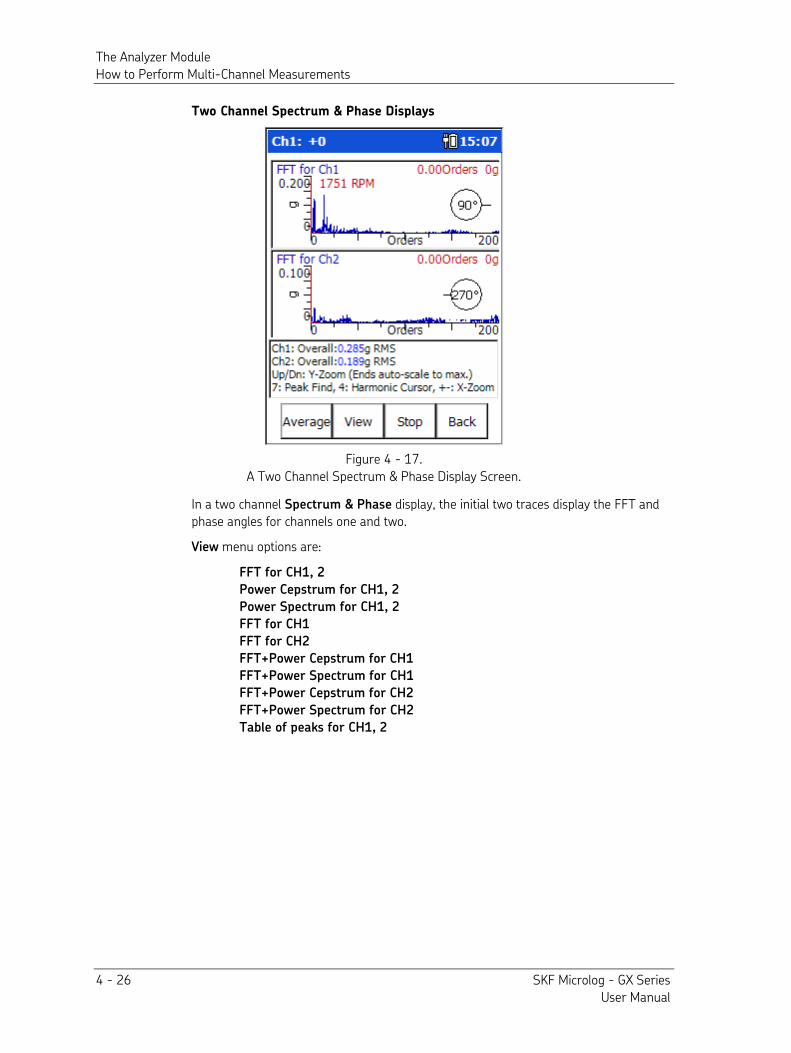
The Analyzer Module How to Perform Multi-Channel Measurements
4 - 26 SKF Microlog - GX Series User Manual
Two Channel Spectrum & Phase Displays
Figure 4 - 17. A Two Channel Spectrum & Phase Display Screen.
In a two channel Spectrum & Phase display, the initial two traces display the FFT and phase angles for channels one and two.
View menu options are:
FFT for CH1, 2
Power Cepstrum for CH1, 2
Power Spectrum for CH1, 2
FFT for CH1
FFT for CH2
FFT+Power Cepstrum for CH1
FFT+Power Spectrum for CH1
FFT+Power Cepstrum for CH2
FFT+Power Spectrum for CH2
Table of peaks for CH1, 2
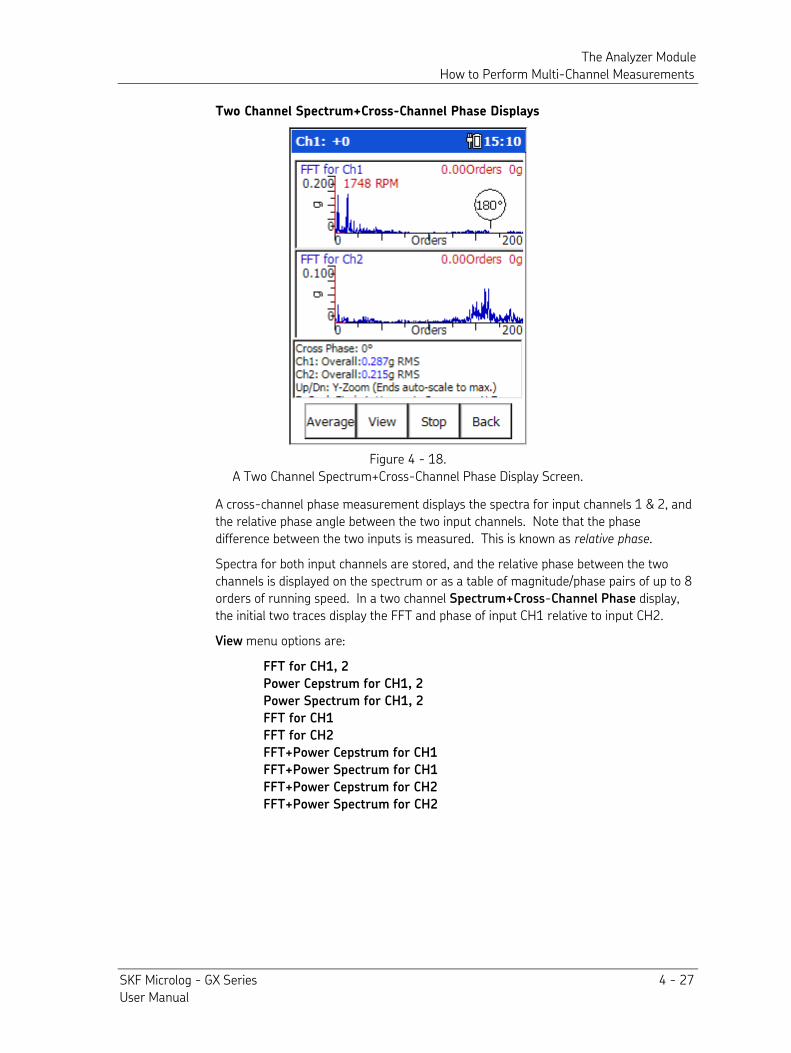
The Analyzer Module How to Perform Multi-Channel Measurements
SKF Microlog - GX Series 4 - 27 User Manual
Two Channel Spectrum+Cross-Channel Phase Displays
Figure 4 - 18. A Two Channel Spectrum+Cross-Channel Phase Display Screen.
A cross-channel phase measurement displays the spectra for input channels 1 & 2, and the relative phase angle between the two input channels. Note that the phase difference between the two inputs is measured. This is known as relative phase.
Spectra for both input channels are stored, and the relative phase between the two channels is displayed on the spectrum or as a table of magnitude/phase pairs of up to 8 orders of running speed. In a two channel Spectrum+Cross-Channel Phase display, the initial two traces display the FFT and phase of input CH1 relative to input CH2.
View menu options are:
FFT for CH1, 2
Power Cepstrum for CH1, 2
Power Spectrum for CH1, 2
FFT for CH1
FFT for CH2
FFT+Power Cepstrum for CH1
FFT+Power Spectrum for CH1
FFT+Power Cepstrum for CH2
FFT+Power Spectrum for CH2
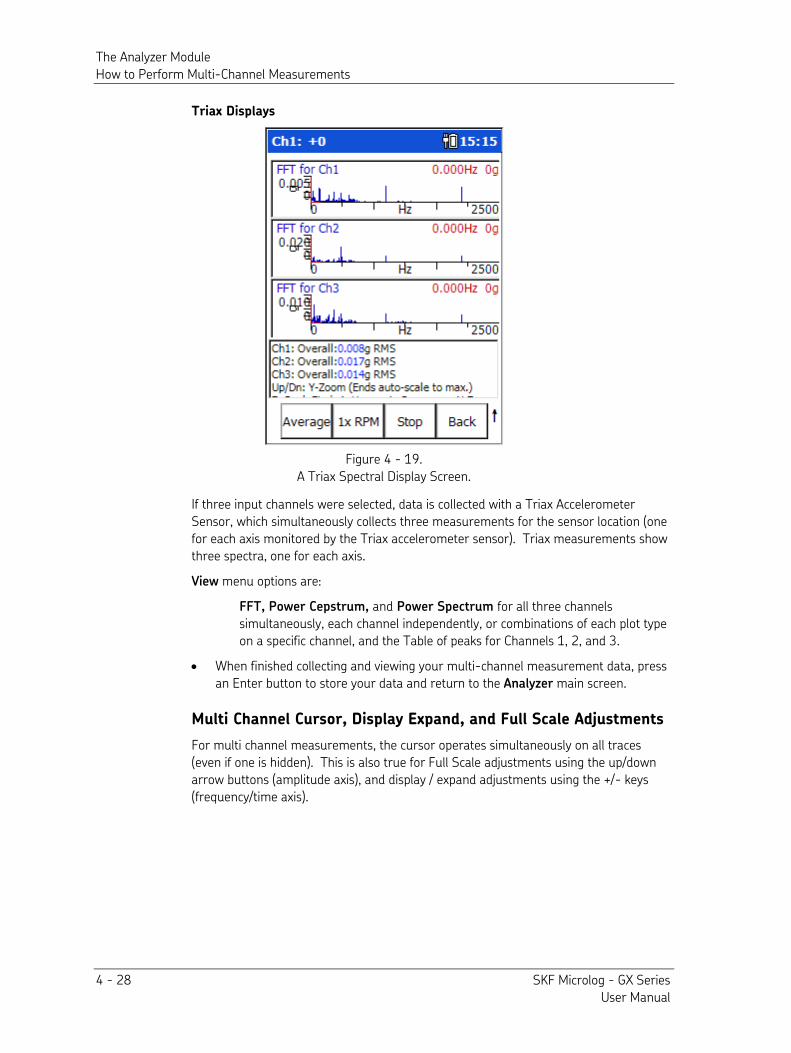
The Analyzer Module How to Perform Multi-Channel Measurements
4 - 28 SKF Microlog - GX Series User Manual
Triax Displays
Figure 4 - 19. A Triax Spectral Display Screen.
If three input channels were selected, data is collected with a Triax Accelerometer Sensor, which simultaneously collects three measurements for the sensor location (one for each axis monitored by the Triax accelerometer sensor). Triax measurements show three spectra, one for each axis.
View menu options are:
FFT, Power Cepstrum, and Power Spectrum for all three channels simultaneously, each channel independently, or combinations of each plot type on a specific channel, and the Table of peaks for Channels 1, 2, and 3.
• When finished collecting and viewing your multi-channel measurement data, press an Enter button to store your data and return to the Analyzer main screen.
Multi Channel Cursor, Display Expand, and Full Scale Adjustments
For multi channel measurements, the cursor operates simultaneously on all traces (even if one is hidden). This is also true for Full Scale adjustments using the up/down arrow buttons (amplitude axis), and display / expand adjustments using the +/- keys (frequency/time axis).
The Analyzer Module How to Measure Shaft Orbit
SKF Microlog - GX Series 4 - 29 User Manual
Independent Autoranging
For two channel measurements, autoranging is performed simultaneously on both channels. This allows you to use two probes of differing sensitivity, and allows you to analyze two axes of differing amplitudes while ensuring optimum gain setting for each channel.
In all cases, the same filters, integrator, and Fmax are used on both channels. However, input range and coupling are independent. For cross-channel phase, dual time and dual spectrum measurements, if the collection specification is "Overall and Spectrum or Overall Only" then the overall value shall be calculated from the spectrum as an RSS overall: there is no support for two channel analog overalls.
How to Measure Shaft Orbit
Orbit Overview
An “orbit” measures the path of a shaft centerline motion during rotation. Orbit measurements measure CH1 time vs. Ch2 time, unfiltered or order-filtered (up to 8 orders).
Typically, machines such as large centrifugal compressors, primary and secondary steam turbines, and large gearboxes do not have standby systems available and rarely have spare rotors available. Machinery that uses pressure fed sleeve bearings is normally both critical to plant operations and very expensive to repair. It is therefore essential that these rotors are effectively monitored, protected, and maintained to the highest standard.
Orbit measurements may be quickly applied using their factory default settings, or you may change their settings and then perform the measurement. We’ll first describe how to perform orbit measurements using the default configuration.
How to Take Orbit Data
To perform an orbit measurement (using its default settings):
• From the Analyzer screen use the arrow keys to highlight the Orbit icon, and press the Start function button. The measurement is performed and the initial measurement results display.
If you highlight a measurement’s icon and press the Enter (Fire) button instead of the Start function button, you will display the measurement’s setup screen, not start the measurement.
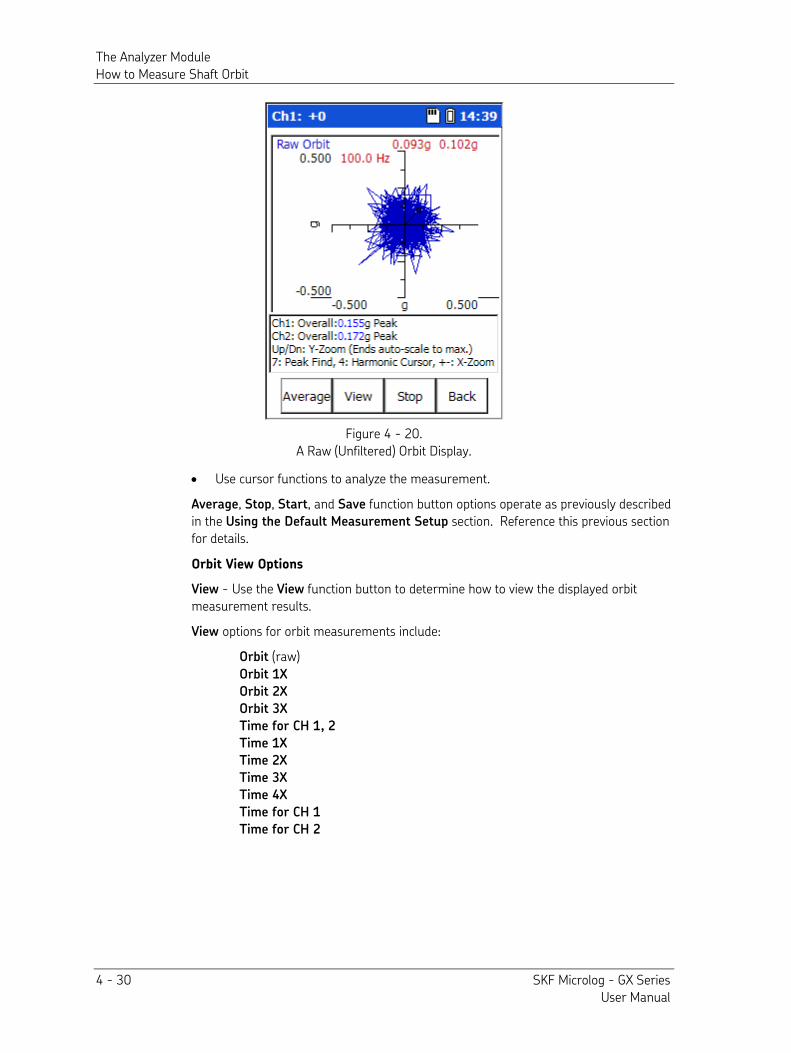
The Analyzer Module How to Measure Shaft Orbit
4 - 30 SKF Microlog - GX Series User Manual
Figure 4 - 20. A Raw (Unfiltered) Orbit Display.
• Use cursor functions to analyze the measurement.
Average, Stop, Start, and Save function button options operate as previously described in the Using the Default Measurement Setup section. Reference this previous section for details.
Orbit View Options
View - Use the View function button to determine how to view the displayed orbit measurement results.
View options for orbit measurements include:
Orbit (raw)
Orbit 1X
Orbit 2X
Orbit 3X
Time for CH 1, 2
Time 1X
Time 2X
Time 3X
Time 4X
Time for CH 1
Time for CH 2
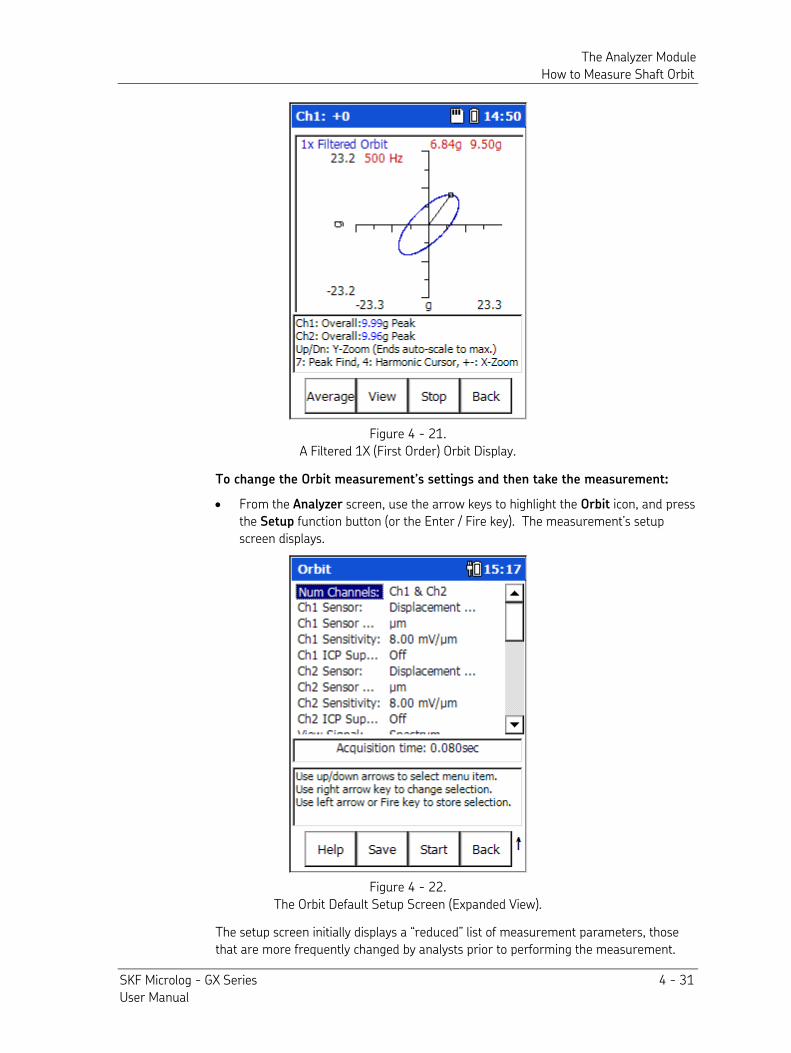
The Analyzer Module How to Measure Shaft Orbit
SKF Microlog - GX Series 4 - 31 User Manual
Figure 4 - 21. A Filtered 1X (First Order) Orbit Display.
To change the Orbit measurement’s settings and then take the measurement:
• From the Analyzer screen, use the arrow keys to highlight the Orbit icon, and press the Setup function button (or the Enter / Fire key). The measurement’s setup screen displays.
Figure 4 - 22. The Orbit Default Setup Screen (Expanded View).
The setup screen initially displays a “reduced” list of measurement parameters, those that are more frequently changed by analysts prior to performing the measurement.
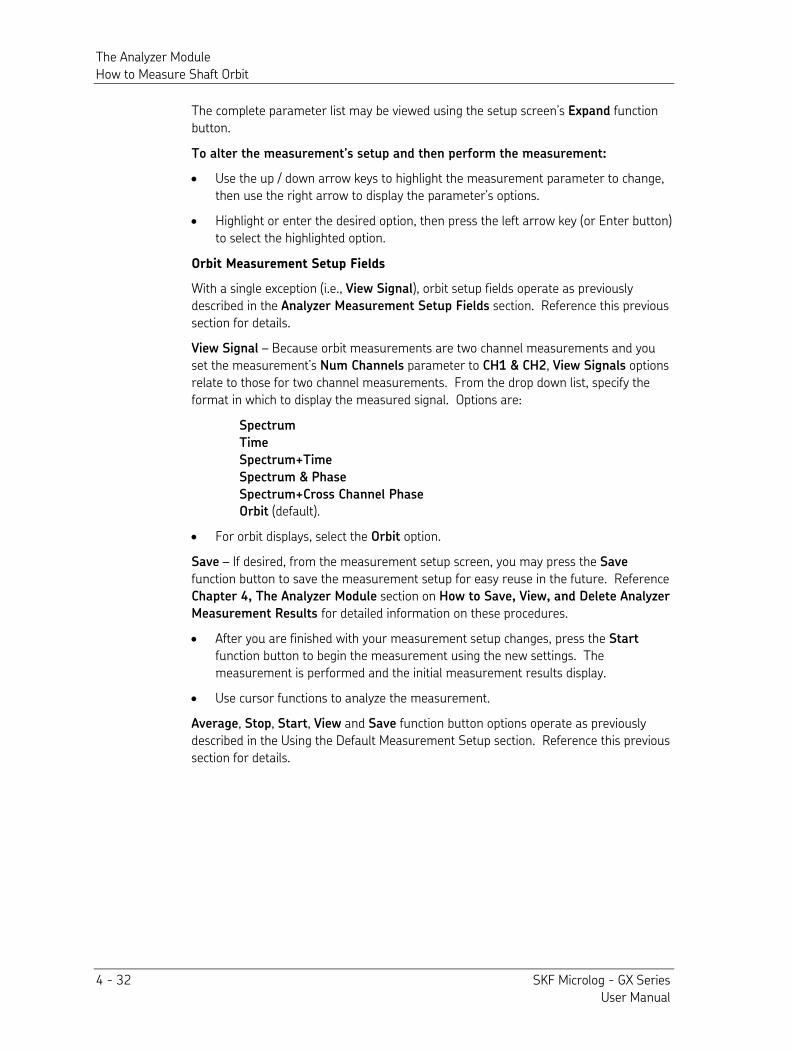
The Analyzer Module How to Measure Shaft Orbit
4 - 32 SKF Microlog - GX Series User Manual
The complete parameter list may be viewed using the setup screen’s Expand function button.
To alter the measurement’s setup and then perform the measurement:
• Use the up / down arrow keys to highlight the measurement parameter to change, then use the right arrow to display the parameter’s options.
• Highlight or enter the desired option, then press the left arrow key (or Enter button) to select the highlighted option.
Orbit Measurement Setup Fields
With a single exception (i.e., View Signal), orbit setup fields operate as previously described in the Analyzer Measurement Setup Fields section. Reference this previous section for details.
View Signal – Because orbit measurements are two channel measurements and you set the measurement’s Num Channels parameter to CH1 & CH2, View Signals options relate to those for two channel measurements. From the drop down list, specify the format in which to display the measured signal. Options are:
Spectrum
Time
Spectrum+Time
Spectrum & Phase
Spectrum+Cross Channel Phase
Orbit (default).
• For orbit displays, select the Orbit option.
Save – If desired, from the measurement setup screen, you may press the Save function button to save the measurement setup for easy reuse in the future. Reference Chapter 4, The Analyzer Module section on How to Save, View, and Delete Analyzer
Measurement Results for detailed information on these procedures.
• After you are finished with your measurement setup changes, press the Start function button to begin the measurement using the new settings. The measurement is performed and the initial measurement results display.
• Use cursor functions to analyze the measurement.
Average, Stop, Start, View and Save function button options operate as previously described in the Using the Default Measurement Setup section. Reference this previous section for details.
The Analyzer Module How to Perform a Bump Test
SKF Microlog - GX Series 4 - 33 User Manual
How to Perform a Bump Test
Overview
Warning - Due to required accessories, this module is not for use in Class I Division 2 hazardous locations. Restrictions apply when used in ATEX zone 2 hazardous locations. Reference this manual's Appendix D, Safety Instructions for details.
A bump test (also called a hammer test) determines the natural frequencies of a machine or a structure. The idea behind the test is that when an object is impacted or “bumped,” the object's natural or resonant frequencies are excited. If a spectrum is taken while the object is vibrating due to the impact, spectral peaks result, pinpointing the object's natural frequencies. A Microlog analyzer can be used to capture this vibration response and to display a spectrum showing the resonant or natural frequencies.
Why Do a Bump Test?
Vibration forces transmitted by rotating machines often excite natural resonances in attached structures. Whenever such structural resonances appear, vibration responses are amplified and can result in fatigue failures. Structural resonances can also mask the cause of a machine's vibration, making it difficult to implement corrective machine maintenance. Bump tests identify a structure's resonant modes and provide a maintenance engineer the opportunity to change the resonance frequency so as to reduce or eliminate damaging vibration.
To Perform a Bump Test
To Perform the Bump Test Using the Default Setup
• Attach the accelerometer to the test object (machine case or structure).
• From the Analyzer screen, use the arrow keys to highlight the Bump Test icon, and press the Start function button. The measurement is performed and the initial measurement results display.
If you highlight a measurement’s icon and press the Enter (Fire) button instead of the Start function button, you will display the measurement’s setup screen, not start the measurement.
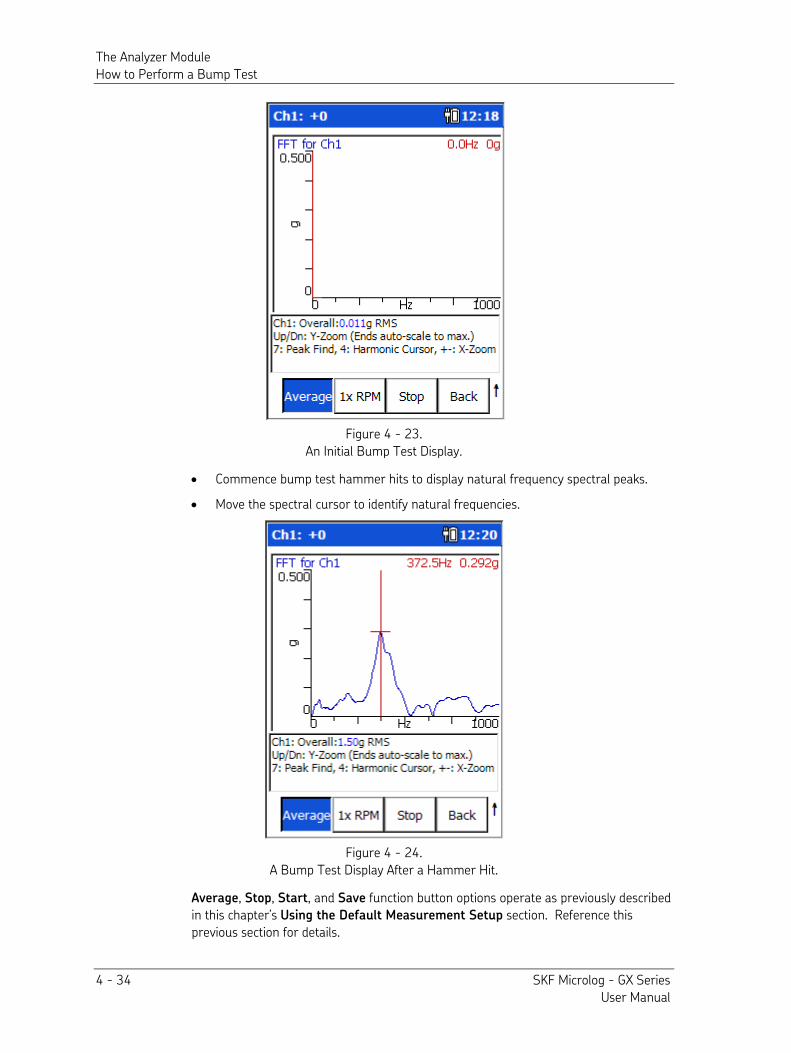
The Analyzer Module How to Perform a Bump Test
4 - 34 SKF Microlog - GX Series User Manual
Figure 4 - 23. An Initial Bump Test Display.
• Commence bump test hammer hits to display natural frequency spectral peaks.
• Move the spectral cursor to identify natural frequencies.
Figure 4 - 24. A Bump Test Display After a Hammer Hit.
Average, Stop, Start, and Save function button options operate as previously described in this chapter’s Using the Default Measurement Setup section. Reference this previous section for details.
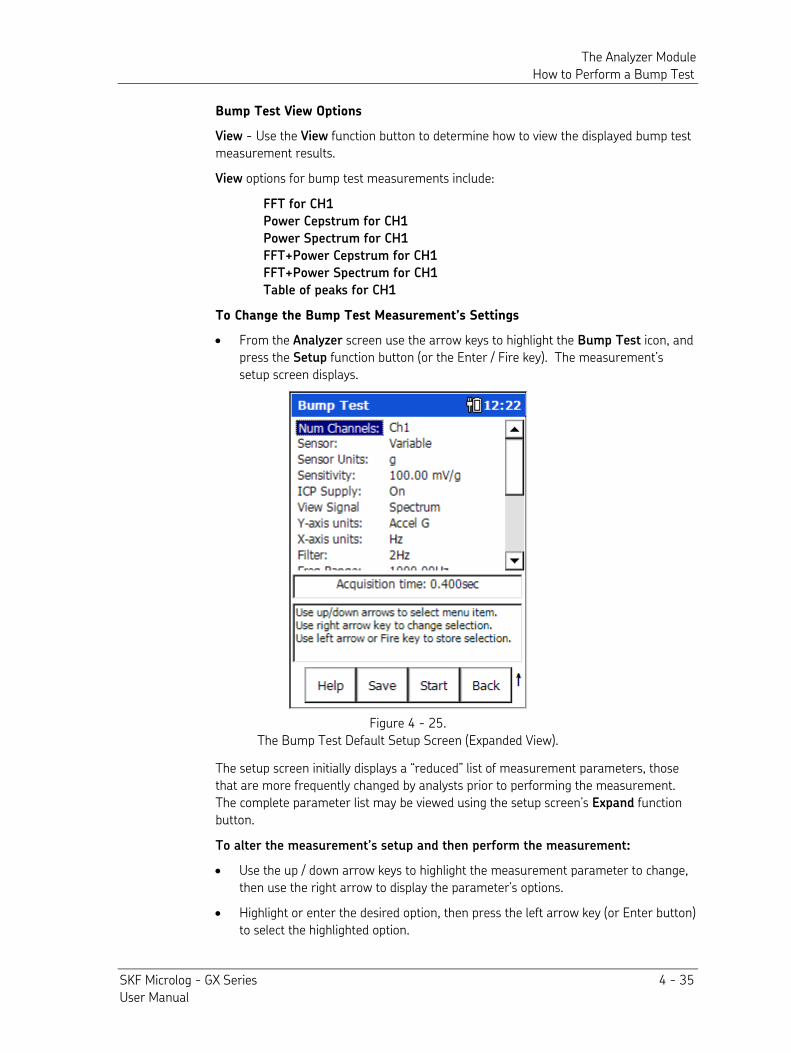
The Analyzer Module How to Perform a Bump Test
SKF Microlog - GX Series 4 - 35 User Manual
Bump Test View Options
View - Use the View function button to determine how to view the displayed bump test measurement results.
View options for bump test measurements include:
FFT for CH1
Power Cepstrum for CH1
Power Spectrum for CH1
FFT+Power Cepstrum for CH1
FFT+Power Spectrum for CH1
Table of peaks for CH1
To Change the Bump Test Measurement’s Settings
• From the Analyzer screen use the arrow keys to highlight the Bump Test icon, and press the Setup function button (or the Enter / Fire key). The measurement’s setup screen displays.
Figure 4 - 25. The Bump Test Default Setup Screen (Expanded View).
The setup screen initially displays a “reduced” list of measurement parameters, those that are more frequently changed by analysts prior to performing the measurement. The complete parameter list may be viewed using the setup screen’s Expand function button.
To alter the measurement’s setup and then perform the measurement:
• Use the up / down arrow keys to highlight the measurement parameter to change, then use the right arrow to display the parameter’s options.
• Highlight or enter the desired option, then press the left arrow key (or Enter button) to select the highlighted option.
The Analyzer Module How to Perform Motor Current Measurements
4 - 36 SKF Microlog - GX Series User Manual
Bump Test Measurement Setup Fields
Bump test setup fields operate as previously described in the Analyzer Measurement
Setup Fields section. Reference this previous section for details.
Save – If desired, from the measurement setup screen, you may press the Save function button to save the measurement setup for easy reuse in the future. Reference Chapter 4, The Analyzer Module section on How to Save, View, and Delete Analyzer
Measurement Results for detailed information on these procedures.
• After you are finished with your measurement setup changes, press the Start function button to begin the measurement using the new settings. The measurement is performed and the initial measurement results display.
• Use cursor functions to analyze the measurement.
Average, Stop, Start, View and Save function button options operate as previously described in the Using the Default Measurement Setup section. Reference this previous section for details.
How to Perform Motor Current Measurements
Overview
The Analyzer’s Motor Current option simplifies the process of analyzing and diagnosing AC induction motor rotor bar defects. The Microlog’s Motor Current option acquires the signal from an SKF CMAC 5208 current clamp and produces a very high definition spectrum on its display. The analyst can then view the spectrum to differentiate between the motor slip frequency and the electrical frequency and observe the sidebands. Once these are measured, the operator needs to determine by calculation whether there is an indication of high resistance or broken rotor bars. The collected motor current data resides in the Microlog.
The Microlog is a four channel analyzer, so you can use three motor current clamps and look at all three phases simultaneously.
Warning - Due to required accessories, this module is not for use in Class I Division 2 hazardous locations. Restrictions apply when used in ATEX zone 2 hazardous locations. Reference this manual's Appendix D, Safety Instructions for details.
To Perform a Motor Current Test
To Perform the Motor Current Test Using the Default Setup
• Connect the motor current clamp(s) to the monitored motor as required.
• From the Analyzer screen, use the arrow keys to highlight the Motor Current icon, and press the Start function button. The measurement is performed and the initial measurement results display.
If you highlight a measurement’s icon and press the Enter / Fire button instead of the Start function button, you will display the measurement’s setup screen, not start the measurement.
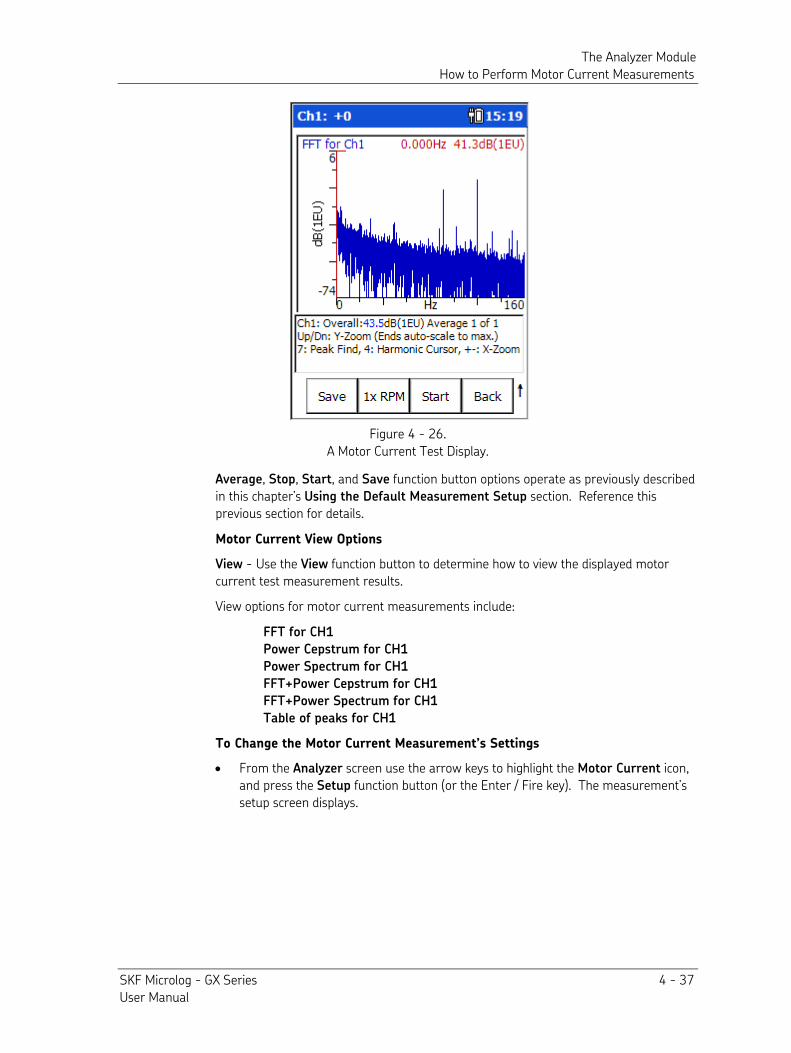
The Analyzer Module How to Perform Motor Current Measurements
SKF Microlog - GX Series 4 - 37 User Manual
Figure 4 - 26. A Motor Current Test Display.
Average, Stop, Start, and Save function button options operate as previously described in this chapter’s Using the Default Measurement Setup section. Reference this previous section for details.
Motor Current View Options
View - Use the View function button to determine how to view the displayed motor current test measurement results.
View options for motor current measurements include:
FFT for CH1
Power Cepstrum for CH1
Power Spectrum for CH1
FFT+Power Cepstrum for CH1
FFT+Power Spectrum for CH1
Table of peaks for CH1
To Change the Motor Current Measurement’s Settings
• From the Analyzer screen use the arrow keys to highlight the Motor Current icon, and press the Setup function button (or the Enter / Fire key). The measurement’s setup screen displays.
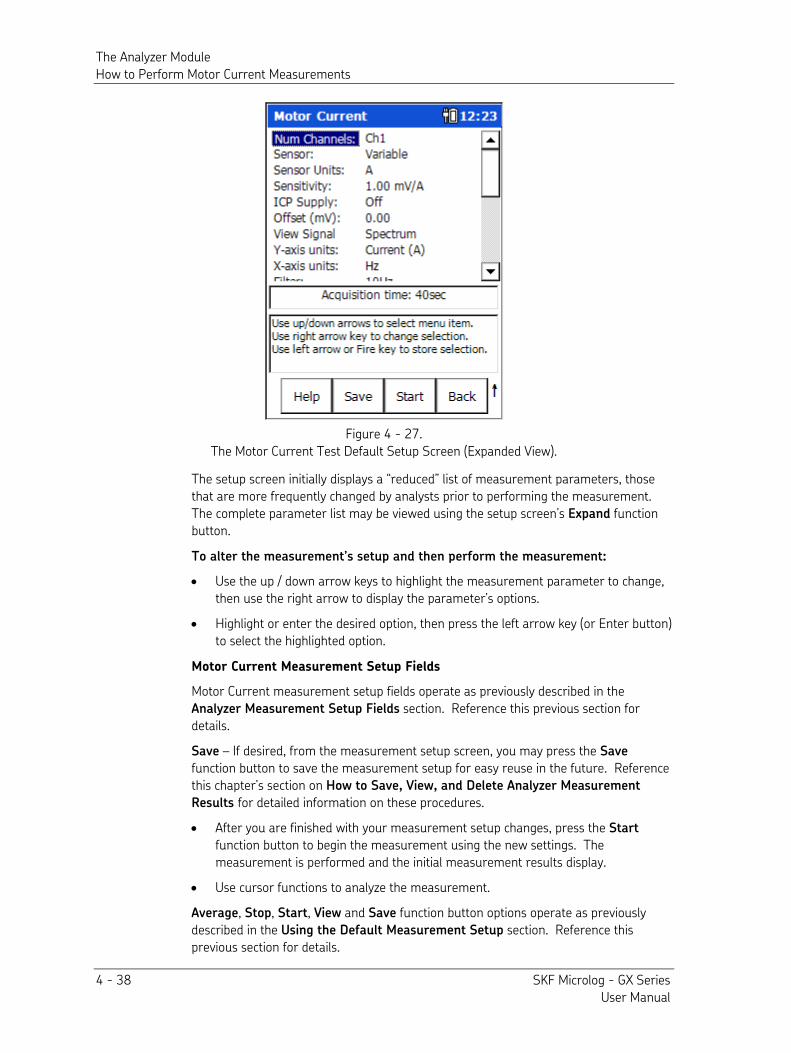
The Analyzer Module How to Perform Motor Current Measurements
4 - 38 SKF Microlog - GX Series User Manual
Figure 4 - 27. The Motor Current Test Default Setup Screen (Expanded View).
The setup screen initially displays a “reduced” list of measurement parameters, those that are more frequently changed by analysts prior to performing the measurement. The complete parameter list may be viewed using the setup screen’s Expand function button.
To alter the measurement’s setup and then perform the measurement:
• Use the up / down arrow keys to highlight the measurement parameter to change, then use the right arrow to display the parameter’s options.
• Highlight or enter the desired option, then press the left arrow key (or Enter button) to select the highlighted option.
Motor Current Measurement Setup Fields
Motor Current measurement setup fields operate as previously described in the Analyzer Measurement Setup Fields section. Reference this previous section for details.
Save – If desired, from the measurement setup screen, you may press the Save function button to save the measurement setup for easy reuse in the future. Reference this chapter’s section on How to Save, View, and Delete Analyzer Measurement
Results for detailed information on these procedures.
• After you are finished with your measurement setup changes, press the Start function button to begin the measurement using the new settings. The measurement is performed and the initial measurement results display.
• Use cursor functions to analyze the measurement.
Average, Stop, Start, View and Save function button options operate as previously described in the Using the Default Measurement Setup section. Reference this previous section for details.
SKF Microlog - GX Series 5 - 1 User Manual
5
Machinery Balancing Module
Microlog Balancing Overview
The easy to use Microlog Balancing application resolves single-plane, two-plane, and static-couple balances with high precision. Clear, comprehensive setup menus and easy-to-follow display screens with graphical data representations make for easy operation.
Warning - Due to required accessories, this module is not for use in Class I Division 2 hazardous locations. Restrictions apply when used in ATEX zone 2 hazardous locations. Reference this manual's Appendix D, Safety Instructions for details.
The Microlog is designed to interface with off-the-shelf laser tachometers, optical tachometers, or stroboscopes for balancing phase measurements.
For focus and ease of use, this chapter overviews and details Microlog procedures for single-plane, two-plane, and static-couple balancing in separate sections.
Measurement Trigger Requirements
Machine balancing requires a 1 X trigger signal. The trigger signal is normally obtained from the ± TTL output of one of four triggers: • Buffered outputs
• Laser tachometer • Reflective systems
• SKF StrobeLite
Single-Plane Balancing Overview
Regardless of whether you are performing a single or two-plane balancing procedure, all balancing procedures progress through basic “runs” as you start (spin) and stop the rotor.
For two-plane procedures, you perform some of the runs twice, once with weights on correction plane one and again with weights on correction plane two. For simplicity, the following example describes a single-plane procedure.
1 - Set Up Balancing Equipment and Measurement Parameters
Stop - First, with the machine stopped, set up the balancing equipment and mark your tachometer reference point on the rotor or shaft. Use Microlog Setup menu options to configure balancing measurement parameters for the balancing run sequence.
Machinery Balancing Module Single-Plane Balancing Overview
5 - 2 SKF Microlog - GX Series User Manual
2 - Perform the Reference Run
Spin - Start the machine and perform a reference run. The reference run simply provides a “starting place” for balancing computations. It records the machine's initial imbalance (1X vibration magnitude and phase angle). Later in the procedure, reference run data is automatically compared with trial (weight) run data to calibrate the machine's imbalance.
3 - Attach a Trial Weight
Stop - After collecting reference run data, stop the machine and add a trial weight. A trial weight is a temporary weight attached to produce a change from the original unbalance readings (reference run readings). Input the trial weight amount and placement angle into the Microlog.
4 - Perform the Trial Run
Spin - With the trial weight securely attached, start the machine again, and perform a trial run with the trial weight. The trial run calibrates the machine's unbalance and allows the Microlog to calculate the influence coefficient and permanent correction weight amount and placement.
To allow for accurate balancing computations, the trial weight should pass the 30/30 rule. The trial weight should:
• A - Increase or decrease the 1X vibration amplitude by at least 30%, or
• B - Change the phase angle by at least 30 degrees, or
• C - A combination of A and B.
5 - Attach the Permanent Correction Weight
Stop - Stop the machine, remove the trial weight, then attach the specified correction weight at the specified angle.
6 - Perform a Correction Weight Run
Spin - Start the machine again, and perform a correction weight run. The correction weight run performs two functions:
• It calculates the amount of residual imbalance with the correction weight in place to confirm that the machine is now balanced within tolerances.
• If further balancing is necessary, it automatically applies the influence coefficient to calculate additional “trim” weights that can be added to further balance the machine.
7 - If Necessary, Attach a Trim Weight
Stop - If additional trim weights are necessary to balance the machine within tolerances, stop the machine and attach the specified trim weights.
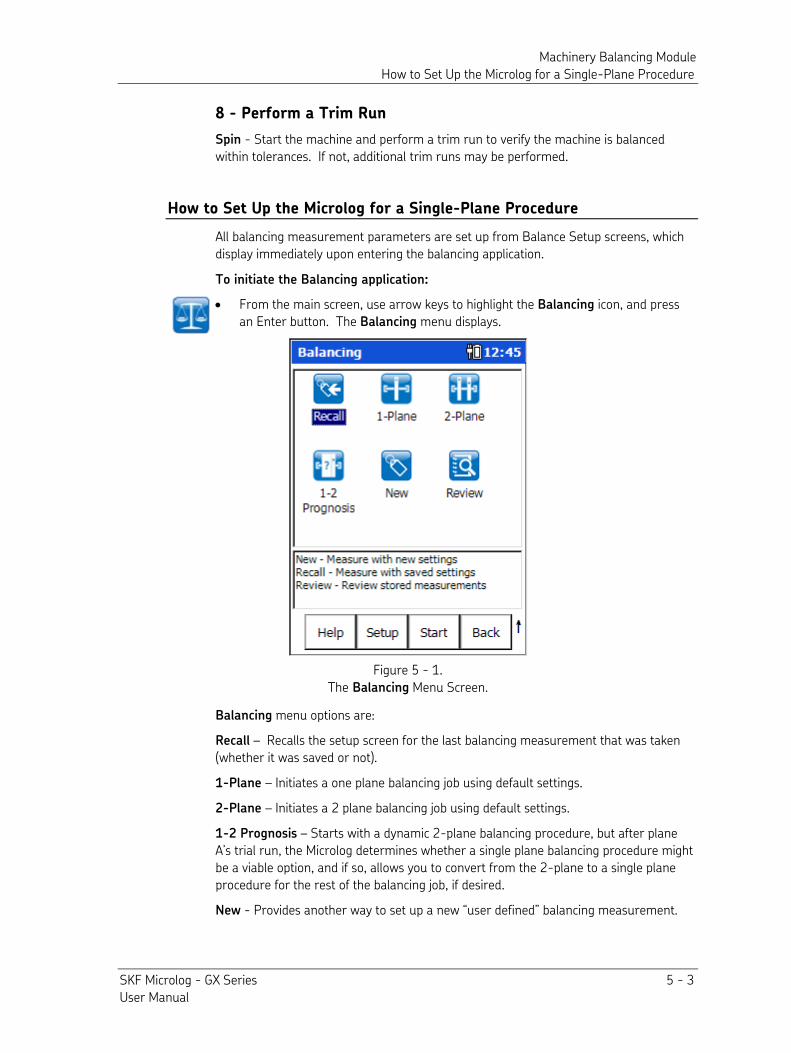
Machinery Balancing Module How to Set Up the Microlog for a Single-Plane Procedure
SKF Microlog - GX Series 5 - 3 User Manual
8 - Perform a Trim Run
Spin - Start the machine and perform a trim run to verify the machine is balanced within tolerances. If not, additional trim runs may be performed.
How to Set Up the Microlog for a Single-Plane Procedure
All balancing measurement parameters are set up from Balance Setup screens, which display immediately upon entering the balancing application.
To initiate the Balancing application:
• From the main screen, use arrow keys to highlight the Balancing icon, and press an Enter button. The Balancing menu displays.
Figure 5 - 1. The Balancing Menu Screen.
Balancing menu options are:
Recall – Recalls the setup screen for the last balancing measurement that was taken (whether it was saved or not).
1-Plane – Initiates a one plane balancing job using default settings.
2-Plane – Initiates a 2 plane balancing job using default settings.
1-2 Prognosis – Starts with a dynamic 2-plane balancing procedure, but after plane A’s trial run, the Microlog determines whether a single plane balancing procedure might be a viable option, and if so, allows you to convert from the 2-plane to a single plane procedure for the rest of the balancing job, if desired.
New - Provides another way to set up a new “user defined” balancing measurement.
Machinery Balancing Module How to Set Up the Microlog for a Single-Plane Procedure
5 - 4 SKF Microlog - GX Series User Manual
Review –Initiates the Balance – Review Data screen allowing you to review previously saved balancing measurement data or saved balancing measurement setups.
Function Buttons
Function buttons at the bottom of the Balancing screen include:
Help – Displays the Microlog’s context sensitive help screen.
Setup – Displays the measurement setup screen for the highlighted measurement type (i.e., Recall, 1-Plane, 2-Plane, 1-2 Prognosis, or New).
Start – Begin a balancing job using the currently highlighted icon’s settings.
Back – Returns you the Microlog’s Main Menu screen.
Press the Shift button (0 / up arrow) to access alternate function buttons:
Review – Displays the Balance – Review Data screen where you may review previously saved Balancing measurement results and saved measurement setups.
Cont. - – Press the Cont.- function button to decrease graphic display contrast.
Cont. + – Press the Cont. + function button to increase graphic display contrast.
The Balance Setup Screen
After setting up your balance measuring equipment and marking your tachometer reference point, the next step is to configure balancing measurement parameters for the balancing run sequence.
• On the Microlog, select Balancing from the main menu. The Balancing menu displays.
• For a single plane balance job, select the 1-Plane icon, and then press the Setup function button. The 1-Plane setup screen displays.
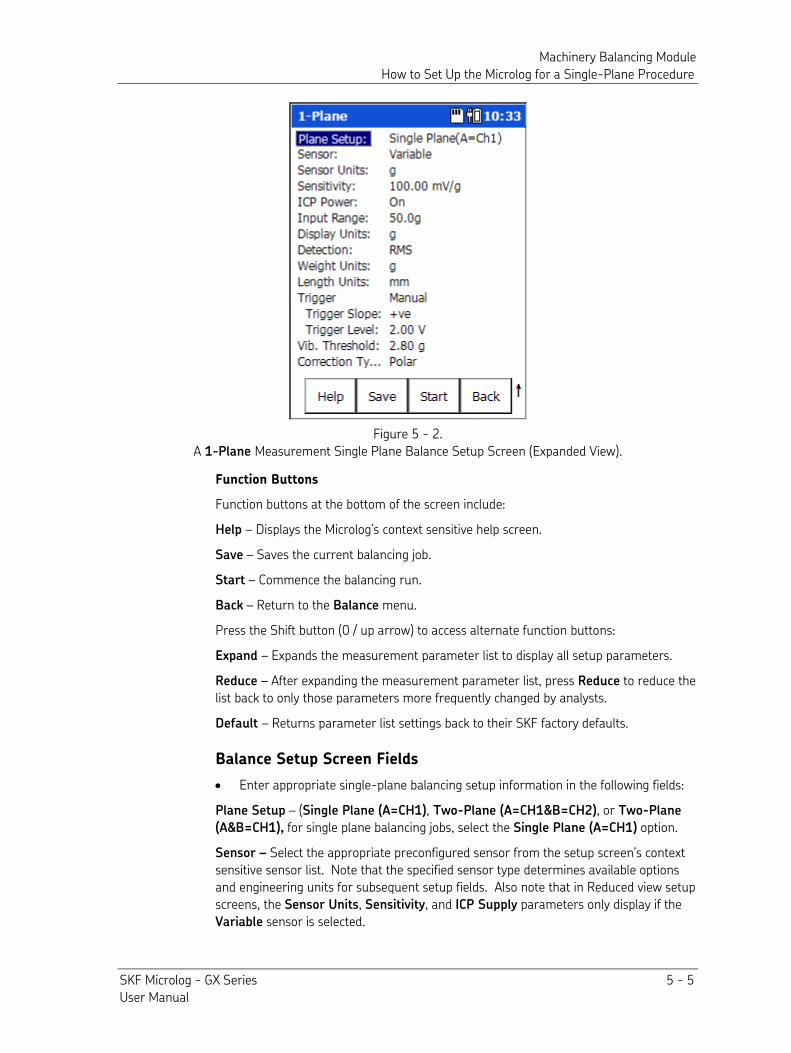
Machinery Balancing Module How to Set Up the Microlog for a Single-Plane Procedure
SKF Microlog - GX Series 5 - 5 User Manual
Figure 5 - 2. A 1-Plane Measurement Single Plane Balance Setup Screen (Expanded View).
Function Buttons
Function buttons at the bottom of the screen include:
Help – Displays the Microlog’s context sensitive help screen.
Save – Saves the current balancing job.
Start – Commence the balancing run.
Back – Return to the Balance menu.
Press the Shift button (0 / up arrow) to access alternate function buttons:
Expand – Expands the measurement parameter list to display all setup parameters.
Reduce – After expanding the measurement parameter list, press Reduce to reduce the list back to only those parameters more frequently changed by analysts.
Default – Returns parameter list settings back to their SKF factory defaults.
Balance Setup Screen Fields
• Enter appropriate single-plane balancing setup information in the following fields:
Plane Setup – (Single Plane (A=CH1), Two-Plane (A=CH1&B=CH2), or Two-Plane
(A&B=CH1), for single plane balancing jobs, select the Single Plane (A=CH1) option.
Sensor – Select the appropriate preconfigured sensor from the setup screen’s context sensitive sensor list. Note that the specified sensor type determines available options and engineering units for subsequent setup fields. Also note that in Reduced view setup screens, the Sensor Units, Sensitivity, and ICP Supply parameters only display if the Variable sensor is selected.
Machinery Balancing Module How to Set Up the Microlog for a Single-Plane Procedure
5 - 6 SKF Microlog - GX Series User Manual
The Variable sensor option allows you to configure settings for a sensor that is not on the sensor list.
Typically, accelerometers are used to perform velocity measurements for field balancing procedures.
A Manual Entry option is available at the end of the list for manual balancing data entry, allowing you to review and change balancing run data. If selected, you are prompted to manually enter the running speed, vibration magnitude, and phase angle for the balancing runs.
Sensor Units – (Not editable if a preconfigured sensor is selected in the Sensor field.) When the Variable sensor is selected, select the measurement units to use for the type of sensor being used. Options include g, in/s, or mil.
Sensitivity – (Not editable if a preconfigured sensor is selected in the Sensor field.) When the Variable sensor is selected, use the alphanumeric keypad to enter transducer sensitivity in millivolts (mV) per Engineering Unit (EU).
Input Range – (Available only if the system Setup menu’s Input Range setting is set to Sensor Units.) Select the signal input range as a fixed range in transducer units in a 1 - 2 - 5 sequence. (The available fixed values vary depending on the transducer type being used.)
If a fixed range is selected and the Microlog detects an over range, it automatically selects the next higher range until it does not over range.
ICP Power – (On or Off), (Not editable if a preconfigured sensor is selected in the Sensor field.) When the Variable sensor is selected, select to turn ICP power Off or On for the sensor.
Display Units – Specify the unit of measurement for the select sensor type. The options available in the list vary depending on the sensor selected.
Detection – Determines signal detection and scaling. Detection options include Peak, Pk-Pk, and RMS. The default setting is Peak for acceleration and velocity, and Peak-to-Peak (Pk-Pk) for displacement.
Weight Units – Select the units of measurement used for your trial, correction, and trim weights. Options include: g, kg, cm, mm, oz, lb, in, EU or %.
Length Units – Select the units of measurement used for measuring the radius of the weight placement (from the shaft center to the position of the weight). Either inch, feet, EU. This information is used if you wish the Microlog to estimate your trial weight for you.
Trigger – Manual or Visual. (Available only if the Setup screen’s Trigger field is set to User.) Determines how the trigger level is entered when setting up measurements that require a trigger, either manually as numeric input in the subsequent Trigger Level field, or visually using a graphic representation of the trigger signal and trigger level.
Manual – When set to Manual, you will enter the trigger level in volts as numeric input in the Trigger Level setup field.
Machinery Balancing Module How to Set Up the Microlog for a Single-Plane Procedure
SKF Microlog - GX Series 5 - 7 User Manual
Visual – Displays the Set Trigger screen that shows a graphical representation of the tacho signal and trigger level (horizontal cursor). Use the up and down arrow keys to move the trigger cursor to the desired trigger level (typically between ½ and ¾ of the full trigger signal), and press OK. The Set Trigger screen closes, the Trigger setting changes to Manual and the visually specified trigger level numerically displays in the Trigger Level field.
Trigger Slope - Select +ve (plus) or –ve (minus) to determine whether the trigger occurs on the rising or descending edge of the trigger signal.
Trigger Level – Data entry field for manual trigger level input, or displays resulting trigger level when the trigger level is entered visually (see above Trigger explanation).
Vib. Threshold – The acceptable imbalance level you are trying to achieve. If the vibration magnitude is greater than this threshold, the magnitude bar is colored red when taking a reading. The bar turns green when the selected level of imbalance is achieved.
Correction Type – (Polar, Component, or Fixed Weight), Select the appropriate weight position type.
Polar - Specifies that weights may be placed at any placement position on the balance plane.
Component - (Also known as vector splitting) (Works with Number of
Components field.) Specifies that weights may be placed only at designated positions (e.g., rotors having a specific weight hole pattern, or with a specific number of fan blades, etc.).
Fixed Weight – (Works with the subsequent Fixed Weight field.) Specifies that you only have a specific weight value with which to work.
Num Components – (Applies to Correction Type / Component weight position measurements only.) Enter the number of weight positions, from three to 360.
The first position defaults to zero degrees, subsequent positions are evenly spaced.
Fixed Weight – (Applies to Correction Type / Fixed Weight weight position type only.) Assumes you have only one value of weight. For example, you only have 10 oz. weights and must use multiples of 10 oz to perform the balance. For example, you would use one 10 oz weight for the trial run, and the Microlog prompts you to use two 10 oz weights at one angle and one 10 oz weight at another angle for the correction weights. Enter the weight value you will use for the balancing process. The Microlog assumes that the Fixed
Weight is initially placed at 0 degrees.
The following parameters are fixed: Weight Direction - always Against Rotation Posn 1 Offset - always 0º
• If desired, press the Save function button to save the balance Setup selections for future use. The Balance – Save Setup screen displays. Refer to Chapter 4, The
Analyzer Module’s section on How to Save, View, and Delete Analyzer
Measurement Results for details on saving your measurement setups.
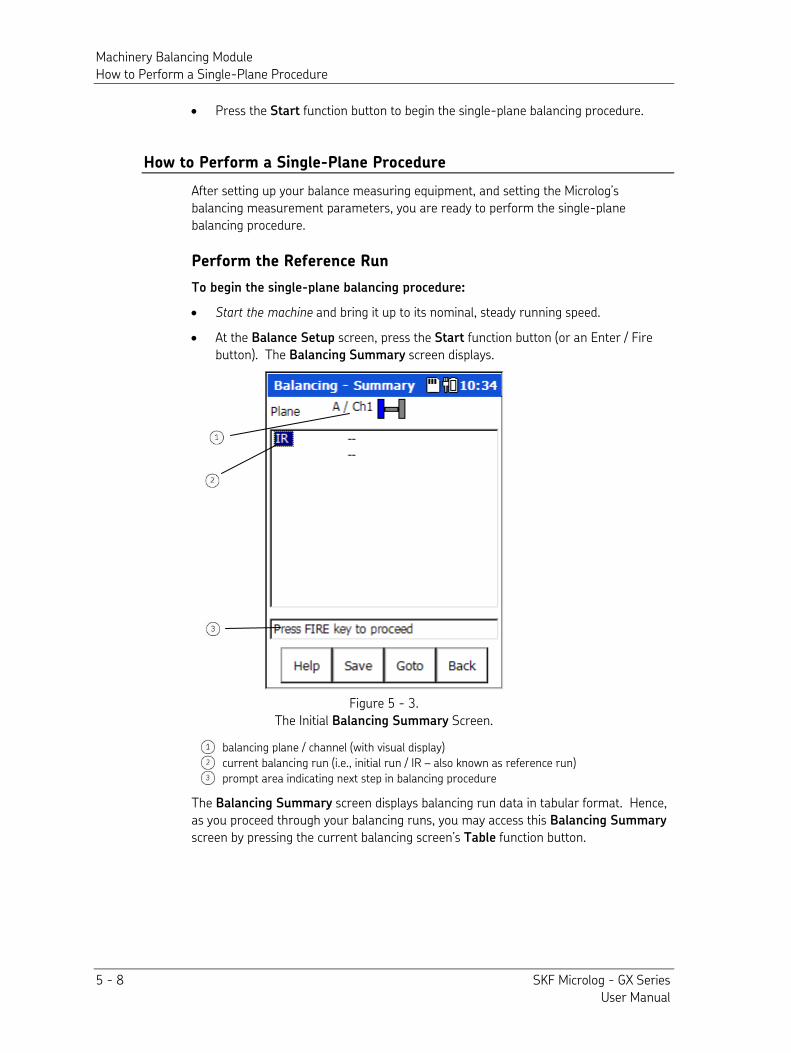
Machinery Balancing Module How to Perform a Single-Plane Procedure
5 - 8 SKF Microlog - GX Series User Manual
• Press the Start function button to begin the single-plane balancing procedure.
How to Perform a Single-Plane Procedure
After setting up your balance measuring equipment, and setting the Microlog’s balancing measurement parameters, you are ready to perform the single-plane balancing procedure.
Perform the Reference Run
To begin the single-plane balancing procedure:
• Start the machine and bring it up to its nominal, steady running speed.
• At the Balance Setup screen, press the Start function button (or an Enter / Fire button). The Balancing Summary screen displays.
Figure 5 - 3. The Initial Balancing Summary Screen.
balancing plane / channel (with visual display)
current balancing run (i.e., initial run / IR – also known as reference run)
prompt area indicating next step in balancing procedure
The Balancing Summary screen displays balancing run data in tabular format. Hence, as you proceed through your balancing runs, you may access this Balancing Summary screen by pressing the current balancing screen’s Table function button.
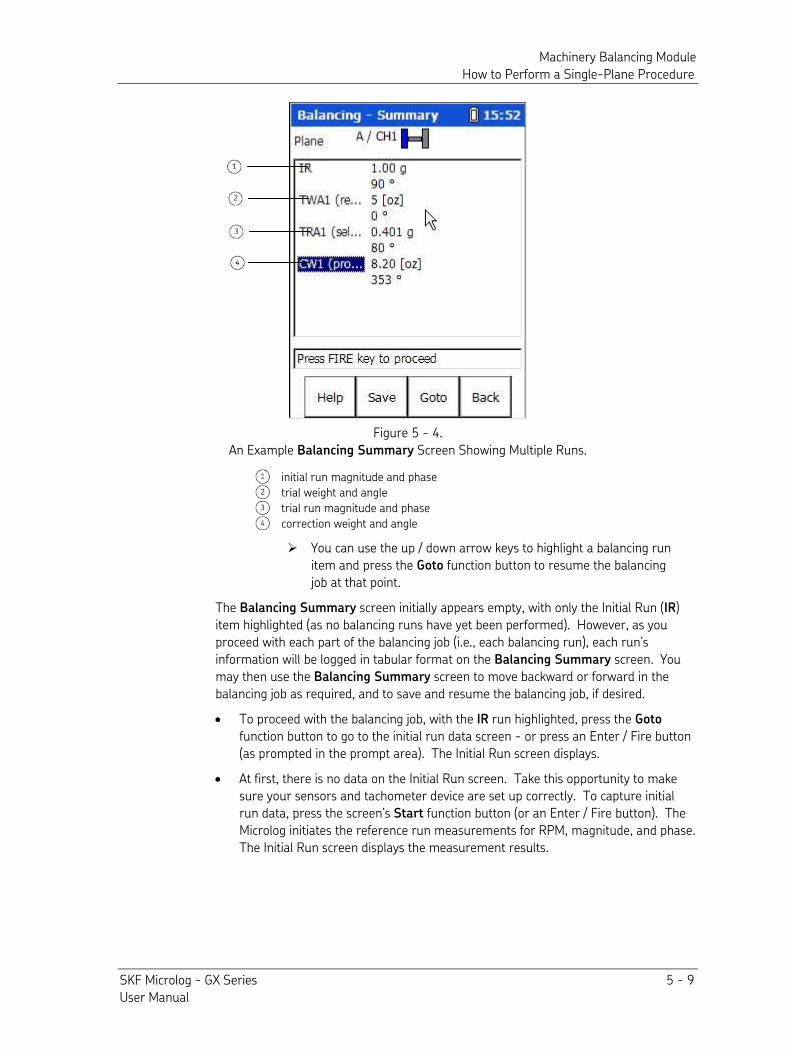
Machinery Balancing Module How to Perform a Single-Plane Procedure
SKF Microlog - GX Series 5 - 9 User Manual
Figure 5 - 4. An Example Balancing Summary Screen Showing Multiple Runs.
initial run magnitude and phase
trial weight and angle
trial run magnitude and phase
correction weight and angle
You can use the up / down arrow keys to highlight a balancing run item and press the Goto function button to resume the balancing job at that point.
The Balancing Summary screen initially appears empty, with only the Initial Run (IR) item highlighted (as no balancing runs have yet been performed). However, as you proceed with each part of the balancing job (i.e., each balancing run), each run’s information will be logged in tabular format on the Balancing Summary screen. You may then use the Balancing Summary screen to move backward or forward in the balancing job as required, and to save and resume the balancing job, if desired.
• To proceed with the balancing job, with the IR run highlighted, press the Goto function button to go to the initial run data screen - or press an Enter / Fire button (as prompted in the prompt area). The Initial Run screen displays.
• At first, there is no data on the Initial Run screen. Take this opportunity to make sure your sensors and tachometer device are set up correctly. To capture initial run data, press the screen’s Start function button (or an Enter / Fire button). The Microlog initiates the reference run measurements for RPM, magnitude, and phase. The Initial Run screen displays the measurement results.
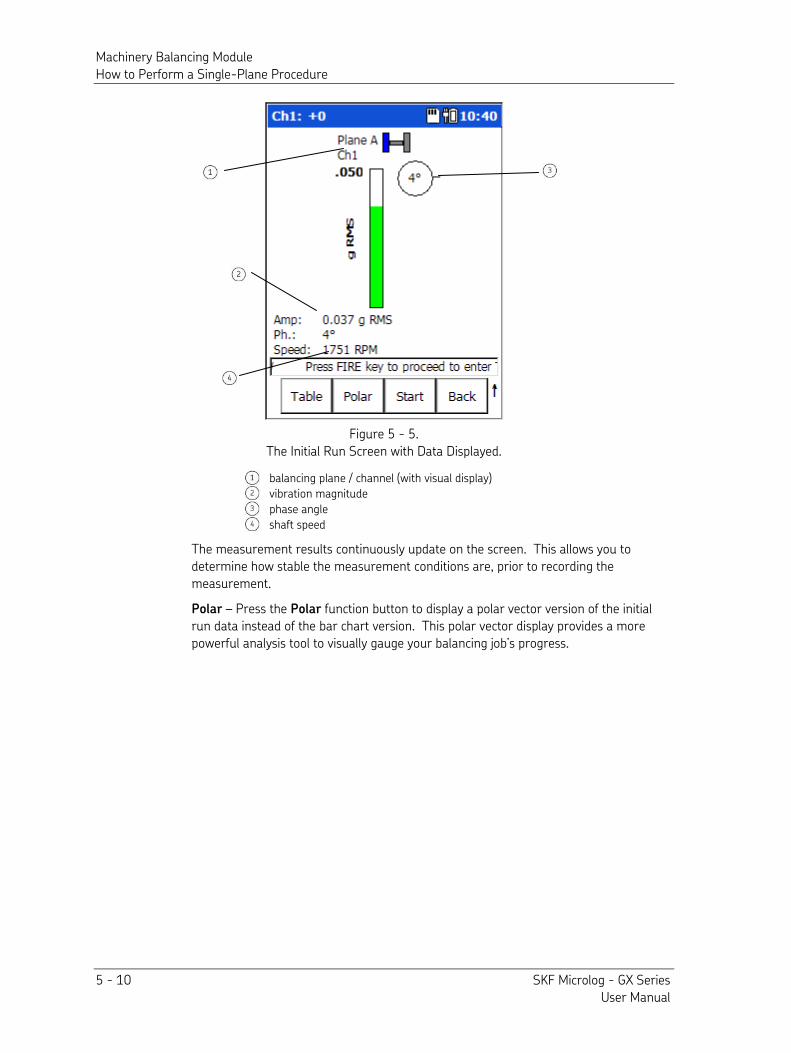
Machinery Balancing Module How to Perform a Single-Plane Procedure
5 - 10 SKF Microlog - GX Series User Manual
Figure 5 - 5. The Initial Run Screen with Data Displayed.
balancing plane / channel (with visual display)
vibration magnitude
phase angle
shaft speed
The measurement results continuously update on the screen. This allows you to determine how stable the measurement conditions are, prior to recording the measurement.
Polar – Press the Polar function button to display a polar vector version of the initial run data instead of the bar chart version. This polar vector display provides a more powerful analysis tool to visually gauge your balancing job’s progress.
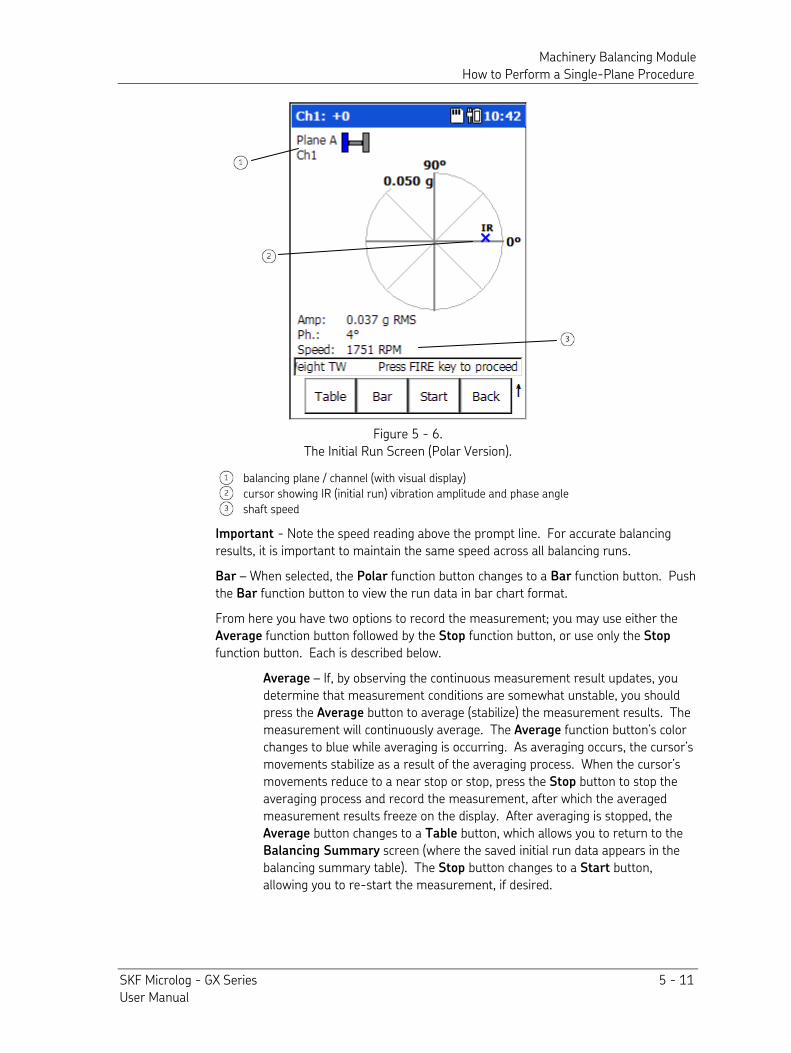
Machinery Balancing Module How to Perform a Single-Plane Procedure
SKF Microlog - GX Series 5 - 11 User Manual
Figure 5 - 6. The Initial Run Screen (Polar Version).
balancing plane / channel (with visual display)
cursor showing IR (initial run) vibration amplitude and phase angle
shaft speed
Important - Note the speed reading above the prompt line. For accurate balancing results, it is important to maintain the same speed across all balancing runs.
Bar – When selected, the Polar function button changes to a Bar function button. Push the Bar function button to view the run data in bar chart format.
From here you have two options to record the measurement; you may use either the Average function button followed by the Stop function button, or use only the Stop function button. Each is described below.
Average – If, by observing the continuous measurement result updates, you determine that measurement conditions are somewhat unstable, you should press the Average button to average (stabilize) the measurement results. The measurement will continuously average. The Average function button’s color changes to blue while averaging is occurring. As averaging occurs, the cursor’s movements stabilize as a result of the averaging process. When the cursor’s movements reduce to a near stop or stop, press the Stop button to stop the averaging process and record the measurement, after which the averaged measurement results freeze on the display. After averaging is stopped, the Average button changes to a Table button, which allows you to return to the Balancing Summary screen (where the saved initial run data appears in the balancing summary table). The Stop button changes to a Start button, allowing you to re-start the measurement, if desired.
Machinery Balancing Module How to Perform a Single-Plane Procedure
5 - 12 SKF Microlog - GX Series User Manual
Stop – If you determine that measurement conditions are stable, and to save time you do not wish to apply the averaging process, or if the machine conditions are in a state for which you wish to immediately capture the measurement, or after averaging stablizes measurement results, press the Stop function button to record the measurement. The measurement results immediately freeze on the display. Again, the screen’s Average button changes to a Table button, and the Stop button changes to a Start button, allowing you to re-start the measurement, if desired.
Enter / Fire buttons always advance the job to the next balancing run.
• Press either the Stop function button to record the measurement, as described above.
It is recommended that you save the initial run so that you do not have to repeat it. Then you can update the saved file with subsequent runs.
If you do not wish to save the initial run data at this time, and instead wish to proceed with the balancing job, follow the on-screen prompt and press an Enter / Fire key to proceed to enter Trial Weight data.
• To save the initial run data, press the Shift (zero / up arrow) function button and then the Save function button. The Balance - Save Setup screen displays, allowing you to save the balancing job. Refer to Chapter 4, The Analyzer Module’s section on How to Save, View, and Delete Analyzer Measurement Results for details on how to save balancing setups.
After saving the balancing job, you are returned to the Initial Run screen.
You may also save the balancing job from the Balancing – Summary screen.
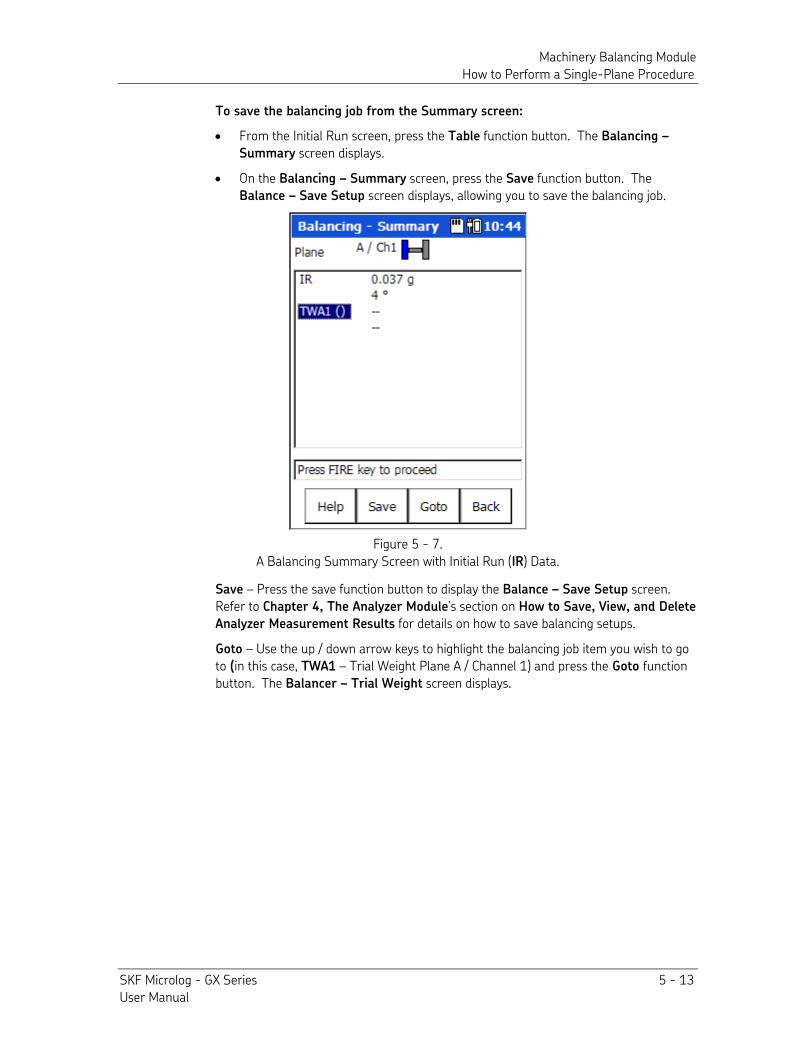
Machinery Balancing Module How to Perform a Single-Plane Procedure
SKF Microlog - GX Series 5 - 13 User Manual
To save the balancing job from the Summary screen:
• From the Initial Run screen, press the Table function button. The Balancing –
Summary screen displays.
• On the Balancing – Summary screen, press the Save function button. The Balance – Save Setup screen displays, allowing you to save the balancing job.
Figure 5 - 7. A Balancing Summary Screen with Initial Run (IR) Data.
Save – Press the save function button to display the Balance – Save Setup screen. Refer to Chapter 4, The Analyzer Module’s section on How to Save, View, and Delete
Analyzer Measurement Results for details on how to save balancing setups.
Goto – Use the up / down arrow keys to highlight the balancing job item you wish to go to (in this case, TWA1 – Trial Weight Plane A / Channel 1) and press the Goto function button. The Balancer – Trial Weight screen displays.
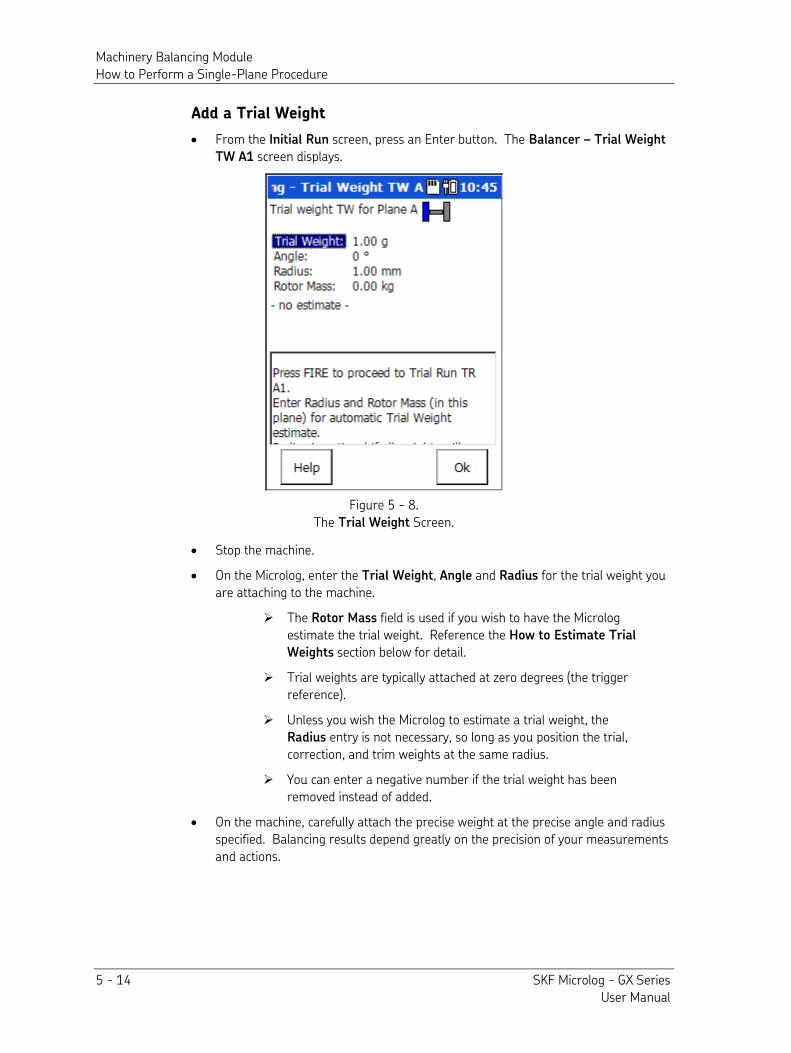
Machinery Balancing Module How to Perform a Single-Plane Procedure
5 - 14 SKF Microlog - GX Series User Manual
Add a Trial Weight
• From the Initial Run screen, press an Enter button. The Balancer – Trial Weight
TW A1 screen displays.
Figure 5 - 8. The Trial Weight Screen.
• Stop the machine.
• On the Microlog, enter the Trial Weight, Angle and Radius for the trial weight you are attaching to the machine.
The Rotor Mass field is used if you wish to have the Microlog estimate the trial weight. Reference the How to Estimate Trial
Weights section below for detail.
Trial weights are typically attached at zero degrees (the trigger reference).
Unless you wish the Microlog to estimate a trial weight, the Radius entry is not necessary, so long as you position the trial, correction, and trim weights at the same radius.
You can enter a negative number if the trial weight has been removed instead of added.
• On the machine, carefully attach the precise weight at the precise angle and radius specified. Balancing results depend greatly on the precision of your measurements and actions.
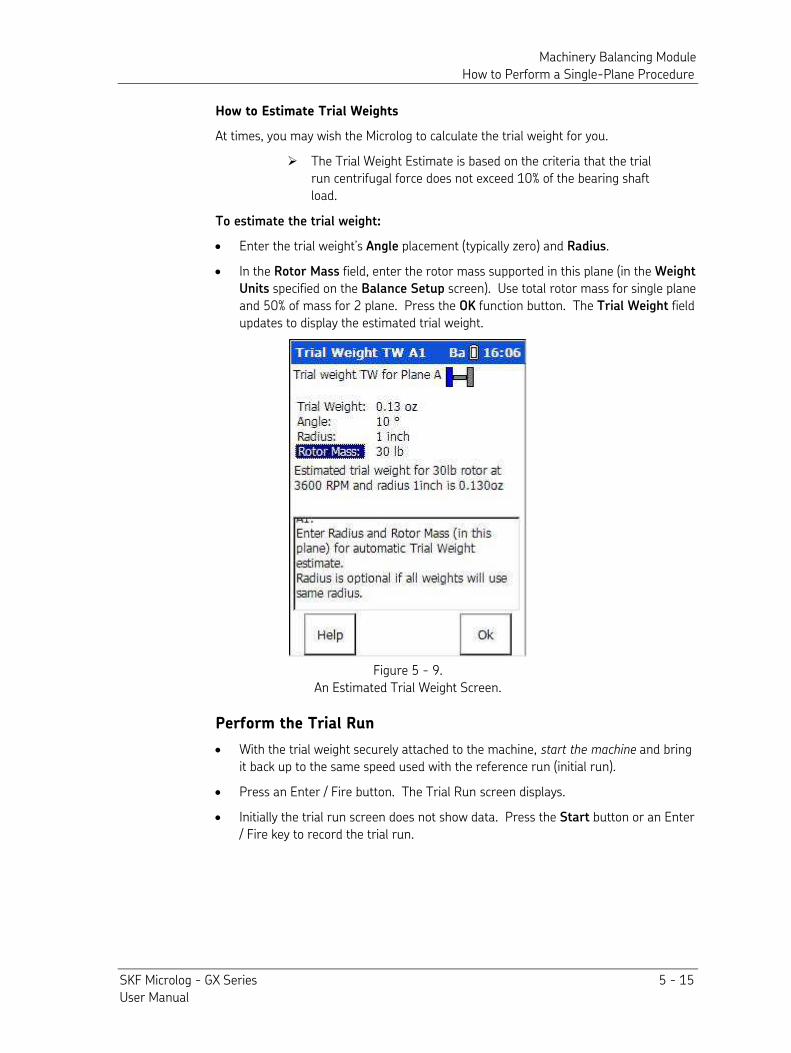
Machinery Balancing Module How to Perform a Single-Plane Procedure
SKF Microlog - GX Series 5 - 15 User Manual
How to Estimate Trial Weights
At times, you may wish the Microlog to calculate the trial weight for you.
The Trial Weight Estimate is based on the criteria that the trial run centrifugal force does not exceed 10% of the bearing shaft load.
To estimate the trial weight:
• Enter the trial weight’s Angle placement (typically zero) and Radius.
• In the Rotor Mass field, enter the rotor mass supported in this plane (in the Weight
Units specified on the Balance Setup screen). Use total rotor mass for single plane and 50% of mass for 2 plane. Press the OK function button. The Trial Weight field updates to display the estimated trial weight.
Figure 5 - 9. An Estimated Trial Weight Screen.
Perform the Trial Run
• With the trial weight securely attached to the machine, start the machine and bring it back up to the same speed used with the reference run (initial run).
• Press an Enter / Fire button. The Trial Run screen displays.
• Initially the trial run screen does not show data. Press the Start button or an Enter / Fire key to record the trial run.
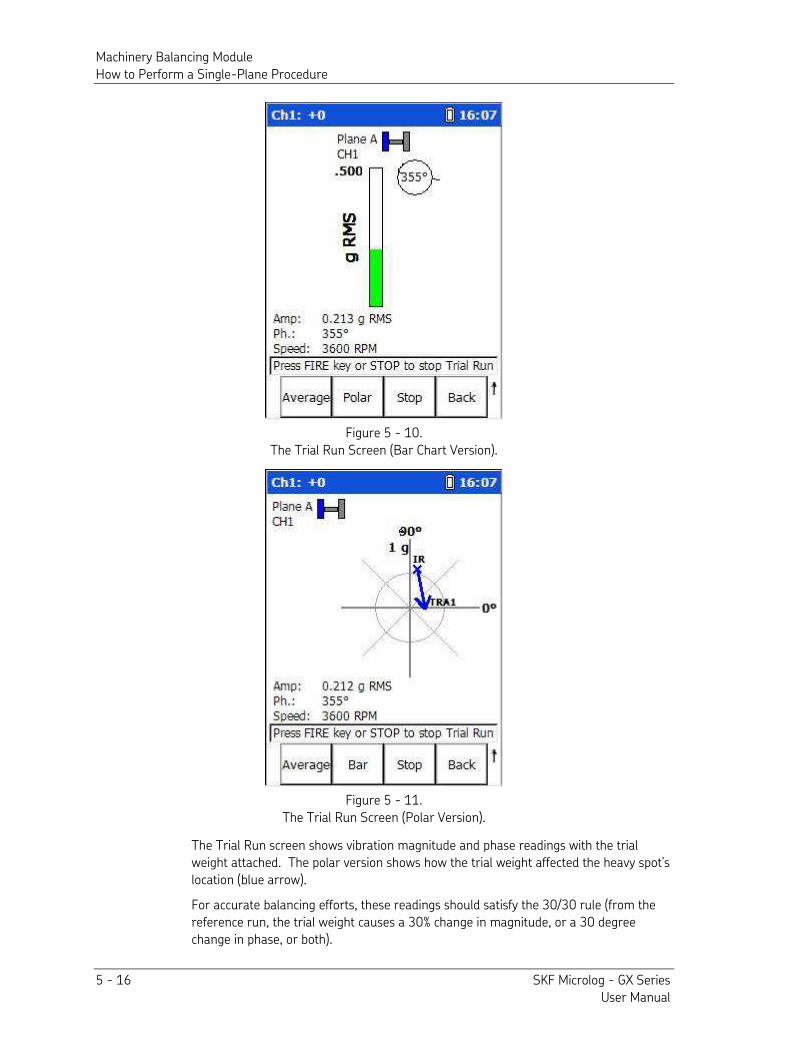
Machinery Balancing Module How to Perform a Single-Plane Procedure
5 - 16 SKF Microlog - GX Series User Manual
Figure 5 - 10. The Trial Run Screen (Bar Chart Version).
Figure 5 - 11. The Trial Run Screen (Polar Version).
The Trial Run screen shows vibration magnitude and phase readings with the trial weight attached. The polar version shows how the trial weight affected the heavy spot’s location (blue arrow).
For accurate balancing efforts, these readings should satisfy the 30/30 rule (from the reference run, the trial weight causes a 30% change in magnitude, or a 30 degree change in phase, or both).
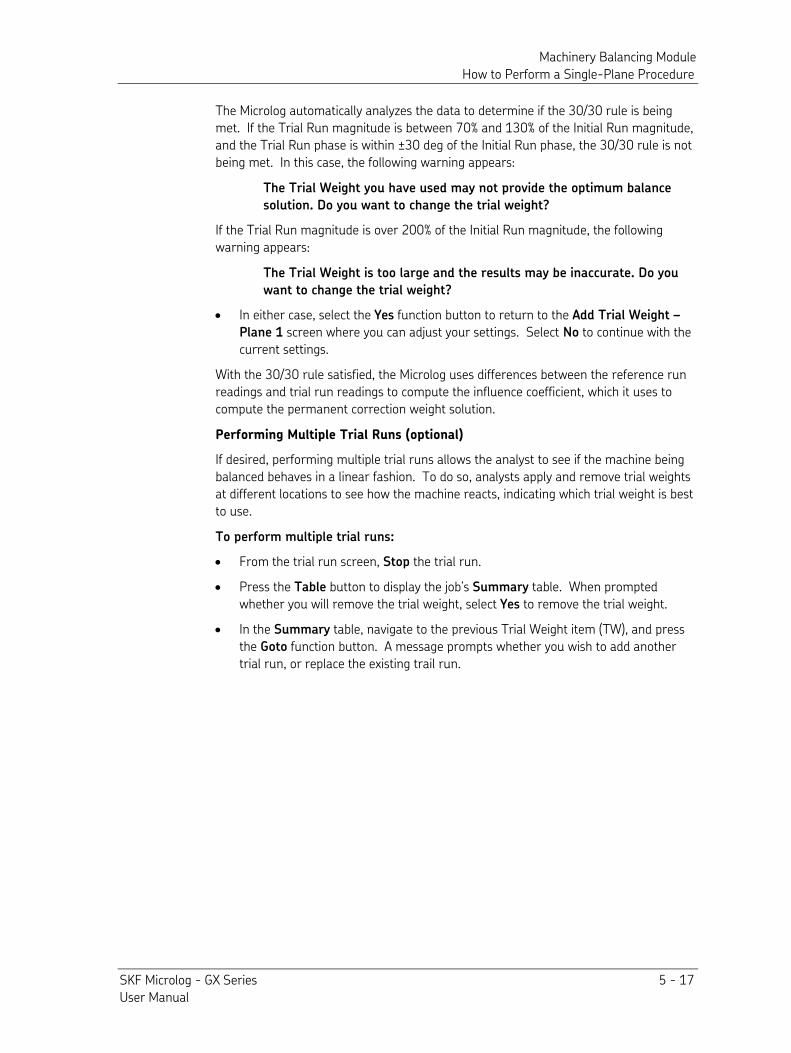
Machinery Balancing Module How to Perform a Single-Plane Procedure
SKF Microlog - GX Series 5 - 17 User Manual
The Microlog automatically analyzes the data to determine if the 30/30 rule is being met. If the Trial Run magnitude is between 70% and 130% of the Initial Run magnitude, and the Trial Run phase is within ±30 deg of the Initial Run phase, the 30/30 rule is not being met. In this case, the following warning appears:
The Trial Weight you have used may not provide the optimum balance
solution. Do you want to change the trial weight?
If the Trial Run magnitude is over 200% of the Initial Run magnitude, the following warning appears:
The Trial Weight is too large and the results may be inaccurate. Do you
want to change the trial weight?
• In either case, select the Yes function button to return to the Add Trial Weight –
Plane 1 screen where you can adjust your settings. Select No to continue with the current settings.
With the 30/30 rule satisfied, the Microlog uses differences between the reference run readings and trial run readings to compute the influence coefficient, which it uses to compute the permanent correction weight solution.
Performing Multiple Trial Runs (optional)
If desired, performing multiple trial runs allows the analyst to see if the machine being balanced behaves in a linear fashion. To do so, analysts apply and remove trial weights at different locations to see how the machine reacts, indicating which trial weight is best to use.
To perform multiple trial runs:
• From the trial run screen, Stop the trial run.
• Press the Table button to display the job’s Summary table. When prompted whether you will remove the trial weight, select Yes to remove the trial weight.
• In the Summary table, navigate to the previous Trial Weight item (TW), and press the Goto function button. A message prompts whether you wish to add another trial run, or replace the existing trail run.
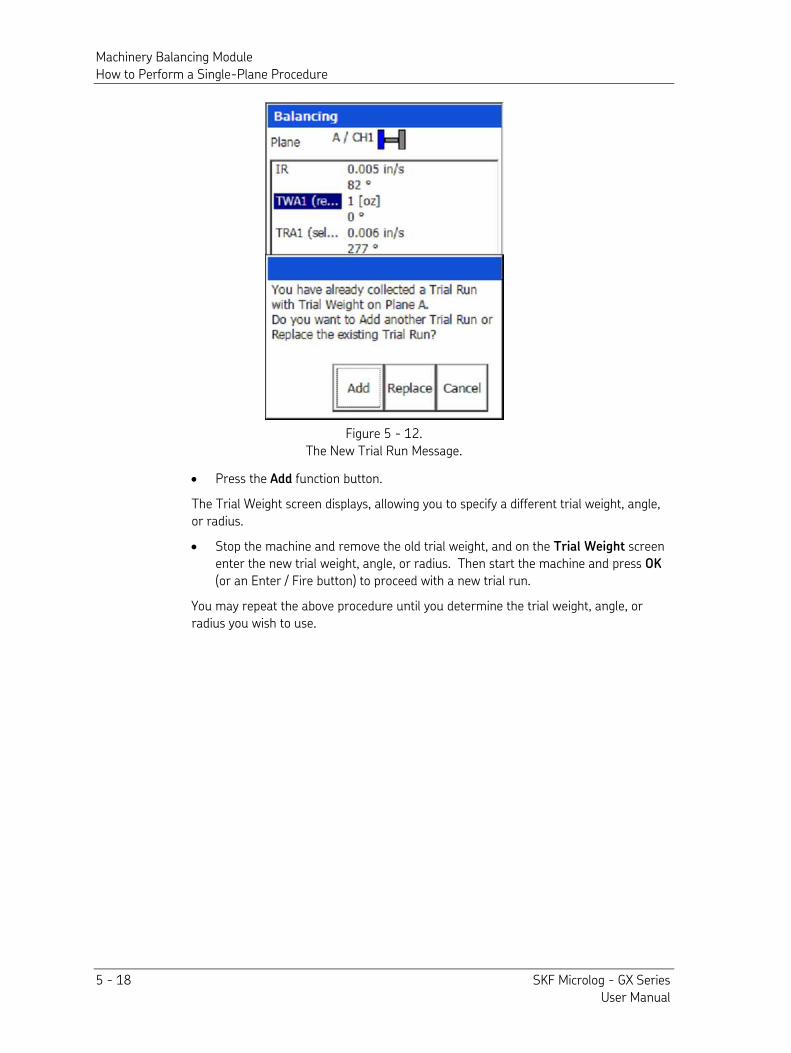
Machinery Balancing Module How to Perform a Single-Plane Procedure
5 - 18 SKF Microlog - GX Series User Manual
Figure 5 - 12. The New Trial Run Message.
• Press the Add function button.
The Trial Weight screen displays, allowing you to specify a different trial weight, angle, or radius.
• Stop the machine and remove the old trial weight, and on the Trial Weight screen enter the new trial weight, angle, or radius. Then start the machine and press OK (or an Enter / Fire button) to proceed with a new trial run.
You may repeat the above procedure until you determine the trial weight, angle, or radius you wish to use.
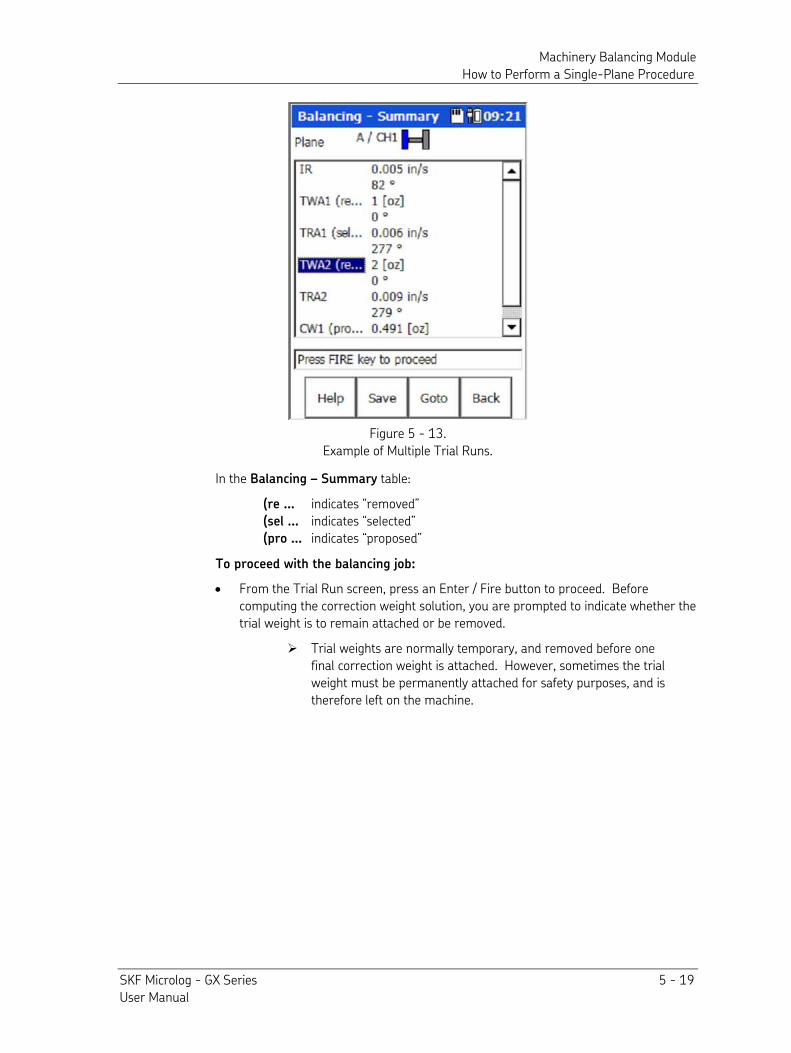
Machinery Balancing Module How to Perform a Single-Plane Procedure
SKF Microlog - GX Series 5 - 19 User Manual
Figure 5 - 13. Example of Multiple Trial Runs.
In the Balancing – Summary table:
(re … indicates “removed” (sel … indicates “selected” (pro … indicates “proposed”
To proceed with the balancing job:
• From the Trial Run screen, press an Enter / Fire button to proceed. Before computing the correction weight solution, you are prompted to indicate whether the trial weight is to remain attached or be removed.
Trial weights are normally temporary, and removed before one final correction weight is attached. However, sometimes the trial weight must be permanently attached for safety purposes, and is therefore left on the machine.
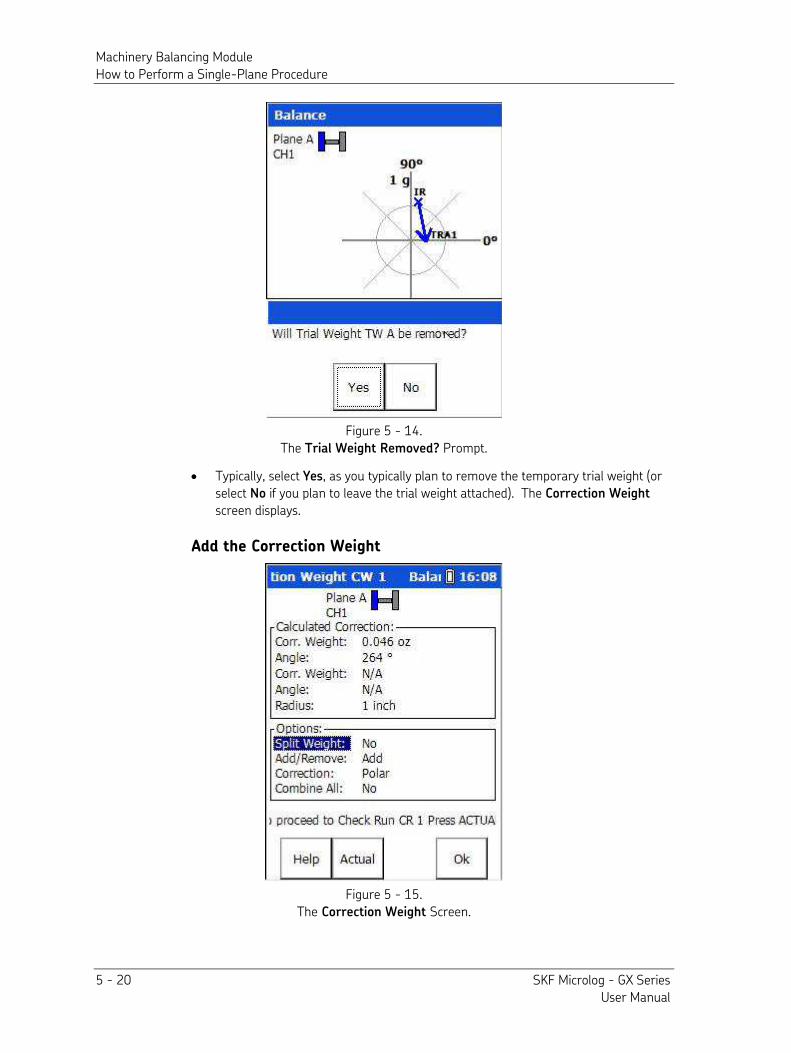
Machinery Balancing Module How to Perform a Single-Plane Procedure
5 - 20 SKF Microlog - GX Series User Manual
Figure 5 - 14. The Trial Weight Removed? Prompt.
• Typically, select Yes, as you typically plan to remove the temporary trial weight (or select No if you plan to leave the trial weight attached). The Correction Weight
screen displays.
Add the Correction Weight
Figure 5 - 15. The Correction Weight Screen.
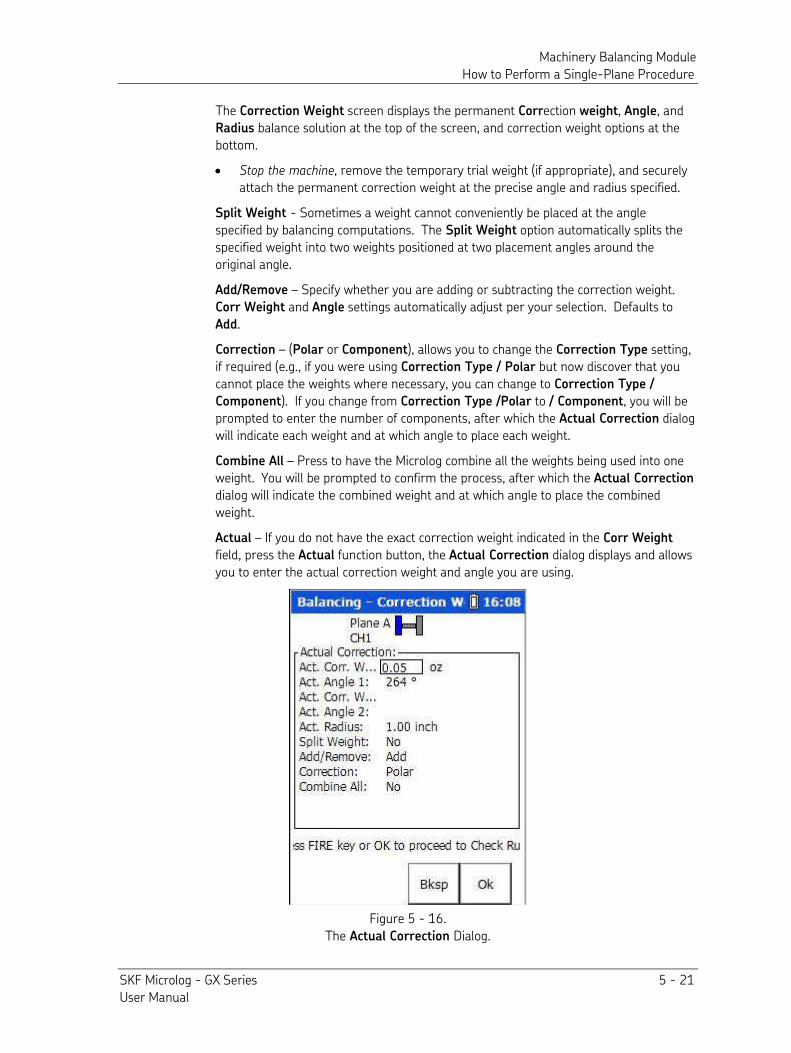
Machinery Balancing Module How to Perform a Single-Plane Procedure
SKF Microlog - GX Series 5 - 21 User Manual
The Correction Weight screen displays the permanent Correction weight, Angle, and Radius balance solution at the top of the screen, and correction weight options at the bottom.
• Stop the machine, remove the temporary trial weight (if appropriate), and securely attach the permanent correction weight at the precise angle and radius specified.
Split Weight - Sometimes a weight cannot conveniently be placed at the angle specified by balancing computations. The Split Weight option automatically splits the specified weight into two weights positioned at two placement angles around the original angle.
Add/Remove – Specify whether you are adding or subtracting the correction weight. Corr Weight and Angle settings automatically adjust per your selection. Defaults to Add.
Correction – (Polar or Component), allows you to change the Correction Type setting, if required (e.g., if you were using Correction Type / Polar but now discover that you cannot place the weights where necessary, you can change to Correction Type /
Component). If you change from Correction Type /Polar to / Component, you will be prompted to enter the number of components, after which the Actual Correction dialog will indicate each weight and at which angle to place each weight.
Combine All – Press to have the Microlog combine all the weights being used into one weight. You will be prompted to confirm the process, after which the Actual Correction dialog will indicate the combined weight and at which angle to place the combined weight.
Actual – If you do not have the exact correction weight indicated in the Corr Weight field, press the Actual function button, the Actual Correction dialog displays and allows you to enter the actual correction weight and angle you are using.
Figure 5 - 16. The Actual Correction Dialog.
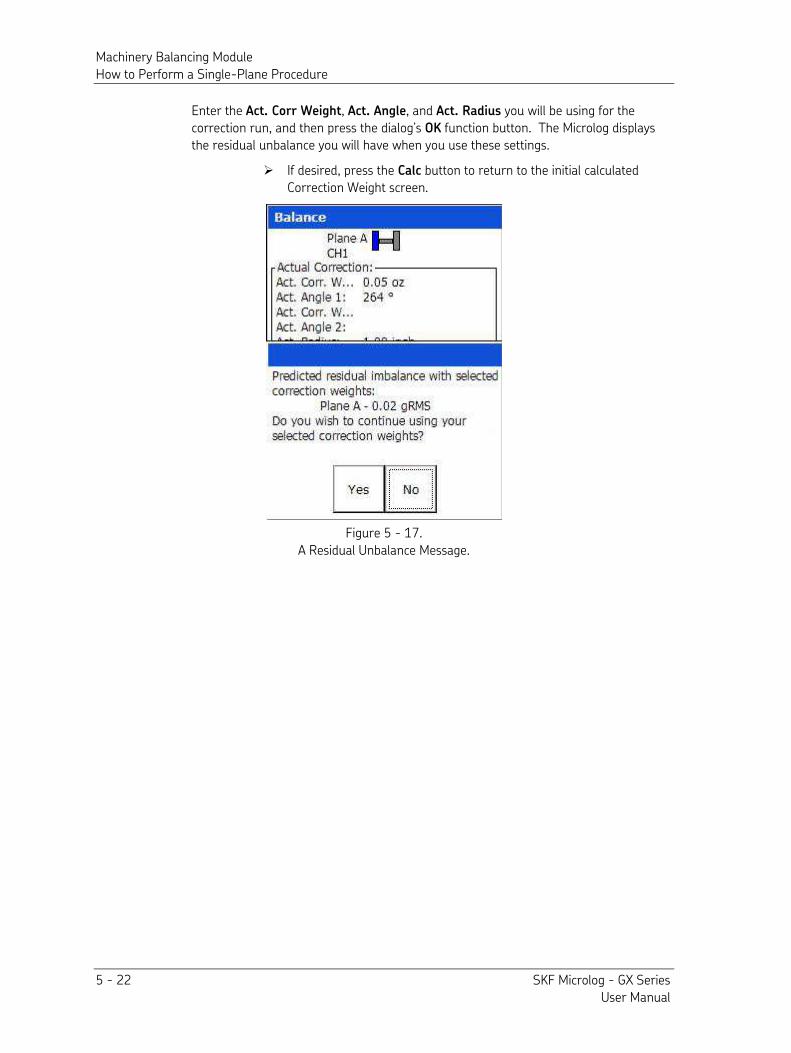
Machinery Balancing Module How to Perform a Single-Plane Procedure
5 - 22 SKF Microlog - GX Series User Manual
Enter the Act. Corr Weight, Act. Angle, and Act. Radius you will be using for the correction run, and then press the dialog’s OK function button. The Microlog displays the residual unbalance you will have when you use these settings.
If desired, press the Calc button to return to the initial calculated Correction Weight screen.
Figure 5 - 17. A Residual Unbalance Message.
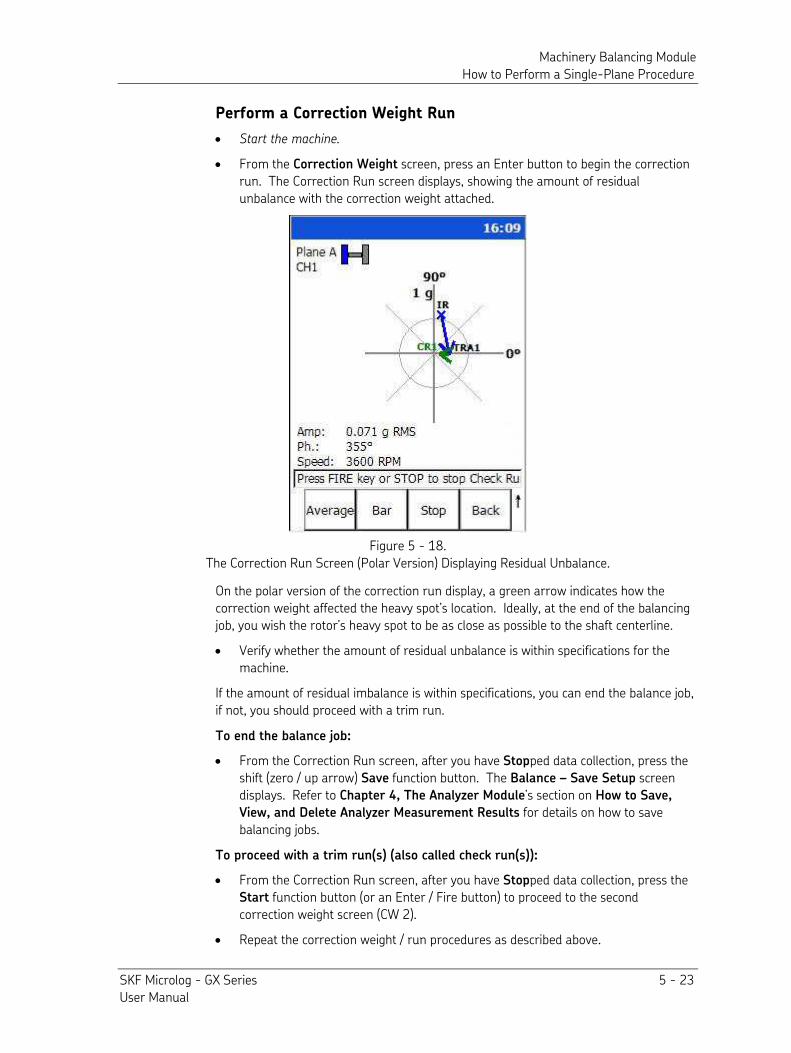
Machinery Balancing Module How to Perform a Single-Plane Procedure
SKF Microlog - GX Series 5 - 23 User Manual
Perform a Correction Weight Run
• Start the machine.
• From the Correction Weight screen, press an Enter button to begin the correction run. The Correction Run screen displays, showing the amount of residual unbalance with the correction weight attached.
Figure 5 - 18. The Correction Run Screen (Polar Version) Displaying Residual Unbalance.
On the polar version of the correction run display, a green arrow indicates how the correction weight affected the heavy spot’s location. Ideally, at the end of the balancing job, you wish the rotor’s heavy spot to be as close as possible to the shaft centerline.
• Verify whether the amount of residual unbalance is within specifications for the machine.
If the amount of residual imbalance is within specifications, you can end the balance job, if not, you should proceed with a trim run.
To end the balance job:
• From the Correction Run screen, after you have Stopped data collection, press the shift (zero / up arrow) Save function button. The Balance – Save Setup screen displays. Refer to Chapter 4, The Analyzer Module’s section on How to Save,
View, and Delete Analyzer Measurement Results for details on how to save balancing jobs.
To proceed with a trim run(s) (also called check run(s)):
• From the Correction Run screen, after you have Stopped data collection, press the Start function button (or an Enter / Fire button) to proceed to the second correction weight screen (CW 2).
• Repeat the correction weight / run procedures as described above.
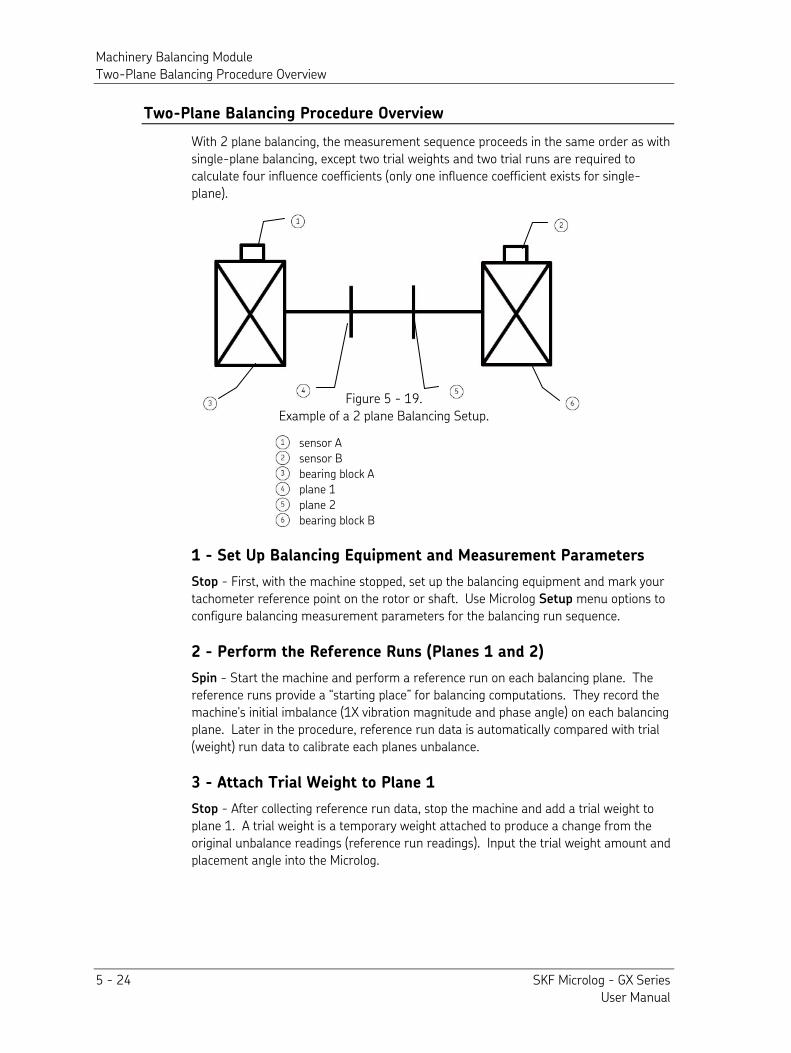
Machinery Balancing Module Two-Plane Balancing Procedure Overview
5 - 24 SKF Microlog - GX Series User Manual
Two-Plane Balancing Procedure Overview
With 2 plane balancing, the measurement sequence proceeds in the same order as with single-plane balancing, except two trial weights and two trial runs are required to calculate four influence coefficients (only one influence coefficient exists for single-plane).
Figure 5 - 19. Example of a 2 plane Balancing Setup.
sensor A
sensor B
bearing block A
plane 1
plane 2
bearing block B
1 - Set Up Balancing Equipment and Measurement Parameters
Stop - First, with the machine stopped, set up the balancing equipment and mark your tachometer reference point on the rotor or shaft. Use Microlog Setup menu options to configure balancing measurement parameters for the balancing run sequence.
2 - Perform the Reference Runs (Planes 1 and 2)
Spin - Start the machine and perform a reference run on each balancing plane. The reference runs provide a “starting place” for balancing computations. They record the machine's initial imbalance (1X vibration magnitude and phase angle) on each balancing plane. Later in the procedure, reference run data is automatically compared with trial (weight) run data to calibrate each planes unbalance.
3 - Attach Trial Weight to Plane 1
Stop - After collecting reference run data, stop the machine and add a trial weight to plane 1. A trial weight is a temporary weight attached to produce a change from the original unbalance readings (reference run readings). Input the trial weight amount and placement angle into the Microlog.
Machinery Balancing Module Two-Plane Balancing Procedure Overview
SKF Microlog - GX Series 5 - 25 User Manual
4A - Perform the Trial Run on Plane 1
Spin - With the trial weight securely attached, start the machine again, and perform a trial run on plane 1. The trial run calibrates the machine's unbalance and allows the Microlog to calculate the influence coefficient and permanent correction weight amount and placement.
To allow for accurate balancing computations, the trial weight should pass the 30/30 rule. The trial weight should:
• A - Increase or decrease the 1X vibration amplitude by at least 30%, or
• B - Change the phase angle by at least 30 degrees, or
• C - A combination of A and B.
4B - Perform the Trial Run on Plane 2
Spin – With the trial weight on Plane 1, perform a trial run on Plane 2. When using two sensors, all Plane 1 and 2 runs occur
simultaneously. Performing separate runs is only necessary if a single sensor needs to be moved between the planes.
5 – Attach the Trial Weight to Plane 2
Stop – Stop the machine, remove the trial weight from Plane 1 and attach it to Plane 2.
6A – Perform Trial Run on Plane 1
Spin - With the trial weight on Plane 2, perform a Trial Run on Plane 1. 6B – Perform Trial Run on Plane 2
Spin - With the trial weight on Plane 2, perform a Trial Run on Plane 2. 7 - Attach the Permanent Correction Weights
Stop - Stop the machine, remove the trial weight from Plane 2, then attach the specified correction weights at the specified angles on each balance plane (1 and 2).
8A - Perform a Correction Weight Run on Plane 1
Spin - Start the machine again, and perform a Correction Weight Run on Plane 1. The correction weight run performs two functions:
• It calculates the amount of residual imbalance with the correction weights in place to confirm that the plane is now balanced within tolerances.
• If further balancing is necessary, it automatically applies the influence coefficient to calculate an additional “trim” weight that can be added to further balance the plane.
8B - Perform a Correction Weight Run on Plane 2
Spin - Perform a Correction Run on Plane 2.
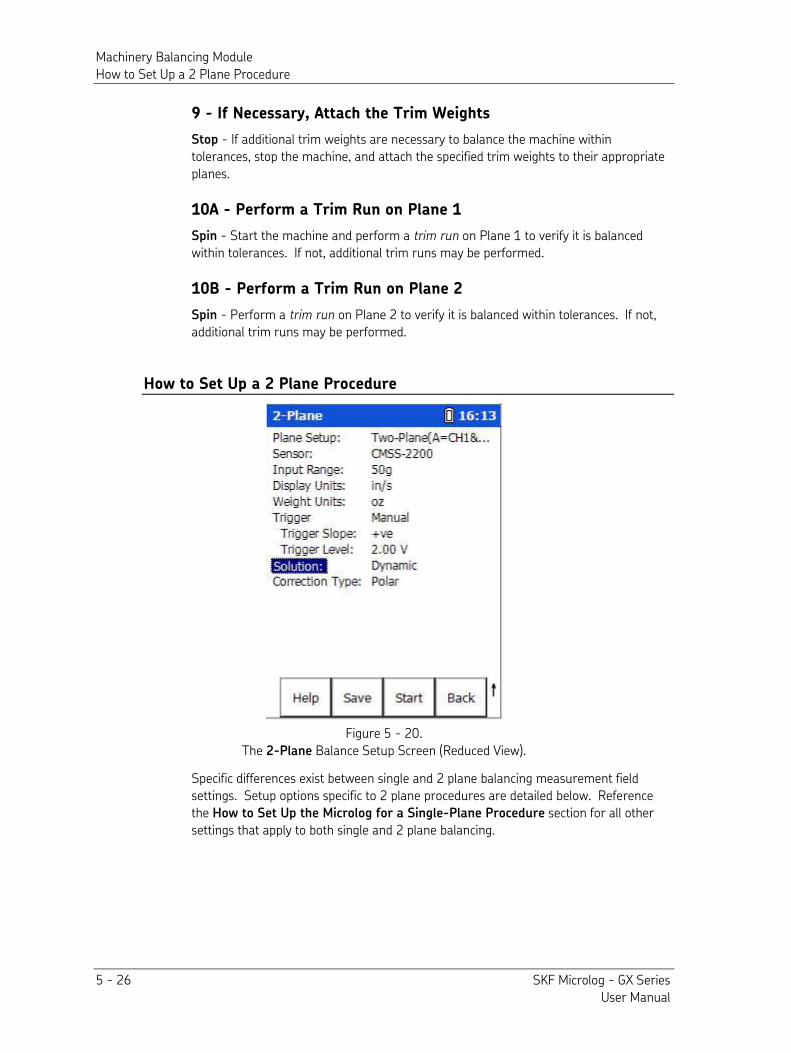
Machinery Balancing Module How to Set Up a 2 Plane Procedure
5 - 26 SKF Microlog - GX Series User Manual
9 - If Necessary, Attach the Trim Weights
Stop - If additional trim weights are necessary to balance the machine within tolerances, stop the machine, and attach the specified trim weights to their appropriate planes.
10A - Perform a Trim Run on Plane 1
Spin - Start the machine and perform a trim run on Plane 1 to verify it is balanced within tolerances. If not, additional trim runs may be performed.
10B - Perform a Trim Run on Plane 2
Spin - Perform a trim run on Plane 2 to verify it is balanced within tolerances. If not, additional trim runs may be performed.
How to Set Up a 2 Plane Procedure
Figure 5 - 20. The 2-Plane Balance Setup Screen (Reduced View).
Specific differences exist between single and 2 plane balancing measurement field settings. Setup options specific to 2 plane procedures are detailed below. Reference the How to Set Up the Microlog for a Single-Plane Procedure section for all other settings that apply to both single and 2 plane balancing.
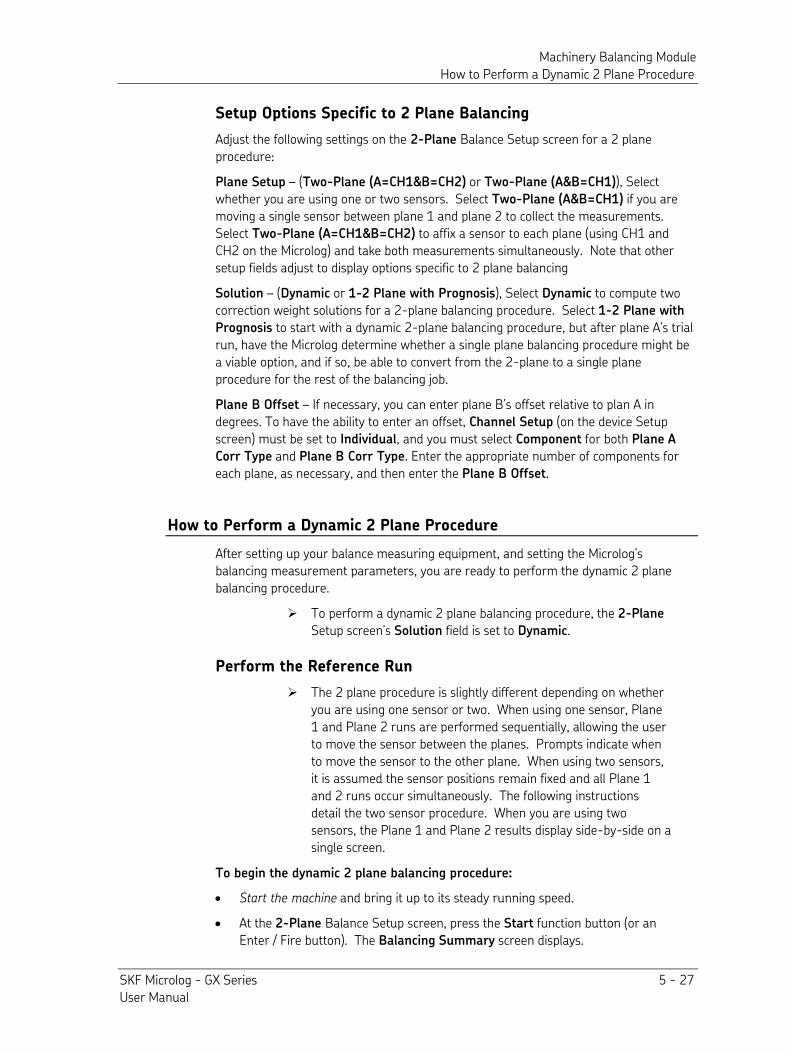
Machinery Balancing Module How to Perform a Dynamic 2 Plane Procedure
SKF Microlog - GX Series 5 - 27 User Manual
Setup Options Specific to 2 Plane Balancing
Adjust the following settings on the 2-Plane Balance Setup screen for a 2 plane procedure:
Plane Setup – (Two-Plane (A=CH1&B=CH2) or Two-Plane (A&B=CH1)), Select whether you are using one or two sensors. Select Two-Plane (A&B=CH1) if you are moving a single sensor between plane 1 and plane 2 to collect the measurements. Select Two-Plane (A=CH1&B=CH2) to affix a sensor to each plane (using CH1 and CH2 on the Microlog) and take both measurements simultaneously. Note that other setup fields adjust to display options specific to 2 plane balancing
Solution – (Dynamic or 1-2 Plane with Prognosis), Select Dynamic to compute two correction weight solutions for a 2-plane balancing procedure. Select 1-2 Plane with
Prognosis to start with a dynamic 2-plane balancing procedure, but after plane A’s trial run, have the Microlog determine whether a single plane balancing procedure might be a viable option, and if so, be able to convert from the 2-plane to a single plane procedure for the rest of the balancing job.
Plane B Offset – If necessary, you can enter plane B’s offset relative to plan A in degrees. To have the ability to enter an offset, Channel Setup (on the device Setup screen) must be set to Individual, and you must select Component for both Plane A
Corr Type and Plane B Corr Type. Enter the appropriate number of components for each plane, as necessary, and then enter the Plane B Offset.
How to Perform a Dynamic 2 Plane Procedure
After setting up your balance measuring equipment, and setting the Microlog’s balancing measurement parameters, you are ready to perform the dynamic 2 plane balancing procedure.
To perform a dynamic 2 plane balancing procedure, the 2-Plane Setup screen’s Solution field is set to Dynamic.
Perform the Reference Run
The 2 plane procedure is slightly different depending on whether you are using one sensor or two. When using one sensor, Plane 1 and Plane 2 runs are performed sequentially, allowing the user to move the sensor between the planes. Prompts indicate when to move the sensor to the other plane. When using two sensors, it is assumed the sensor positions remain fixed and all Plane 1 and 2 runs occur simultaneously. The following instructions detail the two sensor procedure. When you are using two sensors, the Plane 1 and Plane 2 results display side-by-side on a single screen.
To begin the dynamic 2 plane balancing procedure:
• Start the machine and bring it up to its steady running speed.
• At the 2-Plane Balance Setup screen, press the Start function button (or an Enter / Fire button). The Balancing Summary screen displays.
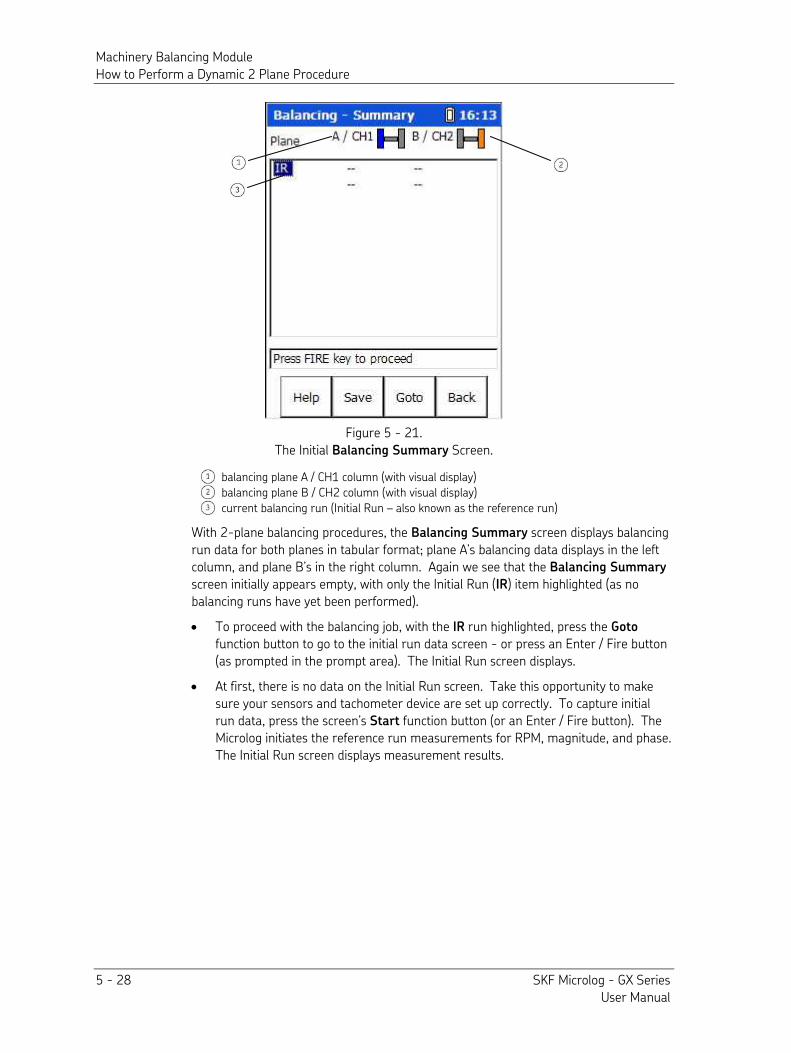
Machinery Balancing Module How to Perform a Dynamic 2 Plane Procedure
5 - 28 SKF Microlog - GX Series User Manual
Figure 5 - 21. The Initial Balancing Summary Screen.
balancing plane A / CH1 column (with visual display)
balancing plane B / CH2 column (with visual display) current balancing run (Initial Run – also known as the reference run)
With 2-plane balancing procedures, the Balancing Summary screen displays balancing run data for both planes in tabular format; plane A’s balancing data displays in the left column, and plane B’s in the right column. Again we see that the Balancing Summary screen initially appears empty, with only the Initial Run (IR) item highlighted (as no balancing runs have yet been performed).
• To proceed with the balancing job, with the IR run highlighted, press the Goto function button to go to the initial run data screen - or press an Enter / Fire button (as prompted in the prompt area). The Initial Run screen displays.
• At first, there is no data on the Initial Run screen. Take this opportunity to make sure your sensors and tachometer device are set up correctly. To capture initial run data, press the screen’s Start function button (or an Enter / Fire button). The Microlog initiates the reference run measurements for RPM, magnitude, and phase. The Initial Run screen displays measurement results.
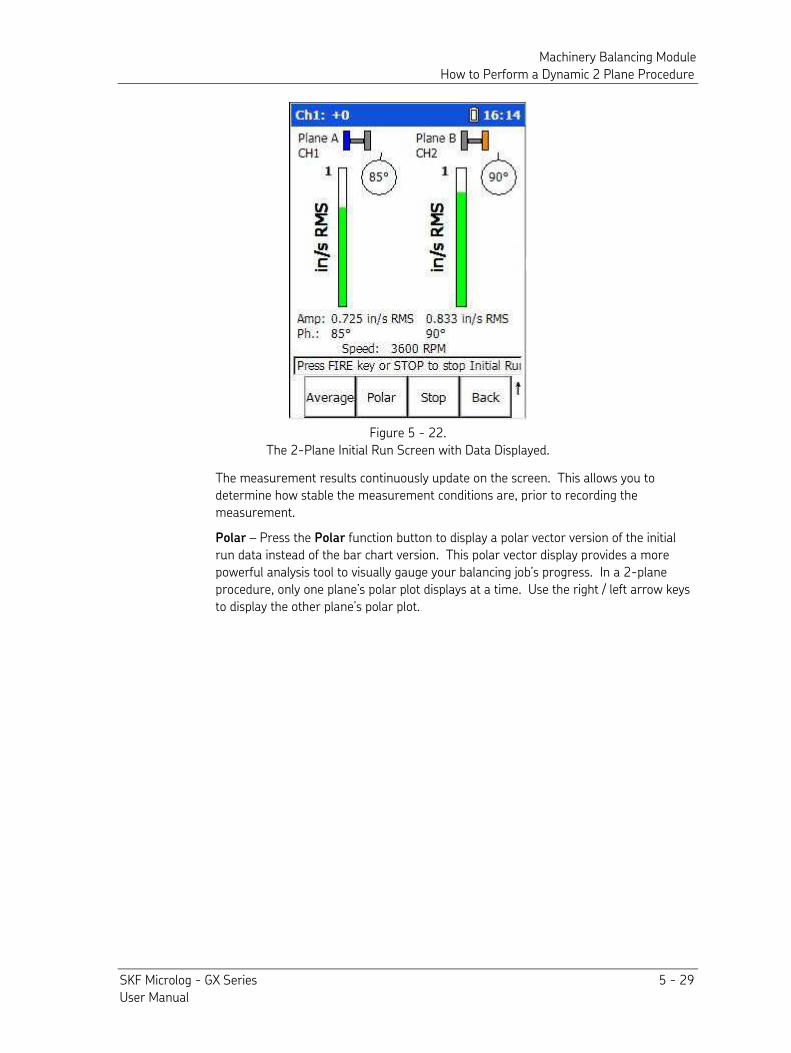
Machinery Balancing Module How to Perform a Dynamic 2 Plane Procedure
SKF Microlog - GX Series 5 - 29 User Manual
Figure 5 - 22. The 2-Plane Initial Run Screen with Data Displayed.
The measurement results continuously update on the screen. This allows you to determine how stable the measurement conditions are, prior to recording the measurement.
Polar – Press the Polar function button to display a polar vector version of the initial run data instead of the bar chart version. This polar vector display provides a more powerful analysis tool to visually gauge your balancing job’s progress. In a 2-plane procedure, only one plane’s polar plot displays at a time. Use the right / left arrow keys to display the other plane’s polar plot.
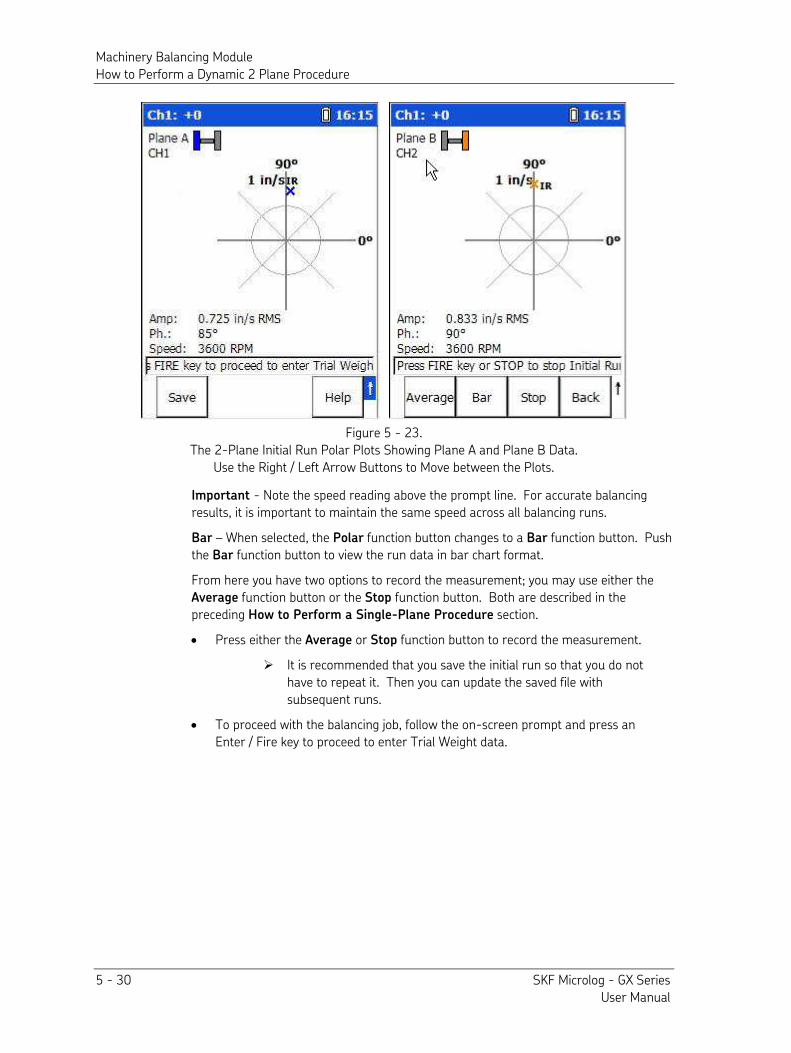
Machinery Balancing Module How to Perform a Dynamic 2 Plane Procedure
5 - 30 SKF Microlog - GX Series User Manual
Figure 5 - 23. The 2-Plane Initial Run Polar Plots Showing Plane A and Plane B Data.
Use the Right / Left Arrow Buttons to Move between the Plots.
Important - Note the speed reading above the prompt line. For accurate balancing results, it is important to maintain the same speed across all balancing runs.
Bar – When selected, the Polar function button changes to a Bar function button. Push the Bar function button to view the run data in bar chart format.
From here you have two options to record the measurement; you may use either the Average function button or the Stop function button. Both are described in the preceding How to Perform a Single-Plane Procedure section.
• Press either the Average or Stop function button to record the measurement.
It is recommended that you save the initial run so that you do not have to repeat it. Then you can update the saved file with subsequent runs.
• To proceed with the balancing job, follow the on-screen prompt and press an Enter / Fire key to proceed to enter Trial Weight data.
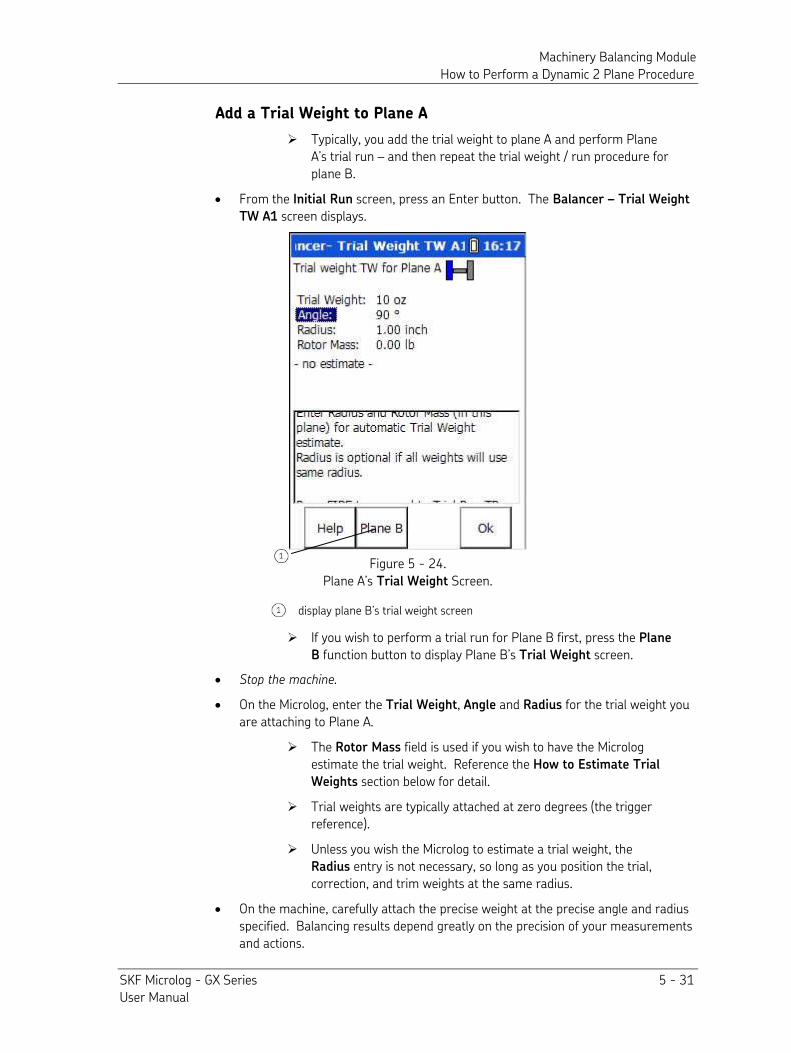
Machinery Balancing Module How to Perform a Dynamic 2 Plane Procedure
SKF Microlog - GX Series 5 - 31 User Manual
Add a Trial Weight to Plane A
Typically, you add the trial weight to plane A and perform Plane A’s trial run – and then repeat the trial weight / run procedure for plane B.
• From the Initial Run screen, press an Enter button. The Balancer – Trial Weight
TW A1 screen displays.
Figure 5 - 24. Plane A’s Trial Weight Screen.
display plane B’s trial weight screen
If you wish to perform a trial run for Plane B first, press the Plane
B function button to display Plane B’s Trial Weight screen.
• Stop the machine.
• On the Microlog, enter the Trial Weight, Angle and Radius for the trial weight you are attaching to Plane A.
The Rotor Mass field is used if you wish to have the Microlog estimate the trial weight. Reference the How to Estimate Trial
Weights section below for detail.
Trial weights are typically attached at zero degrees (the trigger reference).
Unless you wish the Microlog to estimate a trial weight, the Radius entry is not necessary, so long as you position the trial, correction, and trim weights at the same radius.
• On the machine, carefully attach the precise weight at the precise angle and radius specified. Balancing results depend greatly on the precision of your measurements and actions.
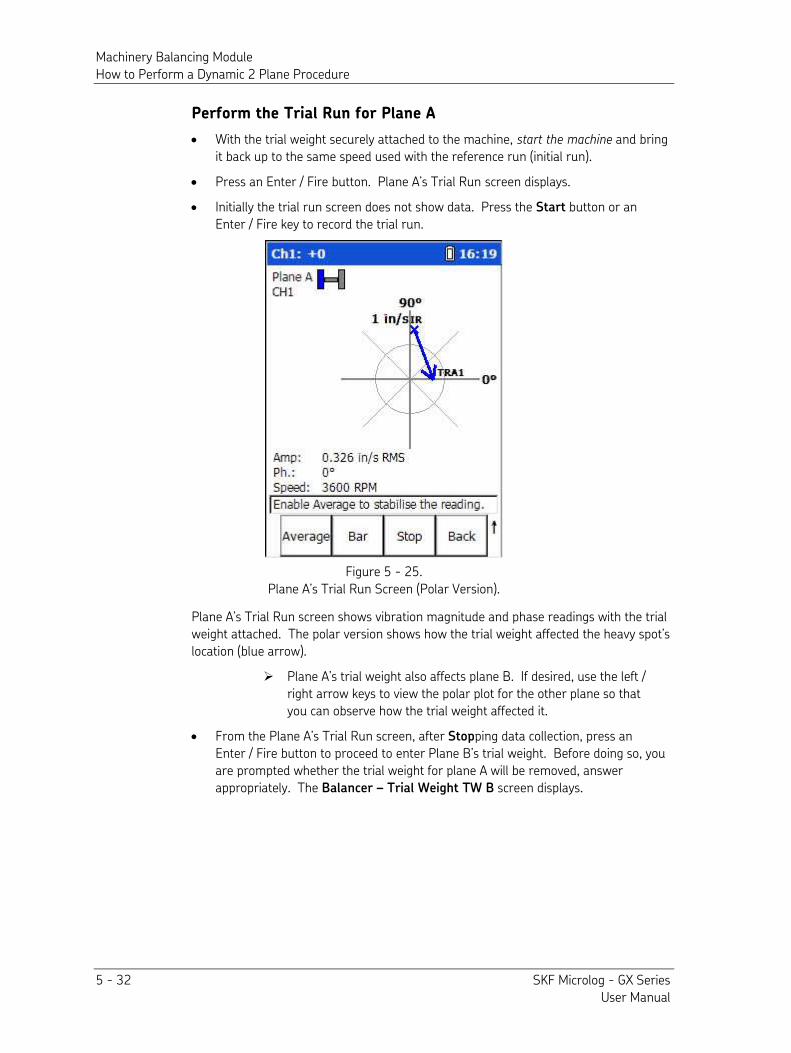
Machinery Balancing Module How to Perform a Dynamic 2 Plane Procedure
5 - 32 SKF Microlog - GX Series User Manual
Perform the Trial Run for Plane A
• With the trial weight securely attached to the machine, start the machine and bring it back up to the same speed used with the reference run (initial run).
• Press an Enter / Fire button. Plane A’s Trial Run screen displays.
• Initially the trial run screen does not show data. Press the Start button or an Enter / Fire key to record the trial run.
Figure 5 - 25. Plane A’s Trial Run Screen (Polar Version).
Plane A’s Trial Run screen shows vibration magnitude and phase readings with the trial weight attached. The polar version shows how the trial weight affected the heavy spot’s location (blue arrow).
Plane A’s trial weight also affects plane B. If desired, use the left / right arrow keys to view the polar plot for the other plane so that you can observe how the trial weight affected it.
• From the Plane A’s Trial Run screen, after Stopping data collection, press an Enter / Fire button to proceed to enter Plane B’s trial weight. Before doing so, you are prompted whether the trial weight for plane A will be removed, answer appropriately. The Balancer – Trial Weight TW B screen displays.
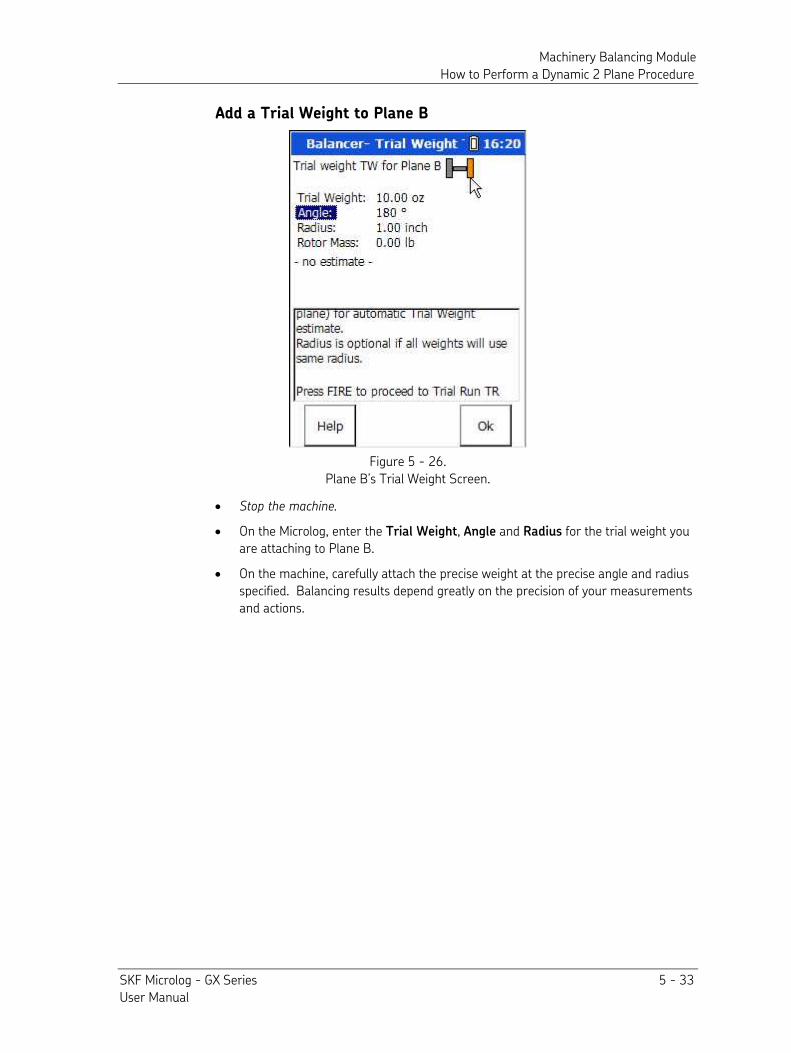
Machinery Balancing Module How to Perform a Dynamic 2 Plane Procedure
SKF Microlog - GX Series 5 - 33 User Manual
Add a Trial Weight to Plane B
Figure 5 - 26. Plane B’s Trial Weight Screen.
• Stop the machine.
• On the Microlog, enter the Trial Weight, Angle and Radius for the trial weight you are attaching to Plane B.
• On the machine, carefully attach the precise weight at the precise angle and radius specified. Balancing results depend greatly on the precision of your measurements and actions.
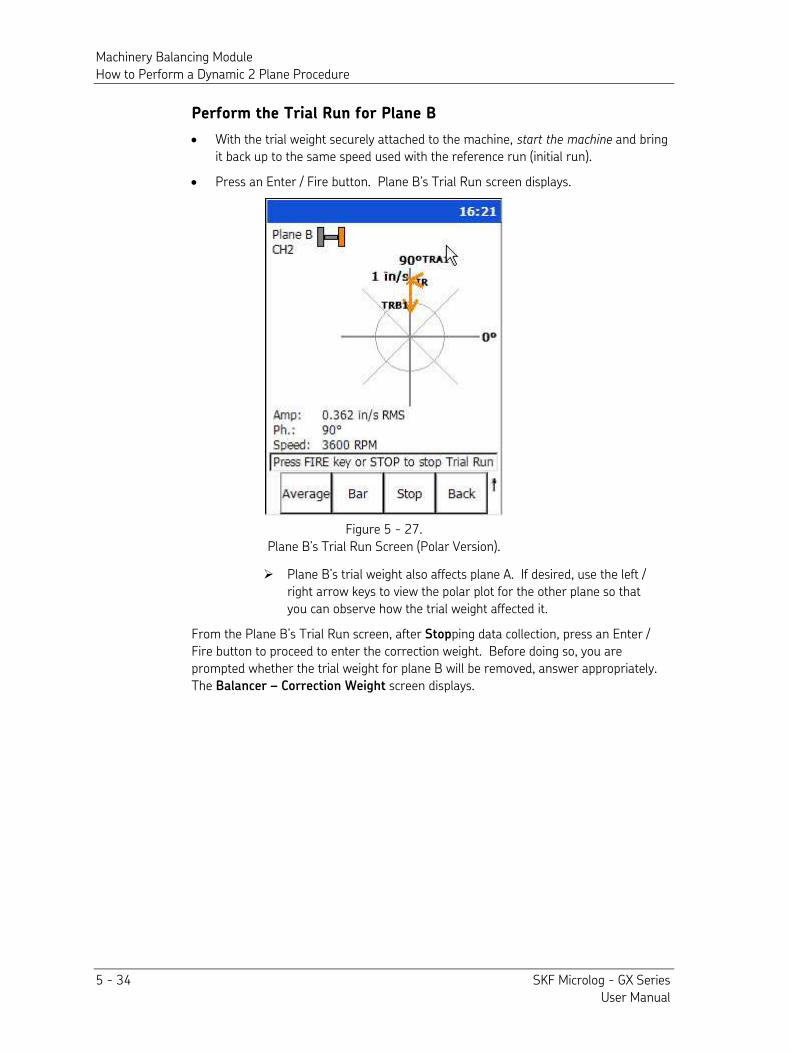
Machinery Balancing Module How to Perform a Dynamic 2 Plane Procedure
5 - 34 SKF Microlog - GX Series User Manual
Perform the Trial Run for Plane B
• With the trial weight securely attached to the machine, start the machine and bring it back up to the same speed used with the reference run (initial run).
• Press an Enter / Fire button. Plane B’s Trial Run screen displays.
Figure 5 - 27. Plane B’s Trial Run Screen (Polar Version).
Plane B’s trial weight also affects plane A. If desired, use the left / right arrow keys to view the polar plot for the other plane so that you can observe how the trial weight affected it.
From the Plane B’s Trial Run screen, after Stopping data collection, press an Enter / Fire button to proceed to enter the correction weight. Before doing so, you are prompted whether the trial weight for plane B will be removed, answer appropriately. The Balancer – Correction Weight screen displays.
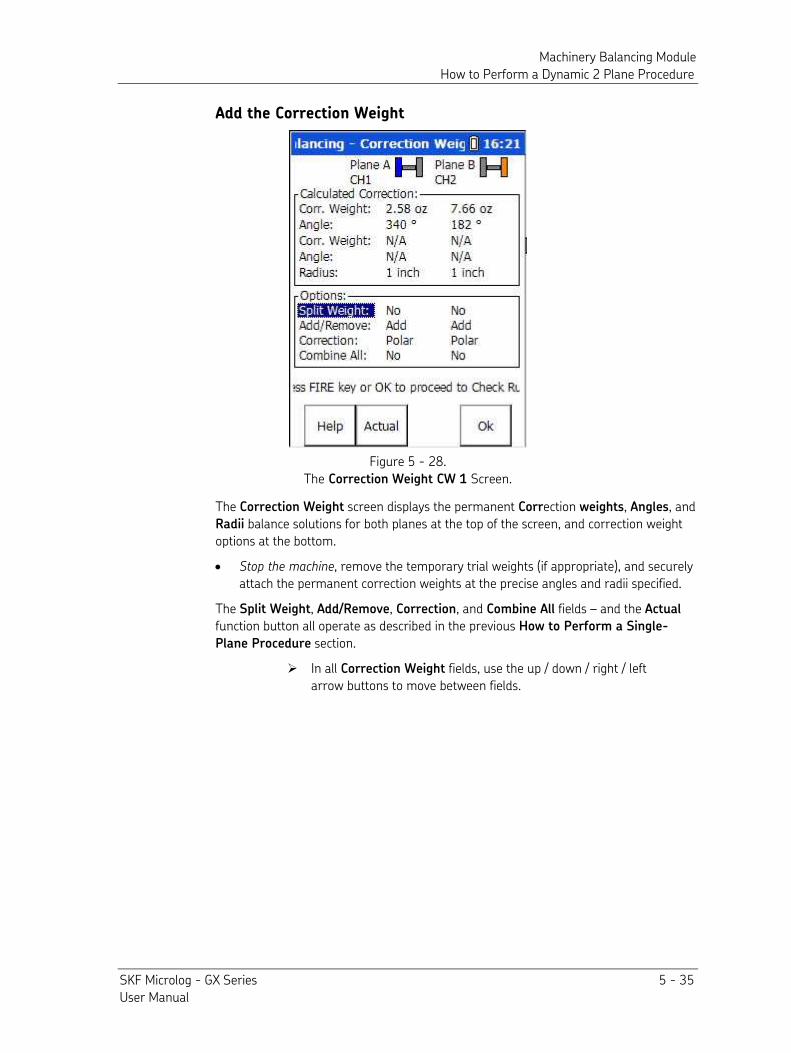
Machinery Balancing Module How to Perform a Dynamic 2 Plane Procedure
SKF Microlog - GX Series 5 - 35 User Manual
Add the Correction Weight
Figure 5 - 28. The Correction Weight CW 1 Screen.
The Correction Weight screen displays the permanent Correction weights, Angles, and Radii balance solutions for both planes at the top of the screen, and correction weight options at the bottom.
• Stop the machine, remove the temporary trial weights (if appropriate), and securely attach the permanent correction weights at the precise angles and radii specified.
The Split Weight, Add/Remove, Correction, and Combine All fields – and the Actual function button all operate as described in the previous How to Perform a Single-
Plane Procedure section.
In all Correction Weight fields, use the up / down / right / left arrow buttons to move between fields.
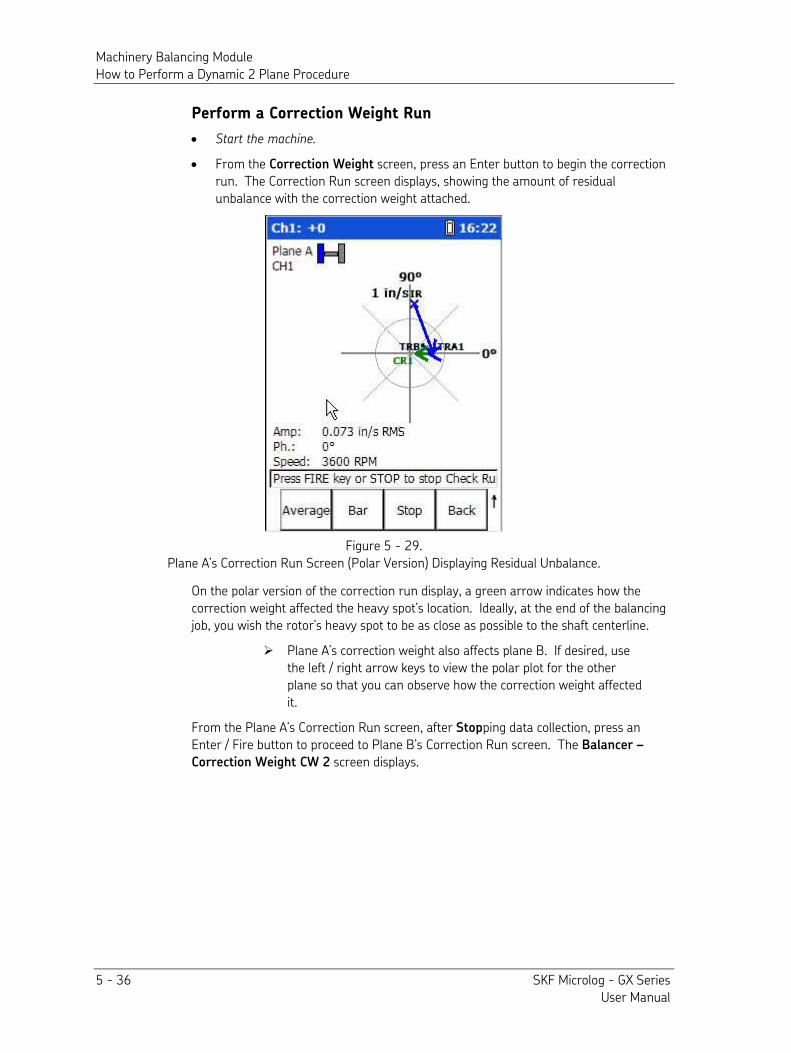
Machinery Balancing Module How to Perform a Dynamic 2 Plane Procedure
5 - 36 SKF Microlog - GX Series User Manual
Perform a Correction Weight Run
• Start the machine.
• From the Correction Weight screen, press an Enter button to begin the correction run. The Correction Run screen displays, showing the amount of residual unbalance with the correction weight attached.
Figure 5 - 29. Plane A’s Correction Run Screen (Polar Version) Displaying Residual Unbalance.
On the polar version of the correction run display, a green arrow indicates how the correction weight affected the heavy spot’s location. Ideally, at the end of the balancing job, you wish the rotor’s heavy spot to be as close as possible to the shaft centerline.
Plane A’s correction weight also affects plane B. If desired, use the left / right arrow keys to view the polar plot for the other plane so that you can observe how the correction weight affected it.
From the Plane A’s Correction Run screen, after Stopping data collection, press an Enter / Fire button to proceed to Plane B’s Correction Run screen. The Balancer –
Correction Weight CW 2 screen displays.
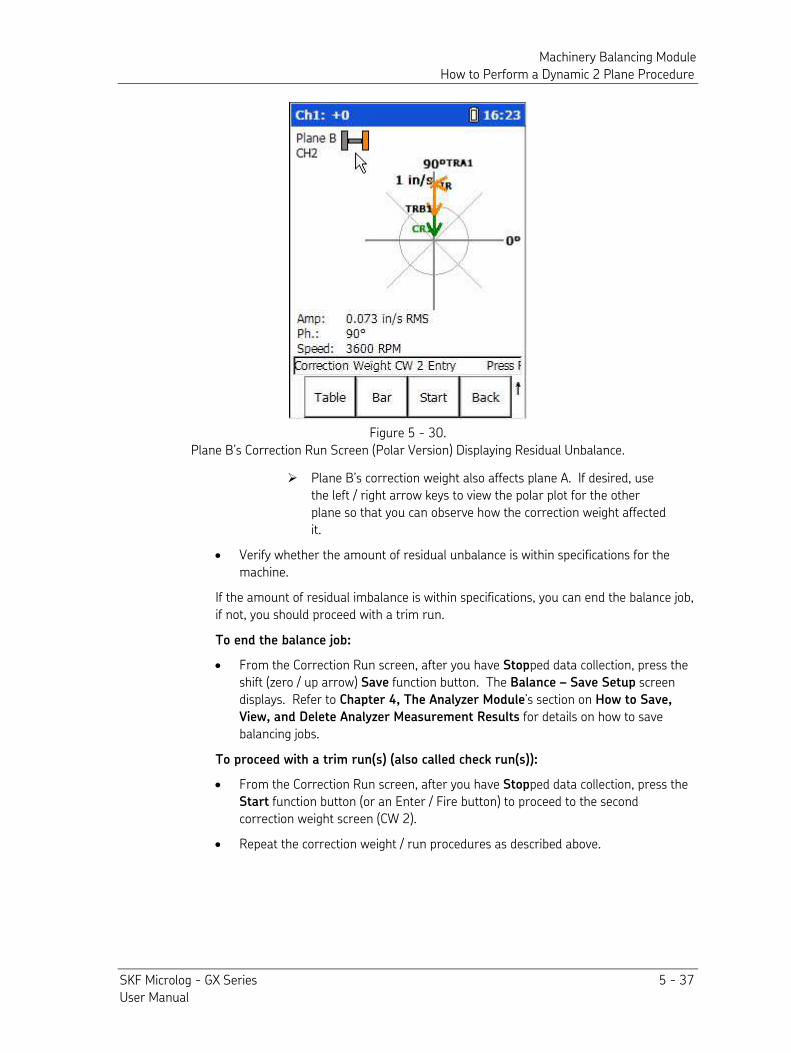
Machinery Balancing Module How to Perform a Dynamic 2 Plane Procedure
SKF Microlog - GX Series 5 - 37 User Manual
Figure 5 - 30. Plane B’s Correction Run Screen (Polar Version) Displaying Residual Unbalance.
Plane B’s correction weight also affects plane A. If desired, use the left / right arrow keys to view the polar plot for the other plane so that you can observe how the correction weight affected it.
• Verify whether the amount of residual unbalance is within specifications for the machine.
If the amount of residual imbalance is within specifications, you can end the balance job, if not, you should proceed with a trim run.
To end the balance job:
• From the Correction Run screen, after you have Stopped data collection, press the shift (zero / up arrow) Save function button. The Balance – Save Setup screen displays. Refer to Chapter 4, The Analyzer Module’s section on How to Save,
View, and Delete Analyzer Measurement Results for details on how to save balancing jobs.
To proceed with a trim run(s) (also called check run(s)):
• From the Correction Run screen, after you have Stopped data collection, press the Start function button (or an Enter / Fire button) to proceed to the second correction weight screen (CW 2).
• Repeat the correction weight / run procedures as described above.
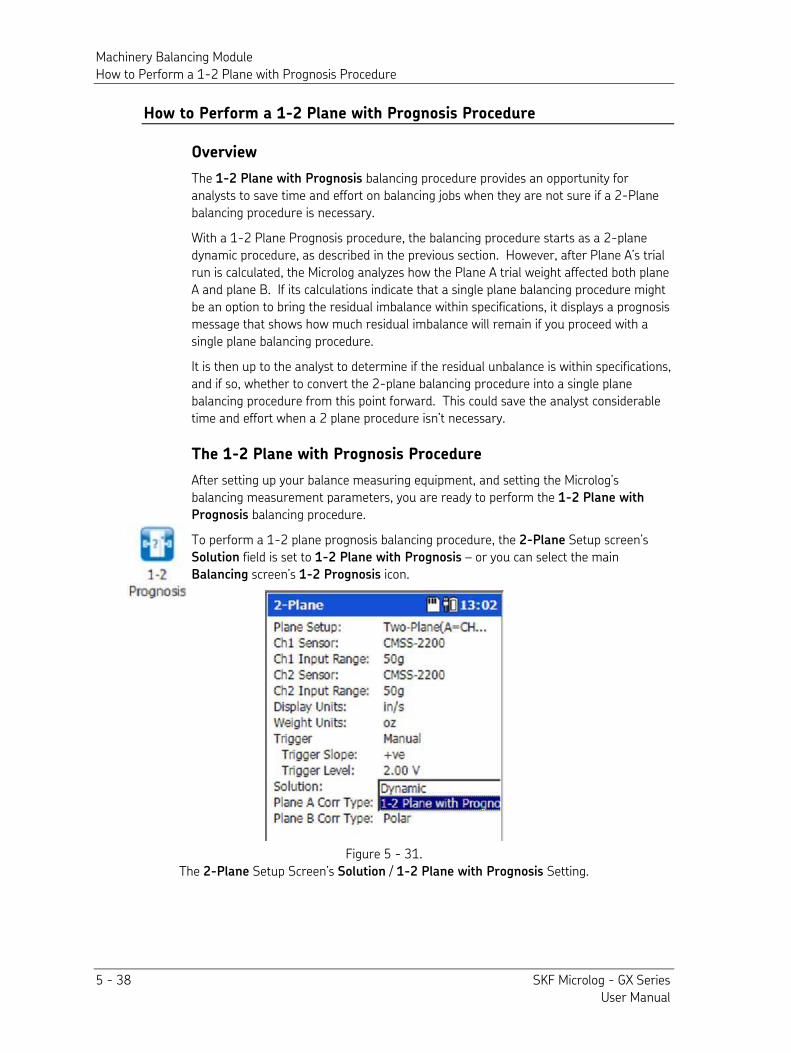
Machinery Balancing Module How to Perform a 1-2 Plane with Prognosis Procedure
5 - 38 SKF Microlog - GX Series User Manual
How to Perform a 1-2 Plane with Prognosis Procedure
Overview
The 1-2 Plane with Prognosis balancing procedure provides an opportunity for analysts to save time and effort on balancing jobs when they are not sure if a 2-Plane balancing procedure is necessary.
With a 1-2 Plane Prognosis procedure, the balancing procedure starts as a 2-plane dynamic procedure, as described in the previous section. However, after Plane A’s trial run is calculated, the Microlog analyzes how the Plane A trial weight affected both plane A and plane B. If its calculations indicate that a single plane balancing procedure might be an option to bring the residual imbalance within specifications, it displays a prognosis message that shows how much residual imbalance will remain if you proceed with a single plane balancing procedure.
It is then up to the analyst to determine if the residual unbalance is within specifications, and if so, whether to convert the 2-plane balancing procedure into a single plane balancing procedure from this point forward. This could save the analyst considerable time and effort when a 2 plane procedure isn’t necessary.
The 1-2 Plane with Prognosis Procedure
After setting up your balance measuring equipment, and setting the Microlog’s balancing measurement parameters, you are ready to perform the 1-2 Plane with
Prognosis balancing procedure.
To perform a 1-2 plane prognosis balancing procedure, the 2-Plane Setup screen’s Solution field is set to 1-2 Plane with Prognosis – or you can select the main Balancing screen’s 1-2 Prognosis icon.
Figure 5 - 31. The 2-Plane Setup Screen’s Solution / 1-2 Plane with Prognosis Setting.
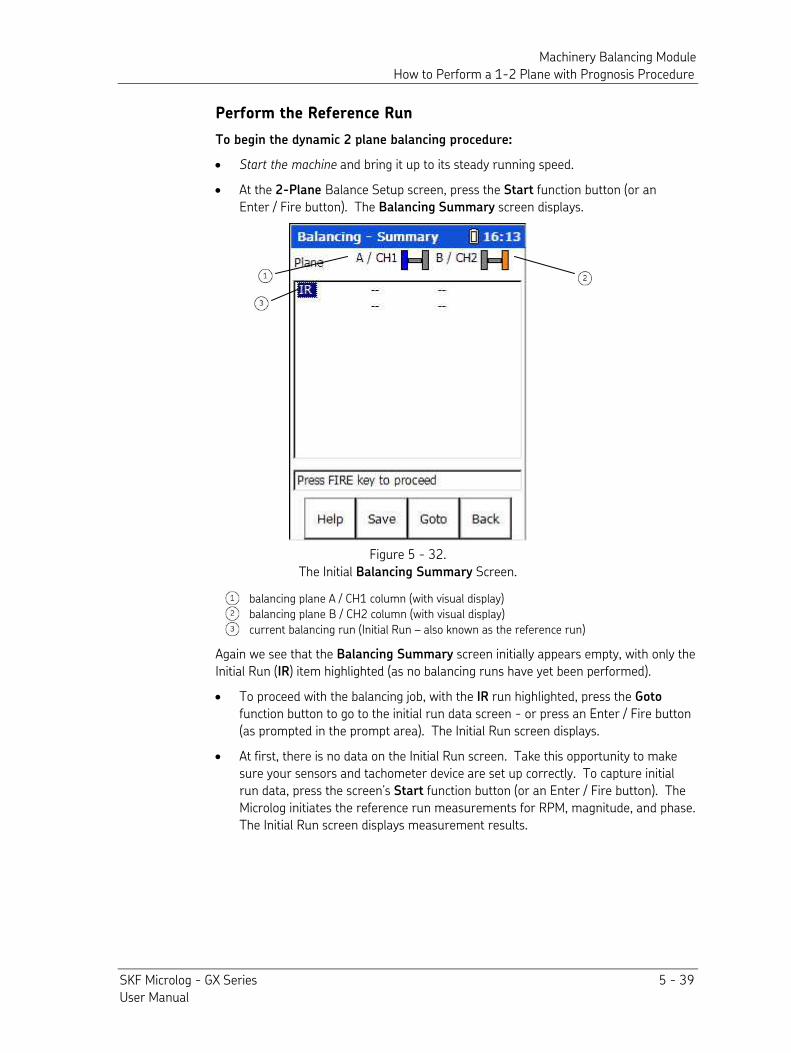
Machinery Balancing Module How to Perform a 1-2 Plane with Prognosis Procedure
SKF Microlog - GX Series 5 - 39 User Manual
Perform the Reference Run
To begin the dynamic 2 plane balancing procedure:
• Start the machine and bring it up to its steady running speed.
• At the 2-Plane Balance Setup screen, press the Start function button (or an Enter / Fire button). The Balancing Summary screen displays.
Figure 5 - 32. The Initial Balancing Summary Screen.
balancing plane A / CH1 column (with visual display) balancing plane B / CH2 column (with visual display)
current balancing run (Initial Run – also known as the reference run)
Again we see that the Balancing Summary screen initially appears empty, with only the Initial Run (IR) item highlighted (as no balancing runs have yet been performed).
• To proceed with the balancing job, with the IR run highlighted, press the Goto function button to go to the initial run data screen - or press an Enter / Fire button (as prompted in the prompt area). The Initial Run screen displays.
• At first, there is no data on the Initial Run screen. Take this opportunity to make sure your sensors and tachometer device are set up correctly. To capture initial run data, press the screen’s Start function button (or an Enter / Fire button). The Microlog initiates the reference run measurements for RPM, magnitude, and phase. The Initial Run screen displays measurement results.
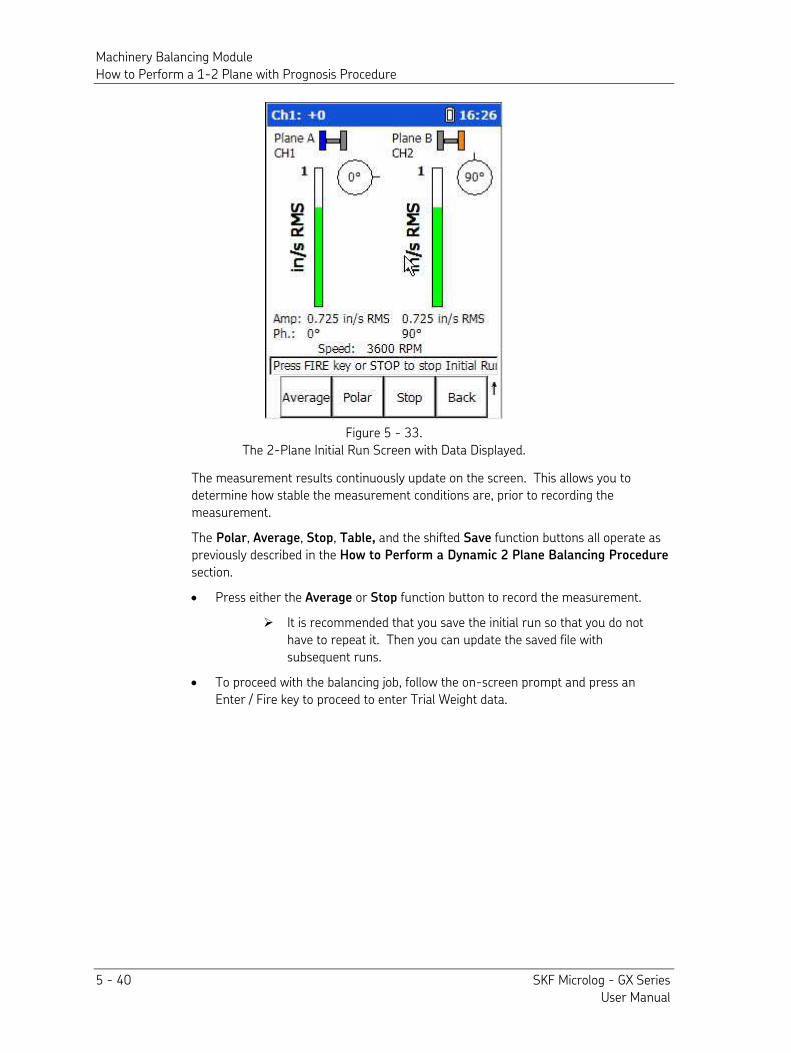
Machinery Balancing Module How to Perform a 1-2 Plane with Prognosis Procedure
5 - 40 SKF Microlog - GX Series User Manual
Figure 5 - 33. The 2-Plane Initial Run Screen with Data Displayed.
The measurement results continuously update on the screen. This allows you to determine how stable the measurement conditions are, prior to recording the measurement.
The Polar, Average, Stop, Table, and the shifted Save function buttons all operate as previously described in the How to Perform a Dynamic 2 Plane Balancing Procedure section.
• Press either the Average or Stop function button to record the measurement.
It is recommended that you save the initial run so that you do not have to repeat it. Then you can update the saved file with subsequent runs.
• To proceed with the balancing job, follow the on-screen prompt and press an Enter / Fire key to proceed to enter Trial Weight data.
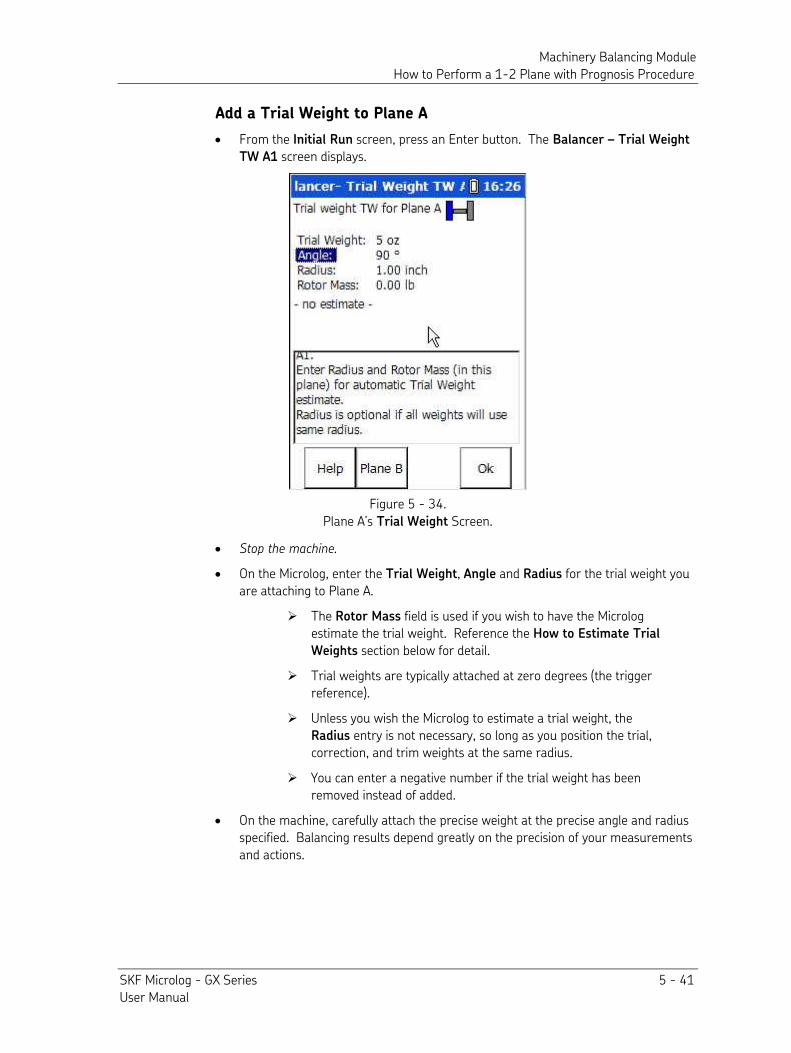
Machinery Balancing Module How to Perform a 1-2 Plane with Prognosis Procedure
SKF Microlog - GX Series 5 - 41 User Manual
Add a Trial Weight to Plane A
• From the Initial Run screen, press an Enter button. The Balancer – Trial Weight
TW A1 screen displays.
Figure 5 - 34. Plane A’s Trial Weight Screen.
• Stop the machine.
• On the Microlog, enter the Trial Weight, Angle and Radius for the trial weight you are attaching to Plane A.
The Rotor Mass field is used if you wish to have the Microlog estimate the trial weight. Reference the How to Estimate Trial
Weights section below for detail.
Trial weights are typically attached at zero degrees (the trigger reference).
Unless you wish the Microlog to estimate a trial weight, the Radius entry is not necessary, so long as you position the trial, correction, and trim weights at the same radius.
You can enter a negative number if the trial weight has been removed instead of added.
• On the machine, carefully attach the precise weight at the precise angle and radius specified. Balancing results depend greatly on the precision of your measurements and actions.
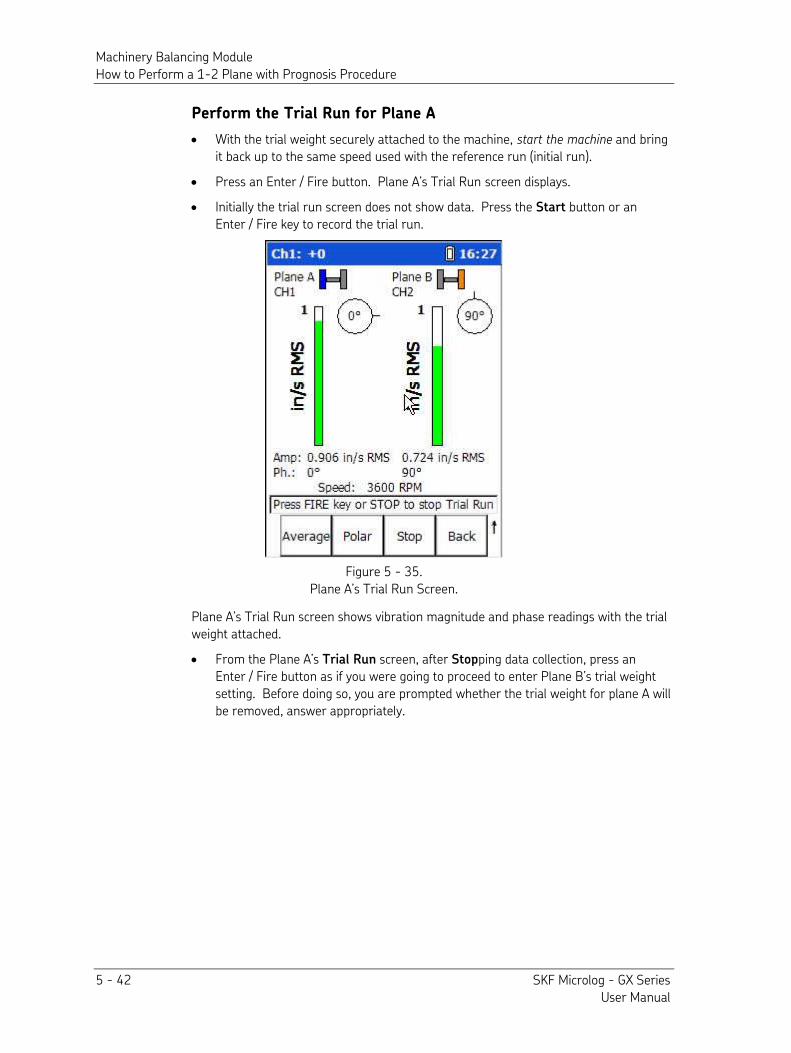
Machinery Balancing Module How to Perform a 1-2 Plane with Prognosis Procedure
5 - 42 SKF Microlog - GX Series User Manual
Perform the Trial Run for Plane A
• With the trial weight securely attached to the machine, start the machine and bring it back up to the same speed used with the reference run (initial run).
• Press an Enter / Fire button. Plane A’s Trial Run screen displays.
• Initially the trial run screen does not show data. Press the Start button or an Enter / Fire key to record the trial run.
Figure 5 - 35. Plane A’s Trial Run Screen.
Plane A’s Trial Run screen shows vibration magnitude and phase readings with the trial weight attached.
• From the Plane A’s Trial Run screen, after Stopping data collection, press an Enter / Fire button as if you were going to proceed to enter Plane B’s trial weight setting. Before doing so, you are prompted whether the trial weight for plane A will be removed, answer appropriately.
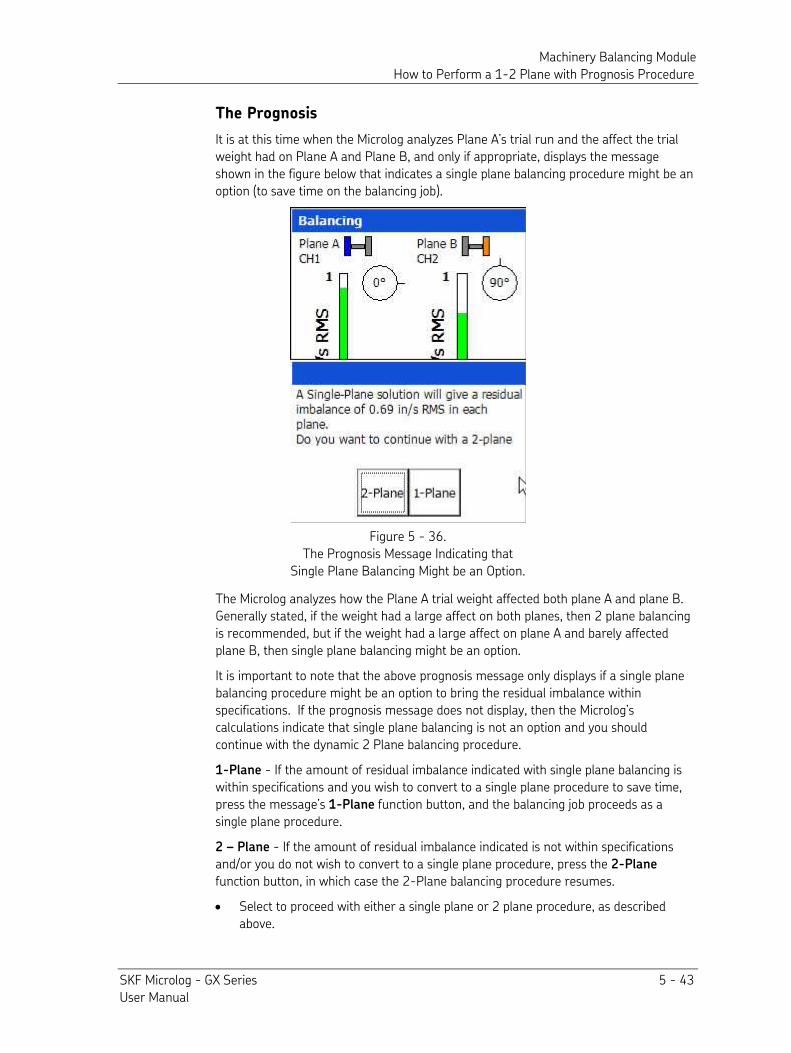
Machinery Balancing Module How to Perform a 1-2 Plane with Prognosis Procedure
SKF Microlog - GX Series 5 - 43 User Manual
The Prognosis
It is at this time when the Microlog analyzes Plane A’s trial run and the affect the trial weight had on Plane A and Plane B, and only if appropriate, displays the message shown in the figure below that indicates a single plane balancing procedure might be an option (to save time on the balancing job).
Figure 5 - 36. The Prognosis Message Indicating that
Single Plane Balancing Might be an Option. The Microlog analyzes how the Plane A trial weight affected both plane A and plane B. Generally stated, if the weight had a large affect on both planes, then 2 plane balancing is recommended, but if the weight had a large affect on plane A and barely affected plane B, then single plane balancing might be an option.
It is important to note that the above prognosis message only displays if a single plane balancing procedure might be an option to bring the residual imbalance within specifications. If the prognosis message does not display, then the Microlog’s calculations indicate that single plane balancing is not an option and you should continue with the dynamic 2 Plane balancing procedure.
1-Plane - If the amount of residual imbalance indicated with single plane balancing is within specifications and you wish to convert to a single plane procedure to save time, press the message’s 1-Plane function button, and the balancing job proceeds as a single plane procedure.
2 – Plane - If the amount of residual imbalance indicated is not within specifications and/or you do not wish to convert to a single plane procedure, press the 2-Plane function button, in which case the 2-Plane balancing procedure resumes.
• Select to proceed with either a single plane or 2 plane procedure, as described above.
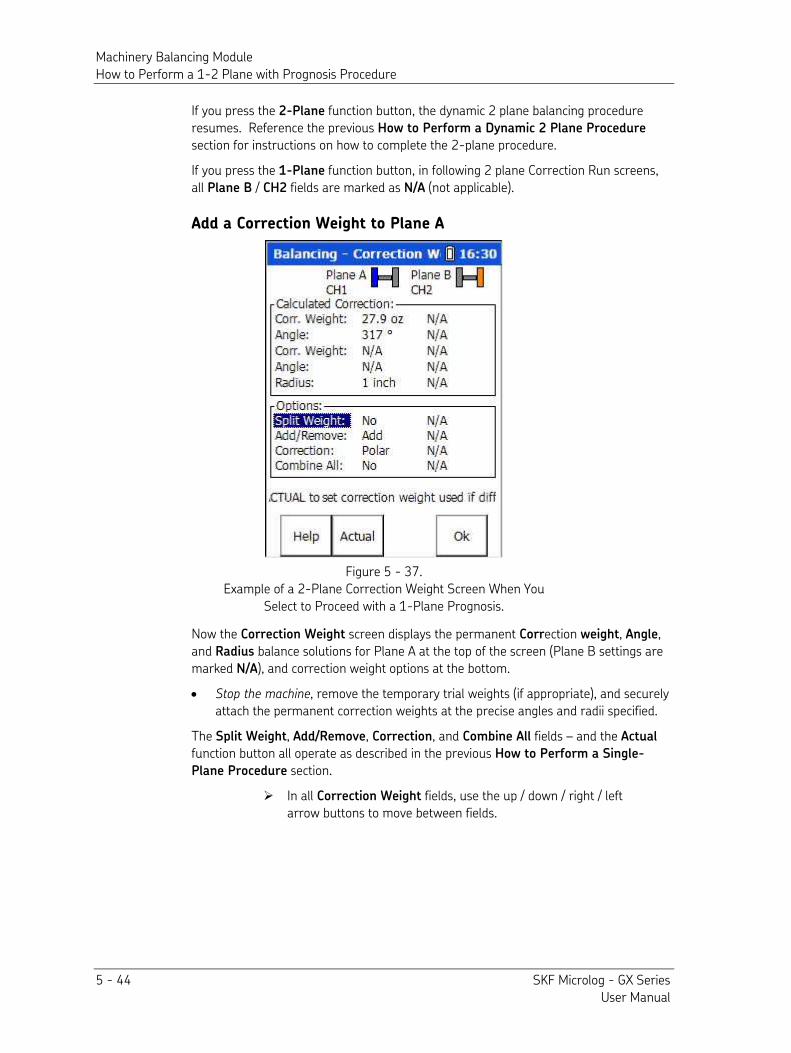
Machinery Balancing Module How to Perform a 1-2 Plane with Prognosis Procedure
5 - 44 SKF Microlog - GX Series User Manual
If you press the 2-Plane function button, the dynamic 2 plane balancing procedure resumes. Reference the previous How to Perform a Dynamic 2 Plane Procedure section for instructions on how to complete the 2-plane procedure.
If you press the 1-Plane function button, in following 2 plane Correction Run screens, all Plane B / CH2 fields are marked as N/A (not applicable).
Add a Correction Weight to Plane A
Figure 5 - 37. Example of a 2-Plane Correction Weight Screen When You
Select to Proceed with a 1-Plane Prognosis.
Now the Correction Weight screen displays the permanent Correction weight, Angle, and Radius balance solutions for Plane A at the top of the screen (Plane B settings are marked N/A), and correction weight options at the bottom.
• Stop the machine, remove the temporary trial weights (if appropriate), and securely attach the permanent correction weights at the precise angles and radii specified.
The Split Weight, Add/Remove, Correction, and Combine All fields – and the Actual function button all operate as described in the previous How to Perform a Single-
Plane Procedure section.
In all Correction Weight fields, use the up / down / right / left arrow buttons to move between fields.
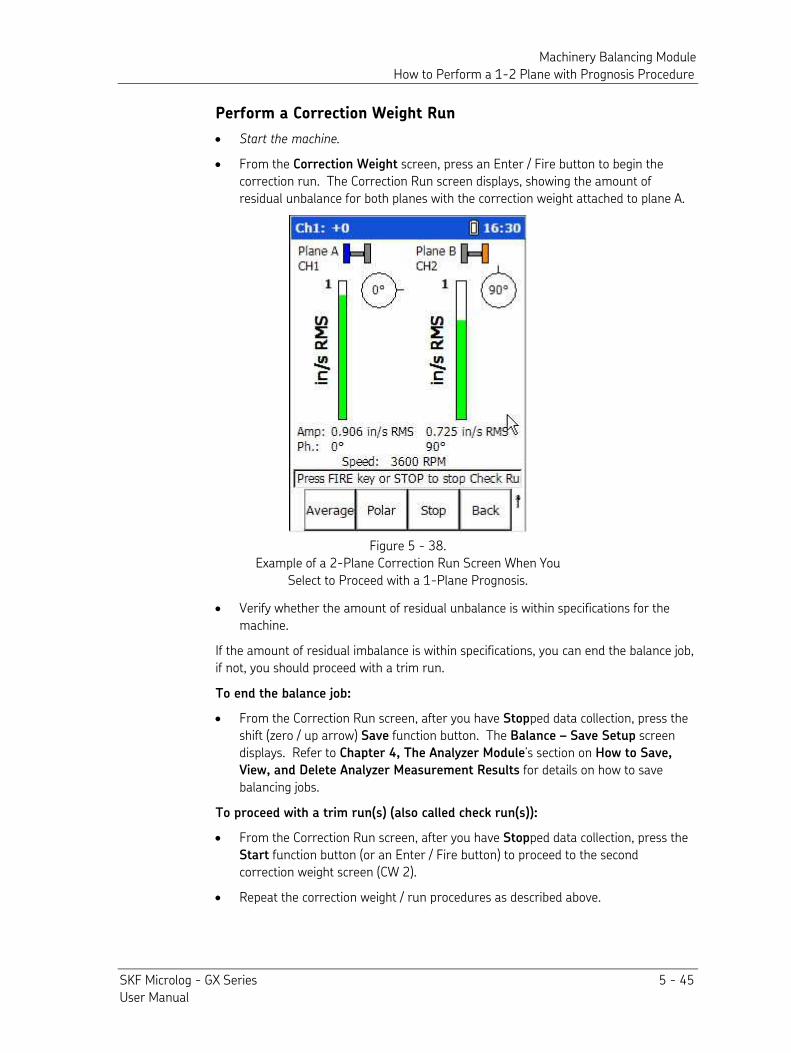
Machinery Balancing Module How to Perform a 1-2 Plane with Prognosis Procedure
SKF Microlog - GX Series 5 - 45 User Manual
Perform a Correction Weight Run
• Start the machine.
• From the Correction Weight screen, press an Enter / Fire button to begin the correction run. The Correction Run screen displays, showing the amount of residual unbalance for both planes with the correction weight attached to plane A.
Figure 5 - 38. Example of a 2-Plane Correction Run Screen When You
Select to Proceed with a 1-Plane Prognosis.
• Verify whether the amount of residual unbalance is within specifications for the machine.
If the amount of residual imbalance is within specifications, you can end the balance job, if not, you should proceed with a trim run.
To end the balance job:
• From the Correction Run screen, after you have Stopped data collection, press the shift (zero / up arrow) Save function button. The Balance – Save Setup screen displays. Refer to Chapter 4, The Analyzer Module’s section on How to Save,
View, and Delete Analyzer Measurement Results for details on how to save balancing jobs.
To proceed with a trim run(s) (also called check run(s)):
• From the Correction Run screen, after you have Stopped data collection, press the Start function button (or an Enter / Fire button) to proceed to the second correction weight screen (CW 2).
• Repeat the correction weight / run procedures as described above.
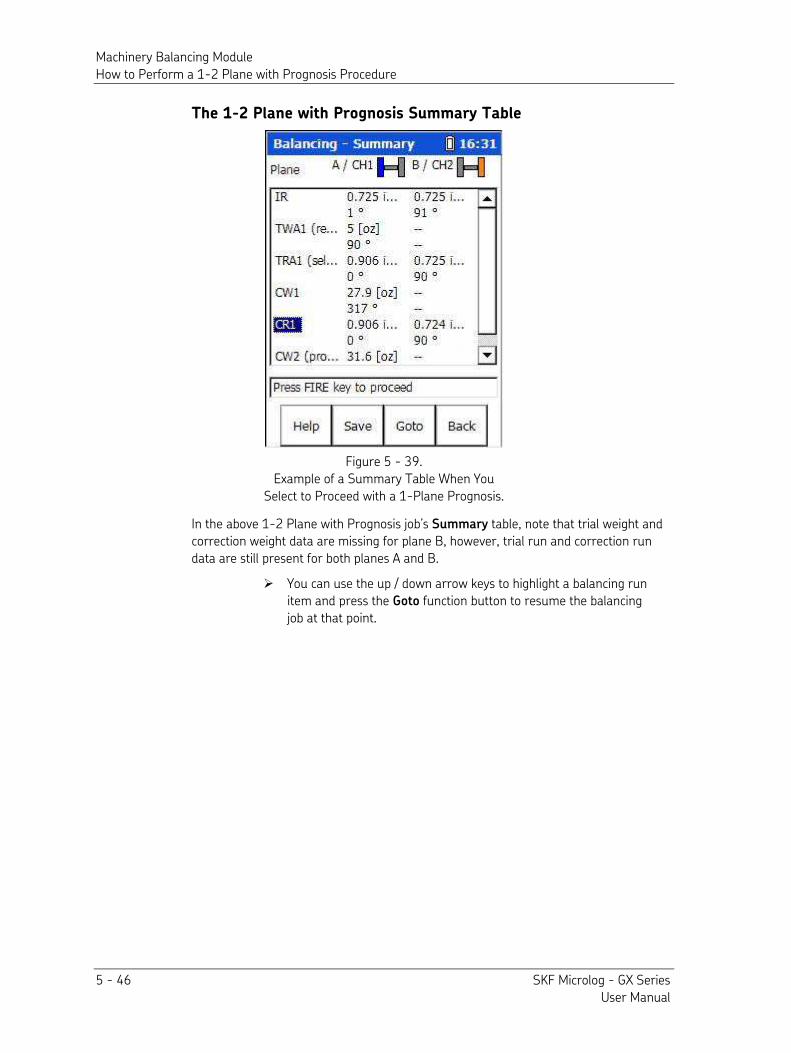
Machinery Balancing Module How to Perform a 1-2 Plane with Prognosis Procedure
5 - 46 SKF Microlog - GX Series User Manual
The 1-2 Plane with Prognosis Summary Table
Figure 5 - 39. Example of a Summary Table When You
Select to Proceed with a 1-Plane Prognosis.
In the above 1-2 Plane with Prognosis job’s Summary table, note that trial weight and correction weight data are missing for plane B, however, trial run and correction run data are still present for both planes A and B.
You can use the up / down arrow keys to highlight a balancing run item and press the Goto function button to resume the balancing job at that point.
Machinery Balancing Module Balancing Using the Strobe light
SKF Microlog - GX Series 5 - 47 User Manual
Balancing Using the Strobe light
The strobe light contains an internally tuned filter that is incorporated in a phase shifting network, which allows the shaft reference mark to be directed at any convenient location on the machine while balancing or performing motion studies (phase measurement) along a machine’s casing or along a machine train.
Examples of a convenient location are the machine’s horizontal split line, top or bottom dead center, or the plane of the reference transducer.
It is recommended to log this reference location for use in future studies or balancing procedures.
As a general setup guideline, in order to be triggered properly and to read phase properly, check the following:
• Connect the interface cables between the strobe light and the GX. The Input and Output jacks are located on the left side of the strobe light.
• Connect the vibration transducer to the strobe light cable.
Use accessory cables CMAC 5404 (input cable) and CMAC 5406 (output cable). Reference Appendix C, Using the Headphones
and Strobe Light for connection details.
Ensure the phase control knob on the strobe light indicates 0.
Ensure the lock / track rocker switch is set to INT. Set the bandwidth rocker switch to the desired position (narrow if
you expect the 1X speed to be constant or wide if you expect the 1X to vary).
Important! Ensure the strobe light battery is fully charged before you start balancing. If the battery is close to being fully discharged you will not get accurate readings.
The vibration transducer provides the signal the strobe uses as a phase trigger source and is the input to the strobe. The vibration transducer also provides the vibration signal to the GX. The interface cable provides a “TEE” connection to both. The strobe provides the phase referenced tachometer signal (output), which is used as a TTL input to the GX for triggering.
• When you are ready to start the balancing procedure and the machine is running, tune the strobe to 1X running speed.
Reference your Strobe Light User Manual for details on how to tune the strobe.
• Once the reference mark is frozen (slight rotation is acceptable), switch the Lock / Track rocker switch to EXT. The flash rate is now derived from the vibration transducer.
The trigger must stay depressed until the Microlog is finished capturing the data.
Once the Microlog has captured the data return the Lock / Track rocker switch to INT.
Machinery Balancing Module Balancing Using the Strobe light
5 - 48 SKF Microlog - GX Series User Manual
• Subsequent runs (add trial weight, etc.) will require you to go through the process of tuning and locking (lock / track rocker to EXT) before taking readings.
If the strobe does not respond to the signal supplied to it by the Microlog, it is possible that the trigger signal to the strobe is too low. The output level is shown on the screen as a number from +0 to +10. If the number shown is +0 then no amplification is going to the strobe.
To increase the signal to the strobe:
• On the GX, press shift (0 / up arrow) and the up arrow button. Each press of the key will increment the number by one. It is recommended that a level of +5 is set.
You may need to adjust this level during the balance procedure, especially after attaching the correction weight as the 1X signal will be significantly lower.
When the strobe is tuned in Internal mode, and then switched to LOCK mode, the filter in the strobe tracks slight changes in speed. If the speed changes too much or too fast, the strobe loses LOCK / TRACK and stops flashing. It will be necessary to switch back to Internal mode and repeat the adjustments. Also, try switching between the Narrow and Wide Bandwidth LOCK to optimize results. Generally, the Wide Bandwidth will give best tracking results, and the Narrow Bandwidth will give better stabilization.
SKF Microlog - GX Series 6 - 1 User Manual
6
Data Recorder Module
Overview
Warning - Due to required accessories, this module is not for use in Class I Division 2 hazardous locations. Restrictions apply when used in ATEX zone 2 hazardous locations. Reference this manual's Appendix D, Safety Instructions for details.
The GX Series’ Data Recorder module records a machine’s raw vibration signal (time waveform) as a Microsoft Windows .wav audio file. The recorded time waveform may be viewed on the Microlog for in-the-field analysis, or the .wav file can be imported into SKF's @ptitude Analyst / Analysis and Reporting Module software. Using the analysis software, you can play the .wav recording and post-process vibration analysis measurements on it as if you were performing measurements on the machine in real time.
Examples for use include:
• For analysis of very low speed machinery.
• Capturing run up / run down data, intermittent events, and transient vibration signals from non steady state machinery.
• With a problem machine that can’t be run for any length of time without additional damage resulting, you can record the vibration signal as .wav data while you run the machine for a short time. You can then shut down the machine to avoid further damage, and play the recorded .wav file as many times as you like while you take your time performing vibration analysis measurements on the machine’s recorded vibration signal.
• For ship propulsion systems, instead of spending hours of gas turbine drive time taking analysis measurements at the ship’s maximum speed, you can instead run the ship up to full speed, record a five minute .wav file at full speed, then run back down and perform hours of analysis measurements on the recorded vibration signal, saving a lot of costly fuel!
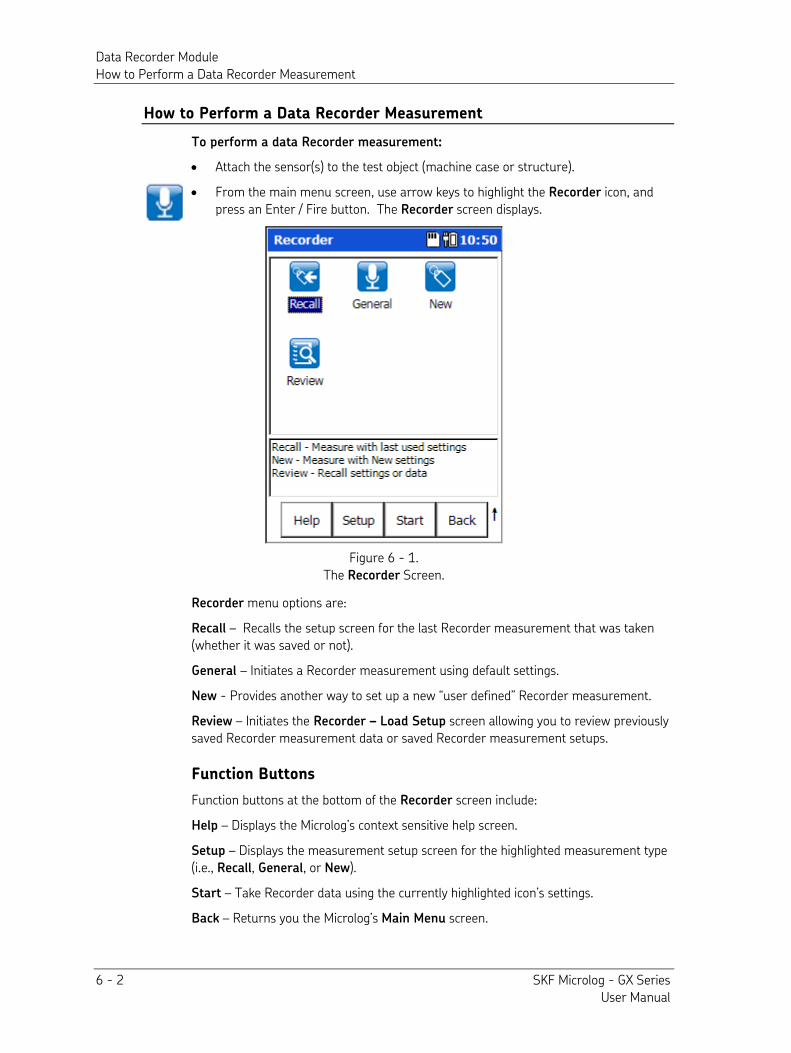
Data Recorder Module How to Perform a Data Recorder Measurement
6 - 2 SKF Microlog - GX Series User Manual
How to Perform a Data Recorder Measurement
To perform a data Recorder measurement:
• Attach the sensor(s) to the test object (machine case or structure).
• From the main menu screen, use arrow keys to highlight the Recorder icon, and press an Enter / Fire button. The Recorder screen displays.
Figure 6 - 1. The Recorder Screen.
Recorder menu options are:
Recall – Recalls the setup screen for the last Recorder measurement that was taken (whether it was saved or not).
General – Initiates a Recorder measurement using default settings.
New - Provides another way to set up a new “user defined” Recorder measurement.
Review – Initiates the Recorder – Load Setup screen allowing you to review previously saved Recorder measurement data or saved Recorder measurement setups.
Function Buttons
Function buttons at the bottom of the Recorder screen include:
Help – Displays the Microlog’s context sensitive help screen.
Setup – Displays the measurement setup screen for the highlighted measurement type (i.e., Recall, General, or New).
Start – Take Recorder data using the currently highlighted icon’s settings.
Back – Returns you the Microlog’s Main Menu screen.
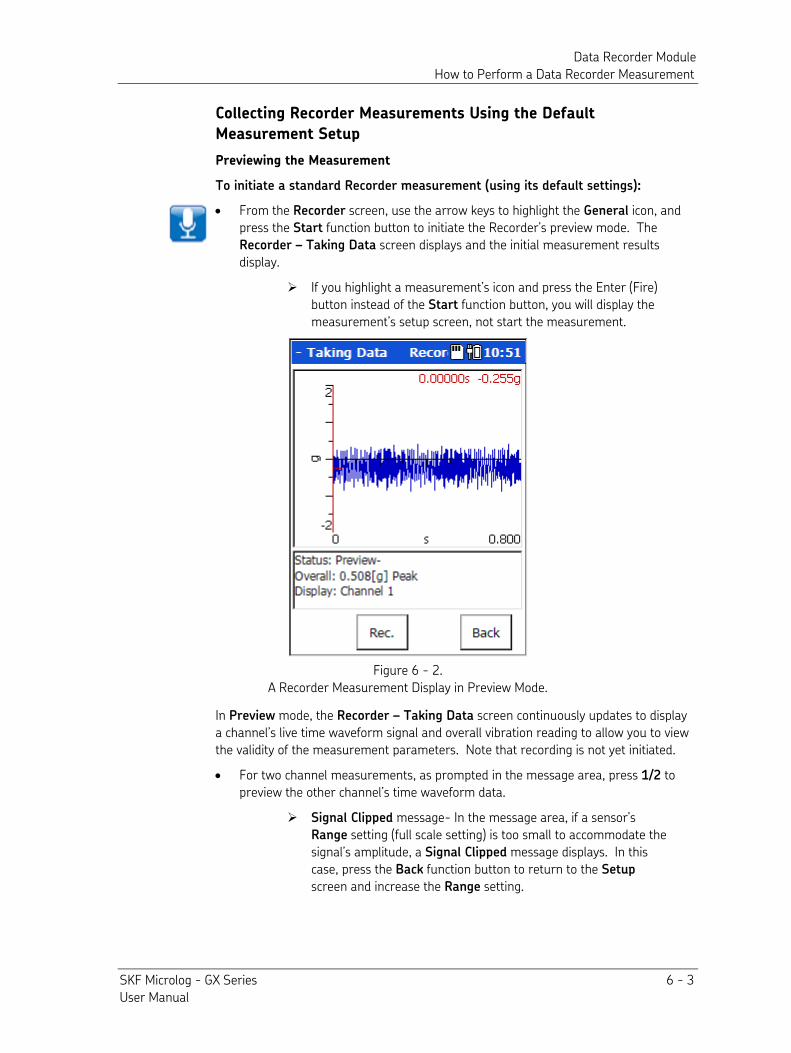
Data Recorder Module How to Perform a Data Recorder Measurement
SKF Microlog - GX Series 6 - 3 User Manual
Collecting Recorder Measurements Using the Default
Measurement Setup
Previewing the Measurement
To initiate a standard Recorder measurement (using its default settings):
• From the Recorder screen, use the arrow keys to highlight the General icon, and press the Start function button to initiate the Recorder’s preview mode. The Recorder – Taking Data screen displays and the initial measurement results display.
If you highlight a measurement’s icon and press the Enter (Fire) button instead of the Start function button, you will display the measurement’s setup screen, not start the measurement.
Figure 6 - 2. A Recorder Measurement Display in Preview Mode.
In Preview mode, the Recorder – Taking Data screen continuously updates to display a channel’s live time waveform signal and overall vibration reading to allow you to view the validity of the measurement parameters. Note that recording is not yet initiated. • For two channel measurements, as prompted in the message area, press 1/2 to
preview the other channel’s time waveform data.
Signal Clipped message- In the message area, if a sensor’s Range setting (full scale setting) is too small to accommodate the signal’s amplitude, a Signal Clipped message displays. In this case, press the Back function button to return to the Setup screen and increase the Range setting.
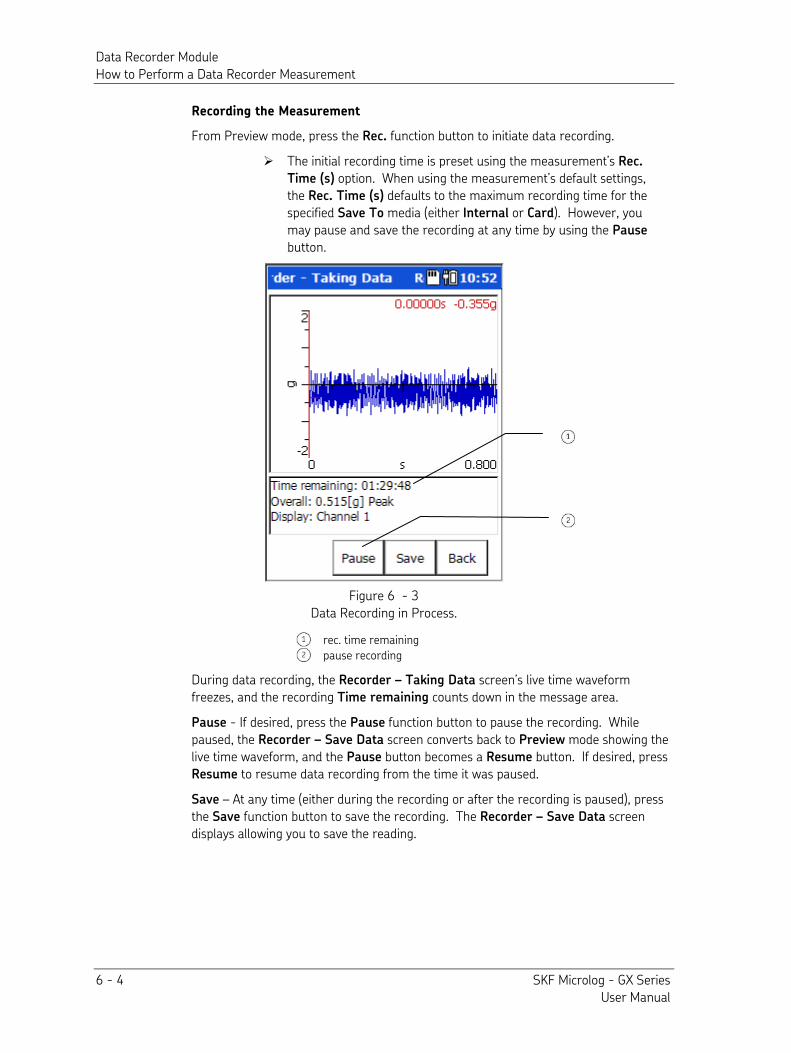
Data Recorder Module How to Perform a Data Recorder Measurement
6 - 4 SKF Microlog - GX Series User Manual
Recording the Measurement
From Preview mode, press the Rec. function button to initiate data recording.
The initial recording time is preset using the measurement’s Rec.
Time (s) option. When using the measurement’s default settings, the Rec. Time (s) defaults to the maximum recording time for the specified Save To media (either Internal or Card). However, you may pause and save the recording at any time by using the Pause button.
Figure 6 - 3 Data Recording in Process.
rec. time remaining
pause recording
During data recording, the Recorder – Taking Data screen’s live time waveform freezes, and the recording Time remaining counts down in the message area.
Pause - If desired, press the Pause function button to pause the recording. While paused, the Recorder – Save Data screen converts back to Preview mode showing the live time waveform, and the Pause button becomes a Resume button. If desired, press Resume to resume data recording from the time it was paused.
Save – At any time (either during the recording or after the recording is paused), press the Save function button to save the recording. The Recorder – Save Data screen displays allowing you to save the reading.
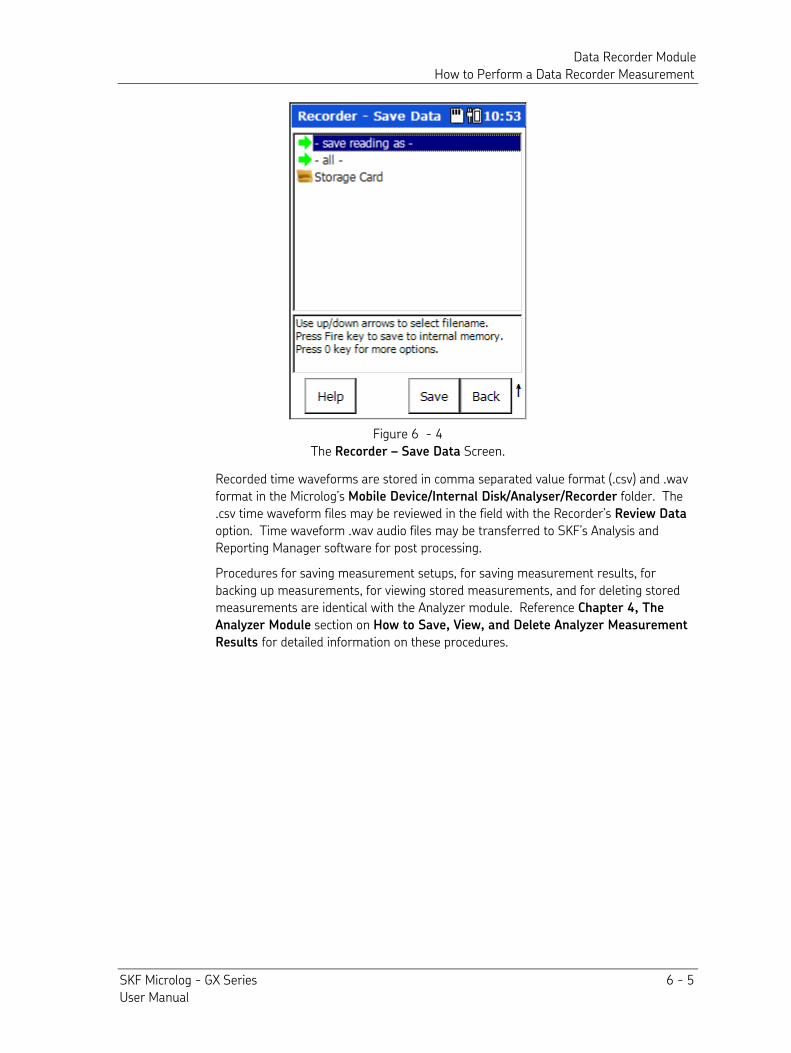
Data Recorder Module How to Perform a Data Recorder Measurement
SKF Microlog - GX Series 6 - 5 User Manual
Figure 6 - 4 The Recorder – Save Data Screen.
Recorded time waveforms are stored in comma separated value format (.csv) and .wav format in the Microlog’s Mobile Device/Internal Disk/Analyser/Recorder folder. The .csv time waveform files may be reviewed in the field with the Recorder’s Review Data option. Time waveform .wav audio files may be transferred to SKF’s Analysis and Reporting Manager software for post processing.
Procedures for saving measurement setups, for saving measurement results, for backing up measurements, for viewing stored measurements, and for deleting stored measurements are identical with the Analyzer module. Reference Chapter 4, The
Analyzer Module section on How to Save, View, and Delete Analyzer Measurement
Results for detailed information on these procedures.
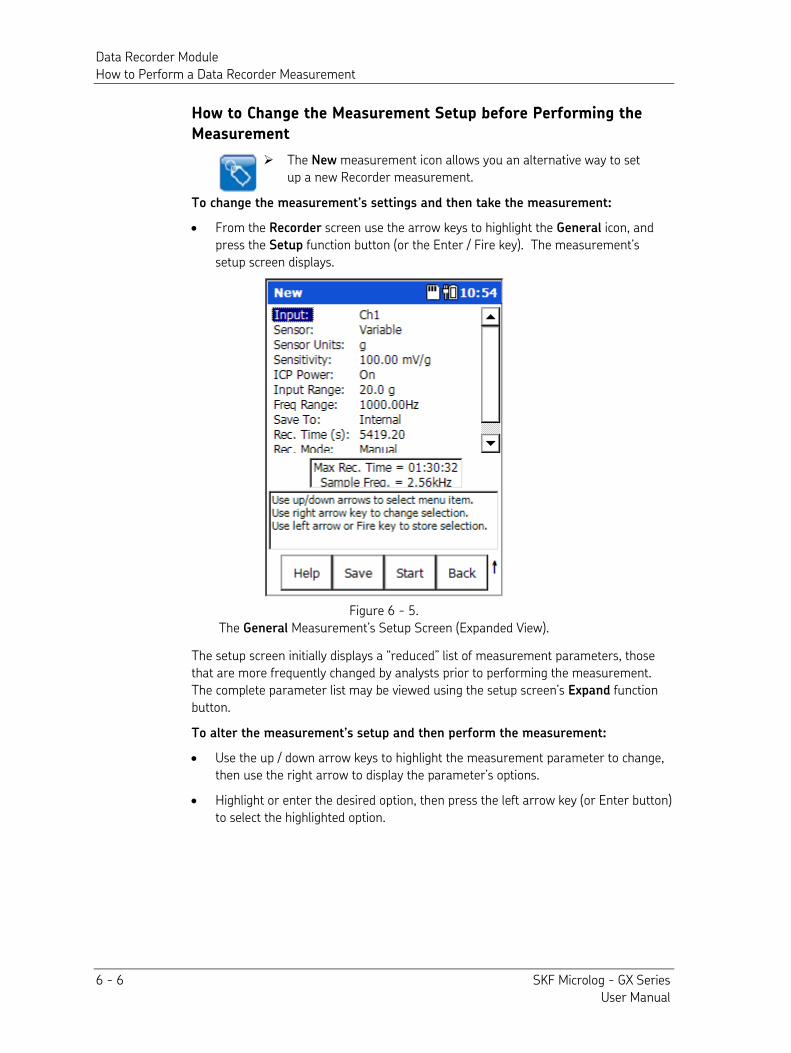
Data Recorder Module How to Perform a Data Recorder Measurement
6 - 6 SKF Microlog - GX Series User Manual
How to Change the Measurement Setup before Performing the
Measurement
The New measurement icon allows you an alternative way to set up a new Recorder measurement.
To change the measurement’s settings and then take the measurement:
• From the Recorder screen use the arrow keys to highlight the General icon, and press the Setup function button (or the Enter / Fire key). The measurement’s setup screen displays.
Figure 6 - 5. The General Measurement’s Setup Screen (Expanded View).
The setup screen initially displays a “reduced” list of measurement parameters, those that are more frequently changed by analysts prior to performing the measurement. The complete parameter list may be viewed using the setup screen’s Expand function button.
To alter the measurement’s setup and then perform the measurement:
• Use the up / down arrow keys to highlight the measurement parameter to change, then use the right arrow to display the parameter’s options.
• Highlight or enter the desired option, then press the left arrow key (or Enter button) to select the highlighted option.
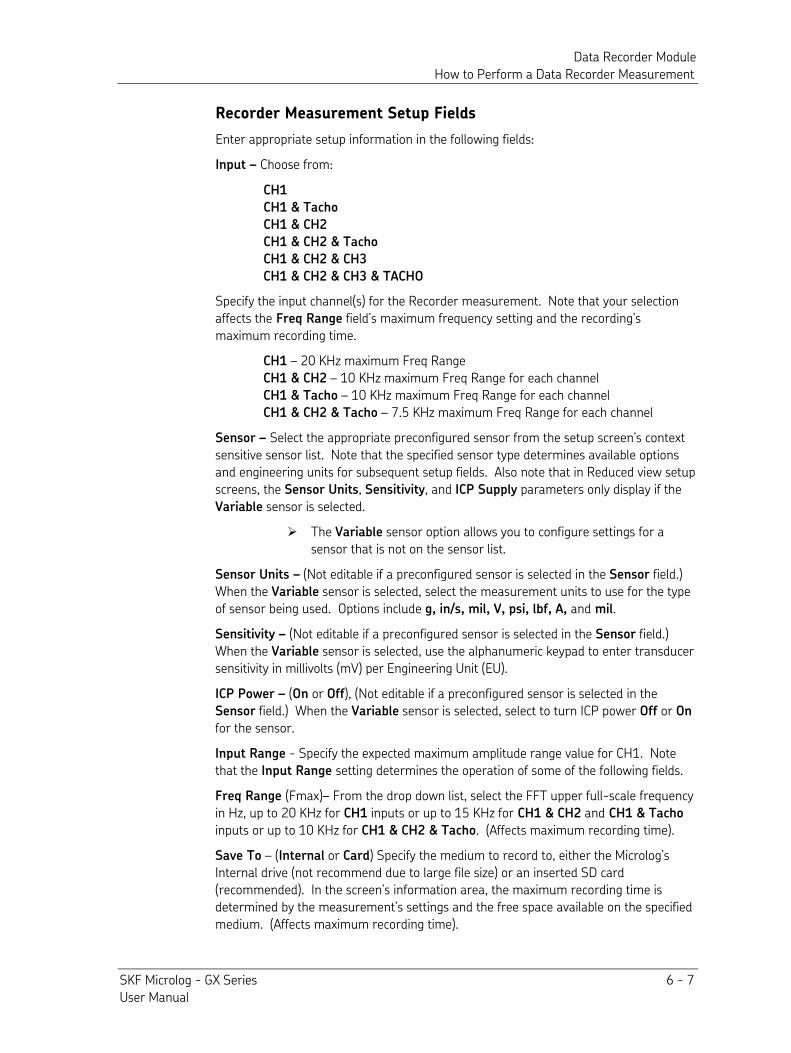
Data Recorder Module How to Perform a Data Recorder Measurement
SKF Microlog - GX Series 6 - 7 User Manual
Recorder Measurement Setup Fields
Enter appropriate setup information in the following fields:
Input – Choose from:
CH1
CH1 & Tacho
CH1 & CH2
CH1 & CH2 & Tacho
CH1 & CH2 & CH3 CH1 & CH2 & CH3 & TACHO
Specify the input channel(s) for the Recorder measurement. Note that your selection affects the Freq Range field’s maximum frequency setting and the recording’s maximum recording time.
CH1 – 20 KHz maximum Freq Range CH1 & CH2 – 10 KHz maximum Freq Range for each channel CH1 & Tacho – 10 KHz maximum Freq Range for each channel CH1 & CH2 & Tacho – 7.5 KHz maximum Freq Range for each channel
Sensor – Select the appropriate preconfigured sensor from the setup screen’s context sensitive sensor list. Note that the specified sensor type determines available options and engineering units for subsequent setup fields. Also note that in Reduced view setup screens, the Sensor Units, Sensitivity, and ICP Supply parameters only display if the Variable sensor is selected.
The Variable sensor option allows you to configure settings for a sensor that is not on the sensor list.
Sensor Units – (Not editable if a preconfigured sensor is selected in the Sensor field.) When the Variable sensor is selected, select the measurement units to use for the type of sensor being used. Options include g, in/s, mil, V, psi, lbf, A, and mil.
Sensitivity – (Not editable if a preconfigured sensor is selected in the Sensor field.) When the Variable sensor is selected, use the alphanumeric keypad to enter transducer sensitivity in millivolts (mV) per Engineering Unit (EU).
ICP Power – (On or Off), (Not editable if a preconfigured sensor is selected in the Sensor field.) When the Variable sensor is selected, select to turn ICP power Off or On for the sensor.
Input Range - Specify the expected maximum amplitude range value for CH1. Note that the Input Range setting determines the operation of some of the following fields.
Freq Range (Fmax)– From the drop down list, select the FFT upper full-scale frequency in Hz, up to 20 KHz for CH1 inputs or up to 15 KHz for CH1 & CH2 and CH1 & Tacho inputs or up to 10 KHz for CH1 & CH2 & Tacho. (Affects maximum recording time).
Save To – (Internal or Card) Specify the medium to record to, either the Microlog’s Internal drive (not recommend due to large file size) or an inserted SD card (recommended). In the screen’s information area, the maximum recording time is determined by the measurement’s settings and the free space available on the specified medium. (Affects maximum recording time).

Data Recorder Module How to Perform a Data Recorder Measurement
6 - 8 SKF Microlog - GX Series User Manual
Rec. Time (s) – Specify the number of seconds to record the vibration signal.
Rec. Mode – (Manual, CH1 Level, or Tacho) Works with the Input field. Specify whether to initiate data recording manually, or to use a CH1 trigger level to initiate recording, or to use a tachometer for triggering data recording (if Input is set to CH1 &
Tacho). (in this case, as soon as the Microlog receives a tachometer signal, data recording initiates).
Save – If desired, from the measurement setup screen, you may press the Save function button to save the measurement setup for easy reuse in the future. Reference Chapter 4, The Analyzer Module section on Saving Analyzer Measurement Results for details on how to save your measurement setup.
• After you are finished with your measurement setup changes, press the Start function button to begin the measurement using the new settings. The measurement is performed and the initial measurement results display.
Function button options for completing, viewing and saving the measurement’s results operate as previously described in this chapter’s Collecting Recorder Measurements
Using the Default Measurement Setup section. Reference this previous section for details.
SKF Microlog - GX Series 7 - 1 User Manual
7
Run Up / Coast Down Module
Overview
Warning - Due to required accessories, this module is not for use in Class I Division 2 hazardous locations. Restrictions apply when used in ATEX zone 2 hazardous locations. Reference this manual's Appendix D, Safety Instructions for details.
The GX Series’ run up / coast down (RUCD) module records and analyses run up / coast down data, intermittent events, and transient vibration signals from non steady state machinery.
The module simultaneously acquires a noise / vibration signal and a tachometer signal from a machine, and records the resulting time waveform as a Microsoft Windows .wav audio file.
The recorded time waveform .wav file can then be analyzed and re-analyzed as often as necessary. Analysis results are presented in a variety of plot formats to best extract and display the data in the most meaningful way. Available display formats include:
• Bode plot
• Nyquist plot • Waterfall plot • Spectrogram
• Table
One of the primary objectives of RUCD analysis is to determine a machine’s critical speeds / resonant frequencies.
For optimized recording, the RUCD module should be used in conjunction with an ultra high speed SD card. Saving data to a card will greatly increase the amount of data able to be recorded.
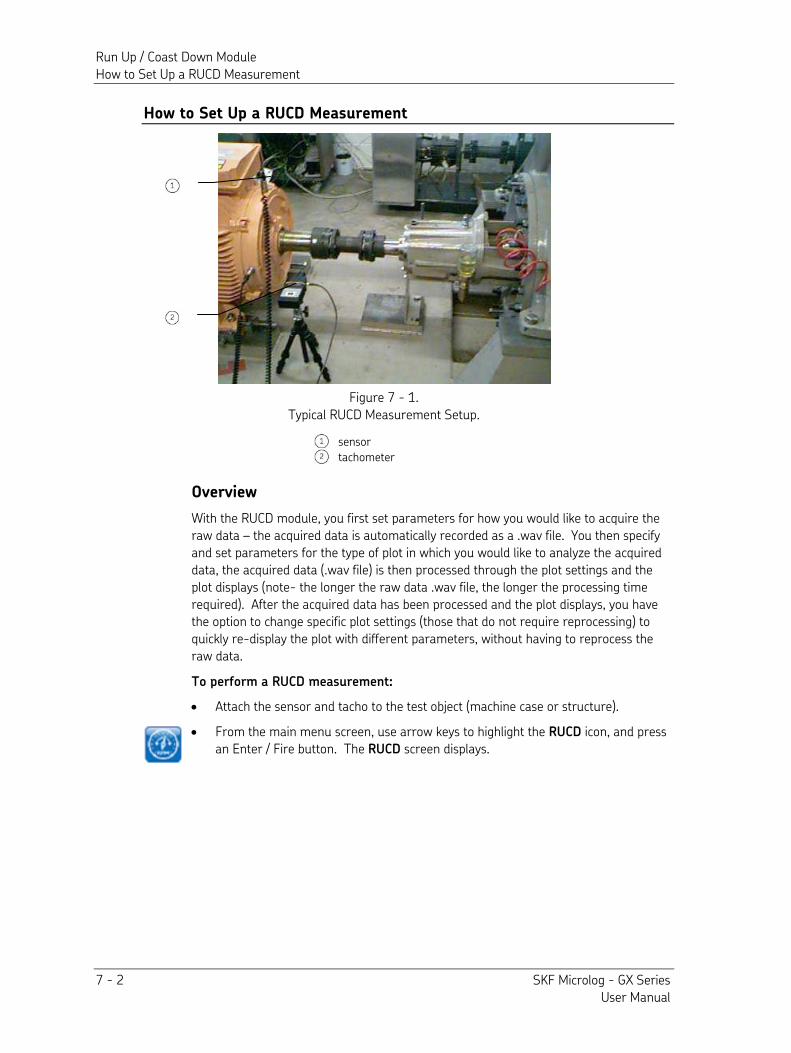
Run Up / Coast Down Module How to Set Up a RUCD Measurement
7 - 2 SKF Microlog - GX Series User Manual
How to Set Up a RUCD Measurement
Figure 7 - 1. Typical RUCD Measurement Setup.
sensor
tachometer
Overview
With the RUCD module, you first set parameters for how you would like to acquire the raw data – the acquired data is automatically recorded as a .wav file. You then specify and set parameters for the type of plot in which you would like to analyze the acquired data, the acquired data (.wav file) is then processed through the plot settings and the plot displays (note- the longer the raw data .wav file, the longer the processing time required). After the acquired data has been processed and the plot displays, you have the option to change specific plot settings (those that do not require reprocessing) to quickly re-display the plot with different parameters, without having to reprocess the raw data.
To perform a RUCD measurement:
• Attach the sensor and tacho to the test object (machine case or structure).
• From the main menu screen, use arrow keys to highlight the RUCD icon, and press an Enter / Fire button. The RUCD screen displays.
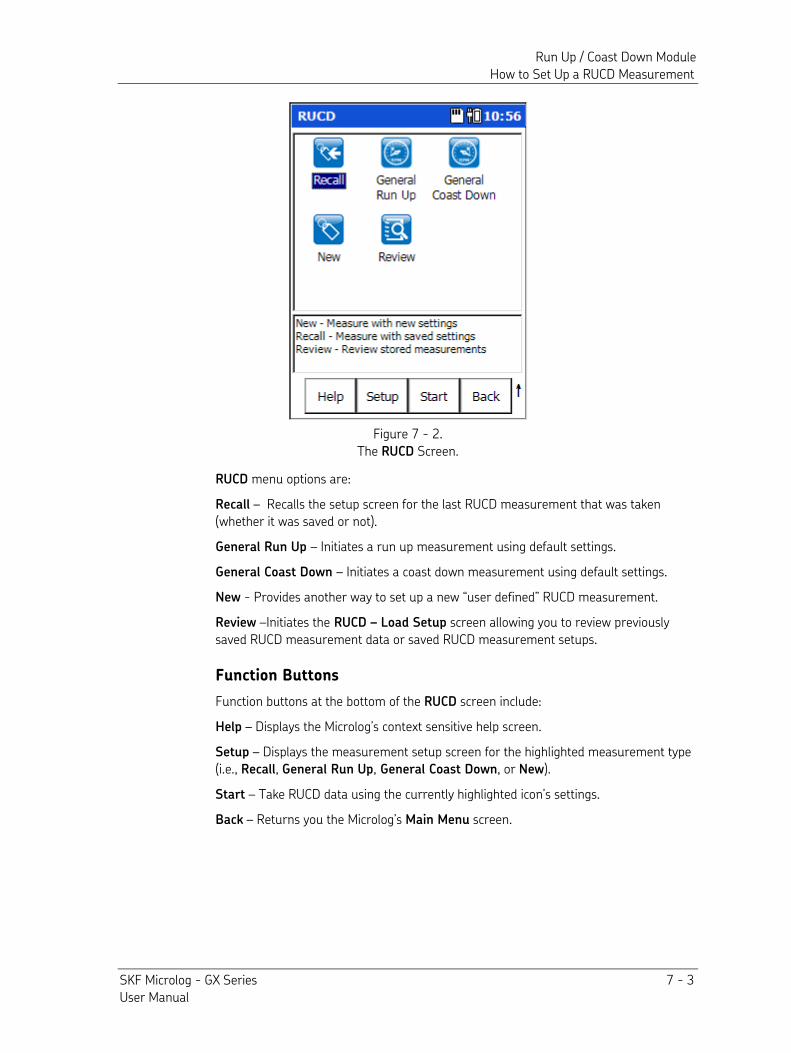
Run Up / Coast Down Module How to Set Up a RUCD Measurement
SKF Microlog - GX Series 7 - 3 User Manual
Figure 7 - 2. The RUCD Screen.
RUCD menu options are:
Recall – Recalls the setup screen for the last RUCD measurement that was taken (whether it was saved or not).
General Run Up – Initiates a run up measurement using default settings.
General Coast Down – Initiates a coast down measurement using default settings.
New - Provides another way to set up a new “user defined” RUCD measurement.
Review –Initiates the RUCD – Load Setup screen allowing you to review previously saved RUCD measurement data or saved RUCD measurement setups.
Function Buttons
Function buttons at the bottom of the RUCD screen include:
Help – Displays the Microlog’s context sensitive help screen.
Setup – Displays the measurement setup screen for the highlighted measurement type (i.e., Recall, General Run Up, General Coast Down, or New).
Start – Take RUCD data using the currently highlighted icon’s settings.
Back – Returns you the Microlog’s Main Menu screen.
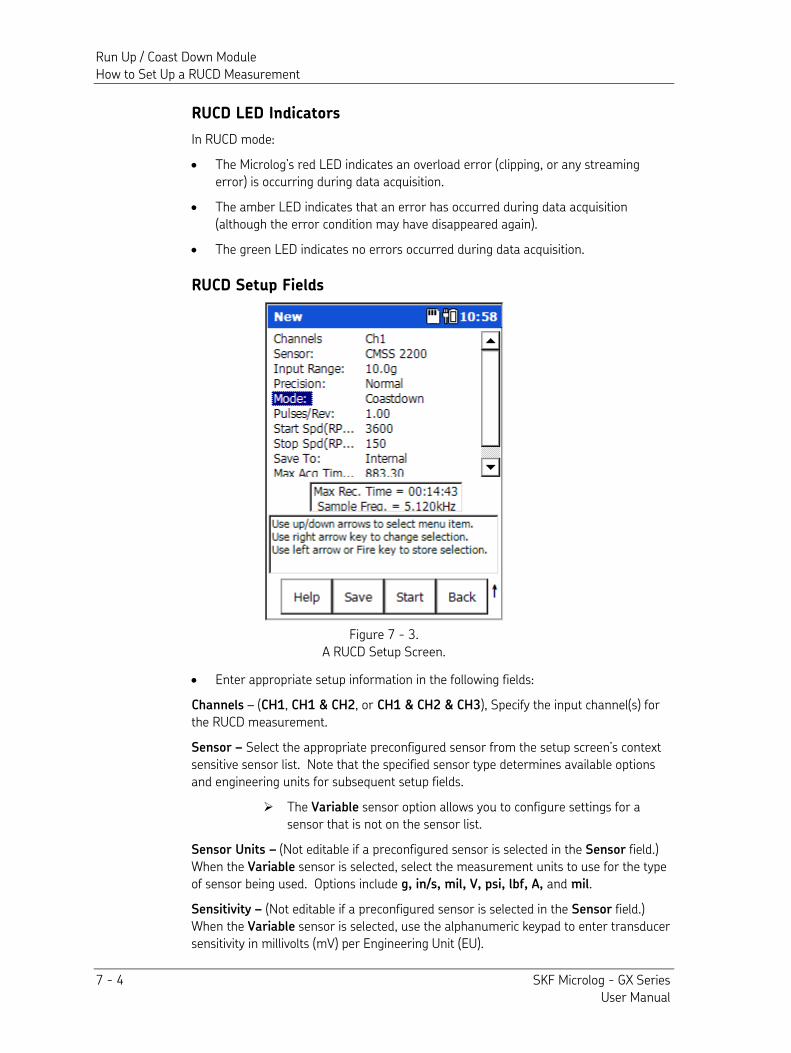
Run Up / Coast Down Module How to Set Up a RUCD Measurement
7 - 4 SKF Microlog - GX Series User Manual
RUCD LED Indicators
In RUCD mode:
• The Microlog’s red LED indicates an overload error (clipping, or any streaming error) is occurring during data acquisition.
• The amber LED indicates that an error has occurred during data acquisition (although the error condition may have disappeared again).
• The green LED indicates no errors occurred during data acquisition. RUCD Setup Fields
Figure 7 - 3. A RUCD Setup Screen.
• Enter appropriate setup information in the following fields:
Channels – (CH1, CH1 & CH2, or CH1 & CH2 & CH3), Specify the input channel(s) for the RUCD measurement.
Sensor – Select the appropriate preconfigured sensor from the setup screen’s context sensitive sensor list. Note that the specified sensor type determines available options and engineering units for subsequent setup fields.
The Variable sensor option allows you to configure settings for a sensor that is not on the sensor list.
Sensor Units – (Not editable if a preconfigured sensor is selected in the Sensor field.) When the Variable sensor is selected, select the measurement units to use for the type of sensor being used. Options include g, in/s, mil, V, psi, lbf, A, and mil.
Sensitivity – (Not editable if a preconfigured sensor is selected in the Sensor field.) When the Variable sensor is selected, use the alphanumeric keypad to enter transducer sensitivity in millivolts (mV) per Engineering Unit (EU).
Run Up / Coast Down Module How to Set Up a RUCD Measurement
SKF Microlog - GX Series 7 - 5 User Manual
ICP Supply – (On or Off), (Not editable if a preconfigured sensor is selected in the Sensor field.) When the Variable sensor is selected, select to turn ICP power Off or On for the sensor.
Input Range - Specifies the maximum expected signal range for the incoming signal. Ensure that the specified range can accommodate unexpected events. If in doubt, err on the side of caution and set levels 10 to 20 times higher than expected.
Precision – (Low, Normal, High, or Very High), Specify the desired data resolution. Note that higher resolution data requires more processing time. This setting determines Max Rec. Time and Sample Freq. settings, as displayed in the screen’s message area.
Mode – (Runup, Manual, or Coastdown), Specify the data collection mode.
Runup - waits for an increase in speed from the tachometer signal to initiate data capture.
Manual - captures data irrespective of shaft speed, and is initiated by a key-press to start recording data (can be used when no tacho signal is available).
Coastdown - waits for a decrease in speed.
Pulses/Rev - Sets the number of pulses per shaft revolution expected from the tachometer output. The setting can be a multiple or a non-integer to accommodate gear ratios, etc.
Tip – To acquire a suitable tachometer signal, the tach. signal should be approximately 1.5 volts peak-to-peak. The adverse effect of excessively short tacho pulse widths can be addressed by increasing the Max No. Orders setting to a higher value in order to increase the sampling rate.
Start Spd (RPM) - Sets the speed at which the RUCD starts recording data.
Stop Spd (RPM) - Sets the speed at which the RUCD stops recording data.
Save To – (Internal or SD Card), Specify the medium to record to, either the Microlog’s Internal hard drive (not recommend due to large .wav file size) or an inserted SD card (recommended). In the screen’s message area, the maximum recording time is determined by the measurement’s settings and the free space available on the specified medium. (Affects maximum recording time).
Max Acq Time(s) - Sets the maximum permissible data acquisition time in seconds. The information panel displays the maximum recording time as regulated by the specified memory type. Also in the information panel, the sampling frequency at which the data will be digitised is provided for information only.
• Save – If desired, from the measurement setup screen, you may press the Save function button to save the measurement setup for easy reuse in the future. Reference Chapter 4, The Analyzer Module section on Saving Analyzer
Measurement Results for details on how to save your measurement setup.
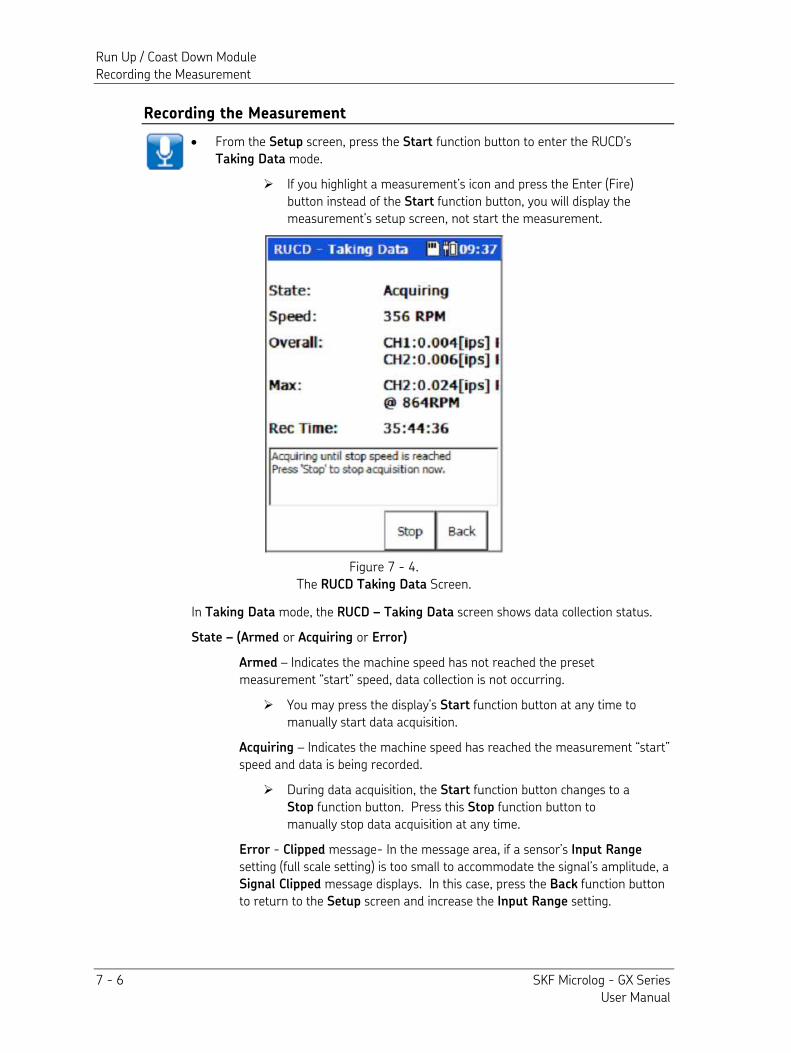
Run Up / Coast Down Module Recording the Measurement
7 - 6 SKF Microlog - GX Series User Manual
Recording the Measurement
• From the Setup screen, press the Start function button to enter the RUCD’s Taking Data mode.
If you highlight a measurement’s icon and press the Enter (Fire) button instead of the Start function button, you will display the measurement’s setup screen, not start the measurement.
Figure 7 - 4. The RUCD Taking Data Screen.
In Taking Data mode, the RUCD – Taking Data screen shows data collection status.
State – (Armed or Acquiring or Error)
Armed – Indicates the machine speed has not reached the preset measurement “start” speed, data collection is not occurring.
You may press the display’s Start function button at any time to manually start data acquisition.
Acquiring – Indicates the machine speed has reached the measurement “start” speed and data is being recorded.
During data acquisition, the Start function button changes to a Stop function button. Press this Stop function button to manually stop data acquisition at any time.
Error - Clipped message- In the message area, if a sensor’s Input Range setting (full scale setting) is too small to accommodate the signal’s amplitude, a Signal Clipped message displays. In this case, press the Back function button to return to the Setup screen and increase the Input Range setting.
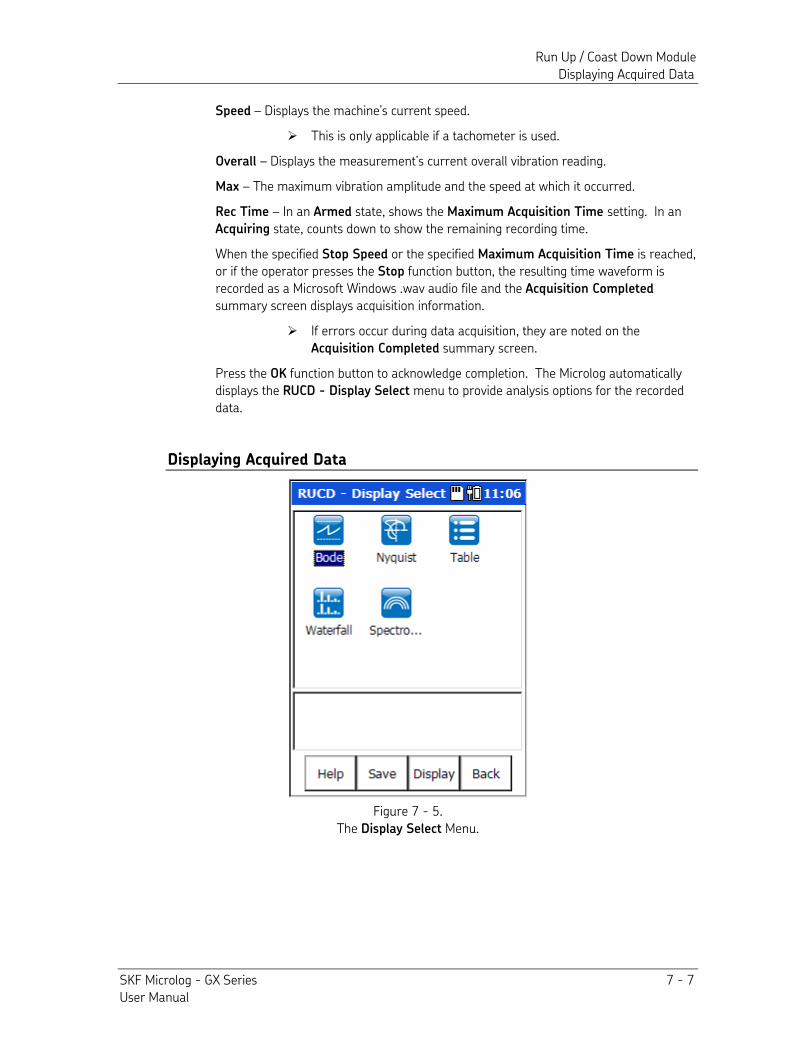
Run Up / Coast Down Module Displaying Acquired Data
SKF Microlog - GX Series 7 - 7 User Manual
Speed – Displays the machine’s current speed.
This is only applicable if a tachometer is used.
Overall – Displays the measurement’s current overall vibration reading.
Max – The maximum vibration amplitude and the speed at which it occurred.
Rec Time – In an Armed state, shows the Maximum Acquisition Time setting. In an Acquiring state, counts down to show the remaining recording time.
When the specified Stop Speed or the specified Maximum Acquisition Time is reached, or if the operator presses the Stop function button, the resulting time waveform is recorded as a Microsoft Windows .wav audio file and the Acquisition Completed summary screen displays acquisition information.
If errors occur during data acquisition, they are noted on the Acquisition Completed summary screen.
Press the OK function button to acknowledge completion. The Microlog automatically displays the RUCD - Display Select menu to provide analysis options for the recorded data.
Displaying Acquired Data
Figure 7 - 5. The Display Select Menu.
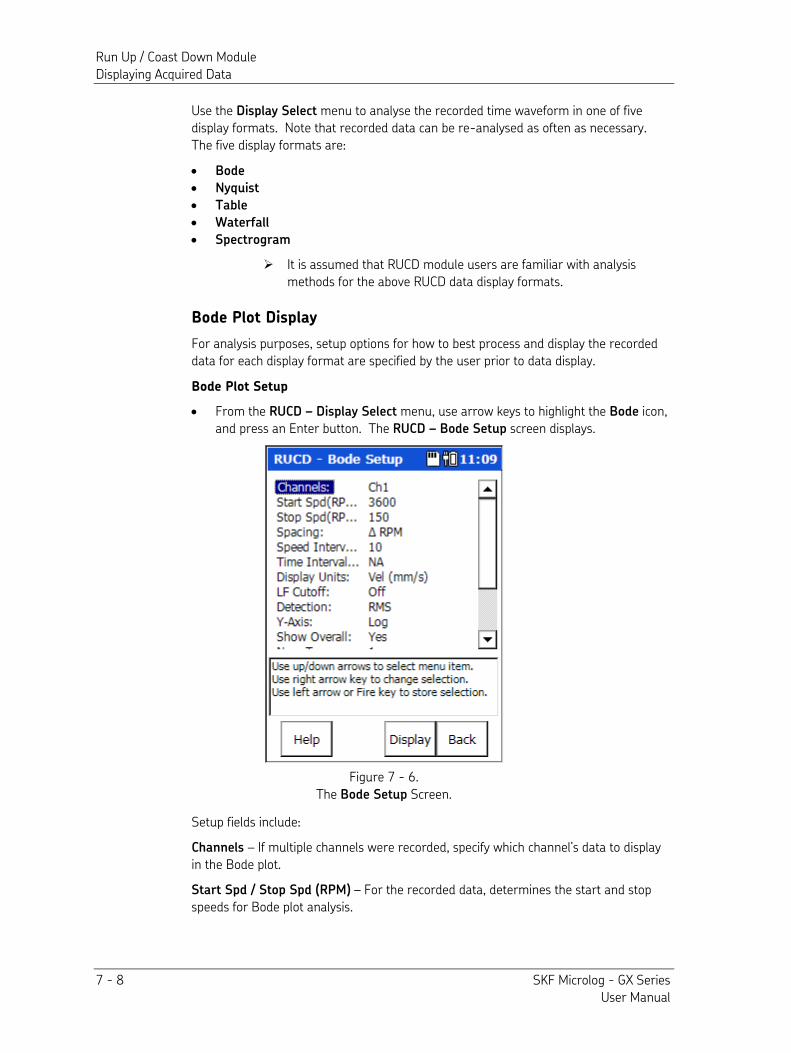
Run Up / Coast Down Module Displaying Acquired Data
7 - 8 SKF Microlog - GX Series User Manual
Use the Display Select menu to analyse the recorded time waveform in one of five display formats. Note that recorded data can be re-analysed as often as necessary. The five display formats are:
• Bode
• Nyquist
• Table
• Waterfall
• Spectrogram
It is assumed that RUCD module users are familiar with analysis methods for the above RUCD data display formats.
Bode Plot Display
For analysis purposes, setup options for how to best process and display the recorded data for each display format are specified by the user prior to data display.
Bode Plot Setup
• From the RUCD – Display Select menu, use arrow keys to highlight the Bode icon, and press an Enter button. The RUCD – Bode Setup screen displays.
Figure 7 - 6. The Bode Setup Screen.
Setup fields include:
Channels – If multiple channels were recorded, specify which channel’s data to display in the Bode plot.
Start Spd / Stop Spd (RPM) – For the recorded data, determines the start and stop speeds for Bode plot analysis.
Run Up / Coast Down Module Displaying Acquired Data
SKF Microlog - GX Series 7 - 9 User Manual
Spacing – (∆ RPM, %∆ RPM, ∆ Time, ∆ RPM + ∆ Time, %∆ RPM + ∆ Time) - Determines the type of interval used when FFT spectra are calculated from the recording. Affects subsequent Speed Interval and Time Interval settings, which update to allow corresponding settings.
∆ RPM – fixed speed change between spectra %∆ RPM – percentage speed change between spectra ∆ Time – fixed time interval between spectra ∆ RPM + ∆ Time - Combination of speed and time settings. If speed stops changing, then spectra are calculated at the defined time interval. %∆ RPM + ∆ Time - Combination of speed and time settings. If speed stops changing, then spectra are calculated at the defined time interval.
Speed Interval (RPM, %, or NA, as specified by the Spacing setting) – If applicable, specifies the speed interval (in RPM or % of RPM) used when FFT spectra are calculated from the recording.
Time Interval (sec or NA, as specified by the Spacing setting) – If applicable, specifies the time interval (in seconds) used when FFT spectra are calculated from the recording.
Display Units (Accel (g), Accel (m/s2), Vel (mm/s), Vel (ips), Disp (mils), Disp (µm)) – If necessary, allows integration of the recorded signal to specified measurement units for display purposes.
LF Cutoff (Off or On) – If On, applies a filter of 0.3 of an order to remove low frequency data from the overall vibration severity calculation.
Detection – (RMS, Peak, PkPk) – Specifies detection type for display purposes.
Y-Axis – (Linear or Log) – Specify y-axis scaling as Linear or Logarithmic. Show Overall (Yes or No) – Specifies whether to display the overall vibration severity as a trace on the Bode plot.
Num Traces – Sets the number of traces (order tracks) to be displayed on the Bode plot. If the previous Overall trace is displayed, the display is limited to three orders, if not, four orders may be displayed.
Trace Order #1 - #4 – Works in conjunction with the Num Traces setting. Determines the order number(s) that will be tracked and displayed. Can be a non-integer order, but the maximum order specified cannot exceed the Max No. Orders set during the data acquisition stage.
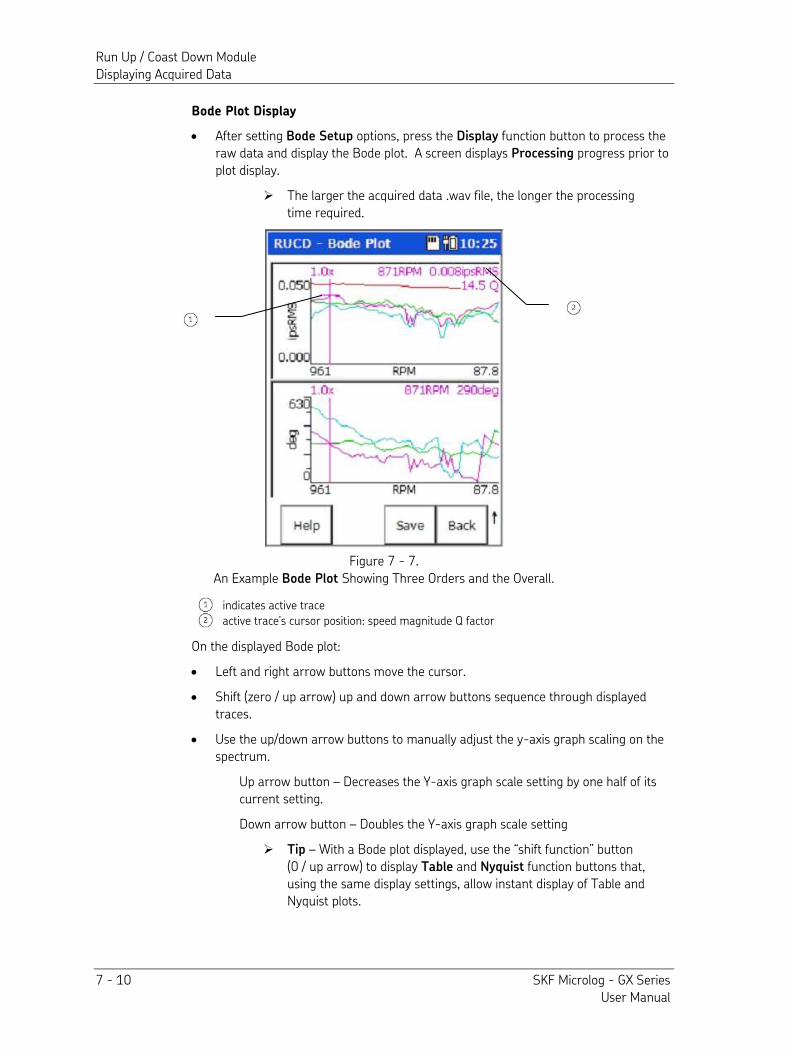
Run Up / Coast Down Module Displaying Acquired Data
7 - 10 SKF Microlog - GX Series User Manual
Bode Plot Display
• After setting Bode Setup options, press the Display function button to process the raw data and display the Bode plot. A screen displays Processing progress prior to plot display.
The larger the acquired data .wav file, the longer the processing time required.
Figure 7 - 7. An Example Bode Plot Showing Three Orders and the Overall. indicates active trace
active trace’s cursor position: speed magnitude Q factor
On the displayed Bode plot: • Left and right arrow buttons move the cursor. • Shift (zero / up arrow) up and down arrow buttons sequence through displayed
traces.
• Use the up/down arrow buttons to manually adjust the y-axis graph scaling on the spectrum.
Up arrow button – Decreases the Y-axis graph scale setting by one half of its current setting.
Down arrow button – Doubles the Y-axis graph scale setting
Tip – With a Bode plot displayed, use the “shift function” button (0 / up arrow) to display Table and Nyquist function buttons that, using the same display settings, allow instant display of Table and Nyquist plots.
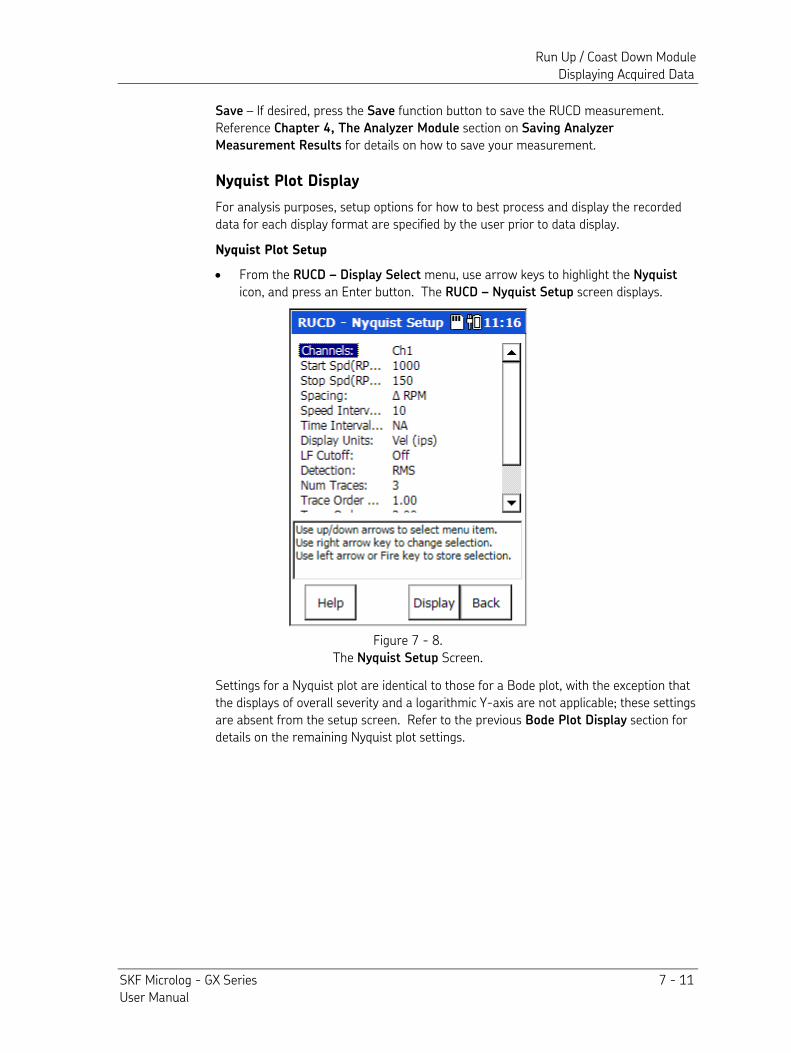
Run Up / Coast Down Module Displaying Acquired Data
SKF Microlog - GX Series 7 - 11 User Manual
Save – If desired, press the Save function button to save the RUCD measurement. Reference Chapter 4, The Analyzer Module section on Saving Analyzer
Measurement Results for details on how to save your measurement.
Nyquist Plot Display
For analysis purposes, setup options for how to best process and display the recorded data for each display format are specified by the user prior to data display.
Nyquist Plot Setup
• From the RUCD – Display Select menu, use arrow keys to highlight the Nyquist icon, and press an Enter button. The RUCD – Nyquist Setup screen displays.
Figure 7 - 8. The Nyquist Setup Screen.
Settings for a Nyquist plot are identical to those for a Bode plot, with the exception that the displays of overall severity and a logarithmic Y-axis are not applicable; these settings are absent from the setup screen. Refer to the previous Bode Plot Display section for details on the remaining Nyquist plot settings.
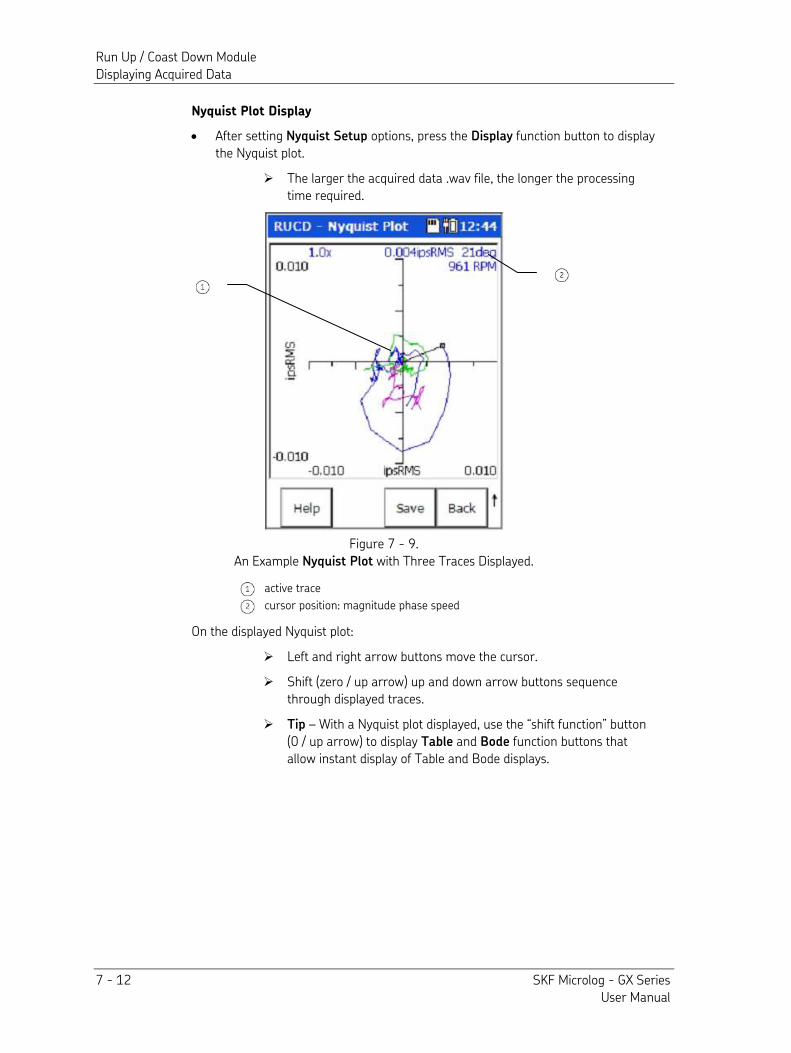
Run Up / Coast Down Module Displaying Acquired Data
7 - 12 SKF Microlog - GX Series User Manual
Nyquist Plot Display
• After setting Nyquist Setup options, press the Display function button to display the Nyquist plot.
The larger the acquired data .wav file, the longer the processing time required.
Figure 7 - 9. An Example Nyquist Plot with Three Traces Displayed.
active trace
cursor position: magnitude phase speed
On the displayed Nyquist plot: Left and right arrow buttons move the cursor. Shift (zero / up arrow) up and down arrow buttons sequence
through displayed traces.
Tip – With a Nyquist plot displayed, use the “shift function” button (0 / up arrow) to display Table and Bode function buttons that allow instant display of Table and Bode displays.
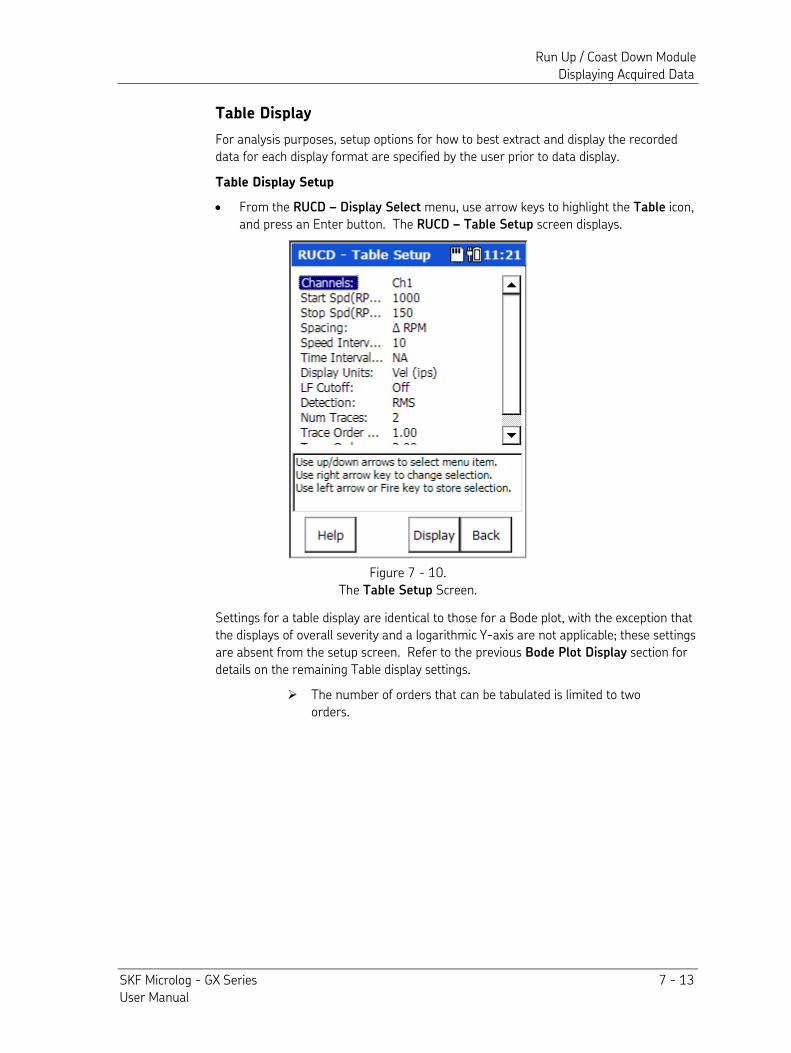
Run Up / Coast Down Module Displaying Acquired Data
SKF Microlog - GX Series 7 - 13 User Manual
Table Display
For analysis purposes, setup options for how to best extract and display the recorded data for each display format are specified by the user prior to data display.
Table Display Setup
• From the RUCD – Display Select menu, use arrow keys to highlight the Table icon, and press an Enter button. The RUCD – Table Setup screen displays.
Figure 7 - 10. The Table Setup Screen.
Settings for a table display are identical to those for a Bode plot, with the exception that the displays of overall severity and a logarithmic Y-axis are not applicable; these settings are absent from the setup screen. Refer to the previous Bode Plot Display section for details on the remaining Table display settings.
The number of orders that can be tabulated is limited to two orders.
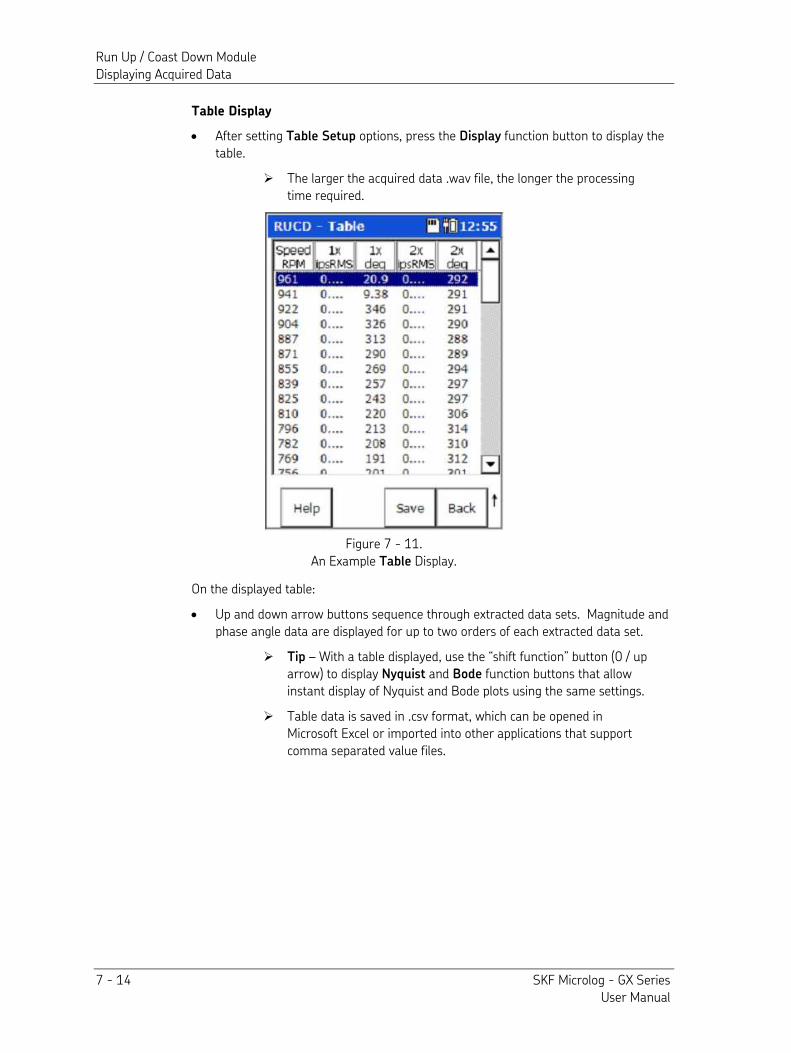
Run Up / Coast Down Module Displaying Acquired Data
7 - 14 SKF Microlog - GX Series User Manual
Table Display
• After setting Table Setup options, press the Display function button to display the table.
The larger the acquired data .wav file, the longer the processing time required.
Figure 7 - 11. An Example Table Display.
On the displayed table: • Up and down arrow buttons sequence through extracted data sets. Magnitude and
phase angle data are displayed for up to two orders of each extracted data set.
Tip – With a table displayed, use the “shift function” button (0 / up arrow) to display Nyquist and Bode function buttons that allow instant display of Nyquist and Bode plots using the same settings.
Table data is saved in .csv format, which can be opened in Microsoft Excel or imported into other applications that support comma separated value files.
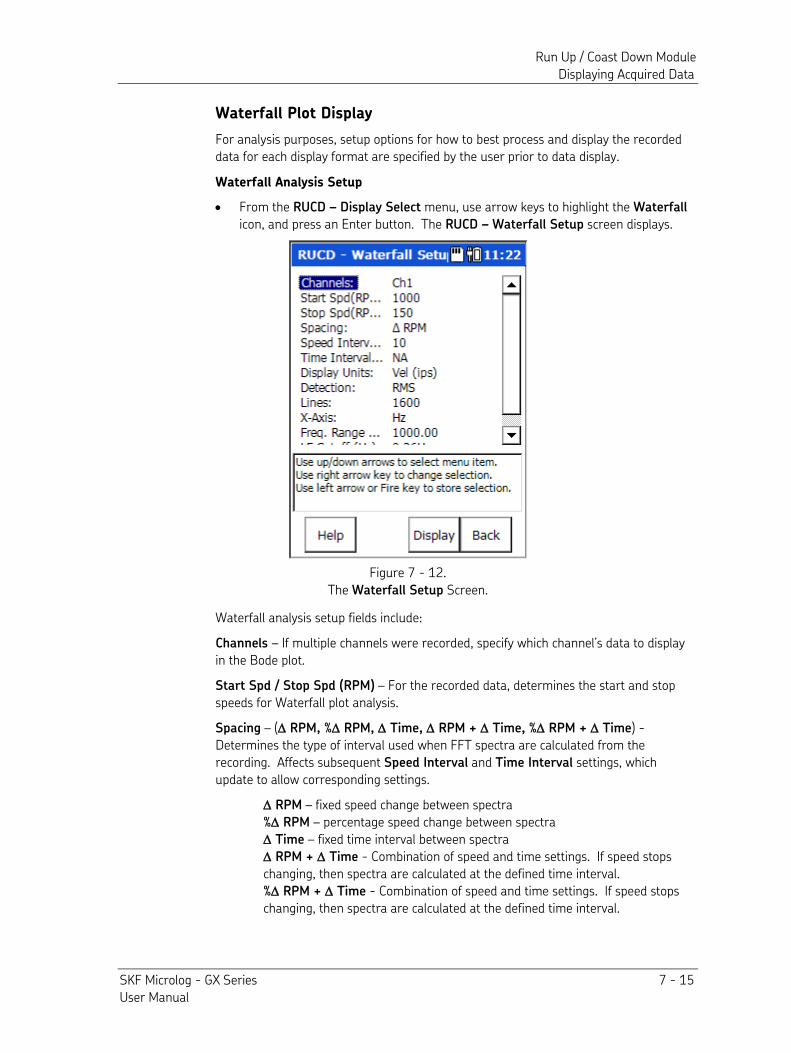
Run Up / Coast Down Module Displaying Acquired Data
SKF Microlog - GX Series 7 - 15 User Manual
Waterfall Plot Display
For analysis purposes, setup options for how to best process and display the recorded data for each display format are specified by the user prior to data display.
Waterfall Analysis Setup
• From the RUCD – Display Select menu, use arrow keys to highlight the Waterfall icon, and press an Enter button. The RUCD – Waterfall Setup screen displays.
Figure 7 - 12. The Waterfall Setup Screen.
Waterfall analysis setup fields include: Channels – If multiple channels were recorded, specify which channel’s data to display in the Bode plot.
Start Spd / Stop Spd (RPM) – For the recorded data, determines the start and stop speeds for Waterfall plot analysis. Spacing – (∆ RPM, %∆ RPM, ∆ Time, ∆ RPM + ∆ Time, %∆ RPM + ∆ Time) - Determines the type of interval used when FFT spectra are calculated from the recording. Affects subsequent Speed Interval and Time Interval settings, which update to allow corresponding settings.
∆ RPM – fixed speed change between spectra %∆ RPM – percentage speed change between spectra ∆ Time – fixed time interval between spectra ∆ RPM + ∆ Time - Combination of speed and time settings. If speed stops changing, then spectra are calculated at the defined time interval. %∆ RPM + ∆ Time - Combination of speed and time settings. If speed stops changing, then spectra are calculated at the defined time interval.
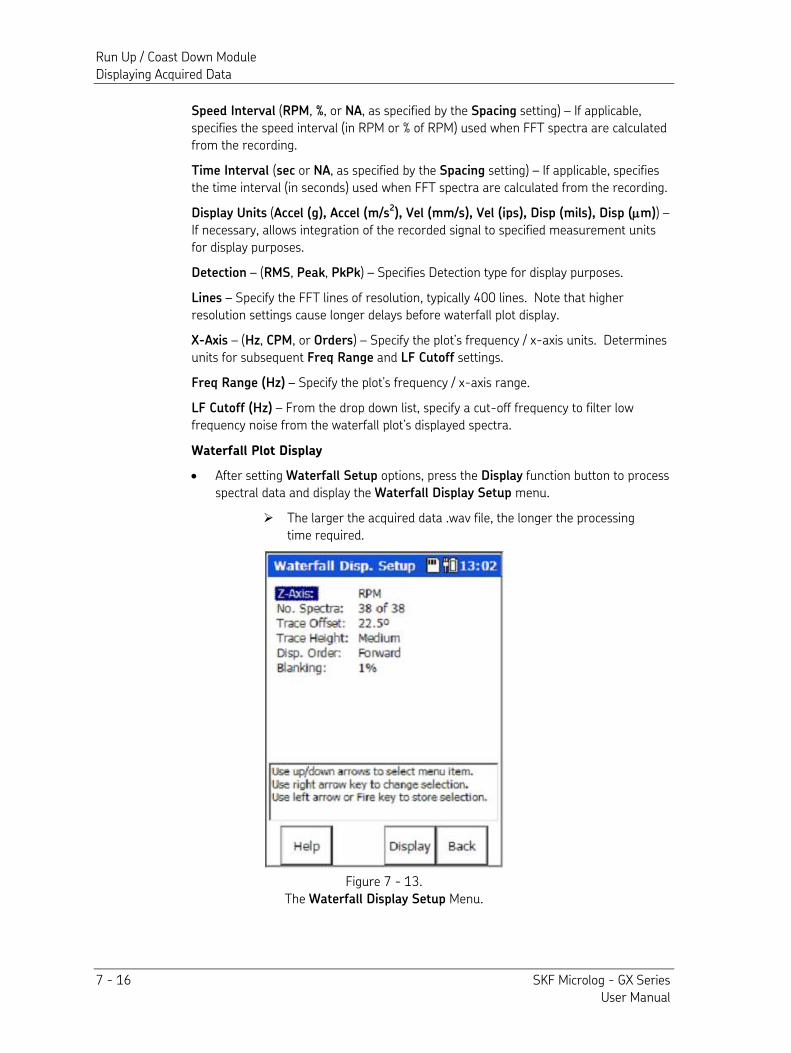
Run Up / Coast Down Module Displaying Acquired Data
7 - 16 SKF Microlog - GX Series User Manual
Speed Interval (RPM, %, or NA, as specified by the Spacing setting) – If applicable, specifies the speed interval (in RPM or % of RPM) used when FFT spectra are calculated from the recording.
Time Interval (sec or NA, as specified by the Spacing setting) – If applicable, specifies the time interval (in seconds) used when FFT spectra are calculated from the recording.
Display Units (Accel (g), Accel (m/s2), Vel (mm/s), Vel (ips), Disp (mils), Disp (µm)) – If necessary, allows integration of the recorded signal to specified measurement units for display purposes.
Detection – (RMS, Peak, PkPk) – Specifies Detection type for display purposes.
Lines – Specify the FFT lines of resolution, typically 400 lines. Note that higher resolution settings cause longer delays before waterfall plot display.
X-Axis – (Hz, CPM, or Orders) – Specify the plot’s frequency / x-axis units. Determines units for subsequent Freq Range and LF Cutoff settings.
Freq Range (Hz) – Specify the plot’s frequency / x-axis range.
LF Cutoff (Hz) – From the drop down list, specify a cut-off frequency to filter low frequency noise from the waterfall plot’s displayed spectra.
Waterfall Plot Display
• After setting Waterfall Setup options, press the Display function button to process spectral data and display the Waterfall Display Setup menu.
The larger the acquired data .wav file, the longer the processing time required.
Figure 7 - 13. The Waterfall Display Setup Menu.
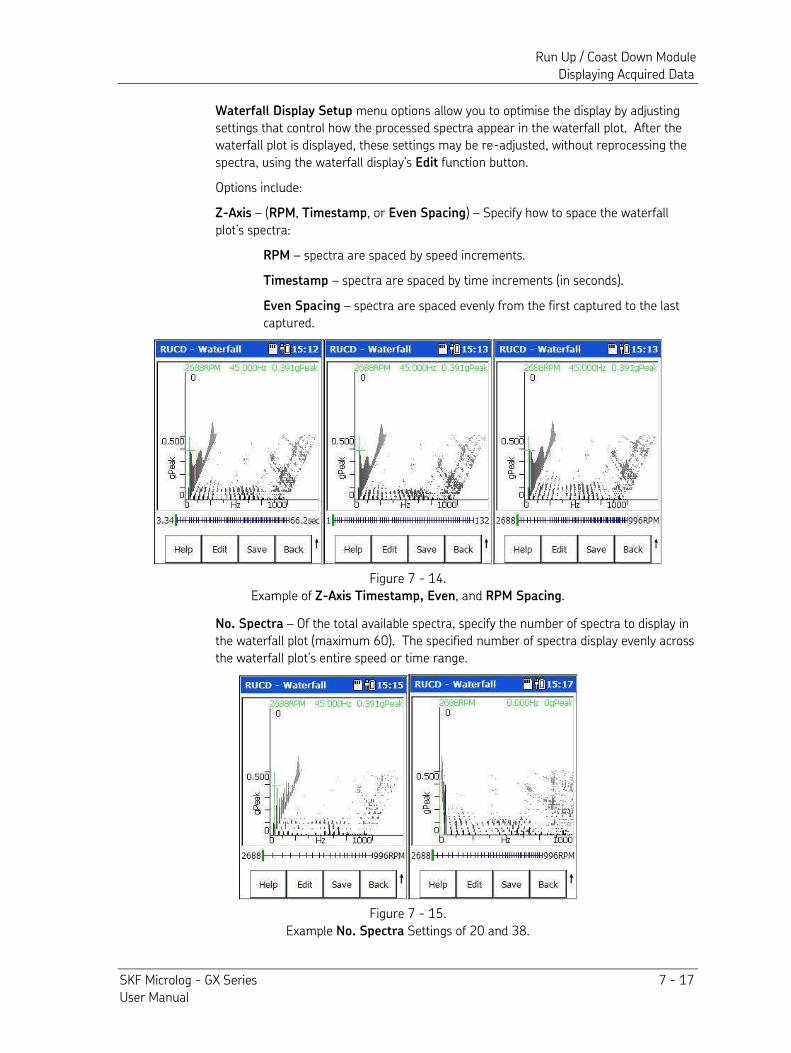
Run Up / Coast Down Module Displaying Acquired Data
SKF Microlog - GX Series 7 - 17 User Manual
Waterfall Display Setup menu options allow you to optimise the display by adjusting settings that control how the processed spectra appear in the waterfall plot. After the waterfall plot is displayed, these settings may be re-adjusted, without reprocessing the spectra, using the waterfall display’s Edit function button.
Options include: Z-Axis – (RPM, Timestamp, or Even Spacing) – Specify how to space the waterfall plot’s spectra:
RPM – spectra are spaced by speed increments.
Timestamp – spectra are spaced by time increments (in seconds).
Even Spacing – spectra are spaced evenly from the first captured to the last captured.
Figure 7 - 14. Example of Z-Axis Timestamp, Even, and RPM Spacing.
No. Spectra – Of the total available spectra, specify the number of spectra to display in the waterfall plot (maximum 60). The specified number of spectra display evenly across the waterfall plot’s entire speed or time range.
Figure 7 - 15. Example No. Spectra Settings of 20 and 38.
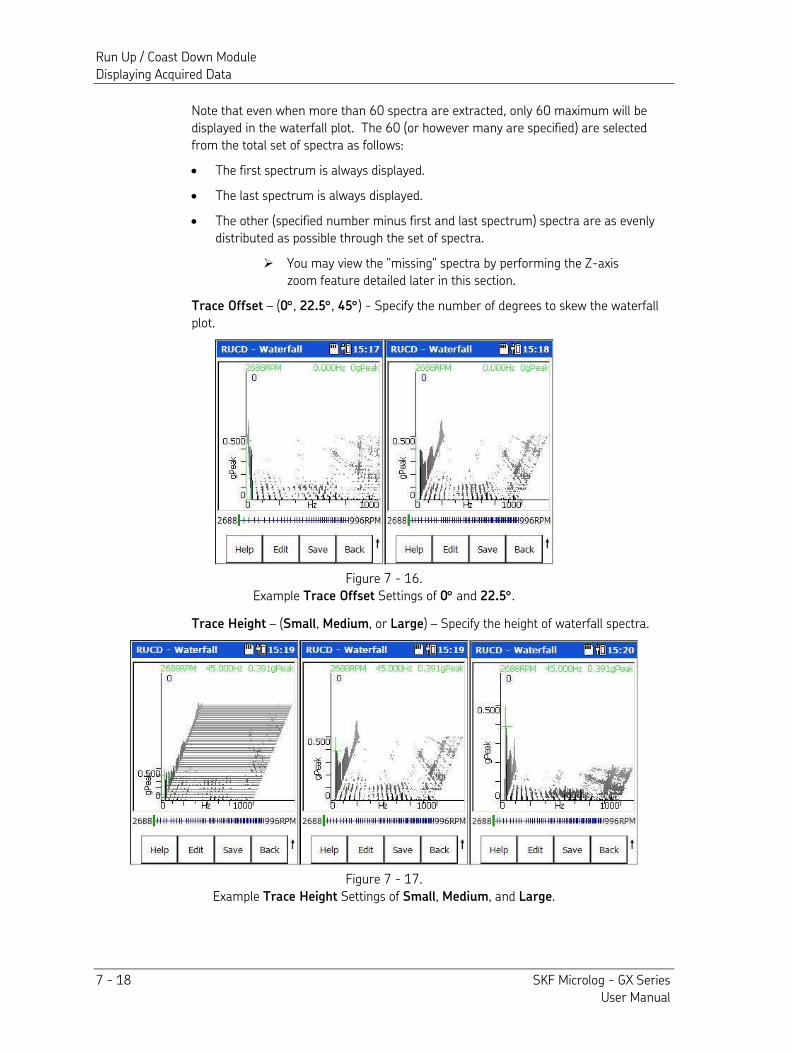
Run Up / Coast Down Module Displaying Acquired Data
7 - 18 SKF Microlog - GX Series User Manual
Note that even when more than 60 spectra are extracted, only 60 maximum will be displayed in the waterfall plot. The 60 (or however many are specified) are selected from the total set of spectra as follows:
• The first spectrum is always displayed.
• The last spectrum is always displayed.
• The other (specified number minus first and last spectrum) spectra are as evenly distributed as possible through the set of spectra.
You may view the "missing" spectra by performing the Z-axis zoom feature detailed later in this section.
Trace Offset – (0°, 22.5°, 45°) - Specify the number of degrees to skew the waterfall plot.
Figure 7 - 16. Example Trace Offset Settings of 0° and 22.5°.
Trace Height – (Small, Medium, or Large) – Specify the height of waterfall spectra.
Figure 7 - 17. Example Trace Height Settings of Small, Medium, and Large.
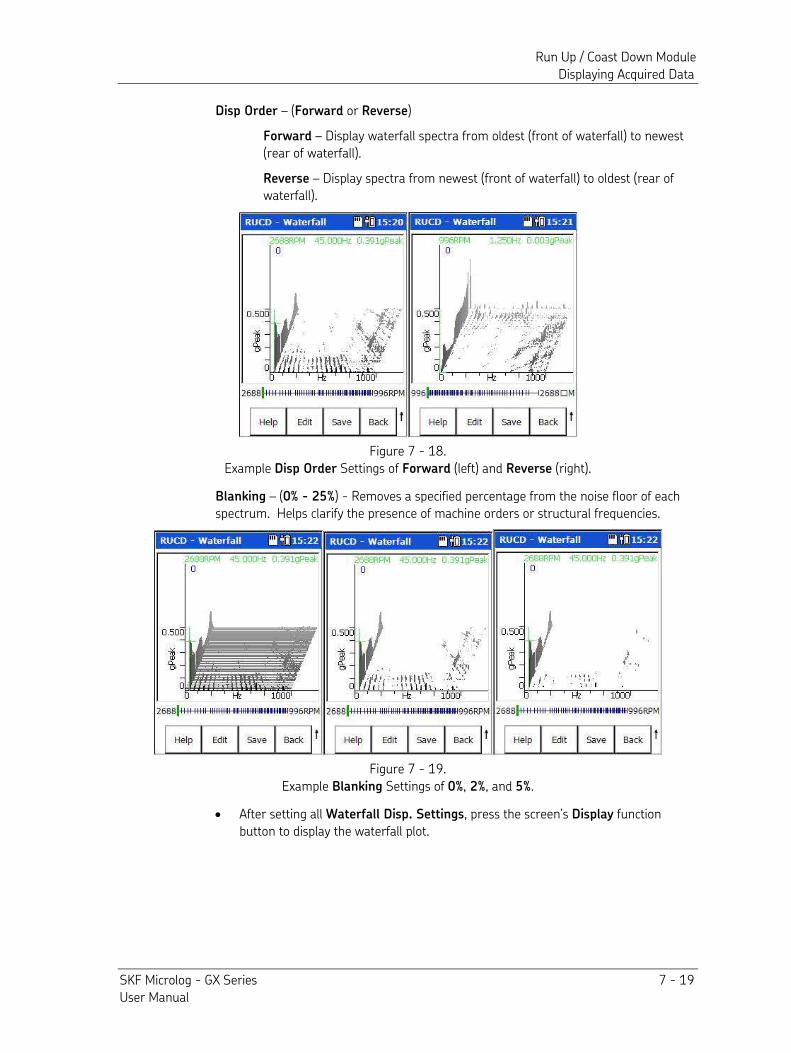
Run Up / Coast Down Module Displaying Acquired Data
SKF Microlog - GX Series 7 - 19 User Manual
Disp Order – (Forward or Reverse)
Forward – Display waterfall spectra from oldest (front of waterfall) to newest (rear of waterfall).
Reverse – Display spectra from newest (front of waterfall) to oldest (rear of waterfall).
Figure 7 - 18. Example Disp Order Settings of Forward (left) and Reverse (right).
Blanking – (0% - 25%) - Removes a specified percentage from the noise floor of each spectrum. Helps clarify the presence of machine orders or structural frequencies.
Figure 7 - 19. Example Blanking Settings of 0%, 2%, and 5%.
• After setting all Waterfall Disp. Settings, press the screen’s Display function button to display the waterfall plot.
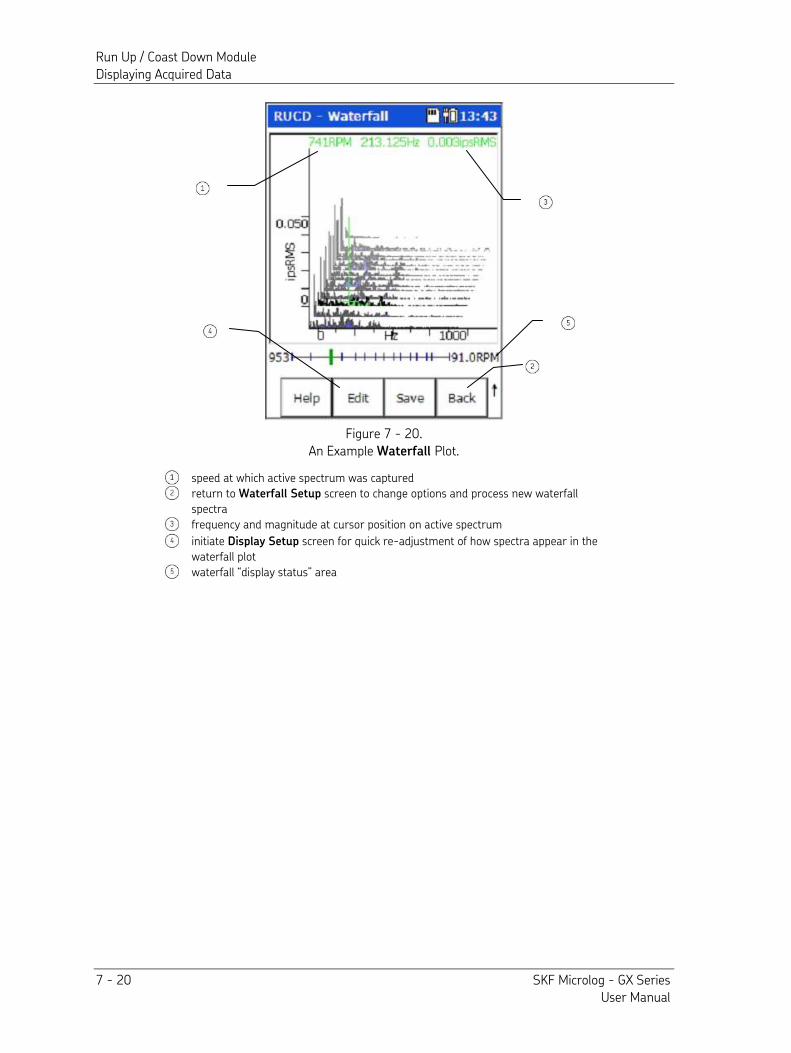
Run Up / Coast Down Module Displaying Acquired Data
7 - 20 SKF Microlog - GX Series User Manual
Figure 7 - 20. An Example Waterfall Plot.
speed at which active spectrum was captured
return to Waterfall Setup screen to change options and process new waterfall spectra
frequency and magnitude at cursor position on active spectrum
initiate Display Setup screen for quick re-adjustment of how spectra appear in the waterfall plot
waterfall “display status” area
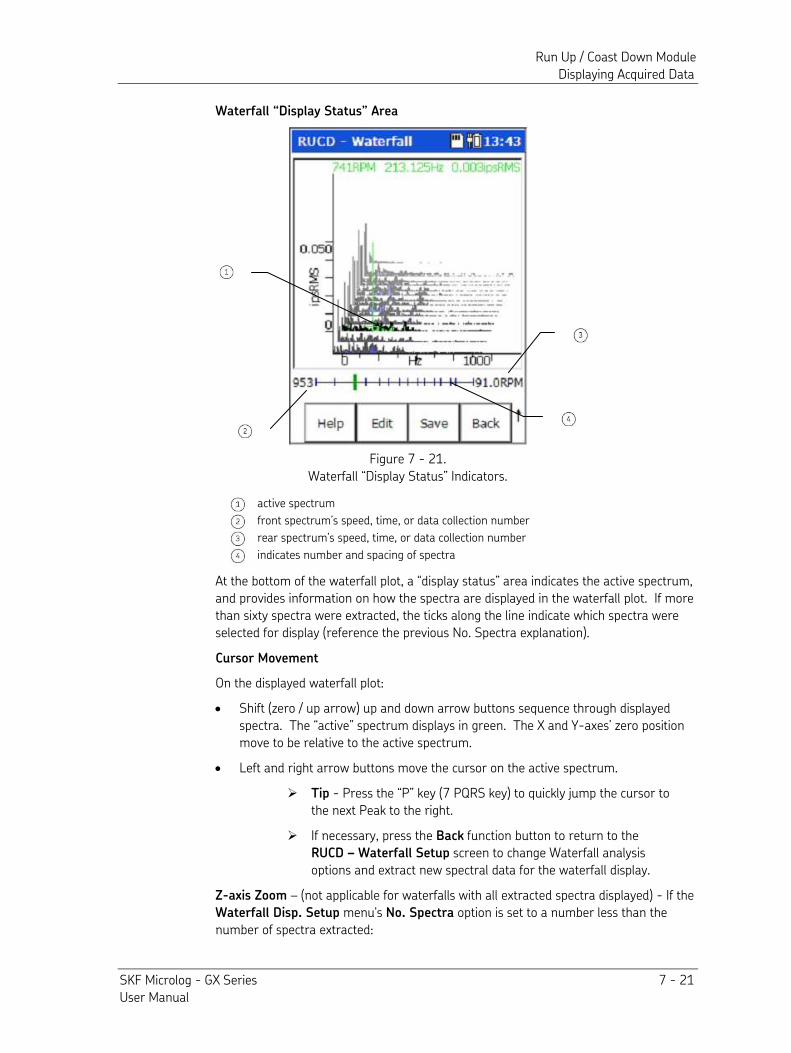
Run Up / Coast Down Module Displaying Acquired Data
SKF Microlog - GX Series 7 - 21 User Manual
Waterfall “Display Status” Area
Figure 7 - 21. Waterfall “Display Status” Indicators.
active spectrum
front spectrum’s speed, time, or data collection number
rear spectrum’s speed, time, or data collection number
indicates number and spacing of spectra
At the bottom of the waterfall plot, a “display status” area indicates the active spectrum, and provides information on how the spectra are displayed in the waterfall plot. If more than sixty spectra were extracted, the ticks along the line indicate which spectra were selected for display (reference the previous No. Spectra explanation).
Cursor Movement
On the displayed waterfall plot: • Shift (zero / up arrow) up and down arrow buttons sequence through displayed
spectra. The “active” spectrum displays in green. The X and Y-axes’ zero position move to be relative to the active spectrum.
• Left and right arrow buttons move the cursor on the active spectrum. Tip - Press the “P” key (7 PQRS key) to quickly jump the cursor to
the next Peak to the right.
If necessary, press the Back function button to return to the RUCD – Waterfall Setup screen to change Waterfall analysis options and extract new spectral data for the waterfall display.
Z-axis Zoom – (not applicable for waterfalls with all extracted spectra displayed) - If the Waterfall Disp. Setup menu's No. Spectra option is set to a number less than the number of spectra extracted:
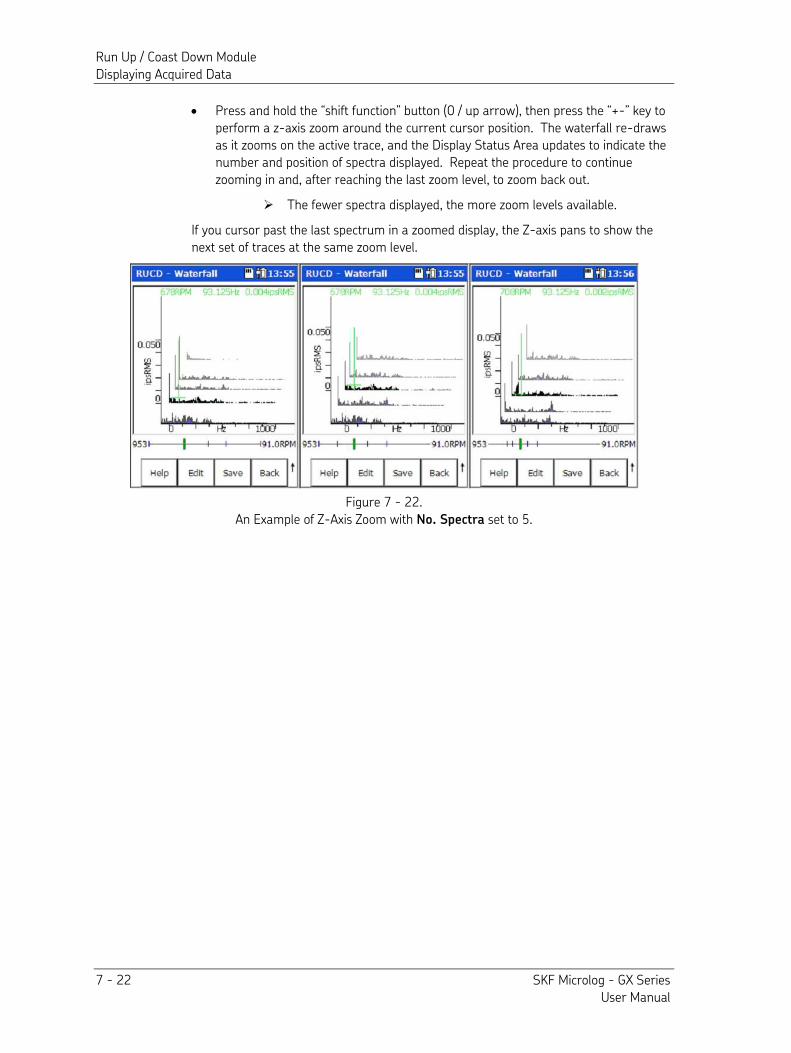
Run Up / Coast Down Module Displaying Acquired Data
7 - 22 SKF Microlog - GX Series User Manual
• Press and hold the “shift function” button (0 / up arrow), then press the “+-” key to perform a z-axis zoom around the current cursor position. The waterfall re-draws as it zooms on the active trace, and the Display Status Area updates to indicate the number and position of spectra displayed. Repeat the procedure to continue zooming in and, after reaching the last zoom level, to zoom back out.
The fewer spectra displayed, the more zoom levels available.
If you cursor past the last spectrum in a zoomed display, the Z-axis pans to show the next set of traces at the same zoom level.
Figure 7 - 22. An Example of Z-Axis Zoom with No. Spectra set to 5.
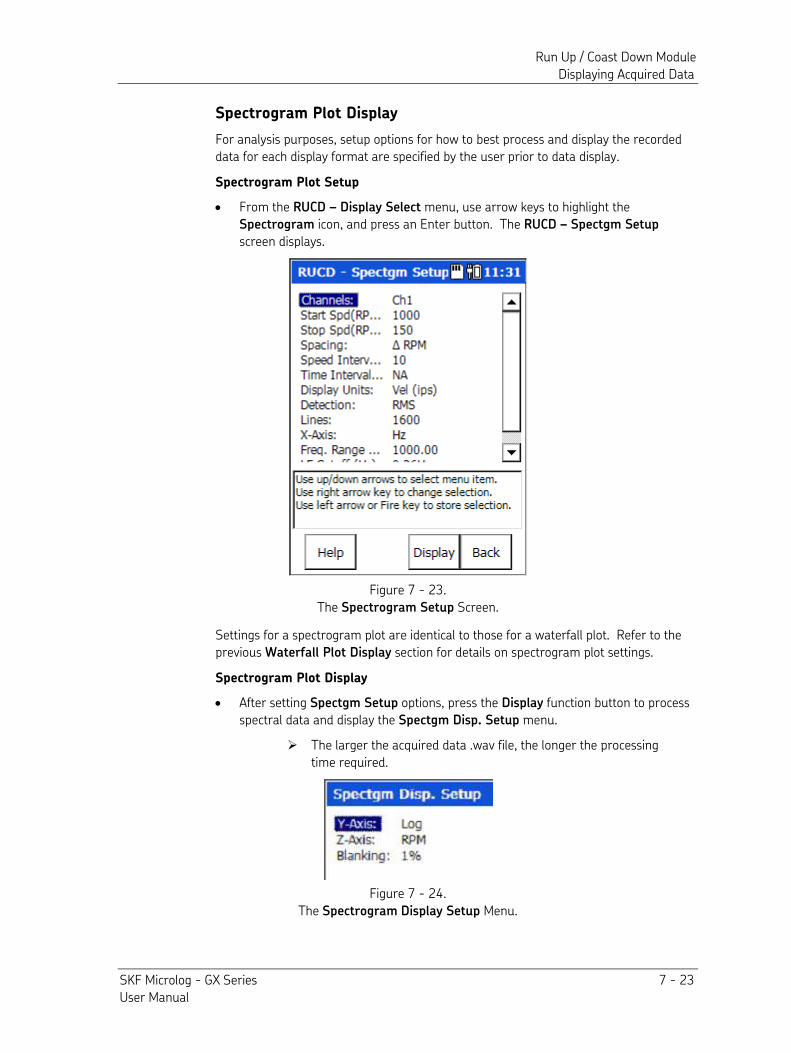
Run Up / Coast Down Module Displaying Acquired Data
SKF Microlog - GX Series 7 - 23 User Manual
Spectrogram Plot Display
For analysis purposes, setup options for how to best process and display the recorded data for each display format are specified by the user prior to data display.
Spectrogram Plot Setup
• From the RUCD – Display Select menu, use arrow keys to highlight the Spectrogram icon, and press an Enter button. The RUCD – Spectgm Setup screen displays.
Figure 7 - 23. The Spectrogram Setup Screen.
Settings for a spectrogram plot are identical to those for a waterfall plot. Refer to the previous Waterfall Plot Display section for details on spectrogram plot settings.
Spectrogram Plot Display
• After setting Spectgm Setup options, press the Display function button to process spectral data and display the Spectgm Disp. Setup menu.
The larger the acquired data .wav file, the longer the processing time required.
Figure 7 - 24. The Spectrogram Display Setup Menu.
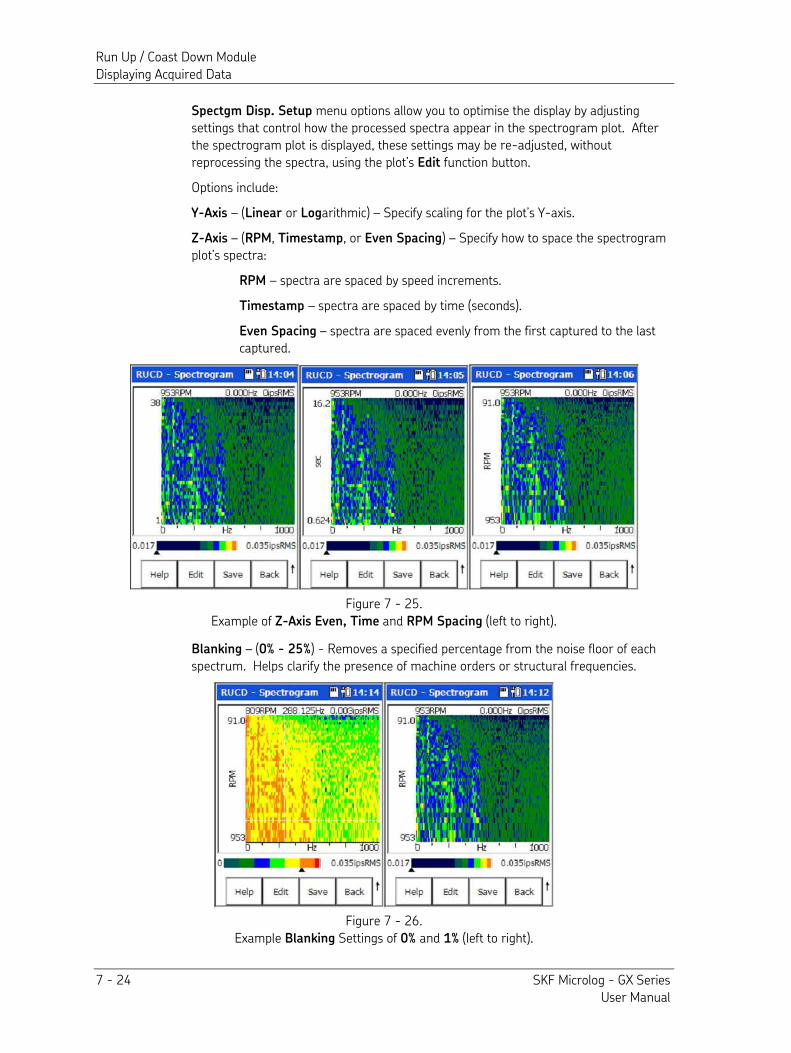
Run Up / Coast Down Module Displaying Acquired Data
7 - 24 SKF Microlog - GX Series User Manual
Spectgm Disp. Setup menu options allow you to optimise the display by adjusting settings that control how the processed spectra appear in the spectrogram plot. After the spectrogram plot is displayed, these settings may be re-adjusted, without reprocessing the spectra, using the plot’s Edit function button.
Options include: Y-Axis – (Linear or Logarithmic) – Specify scaling for the plot’s Y-axis.
Z-Axis – (RPM, Timestamp, or Even Spacing) – Specify how to space the spectrogram plot’s spectra:
RPM – spectra are spaced by speed increments.
Timestamp – spectra are spaced by time (seconds).
Even Spacing – spectra are spaced evenly from the first captured to the last captured.
Figure 7 - 25. Example of Z-Axis Even, Time and RPM Spacing (left to right).
Blanking – (0% - 25%) - Removes a specified percentage from the noise floor of each spectrum. Helps clarify the presence of machine orders or structural frequencies.
Figure 7 - 26. Example Blanking Settings of 0% and 1% (left to right).
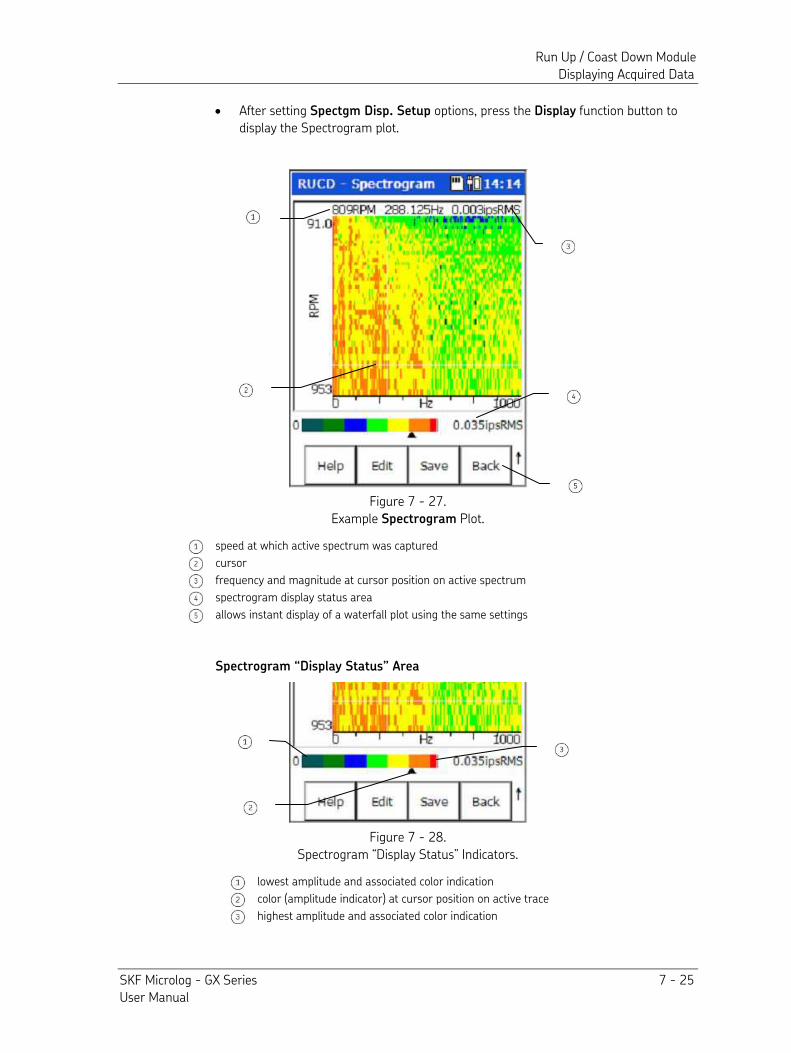
Run Up / Coast Down Module Displaying Acquired Data
SKF Microlog - GX Series 7 - 25 User Manual
• After setting Spectgm Disp. Setup options, press the Display function button to display the Spectrogram plot.
Figure 7 - 27. Example Spectrogram Plot.
speed at which active spectrum was captured
cursor
frequency and magnitude at cursor position on active spectrum
spectrogram display status area
allows instant display of a waterfall plot using the same settings
Spectrogram “Display Status” Area
Figure 7 - 28. Spectrogram “Display Status” Indicators.
lowest amplitude and associated color indication
color (amplitude indicator) at cursor position on active trace
highest amplitude and associated color indication
Run Up / Coast Down Module Saving RUCD Data
7 - 26 SKF Microlog - GX Series User Manual
At the bottom of the spectrogram plot, a “display status” area indicates the plot’s color scale from lowest to highest amplitude, and the color (amplitude indicator) for the cursor position on the active trace.
Cursor Movement
On the displayed spectrogram plot: • Up and down arrow buttons sequence through displayed spectra.
• Left and right arrow buttons move the cursor on the active spectrum. Tip - Press the “P” key (7 PQRS key) to quickly jump the cursor to
the highest Peak to the right.
If necessary, press the Back function button to return to the RUCD – Spectrogram Setup screen to change spectrogram analysis options and extract new spectral data for the waterfall display.
Saving RUCD Data
Saving, Reviewing, and Deleting Measurements
Procedures for saving measurement setups, for saving measurement results, for viewing stored measurements, and for deleting stored measurements are similar between modules. Reference Chapter 4, The Analyzer Module section on How to
Save, View, and Delete Analyzer Measurement Results for detailed information on these procedures.
SKF Microlog - GX Series 8 - 1 User Manual
8
Frequency Response Function Module
Overview
Warning - Due to required accessories, this module is not for use in Class I Division 2 hazardous locations. Restrictions apply when used in ATEX zone 2 hazardous locations. Reference this manual's Appendix D, Safety Instructions for details.
The Microlog FRF module allows the user to determine the natural frequencies of a machine or structure in a more sophisticated manner than the Bump Test module. Rather than simply detecting the frequencies where resonances occur, it captures information about the Frequency Response Function of the structure being tested. The FRF data can be used in conjunction with a Modal Analysis package to model the way the structure will react to forces applied to it.
The FRF module can also be used to capture information about how a machine moves when it is running. This information can be used in conjunction with Operation Deflection Shape (ODS) analysis software. The FRF module includes features for ease of use, including:
• Simple selection of measurement type from a list of predefined options (e.g., Mobility, Stiffness, Apparent Mass, etc.)
• FRF trace colored green or red to illustrate high or low coherence
• Optional automatic parameter setting for input ranges, number of lines, and windowing
• Compatibility with ODS analysis software
Additional Background Information
Newton’s Law and Apparent Mass
Newton’s Law states that force equals mass x acceleration; i.e.: • F = ma
Rearranging this gives:
• m = F/a
The units for this are N/m/s2. The definition of a Newton: • N = kg x m/s
2
So we can see that:
• N/m/s2 = kg
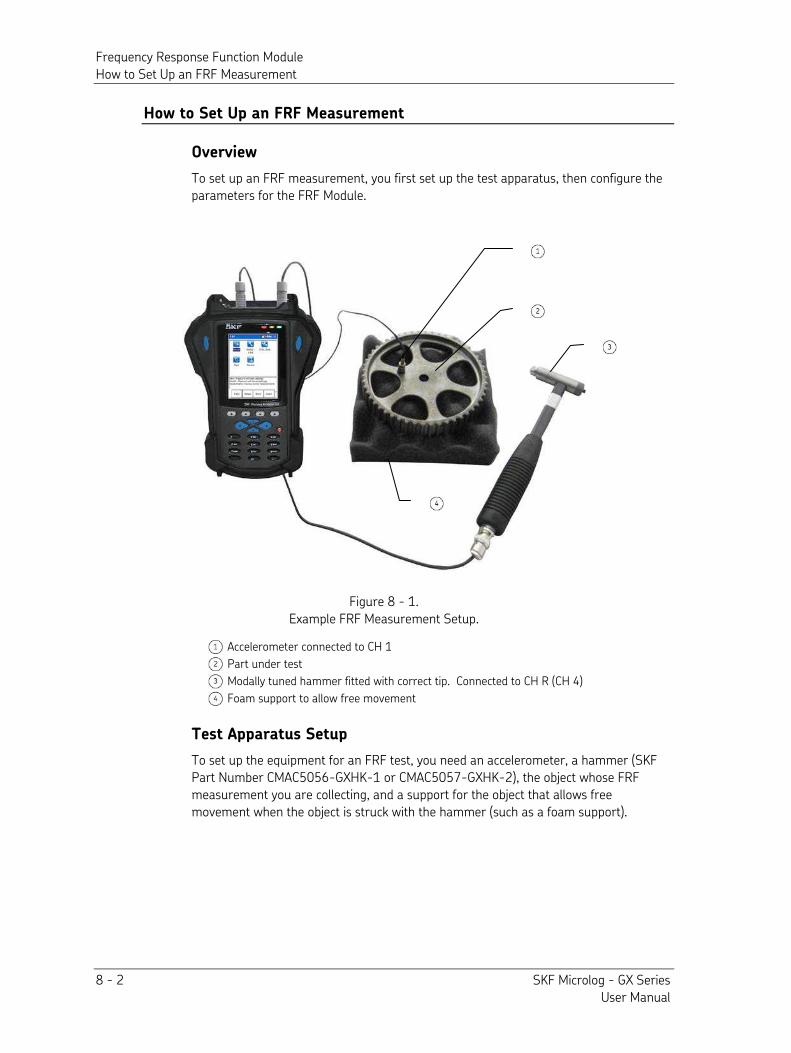
Frequency Response Function Module How to Set Up an FRF Measurement
8 - 2 SKF Microlog - GX Series User Manual
How to Set Up an FRF Measurement
Overview
To set up an FRF measurement, you first set up the test apparatus, then configure the parameters for the FRF Module.
Figure 8 - 1. Example FRF Measurement Setup.
Accelerometer connected to CH 1
Part under test
Modally tuned hammer fitted with correct tip. Connected to CH R (CH 4)
Foam support to allow free movement
Test Apparatus Setup
To set up the equipment for an FRF test, you need an accelerometer, a hammer (SKF Part Number CMAC5056-GXHK-1 or CMAC5057-GXHK-2), the object whose FRF measurement you are collecting, and a support for the object that allows free movement when the object is struck with the hammer (such as a foam support).
Frequency Response Function Module How to Set Up an FRF Measurement
SKF Microlog - GX Series 8 - 3 User Manual
To set up the FRF test apparatus:
• Fit the correct tip to a modally tuned hammer. (The hammer is used to create the force that is to be measured in the FRF.)
Use a harder tip for high frequency and a softer tip for lower frequency measurements.
• Connect the modally tuned hammer to the Channel R (CH 4) input of the Microlog.
• Support the part under test to allow free movement (e.g., on foam support as illustrated).
• Select an accelerometer of the correct mass and connect it to Channel 1 of the Microlog. (The accelerometer is used to measure the response to the hammer input of the FRF.)
The accelerometer mass should be low in relation to the test piece, that is less than 10%.
• Connect the accelerometer to one of the sides of the object you are going to measure.
FRF Module Setup
Some settings are pre-set to simplify user setup. Pre-set measurement parameters are:
• Pre-trigger delay – set to 10% of block length
• Trigger level – set to 10% of input range
All other settings are configured within the FRF Module.
• From the Home screen, use the arrow keys to highlight the FRF icon, and press an Enter button. The FRF menu displays.
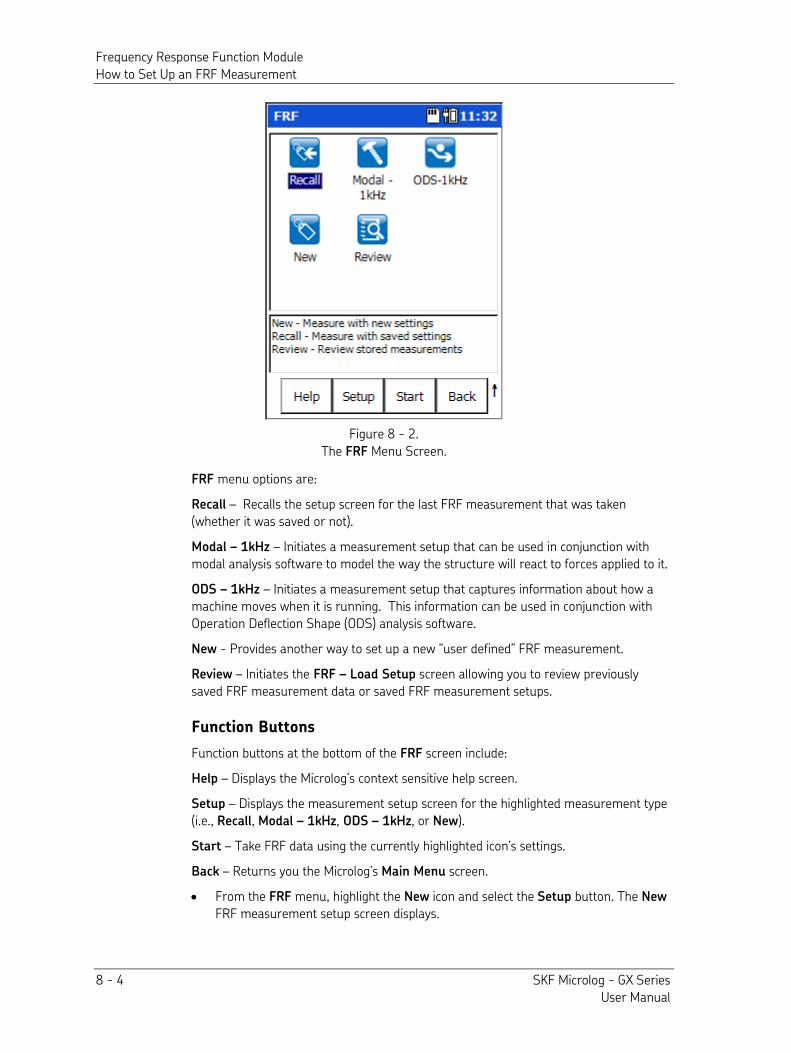
Frequency Response Function Module How to Set Up an FRF Measurement
8 - 4 SKF Microlog - GX Series User Manual
Figure 8 - 2. The FRF Menu Screen.
FRF menu options are:
Recall – Recalls the setup screen for the last FRF measurement that was taken (whether it was saved or not).
Modal – 1kHz – Initiates a measurement setup that can be used in conjunction with modal analysis software to model the way the structure will react to forces applied to it.
ODS – 1kHz – Initiates a measurement setup that captures information about how a machine moves when it is running. This information can be used in conjunction with Operation Deflection Shape (ODS) analysis software. New - Provides another way to set up a new “user defined” FRF measurement.
Review – Initiates the FRF – Load Setup screen allowing you to review previously saved FRF measurement data or saved FRF measurement setups.
Function Buttons
Function buttons at the bottom of the FRF screen include:
Help – Displays the Microlog’s context sensitive help screen.
Setup – Displays the measurement setup screen for the highlighted measurement type (i.e., Recall, Modal – 1kHz, ODS – 1kHz, or New).
Start – Take FRF data using the currently highlighted icon’s settings.
Back – Returns you the Microlog’s Main Menu screen.
• From the FRF menu, highlight the New icon and select the Setup button. The New FRF measurement setup screen displays.
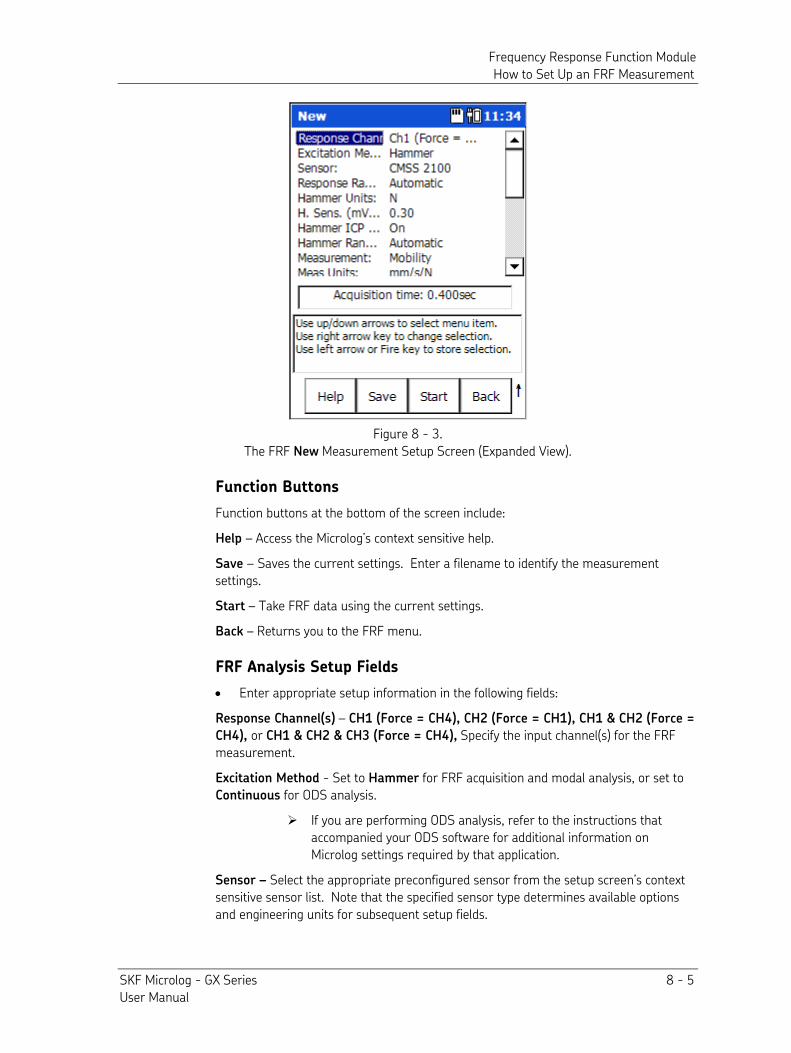
Frequency Response Function Module How to Set Up an FRF Measurement
SKF Microlog - GX Series 8 - 5 User Manual
Figure 8 - 3. The FRF New Measurement Setup Screen (Expanded View).
Function Buttons
Function buttons at the bottom of the screen include:
Help – Access the Microlog’s context sensitive help.
Save – Saves the current settings. Enter a filename to identify the measurement settings.
Start – Take FRF data using the current settings.
Back – Returns you to the FRF menu.
FRF Analysis Setup Fields
• Enter appropriate setup information in the following fields:
Response Channel(s) – CH1 (Force = CH4), CH2 (Force = CH1), CH1 & CH2 (Force =
CH4), or CH1 & CH2 & CH3 (Force = CH4), Specify the input channel(s) for the FRF measurement.
Excitation Method - Set to Hammer for FRF acquisition and modal analysis, or set to Continuous for ODS analysis.
If you are performing ODS analysis, refer to the instructions that accompanied your ODS software for additional information on Microlog settings required by that application.
Sensor – Select the appropriate preconfigured sensor from the setup screen’s context sensitive sensor list. Note that the specified sensor type determines available options and engineering units for subsequent setup fields.
Frequency Response Function Module How to Set Up an FRF Measurement
8 - 6 SKF Microlog - GX Series User Manual
The Variable sensor option allows you to configure settings for a sensor that is not on the sensor list.
Sensor Units – (Not editable if a preconfigured sensor is selected in the Sensor field.) When the Variable sensor is selected, select the measurement units to use for the type of sensor being used. Options include g, in/s, and mil.
Sensitivity – (Not editable if a preconfigured sensor is selected in the Sensor field.) When the Variable sensor is selected, use the alphanumeric keypad to enter transducer sensitivity in millivolts (mV) per Engineering Unit (EU).
ICP Power – (On or Off), (Not editable if a preconfigured sensor is selected in the Sensor field.) When the Variable sensor is selected, select to turn ICP power Off or On for the sensor.
Response Range – Sets response sensor input range manually to selected fixed range, or to be set automatically.
If Hammer Range or Response Range is set to Automatic, the user is prompted to make three trial hits to establish the range to use.
Hammer Units – Set to N for metric, or lbf for English units.
This setting does not restrict the Meas Units options; e.g., if Hammer Units is lbf, mobility can still be measured in mm/sec/N, if desired.
H.Sens – Enter the sensitivity of the hammer in mV/N or mV/lbf. H. ICP Power - (On or Off), Select to turn ICP power Off or On for the hammer.
Hammer Range – Sets hammer input range manually to selected fixed range, or to be set automatically.
Measurement – Sets FRF display type. Available measurement display types are Mobility, Apparent Mass, Accelerance, Impedance, Stiffness and Compliance.
Meas Units – Measurement units change to correspond with the measurement display type that has been chosen, but can be set to English or metric units as per the list.
Y-axis – Sets Y axis to linear, logarithmic or decibel scale. Freq Range – Sets the frequency range for the test. The Acquisition time information box will change accordingly.
Num of Lines – Sets the number of lines of resolution for the FFT. The Acquisition
time information box will change accordingly.
When set to Automatic, the FRF module automatically chooses the number of lines after three trial hits. This uses a Uniform window if possible and automatically increases the lines of resolution to accommodate the decay time. If this cannot be achieved, then Force / Exponential will automatically be selected. This feature is optimized to work for frequency ranges between 200Hz and 4kHz. If Automatic is selected at a frequency range outside this band, the algorithm attempts to auto select, but may not achieve such good results.
Frequency Response Function Module Recording the Measurement
SKF Microlog - GX Series 8 - 7 User Manual
Windowing – Sets the FFT window type to Uniform or Force/Exponential.
Num of Averages – Sets the number of FFT averages.
Accept/Reject – When carrying out a hammer test, setting Accept/Reject to Manual displays a dual time trace and presents the user with an accept or reject control. Setting it to Automatic automatically rejects overloaded data and double impacts.
Invert Phase – Applies a 180o phase offset to the measured data. It is used when the accelerometer or hammer needs to be inverted at a measurement position.
Save To – (Internal or Card) Specify the medium to record to, either the Microlog’s internal disk or an inserted SD card.
Posn. Autoincr – Works with modal analysis software, if this parameter is set to On, then an additional Start Index field appears and prompts for the index’s starting number. For example, if the Start Index is set to 1, then the FRF file is saved as 0001 by default, and then the next file saved is saved as 0002, and so on.
• After setting FRF setup fields, if desired, press the Save function button to name and save the current settings for future recall.
Recording the Measurement
Once the measurement is set up and the transducers are attached correctly, the next step is to start collecting data for the FRF.
To Collect FRF Data:
• From the Setup screen, press the Start function button.
If you have Hammer Range, Response Range or Num of Lines set to automatic, a message displays advising you that you will be asked to perform three trial hits. The results of these hits are used to automatically determine the best settings for the associated options.
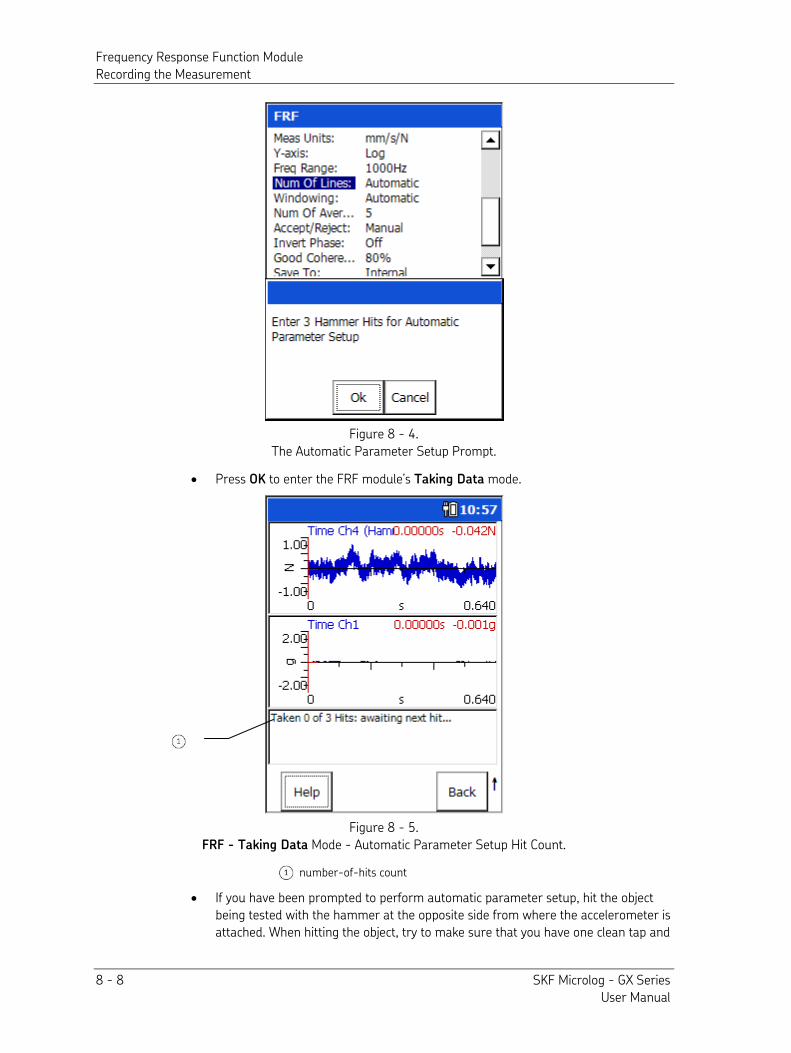
Frequency Response Function Module Recording the Measurement
8 - 8 SKF Microlog - GX Series User Manual
Figure 8 - 4. The Automatic Parameter Setup Prompt.
• Press OK to enter the FRF module’s Taking Data mode.
Figure 8 - 5. FRF - Taking Data Mode - Automatic Parameter Setup Hit Count.
number-of-hits count
• If you have been prompted to perform automatic parameter setup, hit the object being tested with the hammer at the opposite side from where the accelerometer is attached. When hitting the object, try to make sure that you have one clean tap and
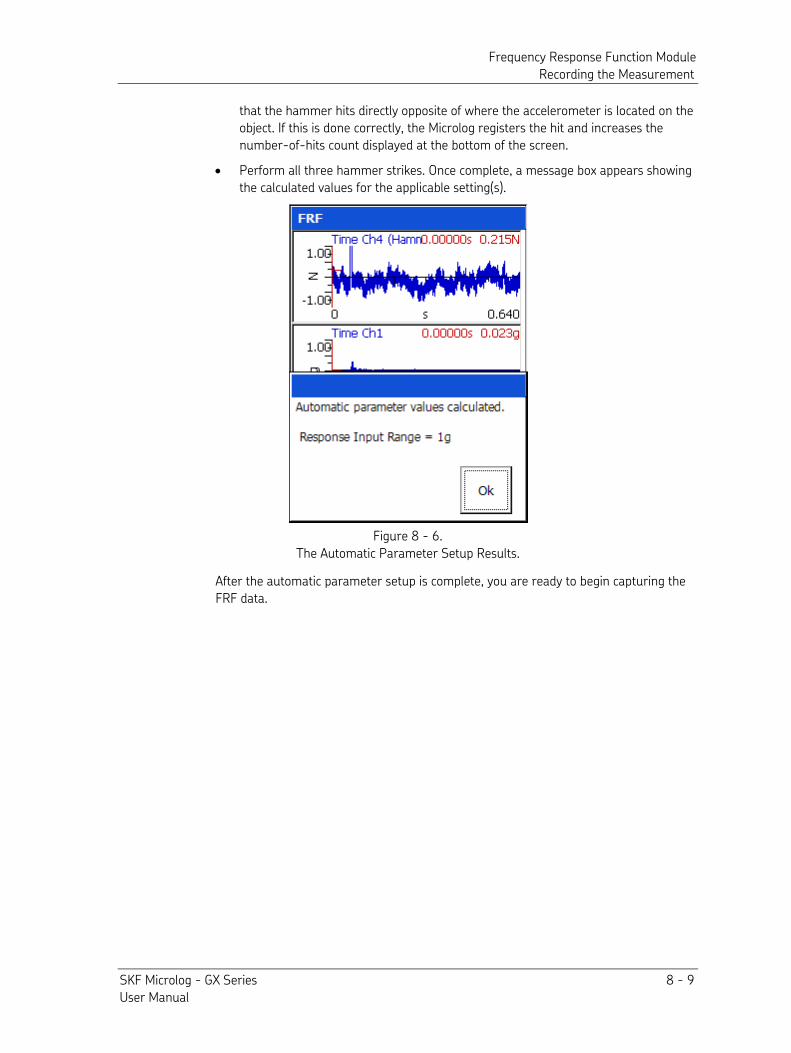
Frequency Response Function Module Recording the Measurement
SKF Microlog - GX Series 8 - 9 User Manual
that the hammer hits directly opposite of where the accelerometer is located on the object. If this is done correctly, the Microlog registers the hit and increases the number-of-hits count displayed at the bottom of the screen.
• Perform all three hammer strikes. Once complete, a message box appears showing the calculated values for the applicable setting(s).
Figure 8 - 6. The Automatic Parameter Setup Results.
After the automatic parameter setup is complete, you are ready to begin capturing the FRF data.
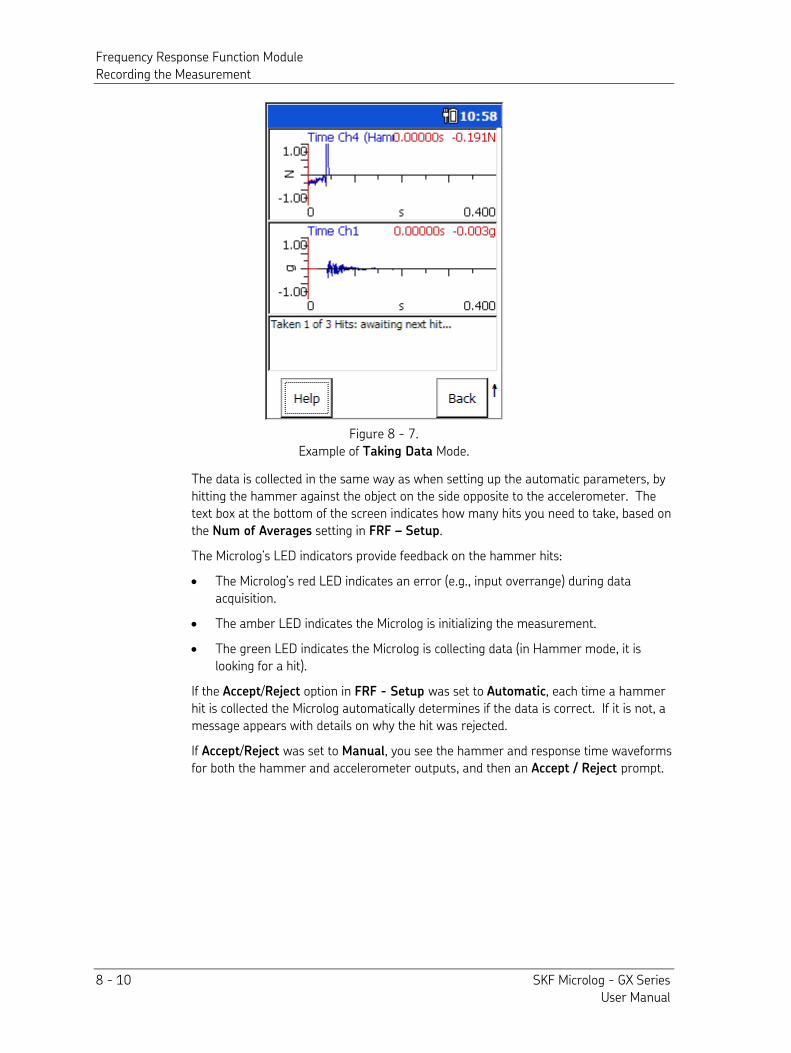
Frequency Response Function Module Recording the Measurement
8 - 10 SKF Microlog - GX Series User Manual
Figure 8 - 7. Example of Taking Data Mode.
The data is collected in the same way as when setting up the automatic parameters, by hitting the hammer against the object on the side opposite to the accelerometer. The text box at the bottom of the screen indicates how many hits you need to take, based on the Num of Averages setting in FRF – Setup.
The Microlog’s LED indicators provide feedback on the hammer hits: • The Microlog’s red LED indicates an error (e.g., input overrange) during data
acquisition.
• The amber LED indicates the Microlog is initializing the measurement. • The green LED indicates the Microlog is collecting data (in Hammer mode, it is
looking for a hit).
If the Accept/Reject option in FRF - Setup was set to Automatic, each time a hammer hit is collected the Microlog automatically determines if the data is correct. If it is not, a message appears with details on why the hit was rejected.
If Accept/Reject was set to Manual, you see the hammer and response time waveforms for both the hammer and accelerometer outputs, and then an Accept / Reject prompt.
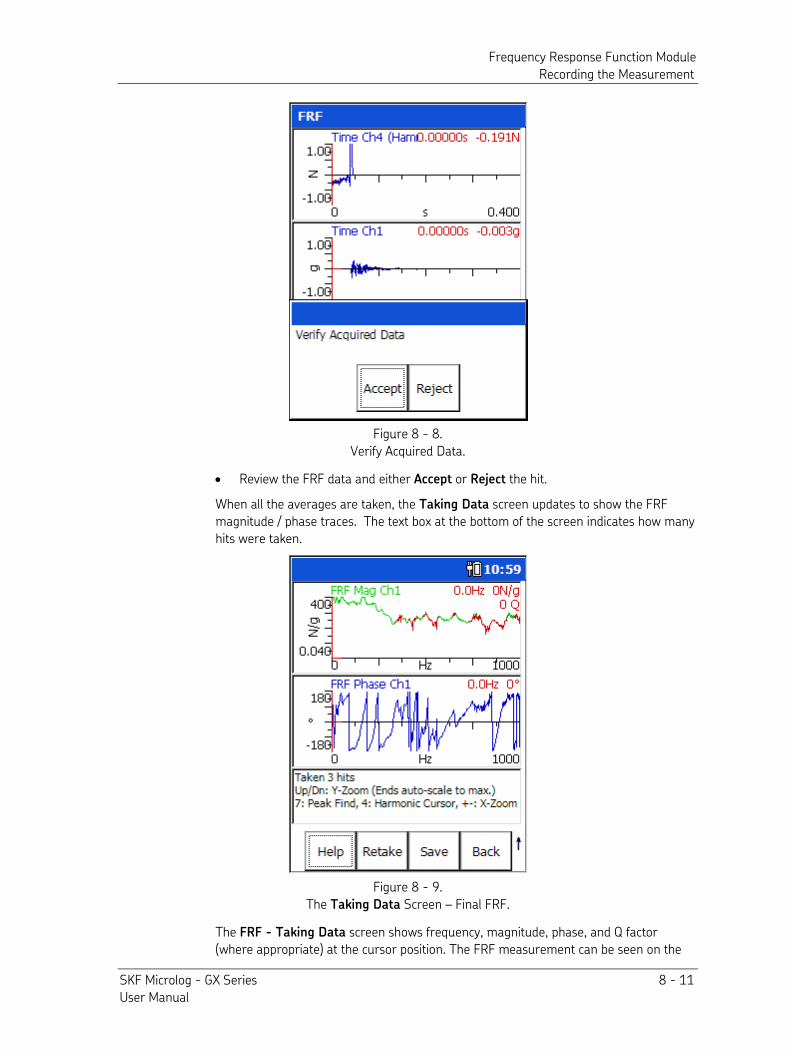
Frequency Response Function Module Recording the Measurement
SKF Microlog - GX Series 8 - 11 User Manual
Figure 8 - 8. Verify Acquired Data.
• Review the FRF data and either Accept or Reject the hit.
When all the averages are taken, the Taking Data screen updates to show the FRF magnitude / phase traces. The text box at the bottom of the screen indicates how many hits were taken.
Figure 8 - 9. The Taking Data Screen – Final FRF.
The FRF - Taking Data screen shows frequency, magnitude, phase, and Q factor (where appropriate) at the cursor position. The FRF measurement can be seen on the
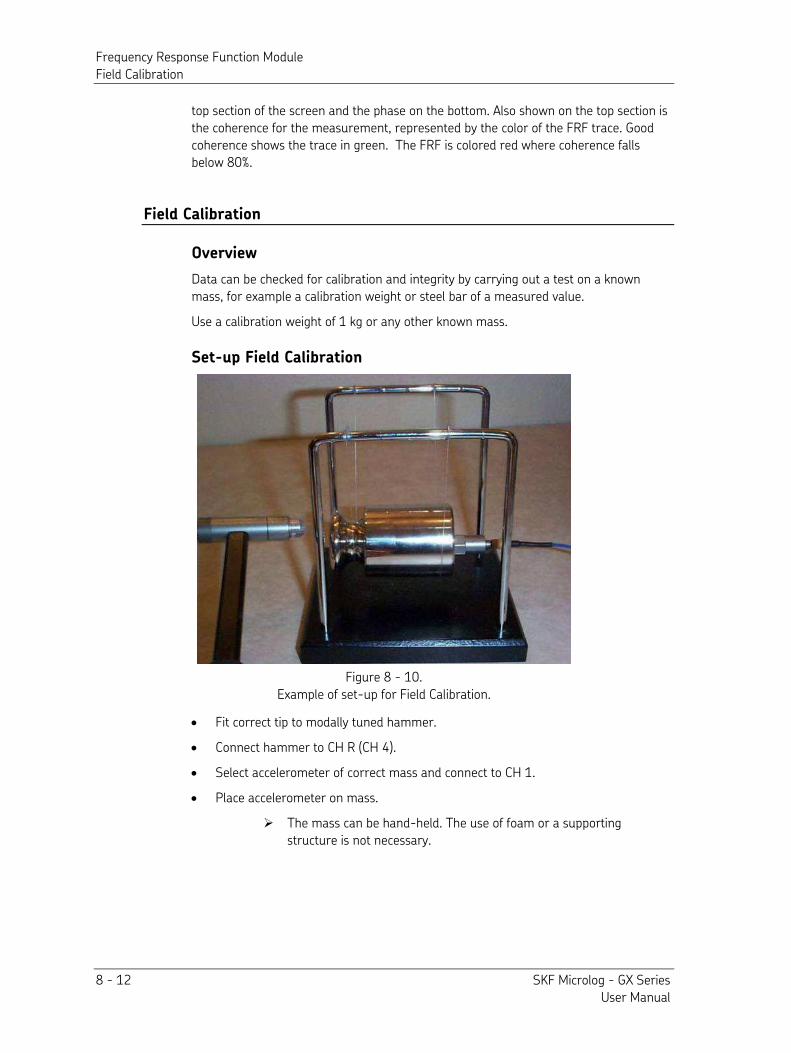
Frequency Response Function Module Field Calibration
8 - 12 SKF Microlog - GX Series User Manual
top section of the screen and the phase on the bottom. Also shown on the top section is the coherence for the measurement, represented by the color of the FRF trace. Good coherence shows the trace in green. The FRF is colored red where coherence falls below 80%.
Field Calibration
Overview
Data can be checked for calibration and integrity by carrying out a test on a known mass, for example a calibration weight or steel bar of a measured value.
Use a calibration weight of 1 kg or any other known mass.
Set-up Field Calibration
Figure 8 - 10. Example of set-up for Field Calibration.
• Fit correct tip to modally tuned hammer.
• Connect hammer to CH R (CH 4). • Select accelerometer of correct mass and connect to CH 1.
• Place accelerometer on mass.
The mass can be hand-held. The use of foam or a supporting structure is not necessary.
Frequency Response Function Module Saving FRF Data
SKF Microlog - GX Series 8 - 13 User Manual
Field Calibration Set-up Fields
• Access the FRF – Setup screen following the instructions under the heading Set-up
the FRF Module, earlier in this chapter.
• Set Measurement to Apparent Mass.
• Set Meas Units to N/m/s2.
The Microlog should then display 1 kg (or other chosen mass), plus the weight of the accelerometer: M = calibrated mass + accelerometer mass (e.g., 1 kg + 10.5 g = 1.0105 kg).
Saving FRF Data
Saving, Reviewing, and Deleting Measurements
Procedures for saving measurement setups, for saving measurement results, for viewing stored measurements, and for deleting stored measurements are similar between modules. Reference Chapter 4, The Analyzer Module section on How to
Save, View, and Delete Analyzer Measurement Results for detailed information on these procedures.

SKF Microlog - GX Series 9 - 1 User Manual
9
Conformance Check Module
Overview
The Microlog GX’s Conformance Check Module is used by personnel who wish to perform before-and-after type vibration level tests for pass / fail conformance in accordance with an appropriate ISO, ANSI, API or other standard, including vibration level standards defined by the user. Examples for its use are:
• A motor rewind shop tests motors before-and-after overhaul to verify and document vibration level improvement and conformance to an appropriate standard.
• A manufacturer’s vibration level check to an appropriate conformance standard on newly manufactured machinery or machinery components prior to delivery.
• A maintenance department’s vibration level checks on newly assembled equipment, or for before-and-after vibration level checks on repaired equipment.
In addition, the Microlog GX’s conformance monitoring ability provides a documented audit trail of machinery vibration levels (e.g., for comparison between “as delivered” and “as received” vibration levels).
The Microlog GX is intended for use by:
• Installation Engineers
• Mechanics
• Commissioning Engineers
• Maintenance Engineers
• Fitters
• Inspection Engineers
• Servicing Personnel
• Noise & Vibration Specialists
Conformance test settings are specified in “test template files” that are transferred to the Microlog GX. A variety of pre-configured test templates are available from your local SKF sales representative. These pre-configured test templates measure machinery vibration in accordance with a recognized international standard (e.g., ISO, ANSI, API, etc.). Each test template defines a standard’s vibration level measurements for a specific machinery classification, and the measurement grade levels to which measurement results are compared.
You may apply these conventional test templates with their standardized measurement grade settings, or you may use a host computer with the supplied Conformance Check
Setup Generator software (CC Setup software) to modify the standardized test template settings to more accurately apply to your machinery vibration conformance
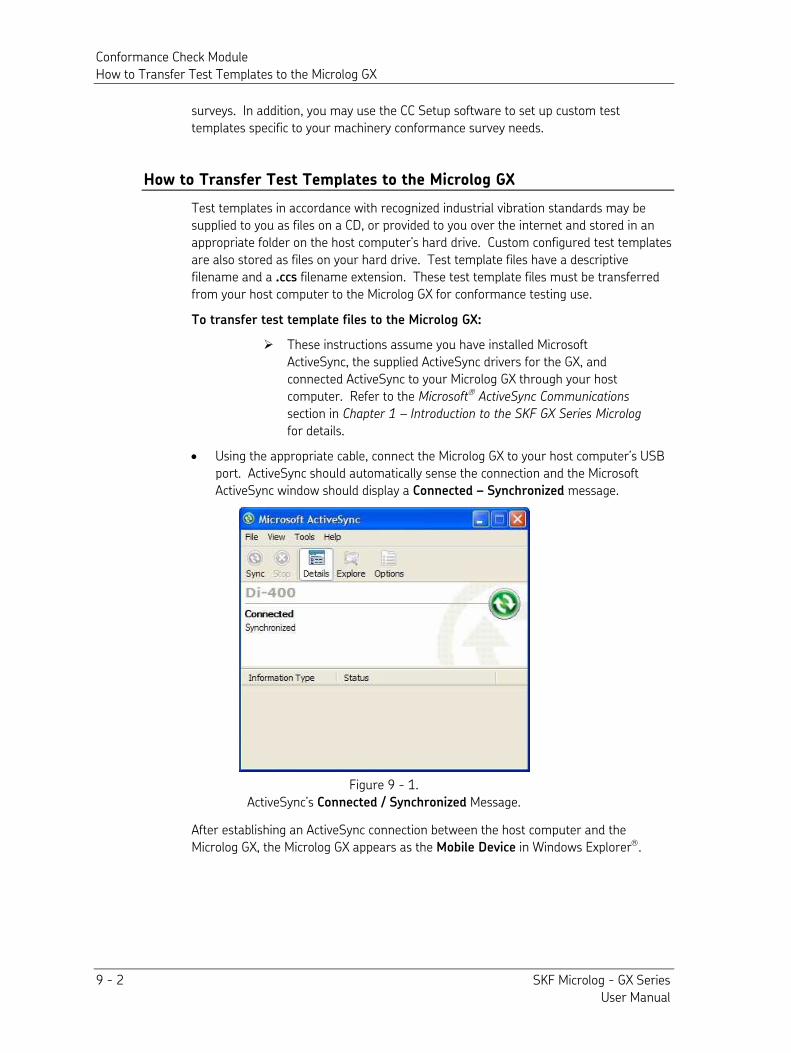
Conformance Check Module How to Transfer Test Templates to the Microlog GX
9 - 2 SKF Microlog - GX Series User Manual
surveys. In addition, you may use the CC Setup software to set up custom test templates specific to your machinery conformance survey needs.
How to Transfer Test Templates to the Microlog GX
Test templates in accordance with recognized industrial vibration standards may be supplied to you as files on a CD, or provided to you over the internet and stored in an appropriate folder on the host computer’s hard drive. Custom configured test templates are also stored as files on your hard drive. Test template files have a descriptive filename and a .ccs filename extension. These test template files must be transferred from your host computer to the Microlog GX for conformance testing use.
To transfer test template files to the Microlog GX:
These instructions assume you have installed Microsoft ActiveSync, the supplied ActiveSync drivers for the GX, and connected ActiveSync to your Microlog GX through your host computer. Refer to the Microsoft ActiveSync Communications
section in Chapter 1 – Introduction to the SKF GX Series Microlog for details.
• Using the appropriate cable, connect the Microlog GX to your host computer’s USB port. ActiveSync should automatically sense the connection and the Microsoft ActiveSync window should display a Connected – Synchronized message.
Figure 9 - 1. ActiveSync’s Connected / Synchronized Message.
After establishing an ActiveSync connection between the host computer and the Microlog GX, the Microlog GX appears as the Mobile Device in Windows Explorer.
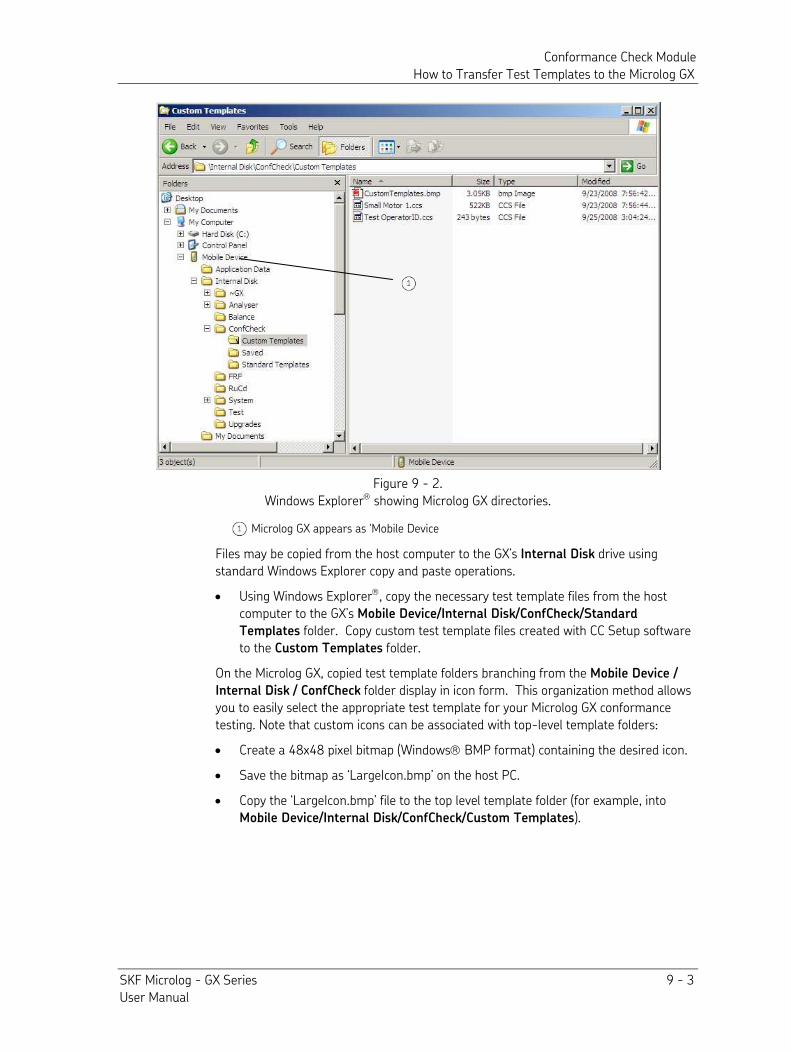
Conformance Check Module How to Transfer Test Templates to the Microlog GX
SKF Microlog - GX Series 9 - 3 User Manual
Figure 9 - 2. Windows Explorer showing Microlog GX directories.
Microlog GX appears as ‘Mobile Device
Files may be copied from the host computer to the GX’s Internal Disk drive using standard Windows Explorer copy and paste operations. • Using Windows Explorer, copy the necessary test template files from the host
computer to the GX’s Mobile Device/Internal Disk/ConfCheck/Standard
Templates folder. Copy custom test template files created with CC Setup software to the Custom Templates folder.
On the Microlog GX, copied test template folders branching from the Mobile Device / Internal Disk / ConfCheck folder display in icon form. This organization method allows you to easily select the appropriate test template for your Microlog GX conformance testing. Note that custom icons can be associated with top-level template folders:
• Create a 48x48 pixel bitmap (Windows BMP format) containing the desired icon.
• Save the bitmap as ‘LargeIcon.bmp’ on the host PC. • Copy the ‘LargeIcon.bmp’ file to the top level template folder (for example, into
Mobile Device/Internal Disk/ConfCheck/Custom Templates).
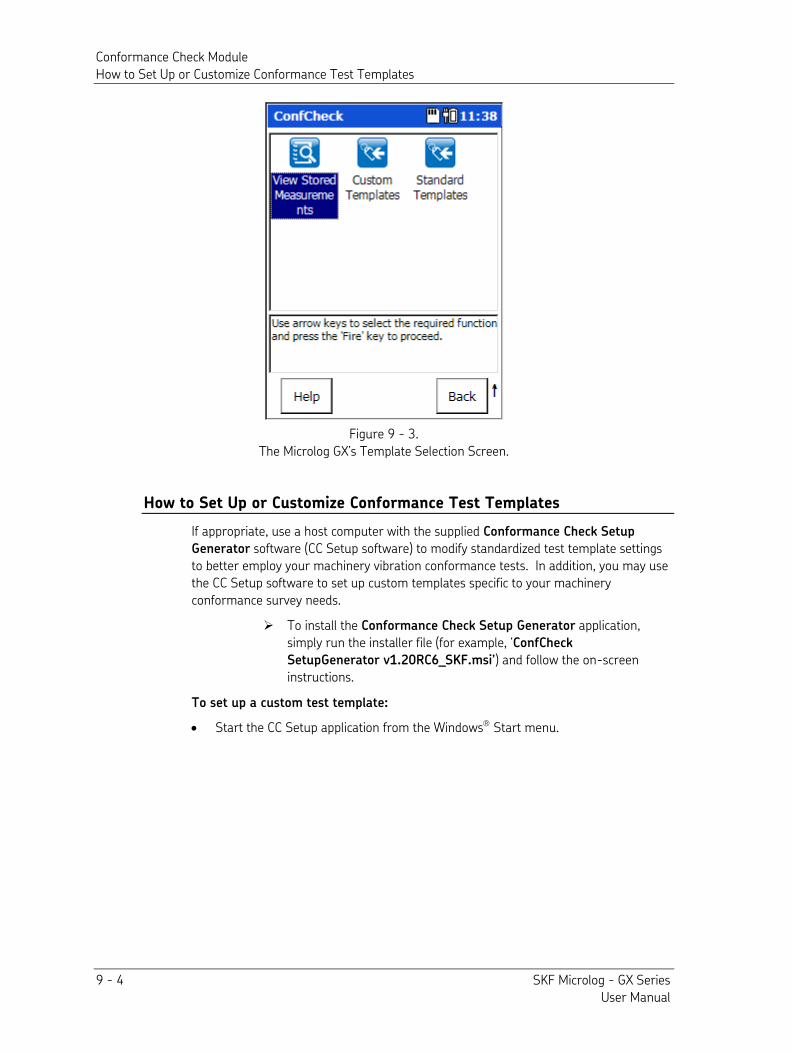
Conformance Check Module How to Set Up or Customize Conformance Test Templates
9 - 4 SKF Microlog - GX Series User Manual
Figure 9 - 3. The Microlog GX’s Template Selection Screen.
How to Set Up or Customize Conformance Test Templates
If appropriate, use a host computer with the supplied Conformance Check Setup
Generator software (CC Setup software) to modify standardized test template settings to better employ your machinery vibration conformance tests. In addition, you may use the CC Setup software to set up custom templates specific to your machinery conformance survey needs.
To install the Conformance Check Setup Generator application, simply run the installer file (for example, ‘ConfCheck
SetupGenerator v1.20RC6_SKF.msi’) and follow the on-screen instructions.
To set up a custom test template:
• Start the CC Setup application from the Windows Start menu.
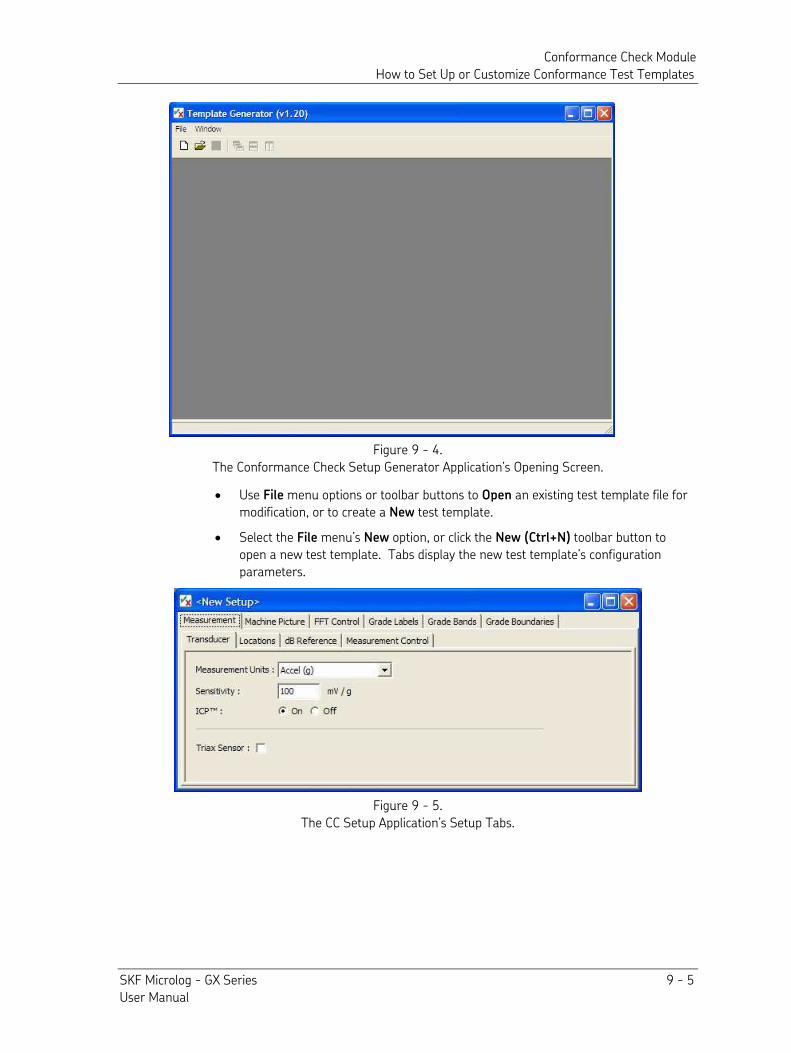
Conformance Check Module How to Set Up or Customize Conformance Test Templates
SKF Microlog - GX Series 9 - 5 User Manual
Figure 9 - 4. The Conformance Check Setup Generator Application’s Opening Screen. • Use File menu options or toolbar buttons to Open an existing test template file for
modification, or to create a New test template.
• Select the File menu’s New option, or click the New (Ctrl+N) toolbar button to open a new test template. Tabs display the new test template’s configuration parameters.
Figure 9 - 5. The CC Setup Application’s Setup Tabs.
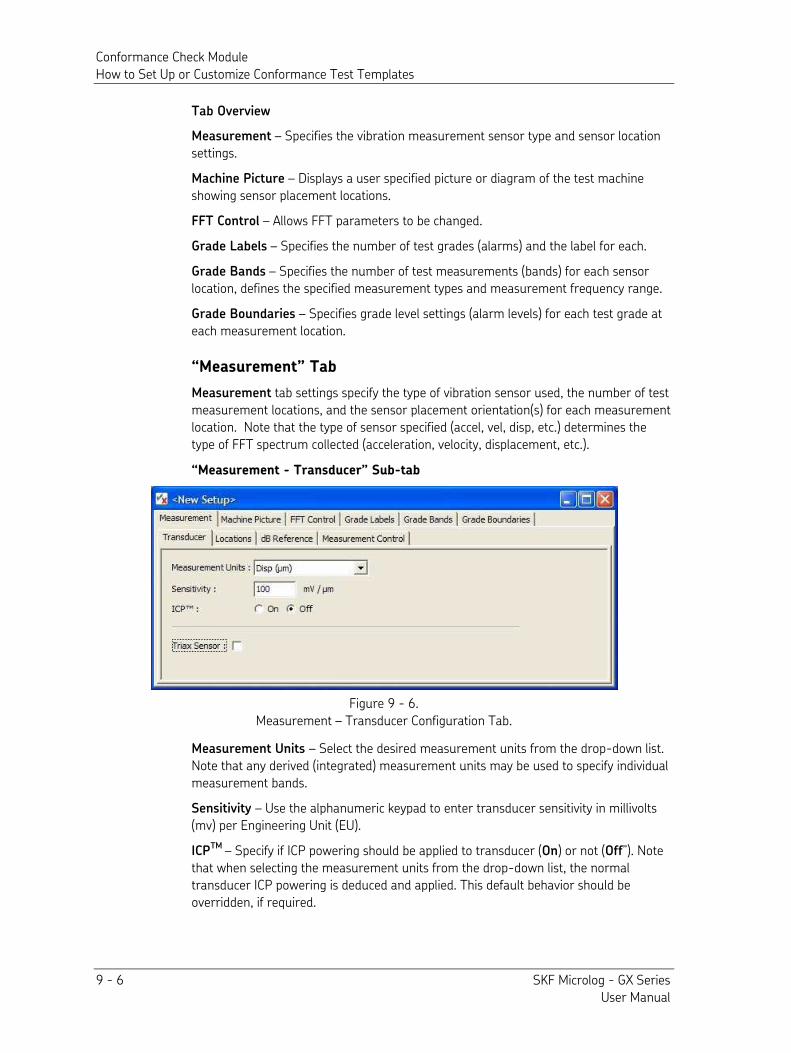
Conformance Check Module How to Set Up or Customize Conformance Test Templates
9 - 6 SKF Microlog - GX Series User Manual
Tab Overview
Measurement – Specifies the vibration measurement sensor type and sensor location settings.
Machine Picture – Displays a user specified picture or diagram of the test machine showing sensor placement locations.
FFT Control – Allows FFT parameters to be changed.
Grade Labels – Specifies the number of test grades (alarms) and the label for each.
Grade Bands – Specifies the number of test measurements (bands) for each sensor location, defines the specified measurement types and measurement frequency range.
Grade Boundaries – Specifies grade level settings (alarm levels) for each test grade at each measurement location.
“Measurement” Tab
Measurement tab settings specify the type of vibration sensor used, the number of test measurement locations, and the sensor placement orientation(s) for each measurement location. Note that the type of sensor specified (accel, vel, disp, etc.) determines the type of FFT spectrum collected (acceleration, velocity, displacement, etc.).
“Measurement - Transducer” Sub-tab
Figure 9 - 6. Measurement – Transducer Configuration Tab.
Measurement Units – Select the desired measurement units from the drop-down list. Note that any derived (integrated) measurement units may be used to specify individual measurement bands.
Sensitivity – Use the alphanumeric keypad to enter transducer sensitivity in millivolts (mv) per Engineering Unit (EU).
ICPTM – Specify if ICP powering should be applied to transducer (On) or not (Off”). Note that when selecting the measurement units from the drop-down list, the normal transducer ICP powering is deduced and applied. This default behavior should be overridden, if required.
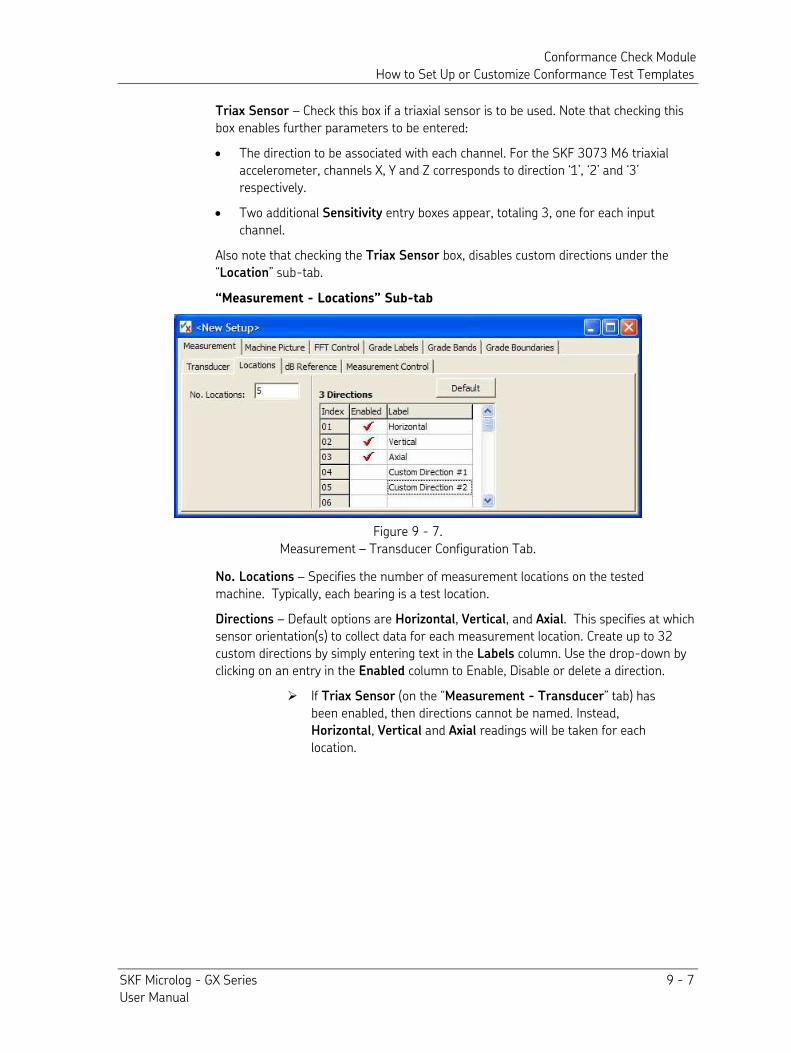
Conformance Check Module How to Set Up or Customize Conformance Test Templates
SKF Microlog - GX Series 9 - 7 User Manual
Triax Sensor – Check this box if a triaxial sensor is to be used. Note that checking this box enables further parameters to be entered:
• The direction to be associated with each channel. For the SKF 3073 M6 triaxial accelerometer, channels X, Y and Z corresponds to direction ‘1’, ‘2’ and ‘3’ respectively.
• Two additional Sensitivity entry boxes appear, totaling 3, one for each input channel.
Also note that checking the Triax Sensor box, disables custom directions under the “Location” sub-tab.
“Measurement - Locations” Sub-tab
Figure 9 - 7. Measurement – Transducer Configuration Tab.
No. Locations – Specifies the number of measurement locations on the tested machine. Typically, each bearing is a test location.
Directions – Default options are Horizontal, Vertical, and Axial. This specifies at which sensor orientation(s) to collect data for each measurement location. Create up to 32 custom directions by simply entering text in the Labels column. Use the drop-down by clicking on an entry in the Enabled column to Enable, Disable or delete a direction.
If Triax Sensor (on the “Measurement - Transducer” tab) has been enabled, then directions cannot be named. Instead, Horizontal, Vertical and Axial readings will be taken for each location.
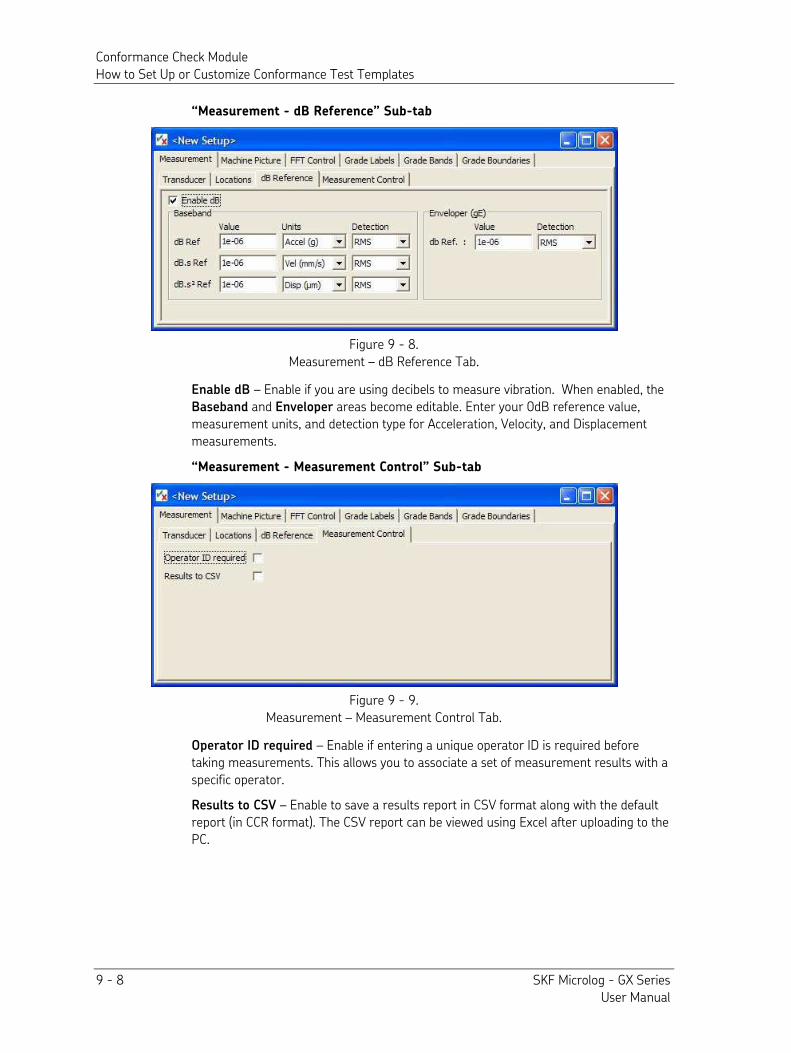
Conformance Check Module How to Set Up or Customize Conformance Test Templates
9 - 8 SKF Microlog - GX Series User Manual
“Measurement - dB Reference” Sub-tab
Figure 9 - 8. Measurement – dB Reference Tab.
Enable dB – Enable if you are using decibels to measure vibration. When enabled, the Baseband and Enveloper areas become editable. Enter your 0dB reference value, measurement units, and detection type for Acceleration, Velocity, and Displacement measurements.
“Measurement - Measurement Control” Sub-tab
Figure 9 - 9. Measurement – Measurement Control Tab.
Operator ID required – Enable if entering a unique operator ID is required before taking measurements. This allows you to associate a set of measurement results with a specific operator.
Results to CSV – Enable to save a results report in CSV format along with the default report (in CCR format). The CSV report can be viewed using Excel after uploading to the PC.
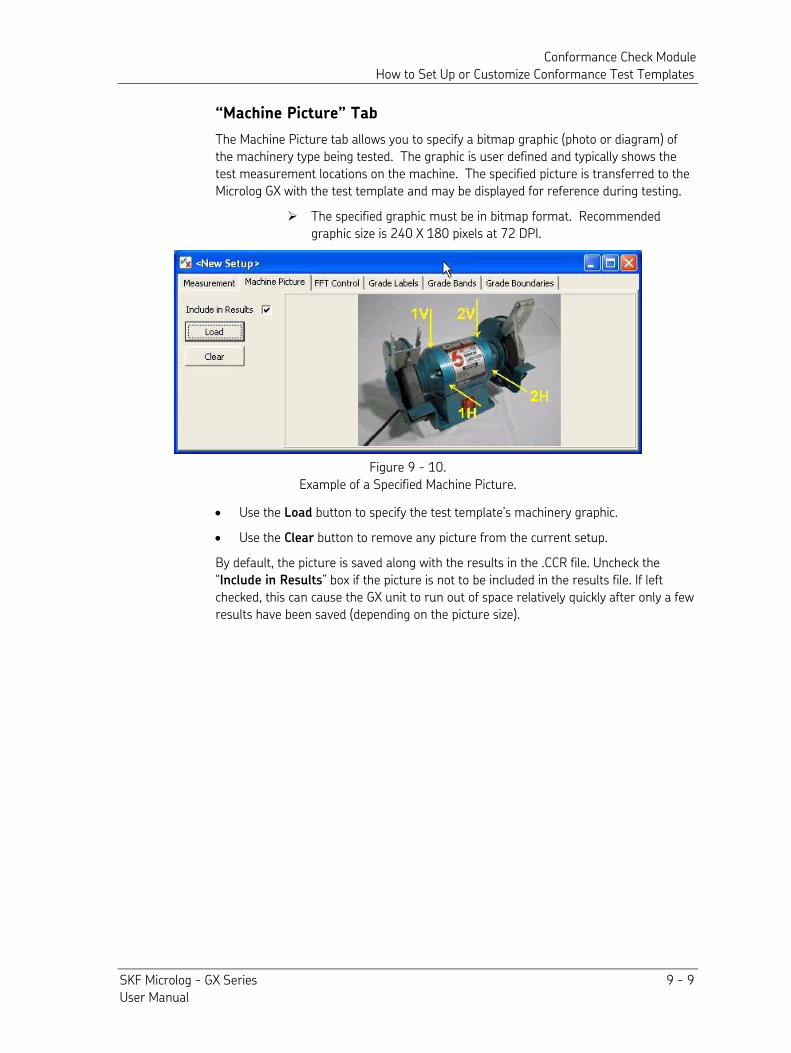
Conformance Check Module How to Set Up or Customize Conformance Test Templates
SKF Microlog - GX Series 9 - 9 User Manual
“Machine Picture” Tab
The Machine Picture tab allows you to specify a bitmap graphic (photo or diagram) of the machinery type being tested. The graphic is user defined and typically shows the test measurement locations on the machine. The specified picture is transferred to the Microlog GX with the test template and may be displayed for reference during testing.
The specified graphic must be in bitmap format. Recommended graphic size is 240 X 180 pixels at 72 DPI.
Figure 9 - 10. Example of a Specified Machine Picture.
• Use the Load button to specify the test template’s machinery graphic.
• Use the Clear button to remove any picture from the current setup.
By default, the picture is saved along with the results in the .CCR file. Uncheck the “Include in Results” box if the picture is not to be included in the results file. If left checked, this can cause the GX unit to run out of space relatively quickly after only a few results have been saved (depending on the picture size).
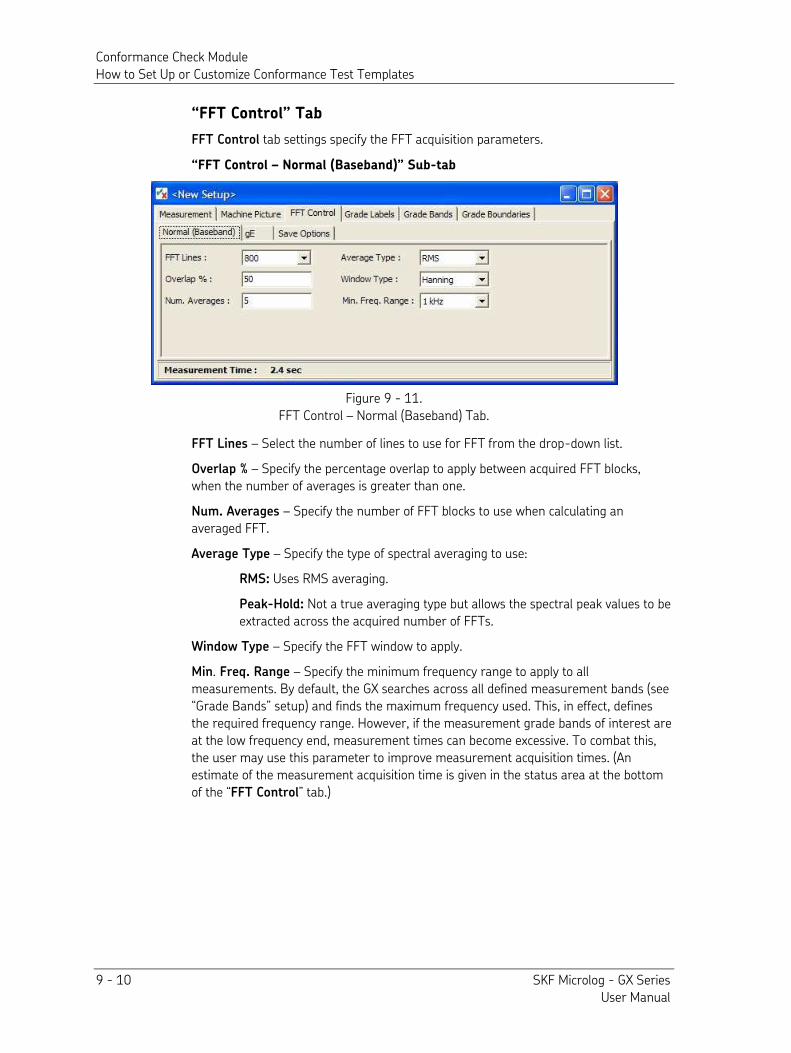
Conformance Check Module How to Set Up or Customize Conformance Test Templates
9 - 10 SKF Microlog - GX Series User Manual
“FFT Control” Tab
FFT Control tab settings specify the FFT acquisition parameters.
“FFT Control – Normal (Baseband)” Sub-tab
Figure 9 - 11. FFT Control – Normal (Baseband) Tab.
FFT Lines – Select the number of lines to use for FFT from the drop-down list.
Overlap % – Specify the percentage overlap to apply between acquired FFT blocks, when the number of averages is greater than one.
Num. Averages – Specify the number of FFT blocks to use when calculating an averaged FFT.
Average Type – Specify the type of spectral averaging to use:
RMS: Uses RMS averaging.
Peak-Hold: Not a true averaging type but allows the spectral peak values to be extracted across the acquired number of FFTs.
Window Type – Specify the FFT window to apply.
Min. Freq. Range – Specify the minimum frequency range to apply to all measurements. By default, the GX searches across all defined measurement bands (see “Grade Bands” setup) and finds the maximum frequency used. This, in effect, defines the required frequency range. However, if the measurement grade bands of interest are at the low frequency end, measurement times can become excessive. To combat this, the user may use this parameter to improve measurement acquisition times. (An estimate of the measurement acquisition time is given in the status area at the bottom of the “FFT Control” tab.)
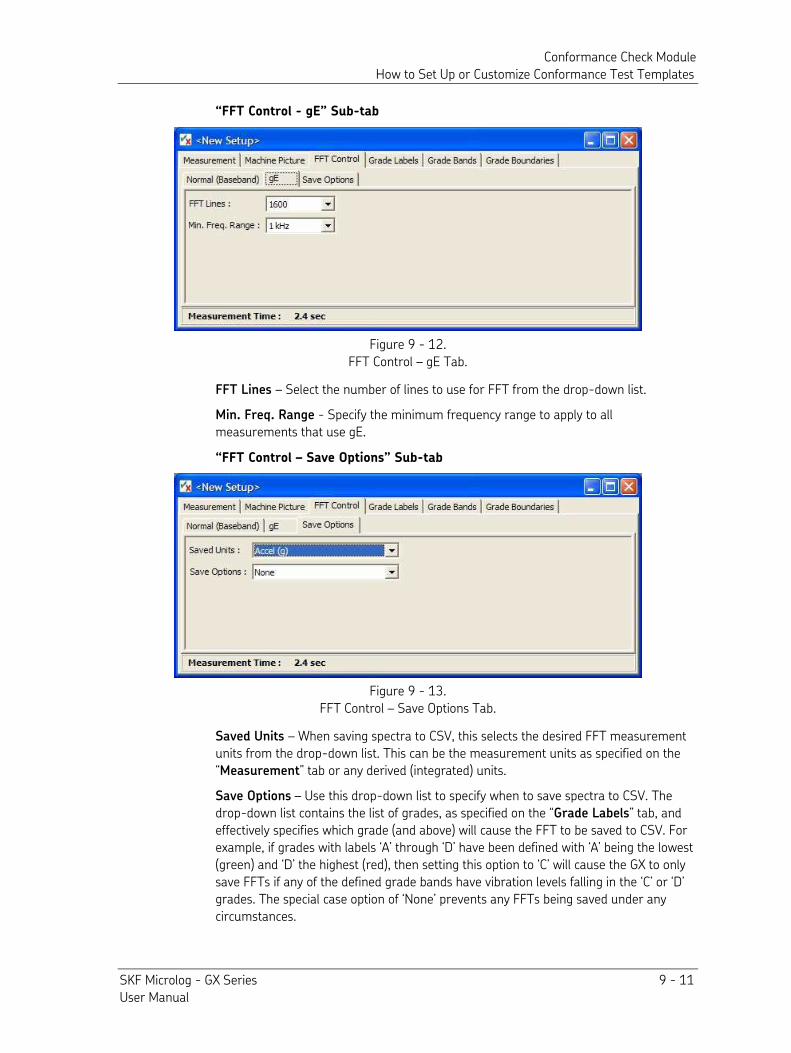
Conformance Check Module How to Set Up or Customize Conformance Test Templates
SKF Microlog - GX Series 9 - 11 User Manual
“FFT Control - gE” Sub-tab
Figure 9 - 12. FFT Control – gE Tab.
FFT Lines – Select the number of lines to use for FFT from the drop-down list.
Min. Freq. Range - Specify the minimum frequency range to apply to all measurements that use gE.
“FFT Control – Save Options” Sub-tab
Figure 9 - 13. FFT Control – Save Options Tab.
Saved Units – When saving spectra to CSV, this selects the desired FFT measurement units from the drop-down list. This can be the measurement units as specified on the “Measurement” tab or any derived (integrated) units.
Save Options – Use this drop-down list to specify when to save spectra to CSV. The drop-down list contains the list of grades, as specified on the “Grade Labels” tab, and effectively specifies which grade (and above) will cause the FFT to be saved to CSV. For example, if grades with labels ‘A’ through ‘D’ have been defined with ‘A’ being the lowest (green) and ‘D’ the highest (red), then setting this option to ‘C’ will cause the GX to only save FFTs if any of the defined grade bands have vibration levels falling in the ‘C’ or ‘D’ grades. The special case option of ‘None’ prevents any FFTs being saved under any circumstances.
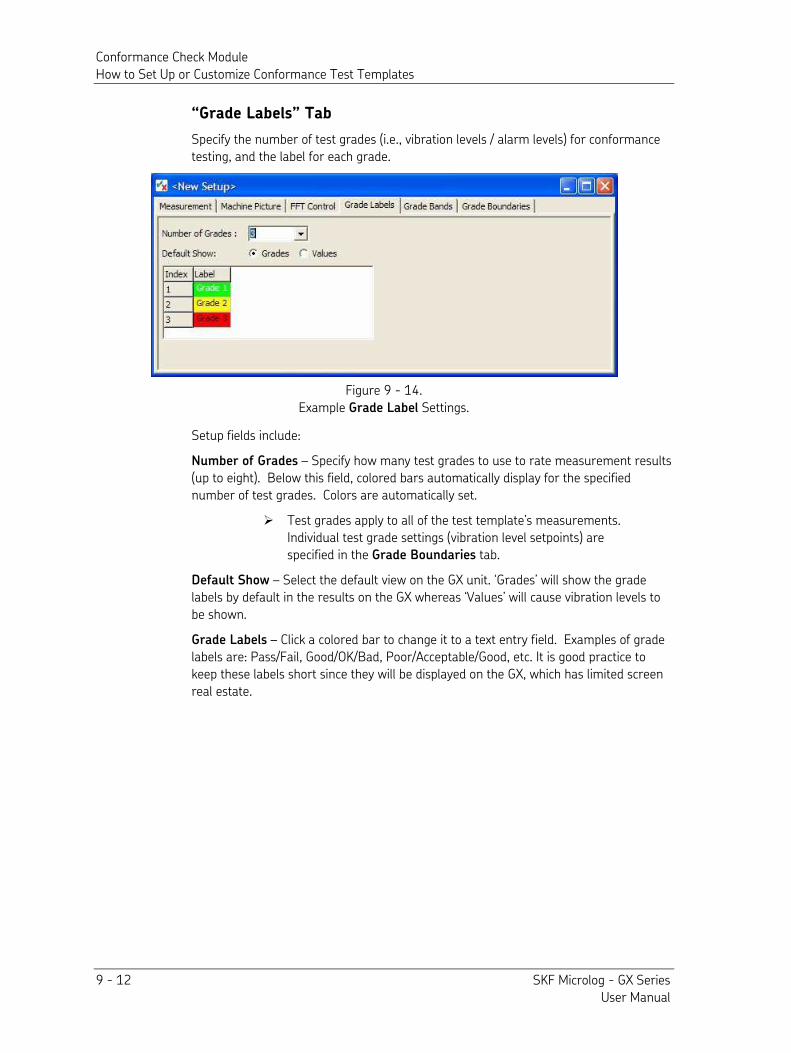
Conformance Check Module How to Set Up or Customize Conformance Test Templates
9 - 12 SKF Microlog - GX Series User Manual
“Grade Labels” Tab
Specify the number of test grades (i.e., vibration levels / alarm levels) for conformance testing, and the label for each grade.
Figure 9 - 14. Example Grade Label Settings.
Setup fields include:
Number of Grades – Specify how many test grades to use to rate measurement results (up to eight). Below this field, colored bars automatically display for the specified number of test grades. Colors are automatically set.
Test grades apply to all of the test template’s measurements. Individual test grade settings (vibration level setpoints) are specified in the Grade Boundaries tab.
Default Show – Select the default view on the GX unit. ‘Grades’ will show the grade labels by default in the results on the GX whereas ‘Values’ will cause vibration levels to be shown.
Grade Labels – Click a colored bar to change it to a text entry field. Examples of grade labels are: Pass/Fail, Good/OK/Bad, Poor/Acceptable/Good, etc. It is good practice to keep these labels short since they will be displayed on the GX, which has limited screen real estate.
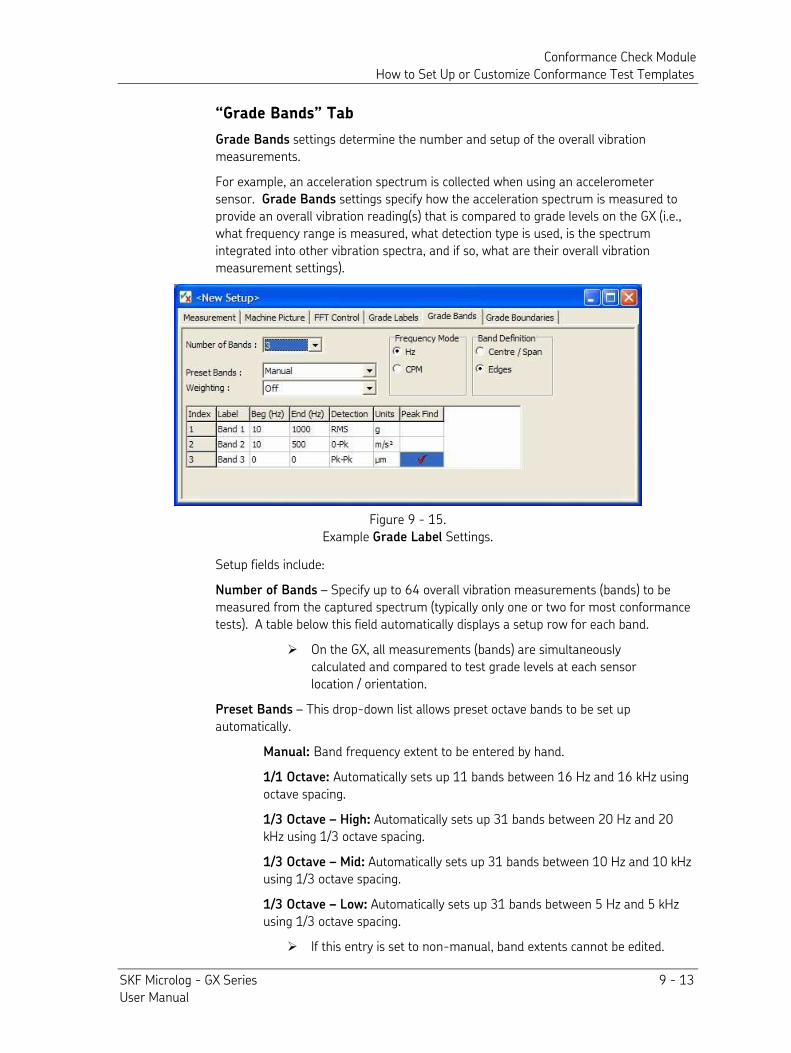
Conformance Check Module How to Set Up or Customize Conformance Test Templates
SKF Microlog - GX Series 9 - 13 User Manual
“Grade Bands” Tab
Grade Bands settings determine the number and setup of the overall vibration measurements.
For example, an acceleration spectrum is collected when using an accelerometer sensor. Grade Bands settings specify how the acceleration spectrum is measured to provide an overall vibration reading(s) that is compared to grade levels on the GX (i.e., what frequency range is measured, what detection type is used, is the spectrum integrated into other vibration spectra, and if so, what are their overall vibration measurement settings).
Figure 9 - 15. Example Grade Label Settings.
Setup fields include:
Number of Bands – Specify up to 64 overall vibration measurements (bands) to be measured from the captured spectrum (typically only one or two for most conformance tests). A table below this field automatically displays a setup row for each band.
On the GX, all measurements (bands) are simultaneously calculated and compared to test grade levels at each sensor location / orientation.
Preset Bands – This drop-down list allows preset octave bands to be set up automatically.
Manual: Band frequency extent to be entered by hand.
1/1 Octave: Automatically sets up 11 bands between 16 Hz and 16 kHz using octave spacing.
1/3 Octave – High: Automatically sets up 31 bands between 20 Hz and 20 kHz using 1/3 octave spacing. 1/3 Octave – Mid: Automatically sets up 31 bands between 10 Hz and 10 kHz using 1/3 octave spacing.
1/3 Octave – Low: Automatically sets up 31 bands between 5 Hz and 5 kHz using 1/3 octave spacing.
If this entry is set to non-manual, band extents cannot be edited.
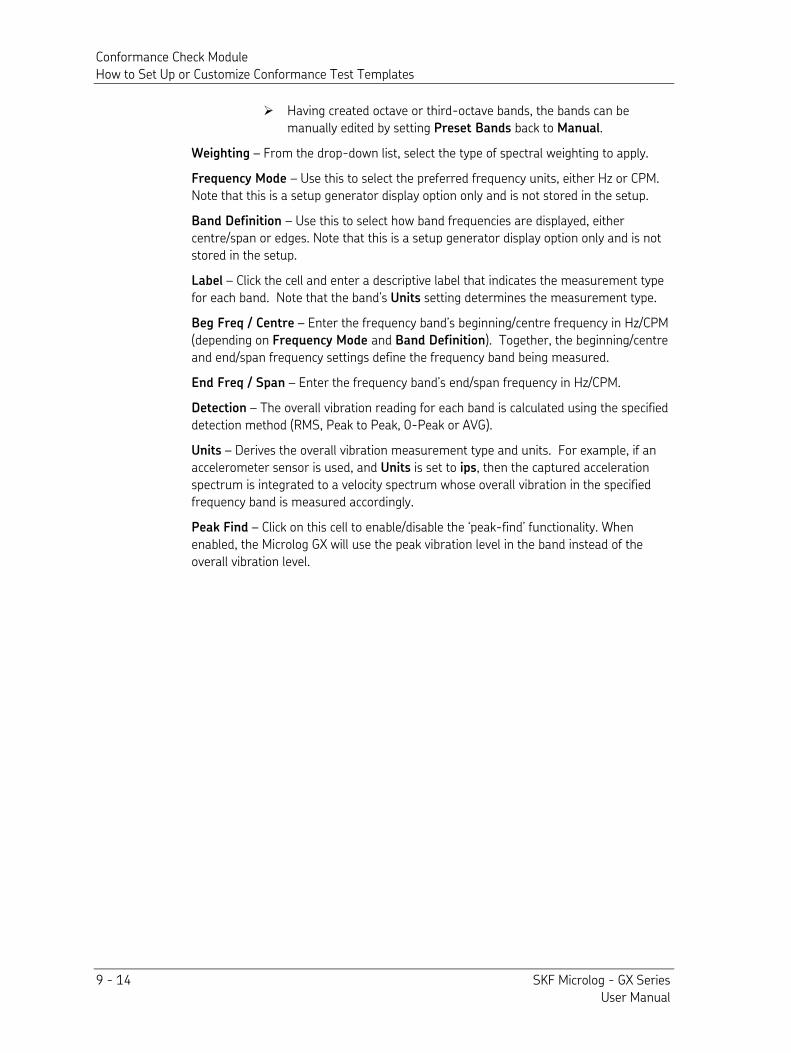
Conformance Check Module How to Set Up or Customize Conformance Test Templates
9 - 14 SKF Microlog - GX Series User Manual
Having created octave or third-octave bands, the bands can be manually edited by setting Preset Bands back to Manual.
Weighting – From the drop-down list, select the type of spectral weighting to apply.
Frequency Mode – Use this to select the preferred frequency units, either Hz or CPM. Note that this is a setup generator display option only and is not stored in the setup.
Band Definition – Use this to select how band frequencies are displayed, either centre/span or edges. Note that this is a setup generator display option only and is not stored in the setup.
Label – Click the cell and enter a descriptive label that indicates the measurement type for each band. Note that the band’s Units setting determines the measurement type.
Beg Freq / Centre – Enter the frequency band’s beginning/centre frequency in Hz/CPM (depending on Frequency Mode and Band Definition). Together, the beginning/centre and end/span frequency settings define the frequency band being measured.
End Freq / Span – Enter the frequency band’s end/span frequency in Hz/CPM. Detection – The overall vibration reading for each band is calculated using the specified detection method (RMS, Peak to Peak, 0-Peak or AVG).
Units – Derives the overall vibration measurement type and units. For example, if an accelerometer sensor is used, and Units is set to ips, then the captured acceleration spectrum is integrated to a velocity spectrum whose overall vibration in the specified frequency band is measured accordingly.
Peak Find – Click on this cell to enable/disable the ‘peak-find’ functionality. When enabled, the Microlog GX will use the peak vibration level in the band instead of the overall vibration level.
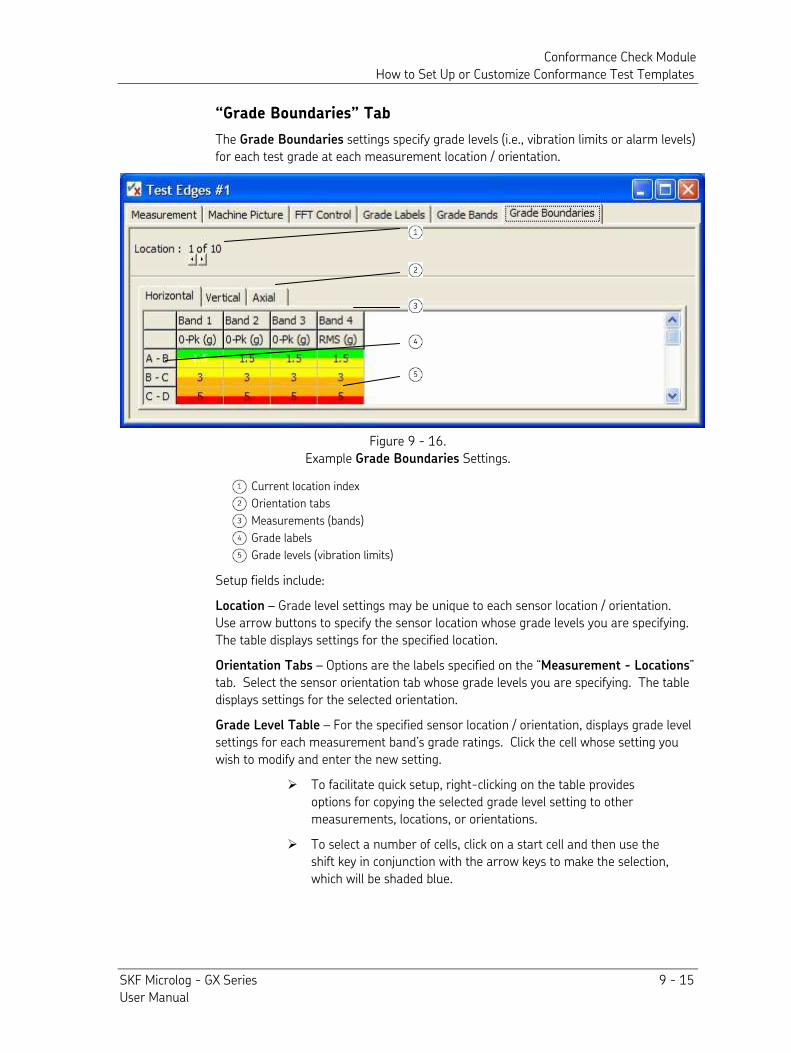
Conformance Check Module How to Set Up or Customize Conformance Test Templates
SKF Microlog - GX Series 9 - 15 User Manual
“Grade Boundaries” Tab
The Grade Boundaries settings specify grade levels (i.e., vibration limits or alarm levels) for each test grade at each measurement location / orientation.
Figure 9 - 16. Example Grade Boundaries Settings.
Current location index
Orientation tabs
Measurements (bands)
Grade labels
Grade levels (vibration limits)
Setup fields include:
Location – Grade level settings may be unique to each sensor location / orientation. Use arrow buttons to specify the sensor location whose grade levels you are specifying. The table displays settings for the specified location.
Orientation Tabs – Options are the labels specified on the “Measurement - Locations” tab. Select the sensor orientation tab whose grade levels you are specifying. The table displays settings for the selected orientation.
Grade Level Table – For the specified sensor location / orientation, displays grade level settings for each measurement band’s grade ratings. Click the cell whose setting you wish to modify and enter the new setting.
To facilitate quick setup, right-clicking on the table provides options for copying the selected grade level setting to other measurements, locations, or orientations.
To select a number of cells, click on a start cell and then use the shift key in conjunction with the arrow keys to make the selection, which will be shaded blue.
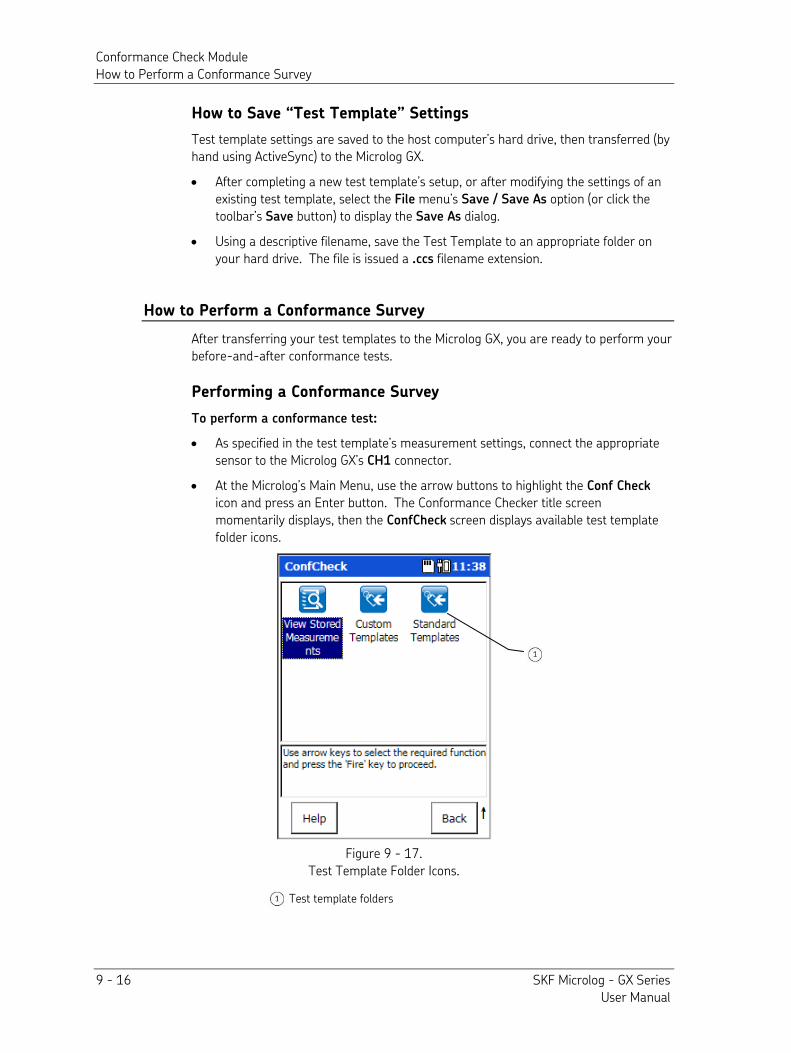
Conformance Check Module How to Perform a Conformance Survey
9 - 16 SKF Microlog - GX Series User Manual
How to Save “Test Template” Settings
Test template settings are saved to the host computer’s hard drive, then transferred (by hand using ActiveSync) to the Microlog GX.
• After completing a new test template’s setup, or after modifying the settings of an existing test template, select the File menu’s Save / Save As option (or click the toolbar’s Save button) to display the Save As dialog.
• Using a descriptive filename, save the Test Template to an appropriate folder on your hard drive. The file is issued a .ccs filename extension.
How to Perform a Conformance Survey
After transferring your test templates to the Microlog GX, you are ready to perform your before-and-after conformance tests.
Performing a Conformance Survey
To perform a conformance test:
• As specified in the test template’s measurement settings, connect the appropriate sensor to the Microlog GX’s CH1 connector.
• At the Microlog’s Main Menu, use the arrow buttons to highlight the Conf Check icon and press an Enter button. The Conformance Checker title screen momentarily displays, then the ConfCheck screen displays available test template folder icons.
Figure 9 - 17. Test Template Folder Icons.
Test template folders

Conformance Check Module How to Perform a Conformance Survey
SKF Microlog - GX Series 9 - 17 User Manual
• Use arrow and Enter buttons to select the test template folder containing the test template you wish to use. The Confcheck-Open screen displays the folder’s test templates.
Figure 9 - 18. Test Templates in the Custom Setups Folder.
• Use arrow buttons to highlight the appropriate test template, then press the Open function button to open the template. If the test template requires an operator ID to be entered, the Operator ID screen will be shown. At this point, the user must either select one of the operator IDs in the list or create a new one using the New button.
• Once an appropriate test template has been selected, the Measurement Results screen displays the template’s measurements and you are ready to begin your conformance testing.
The example below tests displacement, velocity, and acceleration overall vibration measurements (bands) at horizontal and vertical axial orientations, at two measurement locations, and includes a manual measurement (where data is entered manually from the Microlog’s alpha/numeric keypad).
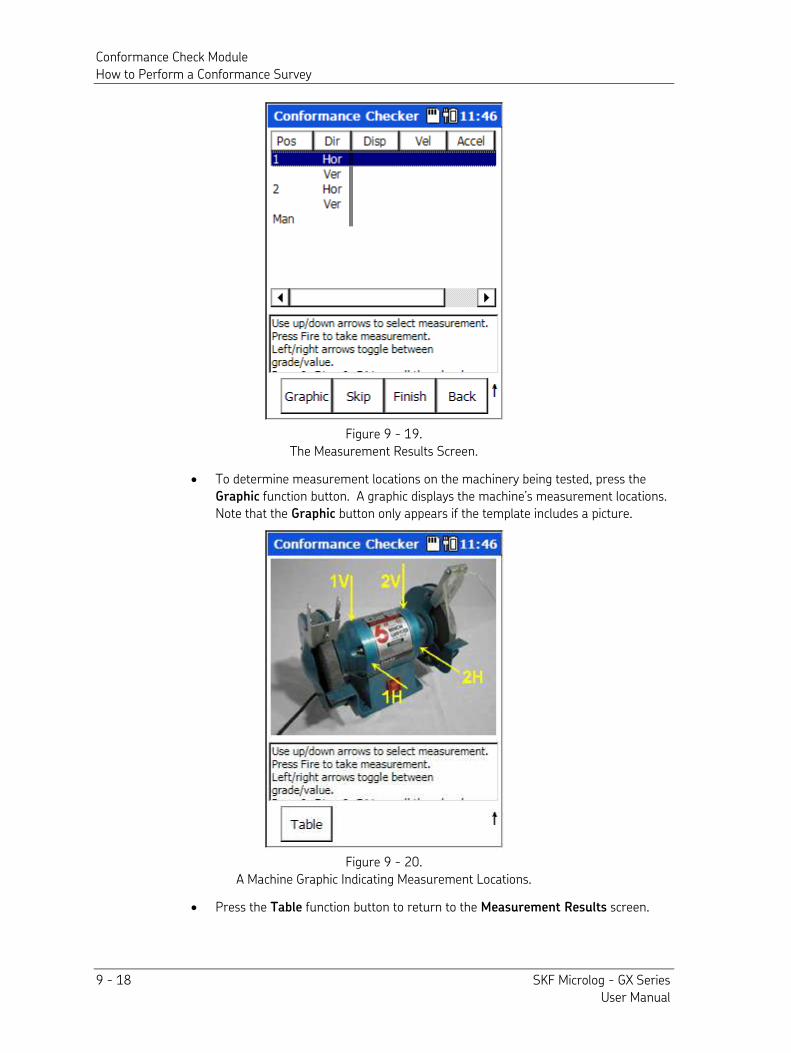
Conformance Check Module How to Perform a Conformance Survey
9 - 18 SKF Microlog - GX Series User Manual
Figure 9 - 19. The Measurement Results Screen.
• To determine measurement locations on the machinery being tested, press the Graphic function button. A graphic displays the machine’s measurement locations. Note that the Graphic button only appears if the template includes a picture.
Figure 9 - 20. A Machine Graphic Indicating Measurement Locations.
• Press the Table function button to return to the Measurement Results screen.
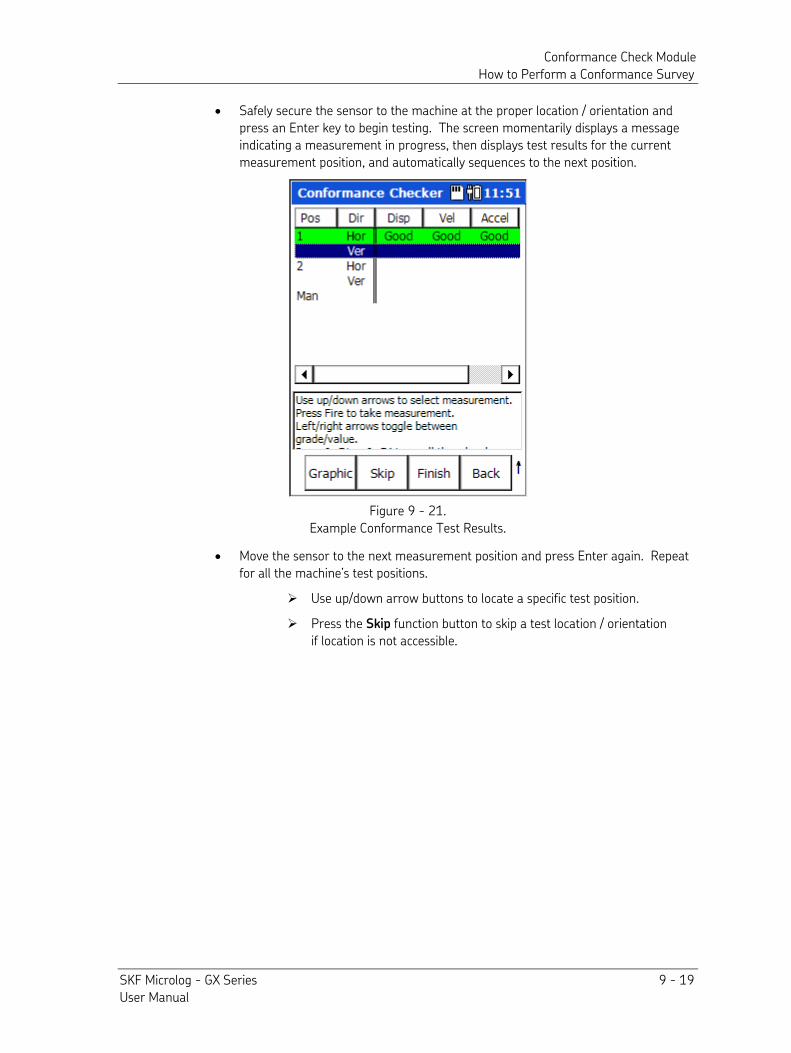
Conformance Check Module How to Perform a Conformance Survey
SKF Microlog - GX Series 9 - 19 User Manual
• Safely secure the sensor to the machine at the proper location / orientation and press an Enter key to begin testing. The screen momentarily displays a message indicating a measurement in progress, then displays test results for the current measurement position, and automatically sequences to the next position.
Figure 9 - 21. Example Conformance Test Results.
• Move the sensor to the next measurement position and press Enter again. Repeat for all the machine’s test positions.
Use up/down arrow buttons to locate a specific test position.
Press the Skip function button to skip a test location / orientation if location is not accessible.
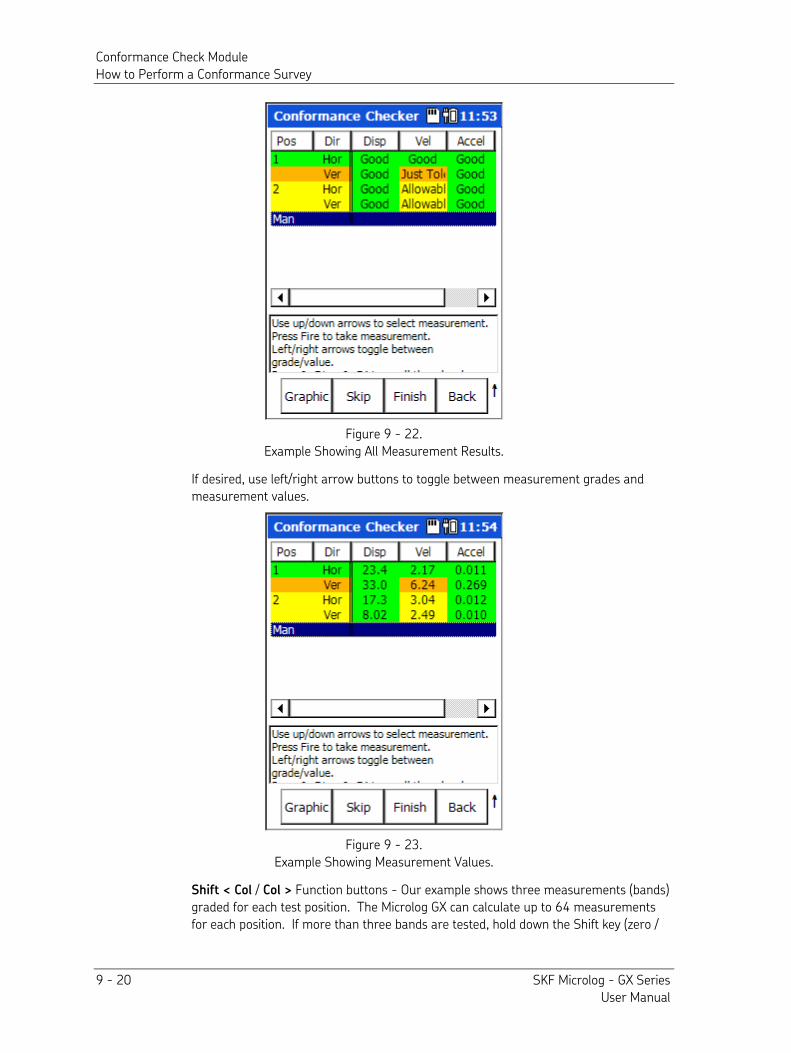
Conformance Check Module How to Perform a Conformance Survey
9 - 20 SKF Microlog - GX Series User Manual
Figure 9 - 22. Example Showing All Measurement Results.
If desired, use left/right arrow buttons to toggle between measurement grades and measurement values.
Figure 9 - 23. Example Showing Measurement Values.
Shift < Col / Col > Function buttons - Our example shows three measurements (bands) graded for each test position. The Microlog GX can calculate up to 64 measurements for each position. If more than three bands are tested, hold down the Shift key (zero /
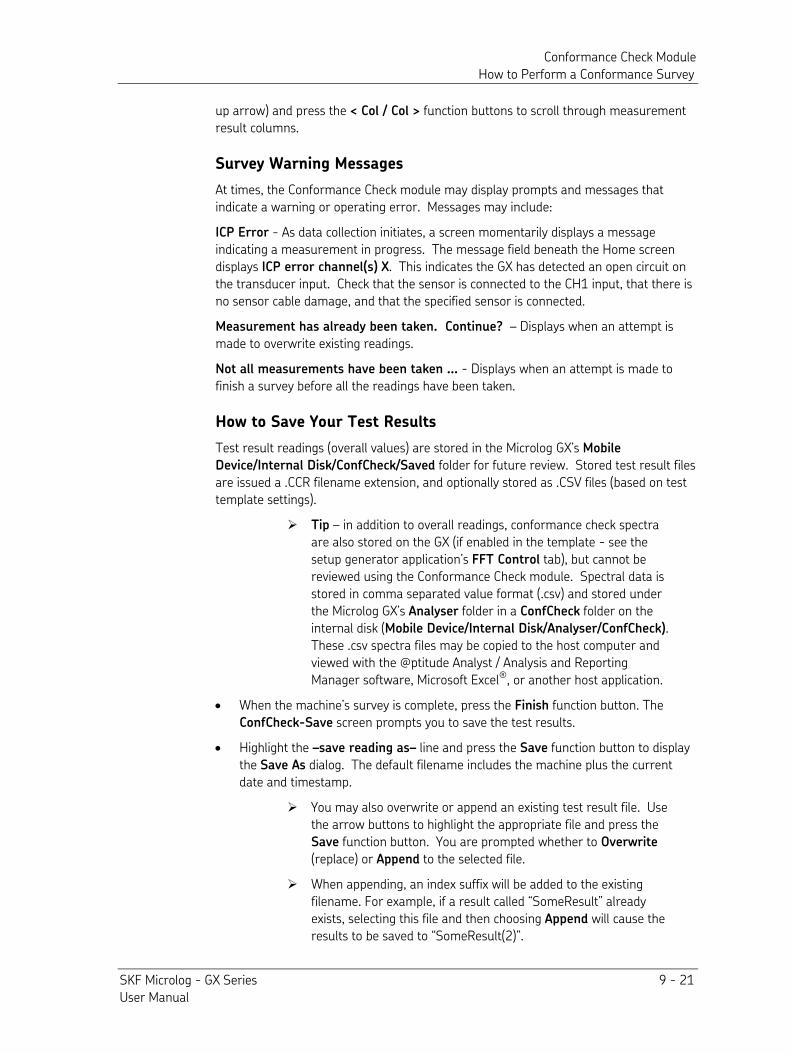
Conformance Check Module How to Perform a Conformance Survey
SKF Microlog - GX Series 9 - 21 User Manual
up arrow) and press the < Col / Col > function buttons to scroll through measurement result columns.
Survey Warning Messages
At times, the Conformance Check module may display prompts and messages that indicate a warning or operating error. Messages may include:
ICP Error - As data collection initiates, a screen momentarily displays a message indicating a measurement in progress. The message field beneath the Home screen displays ICP error channel(s) X. This indicates the GX has detected an open circuit on the transducer input. Check that the sensor is connected to the CH1 input, that there is no sensor cable damage, and that the specified sensor is connected.
Measurement has already been taken. Continue? – Displays when an attempt is made to overwrite existing readings.
Not all measurements have been taken … - Displays when an attempt is made to finish a survey before all the readings have been taken.
How to Save Your Test Results
Test result readings (overall values) are stored in the Microlog GX’s Mobile
Device/Internal Disk/ConfCheck/Saved folder for future review. Stored test result files are issued a .CCR filename extension, and optionally stored as .CSV files (based on test template settings).
Tip – in addition to overall readings, conformance check spectra are also stored on the GX (if enabled in the template - see the setup generator application’s FFT Control tab), but cannot be reviewed using the Conformance Check module. Spectral data is stored in comma separated value format (.csv) and stored under the Microlog GX’s Analyser folder in a ConfCheck folder on the internal disk (Mobile Device/Internal Disk/Analyser/ConfCheck). These .csv spectra files may be copied to the host computer and viewed with the @ptitude Analyst / Analysis and Reporting Manager software, Microsoft Excel®, or another host application.
• When the machine’s survey is complete, press the Finish function button. The ConfCheck-Save screen prompts you to save the test results.
• Highlight the –save reading as– line and press the Save function button to display the Save As dialog. The default filename includes the machine plus the current date and timestamp.
You may also overwrite or append an existing test result file. Use the arrow buttons to highlight the appropriate file and press the Save function button. You are prompted whether to Overwrite (replace) or Append to the selected file.
When appending, an index suffix will be added to the existing filename. For example, if a result called “SomeResult” already exists, selecting this file and then choosing Append will cause the results to be saved to “SomeResult(2)”.
Conformance Check Module Saving Conformance Check Data
9 - 22 SKF Microlog - GX Series User Manual
• Press the OK function button to accept the date timestamp as the filename, or use the Microlog GX’s alphanumeric keypad to enter a descriptive filename, then press OK. Test results are stored and you are returned to the Test Template folder selection screen.
Tip – with the date timestamp displayed, press the right/left arrow button to move the cursor to the end/beginning of the timestamp and type the tested machine’s ID. This naming convention identifies both the machine and the date timestamp of the test.
Saving Conformance Check Data
Saving, Reviewing, and Deleting Measurements
Procedures for saving measurement setups, for saving measurement results, for viewing stored measurements, and for deleting stored measurements are similar between modules. Reference Chapter 4, The Analyzer Module section on How to
Save, View, and Delete Analyzer Measurement Results for detailed information on these procedures.
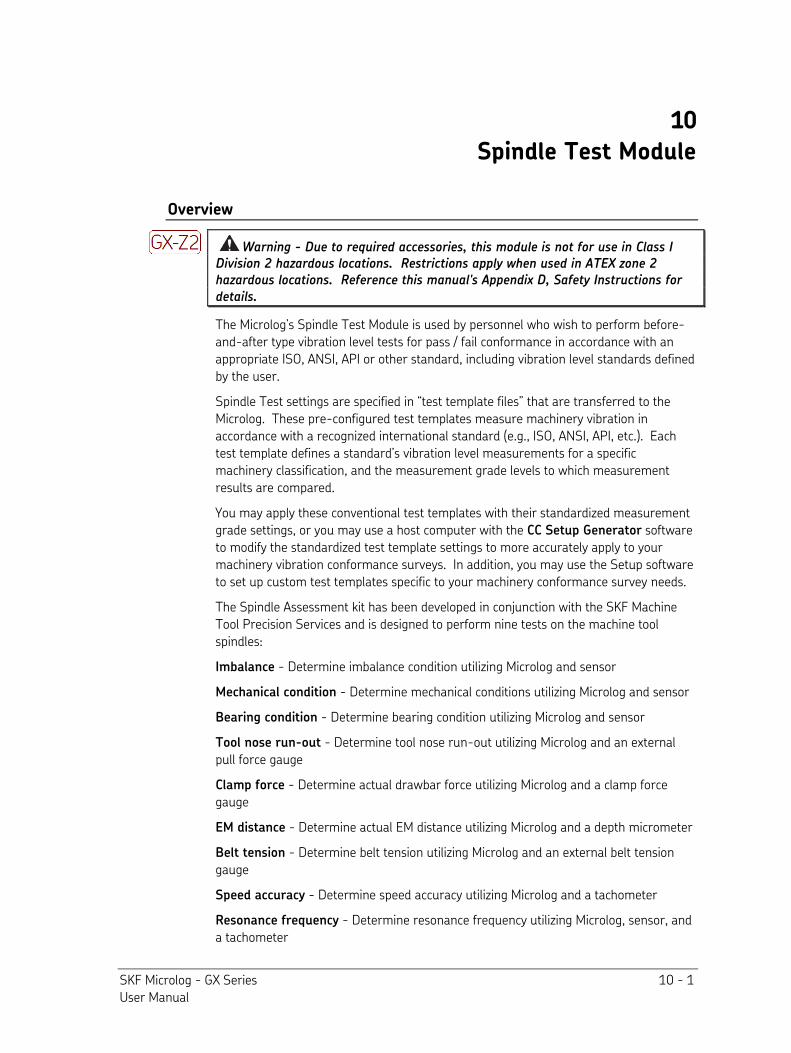
SKF Microlog - GX Series 10 - 1 User Manual
10
Spindle Test Module
Overview
Warning - Due to required accessories, this module is not for use in Class I Division 2 hazardous locations. Restrictions apply when used in ATEX zone 2 hazardous locations. Reference this manual's Appendix D, Safety Instructions for details.
The Microlog’s Spindle Test Module is used by personnel who wish to perform before-and-after type vibration level tests for pass / fail conformance in accordance with an appropriate ISO, ANSI, API or other standard, including vibration level standards defined by the user.
Spindle Test settings are specified in “test template files” that are transferred to the Microlog. These pre-configured test templates measure machinery vibration in accordance with a recognized international standard (e.g., ISO, ANSI, API, etc.). Each test template defines a standard’s vibration level measurements for a specific machinery classification, and the measurement grade levels to which measurement results are compared.
You may apply these conventional test templates with their standardized measurement grade settings, or you may use a host computer with the CC Setup Generator software to modify the standardized test template settings to more accurately apply to your machinery vibration conformance surveys. In addition, you may use the Setup software to set up custom test templates specific to your machinery conformance survey needs.
The Spindle Assessment kit has been developed in conjunction with the SKF Machine Tool Precision Services and is designed to perform nine tests on the machine tool spindles:
Imbalance - Determine imbalance condition utilizing Microlog and sensor
Mechanical condition - Determine mechanical conditions utilizing Microlog and sensor
Bearing condition - Determine bearing condition utilizing Microlog and sensor
Tool nose run-out - Determine tool nose run-out utilizing Microlog and an external pull force gauge
Clamp force - Determine actual drawbar force utilizing Microlog and a clamp force gauge
EM distance - Determine actual EM distance utilizing Microlog and a depth micrometer
Belt tension - Determine belt tension utilizing Microlog and an external belt tension gauge
Speed accuracy - Determine speed accuracy utilizing Microlog and a tachometer
Resonance frequency - Determine resonance frequency utilizing Microlog, sensor, and a tachometer
Spindle Test Module How to Transfer Test Templates to the Microlog
10 - 2 SKF Microlog - GX Series User Manual
And also, if imbalanced:
Balancing - Correct inadequate shaft imbalance utilizing Microlog, two acceleration sensors, and a tachometer
SKF Spindle Assessment Kit – required tools
The Spindle Assessment Kit application includes:
• Microlog spindle test module
• Balancing Module
• Run-Up/Coast Down Module
You may also need the following optional gauges and tools:
• Pull force gauges (clamp force)
• Depth micrometer (EM distance)
Results Import Tool software is supplied to allow you to copy results files from the unit into a pre-configured Excel spreadsheet.
How to Transfer Test Templates to the Microlog
Test template files have a descriptive filename and a .ccs filename extension. These test template files must be transferred from your host computer to the Microlog for spindle testing use.
Files may be copied from the host computer to the Microlog’s Internal Disk drive using the Spindle Test Installer (Start – Programs – SKF – Microlog – Machine Tools – Spindle Test Installer). This will install both the Spindle Test Module and any Template files onto the unit. It should be noted that the unit should come with these files pre-installed and that re-installing them may take several minutes.
How to Perform a Survey
After transferring your test templates to the Microlog, you are ready to perform your before-and-after conformance tests.
Charge the Microlog’s battery for three to five hours prior to use.
Performing a Survey
To perform a conformance test:
• As specified in the test template’s measurement settings, connect the appropriate sensor to the Microlog’s CH1 connector.
• Press the red power button to turn the Microlog on. The SKF title screen initially displays, showing your unit’s installed modules and firmware version number. After a few seconds, the Microlog automatically displays its Home screen showing the available operating modes.
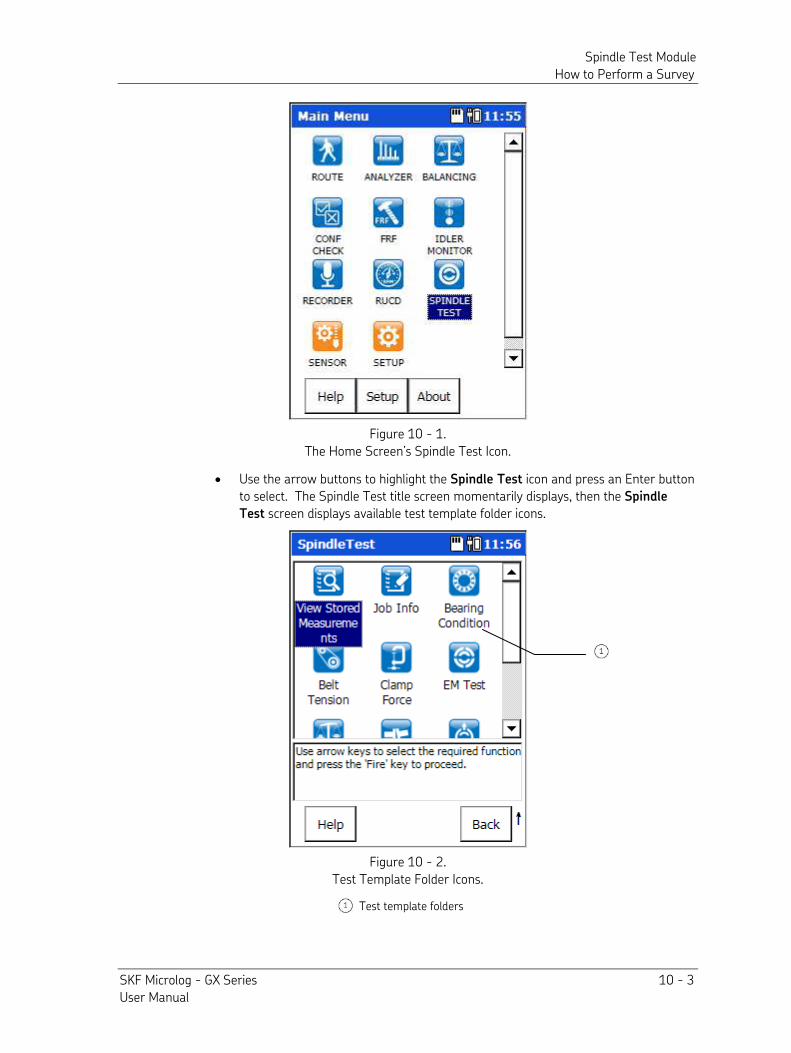
Spindle Test Module How to Perform a Survey
SKF Microlog - GX Series 10 - 3 User Manual
Figure 10 - 1. The Home Screen’s Spindle Test Icon.
• Use the arrow buttons to highlight the Spindle Test icon and press an Enter button to select. The Spindle Test title screen momentarily displays, then the Spindle
Test screen displays available test template folder icons.
Figure 10 - 2. Test Template Folder Icons.
Test template folders
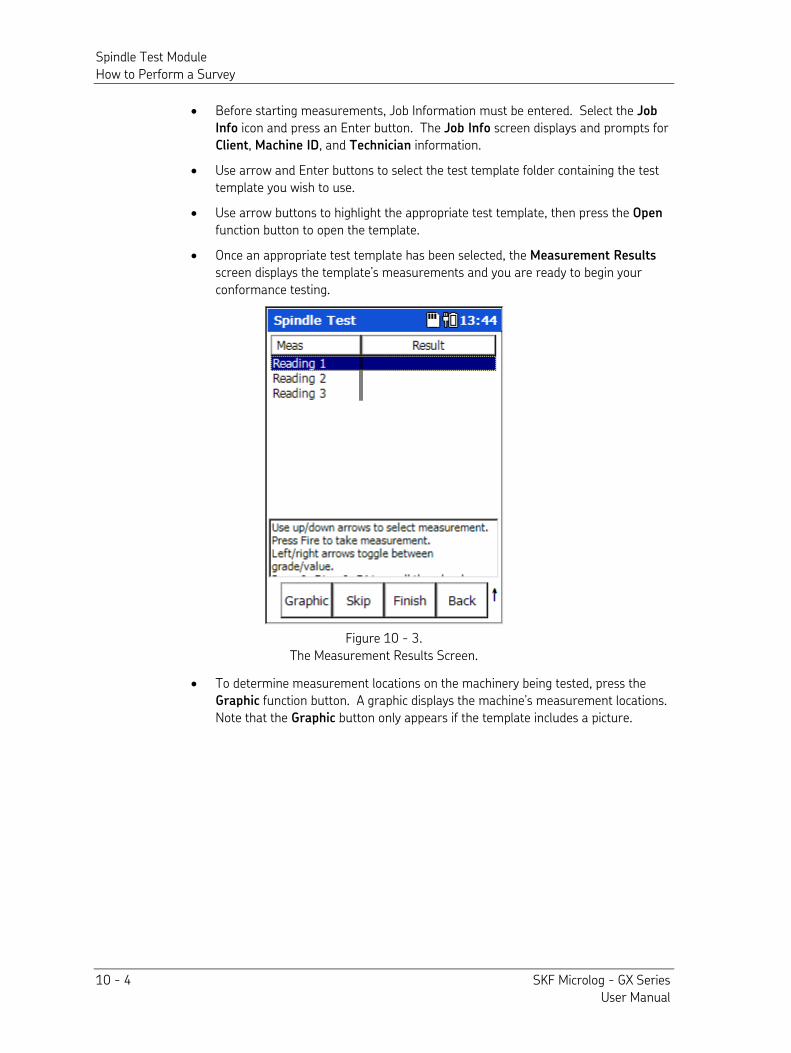
Spindle Test Module How to Perform a Survey
10 - 4 SKF Microlog - GX Series User Manual
• Before starting measurements, Job Information must be entered. Select the Job
Info icon and press an Enter button. The Job Info screen displays and prompts for Client, Machine ID, and Technician information.
• Use arrow and Enter buttons to select the test template folder containing the test template you wish to use.
• Use arrow buttons to highlight the appropriate test template, then press the Open function button to open the template.
• Once an appropriate test template has been selected, the Measurement Results screen displays the template’s measurements and you are ready to begin your conformance testing.
Figure 10 - 3. The Measurement Results Screen.
• To determine measurement locations on the machinery being tested, press the Graphic function button. A graphic displays the machine’s measurement locations. Note that the Graphic button only appears if the template includes a picture.
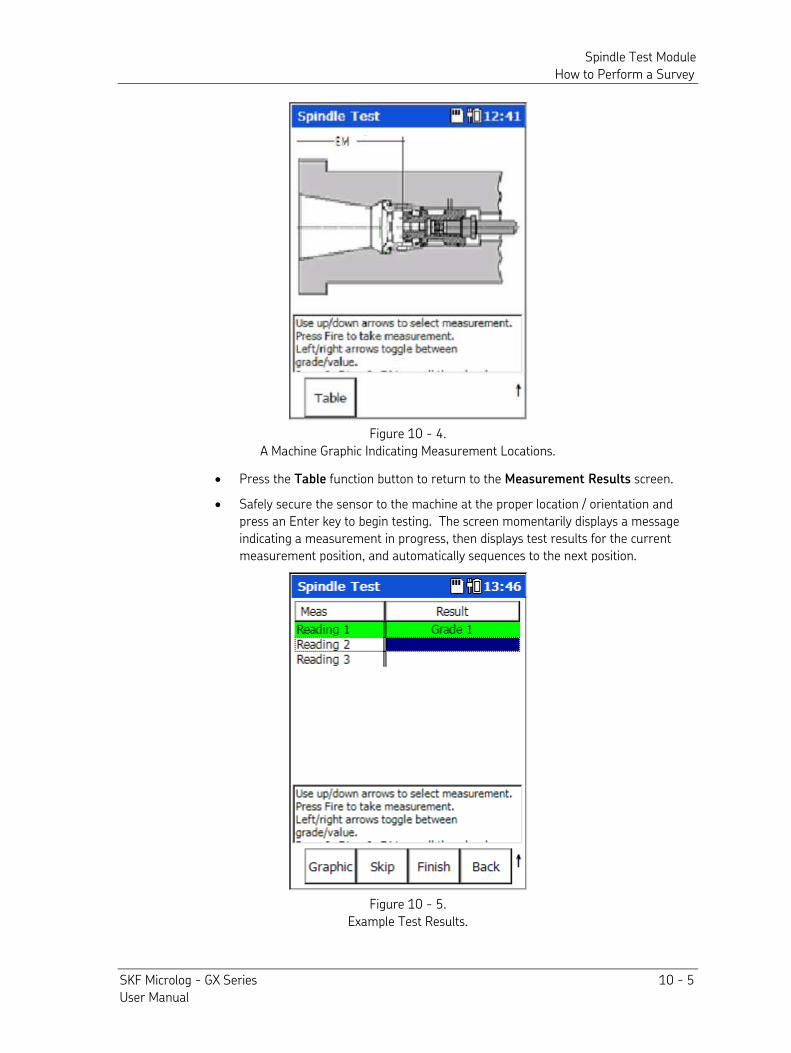
Spindle Test Module How to Perform a Survey
SKF Microlog - GX Series 10 - 5 User Manual
Figure 10 - 4. A Machine Graphic Indicating Measurement Locations.
• Press the Table function button to return to the Measurement Results screen.
• Safely secure the sensor to the machine at the proper location / orientation and press an Enter key to begin testing. The screen momentarily displays a message indicating a measurement in progress, then displays test results for the current measurement position, and automatically sequences to the next position.
Figure 10 - 5. Example Test Results.
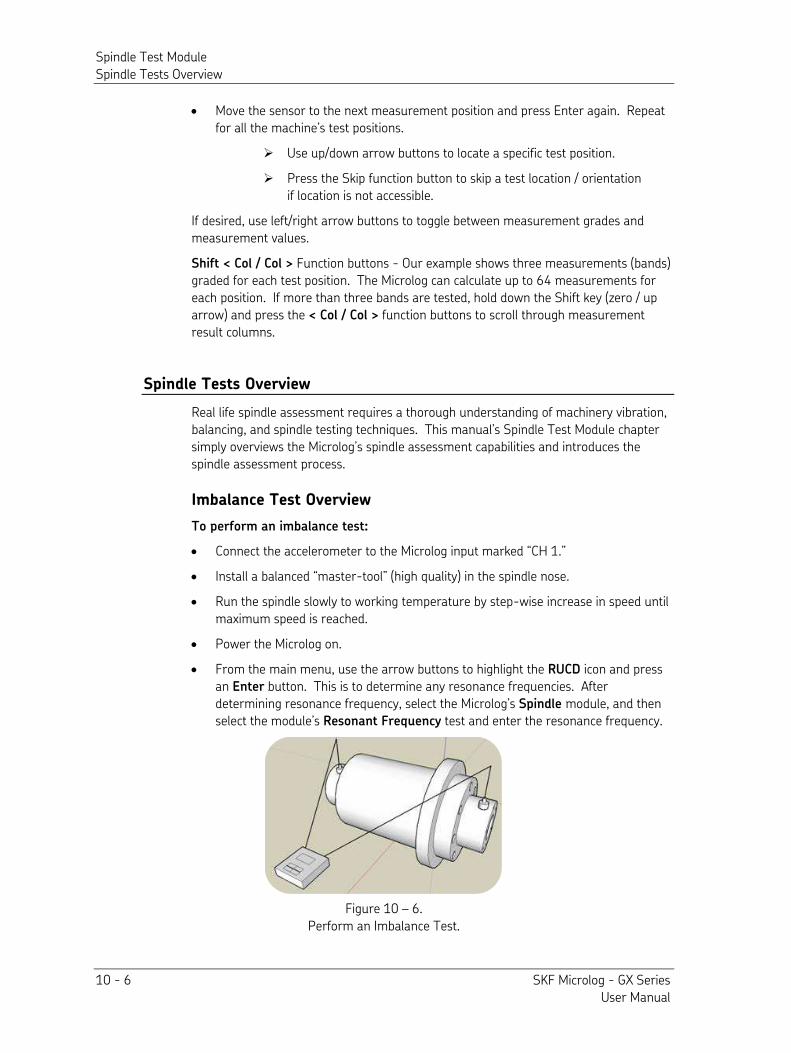
Spindle Test Module Spindle Tests Overview
10 - 6 SKF Microlog - GX Series User Manual
• Move the sensor to the next measurement position and press Enter again. Repeat for all the machine’s test positions.
Use up/down arrow buttons to locate a specific test position.
Press the Skip function button to skip a test location / orientation if location is not accessible.
If desired, use left/right arrow buttons to toggle between measurement grades and measurement values.
Shift < Col / Col > Function buttons - Our example shows three measurements (bands) graded for each test position. The Microlog can calculate up to 64 measurements for each position. If more than three bands are tested, hold down the Shift key (zero / up arrow) and press the < Col / Col > function buttons to scroll through measurement result columns.
Spindle Tests Overview
Real life spindle assessment requires a thorough understanding of machinery vibration, balancing, and spindle testing techniques. This manual’s Spindle Test Module chapter simply overviews the Microlog’s spindle assessment capabilities and introduces the spindle assessment process.
Imbalance Test Overview
To perform an imbalance test:
• Connect the accelerometer to the Microlog input marked “CH 1.” • Install a balanced “master-tool” (high quality) in the spindle nose.
• Run the spindle slowly to working temperature by step-wise increase in speed until maximum speed is reached.
• Power the Microlog on.
• From the main menu, use the arrow buttons to highlight the RUCD icon and press an Enter button. This is to determine any resonance frequencies. After determining resonance frequency, select the Microlog’s Spindle module, and then select the module’s Resonant Frequency test and enter the resonance frequency.
Figure 10 – 6. Perform an Imbalance Test.
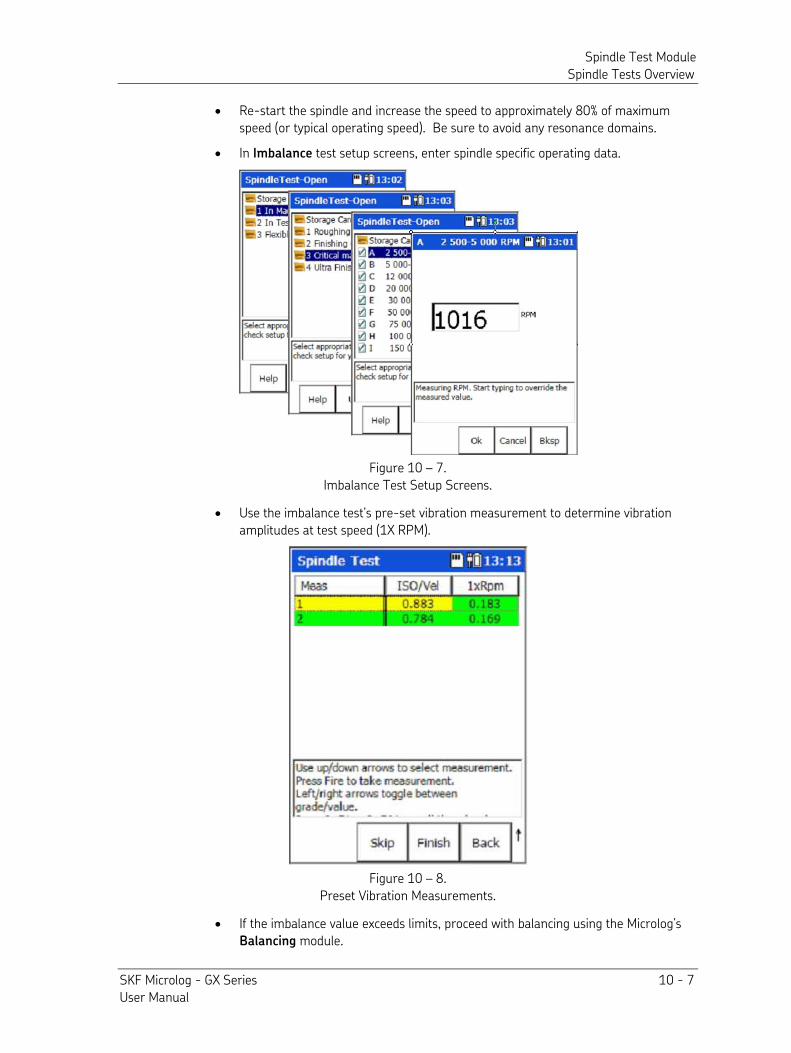
Spindle Test Module Spindle Tests Overview
SKF Microlog - GX Series 10 - 7 User Manual
• Re-start the spindle and increase the speed to approximately 80% of maximum speed (or typical operating speed). Be sure to avoid any resonance domains.
• In Imbalance test setup screens, enter spindle specific operating data.
Figure 10 – 7. Imbalance Test Setup Screens.
• Use the imbalance test’s pre-set vibration measurement to determine vibration amplitudes at test speed (1X RPM).
Figure 10 – 8. Preset Vibration Measurements.
• If the imbalance value exceeds limits, proceed with balancing using the Microlog’s Balancing module.
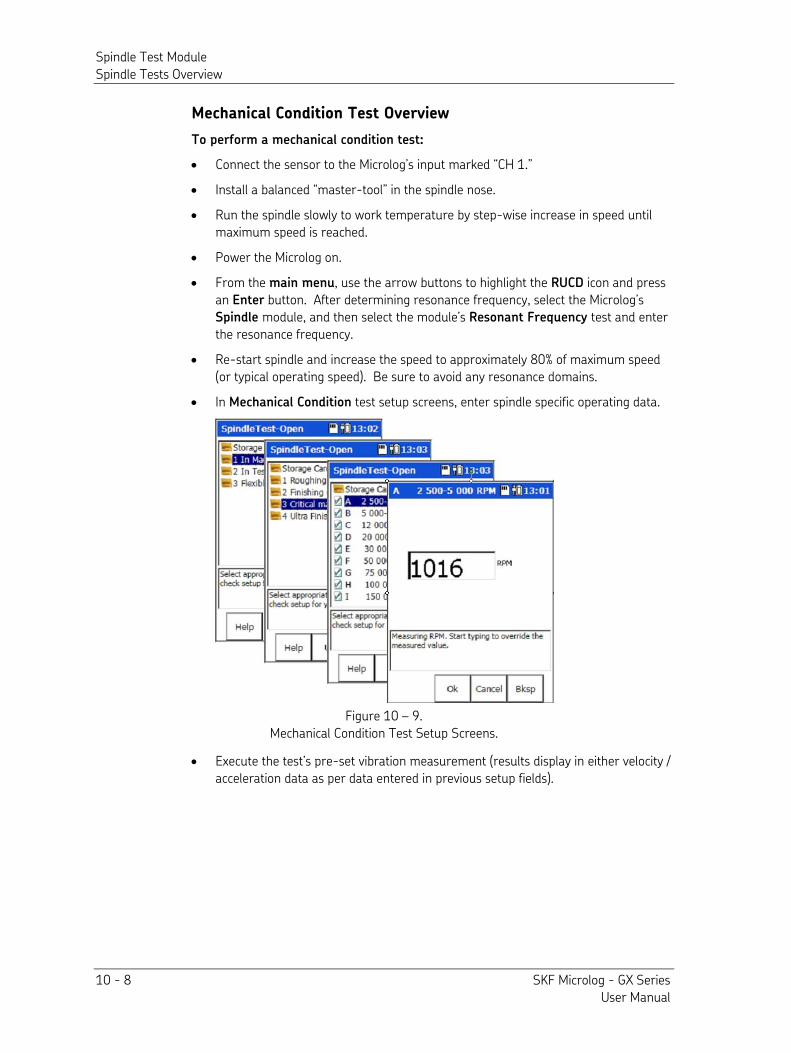
Spindle Test Module Spindle Tests Overview
10 - 8 SKF Microlog - GX Series User Manual
Mechanical Condition Test Overview
To perform a mechanical condition test:
• Connect the sensor to the Microlog’s input marked “CH 1.” • Install a balanced “master-tool” in the spindle nose.
• Run the spindle slowly to work temperature by step-wise increase in speed until maximum speed is reached.
• Power the Microlog on.
• From the main menu, use the arrow buttons to highlight the RUCD icon and press an Enter button. After determining resonance frequency, select the Microlog’s Spindle module, and then select the module’s Resonant Frequency test and enter the resonance frequency.
• Re-start spindle and increase the speed to approximately 80% of maximum speed (or typical operating speed). Be sure to avoid any resonance domains.
• In Mechanical Condition test setup screens, enter spindle specific operating data.
Figure 10 – 9. Mechanical Condition Test Setup Screens.
• Execute the test’s pre-set vibration measurement (results display in either velocity / acceleration data as per data entered in previous setup fields).
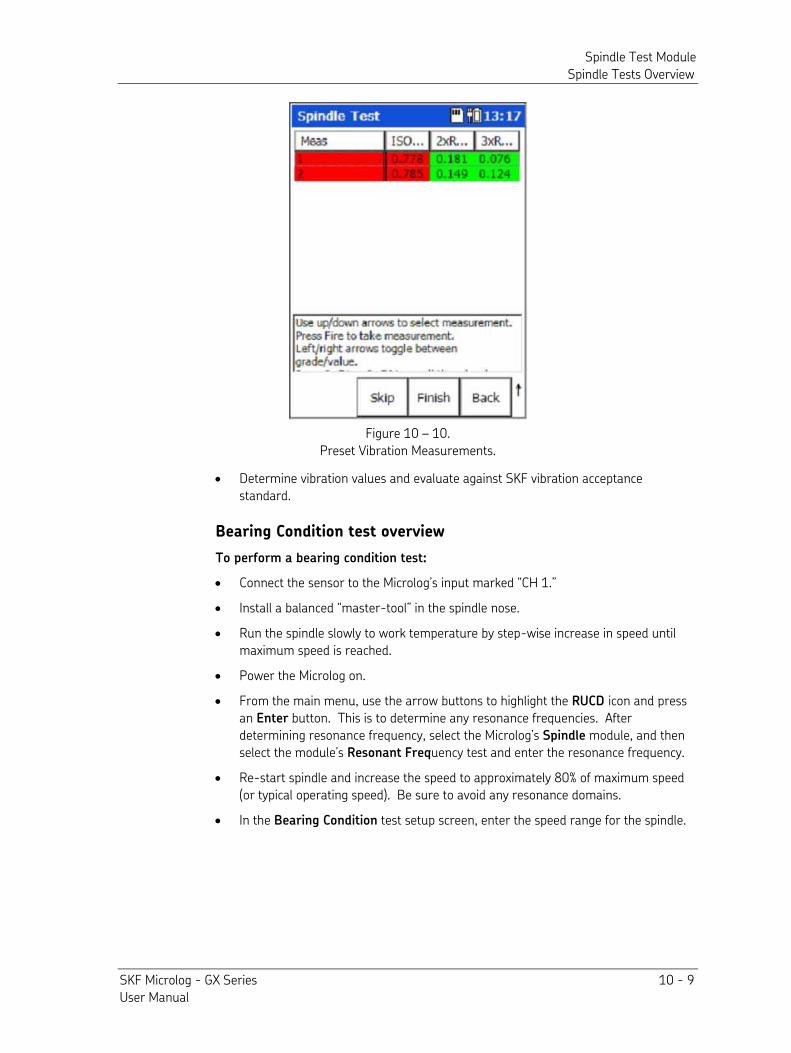
Spindle Test Module Spindle Tests Overview
SKF Microlog - GX Series 10 - 9 User Manual
Figure 10 – 10. Preset Vibration Measurements.
• Determine vibration values and evaluate against SKF vibration acceptance standard.
Bearing Condition test overview
To perform a bearing condition test:
• Connect the sensor to the Microlog’s input marked “CH 1.” • Install a balanced “master-tool” in the spindle nose.
• Run the spindle slowly to work temperature by step-wise increase in speed until maximum speed is reached.
• Power the Microlog on.
• From the main menu, use the arrow buttons to highlight the RUCD icon and press an Enter button. This is to determine any resonance frequencies. After determining resonance frequency, select the Microlog’s Spindle module, and then select the module’s Resonant Frequency test and enter the resonance frequency.
• Re-start spindle and increase the speed to approximately 80% of maximum speed (or typical operating speed). Be sure to avoid any resonance domains.
• In the Bearing Condition test setup screen, enter the speed range for the spindle.
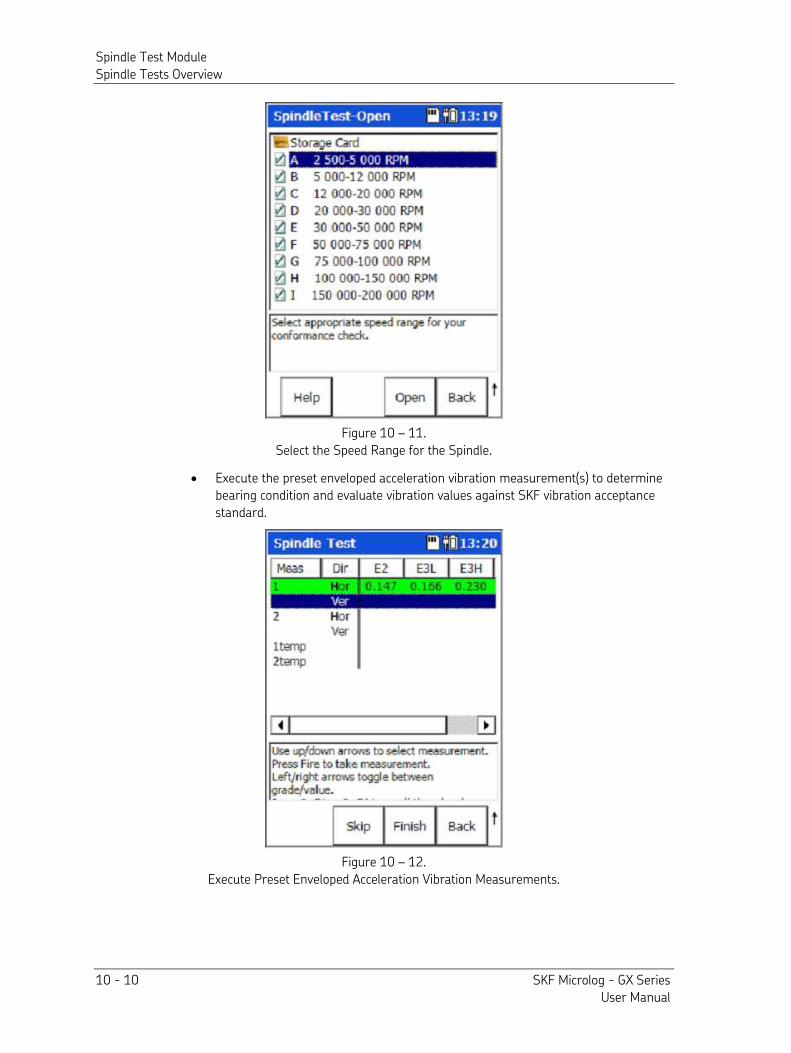
Spindle Test Module Spindle Tests Overview
10 - 10 SKF Microlog - GX Series User Manual
Figure 10 – 11. Select the Speed Range for the Spindle.
• Execute the preset enveloped acceleration vibration measurement(s) to determine bearing condition and evaluate vibration values against SKF vibration acceptance standard.
Figure 10 – 12. Execute Preset Enveloped Acceleration Vibration Measurements.
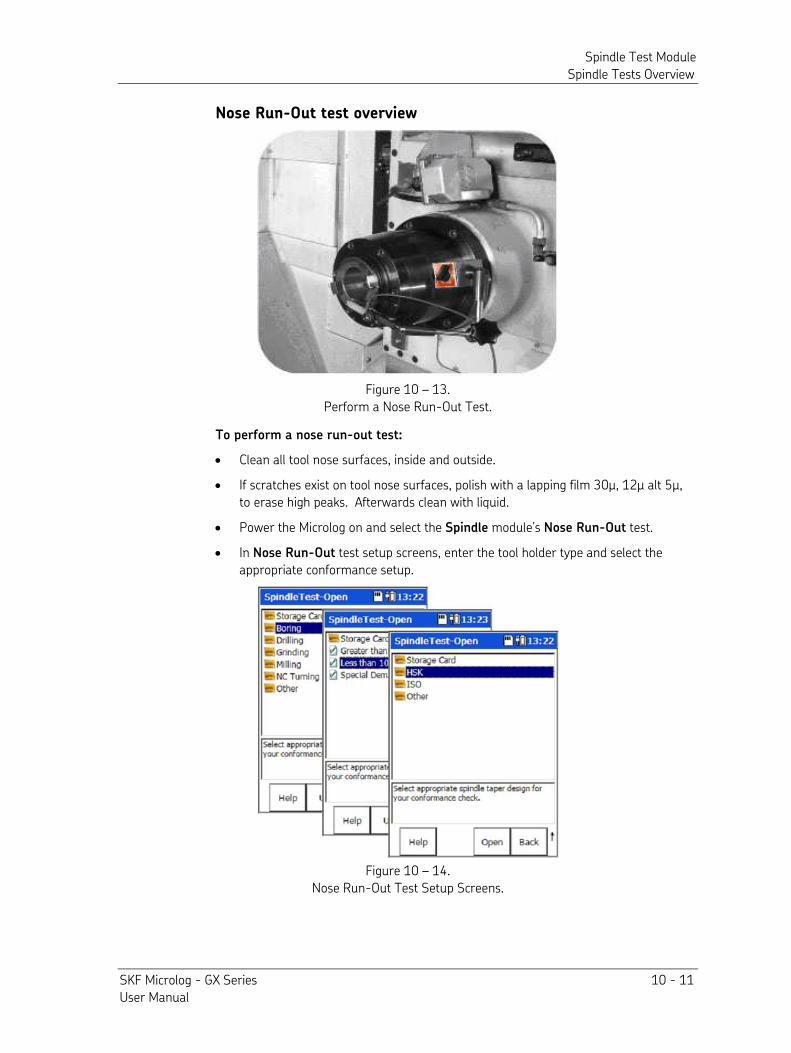
Spindle Test Module Spindle Tests Overview
SKF Microlog - GX Series 10 - 11 User Manual
Nose Run-Out test overview
Figure 10 – 13. Perform a Nose Run-Out Test.
To perform a nose run-out test:
• Clean all tool nose surfaces, inside and outside.
• If scratches exist on tool nose surfaces, polish with a lapping film 30µ, 12µ alt 5µ, to erase high peaks. Afterwards clean with liquid.
• Power the Microlog on and select the Spindle module’s Nose Run-Out test.
• In Nose Run-Out test setup screens, enter the tool holder type and select the appropriate conformance setup.
Figure 10 – 14. Nose Run-Out Test Setup Screens.
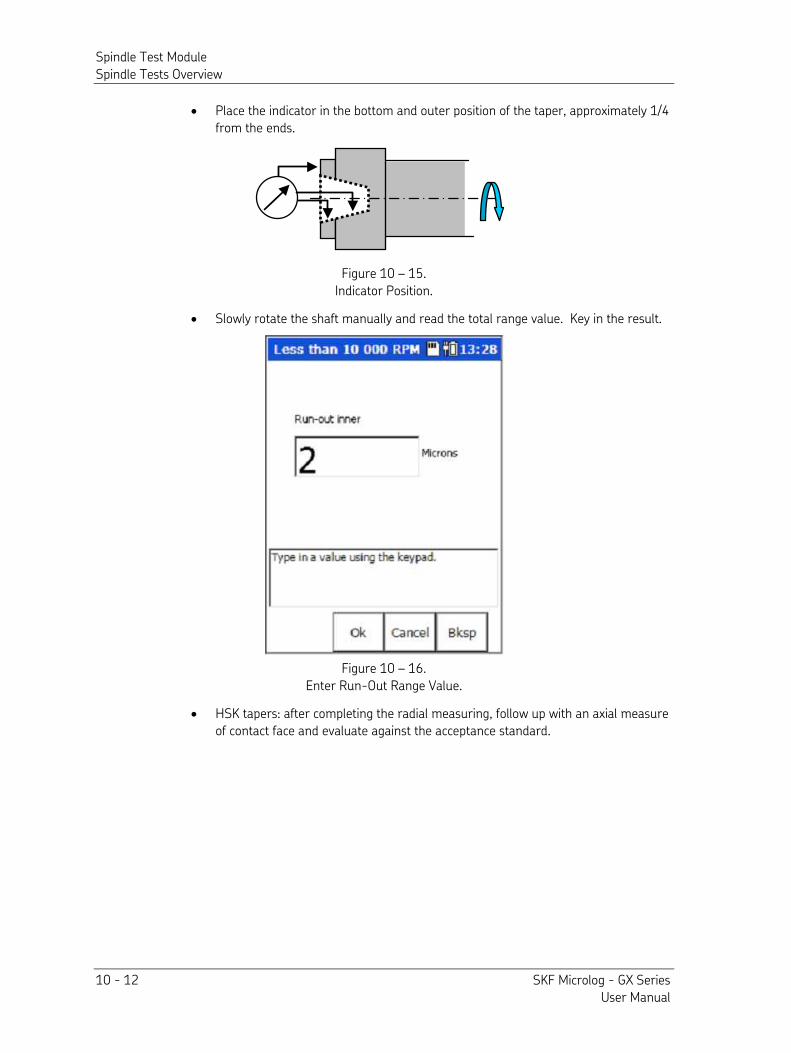
Spindle Test Module Spindle Tests Overview
10 - 12 SKF Microlog - GX Series User Manual
• Place the indicator in the bottom and outer position of the taper, approximately 1/4 from the ends.
Figure 10 – 15.
Indicator Position.
• Slowly rotate the shaft manually and read the total range value. Key in the result.
Figure 10 – 16. Enter Run-Out Range Value.
• HSK tapers: after completing the radial measuring, follow up with an axial measure of contact face and evaluate against the acceptance standard.
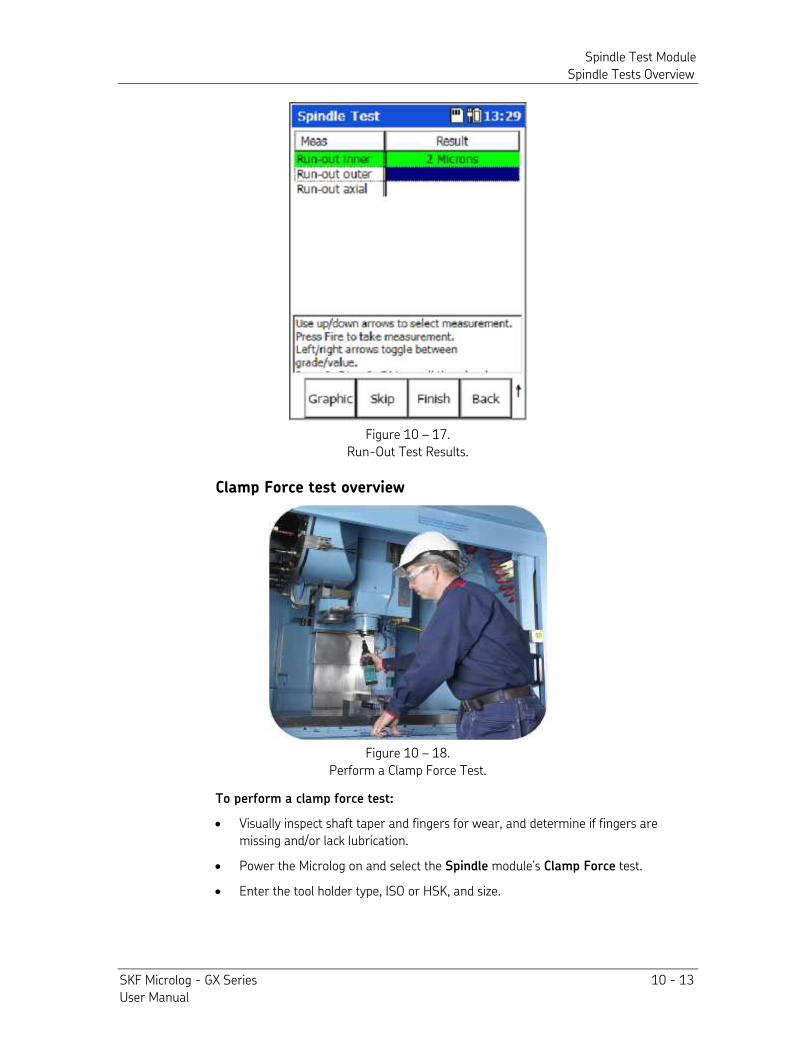
Spindle Test Module Spindle Tests Overview
SKF Microlog - GX Series 10 - 13 User Manual
Figure 10 – 17. Run-Out Test Results.
Clamp Force test overview
Figure 10 – 18. Perform a Clamp Force Test.
To perform a clamp force test:
• Visually inspect shaft taper and fingers for wear, and determine if fingers are missing and/or lack lubrication.
• Power the Microlog on and select the Spindle module’s Clamp Force test.
• Enter the tool holder type, ISO or HSK, and size.
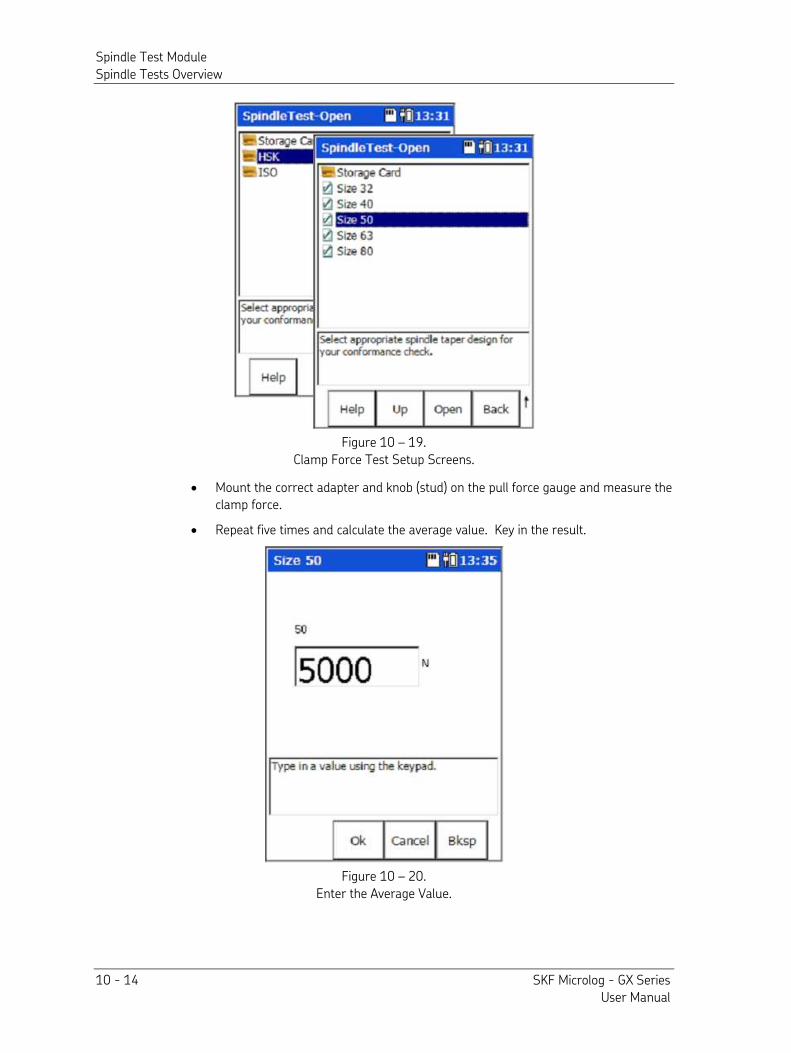
Spindle Test Module Spindle Tests Overview
10 - 14 SKF Microlog - GX Series User Manual
Figure 10 – 19. Clamp Force Test Setup Screens.
• Mount the correct adapter and knob (stud) on the pull force gauge and measure the clamp force.
• Repeat five times and calculate the average value. Key in the result.
Figure 10 – 20. Enter the Average Value.

Spindle Test Module Spindle Tests Overview
SKF Microlog - GX Series 10 - 15 User Manual
• Determine drawbar clamp force value and evaluate against pull force acceptance standard.
Figure 10 – 21. Clamp Force Test Results.
• If inadequate result, identify the root cause (e.g., finger defects, inadequate grease, broken or weak washer springs).
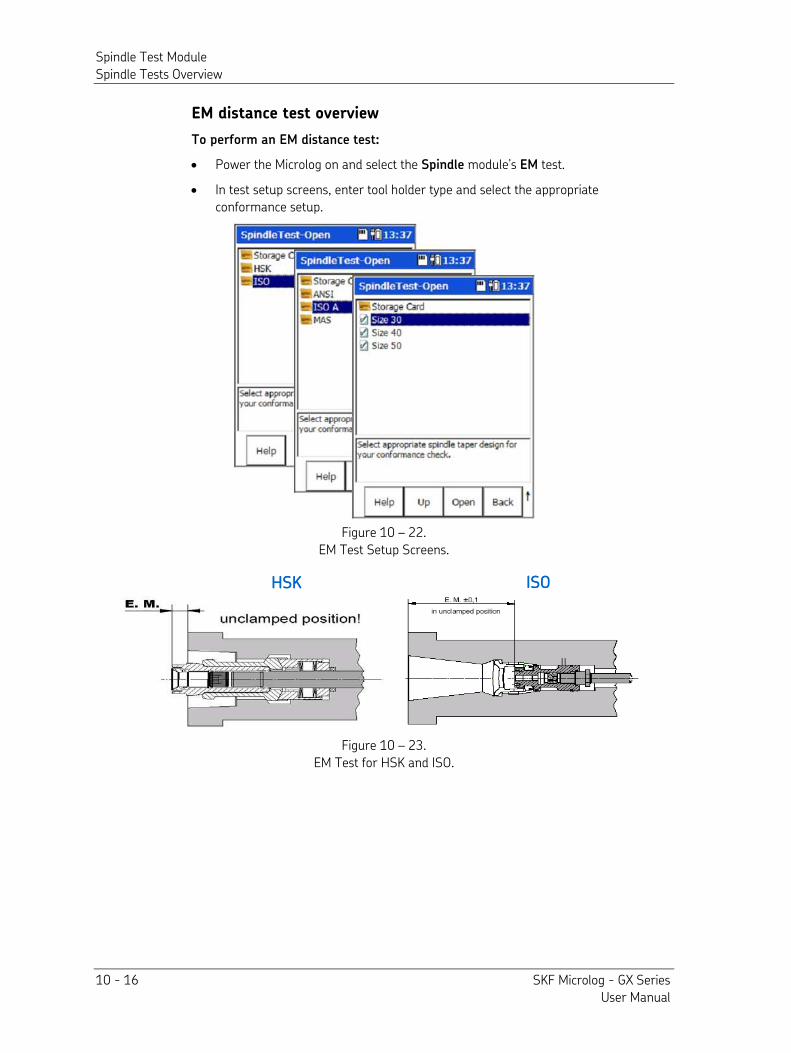
Spindle Test Module Spindle Tests Overview
10 - 16 SKF Microlog - GX Series User Manual
EM distance test overview
To perform an EM distance test:
• Power the Microlog on and select the Spindle module’s EM test.
• In test setup screens, enter tool holder type and select the appropriate conformance setup.
Figure 10 – 22. EM Test Setup Screens.
HSK ISOHSK ISO
Figure 10 – 23. EM Test for HSK and ISO.
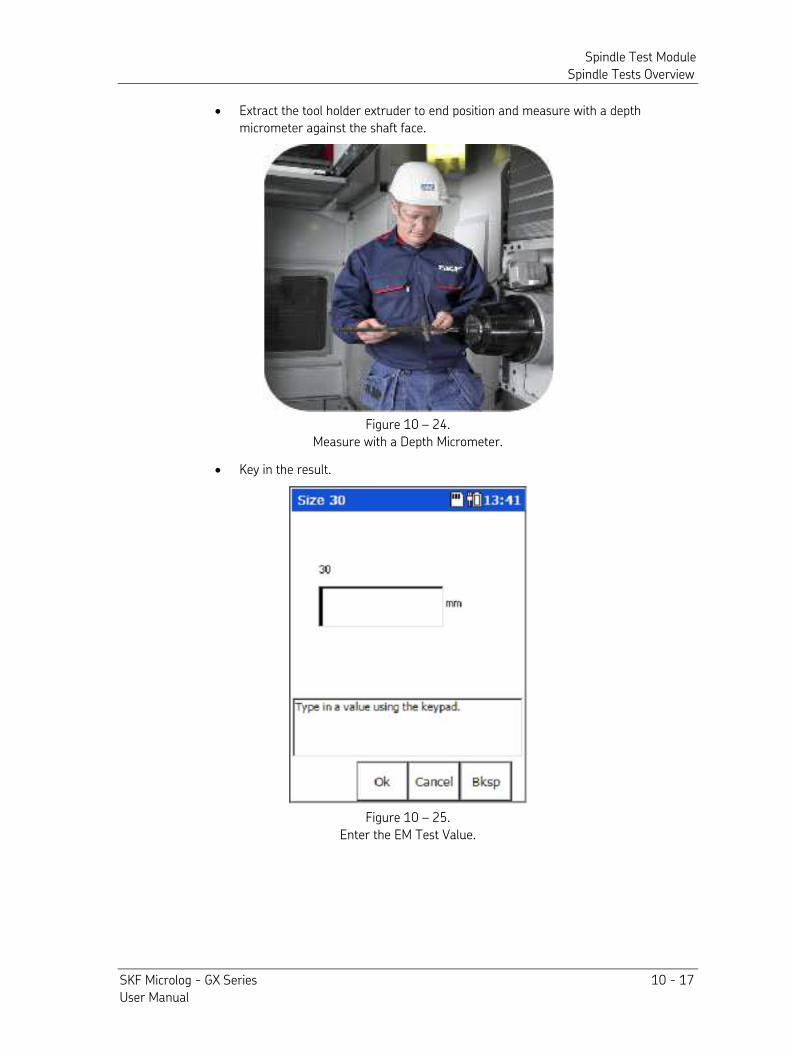
Spindle Test Module Spindle Tests Overview
SKF Microlog - GX Series 10 - 17 User Manual
• Extract the tool holder extruder to end position and measure with a depth micrometer against the shaft face.
Figure 10 – 24. Measure with a Depth Micrometer.
• Key in the result.
Figure 10 – 25. Enter the EM Test Value.
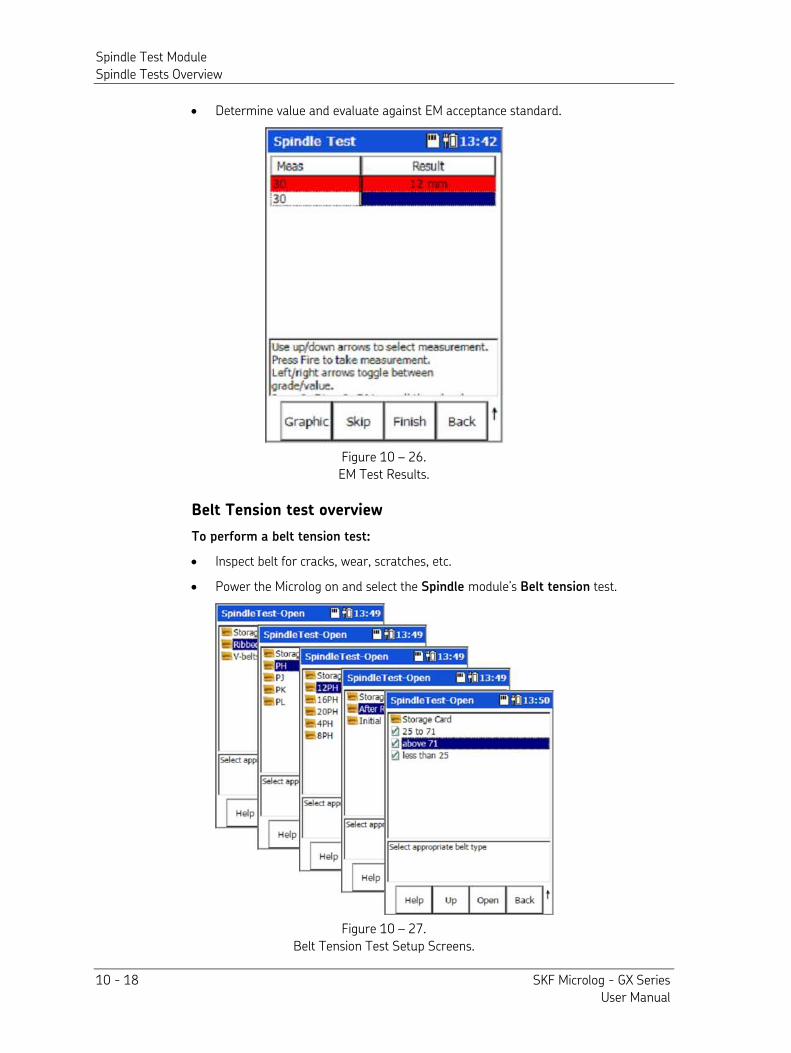
Spindle Test Module Spindle Tests Overview
10 - 18 SKF Microlog - GX Series User Manual
• Determine value and evaluate against EM acceptance standard.
Figure 10 – 26. EM Test Results.
Belt Tension test overview
To perform a belt tension test:
• Inspect belt for cracks, wear, scratches, etc.
• Power the Microlog on and select the Spindle module’s Belt tension test.
Figure 10 – 27. Belt Tension Test Setup Screens.
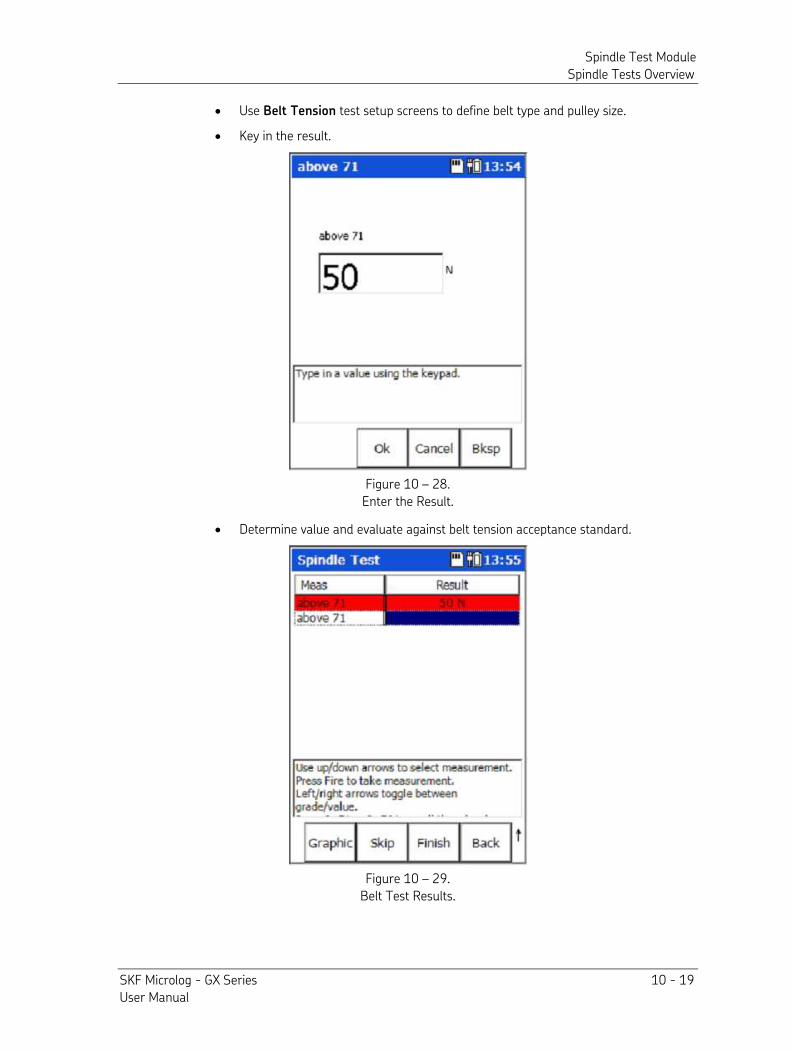
Spindle Test Module Spindle Tests Overview
SKF Microlog - GX Series 10 - 19 User Manual
• Use Belt Tension test setup screens to define belt type and pulley size.
• Key in the result.
Figure 10 – 28. Enter the Result.
• Determine value and evaluate against belt tension acceptance standard.
Figure 10 – 29. Belt Test Results.

Spindle Test Module Spindle Tests Overview
10 - 20 SKF Microlog - GX Series User Manual
Speed Accuracy test overview
To perform a speed accuracy test:
• Clean the shaft to facilitate best adhesion of reflective tachometer tape.
• Place the reflection tape on the shaft (preferably on the inside of the tool taper).
• Start up the spindle to programmed speed and monitor speed with tachometer.
Figure 10 – 30. Monitor the Speed with a Tachometer.
• Power the Microlog on and select the Spindle module’s Speed Accuracy test.
• Enter the tachometer speed value.
• Evaluate against speed acceptance standard.
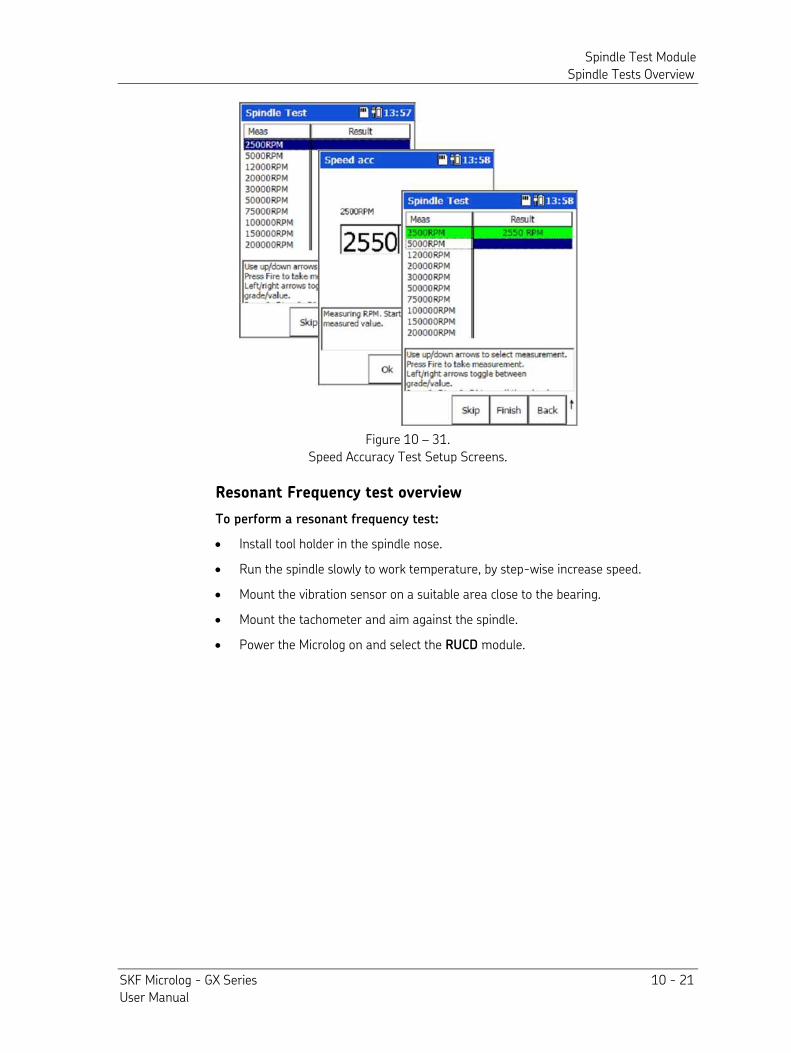
Spindle Test Module Spindle Tests Overview
SKF Microlog - GX Series 10 - 21 User Manual
Figure 10 – 31. Speed Accuracy Test Setup Screens.
Resonant Frequency test overview
To perform a resonant frequency test:
• Install tool holder in the spindle nose.
• Run the spindle slowly to work temperature, by step-wise increase speed.
• Mount the vibration sensor on a suitable area close to the bearing.
• Mount the tachometer and aim against the spindle.
• Power the Microlog on and select the RUCD module.
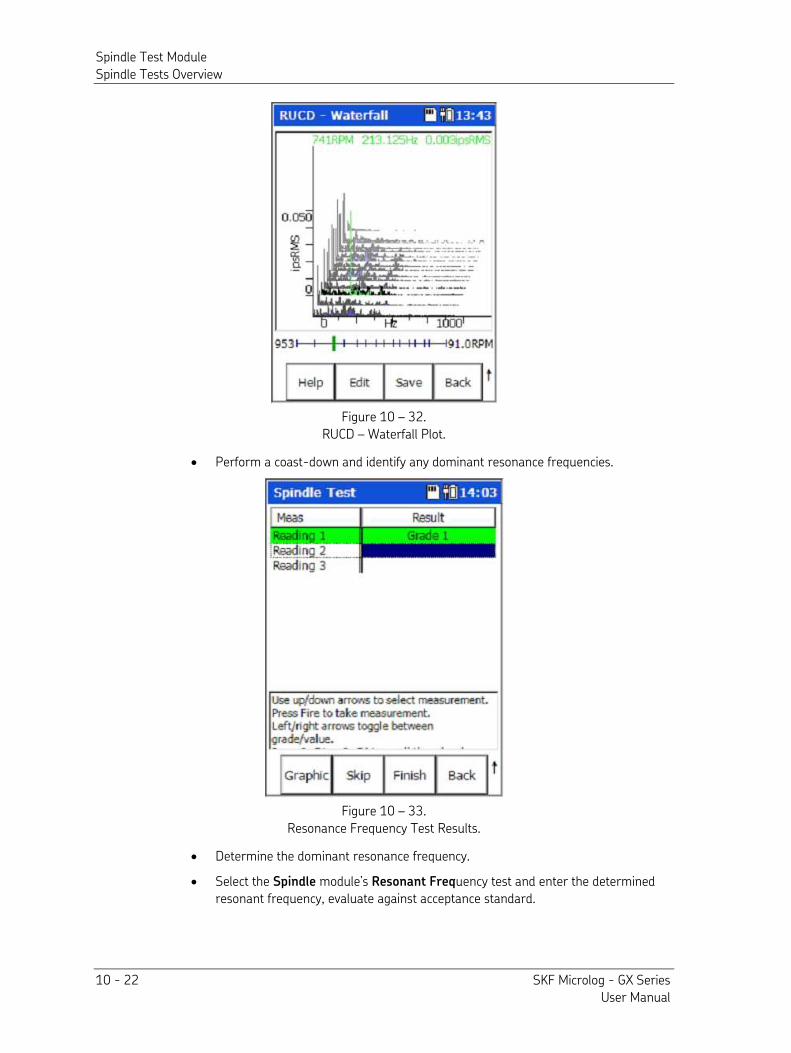
Spindle Test Module Spindle Tests Overview
10 - 22 SKF Microlog - GX Series User Manual
Figure 10 – 32. RUCD – Waterfall Plot.
• Perform a coast-down and identify any dominant resonance frequencies.
Figure 10 – 33. Resonance Frequency Test Results.
• Determine the dominant resonance frequency.
• Select the Spindle module’s Resonant Frequency test and enter the determined resonant frequency, evaluate against acceptance standard.
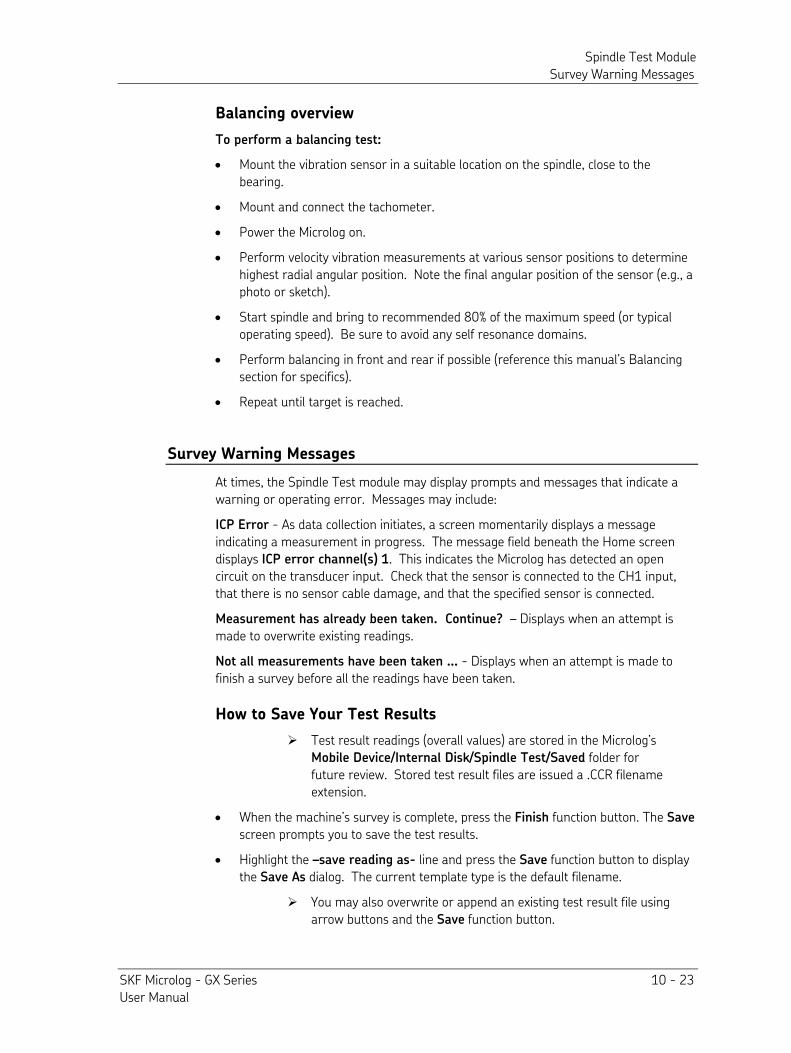
Spindle Test Module Survey Warning Messages
SKF Microlog - GX Series 10 - 23 User Manual
Balancing overview
To perform a balancing test:
• Mount the vibration sensor in a suitable location on the spindle, close to the bearing.
• Mount and connect the tachometer.
• Power the Microlog on.
• Perform velocity vibration measurements at various sensor positions to determine highest radial angular position. Note the final angular position of the sensor (e.g., a photo or sketch).
• Start spindle and bring to recommended 80% of the maximum speed (or typical operating speed). Be sure to avoid any self resonance domains.
• Perform balancing in front and rear if possible (reference this manual’s Balancing section for specifics).
• Repeat until target is reached.
Survey Warning Messages
At times, the Spindle Test module may display prompts and messages that indicate a warning or operating error. Messages may include:
ICP Error - As data collection initiates, a screen momentarily displays a message indicating a measurement in progress. The message field beneath the Home screen displays ICP error channel(s) 1. This indicates the Microlog has detected an open circuit on the transducer input. Check that the sensor is connected to the CH1 input, that there is no sensor cable damage, and that the specified sensor is connected.
Measurement has already been taken. Continue? – Displays when an attempt is made to overwrite existing readings.
Not all measurements have been taken … - Displays when an attempt is made to finish a survey before all the readings have been taken.
How to Save Your Test Results
Test result readings (overall values) are stored in the Microlog’s Mobile Device/Internal Disk/Spindle Test/Saved folder for future review. Stored test result files are issued a .CCR filename extension.
• When the machine’s survey is complete, press the Finish function button. The Save screen prompts you to save the test results.
• Highlight the –save reading as- line and press the Save function button to display the Save As dialog. The current template type is the default filename.
You may also overwrite or append an existing test result file using arrow buttons and the Save function button.
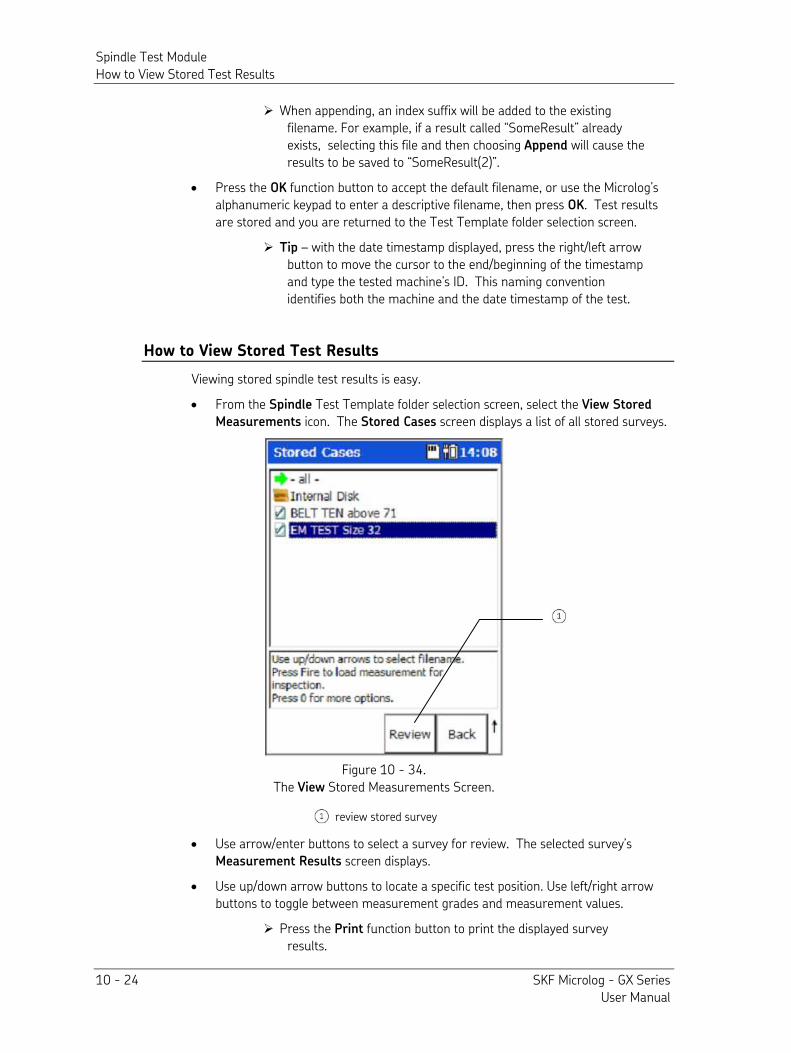
Spindle Test Module How to View Stored Test Results
10 - 24 SKF Microlog - GX Series User Manual
When appending, an index suffix will be added to the existing filename. For example, if a result called “SomeResult” already exists, selecting this file and then choosing Append will cause the results to be saved to “SomeResult(2)”.
• Press the OK function button to accept the default filename, or use the Microlog’s alphanumeric keypad to enter a descriptive filename, then press OK. Test results are stored and you are returned to the Test Template folder selection screen.
Tip – with the date timestamp displayed, press the right/left arrow button to move the cursor to the end/beginning of the timestamp and type the tested machine’s ID. This naming convention identifies both the machine and the date timestamp of the test.
How to View Stored Test Results
Viewing stored spindle test results is easy.
• From the Spindle Test Template folder selection screen, select the View Stored
Measurements icon. The Stored Cases screen displays a list of all stored surveys.
Figure 10 - 34. The View Stored Measurements Screen.
review stored survey
• Use arrow/enter buttons to select a survey for review. The selected survey’s Measurement Results screen displays.
• Use up/down arrow buttons to locate a specific test position. Use left/right arrow buttons to toggle between measurement grades and measurement values.
Press the Print function button to print the displayed survey results.
Spindle Test Module How to Backup Stored Survey Results
SKF Microlog - GX Series 10 - 25 User Manual
• When finished, press the Back button to return to the Stored Cases screen to review additional stored surveys.
How to Backup Stored Survey Results
Copying Survey Results to the Host Computer
• Using the appropriate cable, connect the Microlog to your host computer’s USB port. ActiveSync should automatically sense the connection and the Microsoft ActiveSync window should display a Connected – Synchronized message.
• Using Windows Explorer, copy the stored survey files (.ccr files) from the Microlog’s Mobile Device/Internal Disk/Spindle Test/Saved folder to an appropriate folder on the host computer.
• Results can also be copied from the unit using the Results Import Tool, see below for more details.
Results Import Tool
• To install the Results Import Tool, you will need to run the MTImportSetup.msi file.
• Once installed, the Results Import Tool can be started by clicking the shortcut created at Start – Programs – SKF – Microlog – Machine Tools – Results
Import Tool.
• With the Microlog connected via Active Sync, the Results Import Tool will show available files for importing to the PC.
• When a selection is made in the Results Import Tool’s left-hand window, the associated ccr files are displayed in the right-hand window. Select any of the listed ccr files you wish upload, and click Import.
• You are prompted for a filename and storage location.
• Use the Delete button to remove ccr files from the unit, if desired.
Backing Up Survey Results to SD card
IMPORTANT – The SD card should not be disconnected in hazardous areas, it must be connected / disconnected in safe areas only. For more information, see the Installation Drawing (090-22500) supplied with the unit.
• Insert an SD memory card into the proper slot at the bottom of the Microlog.
• From the Spindle Test Template folder selection screen, select the View Stored
Measurements icon. The Stored Cases screen displays a list of all stored surveys.
• Use up/down arrow buttons to select a survey for backup, or select the – all –
option to back up all surveys.
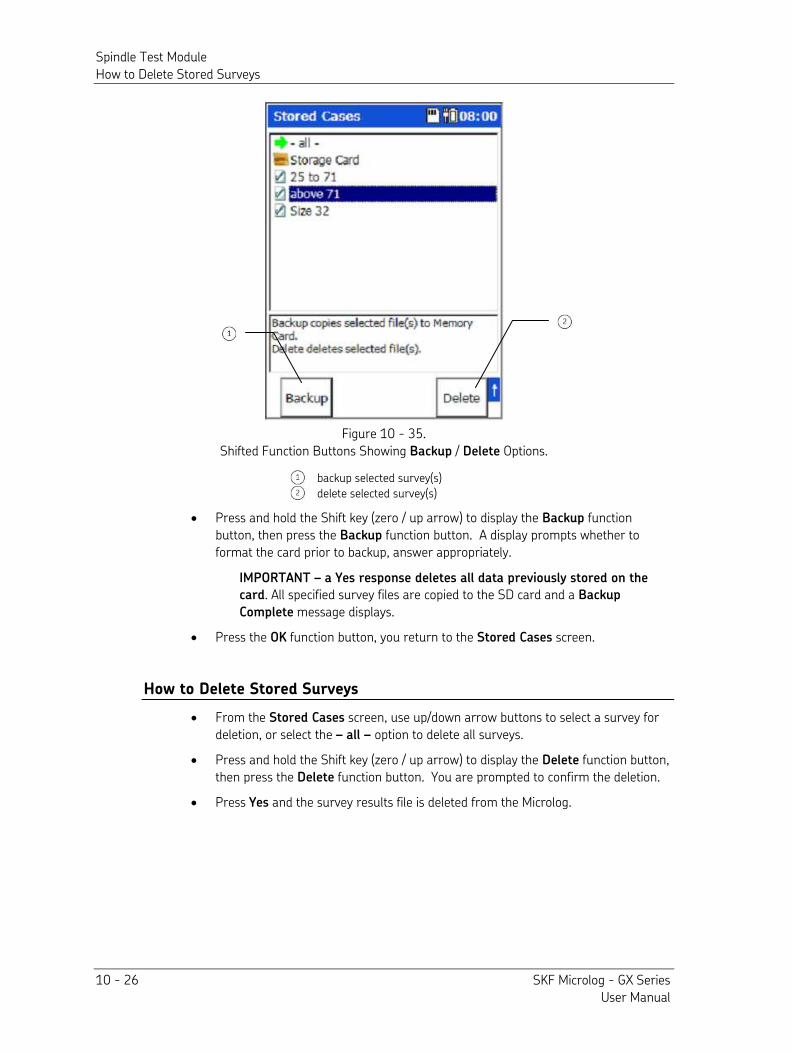
Spindle Test Module How to Delete Stored Surveys
10 - 26 SKF Microlog - GX Series User Manual
Figure 10 - 35. Shifted Function Buttons Showing Backup / Delete Options.
backup selected survey(s)
delete selected survey(s)
• Press and hold the Shift key (zero / up arrow) to display the Backup function button, then press the Backup function button. A display prompts whether to format the card prior to backup, answer appropriately.
IMPORTANT – a Yes response deletes all data previously stored on the
card. All specified survey files are copied to the SD card and a Backup
Complete message displays.
• Press the OK function button, you return to the Stored Cases screen.
How to Delete Stored Surveys
• From the Stored Cases screen, use up/down arrow buttons to select a survey for deletion, or select the – all – option to delete all surveys.
• Press and hold the Shift key (zero / up arrow) to display the Delete function button, then press the Delete function button. You are prompted to confirm the deletion.
• Press Yes and the survey results file is deleted from the Microlog.
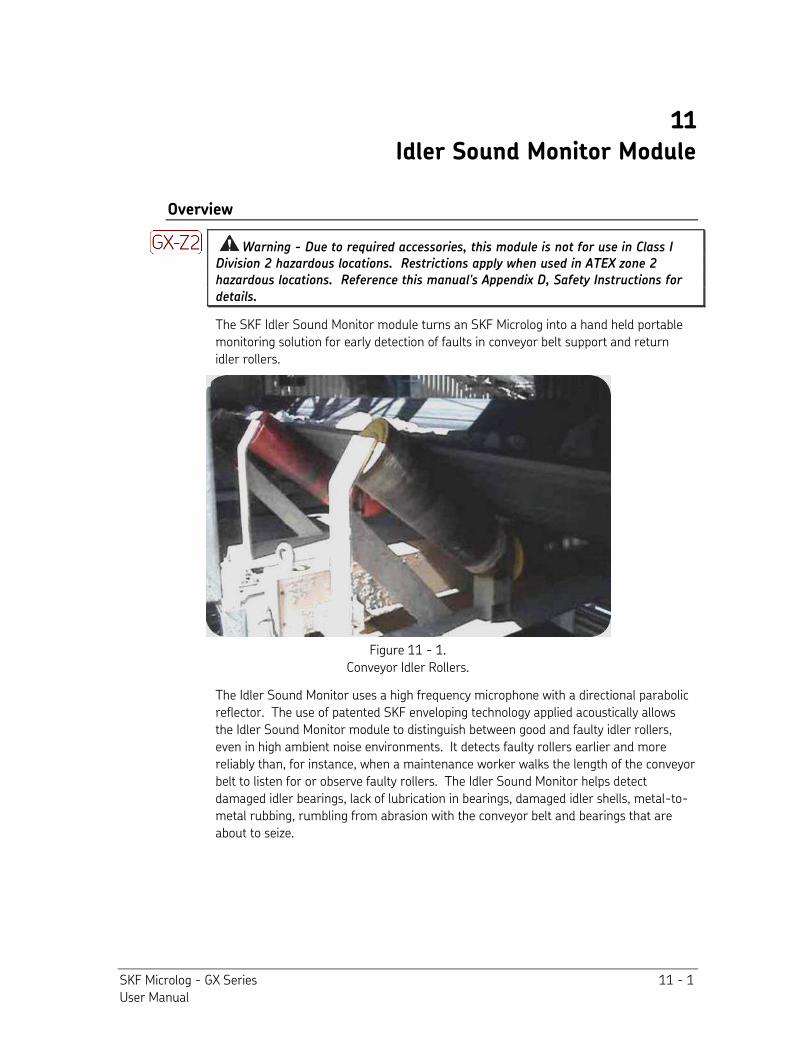
SKF Microlog - GX Series 11 - 1 User Manual
11
Idler Sound Monitor Module
Overview
Warning - Due to required accessories, this module is not for use in Class I Division 2 hazardous locations. Restrictions apply when used in ATEX zone 2 hazardous locations. Reference this manual's Appendix D, Safety Instructions for details.
The SKF Idler Sound Monitor module turns an SKF Microlog into a hand held portable monitoring solution for early detection of faults in conveyor belt support and return idler rollers.
Figure 11 - 1. Conveyor Idler Rollers.
The Idler Sound Monitor uses a high frequency microphone with a directional parabolic reflector. The use of patented SKF enveloping technology applied acoustically allows the Idler Sound Monitor module to distinguish between good and faulty idler rollers, even in high ambient noise environments. It detects faulty rollers earlier and more reliably than, for instance, when a maintenance worker walks the length of the conveyor belt to listen for or observe faulty rollers. The Idler Sound Monitor helps detect damaged idler bearings, lack of lubrication in bearings, damaged idler shells, metal-to-metal rubbing, rumbling from abrasion with the conveyor belt and bearings that are about to seize.
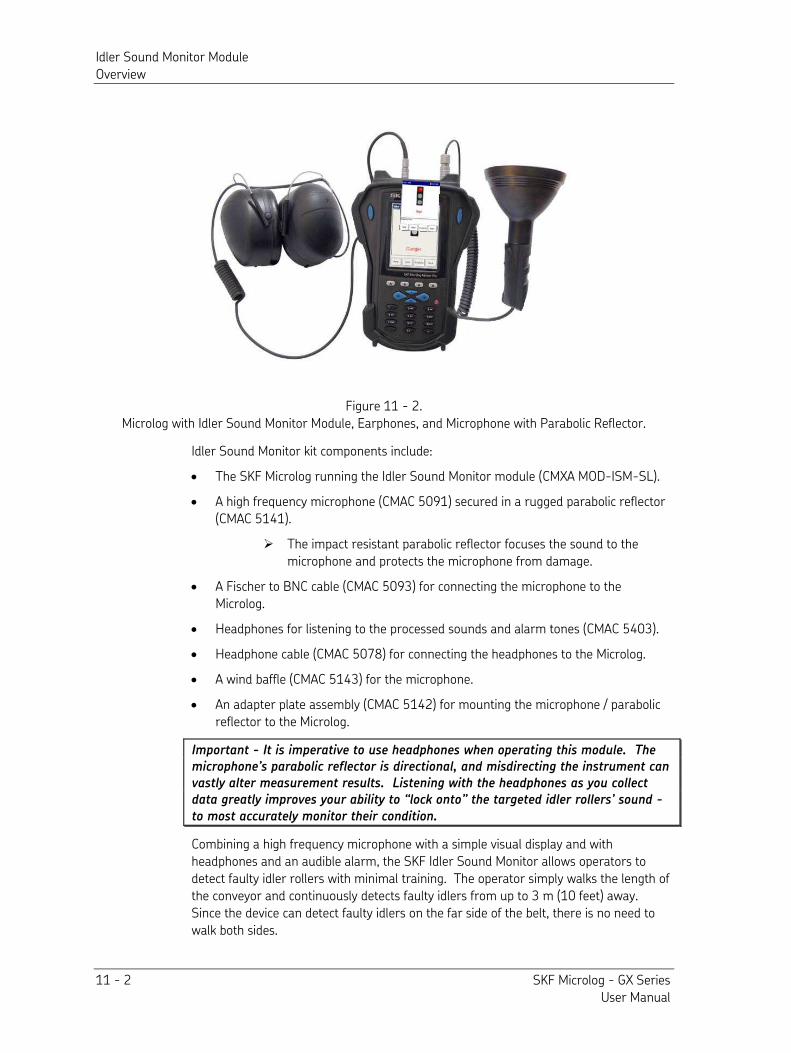
Idler Sound Monitor Module Overview
11 - 2 SKF Microlog - GX Series User Manual
Figure 11 - 2. Microlog with Idler Sound Monitor Module, Earphones, and Microphone with Parabolic Reflector.
Idler Sound Monitor kit components include:
• The SKF Microlog running the Idler Sound Monitor module (CMXA MOD-ISM-SL).
• A high frequency microphone (CMAC 5091) secured in a rugged parabolic reflector (CMAC 5141).
The impact resistant parabolic reflector focuses the sound to the microphone and protects the microphone from damage.
• A Fischer to BNC cable (CMAC 5093) for connecting the microphone to the Microlog.
• Headphones for listening to the processed sounds and alarm tones (CMAC 5403). • Headphone cable (CMAC 5078) for connecting the headphones to the Microlog.
• A wind baffle (CMAC 5143) for the microphone.
• An adapter plate assembly (CMAC 5142) for mounting the microphone / parabolic reflector to the Microlog.
Important - It is imperative to use headphones when operating this module. The microphone’s parabolic reflector is directional, and misdirecting the instrument can vastly alter measurement results. Listening with the headphones as you collect data greatly improves your ability to “lock onto” the targeted idler rollers’ sound - to most accurately monitor their condition.
Combining a high frequency microphone with a simple visual display and with headphones and an audible alarm, the SKF Idler Sound Monitor allows operators to detect faulty idler rollers with minimal training. The operator simply walks the length of the conveyor and continuously detects faulty idlers from up to 3 m (10 feet) away. Since the device can detect faulty idlers on the far side of the belt, there is no need to walk both sides.
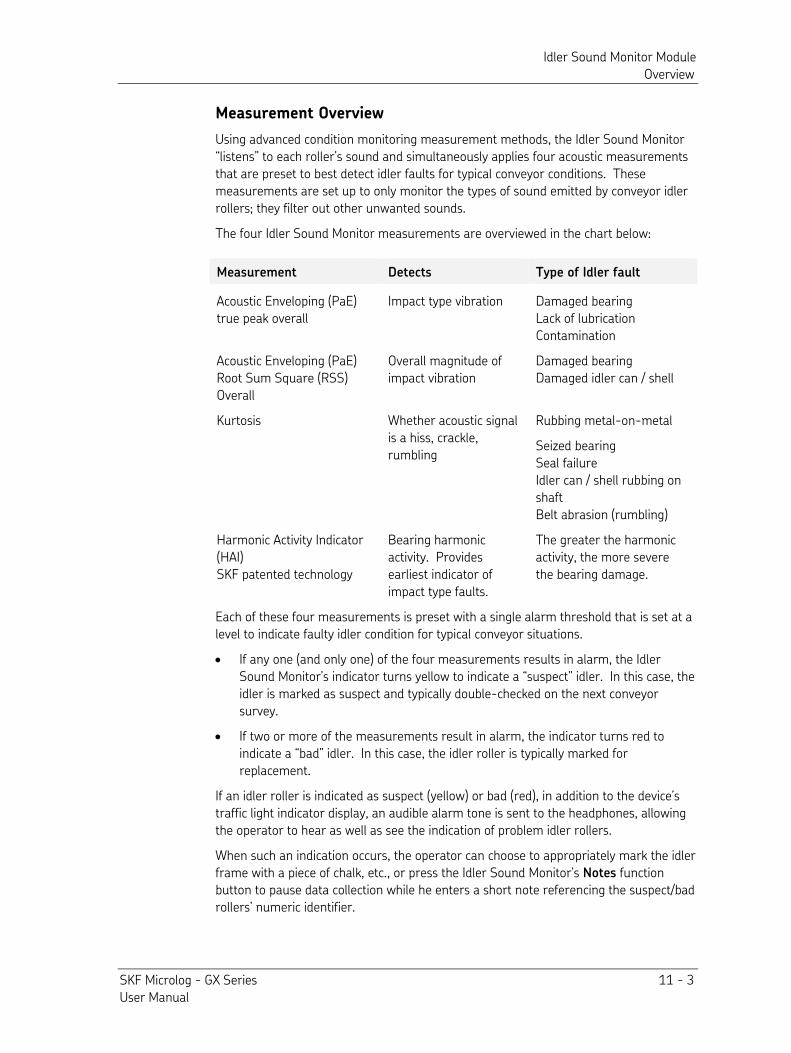
Idler Sound Monitor Module Overview
SKF Microlog - GX Series 11 - 3 User Manual
Measurement Overview
Using advanced condition monitoring measurement methods, the Idler Sound Monitor “listens” to each roller’s sound and simultaneously applies four acoustic measurements that are preset to best detect idler faults for typical conveyor conditions. These measurements are set up to only monitor the types of sound emitted by conveyor idler rollers; they filter out other unwanted sounds.
The four Idler Sound Monitor measurements are overviewed in the chart below:
Measurement Detects Type of Idler fault
Acoustic Enveloping (PaE) true peak overall
Impact type vibration Damaged bearing Lack of lubrication Contamination
Acoustic Enveloping (PaE) Root Sum Square (RSS) Overall
Overall magnitude of impact vibration
Damaged bearing Damaged idler can / shell
Kurtosis Whether acoustic signal is a hiss, crackle, rumbling
Rubbing metal-on-metal
Seized bearing Seal failure Idler can / shell rubbing on shaft Belt abrasion (rumbling)
Harmonic Activity Indicator (HAI) SKF patented technology
Bearing harmonic activity. Provides earliest indicator of impact type faults.
The greater the harmonic activity, the more severe the bearing damage.
Each of these four measurements is preset with a single alarm threshold that is set at a level to indicate faulty idler condition for typical conveyor situations.
• If any one (and only one) of the four measurements results in alarm, the Idler Sound Monitor’s indicator turns yellow to indicate a “suspect” idler. In this case, the idler is marked as suspect and typically double-checked on the next conveyor survey.
• If two or more of the measurements result in alarm, the indicator turns red to indicate a “bad” idler. In this case, the idler roller is typically marked for replacement.
If an idler roller is indicated as suspect (yellow) or bad (red), in addition to the device’s traffic light indicator display, an audible alarm tone is sent to the headphones, allowing the operator to hear as well as see the indication of problem idler rollers.
When such an indication occurs, the operator can choose to appropriately mark the idler frame with a piece of chalk, etc., or press the Idler Sound Monitor’s Notes function button to pause data collection while he enters a short note referencing the suspect/bad rollers’ numeric identifier.
Idler Sound Monitor Module Overview
11 - 4 SKF Microlog - GX Series User Manual
Saving Idler Sound Monitor Data
When in operation, the Idler Sound Monitor automatically stores the results of its four acoustic readings on a continuous basis (at approximately 1.6 second intervals) in the Microlog’s internal memory (or on an installed SD card) in comma separated value file format (csv). Notes entered by the operator are stored with these readings. These .csv files may be copied to the host computer and viewed with Microsoft Excel, Microsoft Word, or similar applications.
Many days of acoustic data are easily stored in the Microlog’s internal memory. However, eventually you will need to delete stored data files to make room for new survey data. Reference the How to Deleted Stored Survey Data Files on the Microlog section at the end of this manual for details.
Figure 11 - 3. Example of Idler Measurement Data Displayed in Microsoft Excel.
The survey’s settings display above the collected data.
The values that are stored are:
• Data acquisition date & time
• True peak value of the enveloped acoustic measurement
• Root Sum Squared value of the enveloped acoustic measurement
• Kurtosis value (filtered 7 kHz to 40 kHz) • Harmonic Activity Index of the enveloped acoustic measurement
• The amount of normalization applied to the signal
Normalization is the Idler Sound Monitor’s method for automatically adjusting volume as you move closer to, or further away from conveyor rollers.
• Idler condition diagnosis
Idler Sound Monitor Module Hardware Setup
SKF Microlog - GX Series 11 - 5 User Manual
• Notes added by the operator during data collection (typically suspect or bad roller identification)
Conveyor Survey Overview
Wearing the headphones, the operator presses the Idler Sound Monitor’s Start button to initiate data collection. The four acoustic measurements commence and run continuously (and their results begin to store to the Microlog’s memory approximately every 1.6 seconds). The operator starts to walk along side the conveyor at a steady pace (as fast as 2 km/hr (1.2 mph)) and from a distance of no greater than 3 meters (10 feet) from the conveyor. As he walks, the operator aims the microphone’s parabolic reflector at each set of idler rollers while listening with the headphones to make sure he is aiming the parabolic reflector accurately. The Microlog continuously performs the four acoustic measurements, and displays the measurement results using both a “traffic light” indicator display and, in the event of an alarm, an audible tone to the headphones. In the event of an alarm, the operator “marks” the rollers appropriately, either physically on the idler frame, or digitally with the rollers’ data in the Microlog’s memory, or both, and then continues to walk and measure the remaining conveyor idler rollers.
Hardware Setup
Overview
Before using the Idler Sound Monitor, you must assemble the kit’s components. This includes:
• Attaching the high frequency microphone to its parabolic reflector.
• Attaching the microphone / parabolic reflector to the Microlog.
• If necessary, fitting the microphone’s optional wind baffle.
• Attaching the headphones to the Microlog and adjusting headphone volume.
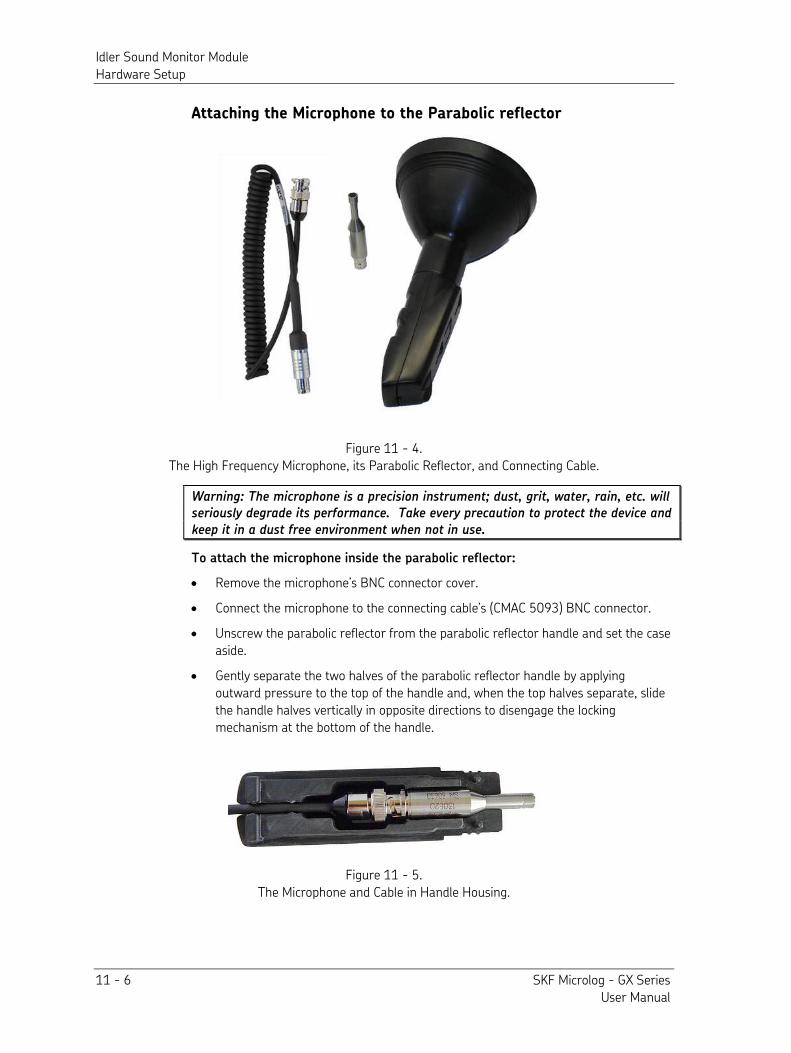
Idler Sound Monitor Module Hardware Setup
11 - 6 SKF Microlog - GX Series User Manual
Attaching the Microphone to the Parabolic reflector
Figure 11 - 4. The High Frequency Microphone, its Parabolic Reflector, and Connecting Cable.
Warning: The microphone is a precision instrument; dust, grit, water, rain, etc. will seriously degrade its performance. Take every precaution to protect the device and keep it in a dust free environment when not in use.
To attach the microphone inside the parabolic reflector:
• Remove the microphone’s BNC connector cover. • Connect the microphone to the connecting cable’s (CMAC 5093) BNC connector. • Unscrew the parabolic reflector from the parabolic reflector handle and set the case
aside.
• Gently separate the two halves of the parabolic reflector handle by applying outward pressure to the top of the handle and, when the top halves separate, slide the handle halves vertically in opposite directions to disengage the locking mechanism at the bottom of the handle.
Figure 11 - 5. The Microphone and Cable in Handle Housing.

Idler Sound Monitor Module Hardware Setup
SKF Microlog - GX Series 11 - 7 User Manual
• One side of the handle houses the microphone and cable. Insert the microphone in its handle housing and feed the microphone’s cable through the handle’s cable guides.
• Refit the two halves of the handle by aligning the locking mechanism at the bottom and sliding the handle halves together, then press firmly together to secure the handle and screw the parabolic reflector back onto the parabolic reflector handle.
Attaching the Microphone / Parabolic reflector to the Microlog
There are two methods for holding the Idler Sound Monitor instrument, shoulder mount and hand held:
• Shoulder mount – requires that you use the shoulder strap.
• Hand held – requires that you use the hand strap and install the back plate for mounting the microphone / parabolic reflector to the Microlog.
Figure 11 - 6. Two Methods for Holding the Instrument; Shoulder Mount and Hand Held.
Shoulder Mount Method
• If using the shoulder mount method, simply connect the microphone cable’s connector to the Microlog’s CH1 connector at the top of the unit.
Hand Held Method
If using the hand held method, you must attach the adapter plate assembly (CMAC 5412) to the back of the Microlog – which allows you to connect the parabolic reflector to the back of the Microlog.
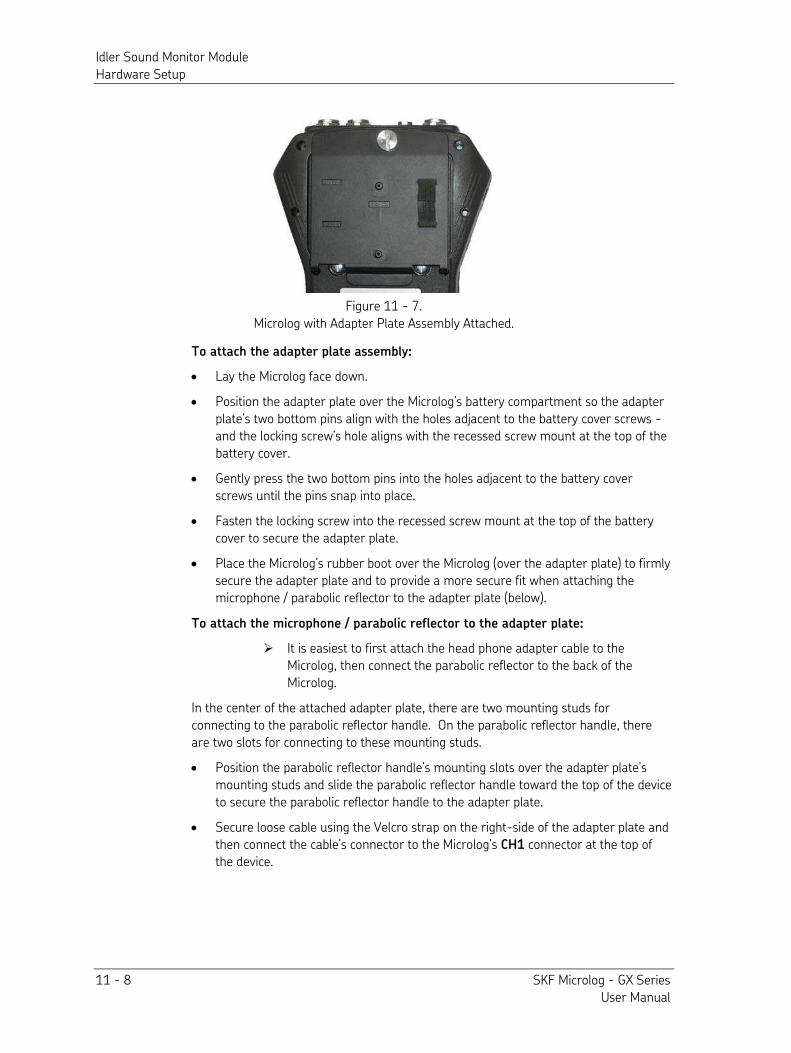
Idler Sound Monitor Module Hardware Setup
11 - 8 SKF Microlog - GX Series User Manual
Figure 11 - 7. Microlog with Adapter Plate Assembly Attached.
To attach the adapter plate assembly:
• Lay the Microlog face down. • Position the adapter plate over the Microlog’s battery compartment so the adapter
plate’s two bottom pins align with the holes adjacent to the battery cover screws - and the locking screw’s hole aligns with the recessed screw mount at the top of the battery cover.
• Gently press the two bottom pins into the holes adjacent to the battery cover screws until the pins snap into place.
• Fasten the locking screw into the recessed screw mount at the top of the battery cover to secure the adapter plate.
• Place the Microlog’s rubber boot over the Microlog (over the adapter plate) to firmly secure the adapter plate and to provide a more secure fit when attaching the microphone / parabolic reflector to the adapter plate (below).
To attach the microphone / parabolic reflector to the adapter plate:
It is easiest to first attach the head phone adapter cable to the Microlog, then connect the parabolic reflector to the back of the Microlog.
In the center of the attached adapter plate, there are two mounting studs for connecting to the parabolic reflector handle. On the parabolic reflector handle, there are two slots for connecting to these mounting studs.
• Position the parabolic reflector handle’s mounting slots over the adapter plate’s mounting studs and slide the parabolic reflector handle toward the top of the device to secure the parabolic reflector handle to the adapter plate.
• Secure loose cable using the Velcro strap on the right-side of the adapter plate and then connect the cable’s connector to the Microlog’s CH1 connector at the top of the device.

Idler Sound Monitor Module Hardware Setup
SKF Microlog - GX Series 11 - 9 User Manual
Figure 11 - 8. The Microphone/Parabolic Reflector Connected to the Microlog.
Fitting the Wind Baffle
Figure 11 - 9. Parabolic Reflector with Wind Baffle.
On windy days, it may become necessary to fit the microphone / parabolic reflector’s wind baffle (CMAC 5143) over the parabolic reflector to reduce wind noise. Simply stretch the wind baffle’s elastic band over the parabolic reflector until snug.
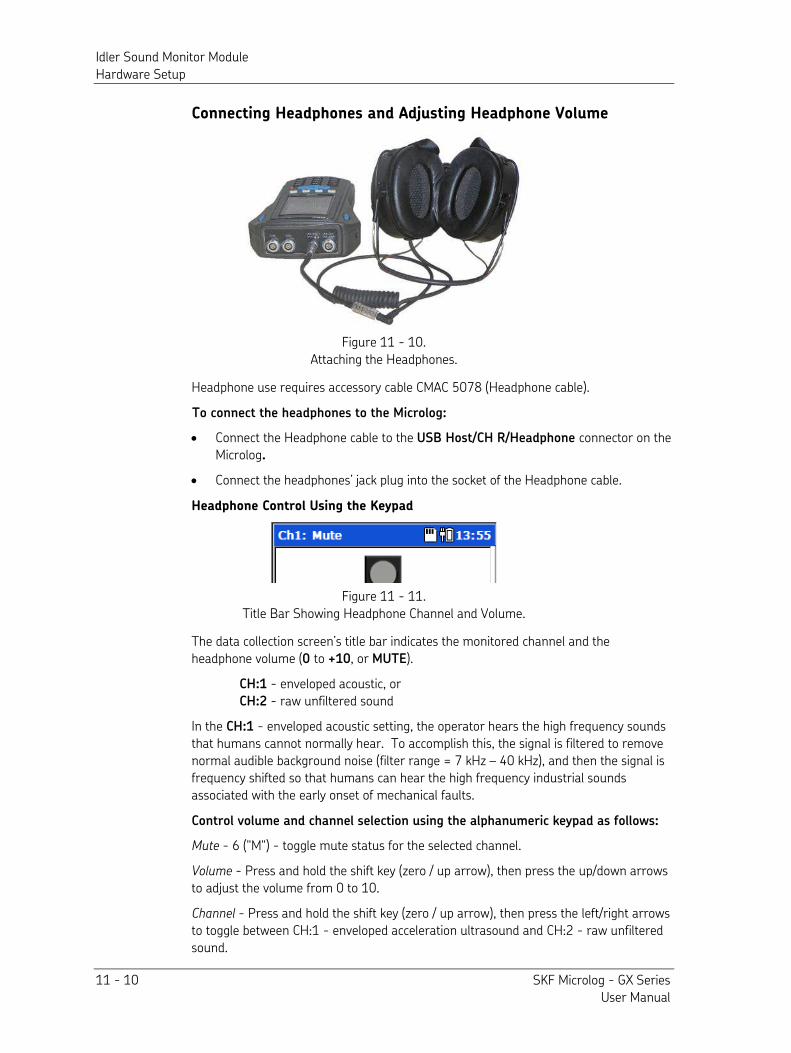
Idler Sound Monitor Module Hardware Setup
11 - 10 SKF Microlog - GX Series User Manual
Connecting Headphones and Adjusting Headphone Volume
Figure 11 - 10. Attaching the Headphones.
Headphone use requires accessory cable CMAC 5078 (Headphone cable). To connect the headphones to the Microlog:
• Connect the Headphone cable to the USB Host/CH R/Headphone connector on the Microlog.
• Connect the headphones’ jack plug into the socket of the Headphone cable. Headphone Control Using the Keypad
Figure 11 - 11. Title Bar Showing Headphone Channel and Volume.
The data collection screen’s title bar indicates the monitored channel and the headphone volume (0 to +10, or MUTE).
CH:1 - enveloped acoustic, or CH:2 - raw unfiltered sound
In the CH:1 - enveloped acoustic setting, the operator hears the high frequency sounds that humans cannot normally hear. To accomplish this, the signal is filtered to remove normal audible background noise (filter range = 7 kHz – 40 kHz), and then the signal is frequency shifted so that humans can hear the high frequency industrial sounds associated with the early onset of mechanical faults.
Control volume and channel selection using the alphanumeric keypad as follows:
Mute - 6 ("M") - toggle mute status for the selected channel.
Volume - Press and hold the shift key (zero / up arrow), then press the up/down arrows to adjust the volume from 0 to 10.
Channel - Press and hold the shift key (zero / up arrow), then press the left/right arrows to toggle between CH:1 - enveloped acceleration ultrasound and CH:2 - raw unfiltered sound.
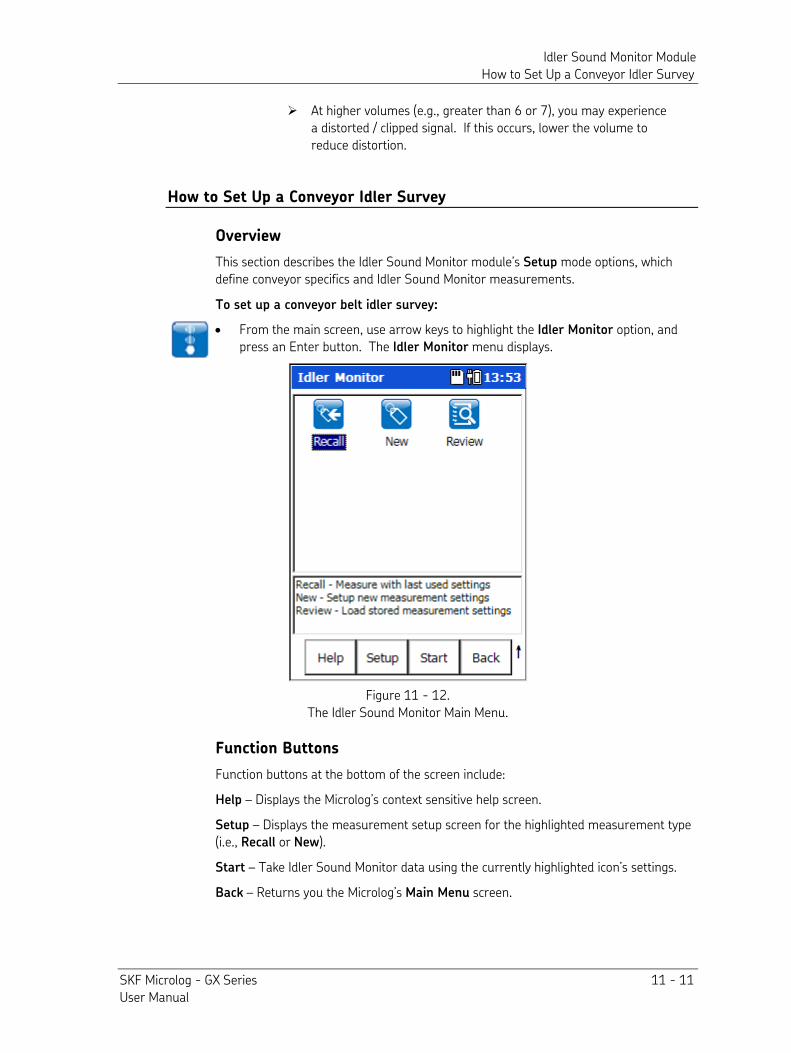
Idler Sound Monitor Module How to Set Up a Conveyor Idler Survey
SKF Microlog - GX Series 11 - 11 User Manual
At higher volumes (e.g., greater than 6 or 7), you may experience a distorted / clipped signal. If this occurs, lower the volume to reduce distortion.
How to Set Up a Conveyor Idler Survey
Overview
This section describes the Idler Sound Monitor module’s Setup mode options, which define conveyor specifics and Idler Sound Monitor measurements.
To set up a conveyor belt idler survey:
• From the main screen, use arrow keys to highlight the Idler Monitor option, and press an Enter button. The Idler Monitor menu displays.
Figure 11 - 12. The Idler Sound Monitor Main Menu.
Function Buttons
Function buttons at the bottom of the screen include:
Help – Displays the Microlog’s context sensitive help screen.
Setup – Displays the measurement setup screen for the highlighted measurement type (i.e., Recall or New).
Start – Take Idler Sound Monitor data using the currently highlighted icon’s settings.
Back – Returns you the Microlog’s Main Menu screen.
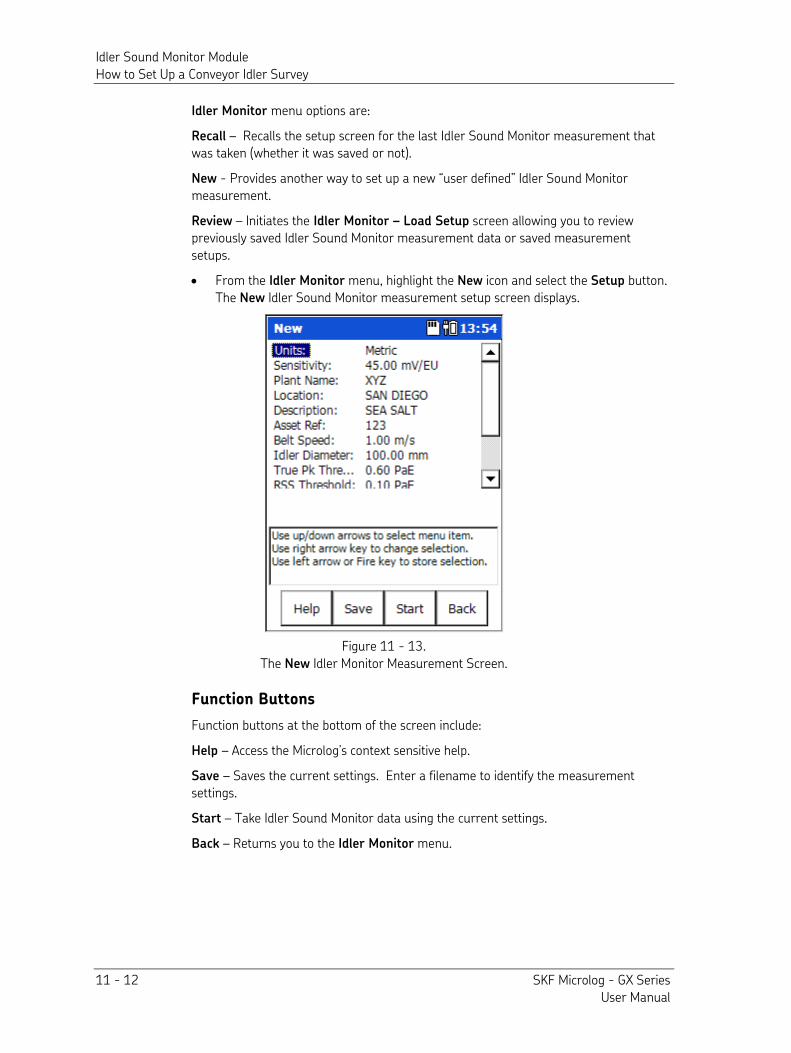
Idler Sound Monitor Module How to Set Up a Conveyor Idler Survey
11 - 12 SKF Microlog - GX Series User Manual
Idler Monitor menu options are:
Recall – Recalls the setup screen for the last Idler Sound Monitor measurement that was taken (whether it was saved or not).
New - Provides another way to set up a new “user defined” Idler Sound Monitor measurement.
Review – Initiates the Idler Monitor – Load Setup screen allowing you to review previously saved Idler Sound Monitor measurement data or saved measurement setups.
• From the Idler Monitor menu, highlight the New icon and select the Setup button. The New Idler Sound Monitor measurement setup screen displays.
Figure 11 - 13. The New Idler Monitor Measurement Screen.
Function Buttons
Function buttons at the bottom of the screen include:
Help – Access the Microlog’s context sensitive help.
Save – Saves the current settings. Enter a filename to identify the measurement settings.
Start – Take Idler Sound Monitor data using the current settings.
Back – Returns you to the Idler Monitor menu.
Idler Sound Monitor Module How to Set Up a Conveyor Idler Survey
SKF Microlog - GX Series 11 - 13 User Manual
LED Indicators
In Idler Sound Monitor mode:
• The green LED indicates data acquisition is occurring.
• The amber LED indicates data acquisition is initializing.
• The red LED indicates a data collection fault (i.e., ICP error). Idler Sound Monitor Setup Fields
• Enter appropriate setup information in the following fields:
Units – English or Metric. Determines the system's units of measurement. For example, select Metric to set belt speed in m/s and idler diameter in mm. Select English to set belt speed in ft/min and idler diameter in inches.
Sensitivity – Enter the microphone’s sensitivity in mV/Pascal of sound pressure. The default sensitivity is set to 45 mV/Pascal for the microphone provided by SKF. This should not need to be changed unless a different microphone is used.
Plant Name - Enter the mine, company or plant name. This information (along with the following three fields) is stored to memory and saved with the recorded conveyor sound data for identification purposes.
Location – Enter the conveyor or machine’s location.
Description – If necessary, enter additional description for identification purposes.
Asset Reference – Enter the conveyor asset number, serial number or tag number.
Belt Speed – Enter the conveyor’s belt speed. Belt speed and idler roller diameter are used to calculate roller rotation speed and bearing fault frequencies.
Idler Diameter – Enter the conveyor’s idler roller diameter. Idler roller diameter and belt speed are used to calculate roller rotation speed and bearing fault frequencies.
The next four fields allow you to alter alarm thresholds for the Idler Sound Monitor’s four acoustic measurements. The default alarm threshold settings are set to best detect idler faults for typical conveyor conditions and should only be altered if they prove insufficient for your conveyor conditions. Prior to resetting measurement alarm thresholds, you should read the Resetting Measurement Alarm Thresholds section later in this manual.
True Pk Threshold – Specify alarm threshold for the Acoustic Enveloping (PaE) true peak overall measurement.
RSS Threshold – Specify alarm threshold for the Acoustic Enveloping (PaE) Root Sum Square (RSS) Overall measurement. Kurtosis Threshold – Specify alarm threshold for the Kurtosis measurement.
HAI Threshold – Specify alarm threshold for the Harmonic Activity Indicator measurement.
Save To – (Internal or SD Card) specify the medium to record to either the Microlog’s internal hard drive or an inserted SD card.
Idler Sound Monitor Module How to Perform a Conveyor Idler Roller Survey
11 - 14 SKF Microlog - GX Series User Manual
Saving
• After setting Idler Sound Monitor setup fields, if desired, press the Save function button to name and save the current settings for future recall.
How to Perform a Conveyor Idler Roller Survey
After defining the survey’s settings, or recalling previously saved settings for the conveyor, you are ready to begin the conveyor sound survey.
Optimal Survey Conditions
As the Idler Sound Monitor performs acoustical measurements, ideal measurement conditions exist when ambient noise is minimal (i.e., wind, rain, other machinery noise, traffic, conversations, etc.) and when the idler rollers are not covered by solid covers. If possible, you should schedule your idler survey when ambient noise conditions are minimized. If you must perform your survey in higher ambient noise conditions, you may need to walk slower and position the microphone / parabolic reflector closer to the idler rollers. In addition, in very high ambient noise conditions, users should place more emphasis on listening to, comparing, and judging idler roller sound emitting from the headphones.
Important - idler roller noise is sometimes louder on one side of the conveyor belt than the other. If this is the case for your conveyor, perform your survey from the louder side.
To start the conveyor survey:
• Put on headphones and adjust volume appropriately.
• From the Idler Monitor – Setup screen, press the Start function button to initiate the idler roller sound measurements. An Initializing DAQ message (initializing data acquisition) appears and then changes to an Acquiring Data message as the module starts to record measurement data. The module’s traffic light indicator displays the result of the current idler measurements:
OK – none of the four measurements are in alarm state. Suspect – one of the four measurements is in alarm state. Bad – at least two of the four measurements are in alarm state.
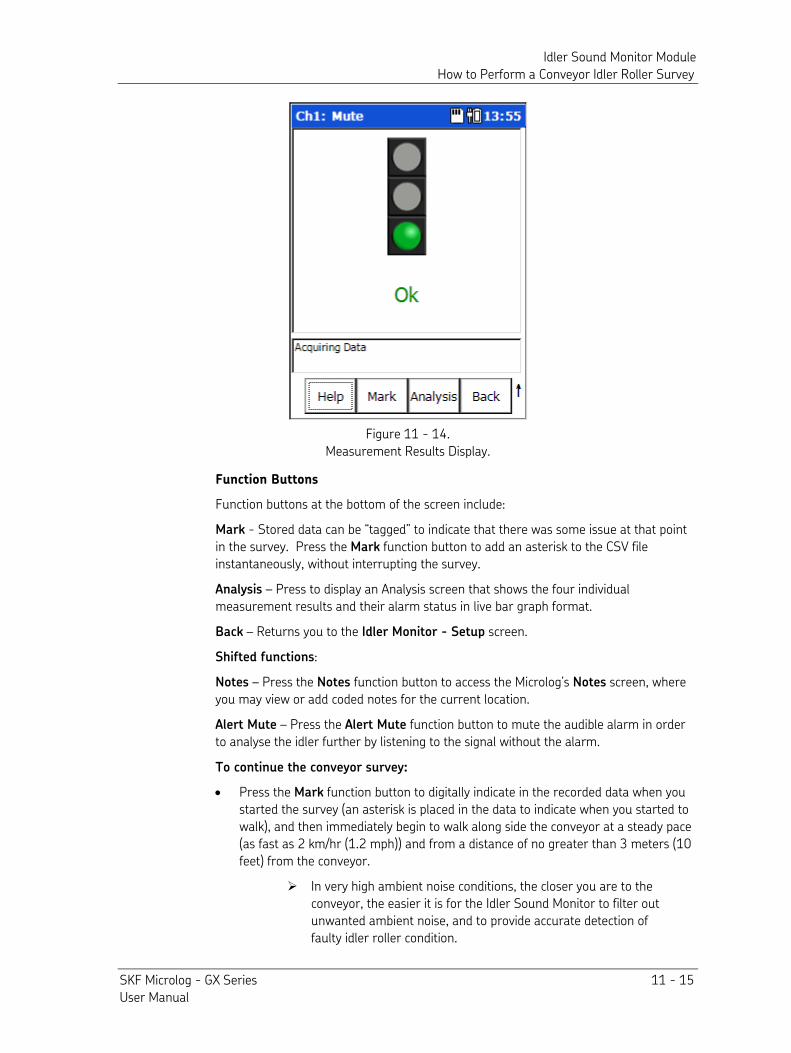
Idler Sound Monitor Module How to Perform a Conveyor Idler Roller Survey
SKF Microlog - GX Series 11 - 15 User Manual
Figure 11 - 14. Measurement Results Display.
Function Buttons
Function buttons at the bottom of the screen include:
Mark - Stored data can be “tagged” to indicate that there was some issue at that point in the survey. Press the Mark function button to add an asterisk to the CSV file instantaneously, without interrupting the survey.
Analysis – Press to display an Analysis screen that shows the four individual measurement results and their alarm status in live bar graph format.
Back – Returns you to the Idler Monitor - Setup screen.
Shifted functions:
Notes – Press the Notes function button to access the Microlog’s Notes screen, where you may view or add coded notes for the current location.
Alert Mute – Press the Alert Mute function button to mute the audible alarm in order to analyse the idler further by listening to the signal without the alarm.
To continue the conveyor survey:
• Press the Mark function button to digitally indicate in the recorded data when you started the survey (an asterisk is placed in the data to indicate when you started to walk), and then immediately begin to walk along side the conveyor at a steady pace (as fast as 2 km/hr (1.2 mph)) and from a distance of no greater than 3 meters (10 feet) from the conveyor.
In very high ambient noise conditions, the closer you are to the conveyor, the easier it is for the Idler Sound Monitor to filter out unwanted ambient noise, and to provide accurate detection of faulty idler roller condition.
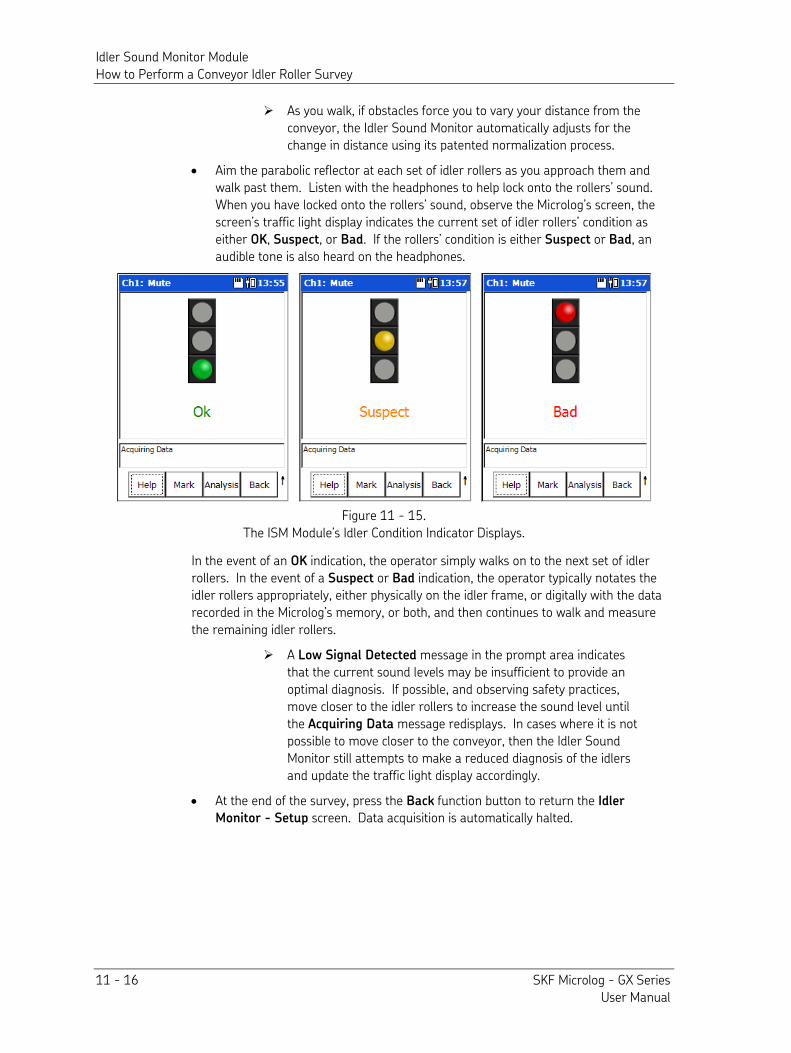
Idler Sound Monitor Module How to Perform a Conveyor Idler Roller Survey
11 - 16 SKF Microlog - GX Series User Manual
As you walk, if obstacles force you to vary your distance from the conveyor, the Idler Sound Monitor automatically adjusts for the change in distance using its patented normalization process.
• Aim the parabolic reflector at each set of idler rollers as you approach them and walk past them. Listen with the headphones to help lock onto the rollers’ sound. When you have locked onto the rollers’ sound, observe the Microlog’s screen, the screen’s traffic light display indicates the current set of idler rollers’ condition as either OK, Suspect, or Bad. If the rollers’ condition is either Suspect or Bad, an audible tone is also heard on the headphones.
Figure 11 - 15. The ISM Module’s Idler Condition Indicator Displays.
In the event of an OK indication, the operator simply walks on to the next set of idler rollers. In the event of a Suspect or Bad indication, the operator typically notates the idler rollers appropriately, either physically on the idler frame, or digitally with the data recorded in the Microlog’s memory, or both, and then continues to walk and measure the remaining idler rollers.
A Low Signal Detected message in the prompt area indicates that the current sound levels may be insufficient to provide an optimal diagnosis. If possible, and observing safety practices, move closer to the idler rollers to increase the sound level until the Acquiring Data message redisplays. In cases where it is not possible to move closer to the conveyor, then the Idler Sound Monitor still attempts to make a reduced diagnosis of the idlers and update the traffic light display accordingly.
• At the end of the survey, press the Back function button to return the Idler
Monitor - Setup screen. Data acquisition is automatically halted.
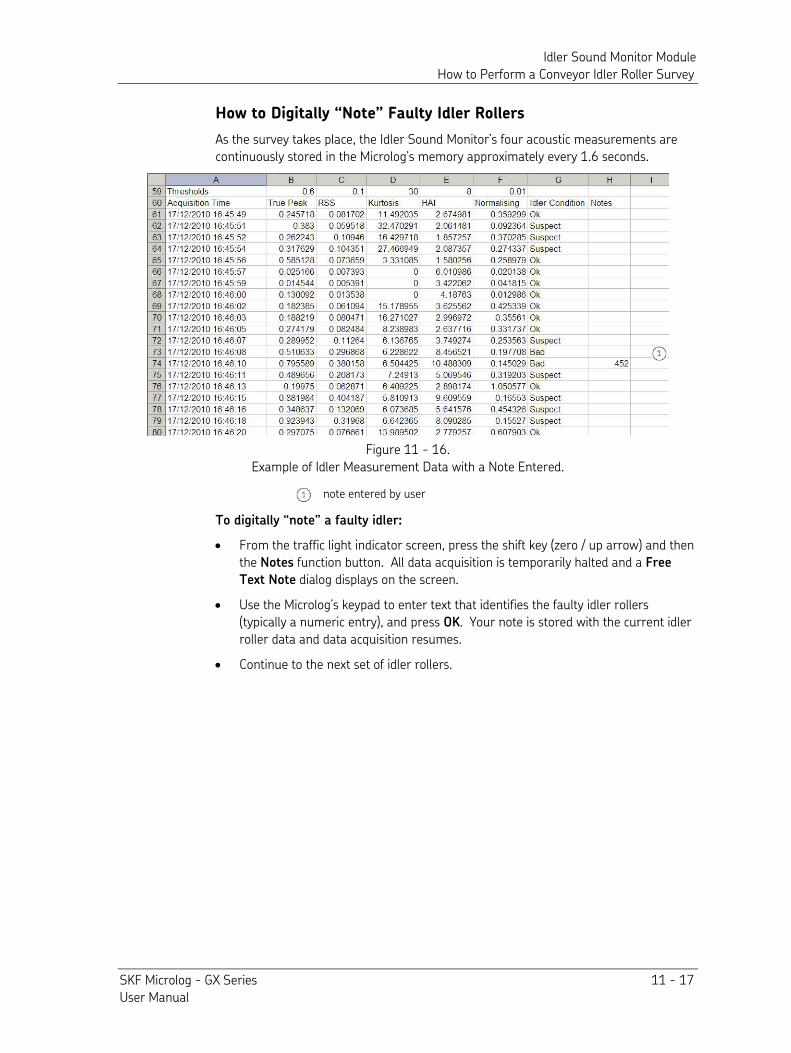
Idler Sound Monitor Module How to Perform a Conveyor Idler Roller Survey
SKF Microlog - GX Series 11 - 17 User Manual
How to Digitally “Note” Faulty Idler Rollers
As the survey takes place, the Idler Sound Monitor’s four acoustic measurements are continuously stored in the Microlog’s memory approximately every 1.6 seconds.
Figure 11 - 16. Example of Idler Measurement Data with a Note Entered.
note entered by user
To digitally “note” a faulty idler:
• From the traffic light indicator screen, press the shift key (zero / up arrow) and then the Notes function button. All data acquisition is temporarily halted and a Free
Text Note dialog displays on the screen.
• Use the Microlog’s keypad to enter text that identifies the faulty idler rollers (typically a numeric entry), and press OK. Your note is stored with the current idler roller data and data acquisition resumes.
• Continue to the next set of idler rollers.
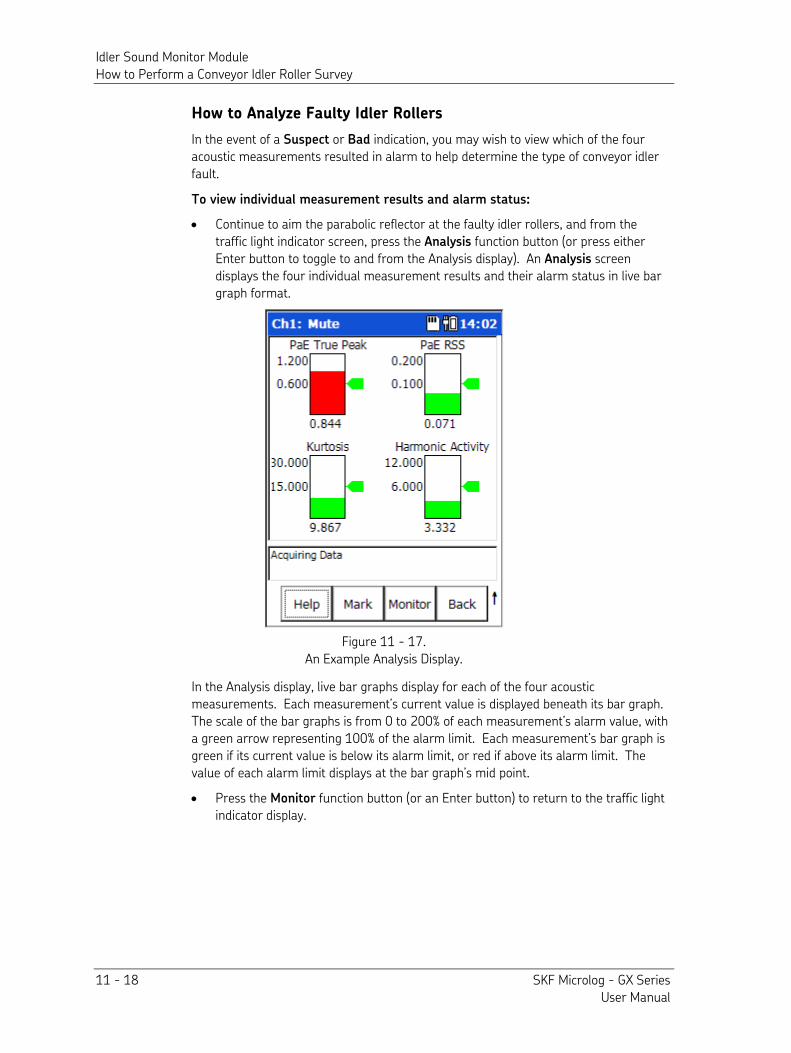
Idler Sound Monitor Module How to Perform a Conveyor Idler Roller Survey
11 - 18 SKF Microlog - GX Series User Manual
How to Analyze Faulty Idler Rollers
In the event of a Suspect or Bad indication, you may wish to view which of the four acoustic measurements resulted in alarm to help determine the type of conveyor idler fault.
To view individual measurement results and alarm status:
• Continue to aim the parabolic reflector at the faulty idler rollers, and from the traffic light indicator screen, press the Analysis function button (or press either Enter button to toggle to and from the Analysis display). An Analysis screen displays the four individual measurement results and their alarm status in live bar graph format.
Figure 11 - 17. An Example Analysis Display.
In the Analysis display, live bar graphs display for each of the four acoustic measurements. Each measurement’s current value is displayed beneath its bar graph. The scale of the bar graphs is from 0 to 200% of each measurement’s alarm value, with a green arrow representing 100% of the alarm limit. Each measurement’s bar graph is green if its current value is below its alarm limit, or red if above its alarm limit. The value of each alarm limit displays at the bar graph’s mid point.
• Press the Monitor function button (or an Enter button) to return to the traffic light indicator display.
Idler Sound Monitor Module Transferring, Reviewing, and Deleting Survey Data Files
SKF Microlog - GX Series 11 - 19 User Manual
How to Load a Saved Idler Sound Monitor Setup
You may load a previously saved Idler Sound Monitor setup to perform a new survey with the same settings.
• From the main menu, select the Review menu option and press an Enter button. The Idler Monitor – Load Setup screen displays a list of all previously saved setup files and all stored survey data files.
Filenames for survey setup files are identified by the name specified for the setup file when the setup was saved. Filenames for stored data files begin with the Plant Name specified in the survey’s setup, followed by the survey’s date/timestamp
• Use the up/down arrow keys to highlight the survey setup you would like to load and select the Open function button. The Idler Monitor – Setup screen displays with the selected settings.
Transferring, Reviewing, and Deleting Survey Data Files
How to Transfer and Review Survey Data Files on Your PC
Survey data files are stored in comma separated value format (.csv) in the Microlog’s Mobile Device/Internal Disk/IdlerMonitor folder; or if you are using an SD card for data storage, in Mobile Device/Storage Card/IdlerMonitor. These .csv data files may be copied to the host computer and viewed with Microsoft Excel or other host application.
To copy data files to the host PC:
• Using the appropriate cable, connect the Microlog to your host computer’s USB port. ActiveSync should automatically sense the connection and the Microsoft ActiveSync window should display a Connected – Synchronized message.
ActiveSync communication with the Microlog requires specific drivers to be installed on the host PC. Refer to the Microsoft
ActiveSync Communications section in Chapter 1 – Introduction to
the Microlog for details.
• Using Windows Explorer, copy the stored survey data files (.csv files) from the Microlog’s Mobile Device/Internal Disk/Idler Monitor folder to an appropriate folder on the host computer.
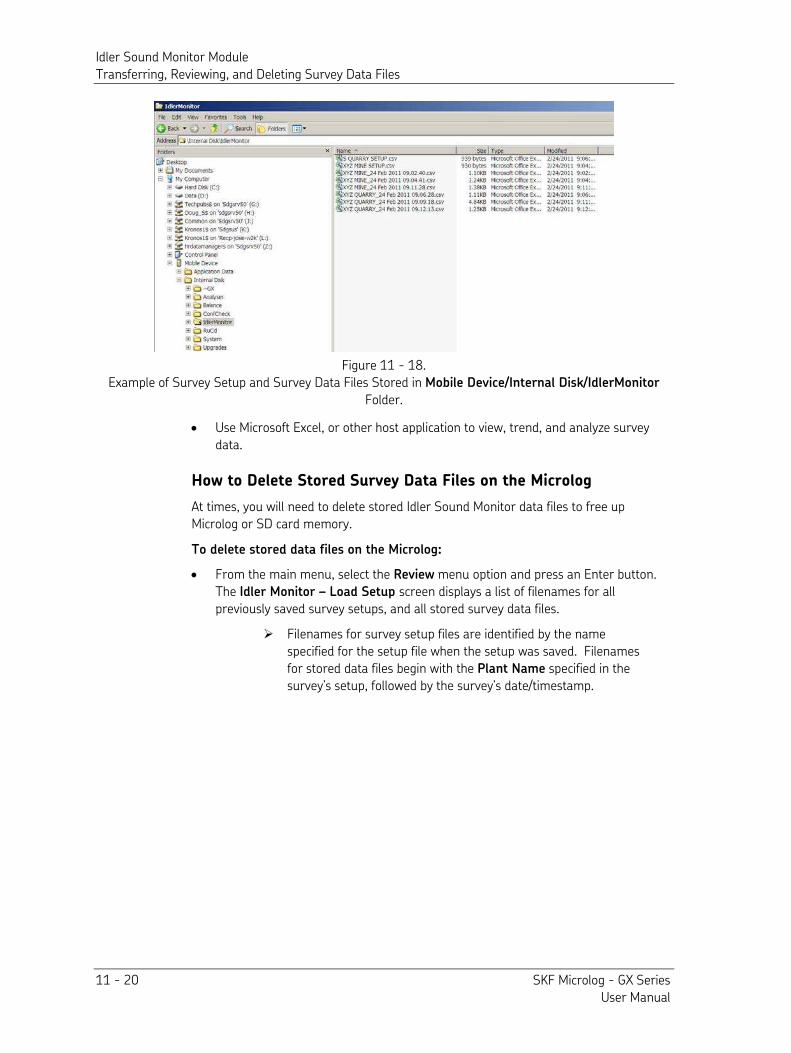
Idler Sound Monitor Module Transferring, Reviewing, and Deleting Survey Data Files
11 - 20 SKF Microlog - GX Series User Manual
Figure 11 - 18. Example of Survey Setup and Survey Data Files Stored in Mobile Device/Internal Disk/IdlerMonitor
Folder.
• Use Microsoft Excel, or other host application to view, trend, and analyze survey data.
How to Delete Stored Survey Data Files on the Microlog
At times, you will need to delete stored Idler Sound Monitor data files to free up Microlog or SD card memory.
To delete stored data files on the Microlog:
• From the main menu, select the Review menu option and press an Enter button. The Idler Monitor – Load Setup screen displays a list of filenames for all previously saved survey setups, and all stored survey data files.
Filenames for survey setup files are identified by the name specified for the setup file when the setup was saved. Filenames for stored data files begin with the Plant Name specified in the survey’s setup, followed by the survey’s date/timestamp.
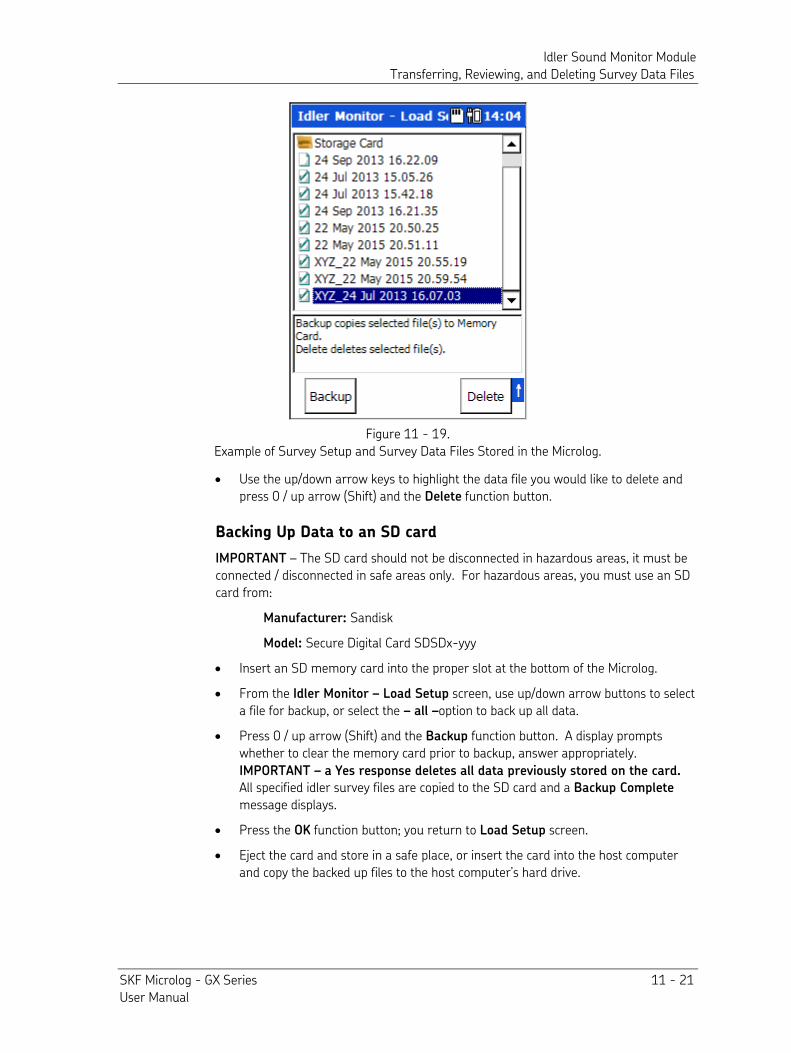
Idler Sound Monitor Module Transferring, Reviewing, and Deleting Survey Data Files
SKF Microlog - GX Series 11 - 21 User Manual
Figure 11 - 19. Example of Survey Setup and Survey Data Files Stored in the Microlog.
• Use the up/down arrow keys to highlight the data file you would like to delete and press 0 / up arrow (Shift) and the Delete function button.
Backing Up Data to an SD card
IMPORTANT – The SD card should not be disconnected in hazardous areas, it must be connected / disconnected in safe areas only. For hazardous areas, you must use an SD card from:
Manufacturer: Sandisk
Model: Secure Digital Card SDSDx-yyy
• Insert an SD memory card into the proper slot at the bottom of the Microlog.
• From the Idler Monitor – Load Setup screen, use up/down arrow buttons to select a file for backup, or select the – all –option to back up all data.
• Press 0 / up arrow (Shift) and the Backup function button. A display prompts whether to clear the memory card prior to backup, answer appropriately.
IMPORTANT – a Yes response deletes all data previously stored on the card.
All specified idler survey files are copied to the SD card and a Backup Complete
message displays.
• Press the OK function button; you return to Load Setup screen.
• Eject the card and store in a safe place, or insert the card into the host computer and copy the backed up files to the host computer’s hard drive.
Idler Sound Monitor Module Resetting Measurement Alarm Thresholds
11 - 22 SKF Microlog - GX Series User Manual
Resetting Measurement Alarm Thresholds
The Idler Sound Monitor’s default alarm threshold settings are set to best detect idler faults for typical conveyor conditions and should only be altered if they prove insufficient for your conveyor conditions.
Procedure for determining specific conveyor alarm threshold settings:
• Perform a baseline survey – Using the default threshold settings, perform a conveyor survey to determine how each of the four measurement alarm settings applies to your conveyor conditions.
• Analyze the baseline measurement data - Using Microsoft Excel or other host software, for each of the four measurements, determine if the default alarm thresholds are set too low, too high, or are accurate as is.
• Determine more accurate measurement thresholds – Based on your analysis, determine new measurement alarm thresholds as necessary. Alarm thresholds should be set low enough to alarm on bad idler roller conditions, but not so low as to cause false alarming.
• Update your survey settings with new measurement thresholds – Reference this manual’s previous How to Set up a Conveyor Idler Survey section for details.
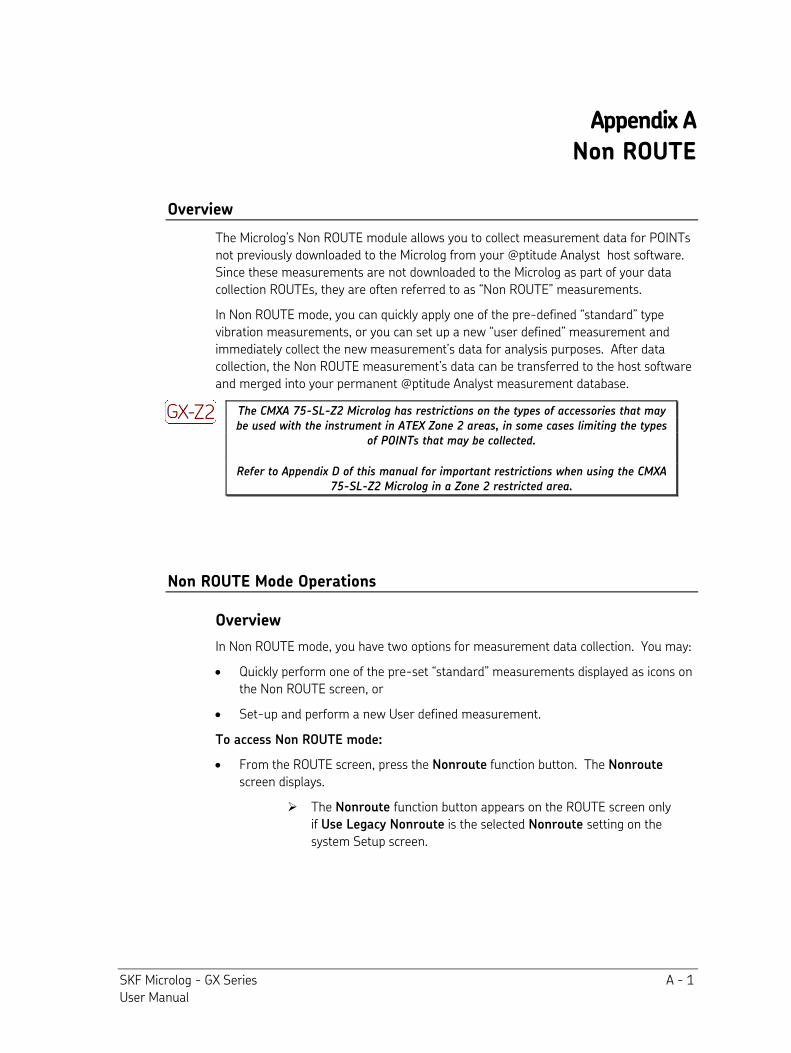
SKF Microlog - GX Series A - 1 User Manual
Appendix A
Non ROUTE
Overview
The Microlog’s Non ROUTE module allows you to collect measurement data for POINTs not previously downloaded to the Microlog from your @ptitude Analyst host software. Since these measurements are not downloaded to the Microlog as part of your data collection ROUTEs, they are often referred to as “Non ROUTE” measurements. In Non ROUTE mode, you can quickly apply one of the pre-defined “standard” type vibration measurements, or you can set up a new “user defined” measurement and immediately collect the new measurement’s data for analysis purposes. After data collection, the Non ROUTE measurement’s data can be transferred to the host software and merged into your permanent @ptitude Analyst measurement database.
The CMXA 75-SL-Z2 Microlog has restrictions on the types of accessories that may be used with the instrument in ATEX Zone 2 areas, in some cases limiting the types
of POINTs that may be collected.
Refer to Appendix D of this manual for important restrictions when using the CMXA 75-SL-Z2 Microlog in a Zone 2 restricted area.
Non ROUTE Mode Operations
Overview
In Non ROUTE mode, you have two options for measurement data collection. You may: • Quickly perform one of the pre-set “standard” measurements displayed as icons on
the Non ROUTE screen, or • Set-up and perform a new User defined measurement.
To access Non ROUTE mode:
• From the ROUTE screen, press the Nonroute function button. The Nonroute screen displays.
The Nonroute function button appears on the ROUTE screen only if Use Legacy Nonroute is the selected Nonroute setting on the system Setup screen.
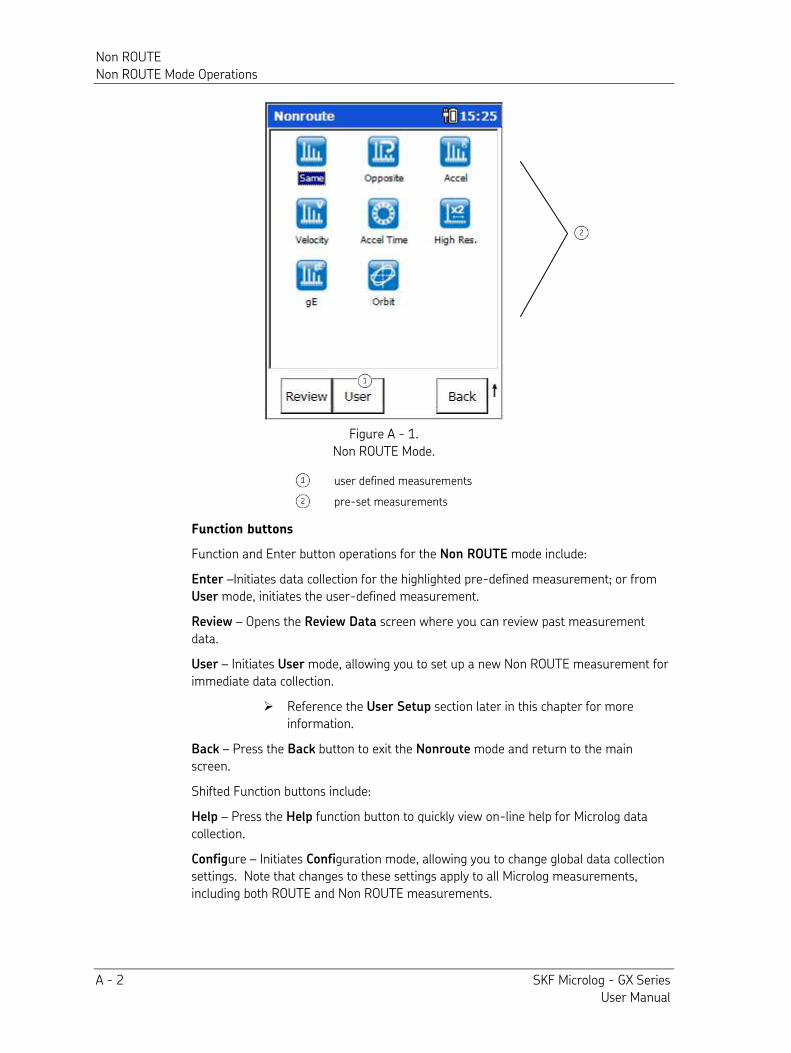
Non ROUTE Non ROUTE Mode Operations
A - 2 SKF Microlog - GX Series User Manual
Figure A - 1. Non ROUTE Mode.
user defined measurements
pre-set measurements
Function buttons
Function and Enter button operations for the Non ROUTE mode include:
Enter –Initiates data collection for the highlighted pre-defined measurement; or from User mode, initiates the user-defined measurement.
Review – Opens the Review Data screen where you can review past measurement data.
User – Initiates User mode, allowing you to set up a new Non ROUTE measurement for immediate data collection.
Reference the User Setup section later in this chapter for more information.
Back – Press the Back button to exit the Nonroute mode and return to the main screen.
Shifted Function buttons include:
Help – Press the Help function button to quickly view on-line help for Microlog data collection.
Configure – Initiates Configuration mode, allowing you to change global data collection settings. Note that changes to these settings apply to all Microlog measurements, including both ROUTE and Non ROUTE measurements.
Non ROUTE How to Collect Pre-set Non ROUTE Measurements
SKF Microlog - GX Series A - 3 User Manual
How to Collect Pre-set Non ROUTE Measurements
For fast, easy collection of “standard” type measurements, use one of the pre-set measurement options on the Microlog’s Non ROUTE screen. These measurement types have fixed industry-standard settings as described below.
You may not alter the configuration of these pre-set Non ROUTE measurements; they must be applied “as is.”
For the Same, Opposite, and High Resolution pre-set measurement types, the following standard settings are taken from the current selected ROUTE measurement:
Detection
Sensitivity
Window
Type
Coupling
Input Channel
Ext. Trigger Slope
Trigger Level
Same – This measurement’s configuration is based upon the most recently highlighted measurement in the Microlog’s ROUTE mode. Its setup is the Same as the “active” measurement in the “active” ROUTE. This allows you to quickly collect Non ROUTE measurements that are identical to your “active” ROUTE measurement, but from various sensor positions for analysis purposes.
If the active ROUTE POINT is set up to collect both FFT and time waveform data, the Non ROUTE Same measurement is FFT only.
Measurement parameters are set to:
Overlap – 50% Bin Zeroing - On
Opposite – Also based upon the highlighted measurement in the Microlog’s ROUTE mode. Its setup is identical to the “active” measurement in the “active” ROUTE, except it collects the Opposite data format. For example, if the “active” ROUTE POINT collects FFT spectrum data, the Opposite Non ROUTE measurement collects time waveform data, and vice versa. Measurement parameters are set to:
Overlap – 50% Bin Zeroing - On
High Resolution – Also based upon the highlighted measurement in the Microlog’s ROUTE mode. Its setup is identical to the “active” measurement in the “active” ROUTE, except its Lines/Samples setting is doubled (increased by a factor of 2) to a maximum of 25,600 lines (up to 12,800 for two-channel measurements and up to 6,400 for three and four-channel measurements). For example, if the “active” ROUTE POINT’s Lines/Samples setting is 400 Lines, the High Resolution Non ROUTE measurement’s Lines/Samples setting is 800 Lines. This allows you to quickly take a high resolution look at your active ROUTE measurement. Measurement parameters are set to:
Overlap – 50% Bin Zeroing - On
Non ROUTE How to Collect Pre-set Non ROUTE Measurements
A - 4 SKF Microlog - GX Series User Manual
For Accel, Accel Time, Velocity, and gE pre-set measurement types, the following standard settings are taken from the current selected ROUTE measurement:
Sensitivity Coupling Detection Window
Accel – Performs a “standard” type vibration Acceleration measurement. Measurement parameters are set to:
Units - Accel (Gs) Display Format – Spectrum High-pass frequency - 1.1 Hz Fmax - 10 kHz Lines/Samples - 800 Lines Averages – 4 Input Channel – CH1 Overlap – 50% Ext. Trigger Slope – Positive Trigger Level – 2 V Bin Zeroing – On Type - Spectral
Accel Time – Performs the same “standard” type vibration Acceleration measurement, but collects time waveform data. Measurement parameters are set to:
Units - Accel (Gs) Display Format – Time High-pass frequency - 1.1 Hz Fmax - 8 kHz Lines/Samples – 6400 Lines / 16384 Samples Averages – 4 (time sync.) If a trigger is defined for the active ROUTE point, if no trigger is detected only 1 average is taken. Input Channel – CH1 Overlap – 50% Ext. Trigger Slope – Positive Trigger Level – 2 V Bin Zeroing – On Type – Time
Velocity – Performs a “standard” type acceleration to velocity vibration measurement. Measurement parameters are set to:
Units – A -> V Display Format – Spectrum High-pass frequency - 1.1 Hz Fmax - 1 kHz
Lines/Samples - 400 Lines Averages – 4 Input Channel – CH1 Overlap – 50%
Non ROUTE How to Collect Pre-set Non ROUTE Measurements
SKF Microlog - GX Series A - 5 User Manual
Ext. Trigger Slope – Positive Trigger Level – 2 V Bin Zeroing – On| Type - Spectral
gE – Performs a “standard” type enveloped acceleration vibration measurement. Measurement parameters are set to:
Units – Enveloped Acceleration Display Format – Spectrum Band pass frequency - gE BPF #3 (500 Hz – 10 kHz) Fmax - 10 kHz Lines/Samples - 400 Lines Averages – 4 Input Channel – CH1 Overlap – 50% Ext. Trigger Slope – Positive Trigger Level – 2 V Bin Zeroing – On Type - Spectral
Orbit – Measures the path of a shaft centerline motion during rotation. Parameters for Non ROUTE orbit measurements are configured in the Nonroute Orbit Setup screen, detailed later in this section.
HFD – Measures the dynamic high frequency input from an accelerometer for assessing the condition of rolling element ball or roller bearings. The HFD measurement has a detected overall value from 5 KHz to 60 KHz but does not record a spectrum. Detection type set to RMS.
To quickly perform one of the pre-set measurements:
• In the Non ROUTE screen, use the arrow buttons to highlight the desired pre-set measurement and press Enter. The selected measurement’s data display screen appears.
If you select the Orbit option, a setup screen displays.
• With the measurement’s data screen displayed, press an Enter button to save the Non ROUTE measurement’s data. Each Non ROUTE measurement is sequentially given a numerical name, starting at 1.
Orbit Operation
Orbit Overview
An “orbit” measures the path of a shaft centerline motion during rotation.
Typically, machines such as large centrifugal compressors, primary and secondary steam turbines, and large gearboxes do not have standby systems available and rarely have spare rotors available. Machinery that uses pressure fed sleeve bearings is normally both critical to plant operations and very expensive to repair. It is therefore essential that these rotors are effectively monitored, protected, and maintained to the highest standard.
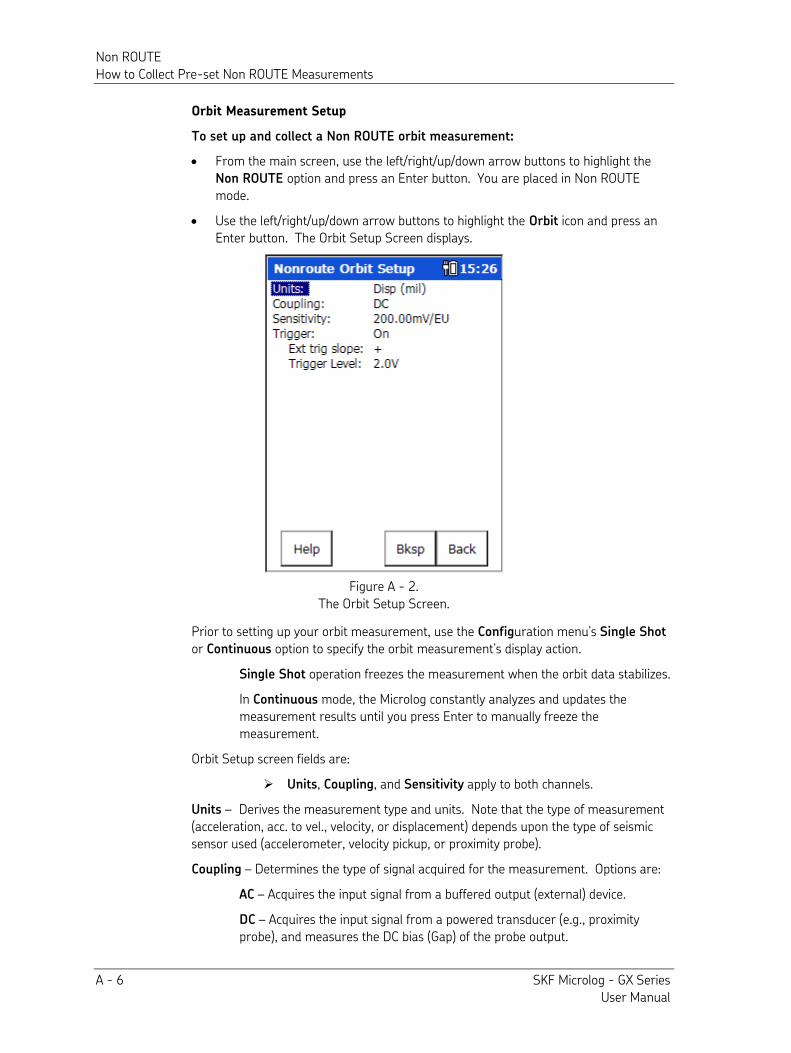
Non ROUTE How to Collect Pre-set Non ROUTE Measurements
A - 6 SKF Microlog - GX Series User Manual
Orbit Measurement Setup
To set up and collect a Non ROUTE orbit measurement:
• From the main screen, use the left/right/up/down arrow buttons to highlight the Non ROUTE option and press an Enter button. You are placed in Non ROUTE mode.
• Use the left/right/up/down arrow buttons to highlight the Orbit icon and press an Enter button. The Orbit Setup Screen displays.
Figure A - 2. The Orbit Setup Screen.
Prior to setting up your orbit measurement, use the Configuration menu’s Single Shot or Continuous option to specify the orbit measurement’s display action.
Single Shot operation freezes the measurement when the orbit data stabilizes.
In Continuous mode, the Microlog constantly analyzes and updates the measurement results until you press Enter to manually freeze the measurement.
Orbit Setup screen fields are: Units, Coupling, and Sensitivity apply to both channels.
Units – Derives the measurement type and units. Note that the type of measurement (acceleration, acc. to vel., velocity, or displacement) depends upon the type of seismic sensor used (accelerometer, velocity pickup, or proximity probe).
Coupling – Determines the type of signal acquired for the measurement. Options are: AC – Acquires the input signal from a buffered output (external) device.
DC – Acquires the input signal from a powered transducer (e.g., proximity probe), and measures the DC bias (Gap) of the probe output.
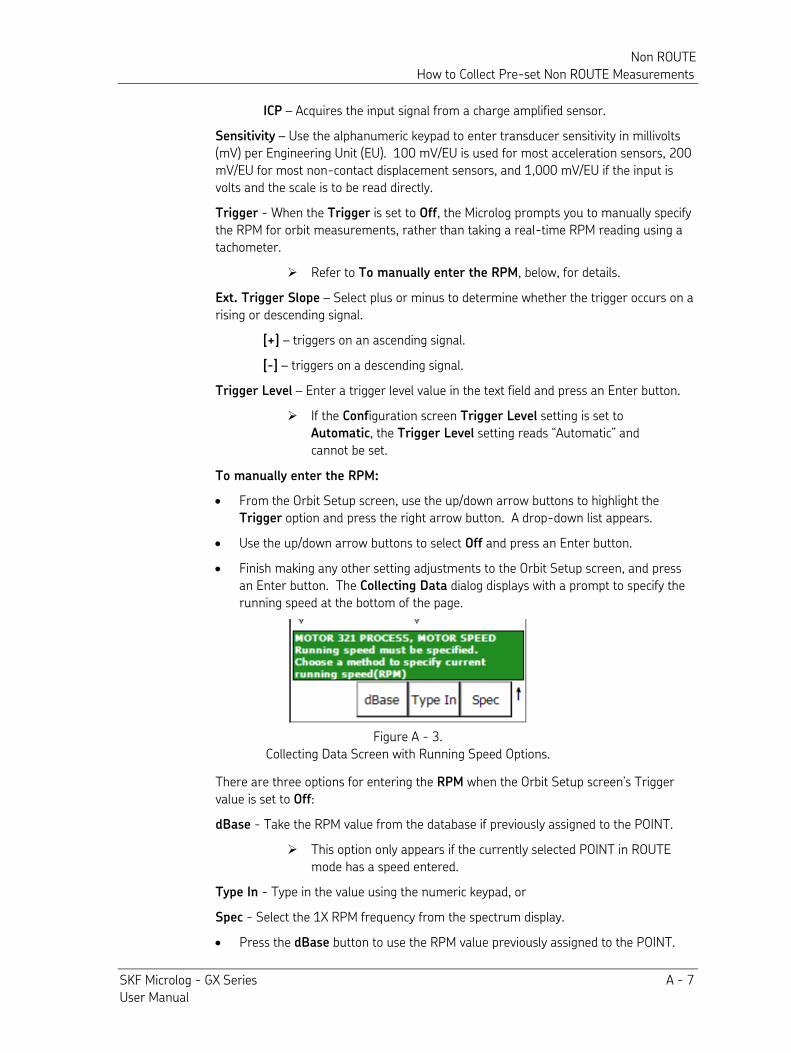
Non ROUTE How to Collect Pre-set Non ROUTE Measurements
SKF Microlog - GX Series A - 7 User Manual
ICP – Acquires the input signal from a charge amplified sensor.
Sensitivity – Use the alphanumeric keypad to enter transducer sensitivity in millivolts (mV) per Engineering Unit (EU). 100 mV/EU is used for most acceleration sensors, 200 mV/EU for most non-contact displacement sensors, and 1,000 mV/EU if the input is volts and the scale is to be read directly.
Trigger - When the Trigger is set to Off, the Microlog prompts you to manually specify the RPM for orbit measurements, rather than taking a real-time RPM reading using a tachometer.
Refer to To manually enter the RPM, below, for details.
Ext. Trigger Slope – Select plus or minus to determine whether the trigger occurs on a rising or descending signal.
[+] – triggers on an ascending signal.
[-] – triggers on a descending signal.
Trigger Level – Enter a trigger level value in the text field and press an Enter button.
If the Configuration screen Trigger Level setting is set to Automatic, the Trigger Level setting reads “Automatic” and cannot be set.
To manually enter the RPM:
• From the Orbit Setup screen, use the up/down arrow buttons to highlight the Trigger option and press the right arrow button. A drop-down list appears.
• Use the up/down arrow buttons to select Off and press an Enter button.
• Finish making any other setting adjustments to the Orbit Setup screen, and press an Enter button. The Collecting Data dialog displays with a prompt to specify the running speed at the bottom of the page.
Figure A - 3. Collecting Data Screen with Running Speed Options.
There are three options for entering the RPM when the Orbit Setup screen’s Trigger value is set to Off:
dBase - Take the RPM value from the database if previously assigned to the POINT. This option only appears if the currently selected POINT in ROUTE
mode has a speed entered.
Type In - Type in the value using the numeric keypad, or
Spec - Select the 1X RPM frequency from the spectrum display.
• Press the dBase button to use the RPM value previously assigned to the POINT.
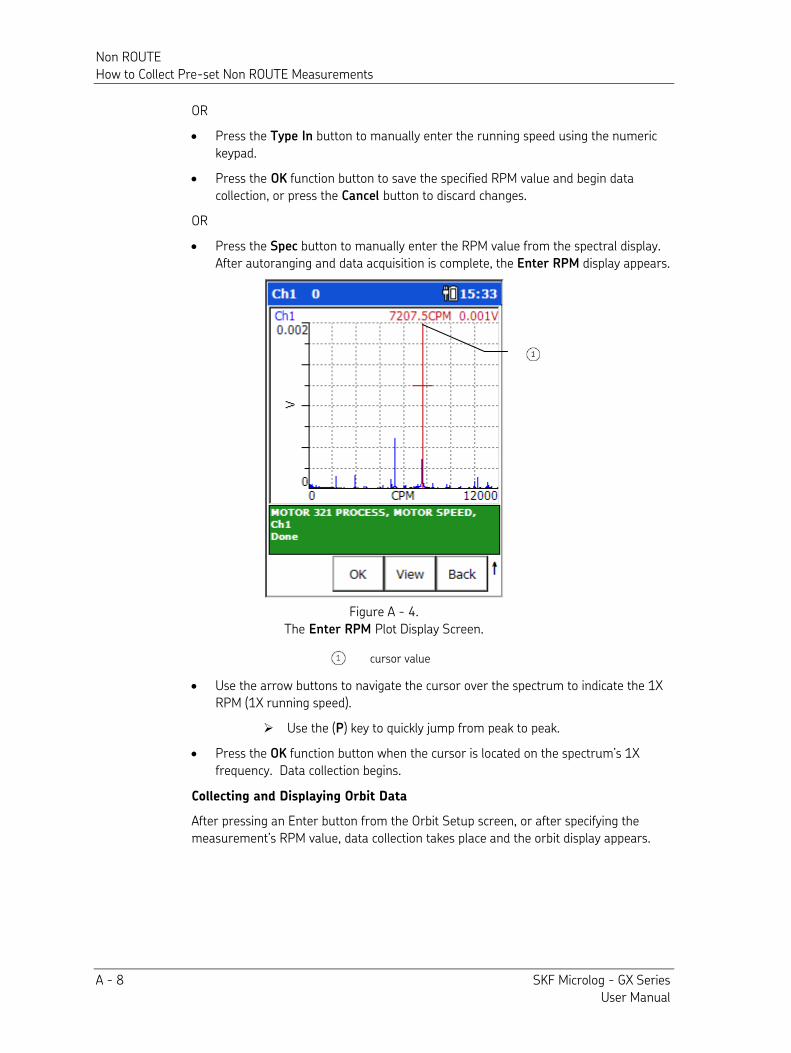
Non ROUTE How to Collect Pre-set Non ROUTE Measurements
A - 8 SKF Microlog - GX Series User Manual
OR
• Press the Type In button to manually enter the running speed using the numeric keypad.
• Press the OK function button to save the specified RPM value and begin data collection, or press the Cancel button to discard changes.
OR
• Press the Spec button to manually enter the RPM value from the spectral display. After autoranging and data acquisition is complete, the Enter RPM display appears.
Figure A - 4. The Enter RPM Plot Display Screen.
cursor value
• Use the arrow buttons to navigate the cursor over the spectrum to indicate the 1X RPM (1X running speed).
Use the (P) key to quickly jump from peak to peak.
• Press the OK function button when the cursor is located on the spectrum’s 1X frequency. Data collection begins.
Collecting and Displaying Orbit Data
After pressing an Enter button from the Orbit Setup screen, or after specifying the measurement’s RPM value, data collection takes place and the orbit display appears.
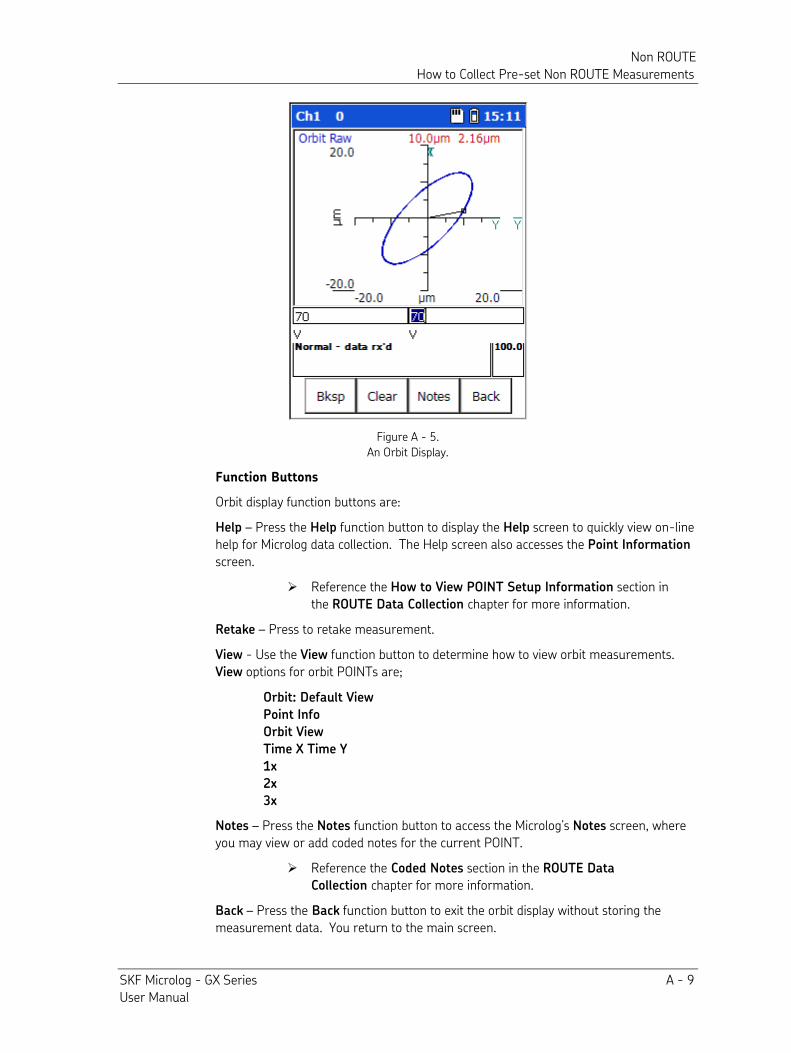
Non ROUTE How to Collect Pre-set Non ROUTE Measurements
SKF Microlog - GX Series A - 9 User Manual
Figure A - 5. An Orbit Display.
Function Buttons
Orbit display function buttons are:
Help – Press the Help function button to display the Help screen to quickly view on-line help for Microlog data collection. The Help screen also accesses the Point Information
screen.
Reference the How to View POINT Setup Information section in the ROUTE Data Collection chapter for more information.
Retake – Press to retake measurement.
View - Use the View function button to determine how to view orbit measurements. View options for orbit POINTs are;
Orbit: Default View
Point Info
Orbit View
Time X Time Y
1x
2x
3x
Notes – Press the Notes function button to access the Microlog’s Notes screen, where you may view or add coded notes for the current POINT.
Reference the Coded Notes section in the ROUTE Data
Collection chapter for more information.
Back – Press the Back function button to exit the orbit display without storing the measurement data. You return to the main screen.
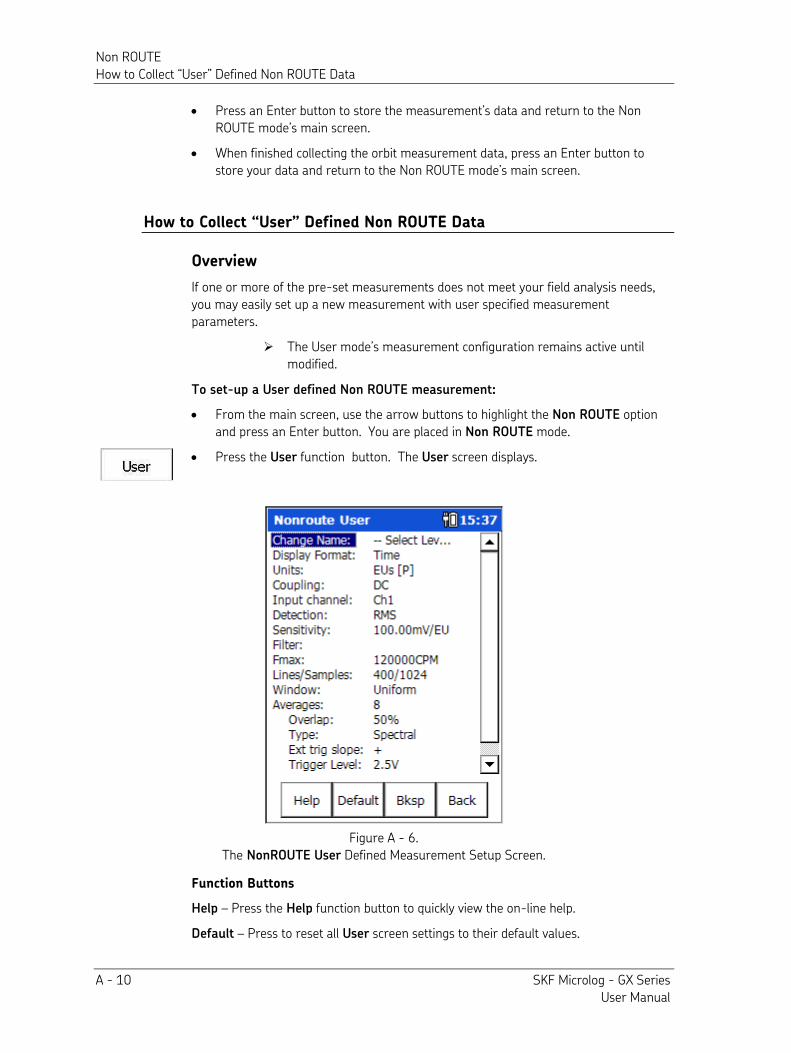
Non ROUTE How to Collect “User” Defined Non ROUTE Data
A - 10 SKF Microlog - GX Series User Manual
• Press an Enter button to store the measurement’s data and return to the Non ROUTE mode’s main screen.
• When finished collecting the orbit measurement data, press an Enter button to store your data and return to the Non ROUTE mode’s main screen.
How to Collect “User” Defined Non ROUTE Data
Overview
If one or more of the pre-set measurements does not meet your field analysis needs, you may easily set up a new measurement with user specified measurement parameters.
The User mode’s measurement configuration remains active until modified.
To set-up a User defined Non ROUTE measurement:
• From the main screen, use the arrow buttons to highlight the Non ROUTE option and press an Enter button. You are placed in Non ROUTE mode.
• Press the User function button. The User screen displays.
Figure A - 6. The NonROUTE User Defined Measurement Setup Screen.
Function Buttons
Help – Press the Help function button to quickly view the on-line help.
Default – Press to reset all User screen settings to their default values.
Non ROUTE How to Collect “User” Defined Non ROUTE Data
SKF Microlog - GX Series A - 11 User Manual
Backspace – When in a text entry field, such as the Change Name setting, use the Bksp button to erase the previous digit.
Back – Returns to the Non ROUTE mode main screen without collecting data or saving changes to your user defined measurement settings.
• On the User mode screen, set your desired measurement parameters and press an Enter button. Data collection immediately initiates for your user defined POINT.
User Defined Measurement Options
Navigate and select your user defined measurement parameters using the same setup screen navigation procedures described earlier.
To specify your measurement’s parameters:
• Use the up/down arrows to scroll through the fields and their current settings.
• Press the right arrow button to view options for fields you wish to alter.
• If several options are available, a drop-down list appears. Use the up/down arrows to scroll through the drop-down list, and press Enter to select the highlighted option.
• When finished setting all your measurement parameters, press an Enter button to initiate data collection.
User Defined Measurement Options
Change Name – Enables you to enter an identifying name for the new measurement POINT, for reference in the Microlog’s Review mode and when uploaded to your @ptitude Analyst host software.
You may specify the Machine name, POINT name, and Description. • Select the item you wish to name and press an Enter button. A text entry dialog
displays at the bottom of the screen. The title of the dialog indicates the name of the element you are configuring (Machine, Point, or Description).
• Press the alphanumeric key the appropriate number of times to display each letter. For example, to type a B, press the 2 key three times. (One press displays 2, two presses display A, and three presses display B.)
Press the zero key twice to type a “space.”
Use quick key presses for the most effective typing.
• Repeat for each element you wish to name.
Display Format – Determines how to display the measurement’s data. Options are: Spectrum + Time
Spectrum
Time
Phase
Orders + Time
Orders
Non ROUTE How to Collect “User” Defined Non ROUTE Data
A - 12 SKF Microlog - GX Series User Manual
Orders sets the horizontal axis of the spectrum display in orders (multiples of running speed). Orders requires an external 1XRPM trigger that is phase referenced to the rotating shaft.
Units – Derives the measurement type and units. Note that the type of measurement (acceleration, acc. to vel., velocity, displacement, volts, pressure, or enveloped acceleration) depends upon the type of seismic sensor used (accelerometer, velocity pickup, or proximity probe).
Coupling – Determines the type of signal acquired for the measurement. Options are: AC – Acquires the input signal from a buffered output (external) device. No power is applied to the input by the Microlog. DC – Acquires the input signal without using a charge-amplified sensor. No power is applied to the input by the Microlog. ICP – Acquires the input signal from a charge amplified sensor. 4 mA constant current is supplied to the input by the Microlog.
Input Channel – Choose from CH1, CH2, CH3, CH1 & CH2, CH2 & CH3, or CH1&CH2&CH3 A channel is a single point of monitoring, including the sensor and the hardware needed to condition the input signal and to compare the input signal to pre-determined setpoints.
For measurements taken with a Triax sensor, select CH1 & CH2
& CH3.
For more details on multi-channel measurements, refer to How
to Set Up Multi-Spectrum / Multi-Time Measurements, later in this chapter.
Channel 1 = POINT.1_2 Channel 1 Channel 2 = POINT.1_2 Channel 2 Channel 3 = POINT.3_4 Channel 1
Detection – Determines signal detection and scaling.
Choose from:
RMS – The Root Mean Squared overall calculated from the FFT or time data. Peak – Scaled from RMS as √2 ⋅ RMS. Pk-Pk – Scaled from RMS as 2 ⋅ √2 ⋅ RMS. True Peak – Detected from the time waveform rather than the FFT spectrum as ½ (max Pk. – min Pk.). True Pk-Pk – Detected from the time waveform rather than the FFT spectrum as (max Pk. – min Pk.).
Use the following table to determine which Peak or Pk-Pk setting will match the CMVA65, CMVA55, CMVA40, and CMVA30’s detection method for the same POINT type:
Non ROUTE How to Collect “User” Defined Non ROUTE Data
SKF Microlog - GX Series A - 13 User Manual
POINT Type CMVA65
Detection
Microlog Detection
Enveloped acceleration, displacement (non-
integrated), volts
Peak or Pk-Pk True Peak or True Pk-Pk
All others Peak or Pk-Pk Peak or Pk-Pk
Sensitivity – Use the alphanumeric keypad to enter transducer sensitivity in millivolts (mv) per Engineering Unit (EU). 100 mV/EU is used for most acceleration sensors, 200 mV/EU for most non contact displacement sensors, and 1,000 mV/EU if the input is volts and the scale is to be read directly.
Filter – The drop-down list displays three types of filter settings, High-pass filter settings, Enveloper Band pass filter settings and the HFD measurement setting. The Microlog’s real analog High-pass filter affects both the time and FFT domains.
Selecting Off when you have ICP or AC coupling will cause the unit to default to an intrinsic high-pass filter value of .16 Hz. This eliminates only very low frequency components.
The Microlog’s High-pass filter filters the time domain with a real analog filter, which attenuates based on the selected value. Choose one of the 7 discrete values.
• When setting up a measurement other than an enveloped acceleration
measurement. The range for normal measurements is from approximately 200 CPM to 600 CPM, or the equivalent in Hz.
• With enveloped acceleration measurements, the enveloping process automatically performs a low frequency cut off.
Fmax – Use the alphanumeric keypad to enter the FFT upper full-scale frequency, up to 40,000 Hz (2,400,000 CPM). Unless you are making a very unusual measurement, the Fmax setting should always be greater than running speed.
Fmax values entered are adjusted to the next highest valid Fmax value available in the Microlog. The adjusted (actual) value appears on the collected spectrum’s y-axis.
Lines/Samples – Determines the resolution of the spectrum. Note increased resolution requires increased time for data collection and consumes more storage memory.
Frequency range
= frequency segment size
lines resolution
Non ROUTE How to Collect “User” Defined Non ROUTE Data
A - 14 SKF Microlog - GX Series User Manual
1,000 Hz
= 2.5 Hz
400 lines
For example, if you choose 400 lines and a frequency range from 0 to 1,000 Hz, the basic resolution of the spectrum will be 1,000 divided by 400 or 2.5 Hz. This specifies that the frequency axis is divided into 400 segments spaced 2.5 Hz apart.
Window – The type of window used in the FFT processing. A window function must be applied to any periodic time record prior to performing an FFT to minimize leakage errors. The Hanning and Flat Top window functions attenuate to zero both the leading and trailing edges of the time domain buffer (to prevent leakage error caused by discontinuities in the time record). Press the right arrow to view the choices:
Hanning - A dynamic signal analyzer window function that provides better frequency resolution than Flat Top, but with reduced amplitude accuracy. Useful for machine vibration measurements, general purpose measurements, and measurements containing random noise.
Flat Top - A dynamic signal analyzer window function, which provides the best amplitude accuracy for measuring discrete frequency components. Useful for calibration or machine vibration measurements using displacement probes in fluid film bearings.
Uniform – A dynamic signal analyzer window function with uniform weighting across time. Useful for measuring transients or mechanical response measurements and in tracking mode.
Averages – Determines the number of average samples taken for the measurement. Enter the number of FFT averages to be collected (from 1 to 4096). Four to six averages are adequate and are normally used for machine monitoring. The higher the number of averages, the slower the data collection.
Overlap – Overlap processing is advantageous when the time required to gather a time record is much longer than the time needed to calculate an FFT spectrum. In the Microlog, this occurs at frequencies below 1,000 Hz (60,000 CPM). For lower frequencies, the amount of overlap can be increased to reduce the time required to collect a given number of averages. Recognize, however, that the greater the overlap, the more information shared between averages. Overlap processing is used to obtain enough new ensemble data for an accurate average. If the maximum frequency is low and the FFT process time is fast, the average sum would include a high percent of old data with maximum overlap.
Below 2 kHz, 50% overlap and six averages is a reasonable ROUTE setup.
• Enter a value in the text field and press an Enter button.
Type – Choose from the following average types:
Spectral – The summation of the magnitude of each spectral line is divided by the total number of averages (ensemble averaging). This is the most frequently used method of averaging for routine data collection and analysis.
Non ROUTE How to Set Up HFD Measurements
SKF Microlog - GX Series A - 15 User Manual
Time Synchronous – Averaging in the time domain. This method of averaging requires a reference trigger. Components within the signal that are synchronous with the reference trigger are reinforced, while noise quickly averages out. Synchronous time domain averaging produces the most improvement in signal to noise ratio, and is advantageous whenever it is deemed necessary to extract very low amplitude signals, or to minimize the “noise” produced by the vibration of other machines nearby. When this averaging method is selected, the spectrum displayed is the FFT of the averaged synchronous time domain samples.
Peak Hold – Peak Hold holds the highest value received at each spectral line during the averaging time. This method of averaging is very useful when the signal contains a great deal of amplitude variation and the primary objective of the analysis is to see the maximum reached by each component.
For time waveforms, Average Type:Average and Average
Type:Pk Hold are not recommended. Use Average Type:Time
Sync instead.
Ext. trig. slope – Select plus or minus to determine whether the trigger occurs on a rising or descending signal.
[+] – triggers on an ascending signal.
[–] – triggers on a descending signal.
Trigger Level – Enter a trigger level value in the text field and press an Enter button.
If the Configuration screen Trigger Level setting is set to Automatic, the Trigger Level setting reads “Automatic” and cannot be set.
Bin Zeroing – Works in conjunction with the High Pass Filter setting. Choose from:
On – Zeroes everything out below the High Pass Filter setting in the FFT.
It is recommended that you set Bin Zeroing to On, in order to comply with the CMVA65 Microlog’s Low Frequency Cut-off parameter.
Off – The device does not zero out all recorded FFT values beneath the selected High Pass Filter value.
How to Set Up HFD Measurements
The GX Series Microlog supports dHFD measurements (d High Frequency Detection). dHFD is an emulation of HFD measurements supported by the CMVA65 Microlog. Note that, because of differences between the CMVA and CMXA platforms, not all signals will produce identical HFD (CMVA) and dHFD (GX) readings.
ROUTE dHFD POINTs – When collecting ROUTE data on the Microlog, any HFD POINTs downloaded from @ptitude Analyst software are automatically converted to dHFD POINTs (either RMS or Peak detection).
Non ROUTE How to Set Up Multi-Channel Measurements
A - 16 SKF Microlog - GX Series User Manual
Setting up Non ROUTE dHFD POINTs
To set up Non ROUTE dHFD POINTs:
• Set Units to gE.
• Set Filter to HFD.
• Set Detection to either RMS or True Peak. Other Detection settings produce repeatable dHFD readings, but will not necessarily match readings obtained from ROUTE POINTs.
How to Set Up Multi-Channel Measurements
Multi-channel measurements allow you to monitor shaft orbits, multi-spectrum, multi-time, and cross-channel phase measurements for Non ROUTE measurements. These measurements can be triggered or non-triggered. In non-triggered mode, you can either type in the required RPM value or specify running speed from the spectral display.
For all multi-channel measurements, you may choose to display the trace for any of the monitored channels, or for all channels simultaneously.
Multi Channel Measurement Options Overview
Orbit CH1 time vs. Ch2 time, unfiltered or order-filtered (up to 8 orders), plus DC gap
measurement
Multi-Spectrum Spectra of all input channels captured and displayed simultaneously
Multi-Time Time waveforms of all input channels captured
and displayed simultaneously
Cross-Channel Phase Phase of input CH1 relative to input CH2: Both spectra are stored and phase is displayed as a
table of magnitude/phase pairs with up to 8 orders.
Multi-channel Orbit measurements were described in the How to
Collect Pre-set Non ROUTE Measurements section of this chapter.
Non ROUTE How to Set Up Multi-Channel Measurements
SKF Microlog - GX Series A - 17 User Manual
Microlog Setup
The Microlog supports up to three-channel measurements using the two Fischer connectors and the USB Host connector at the top of the unit.
Refer to the Connector Details section in the Introduction to the SKF GX Series Microlog chapter for pin-out details.
CH1 Fischer Connector CH2 Fischer Connector USB Host Connector
Channel 1 – –
Channel 2 Channel 2 –
Channel 3 Channel 3 –
Channel 4 – Channel 4
Two-channel measurements are supported using a sensor connected to the CH1 connector and another sensor to the CH2 connector to take measurements on Channels 1 and 2, respectively.
Three-channel measurements are supported using a Triax sensor on the CH1 connector.
Measurement Setup
To set up and collect Non ROUTE multi- spectrum/time measurements:
Prior to setting up your multi spectrum/time measurement, use the Configuration menu’s Single Shot or Continuous option to specify the measurement’s display action.
• From the main screen, use the left/right/up/down arrow buttons to select the Non
ROUTE option. You are placed in Non ROUTE mode.
• Press the User function button. The Non ROUTE “user defined measurement” setup screen displays.
• Use the up/down arrow buttons to highlight the Display Format option and press the right arrow button. A drop-down list displays.
• Use the up/down arrow buttons to select either Spectrum, Time, or Spectrum +
Time and press an Enter button once.
• Use the up/down arrow buttons to highlight the Input Channel option and press the right arrow button. A drop down list displays.
• Use the up/down arrow buttons to specify your input channels, CH1 & CH2, CH2 &
CH3, or CH1 & CH2 & CH3, and press an Enter button.
• Configure other User Setup screen parameters as described above.
• Press an Enter button to begin data collection.
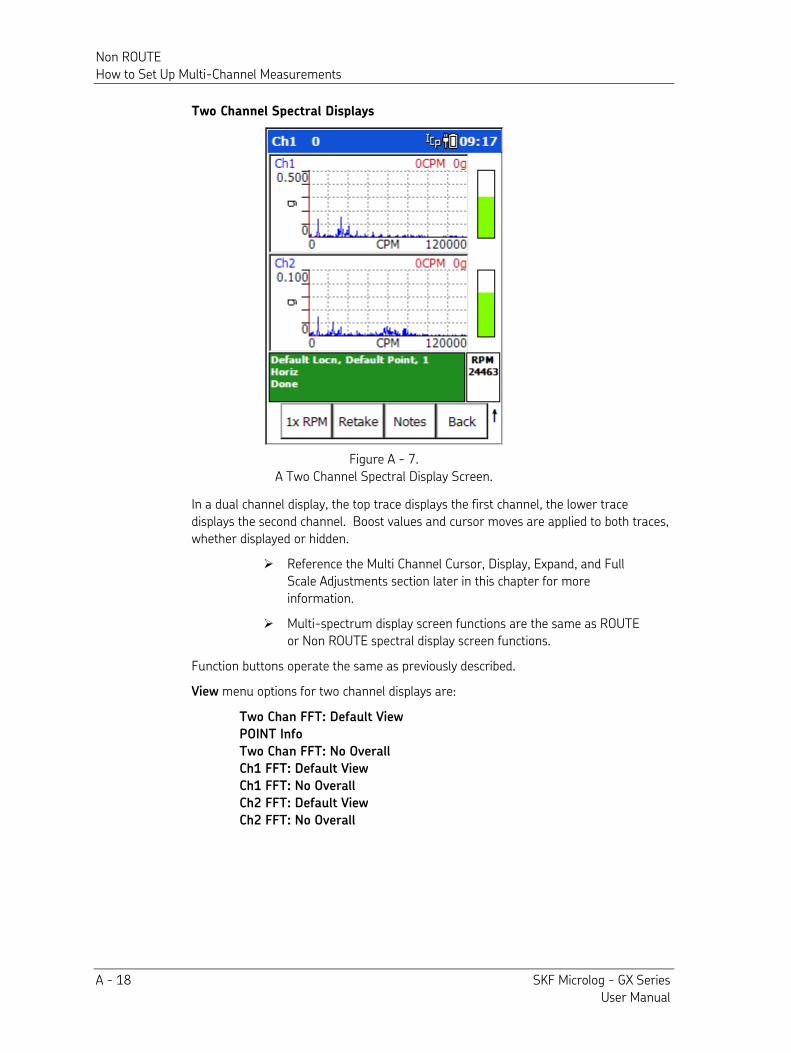
Non ROUTE How to Set Up Multi-Channel Measurements
A - 18 SKF Microlog - GX Series User Manual
Two Channel Spectral Displays
Figure A - 7. A Two Channel Spectral Display Screen.
In a dual channel display, the top trace displays the first channel, the lower trace displays the second channel. Boost values and cursor moves are applied to both traces, whether displayed or hidden.
Reference the Multi Channel Cursor, Display, Expand, and Full Scale Adjustments section later in this chapter for more information.
Multi-spectrum display screen functions are the same as ROUTE or Non ROUTE spectral display screen functions.
Function buttons operate the same as previously described.
View menu options for two channel displays are:
Two Chan FFT: Default View
POINT Info
Two Chan FFT: No Overall
Ch1 FFT: Default View
Ch1 FFT: No Overall
Ch2 FFT: Default View
Ch2 FFT: No Overall
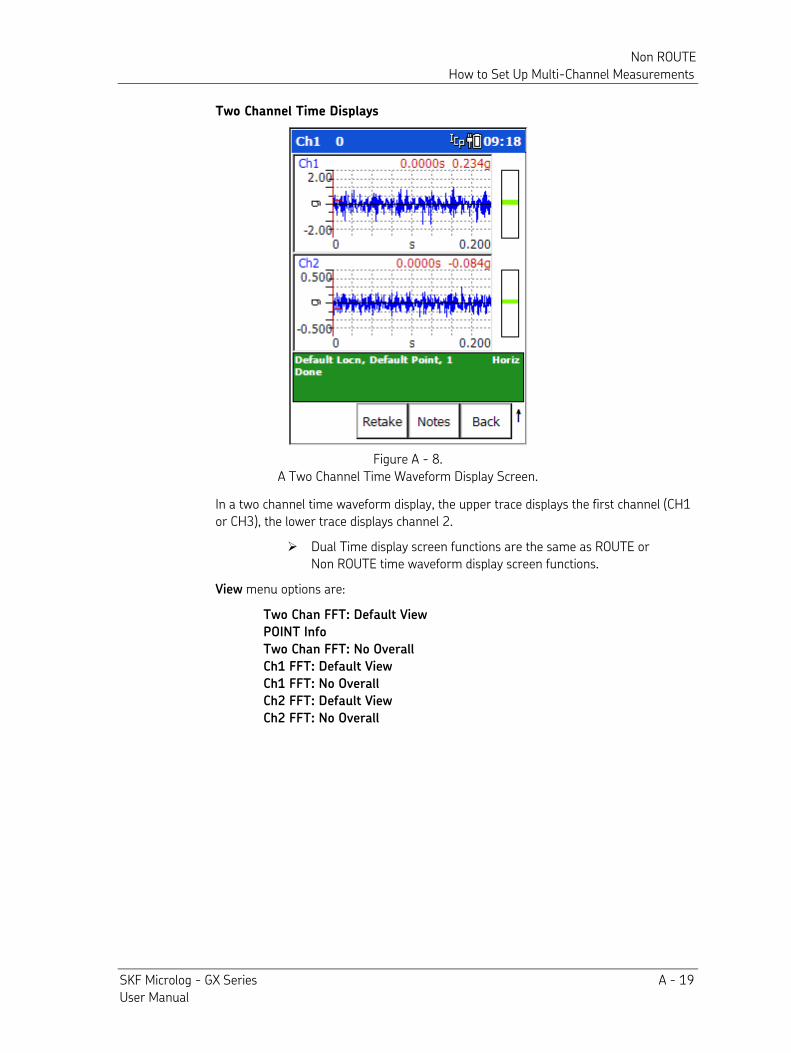
Non ROUTE How to Set Up Multi-Channel Measurements
SKF Microlog - GX Series A - 19 User Manual
Two Channel Time Displays
Figure A - 8. A Two Channel Time Waveform Display Screen.
In a two channel time waveform display, the upper trace displays the first channel (CH1 or CH3), the lower trace displays channel 2.
Dual Time display screen functions are the same as ROUTE or Non ROUTE time waveform display screen functions.
View menu options are:
Two Chan FFT: Default View
POINT Info
Two Chan FFT: No Overall
Ch1 FFT: Default View
Ch1 FFT: No Overall
Ch2 FFT: Default View
Ch2 FFT: No Overall
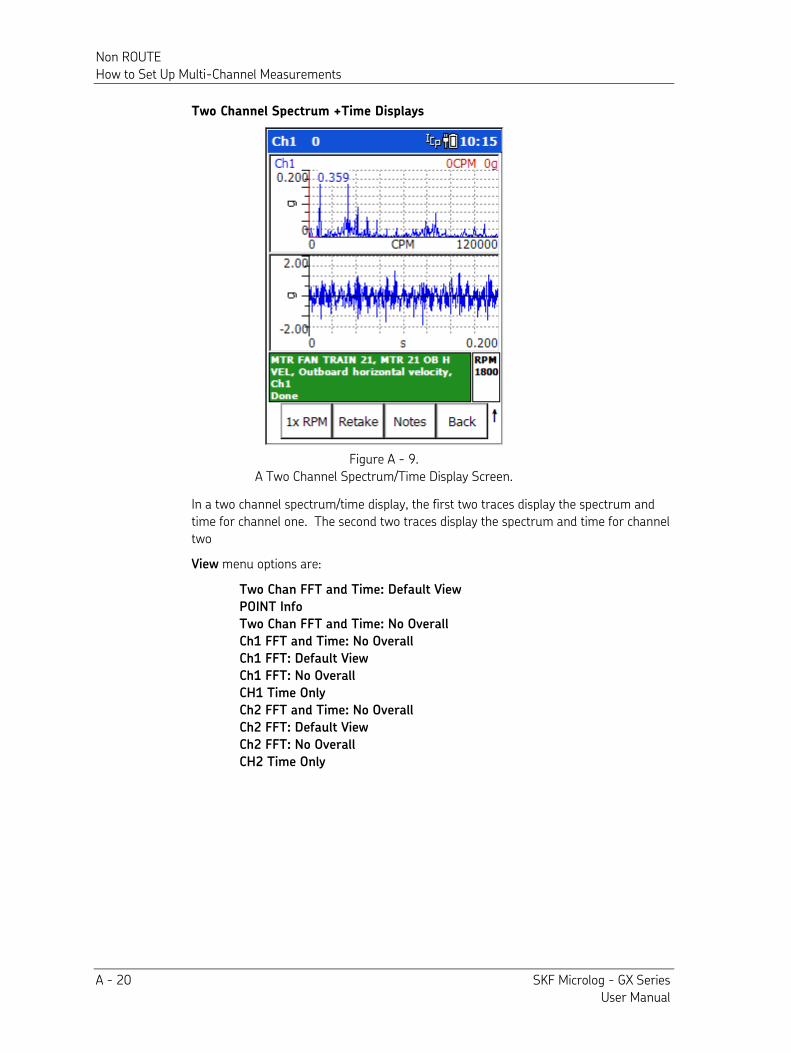
Non ROUTE How to Set Up Multi-Channel Measurements
A - 20 SKF Microlog - GX Series User Manual
Two Channel Spectrum +Time Displays
Figure A - 9. A Two Channel Spectrum/Time Display Screen.
In a two channel spectrum/time display, the first two traces display the spectrum and time for channel one. The second two traces display the spectrum and time for channel two
View menu options are:
Two Chan FFT and Time: Default View
POINT Info
Two Chan FFT and Time: No Overall
Ch1 FFT and Time: No Overall
Ch1 FFT: Default View
Ch1 FFT: No Overall
CH1 Time Only
Ch2 FFT and Time: No Overall
Ch2 FFT: Default View
Ch2 FFT: No Overall
CH2 Time Only
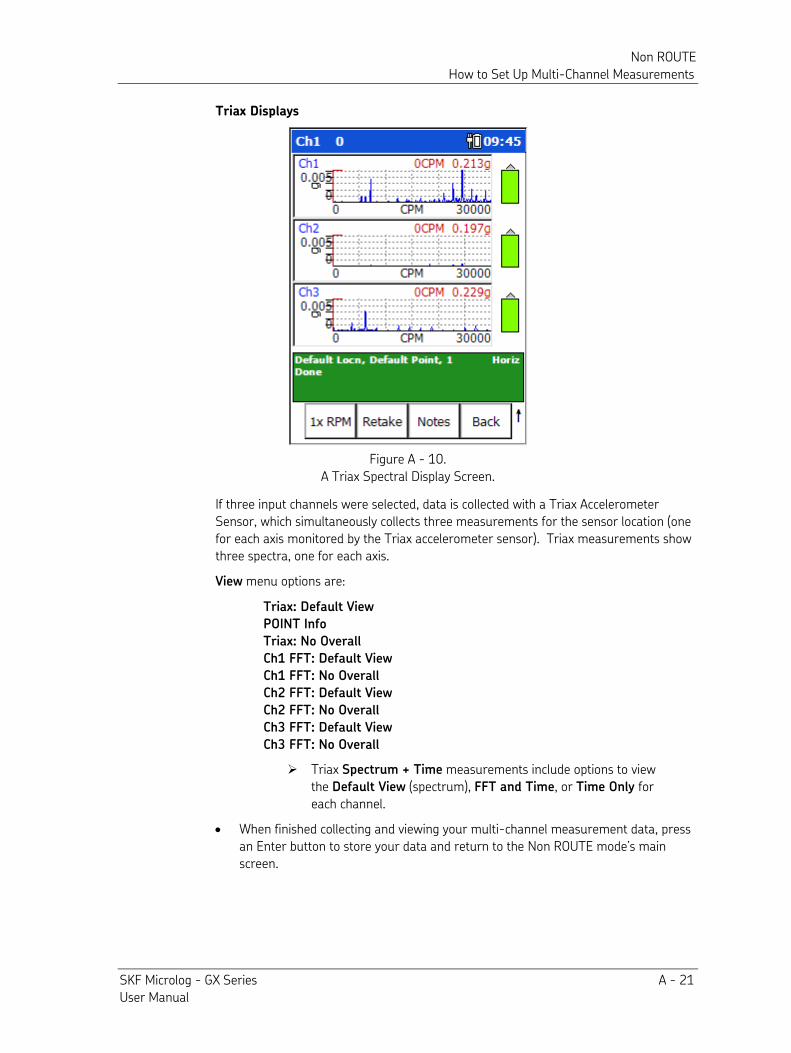
Non ROUTE How to Set Up Multi-Channel Measurements
SKF Microlog - GX Series A - 21 User Manual
Triax Displays
Figure A - 10. A Triax Spectral Display Screen.
If three input channels were selected, data is collected with a Triax Accelerometer Sensor, which simultaneously collects three measurements for the sensor location (one for each axis monitored by the Triax accelerometer sensor). Triax measurements show three spectra, one for each axis.
View menu options are:
Triax: Default View
POINT Info
Triax: No Overall
Ch1 FFT: Default View
Ch1 FFT: No Overall
Ch2 FFT: Default View
Ch2 FFT: No Overall
Ch3 FFT: Default View
Ch3 FFT: No Overall
Triax Spectrum + Time measurements include options to view the Default View (spectrum), FFT and Time, or Time Only for each channel.
• When finished collecting and viewing your multi-channel measurement data, press an Enter button to store your data and return to the Non ROUTE mode’s main screen.
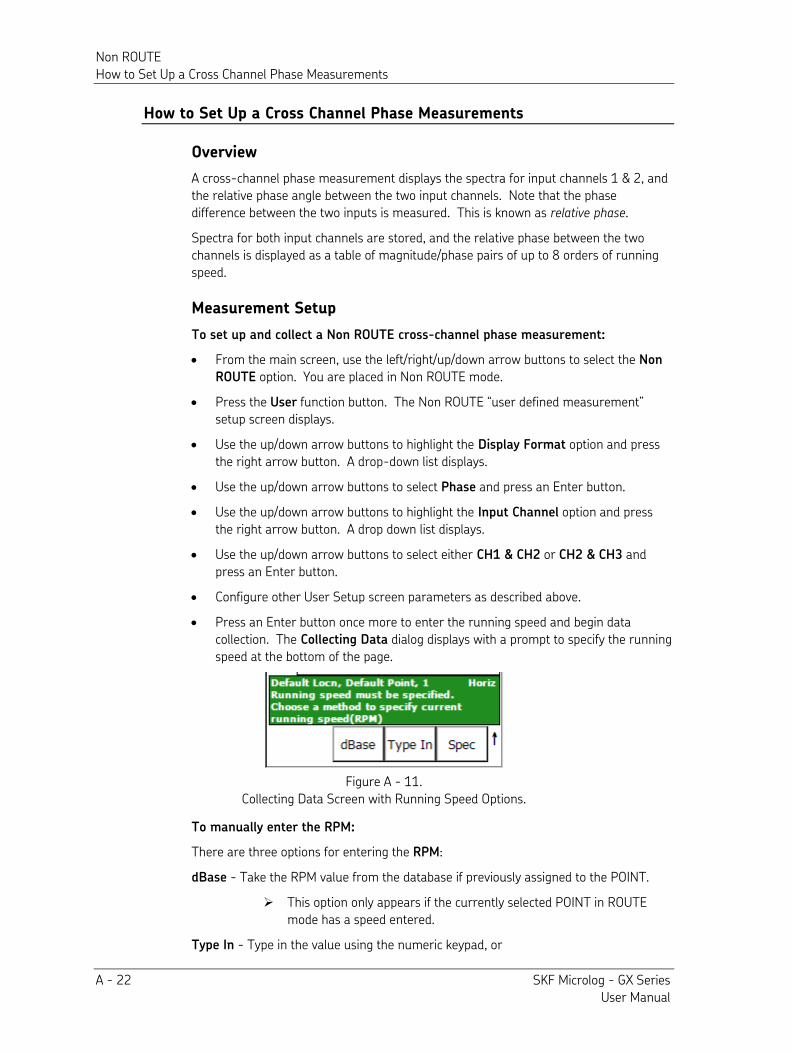
Non ROUTE How to Set Up a Cross Channel Phase Measurements
A - 22 SKF Microlog - GX Series User Manual
How to Set Up a Cross Channel Phase Measurements
Overview
A cross-channel phase measurement displays the spectra for input channels 1 & 2, and the relative phase angle between the two input channels. Note that the phase difference between the two inputs is measured. This is known as relative phase.
Spectra for both input channels are stored, and the relative phase between the two channels is displayed as a table of magnitude/phase pairs of up to 8 orders of running speed.
Measurement Setup
To set up and collect a Non ROUTE cross-channel phase measurement:
• From the main screen, use the left/right/up/down arrow buttons to select the Non
ROUTE option. You are placed in Non ROUTE mode.
• Press the User function button. The Non ROUTE “user defined measurement” setup screen displays.
• Use the up/down arrow buttons to highlight the Display Format option and press the right arrow button. A drop-down list displays.
• Use the up/down arrow buttons to select Phase and press an Enter button.
• Use the up/down arrow buttons to highlight the Input Channel option and press the right arrow button. A drop down list displays.
• Use the up/down arrow buttons to select either CH1 & CH2 or CH2 & CH3 and press an Enter button.
• Configure other User Setup screen parameters as described above.
• Press an Enter button once more to enter the running speed and begin data collection. The Collecting Data dialog displays with a prompt to specify the running speed at the bottom of the page.
Figure A - 11. Collecting Data Screen with Running Speed Options.
To manually enter the RPM:
There are three options for entering the RPM:
dBase - Take the RPM value from the database if previously assigned to the POINT. This option only appears if the currently selected POINT in ROUTE
mode has a speed entered.
Type In - Type in the value using the numeric keypad, or
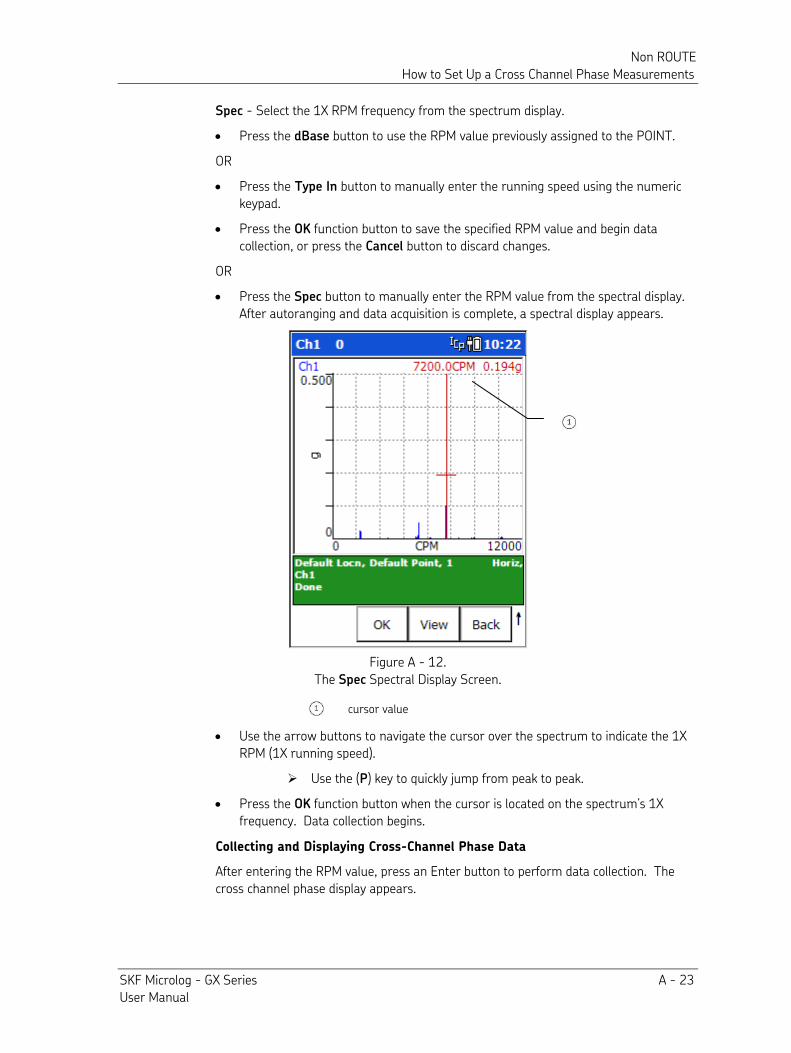
Non ROUTE How to Set Up a Cross Channel Phase Measurements
SKF Microlog - GX Series A - 23 User Manual
Spec - Select the 1X RPM frequency from the spectrum display.
• Press the dBase button to use the RPM value previously assigned to the POINT. OR
• Press the Type In button to manually enter the running speed using the numeric keypad.
• Press the OK function button to save the specified RPM value and begin data collection, or press the Cancel button to discard changes.
OR
• Press the Spec button to manually enter the RPM value from the spectral display. After autoranging and data acquisition is complete, a spectral display appears.
Figure A - 12. The Spec Spectral Display Screen.
cursor value
• Use the arrow buttons to navigate the cursor over the spectrum to indicate the 1X RPM (1X running speed).
Use the (P) key to quickly jump from peak to peak.
• Press the OK function button when the cursor is located on the spectrum’s 1X frequency. Data collection begins.
Collecting and Displaying Cross-Channel Phase Data
After entering the RPM value, press an Enter button to perform data collection. The cross channel phase display appears.
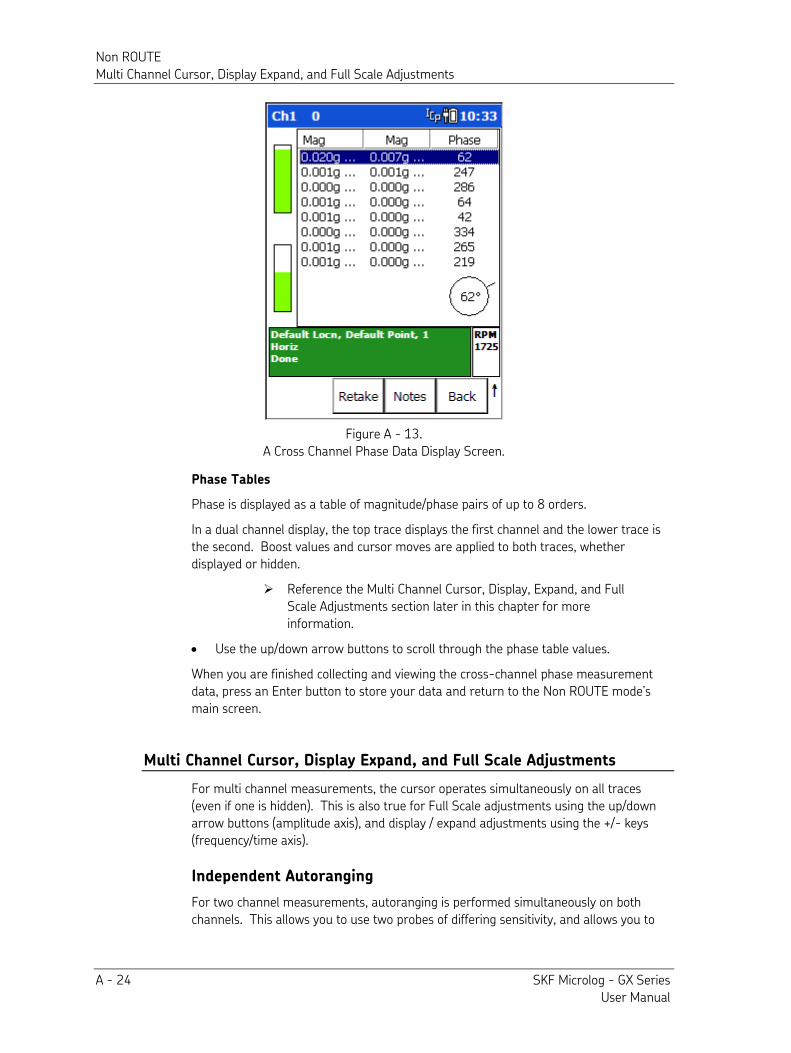
Non ROUTE Multi Channel Cursor, Display Expand, and Full Scale Adjustments
A - 24 SKF Microlog - GX Series User Manual
Figure A - 13. A Cross Channel Phase Data Display Screen.
Phase Tables
Phase is displayed as a table of magnitude/phase pairs of up to 8 orders.
In a dual channel display, the top trace displays the first channel and the lower trace is the second. Boost values and cursor moves are applied to both traces, whether displayed or hidden.
Reference the Multi Channel Cursor, Display, Expand, and Full Scale Adjustments section later in this chapter for more information.
• Use the up/down arrow buttons to scroll through the phase table values.
When you are finished collecting and viewing the cross-channel phase measurement data, press an Enter button to store your data and return to the Non ROUTE mode’s main screen.
Multi Channel Cursor, Display Expand, and Full Scale Adjustments
For multi channel measurements, the cursor operates simultaneously on all traces (even if one is hidden). This is also true for Full Scale adjustments using the up/down arrow buttons (amplitude axis), and display / expand adjustments using the +/- keys (frequency/time axis).
Independent Autoranging
For two channel measurements, autoranging is performed simultaneously on both channels. This allows you to use two probes of differing sensitivity, and allows you to
Non ROUTE How to Review Non ROUTE Measurement Data
SKF Microlog - GX Series A - 25 User Manual
analyze two axes of differing amplitudes while ensuring optimum gain setting for each channel.
In all cases, the same filters, integrator, and Fmax are used on both channels. However, input range and coupling are independent. For cross-channel phase, dual time and dual spectrum measurements, if the collection specification is "Overall and Spectrum or Overall Only" then the overall value shall be calculated from the spectrum as an RSS overall: there is no support for two channel analog overalls.
Triggerless Operation
Most two channel measurements use a trigger to establish running speed. However, as previously stated, the running speed can be manually entered, or taken from a spectrum by positioning the cursor on the 1X spectral peak. Reference the Orbit
Operation, Dual Spectrum/Dual Time Operation, or Cross-Channel Phase Operation sections for more information on triggerless operation applications.
Orbits typically require a trigger, else the display shows a random moving cursor around the trace and has no useful meaning. Therefore, the cursor is not displayed when operating in triggerless mode with orbits. With orbits, the specified RPM value is used to set both the Fmax and the frequency used to configure the orbit input filters.
How to Review Non ROUTE Measurement Data
Non ROUTE measurement data can be reviewed in a similar manner to ROUTE data. To review Non ROUTE measurement data:
• From the Nonroute screen, press the Review function button. The Review Data screen displays.
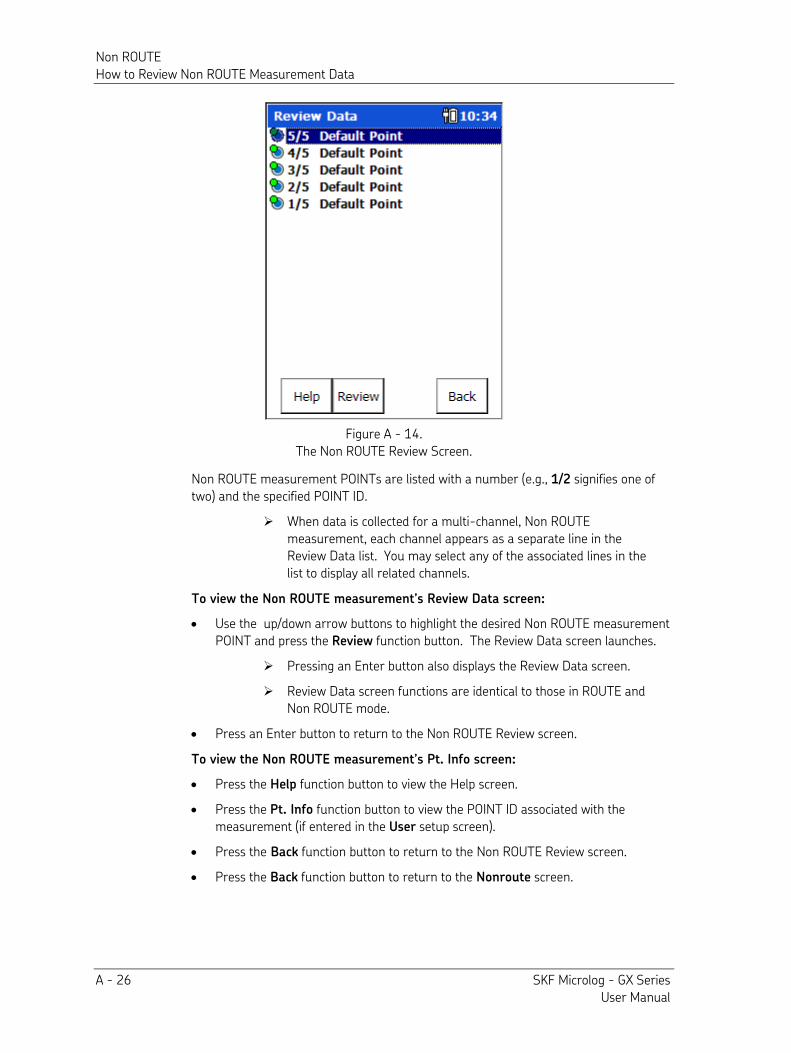
Non ROUTE How to Review Non ROUTE Measurement Data
A - 26 SKF Microlog - GX Series User Manual
Figure A - 14. The Non ROUTE Review Screen.
Non ROUTE measurement POINTs are listed with a number (e.g., 1/2 signifies one of two) and the specified POINT ID.
When data is collected for a multi-channel, Non ROUTE measurement, each channel appears as a separate line in the Review Data list. You may select any of the associated lines in the list to display all related channels.
To view the Non ROUTE measurement’s Review Data screen:
• Use the up/down arrow buttons to highlight the desired Non ROUTE measurement POINT and press the Review function button. The Review Data screen launches.
Pressing an Enter button also displays the Review Data screen.
Review Data screen functions are identical to those in ROUTE and Non ROUTE mode.
• Press an Enter button to return to the Non ROUTE Review screen.
To view the Non ROUTE measurement’s Pt. Info screen:
• Press the Help function button to view the Help screen.
• Press the Pt. Info function button to view the POINT ID associated with the measurement (if entered in the User setup screen).
• Press the Back function button to return to the Non ROUTE Review screen.
• Press the Back function button to return to the Nonroute screen.
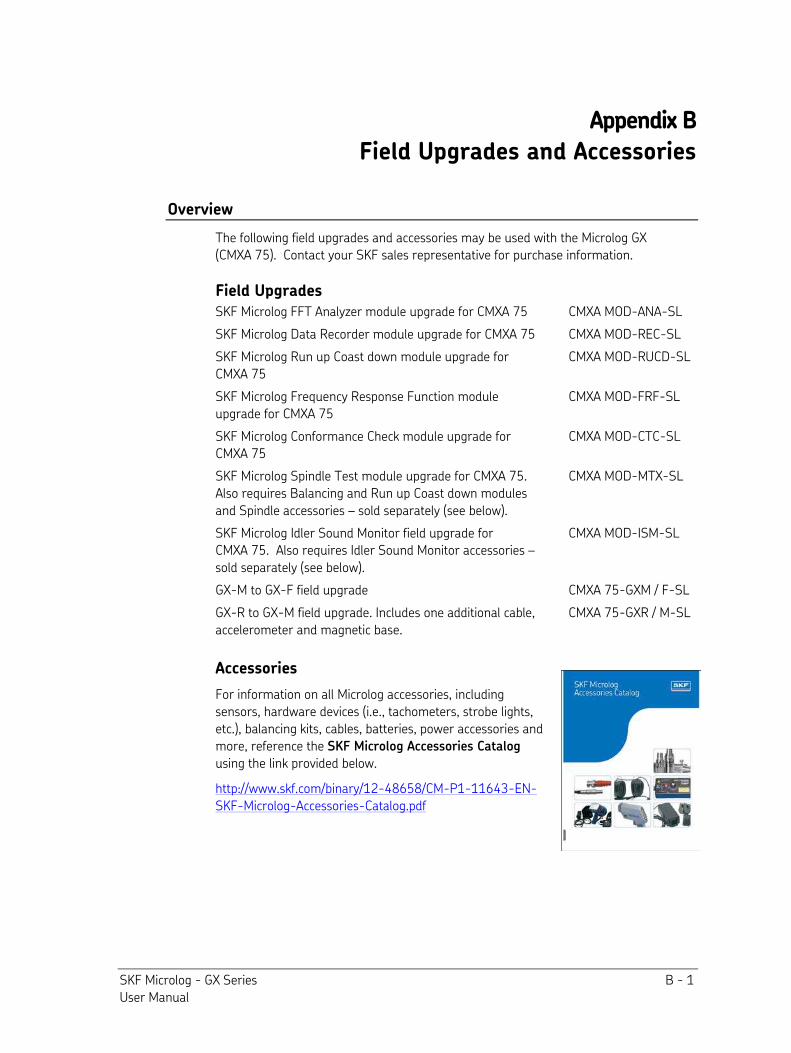
SKF Microlog - GX Series B - 1 User Manual
Appendix B
Field Upgrades and Accessories
Overview
The following field upgrades and accessories may be used with the Microlog GX (CMXA 75). Contact your SKF sales representative for purchase information.
Field Upgrades SKF Microlog FFT Analyzer module upgrade for CMXA 75 CMXA MOD-ANA-SL
SKF Microlog Data Recorder module upgrade for CMXA 75 CMXA MOD-REC-SL
SKF Microlog Run up Coast down module upgrade for CMXA 75
CMXA MOD-RUCD-SL
SKF Microlog Frequency Response Function module upgrade for CMXA 75
CMXA MOD-FRF-SL
SKF Microlog Conformance Check module upgrade for CMXA 75
CMXA MOD-CTC-SL
SKF Microlog Spindle Test module upgrade for CMXA 75. Also requires Balancing and Run up Coast down modules and Spindle accessories – sold separately (see below).
CMXA MOD-MTX-SL
SKF Microlog Idler Sound Monitor field upgrade for CMXA 75. Also requires Idler Sound Monitor accessories – sold separately (see below).
CMXA MOD-ISM-SL
GX-M to GX-F field upgrade CMXA 75-GXM / F-SL
GX-R to GX-M field upgrade. Includes one additional cable, accelerometer and magnetic base.
CMXA 75-GXR / M-SL
Accessories
For information on all Microlog accessories, including sensors, hardware devices (i.e., tachometers, strobe lights, etc.), balancing kits, cables, batteries, power accessories and more, reference the SKF Microlog Accessories Catalog using the link provided below.
http://www.skf.com/binary/12-48658/CM-P1-11643-EN-SKF-Microlog-Accessories-Catalog.pdf


SKF Microlog - GX Series C - 1 User Manual
Appendix C
Using the Headphones and Strobe Light
How to Use the Headphones with the GX
WARNING! Not certified for use in hazardous locations.
The GX Series Microlog also offers headphone support, which allows users to listen to the vibration as measurements are being recorded. This allows the operator to verify signal integrity and to observe the audio output as an aid to machinery diagnostics.
Connecting the headphones to the GX Series Microlog
Headphone use requires accessory cable CMAC 5078 (Headphone cable).
Figure C - 1. Headphones Connected to GX Series Microlog.
To connect the headphones to the Microlog:
• Connect the Headphone cable to the USB Host/CH 4/Headphone connector on the Microlog.
• Connect the headphones’ jack plug into the socket of the Headphone cable. Headphone Control Using the Keypad
The data collection screen’s title bar indicates the monitored channel (CH:1 to CH:4) and the headphone volume (0 to +10, or MUTE).
Volume and channel are controlled using the alphanumeric keypad as follows:
• 6 ("M") - toggle Mute status for the selected channel
• 0 / up arrow or 0 / down arrow – adjust the volume (from 0 to 10)
• 0 / left arrow or 0 / right arrow – sequences through channels being monitored (from Ch:1 to Ch:4)

Using the Headphones and Strobe Light How to Use the Strobe Light with the GX
C - 2 SKF Microlog - GX Series User Manual
At higher volumes (e.g., greater than 6 or 7), you may experience a distorted / clipped signal. If this occurs, lower the volume to reduce distortion.
How to Use the Strobe Light with the GX
WARNING! Not certified for use in hazardous locations.
Connecting the Strobe Light to the GX Series Microlog
Strobe light use requires accessory cables CMAC 5404 (input cable) and CMAC 5406 (output cable).
Figure C - 2. Strobe Light Connected to GX Series Microlog.
To connect the strobe light to the Microlog:
• Connect the input cable to the USB Host / CH 4 / Headphone connector on the Microlog.
• Connect the input cable’s jack plug into the socket of the strobe light.
• Connect the output cable into the USB DEV / TRIG / POWER connector on the Microlog.
• Connect the output cable’s jack plug into the socket of the strobe light.
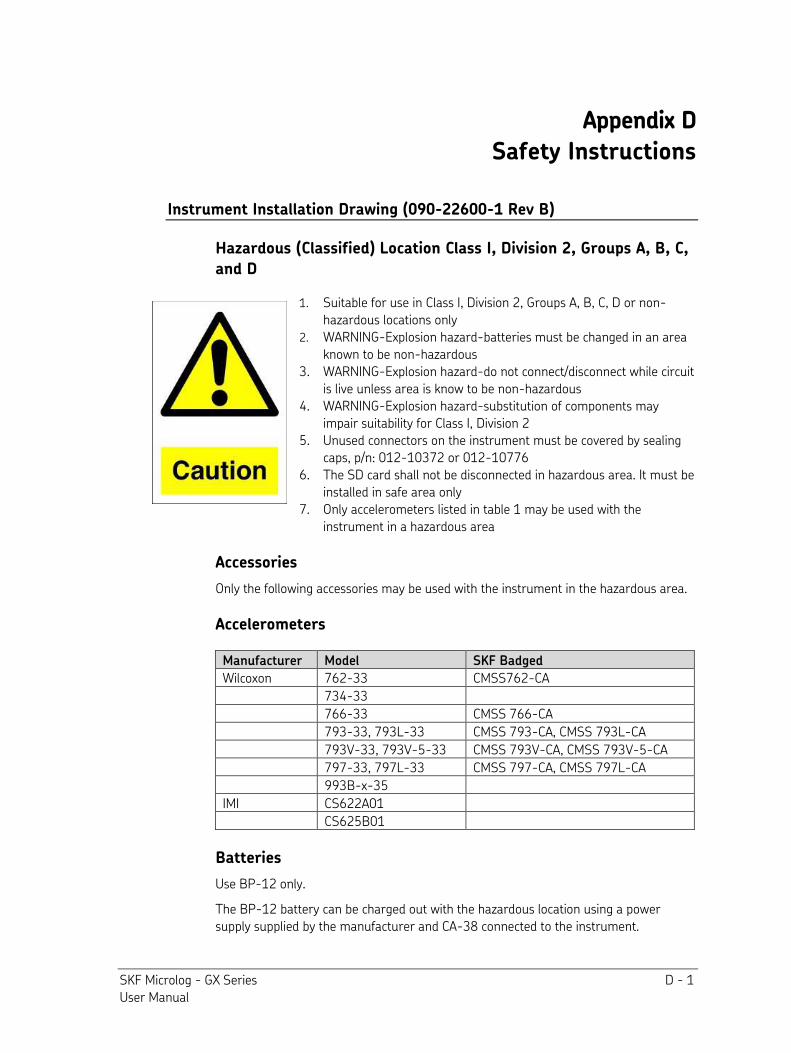
SKF Microlog - GX Series D - 1 User Manual
Appendix D
Safety Instructions
Instrument Installation Drawing (090-22600-1 Rev B)
Hazardous (Classified) Location Class I, Division 2, Groups A, B, C,
and D
1. Suitable for use in Class I, Division 2, Groups A, B, C, D or non-hazardous locations only
2. WARNING-Explosion hazard-batteries must be changed in an area known to be non-hazardous
3. WARNING-Explosion hazard-do not connect/disconnect while circuit is live unless area is know to be non-hazardous
4. WARNING-Explosion hazard-substitution of components may impair suitability for Class I, Division 2
5. Unused connectors on the instrument must be covered by sealing caps, p/n: 012-10372 or 012-10776
6. The SD card shall not be disconnected in hazardous area. It must be installed in safe area only
7. Only accelerometers listed in table 1 may be used with the instrument in a hazardous area
Accessories
Only the following accessories may be used with the instrument in the hazardous area. Accelerometers
Manufacturer Model SKF Badged
Wilcoxon 762-33 CMSS762-CA
734-33
766-33 CMSS 766-CA
793-33, 793L-33 CMSS 793-CA, CMSS 793L-CA
793V-33, 793V-5-33 CMSS 793V-CA, CMSS 793V-5-CA
797-33, 797L-33 CMSS 797-CA, CMSS 797L-CA
993B-x-35
IMI CS622A01
CS625B01
Batteries
Use BP-12 only.
The BP-12 battery can be charged out with the hazardous location using a power supply supplied by the manufacturer and CA-38 connected to the instrument.
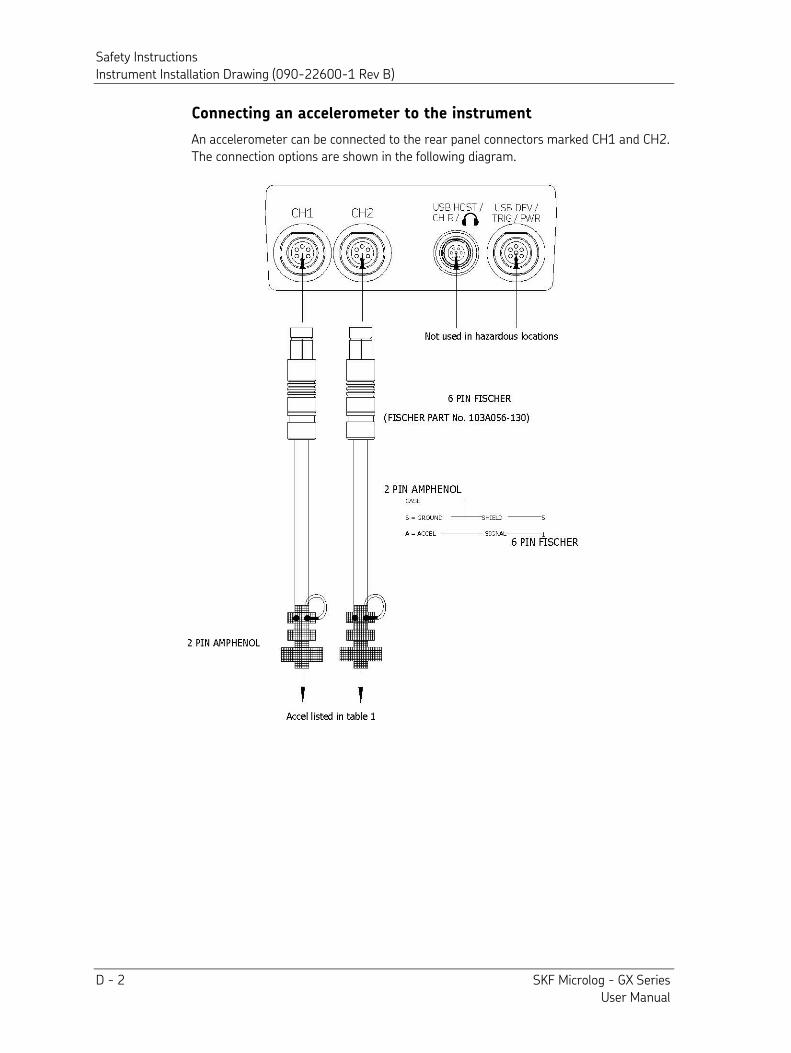
Safety Instructions Instrument Installation Drawing (090-22600-1 Rev B)
D - 2 SKF Microlog - GX Series User Manual
Connecting an accelerometer to the instrument
An accelerometer can be connected to the rear panel connectors marked CH1 and CH2. The connection options are shown in the following diagram.
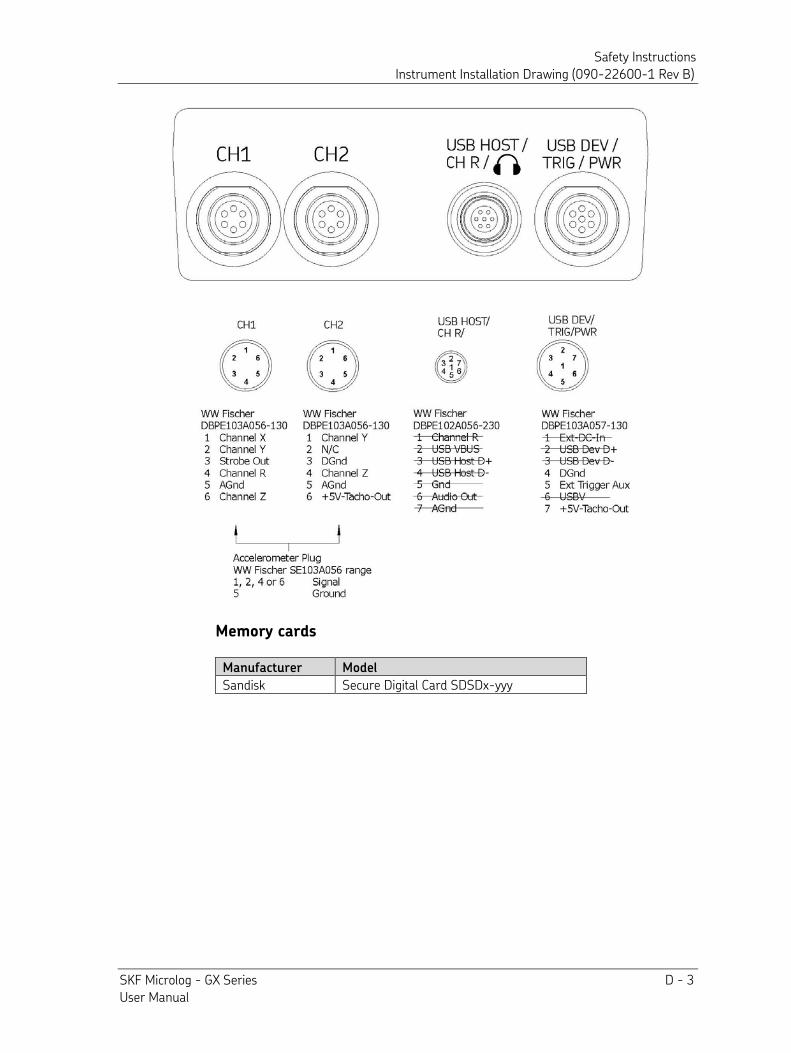
Safety Instructions Instrument Installation Drawing (090-22600-1 Rev B)
SKF Microlog - GX Series D - 3 User Manual
Memory cards
Manufacturer Model
Sandisk Secure Digital Card SDSDx-yyy
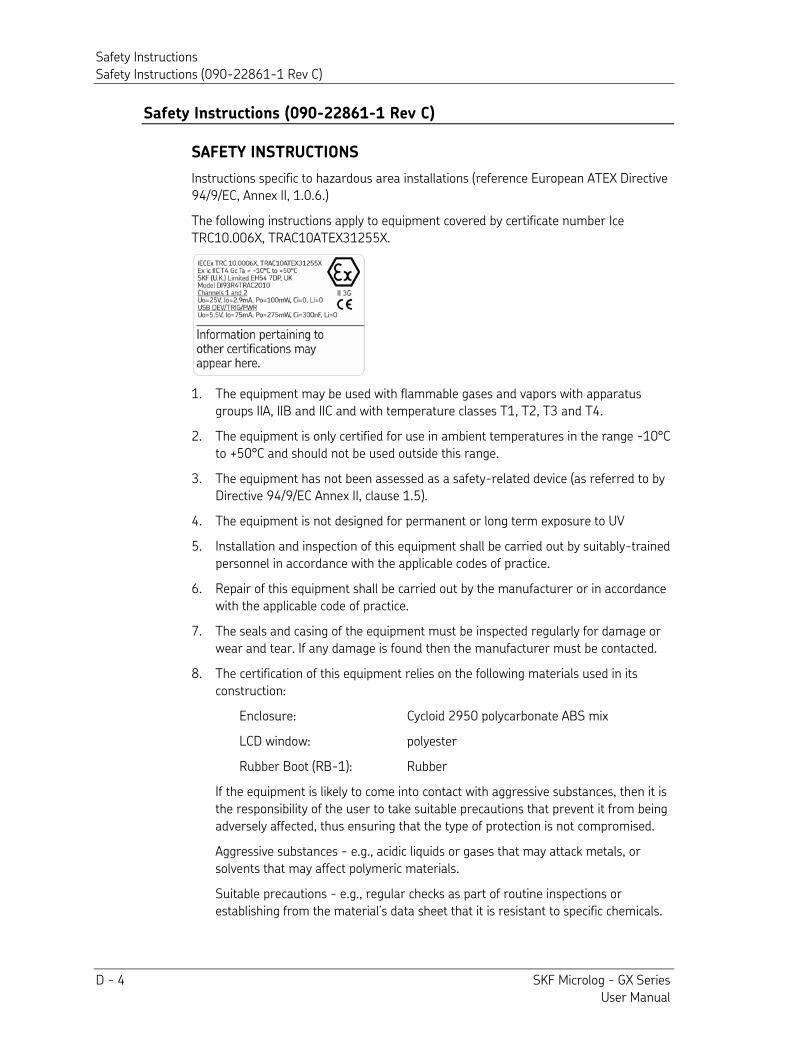
Safety Instructions Safety Instructions (090-22861-1 Rev C)
D - 4 SKF Microlog - GX Series User Manual
Safety Instructions (090-22861-1 Rev C)
SAFETY INSTRUCTIONS
Instructions specific to hazardous area installations (reference European ATEX Directive 94/9/EC, Annex II, 1.0.6.)
The following instructions apply to equipment covered by certificate number Ice TRC10.006X, TRAC10ATEX31255X.
1. The equipment may be used with flammable gases and vapors with apparatus groups IIA, IIB and IIC and with temperature classes T1, T2, T3 and T4.
2. The equipment is only certified for use in ambient temperatures in the range -10°C to +50°C and should not be used outside this range.
3. The equipment has not been assessed as a safety-related device (as referred to by Directive 94/9/EC Annex II, clause 1.5).
4. The equipment is not designed for permanent or long term exposure to UV
5. Installation and inspection of this equipment shall be carried out by suitably-trained personnel in accordance with the applicable codes of practice.
6. Repair of this equipment shall be carried out by the manufacturer or in accordance with the applicable code of practice.
7. The seals and casing of the equipment must be inspected regularly for damage or wear and tear. If any damage is found then the manufacturer must be contacted.
8. The certification of this equipment relies on the following materials used in its construction:
Enclosure: Cycloid 2950 polycarbonate ABS mix
LCD window: polyester
Rubber Boot (RB-1): Rubber
If the equipment is likely to come into contact with aggressive substances, then it is the responsibility of the user to take suitable precautions that prevent it from being adversely affected, thus ensuring that the type of protection is not compromised.
Aggressive substances - e.g., acidic liquids or gases that may attack metals, or solvents that may affect polymeric materials.
Suitable precautions - e.g., regular checks as part of routine inspections or establishing from the material’s data sheet that it is resistant to specific chemicals.
Safety Instructions Safety Instructions (090-22861-1 Rev C)
SKF Microlog - GX Series D - 5 User Manual
9. The CH1 and CH2 sockets of the DI93R4TRAC2010 can be connected to the Monitoring model MTN/1100I Accelerometer, BAS02ATEX1057X, or the Wilcoxon model 793-35 vibration transducer, SIRA 03ATEX2109X, or the Wilcoxon model 797-35 vibration transducer, SIRA 03ATEX2111X, or BKV model 8326x x xx x axe, DEMKO 01 ATEX 128807X, or BKV model ASA-06x, PTB 07 ATEX 2008 by an interconnecting lead.
10. The USB DEV/TRIG/PWR socket of the DI93TRAC2010 can be connected to Compact Instruments optical speed/phase sensor, MiniLVSxxx/N, BAS02ATEX3259X by an interconnecting lead.
11. Irrespective of the marking on the accelerometers, they are limited to ATEX II 3 G use in this application.
12. For group II C applications, the Wilcoxon type 793-35 accelerometer must not be subject to acceleration greater than 2800g and must be mechanically protected against impacts >4J. For Group II B applications the accelerometer must not be subject to acceleration greater than 4900g.
13. The Wilcoxon type 797-35 accelerometer must not be subject to acceleration greater than 3200g.
14. Do not change or replace the battery pack in the hazardous area.
15. All unused connectors, except Channels 1 and 2 must be fitted with the blanking caps supplied when the unit is in the hazardous area. These must only be removed in an area known to be non-hazardous.
16. The SD card shall not be disconnected in hazardous area. It must be installed in safe area only.
17. Only for use with charger PSU-13 (rated 12V, 5.2A)
18. Only Channel 1, Channel 2 and two pins (Ext Trigger AUX and +5V-TACHO-OUT) on the Power/USB/Trigger connectors are to be used in the hazardous area for connection to Ex approved equipment as detailed below.
Accessories
The following accessories may be used with the instrument in the hazardous area:
Battery
BP-12 (only)
Safety Instructions Safety Instructions (090-22861-1 Rev C)
D - 6 SKF Microlog - GX Series User Manual
Accelerometers1
Manufacturer Model Certificate SKF Badged
Wilcoxon 793-35 SIRA 03ATEX2109X CMSS 793-EE
Wilcoxon 797-35 SIRA 03ATEX2109X CMSS 797-EE
Monitran MTN/1100I BAS02ATEX1057X CMSS 2210
Optical speed/phase sensors1
Manufacturer Model Certificate SKF Badged
Compact instruments MiniVLSxxx/N BAS02ATEX3259X CMAC 5030K-Z2
Straps
Part Number Description SKF Part Number
STR-8 Hand Strap CMAC 5020
STR-9 Neck Strap CMAC 5113
1 Other Ex approved equipment may be used as long as they do not invalidate the entity parameters listed
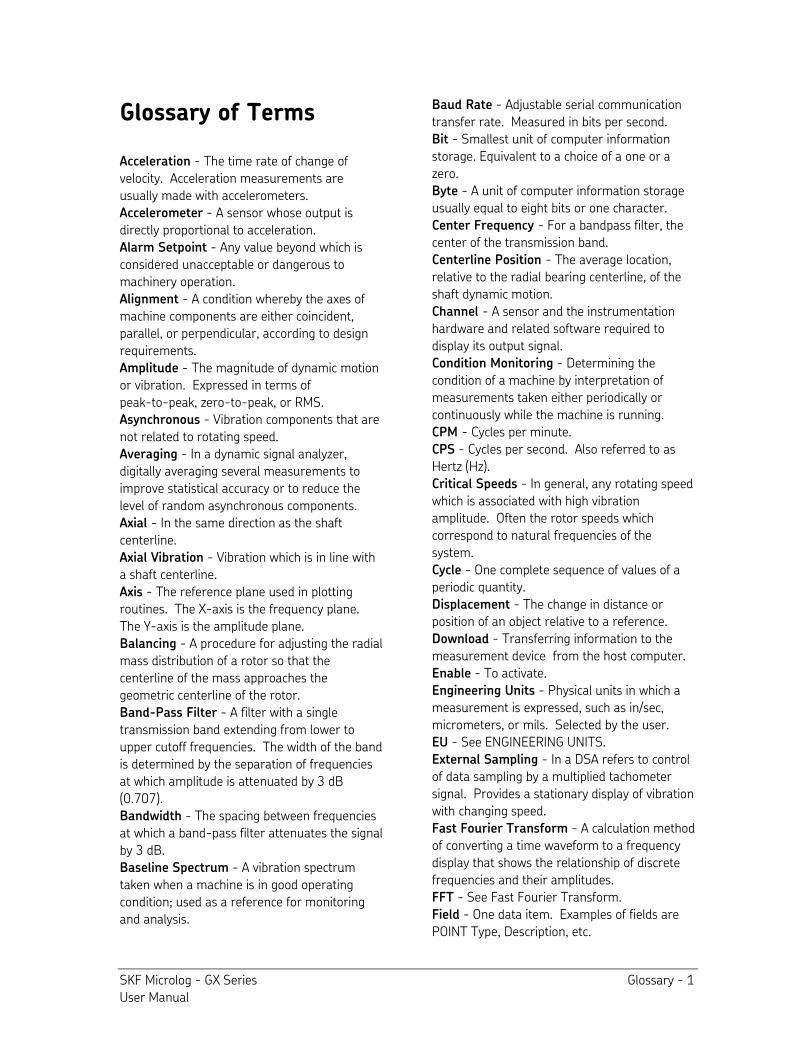
SKF Microlog - GX Series Glossary - 1 User Manual
Glossary of Terms Acceleration - The time rate of change of velocity. Acceleration measurements are usually made with accelerometers. Accelerometer - A sensor whose output is directly proportional to acceleration. Alarm Setpoint - Any value beyond which is considered unacceptable or dangerous to machinery operation. Alignment - A condition whereby the axes of machine components are either coincident, parallel, or perpendicular, according to design requirements. Amplitude - The magnitude of dynamic motion or vibration. Expressed in terms of peak-to-peak, zero-to-peak, or RMS. Asynchronous - Vibration components that are not related to rotating speed. Averaging - In a dynamic signal analyzer, digitally averaging several measurements to improve statistical accuracy or to reduce the level of random asynchronous components. Axial - In the same direction as the shaft centerline. Axial Vibration - Vibration which is in line with a shaft centerline. Axis - The reference plane used in plotting routines. The X-axis is the frequency plane. The Y-axis is the amplitude plane. Balancing - A procedure for adjusting the radial mass distribution of a rotor so that the centerline of the mass approaches the geometric centerline of the rotor. Band-Pass Filter - A filter with a single transmission band extending from lower to upper cutoff frequencies. The width of the band is determined by the separation of frequencies at which amplitude is attenuated by 3 dB (0.707). Bandwidth - The spacing between frequencies at which a band-pass filter attenuates the signal by 3 dB. Baseline Spectrum - A vibration spectrum taken when a machine is in good operating condition; used as a reference for monitoring and analysis.
Baud Rate - Adjustable serial communication transfer rate. Measured in bits per second. Bit - Smallest unit of computer information storage. Equivalent to a choice of a one or a zero. Byte - A unit of computer information storage usually equal to eight bits or one character. Center Frequency - For a bandpass filter, the center of the transmission band. Centerline Position - The average location, relative to the radial bearing centerline, of the shaft dynamic motion. Channel - A sensor and the instrumentation hardware and related software required to display its output signal. Condition Monitoring - Determining the condition of a machine by interpretation of measurements taken either periodically or continuously while the machine is running. CPM - Cycles per minute. CPS - Cycles per second. Also referred to as Hertz (Hz). Critical Speeds - In general, any rotating speed which is associated with high vibration amplitude. Often the rotor speeds which correspond to natural frequencies of the system. Cycle - One complete sequence of values of a periodic quantity. Displacement - The change in distance or position of an object relative to a reference. Download - Transferring information to the measurement device from the host computer. Enable - To activate. Engineering Units - Physical units in which a measurement is expressed, such as in/sec, micrometers, or mils. Selected by the user. EU - See ENGINEERING UNITS. External Sampling - In a DSA refers to control of data sampling by a multiplied tachometer signal. Provides a stationary display of vibration with changing speed. Fast Fourier Transform - A calculation method of converting a time waveform to a frequency display that shows the relationship of discrete frequencies and their amplitudes. FFT - See Fast Fourier Transform. Field - One data item. Examples of fields are POINT Type, Description, etc.
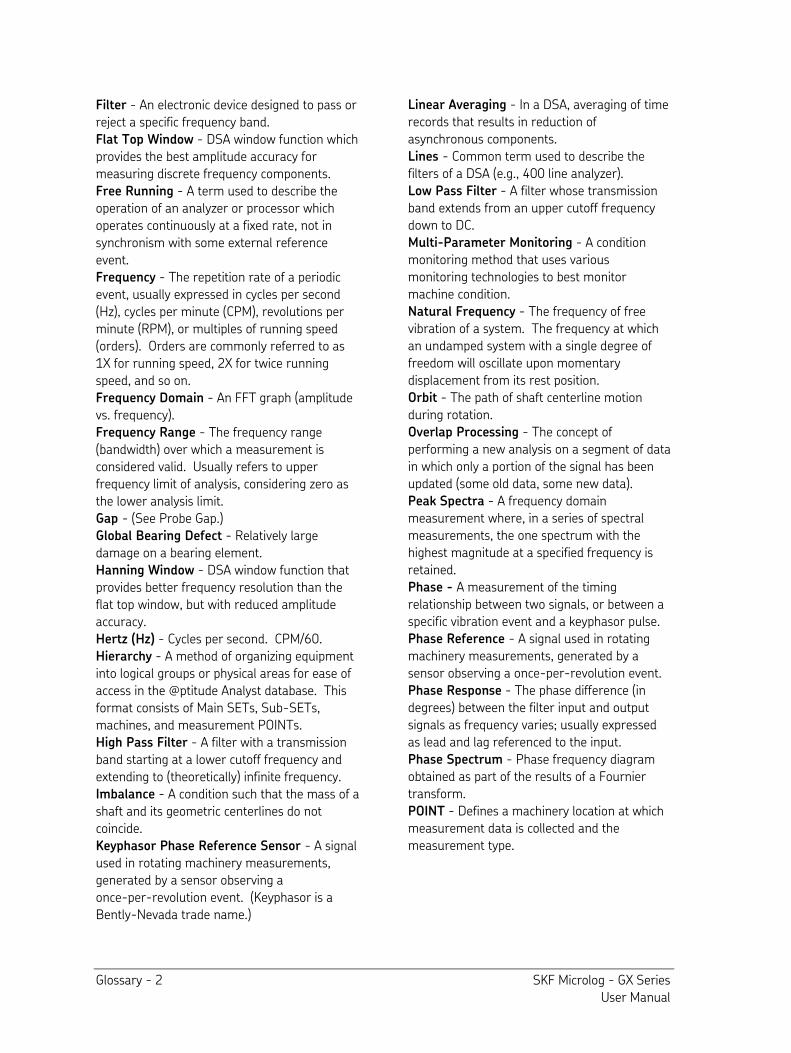
Glossary - 2 SKF Microlog - GX Series User Manual
Filter - An electronic device designed to pass or reject a specific frequency band. Flat Top Window - DSA window function which provides the best amplitude accuracy for measuring discrete frequency components. Free Running - A term used to describe the operation of an analyzer or processor which operates continuously at a fixed rate, not in synchronism with some external reference event. Frequency - The repetition rate of a periodic event, usually expressed in cycles per second (Hz), cycles per minute (CPM), revolutions per minute (RPM), or multiples of running speed (orders). Orders are commonly referred to as 1X for running speed, 2X for twice running speed, and so on. Frequency Domain - An FFT graph (amplitude vs. frequency). Frequency Range - The frequency range (bandwidth) over which a measurement is considered valid. Usually refers to upper frequency limit of analysis, considering zero as the lower analysis limit. Gap - (See Probe Gap.) Global Bearing Defect - Relatively large damage on a bearing element. Hanning Window - DSA window function that provides better frequency resolution than the flat top window, but with reduced amplitude accuracy. Hertz (Hz) - Cycles per second. CPM/60. Hierarchy - A method of organizing equipment into logical groups or physical areas for ease of access in the @ptitude Analyst database. This format consists of Main SETs, Sub-SETs, machines, and measurement POINTs. High Pass Filter - A filter with a transmission band starting at a lower cutoff frequency and extending to (theoretically) infinite frequency. Imbalance - A condition such that the mass of a shaft and its geometric centerlines do not coincide. Keyphasor Phase Reference Sensor - A signal used in rotating machinery measurements, generated by a sensor observing a once-per-revolution event. (Keyphasor is a Bently-Nevada trade name.)
Linear Averaging - In a DSA, averaging of time records that results in reduction of asynchronous components. Lines - Common term used to describe the filters of a DSA (e.g., 400 line analyzer). Low Pass Filter - A filter whose transmission band extends from an upper cutoff frequency down to DC. Multi-Parameter Monitoring - A condition monitoring method that uses various monitoring technologies to best monitor machine condition. Natural Frequency - The frequency of free vibration of a system. The frequency at which an undamped system with a single degree of freedom will oscillate upon momentary displacement from its rest position. Orbit - The path of shaft centerline motion during rotation. Overlap Processing - The concept of performing a new analysis on a segment of data in which only a portion of the signal has been updated (some old data, some new data). Peak Spectra - A frequency domain measurement where, in a series of spectral measurements, the one spectrum with the highest magnitude at a specified frequency is retained. Phase - A measurement of the timing relationship between two signals, or between a specific vibration event and a keyphasor pulse. Phase Reference - A signal used in rotating machinery measurements, generated by a sensor observing a once-per-revolution event. Phase Response - The phase difference (in degrees) between the filter input and output signals as frequency varies; usually expressed as lead and lag referenced to the input. Phase Spectrum - Phase frequency diagram obtained as part of the results of a Fournier transform. POINT - Defines a machinery location at which measurement data is collected and the measurement type.
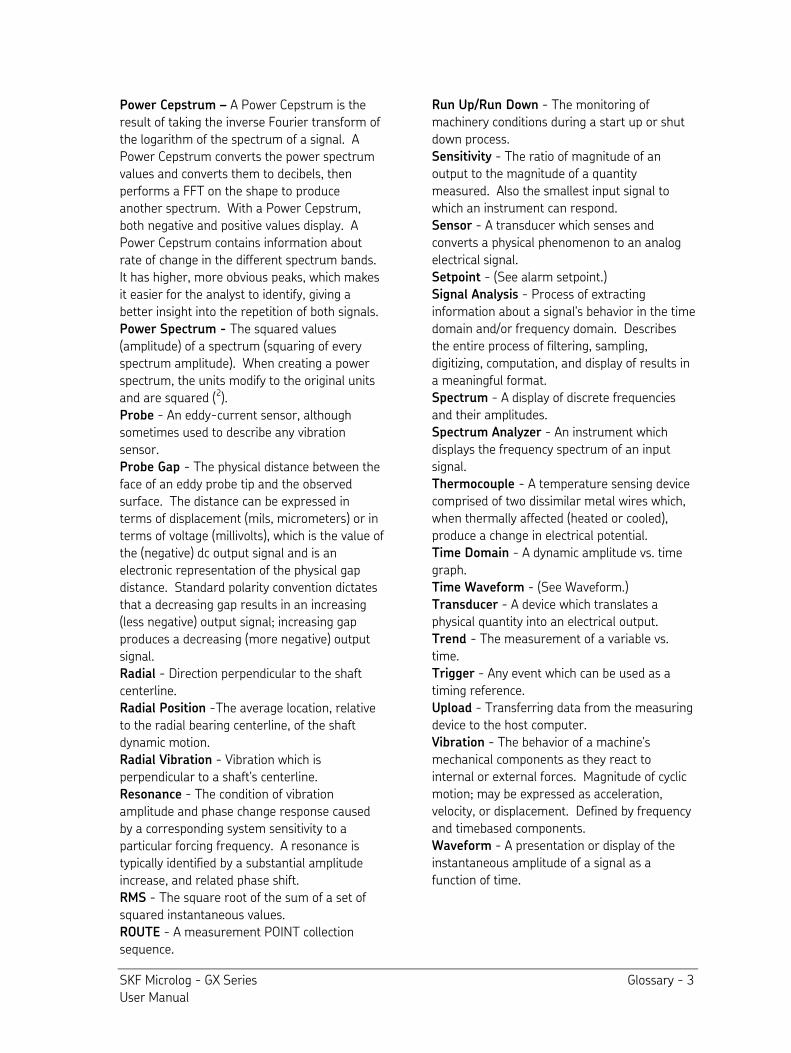
SKF Microlog - GX Series Glossary - 3 User Manual
Power Cepstrum – A Power Cepstrum is the result of taking the inverse Fourier transform of the logarithm of the spectrum of a signal. A Power Cepstrum converts the power spectrum values and converts them to decibels, then performs a FFT on the shape to produce another spectrum. With a Power Cepstrum, both negative and positive values display. A Power Cepstrum contains information about rate of change in the different spectrum bands. It has higher, more obvious peaks, which makes it easier for the analyst to identify, giving a better insight into the repetition of both signals. Power Spectrum - The squared values (amplitude) of a spectrum (squaring of every spectrum amplitude). When creating a power spectrum, the units modify to the original units and are squared (2). Probe - An eddy-current sensor, although sometimes used to describe any vibration sensor. Probe Gap - The physical distance between the face of an eddy probe tip and the observed surface. The distance can be expressed in terms of displacement (mils, micrometers) or in terms of voltage (millivolts), which is the value of the (negative) dc output signal and is an electronic representation of the physical gap distance. Standard polarity convention dictates that a decreasing gap results in an increasing (less negative) output signal; increasing gap produces a decreasing (more negative) output signal. Radial - Direction perpendicular to the shaft centerline. Radial Position -The average location, relative to the radial bearing centerline, of the shaft dynamic motion. Radial Vibration - Vibration which is perpendicular to a shaft's centerline. Resonance - The condition of vibration amplitude and phase change response caused by a corresponding system sensitivity to a particular forcing frequency. A resonance is typically identified by a substantial amplitude increase, and related phase shift. RMS - The square root of the sum of a set of squared instantaneous values. ROUTE - A measurement POINT collection sequence.
Run Up/Run Down - The monitoring of machinery conditions during a start up or shut down process. Sensitivity - The ratio of magnitude of an output to the magnitude of a quantity measured. Also the smallest input signal to which an instrument can respond. Sensor - A transducer which senses and converts a physical phenomenon to an analog electrical signal. Setpoint - (See alarm setpoint.) Signal Analysis - Process of extracting information about a signal's behavior in the time domain and/or frequency domain. Describes the entire process of filtering, sampling, digitizing, computation, and display of results in a meaningful format. Spectrum - A display of discrete frequencies and their amplitudes. Spectrum Analyzer - An instrument which displays the frequency spectrum of an input signal. Thermocouple - A temperature sensing device comprised of two dissimilar metal wires which, when thermally affected (heated or cooled), produce a change in electrical potential. Time Domain - A dynamic amplitude vs. time graph. Time Waveform - (See Waveform.) Transducer - A device which translates a physical quantity into an electrical output. Trend - The measurement of a variable vs. time. Trigger - Any event which can be used as a timing reference. Upload - Transferring data from the measuring device to the host computer. Vibration - The behavior of a machine's mechanical components as they react to internal or external forces. Magnitude of cyclic motion; may be expressed as acceleration, velocity, or displacement. Defined by frequency and timebased components. Waveform - A presentation or display of the instantaneous amplitude of a signal as a function of time.

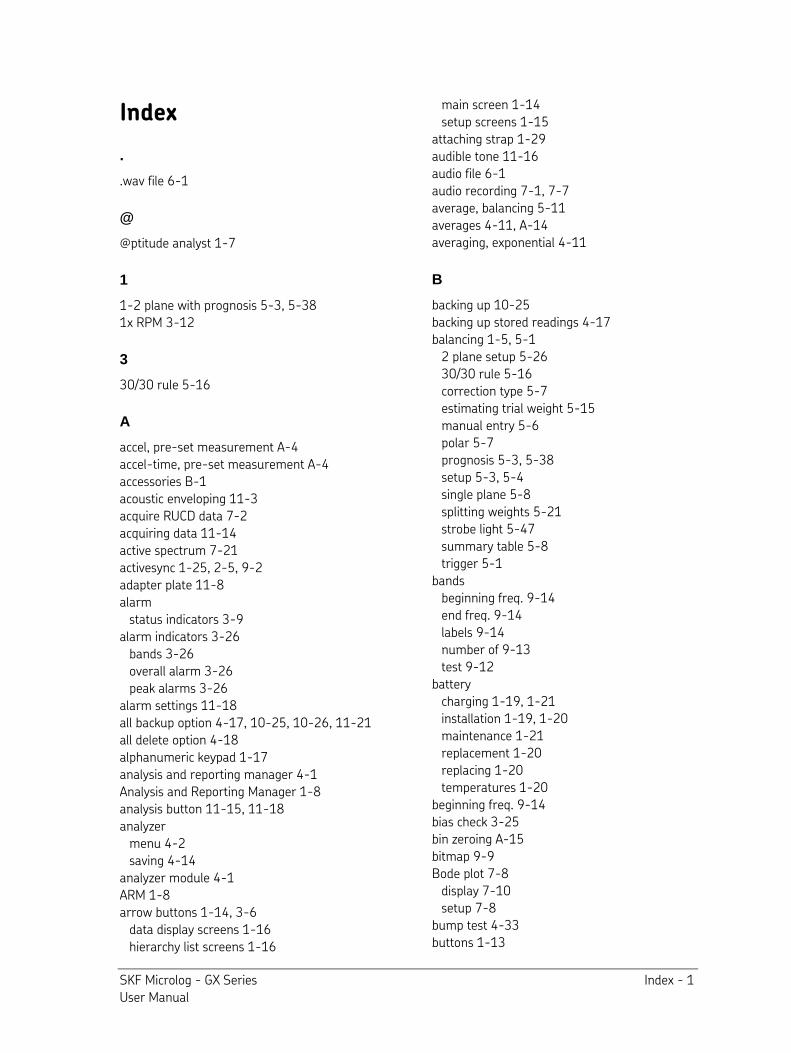
SKF Microlog - GX Series Index - 1 User Manual
Index
.
.wav file 6-1
@
@ptitude analyst 1-7
1
1-2 plane with prognosis 5-3, 5-38 1x RPM 3-12
3
30/30 rule 5-16
A
accel, pre-set measurement A-4 accel-time, pre-set measurement A-4 accessories B-1 acoustic enveloping 11-3 acquire RUCD data 7-2 acquiring data 11-14 active spectrum 7-21 activesync 1-25, 2-5, 9-2 adapter plate 11-8 alarm
status indicators 3-9 alarm indicators 3-26
bands 3-26 overall alarm 3-26 peak alarms 3-26
alarm settings 11-18 all backup option 4-17, 10-25, 10-26, 11-21 all delete option 4-18 alphanumeric keypad 1-17 analysis and reporting manager 4-1 Analysis and Reporting Manager 1-8 analysis button 11-15, 11-18 analyzer
menu 4-2 saving 4-14
analyzer module 4-1 ARM 1-8 arrow buttons 1-14, 3-6
data display screens 1-16 hierarchy list screens 1-16
main screen 1-14 setup screens 1-15
attaching strap 1-29 audible tone 11-16 audio file 6-1 audio recording 7-1, 7-7 average, balancing 5-11 averages 4-11, A-14 averaging, exponential 4-11
B
backing up 10-25 backing up stored readings 4-17 balancing 1-5, 5-1
2 plane setup 5-26 30/30 rule 5-16 correction type 5-7 estimating trial weight 5-15 manual entry 5-6 polar 5-7 prognosis 5-3, 5-38 setup 5-3, 5-4 single plane 5-8 splitting weights 5-21 strobe light 5-47 summary table 5-8 trigger 5-1
bands beginning freq. 9-14 end freq. 9-14 labels 9-14 number of 9-13 test 9-12
battery charging 1-19, 1-21 installation 1-19, 1-20 maintenance 1-21 replacement 1-20 replacing 1-20 temperatures 1-20
beginning freq. 9-14 bias check 3-25 bin zeroing A-15 bitmap 9-9 Bode plot 7-8
display 7-10 setup 7-8
bump test 4-33 buttons 1-13
Index - 2 SKF Microlog - GX Series User Manual
arrow 1-14 enter 1-14 function 1-14 shift 1-14, 1-17
C
cepstrum 4-5 channel control 11-10 channels
number of 4-9 chapter overview 1-3 clipped signal 7-6 coded notes 3-22 col < / > col function button 9-20, 10-6 collapse hierarchy 3-6 collecting data 3-4 color display 1-9 column, scroll 9-20, 10-6 communication
connections 1-22 set up 3-2
communications 1-25 activesync 1-25 USB 1-25 windows mobile device center 1-25
config screen 2-7 fill spectrum 3-13 frequency units 2-8 historical data collect 2-10 route ICP 2-9
configuration screen 2-7 conformance check
overview 9-1, 10-1 performing test 9-16, 10-2 saving results 9-21, 10-23 setup tabs 9-6
conformance check setup software 9-1, 9-4, 10-1
connections 1-22 coupling 1-23 disconnecting 1-23
correction type, balancing 5-7 coupling A-12 CPM 4-8, 4-10 cross channel phase A-22
data collection A-22 display screen A-23 measurement setup A-22 phase tables A-24
cursor multi channel 4-28, A-24 peak 3-14 two channel 3-18
cursor mode 3-13
D
data transfer 3-2
data collection 3-25 cross channel phase A-22, A-23 MPA measurements 3-27 multi spectrum A-17 multi time waveform A-17 orbit A-8 process measurements 3-19 retaking measurements 3-25 route 3-4 skipping measurements 3-25
data display expand 3-18, 4-28, A-24 full scale adjustments 3-18, 4-28, A-24 multi channel cursor 4-28, A-24 phase tables A-24 two channel cursor 3-18
date format 2-5 date setting 2-5 db ref units 4-11 db reference 4-11 default function button 5-5 delete
measurement results 4-15 measurement setup 4-15
delete saved meas. 4-18 deleting meas. 7-26, 10-26 detection
analyzer 4-11 conf. checker 9-14
dimmed icons hiding 1-10, 1-11
directions, test 9-7 display format A-11 display screen
printing 1-18 display y axis 4-10 download 1-22 downloading 3-2 dynamic measurements 3-10
review 3-28
SKF Microlog - GX Series Index - 3 User Manual
spectral display screen 3-10 time waveform display screens 3-14
E
end freq. 9-14 enter buttons 1-14 enveloped accel, pre-set measurement A-5 error messages 3-24 estimate trial weight 5-15 expand hierarchy 3-5, 3-6 exponential averaging 4-11 ext. trig slope A-15
F
FFT spectral banding 3-26 FFT spectrum 9-13, 9-21 field analysis features 3-13 fill spectrum 3-13 filter A-13
analyzer 4-10 firmware version number 1-9, 1-12, 1-14,
10-2 fixed weight 5-7 fmax A-13
actual values 3-3, A-13 font size 2-5 free text note 11-17 freq range 4-10, 6-7 FRF
calibration 8-12 equipment setup 8-2 function buttons 8-5 hammer 8-2 recall 8-7 save settings 8-5 setup 8-5 taking data mode 8-9
function button default 5-5
function buttons 1-14, 2-1, 2-2, 2-11 about button 1-12 FRF 8-5 help button 1-12 idler sound monitor screen 11-11, 11-15 manual data entry display screen 3-21 non-route mode A-2 orbit display screen A-9 overview 1-12
process display screen 3-20 route 3-6 route manager 3-3 spectral display screen 3-12 time waveform display screen 3-16 user screen A-10
G
gE, pre-set measurement A-5 global measurement settings 2-7 grade bands 9-6 grade boundaries 9-6 grade labels 9-6, 9-12 grades
bands 9-12 boundaries 9-15 labels 9-12 levels 9-15 number of 9-12
graph scaling adjustment, y-axis 3-14 graphic 9-18, 10-4 grid 3-13 grid view 3-13 GX Series Microlog system 1-4
H
hammer 8-2 hammer test 4-33 hard reset 1-28 harmonic activity indicator 11-3 harmonic marker 3-13 harmonic markers 3-14, 4-7 hazardous area 1-27, 10-25 headphone volume controls 11-10 headphones 1-18, 3-9, 11-2, 11-10, C-1
setting volume 11-10 help
button 1-12 HFD A-5, A-13, A-15 hide dimmed icons 1-10, 1-11 hide icons 1-10, 1-11 hierarchy 3-1
collapse 3-6 expand 3-5, 3-6 navigation 3-5
high res, pre-set measurement A-3 high-pass filter A-13
Index - 4 SKF Microlog - GX Series User Manual
historical data configure 2-10 review 3-32 save 3-9
home screen 1-14, 10-2 Hz 4-8, 4-10
I
icons hide/show 1-10, 1-11
ICP 2-9 error 9-21, 10-23
idler sound monitor adapter plate 11-8 function buttons 11-11, 11-15 led indications 11-13 measurement types 11-3 microphone 11-6 notes 11-5 optimal conditions 11-14 parabolic reflector 11-6
independent autoranging 4-29, A-24 indicators, LCD 1-5 initialize 2-5 initializing DAQ 11-14 input channel A-12 input devices 1-5 internal drive 7-5, 8-7 Internal drive 6-7
K
keypad 1-17 alphanumeric 1-17 entering letters 1-17 entering numbers 1-17
Kurtosis 11-3
L
language 2-6 last point of route 3-10 LCD display 1-9 LCD indicators 1-5 led indications, idler sound monitor 11-13 license modules 1-12 linear 4-10 lines resolution 4-11 lines/samples A-13 live time waveform 6-3
location no. 9-15 logarithmic 4-10
M
machine picture 9-6, 9-9 machine speed 2-8 main screen 1-9 manual entry, balancing calculations 5-6 manual function button 3-21 mark button 11-15 markers, harmonic 3-14 max. rec. time 6-7, 7-5, 8-7 maximum acq. time 7-5 measurements
acoustic 11-3 memory card 1-27 memory operations 2-5
delete all routes 2-5 initialize 2-5 troubleshooting 2-13
microlog 1-4 microphone 11-6
mobile device 9-2 mode - RUCD 7-5 module
model versions 1-6 spindle test 10-1
module manager 1-10, 1-11 modules
hide/show 1-10, 1-11 license 1-12 purchase 1-12
motor current measurement 4-36 MPA measurements 3-23, 3-26
data collection 3-27 review 3-31
multi channel 4-9, 6-7, A-12 cross channel phase A-22 cursor 4-28, A-24 display expand 4-28, A-24 full scale adjustments 4-28, A-24 route mode 3-17 spectrum data collection A-17 spectrum setup A-17 time waveform data collection A-17 time waveform setup A-17
multi measurements collection A-17 setup A-17
SKF Microlog - GX Series Index - 5 User Manual
multi spectrum measurement setup A-17 triax 4-28, A-21 two channel spectrum A-18 two channel spectrum/time A-20 two channel time A-19
multi time waveform measurement setup A-17
multi-channel measurements 4-19 multi-point automation See MPA
measurements mute 11-10
N
non-route function buttons A-2 pre-set measurements A-3 review A-25 triax displays 4-28, A-21 two channel spectrum A-18 two channel spectrum/time A-20 two channel time A-19 user screen A-10 user-defined measurements A-10
normalization 11-4, 11-16 note button 11-17 notes, coded 3-22 number of bands 9-13 number of components 5-7 Nyquist plot 7-11
display 7-12 setup 7-11
O
operator, selecting 3-3 opposite, pre-set measurement A-3 orbit 4-19, A-5
data collection A-8 data review 3-30 overview 4-29, A-5 route mode 3-18 setup A-6 setup screen A-6
orbit setup A-6 coupling A-6 ext. trigger slope A-7 level A-7 sensitivity A-7
trigger A-7 units A-6
overall vibration 6-3 overlap 4-11, A-14 overload
clearing 3-25 signal 3-25
P
parabolic reflector 11-6 pause recording 6-4 peak cursor 3-14 phase 4-7, 4-10 phase tables A-24 phase, cross channel A-22 pickup 3-24 picture 9-18, 10-4 point information A-26 polar 5-10 polar correction 5-7 post-process 6-1 power button 1-14 power cycle, automatic 1-14, 3-13 power spectrum 4-5 power supply/battery charger 1-19, 1-20 pre-set measurements A-3
acceleration A-4 acceleration-time A-4 enveloped acceleration A-5 hfd A-5 high resolution A-3 opposite A-3 orbit A-5 same A-3 velocity A-4
printing from display 4-16, 10-24 screens 1-18 test results 4-16, 10-24
process measurements data collection 3-19 manual data entry 3-21 review 3-34 review screen 3-34
processing time - RUCD 7-2 prognosis 5-3, 5-38
message 5-43 pulses/rev 7-5 purchase modules 1-12
Index - 6 SKF Microlog - GX Series User Manual
R
recall 5-3, 6-2, 7-3, 7-26, 8-4, 8-7, 11-12 recalling a setup 11-19 recorder
overview 6-1 preview mode 6-3
recording mode 6-8 recording time 6-8 recording, pause 6-4 reference point, speed 3-23 reset, hard 1-28 resolution 4-11 resume mode 1-14 resume recording 6-4 review 3-28
dynamic measurements 3-28 historical data 3-32 MPA measurements 3-31 non-route A-25 orbit data 3-30 process measurements 3-34 spectral display screen 3-28, A-26 three channel in route 3-31 triax in route 3-31 two channel in route 3-31
review meas. 7-26 review process screen 3-34 reviewing test results 10-24 rotor mass 5-14 route 3-1
delete all 2-5 font 2-5 function buttons 3-6 hierarchy 3-4 hierarchy list navigation 3-5 multi channel data 3-17 orbit data 3-18 route module 3-1 status 3-9
RPM 1x RPM 3-12
RUCD led 7-4 mode 7-5 processing time 7-2 setup 7-4 start - stop speed 7-5 state 7-6 taking data mode 7-6
run-up coast-down 6-1, 7-1
S
same, pre-set measurement A-3 samples/lines A-13 save
meas. results 4-14 meas. setup 4-12, 4-14, 4-22, 4-32, 4-36,
4-38 save button 11-14 saving meas. 7-26 saving screens 1-18 saving settings 11-14 saving test results 9-21, 10-23 saving test template 9-16 scroll columns 9-20, 10-6 SD card 1-9, 1-27, 4-17, 6-7, 7-5, 8-7,
10-25, 11-21 operation 1-27 printing screens 1-18
selecting operators 3-3 sensitivity A-13 sensor
disconnecting 3-10, 3-25 orientation 9-7, 9-15 setup 2-10 type 4-9 variable 4-9
sensor setup screen 2-10 sensor type
conf. checker 9-6 serial number 1-12 settling 2-8
delay 2-8 setup screen 2-1, 2-2
date format 2-5 date/time 2-5 default units 2-2 memory 2-5 route memory 2-2 timeout 2-2
setup, balancing 5-4 shift button 1-14, 1-17 shift key 2-1 show icons 1-10, 1-11 SKF title screen 1-9, 1-14, 10-2 skip function button 9-19, 10-6 skip test position 9-19, 10-6
SKF Microlog - GX Series Index - 7 User Manual
software conf. check setup 9-1, 10-1
specify RPM database A-7, A-23 spectral display A-8, A-23 type in A-8, A-23
spectral banding 3-26 spectral data 3-10 spectral display screen 3-10
fill spectrum 3-13 multi channel 3-17
spectrogram 7-23 display 7-23 display status area 7-26 setup 7-23
Speed 1x RPM 3-12
speed ratio 3-23 speed reference point 3-23 speed tagging 3-23
error messages 3-24 spindle
balancing test 10-23 bearing condition test 10-9 belt tension test 10-18 clamp force test 10-13 EM distance test 10-16 imbalance test 10-6 mechanical condition test 10-8 module 10-1 nose run-out test 10-11 resonant frequency test 10-21 speed accuracy test 10-20 test
templates 10-1 start button 11-14 stop acquisition 4-11 strap attachment 1-29 strobe light C-2 summary, balancing 5-8 suspend mode 1-14 system settings 2-1
T
table - RUCD 7-13 display 7-14 setup 7-13
table of peaks 4-5 taking data mode 8-8
test template 9-1, 10-1 copy 9-3 custom 9-2, 10-1 folders/icons 9-17, 10-4 location 9-3 pre-configured 9-1, 10-1 saving 9-16 selection 9-17, 10-4 setup 9-4 spindle 10-1 transfer 10-2 transfer to AX 9-2
text note 11-17 three channel
review in route 3-31 time remaining 6-4 time setting 2-5
time waveform 6-1 time waveform data 3-14 time zone 2-5 title screen 1-14, 10-2 tone 11-16 traffic light indicator 11-3 transfer 3-2 transfer test template 9-2, 10-2 transient capture 6-1, 7-1 trial weight 5-14
estimate 5-15 triax 3-17
non-route 4-9, 4-28, A-12, A-21 review in route 3-31
triax measurement 4-28 triaxial measurements 4-9, A-12 trigger 5-1, 5-6, A-7 trigger level A-15 triggerless operation A-25 troubleshooting 9-21, 10-23 troubleshooting, bias check 3-25 troubleshooting, memory operations 2-13 two channel
cursor 3-18 display expand 3-18 full scale adjustments 3-18 independent autoranging 4-29, A-24 non-route A-18, A-19 review in route 3-31 spectrum A-18 spectrum/time waveform A-20 time waveform A-19 triggerless operation A-25
Index - 8 SKF Microlog - GX Series User Manual
two channel recording 6-3 type A-14 types of measurements A-3
U
unit ID number 1-12 units 2-2, 4-8, 4-10, A-12
conf. checker 9-14 upgrades B-1 upload 1-22 uploading 3-2 USB 1-19, 1-23, 9-2
communications 1-25 driver 1-25
user function button A-2 user manual conventions 1-2 user screen A-10
function buttons A-10 user, selecting 3-3 user-defined measurement options A-11
averages 4-11, A-14 bin zeroing A-15 change name A-11 coupling A-12 display format A-11 ext. trig. slope A-15 fmax A-13 high-pass filter A-13 input channel A-12 level A-15 lines/samples A-13 overlap A-14 sensitivity A-13 type A-14 units A-12 window 4-12, A-14
user-defined non-route measurements A-10
V
variable sensor type 4-9 velocity, pre-set measurement A-4 version number 1-14, 10-2 vibration threshold 5-7 view 3-13
grid 3-13 options 3-13
view signal 4-10 volume control 11-10
W
warning messages 9-21, 10-23 waterfall plot 7-15
display 7-16 display status area 7-21 setup 7-15
wav file 7-1, 7-7 wind baffle 11-9 window 4-12, A-14 windows mobile device center 1-25
X
x axis units 4-8, 4-10
Y
y axis units 4-10 y-axis display 4-11 y-axis graph scaling adjustment 3-14