skill requirements across firms and labor markets
TRANSCRIPT

A
Skill Requirements across Firms andLabor Markets: Evidence from Job
Postings for Professionals
David Deming, Harvard University and National Bureauof Economic Research
Lisa B. Kahn, Yale University and National Bureauof Economic Research
WAmEcoindhelpous
[©S
ll us
We study variation in skill demands for professionals across firmsand labor markets. We categorize a wide range of keywords foundin job ads into 10 general skills. There is substantial variation in theseskill requirements, even within narrowly defined occupations. Focus-ing particularly on cognitive and social skills, we find positive cor-relations between each skill and external measures of pay and firmperformance. We also find evidence of a cognitive social skill comple-mentarity for both outcomes. As a whole, job skills have explanatorypower in pay and firm performance regressions beyond what is avail-able in widely used labor market data.
I. Introduction
Wage inequality in theUnited States has increasedmarkedly over the pastfew decades. A large literature in economics links rising wage inequality inthe United States and other developed countries to technological change,
e are grateful to Edward Lazear, Kathryn Shaw, and seminar participants at theerican Economic Association 2017 Annual Meeting, the National Bureau ofnomic Research, and the Trans Pacific Labor Seminar 2016. We are especiallyebted to Brad Hershbein, Dan Restuccia, Jake Sherman, and Bledi Taska forand provision of the Burning Glass Technologies data. This paper was previ-
ly circulated under the title “Firm Heterogeneity in Skill Demands.” Contact
Journal of Labor Economics, 2018, vol. 36, no. S1]2018 by The University of Chicago. All rights reserved. 0734-306X/2018/36S1-0015$10.00
ubmitted June 3, 2016; Accepted May 11, 2017
S337
This content downloaded from 206.253.207.235 on December 12, 2018 16:04:36 PMe subject to University of Chicago Press Terms and Conditions (http://www.journals.uchicago.edu/t-and-c).
S338 Deming/Kahn
A
specifically the computerization of the labor market (e.g., Autor, Levy, andMurnane 2003; Autor, Katz, and Kearney 2008; Acemoglu andAutor 2011;Goos, Manning, and Salomons 2014). This work focuses on changes in rel-ative demand across occupations that differ in the content of the tasks thatare typically performed on the job. For example, Autor et al. (2003) showthat the falling price of computer capital led to employment and wage re-ductions in routine task-intensive occupations and increases in cognitiveoccupations.One empirical limitation in the study of technological change is that ex-
isting data sources typically measure variation in workplace tasks across oc-cupations but not within them. This work typically proceeds by linkingmeasures of occupation task content—obtained from such data sources astheDictionary ofOccupational Titles (DOT) or theOccupational Informa-tion Network (O*NET)—with employment data. Autor et al. (2003) showthat cognitive-intensive occupations, such as being a doctor or lawyer, havebecome a larger share of the US labor force since the 1970s. This work doc-uments relative employment shifts across occupations but says nothingabout whether the tasks performed by doctors and lawyers have changedover time in response to technological change. Yet wage inequality has alsoincreased sharply within occupations in recent decades (e.g., Firpo, Fortin,and Lemieux 2009). Perhaps rising wage inequality across space and overtime is linked to changes in task content, even within narrowly defined cat-egories of occupations.In this paper, we study heterogeneity in employer skill demands using a
data set of job vacancies that encompasses nearly all jobs posted to an onlinesource in the United States from 2010 to 2015. We restrict our attention tojob ads for professional workers because of their likely broader scope forimportant variation in skill requirements. The data include detailed infor-mation about employers’ skill requirements for individual jobs, includingfirm identifiers and other important observable characteristics, such as oc-cupation, industry, and education and experience requirements. The dataalso include a vast and detailed set of job requirements, ranging from generalskills, such as problem solving or negotiation, to specific capabilities, suchas proficiency with specialized software (e.g., Java and SQL). Importantly,these data allow us to move beyond the limitations of existing work and askwhether there are labor market returns to skills even within narrowly de-fined occupation categories.We begin bywinnowing down the large variety of keywords and phrases
in job vacancy postings into 10 commonly observed and recognizable jobskills. Among others, these include cognitive skills, social skills, manage-ment, and finance. These skills definitions are motivated by the task litera-
e corresponding author, Lisa B. Kahn, at [email protected]. Information concern-g access to the data used in this paper is available as supplementary material online.
thin
This content downloaded from 206.253.207.235 on December 12, 2018 16:04:36 PMll use subject to University of Chicago Press Terms and Conditions (http://www.journals.uchicago.edu/t-and-c).

Skill Requirements across Firms and Labor Markets S339
A
ture that ties shifts in relative demand across occupations to technologicalchange. We first show that there is substantial heterogeneity in demand forthese skills, even within occupation, industry, and location and when con-trolling for other characteristics, such as education and experience require-ments. We next show that the prevalence of these skills is correlated withproxies for job productivity. Differences in employer skill demands predict oc-cupational wage premia across metropolitan statistical areas (MSAs), even aftercontrolling for a rich set of characteristics. We also show that variation in skilldemands is positively correlated with measures of firm performance. Finally,we show that the 10 job skills account for roughly 15% of the variation inour aggregated wage measure across firms. Overall, our results show that themeasures of advertised skill requirements found in job vacancy data are im-portant predictors of wage patterns beyond what is available in widely usedlabor market data.In principle, measures of skill requirements extracted from job vacancy
data can be used to study the returns to a variety of skills across occupations,labor markets, and other contexts. Here we focus on just two—cognitiveskills and social skills. A large literature shows that the returns to cognitiveskills have increased in recent decades, perhaps because computers comple-ment workers performing cognitively complex, abstract tasks (Autor et al.2003, 2008). More recent work suggests that the return to cognitive skillsmaybe evolving,with important consequences for income inequality. Beau-dry, Green, and Sand (2016) show that cognitive jobs as a whole saw littlewage or employment growth in the last decade, while researchers insteadpoint to a rising complementarity between cognitive and social skills (Borg-hans, ter Weel, and Weinberg 2014; Weinberger 2014; Deming 2017). In-deed, social skills may become increasingly important as computers substi-tute for a wider range of noninteractive tasks (Autor 2014; Lu 2015).1 Wehighlight cognitive and social skills because of their prominence in this lit-erature linking technological change to wage inequality and because of thesense that they are generally important in a wide range of professional jobs.This focus provides a clear illustration of what can be learned from the skillrequirements found in job postings relative to existing data.To understand whether stated preferences for cognitive and social skills
are indeed indicative of higher-skilled and more productive jobs, we investi-gate the relationship between this stated demand andproxies for productivityof workers in the advertised jobs. Because job ads tend not to specify wages(Kuhn and Shen 2013; Marinescu and Wolthoff 2016), we link our data totwo external sources measuring wages and performance at aggregated levels.First, we obtain average wages at the location-occupation (MSA by six-digit
1 For example, advances in automation of some types of cancer diagnoses andtreatment, as well as in legal e-discovery, make possible the automation of some as-pects of even doctors’ and lawyers’ jobs (Brynjolfsson and McAfee 2014; Deming2017).
This content downloaded from 206.253.207.235 on December 12, 2018 16:04:36 PMll use subject to University of Chicago Press Terms and Conditions (http://www.journals.uchicago.edu/t-and-c).

S340 Deming/Kahn
A
StandardOccupational Classification [SOC] occupation) level from the Oc-cupational Employment Statistics (OES) program. Second, we obtain twomeasures of firm performance: whether the firm posting the add is publiclytraded (as proxied by whether we can link the name to a firm in Compustat)and revenue per worker for publicly traded firms.We find that cognitive skill and social skill requirements in job ads pos-
itively predict occupational wage differences across local labormarkets evenafter controlling for education and experience requirements, MSA fixed ef-fects, and industry and occupation (six-digit) fixed effects. We also find apositive correlation between demand for both skills and firm performanceeven after controlling for other skill requirements and the average frequencyof firm vacancy postings within locations and occupations. These returnsare largely concentrated among ads that post both cognitive and social skillrequirements, which is consistent with the complementarity between cog-nitive skills and social skills found inWeinberger (2014) andDeming (2017).Our results suggest that variation in pay and performance across MSAs
and firms may partly reflect differences in skill demands. We estimate thatdemand for cognitive and social skills accounts for 5% of the variation infirm pay within our detailed set of controls (occupation, industry, educa-tion and experience requirements, and the other eight general skill require-ments) and for similar fractions of variation in firm performance. Our paymeasure masks considerable variation across firms since it is available onlyat an aggregatedMSA-occupation level. Wemight expect this percentage tobe even larger for worker-level pay.Our results are thus consistent with wage inequality across firms being
driven in part by differences in skill utilization, perhaps as some firms takebetter advantage of modern production technologies. Naturally, we do notobserve production technology in our data and cannot rule out that an omit-ted factor, evenwithin our detailed controls, drives both stated skill demandand outcomes. However, these results are interesting in light of recent re-search that points to widening pay differentials across firms and acrossUS cities as important contributors to the overall rise in inequality.2 Weuse our short panel to link variation in pay to variation in demand for tasksthat are particularly associated with rising inequality over time even thoughwe cannot speak to the time series on rising pay and performance differen-tials across firms and cities. We therefore provide a specific illustration ofhowour data can speak to the recent debate in the inequality literature basedon the changing demand for cognitive and social skills and the increasingcomplementarity between them (Weinberger 2014; Deming 2017; Beaudryet al. 2016).
2 For research on firms, see other papers in this issue as well as Barth et al. (2016),Card, Heining, and Kline (2013), and Song et al. (2015). For research on geographicsorting and agglomeration economies, see Glaeser and Gottlieb (2009), Moretti(2013), and Diamond (2016).
This content downloaded from 206.253.207.235 on December 12, 2018 16:04:36 PMll use subject to University of Chicago Press Terms and Conditions (http://www.journals.uchicago.edu/t-and-c).

Skill Requirements across Firms and Labor Markets S341
A
Research on the task content of occupations has furthered our understand-ing of broad labor market trends in inequality (e.g., Autor et al. 2003; Autorand Dorn 2013) as well as in human capital and worker mobility (Poletaevand Robinson 2008; Gathmann and Schonberg 2010; Speer 2017). Our re-sults show the usefulness of advertised skill requirements in explaining het-erogeneity in wages across firms and labor markets, even within narrowlydefined occupations. Firm identifiers in our data set allow us to relate inter-nal firm practices (i.e., stated preferences) to performance, yielding addi-tional explanatory power. In that spirit we are related to the important lit-erature measuring and relating management practices to firm performance(Ichniowski, Shaw, and Prennushi 1997; Bloom and Van Reenen 2007).We also join a growing set of papers that use job vacancy data to understanda variety of labor market issues, for example, how and when firms respondto technological change (Hershbein and Kahn 2016), firm preferences fordiscrimination (Kuhn and Shen 2013), and the general equilibrium effectsof unemployment insurance (Marinescu 2017).This paper proceeds as follows. In Section II we describe the data sets and
explain howwe classify 10 job skills from the thousands of keywords foundin the job ads. In Section III we show that these skills have explanatorypower in labor market pay and firm performance regressions even withina detailed set of job controls. In Section IV we decompose variation in firmlabor market pay and performance into components attributable to subsetsof skills measures as well as controls. Section V concludes with a brief dis-cussion of how job vacancy data could be used in the future.
II. Data
A. Overview
Our primary data source is a database of employment vacancies providedby Burning Glass Technologies (hereafter, BG), an employment analyticsand labor market information firm. BG examines nearly 40,000 online jobboards and company websites, removes duplicates, and parses the ads intoa systematic, machine-readable form. It uses the resulting database to createlabor market analytic products. BG claims that its database encompassesnearly all jobs posted to an online source during the time period ofmeasure-ment. The BGmicro data were first used by Hershbein and Kahn (2016) tostudy whether the Great Recession accelerated the adoption of routine-labor-saving technologies.Werestrict our attention toadsposted inprofessionaloccupations (roughly
60% of all ads).3 This category includes almost all occupations employing
3 Specifically, we restrict to major SOC categories 11–29, which include manage-ment, business and financial operations, computer and mathematical, architectureand engineering, the sciences, community and social services, legal, education, artsand entertainment, and healthcare practitioners and technical occupations.
This content downloaded from 206.253.207.235 on December 12, 2018 16:04:36 PMll use subject to University of Chicago Press Terms and Conditions (http://www.journals.uchicago.edu/t-and-c).
S342 Deming/Kahn
A
college-educated workers, and it has themost representative coverage in theBGdata (Carnevale, Jayasundera, andRepnikov 2014;Hershbein andKahn2016).4 Furthermore, professional occupations are the focus of the primarydebate to which we would like to speak. Focusing on professional occupa-tions, Beaudry et al. (2016) show that occupations requiring cognitive skillssaw no employment or wage growth in the 2000s. Deming (2017) insteadfindsgrowth inoccupations that requirebothcognitive and social skills, pro-viding evidence for an increasing complementarity precisely across higher-paying occupations. The BGdata provide a unique view of the cross-sectionalvariation in skill requirements within detailed occupations. The large samplesizes allowus to explore heterogeneity in skill demands across cities andfirms,with a particular focus on professional occupations.Our resulting data set contains nearly 45 million ads for the years 2010–
2015.5 The BG data include education and experience requirements, de-tailed industry and occupation codes (six-digit SOC), the location, the datethe ad was posted, and firm identifiers (where available) for each job va-cancy. BG also parses the actual text of each job vacancy and codes key-words and phrases as additional job requirements. In our sample, 93% ofads have at least one such requirement and, conditional on having any re-quirement, post an average of nine. In the next subsection, we describe howwe distill more than 10,000 unique keywords and phrases identified by BGinto a subset of general “job skills” that could be useful across a wide rangeof jobs.6
We focus on two samples: (1) the full set of professional ads (hereafter, thefull sample) and (2) the 63% of ads with a nonmissing firm.7 The latter sam-ple allows us to estimate heterogeneity in skill requirements across firms.For the firm sample, we further focus our attention on the remaining96%of ads from firms that have posted at least 10 ads total and ads in at leasttwo different professional occupations and at least two differentMSAs over
4 Naturally, data on job ads posted to an online source will not be perfectly rep-resentative of all job ads or of employment, even within professional occupations.See Hershbein and Kahn (2016), especially the data appendix, for more detail onsample representativeness, how the BG sample changes over time, and how skill re-quirements relate to the skills of employed workers.
5 We exclude micropolitan statistical areas from our analysis (roughly 5% ofads), since external data on wages and location characteristics is either unavailableor much less precise.
6 BG cleans and codes the text of job ads into a taxonomy of thousands of uniquebut standardized requirements. Beginning with a set of predefined possible skills,BG uses machine-learning algorithms to search text in an ad for an indication thatthe skill is required. For example, for teamwork they search for the keyword“teamwork” but also look for variations, such as “ability to work as a team.”
7 Ads that do not contain a firm identifier are typically obtained from recruiterwebsites, where the poster does not wish to reveal the information. We explore ro-bustness to this sample restriction below.
This content downloaded from 206.253.207.235 on December 12, 2018 16:04:36 PMll use subject to University of Chicago Press Terms and Conditions (http://www.journals.uchicago.edu/t-and-c).

Skill Requirements across Firms and Labor Markets S343
A
our sample period.8 These restrictions help clean out some noise in the firm-level variation in skill requirements that we explore. The resulting database(hereafter, the firm sample) contains nearly 86,000 unique firms.Only 13% of professional ads post the wage that is offered, which pre-
vents us from studying the relationship between skill demands and wagesfor individual job vacancies.9 Instead, we use two sources of external datathat allow us to relate average skill demands to wages across labor marketsand performance across firms.We obtain data on average wages for MSA-occupation (six-digit SOC)
cells from the OES program produced by the Bureau of Labor Statistics.The OES is a large survey of nonfarm establishments specially designed toproduce data at substate levels. Six percent of job vacancies are posted inMSA-occupation cells that cannot be matched to OES data or have sup-pressed wage data, likely because they are too small, and these cells were re-moved from this analysis.We obtain firm performance data from Compustat North America by
Standard & Poors.10 All publicly traded companies are required to trackaccounting and balance sheet data, making Compustat the most completedatabase of this information for US firms. We are able to match about 30%of ads in the firm sample to a publicly traded firm in Compustat.11 Our mainfirm performance measures are whether the firm is publicly traded, as mea-sured by whether the firm can be linked to Compustat, and, conditional onthe link being possible, the firm’s revenue per worker.We also obtain MSA demographic characteristics to use as control vari-
ables from American Community Survey (ACS) data. Here again we canmatch all but a small fraction of our sample (making up 3.5% of ads) tothe ACS, excluding some small cities.12
8 Firms with a very small number of posts likely represent data errors containingfragments of text from the ad that do not correspond to the firm name.
9 It is well known that ads for vacancies rarely post wage offers. See, e.g., Kuhnand Shen (2013) and Marinescu and Wolthoff (2016).
10 We obtain these data via Wharton Research Data Services.11 After cleaning firm names in both BG and Compustat to remove words like
“incorporated” and its associated abbreviations as well as all punctuation, we matchon the basis of exact name (75% of matched firms). We then use a fuzzy-match al-gorithm to link firms with at least a 95% chance of being the same (3% of matchedfirms). Finally, we match on the basis of a regularized subset of words. Hershbeinand Kahn (2016) also use this match. They point out that total employment inCompustat was 50% of US employment in these sample years, although employ-ment is not collected in a standardized way in Compustat and includes foreign af-filiates.
12 Demographic controls from the ACS include MSA-level share female, black,Hispanic, Asian, married, and moved in the last year. We also control for education(high school dropouts, exactly high school, some college, exactly BA) and age (lessthan 18, 19–29, 30–39, 40–49, 50–64) distributions. We set all controls to 0 if the
This content downloaded from 206.253.207.235 on December 12, 2018 16:04:36 PMll use subject to University of Chicago Press Terms and Conditions (http://www.journals.uchicago.edu/t-and-c).

S344 Deming/Kahn
A
Both wages and revenue per worker are available at an annual frequency.However, because the time series in the BG data is fairly short and becausejob ads likely represent intentions for the flow of new workers while wagesand firm performance variables reflect the stock of existing workers, we ag-gregate all data sources, taking an unweighted average across the years 2010–2015. We thus restrict our attention to cross-sectional relationships betweenaverage skill requirements at theMSA-occupation or firm level and wages orfirm performance. This aggregation has the advantage of smoothing outtime variation in skill requirements driven by factors outside the scope ofthis analysis, such as labor supply shocks or labor market conditions.13
Table A1 in the appendix provides summary statistics for ads in the fullsample (panel A), the firm sample (panel B), and the Compustat-matchedsample (panel C). The full sample has coverage in 56,611 MSA-occupation(six-digit SOC) cells, containing an average of nearly 800 ads, although thereis a wide range. The ad-weighted average wage is $42 per hour in our sampleof professional occupations.Thefirm sample (panel B) contains nearly 86,000firms posting an average
of 301 ads, each again with a wide range. The average ad is from a firm thatposts in roughly 100 occupations (of 352) and roughly 100 MSAs (of 371).This sample has coverage across nearly as many MSA-occupation cells asthe full sample (55,241), although with typically fewer ads per cell.Panel C shows that the 3,622 firms that can be matched to Compustat are
bigger. They post an average of 2,138 ads across a larger number of MSAs andoccupations. They still have coverage in more than 45,000 MSA-occupationcells, with an average of 173 ads per cell. The average ad is posted to a firmwith roughly half a million dollars in revenue per worker, and they pay slightlymore for professional workers ($44 per hour).
B. Job Skills in the BG Data
One contribution of this paper is to distill and analyze the keywords andphrases coded from the open text of ads in the BG data. But BG also codesthe more standard skill measures, education and experience. From table A1,59% of professional ads specify an education requirement that averages15.7 years of school (fitting modal years to degree requirements). Fifty-eightpercent of ads specify a requirement for experience in the field that averages4 years. The propensity to specify these requirements is higher in the firmsample and even higher in the Compustat-matched sample. Interestingly,
MSA did not match and include a dummy for whether the MSA matched to ACSdata.
13 Hershbein and Kahn (2016) show a persistent shift in skill requirements inMSAs hit harder by the Great Recession that is consistent with an increased adop-tion of routine-labor-saving technologies. Modestino, Shoag, and Ballance (2016)show that skill requirements are responsive to a labor supply shock: returningUS troops from Iraq and Afghanistan.
This content downloaded from 206.253.207.235 on December 12, 2018 16:04:36 PMll use subject to University of Chicago Press Terms and Conditions (http://www.journals.uchicago.edu/t-and-c).
Skill Requirements across Firms and Labor Markets S345
A
Hershbein and Kahn (2016) show that average education requirements inBG align well with the education levels of employed workers at the occu-pation and MSA levels. This shows that, for the most part, firms continueto specify skill requirements, even for high-skilled jobs where an educationrequirement might be assumed.14
Figure 1 provides some intuition for the relationship between educationrequirements and earnings among professional occupations. We plot de-meaned hourly wages (dark gray bars) from the OES ordered by their citywage rank for the 50 largest MSAs in terms of employment in professionaloccupations (according to the OES). Wage bars are followed by the corre-sponding demeaned years of schooling required for job vacancies posted inthat same MSA in the full sample. As figure 1 shows clearly, average wages(from the OES data) and average years of schooling required (from the BGdata) are strongly correlated (about 0.84 when weighted by MSA employ-ment). This correlation is reassuring that the BG data generally preserve theranking of labor markets by skill.We next explain how we make sense of the keywords and phrases coded
by BG. Using the more than 10,000 unique fields as our starting point, wecreate 10 categories of job skills that could be useful across a wide range ofjobs. Table 1 lists the 10 skills and provides the corresponding words andphrases that fall into each category. We code an ad as having a particularjob skill requirement if it has at least one of the keywords or phrases listed,although it may havemany. The skills are mutually exclusive but not collec-tively exhaustive—indeed, there are many other categories of job skills thatone could study.15
The first two skills listed in table 1 are “cognitive” and “social.” Job va-cancies that require cognitive skills ask for keywords and phrases such as“problem solving,” “research,” and “analytical.” We chose these skills de-liberately to match the description of the “nonroutine analytical” job tasksused inAutor et al. (2003) and other relatedwork.We group keywords suchas “communication,” “teamwork,” and “collaboration” under the headingof “social skills,” following closely the definition used in Deming (2017).For both cognitive and social skills, we check each key phrase to ensure thatits prevalence corresponds with occupations that the previous literaturetends to classify as cognitive or social.16
14 For example, most ads posted on the Job Openings in Economics websitespecify a PhD requirement.
15 Examples range from skills that are particularly useful in certain jobs (e.g.,plumbing) to business processes (e.g., Six Sigma) to very general attributes thatare hard to categorize (e.g., quick learner).
16 Specifically, at the occupation level we find that the share of ads containing agiven keyword is positively related to an index score for how cognitive or social theoccupation is. Index scores are based onO*NET 18.1 and stem frommeasures usedin Deming (2017) based on an earlier time period. Hershbein and Kahn (2016) alsofollow this approach.
This content downloaded from 206.253.207.235 on December 12, 2018 16:04:36 PMll use subject to University of Chicago Press Terms and Conditions (http://www.journals.uchicago.edu/t-and-c).

FIG.1.—
Wages
andeducationrequ
irem
entsby
city
wagerank
.Darkgray
barsshow
metropo
litan
statistic
alarea
(MSA
)average
wages
for
profession
aloccupatio
ns,o
btainedfrom
theOccup
ationalE
mploy
mentS
tatistic
sfor2010
to2015.L
ight
gray
bars
show
MSA
averageyears
ofscho
olingrequ
ired
inBurning
Glass
Techn
olog
iesjobadsfrom
2010
to2015,con
ditio
nalo
nhaving
anystated
requ
irem
ent.The
chart
includ
esthetop50
MSA
s(in
term
sof
employ
mentinprofession
aloccupatio
ns)a
ndisorderedby
MSA
wagerank
.Acolorversionof
this
figu
reisavailableon
line.
This content downloaded from 206.253.207.235 on December 12, 201All use subject to University of Chicago Press Terms and Conditions (http://www.jo
8 ur
16:0nals
4:3.uc
6 Phic
Mago
.edu/t-and-c).
Skill Requirements across Firms and Labor Markets S347
A
We categorize eight additional skill groups and show that these are im-portant in explaining pay differentials across labor markets and perfor-mance differentials across firms. The third skill, “character,” is an umbrellaterm for keywords and phrases such as “organized,” “detail oriented,” and“time management.”Here we follow the large literature on noncognitive or“soft” skills, which discusses the labor market returns to personality traits,such as conscientiousness and agreeableness, as well as personal attributes,such as self-control and positive affect (e.g., Heckman and Kautz 2012).Our criteria for the other seven job skills is that they be commonly listed
and generally applicable to a wide range of jobs. For example, writing, cus-tomer service, sales, and project management are among the top 15 most com-monly listed text fields in BGdata from 2014.We also create the skill categories“people management” and “financial” from a range of related keywords andphrases. Finally, we include categories for general and specific computer skills.BG codes these categories themselves. The former encompasses the genericphrase “computer skills” as well as key phrases for common software, such asMicrosoft Excel, while the latter includes specialized software, such as SQL,Java, and C11.To provide intuition for these job skills, table A2 shows the share of job
vacancies that require each skill for selected occupations in the full sample.As can be seen, this skill demand is fairly high for cognitive, social, and char-acter skills, which are required across a broad range of jobs. In addition, jobskills line up well with occupation titles and perceived job tasks. Eighty-four percent of vacancies for accountants and auditors require financialskills, comparedwith an average of only 16%across all professional occupa-tions. Similarly, the share of computer systems analysts requiring projectmanagement skills is particularly high, as is the share of computer program-
Table 1Description of Job Skills
Job Skills Keywords and Phrases
Cognitive Problem solving, research, analytical, critical thinking, math, statisticsSocial Communication, teamwork, collaboration, negotiation, presentationCharacter Organized, detail oriented, multitasking, time management, meeting
deadlines, energeticWriting WritingCustomer service Customer, sales, client, patientProject management Project managementPeople management Supervisory, leadership, management (not project), mentoring, staffFinancial Budgeting, accounting, finance, costComputer (general) Computer, spreadsheets, common software (e.g., Microsoft Excel,
PowerPoint)
Software (specific)Programming language or specialized software (e.g., Java, SQL,Python)
This content ll use subject to Universi
NOTE.—Shown is the authors categorization of open text fields in Burning Glass Technologies data.
downloaded from 206.253.207.235 on December 12, 2018 16:04:36 PMty of Chicago Press Terms and Conditions (http://www.journals.uchicago.edu/t-and-c).

S348 Deming/Kahn
A
mers requiring skill in a specific software program. Ads for registered nursesare more likely to specify a customer service requirement. Finally, there is alot of variation in skill requirements even within detailed occupation catego-ries. For example, among managers, financial manager vacancies are muchmore likely to require financial skills than are sales and general manager va-cancies. In contrast, customer service skills are much more likely to be re-quested for sales managers than for the other types.Our exercise falls very much in the spirit of the task literature, which cat-
alogs task requirements at the occupation level using the DOT or O*NETand explores variation over time or over a career (Autor et al. 2003; Poletaevand Robinson 2008; Gathmann and Schonberg 2010). In what follows, weprimarily focus on cognitive skills and social skills because they are impor-tant predictors of productivity andwages in awide variety of occupations andbecause of their prominence in the literature linking technological change towage inequality (e.g., Weinberger 2014; Deming 2017). While we can showthat the remaining skill measures have explanatory power in pay and perfor-mance regressions, we refrain from interpreting (or showing) the signs ormagnitudes of the coefficients on the other eight job skill measures. This is be-cause we do not have a general framework for analyzing them. Some skillsmay be valuable the higher the requirement, some may reflect horizontal dif-ferentiation in production or selection of workers, and others may substituteor complement each other. For example, listing “character” skills might be asignal of lower-paying jobs where obedience is required, even if character skillsthemselves are valuable in all jobs. We leave questions such as these for futurework.
C. Variation in Skill Requirements
Table A1 provides summary statistics for these measures. Thirty-seven per-cent of professional jobs specify a cognitive skill requirement, and 36% specifya social requirement.A quarter of ads specify both requirements. Frequencyof appearance for the other job skills ranges from one-ninth of ads (projectmanagement) to nearly a third (character and software). Skill requirements area bit more prevalent in the firm sample, especially for ads in the Compustat-matched sample.There is also substantial variation in skill requirements across ads. Fig-
ure 2 illustrates variation in skill requirements that can be accounted forby the other characteristics found in the ads.We regress the probability thatan ad posts a given skill on our most detailed set of controls: six-digit occu-pation, MSA, and firm fixed effects as well as education and experience re-quirements.17 We estimate this regression on the firm sample, which is re-
17 Education controls include an indicator for whether the ad has any educationrequirement and the number of years required if there is a requirement (otherwise,0); experience controls are analogous.
This content downloaded from 206.253.207.235 on December 12, 2018 16:04:36 PMll use subject to University of Chicago Press Terms and Conditions (http://www.journals.uchicago.edu/t-and-c).

Skill Requirements across Firms and Labor Markets S349
A
stricted to firms with at least 10 ads and postings in at least two MSAs andtwo occupations, to limit noise in the firm fixed effects.The bottom bar (solid dark gray) plots the variance in the fitted values for
the occupationfixed effects.Occupation typically accounts for a fairly smallfraction of the total variance in skill requirements, between 2% and 8%, ex-cept in finance and software, where it accounts for nearly 20%. This is in-tuitive given the nature of the skill requirements, and it gives us confidencethat our measures capture real variation in employer demands for the indi-cated skill.The next bar (brick pattern) plots the variance in fitted values for the re-
maining controls exceptfirm effects. Controls for location and themore typ-ical skill measures (education and experience) tend to account for roughly15% of the total variation. This is because, as we explain below, almost allof the skill measures are positively correlated with education and experiencerequirements and because the skill requirements in a location tend to reflectthe skill of employed workers in the location (see Hershbein and Kahn2016).
FIG. 2.—Variances in skill requirements. Data are based on the firm sample. Weregress an indicator for whether an ad has the skill requirement on occupation (six-digit) fixed effects, additional controls (metropolitan statistical area fixed effects andeducation and experience requirements), and firm fixed effects. Bars plot variancesof fitted values based on specified controls or the residuals. A color version of thisfigure is available online.
This content downloaded from 206.253.207.235 on December 12, 2018 16:04:36 PMll use subject to University of Chicago Press Terms and Conditions (http://www.journals.uchicago.edu/t-and-c).

S350 Deming/Kahn
A
The third bar (vertical line pattern) plots the variance in fitted values forthe firm fixed effects. Interestingly, we find that there is substantial system-atic variation across firms in their tendency to specify these skill require-ments. They account for nearly 30% of the total variation for most of theskill measures. Firms clearly have large systematic differences in their re-cruiting strategies and possibly differences in skill utilization, even control-ling for the distribution of occupations and MSAs they post in.Finally, there is substantial remaining variation across ads in the propen-
sity to specify these skill requirements, even within this very detailed set ofcontrols. The residual variances tend to be about half of the total variation inrequirements.Table 2 presents bivariate correlations for each pair of skill requirements,
weighted by ads, in the firm sample. There are two main takeaways fromtable 2. First, cognitive skill and social skill requirements are positively cor-related with each other, with years of education and experience required,and with most of the other eight job skills. This suggests that they are gen-eral skills deemed important by employers across a wide range of occupa-tions and labormarkets. Second, the correlations between education and ex-perience requirements and job skills are mostly positive but relatively small.This suggests that there is wide variation in employer skill demands evenafter accounting for education and experience requirements.
III. Skill Demands and Worker and Firm Outcomes
The goal of this paper is to understand whether pay differentials acrossmarkets and firms are associated with differences in demand for skills. Inparticular, are firms and markets that pay more also more likely to requireemployees to have cognitive skills, social skills, or both? Differences in de-mand for these skills and associated returns in terms of wages and firm per-formance may reflect variation in production technology, especially withinnarrowly defined occupations. Since we do not measure individual produc-tivity or wages directly in our data set, we use three proxies. The first is theaverage wage in the MSA-occupation cell, obtained from OES data, whichshould be correlatedwithwages paid byfirms posting ads in those same cells.The second is whether the firm is publicly traded, measured by whether wecan link the firm name to Compustat. Publicly traded firms are generallylarger, higher-paying, more successful firms, and we can ask whether thisfirm performance measure is correlated with the types of skills demanded.The third is log revenue per worker, conditional on being matched to Com-pustat. For this subset of firms, all of which are at least successful enough tobe publicly traded, we can ask whether differences in skill demand correlatewith differences in their bottom line.In thinking about the relationship between job skills and wages, a few
examples may be instructive. First, consider computer programmers in
This content downloaded from 206.253.207.235 on December 12, 2018 16:04:36 PMll use subject to University of Chicago Press Terms and Conditions (http://www.journals.uchicago.edu/t-and-c).

ThAll use subject to
Tab
le2
Correlation
sof
Skill
Requiremen
ts
Edu
catio
nExp
erience
Cog
nitiv
eSo
cial
Character
Writin
gCustomer
Service
Project
Mgm
tPeople
Mgm
tFinancial
Com
puter
Software
Years
ofeducation
requ
ired
1.00
Years
ofexperience
requ
ired
.30
1.00
Cog
nitiv
e.20
.37
1.00
Social
.05
.25
.64
1.00
Character
2.06
.14
.59
.69
1.00
Customer
service
2.27
2.38
2.03
.17
.14
1.00
Writin
g.12
.24
.57
.52
.52
2.07
1.00
Project
mgm
t.20
.57
.55
.45
.39
2.20
.39
1.00
Peoplemgm
t2.05
.01
.35
.34
.38
.13
.30
.27
1.00
Financial
.02
.21
.43
.35
.37
2.04
.36
.38
.39
1.00
Com
puter(general)
2.06
.27
.52
.52
.54
2.02
.50
.40
.24
.41
1.00
Software(specific)
.26
.61
.36
.25
.11
2.33
.24
.50
2.06
.02
.27
1.00
NOTE.—
The
tableshow
sad-w
eigh
tedbivariatecorrelations
across
allskillmeasuresatthefirm
levelu
sing
thefirm
sample.Seetable1forskillsdefinitio
ns.m
gmtp
managem
ent.
is
coUnnteive
nt drsity
own of C
loahi
dedcag
fro P
omres
20s T
6.2erm
53.s a
207nd
.23 Co
5 ond
n Ditio
ecns (
emhtt
berp://
1w
2, 2018 16:04:36 PMww.journals.uchicago.edu/t-and-c).

S352 Deming/Kahn
A
Washington, DC, versus Manchester-Nashua, New Hampshire. Hourlywages for computer programmers are about 25% higher in Washington,DC, than inNewHampshire. Thirty-five percent of computer programmervacancies in Washington, DC, require social skills, compared with only21% in Manchester-Nashua, and firms with computer programmer vacan-cies in Washington, DC, have about 10% higher revenue per worker thantheir New Hampshire counterparts.Hourly wages for management analysts are about 25% higher in San
Jose, California, than in SanDiego. Eighty-four percent of management an-alyst vacancies in San Jose require cognitive skills, comparedwith only 75%in San Diego, and firms with management analyst vacancies in San Jose arealso about 2 percentage points more likely to be publicly traded.Our hypothesis is that while most computer programmer vacancies re-
quire cognitive skills, computer programming jobs in Washington, DC,that also require social skills are performing more complex functions, per-haps strategizing with clients or overseeing coworkers, and are thereforemore productive. Similarly, while all management analysts likely requiresocial skills to interact with clients, those in San Jose may engage in morecomplex problem solving and analysis. These are only illustrative examples,and of course we cannot observe production technology in our data. But wefind the subsequent evidence on stated preferences of firms compelling andconsistent with this hypothesis.Of course, wages and job skill requirements may be correlated for a va-
riety of reasons. Washington, DC, and San Jose are more expensive citieswith more educated workers and different amenities than their counter-parts. We want to understand whether the skill requirements reflect differ-ences in how workers produce or simply pick up city- or occupation-widedifferences. To that end, we estimate regressions of the following generalform:
log Wageð Þom5 a 1 Skillomb0 1 Controls 1 eom: (1)
For a six-digit SOC occupation, o, and MSA,m, we regress the mean logwage (log(Wage)) as measured by the OES on a vector of average skill re-quirements (Skillom) of ads posted in the MSA-occupation cell in the BGdata. We experiment with a few different sets of controls, always includingthe more standard skill measures, education and experience.18 Additionalcontrols are added successively and are described below. All regressions
18 We control for the average years of education (experience) required in the cellas well as the share of ads with any education (experience) requirement. For MSA-occupation cells with no education (experience) requirement, the years variable isset to 0 and the share of ads with any requirement will equal 0, thus indicating thisimputation.
This content downloaded from 206.253.207.235 on December 12, 2018 16:04:36 PMll use subject to University of Chicago Press Terms and Conditions (http://www.journals.uchicago.edu/t-and-c).

Skill Requirements across Firms and Labor Markets S353
A
are weighted by the number of ads in each MSA-occupation cell, althoughresults are very similar when we instead weight by employment.Table 3 presents results from estimates of equation (1) on the full sample.
Column 1 summarizes a sparse model that includes the 10 skill measuresand the education and experience variables. The coefficient of 0.11 on cog-nitive skills is statistically significant at the less than 1% level. The magni-tude of the coefficient implies that a 10 percentage point increase in the shareof job vacancies requiring cognitive skills is associated with 1.1% higherwages. Alternatively, a 1 standard deviation increase in the propensity tospecify a cognitive skill requirement across occupation-MSA cells (0.17) in-creases wages by nearly 2%.We estimate that adding any cognitive skill re-quirement is associated with a roughly equivalent wage gain to increasingthe education or experience requirement by 1 year. The coefficient on socialskills is much larger in magnitude and also statistically significant at the lessthan 1% level. A standard deviation increase (0.12) in demand for social skillis associated with a 5% wage increase.
Table 3Average Wages and Skill Requirements
Dependent Variable: Log(Mean Wages) in MSA-Occupation Cells
(1) (2) (3) (4) (5) (6)
Cognitive .113*** 2.413*** .245*** .181*** .0792*** .0465***(.00908) (.0166) (.00784) (.0139) (.00873) (.0122)
Social .429*** 2.0919*** .301*** .236*** .0517*** .0202(.0155) (.0206) (.0121) (.0167) (.00966) (.0127)
Both required 1.319*** .157*** .0760***(.0349) (.0278) (.0198)
Years of education .131*** .129*** .0764*** .0765*** .00865*** .00873***(.000770) (.000763) (.000844) (.000844) (.000995) (.000995)
Years of experience .160*** .161*** .0848*** .0849*** .0318*** .0318***(.00120) (.00118) (.00120) (.00120) (.00102) (.00102)
Base controls X XDetailed controls X XF-statistic (cognitiveand social) 553.1 855.0 1,004 680.4 69.66 51.35
F-statistic (all 10 skills) 1,874 2,054 612.6 560.1 59.93 55.83MSA-occupation cells 56,611 56,611 56,611 56,611 56,611 56,611R2 .702 .710 .846 .846 .940 .941
This content dll use subject to University
ownloaded of Chicag
from 206.25o Press Term
3.207.235 s and Cond
on Decembitions (http:
er 12, 2018 1//www.journ
NOTE.—All regressions control for the share of ads with each of the eight other job skill, education, andexperience requirements. Years of education and experience equal 0 if the MSA-occupation cell has no adsthat specify requirements. The dependent variable is the log of median hourly earnings in the MSA-occupationcell, obtained fromOccupational Employment Statistics data. Base controls include metropolitan statisticalarea (MSA) characteristics from the American Community Survey, four-digit Standard Occupational Clas-sification (SOC) occupation fixed effects, and the share of ads in the MSA-occupation cell that are in each ofthe two-digit North American Industry Classification System industries. Detailed controls include MSA andsix-digit SOC occupation fixed effects and the industry shares. Observations are from the full sample, weightedby the number of ads in the MSA-occupation cell. See table 1 for skills definitions.*** p < .01.
6:04:36 PMals.uchicago.edu/t-and-c).
S354 Deming/Kahn
A
Column 2 adds the share of vacancies in each MSA-occupation cell withboth a cognitive skill and a social skill requirement. LikeWeinberger (2014)and Deming (2017), we find strong evidence of complementarity betweencognitive skills and social skills. Each of the positive correlations betweencognitive or social skill requirements and wages (found in col. 1) is ex-plained by vacancies that ask for both types of skills. The coefficient impliesthat a 1 standard deviation increase (0.10) in the share of vacancies requiringboth cognitive and social skills increases wages by 14%. Surprisingly, wefind a negative wage return for ads that require only cognitive or only socialskills, although this effect reverses with controls. We also report F-statisticsfor the cognitive and social variables (including the requirement for both ineven columns) and for the full set of skills. In both columns we can stronglyreject that these groups of coefficients are equal to 0 (p 5 :000).Columns 3 and 4 of table 3 add a base set of controls: four-digit SOC
occupation fixed effects, MSA characteristics from the ACS, and the distri-bution of ads across two-digitNorthAmerican IndustryClassification Sys-tem (NAICS) industries. These controls help adjust for a range of alterna-tive explanations for the positive correlation between skill requirements andwages. First, as noted, firms may post skill requirements in cities that havemore skilled workers, whichmay also bemore expensive cities where wagesare higher. Second, occupation and industry controls adjust for a range offactors, including differences in representation in online job ads, the pro-pensity to not post requirements because skills are assumed, and the pro-pensity to post requirements as a way of signaling something about thejob other than skill utilization in production. For example, jobs for a sales-person may in general not specify a social skill requirement because it is al-ways assumed, but within ads for salespeople the prevalence of keywordsmay signal a slightly different focus.Evenwithin these controls, the pattern of results is similar to the raw cor-
relations.While the coefficient on cognitive skill requirements increases andthe coefficient on social skills decreases, both remain positive and statisti-cally significant at the less than 1% level, and the interaction between thetwo skills in column 4 is also positive and statistically significant. We seepositive returns for each skill individually that double when the two are re-quired together. We can again strongly reject that the coefficients on cogni-tive and social skills are jointly equal to 0, and likewise for all 10 skills to-gether (p 5 :000 in both cases).Columns 5 and 6 fully saturate the model, controlling for six-digit occu-
pation fixed effects and MSA fixed effects in addition to industry shares.MSA fixed effects control for any pay differences across labor markets thatare due to common factors, such as cost of living or local amenities. Even inthis highly controlled specification, we can strongly reject that the coeffi-cients on cognitive and social skills—and all skills jointly—are equal to 0(p 5 :000 in both cases). Cognitive and social skill requirements are posi-
This content downloaded from 206.253.207.235 on December 12, 2018 16:04:36 PMll use subject to University of Chicago Press Terms and Conditions (http://www.journals.uchicago.edu/t-and-c).

Skill Requirements across Firms and Labor Markets S355
A
tively correlated with MSA-occupation wages, with the majority of the re-turn concentrated among ads that specify both requirements.The results in table 3 show clearly that data on the average skill require-
ments of jobs in local labormarkets have explanatory power beyondwhat isavailable in conventional data sources. Labormarkets paying relatively highwages to a particular occupation are likely to advertise for relatively highercognitive and social skill requirements. We still find a positive return forcognitive skills, and it nearly triples when social skills are also required. Itis also worth noting that the controls for the other job skills suggest thatthe returns to cognitive and social skills are not driven by their relative con-centration in particular job types, such as managerial or finance jobs, thatearn high returns. Table A3 shows that these results are very similar inthe firm sample.Next we ask whether larger and more productive firms post systematically
different skill requirements for the same occupations. We estimate the corre-lation between firm performance and skill requirements in the following re-gression framework:
Firm_perff 5 a0 1 Skillfb0 1 �Iof 1 �Xfg0 1 �Imf 1 vn 1 ef , (2)
where Skillf is a vector of firm average shares of job vacancies that requireeach skill, �Iof is the share of each firm’s postings belonging to each occupationcode, �Xf is a vector of average education and experience requirements, �Imfis the share of each firm’s postings belonging to each MSA or the ad-weightedaverage MSA characteristics of the firm, and vn is industry fixed effects. Weweight by the share of ads posted by the firm.Table 4 presents estimates of equation (2) for both firm performance out-
comes. We alternately include our base set of controls and more detailedcontrols, as in table 3. Columns 1–4 present results where the outcome isan indicator variable for whether the firm is publicly traded and is estimatedon the firm sample. We find evidence of a positive association between be-ing publicly traded and postings ads with cognitive skill and social skill re-quirements. This result holds with both the base set of controls (col. 1) andwhen controlling for occupation, industry, and MSA fixed effects (col. 3).The coefficients on cognitive skill requirements are positive in columns 1and 3 but are statistically significant only whenmore detailed controls are in-cluded. The coefficients on social skill requirements are larger than the resultsfor cognitive skills; moreover, they are positive and statistically significant atthe less than 1% level in both specifications. In column 1, the coefficientsimply that a 1 standard deviation increase in the share of vacancies with asocial skill requirement (the standard deviation across firms is about 0.2for both skills) is associatedwith a 3.2 percentage point increase in the prob-ability that a company is publicly traded. This is a 10% increase relative tothe baseline 30% probability that an ad is posted to a publicly traded firm.
This content downloaded from 206.253.207.235 on December 12, 2018 16:04:36 PMll use subject to University of Chicago Press Terms and Conditions (http://www.journals.uchicago.edu/t-and-c).

All u
Tab
le4
Firm
Outcomes
andAverage
Skill
Requiremen
ts
Pub
licly
Traded
Log
(Revenue
perWorker)
(1)
(2)
(3)
(4)
(5)
(6)
(7)
(8)
Cog
nitiv
e.0131
2.170***
.0318**
2.136***
.469***
.624***
.379***
.0761
(.0122)
(.0180)
(.0129)
(.0185)
(.117)
(.190)
(.136)
(.218)
Social
.162***
.0165
.0934***
2.0364**
.218**
.348**
.239*
2.00813
(.0114)
(.0115)
(.0115)
(.0154)
(.105)
(.164)
(.123)
(.185)
Bothrequ
ired
.365***
.328***
2.268
.531*
(.0262)
(.0260)
(.259)
(.298)
Years
ofeducation
2.00212
2.00141
2.00242*
2.00203
.00423
.00312
.00979
.00974
(.00134)
(.00134)
(.00135)
(.00135)
(.0222)
(.0222)
(.0266)
(.0266)
Years
ofexperience
.0236***
.0239***
.0125***
.0128***
.0851***
.0839***
.119***
.120***
(.00150)
(.00150)
(.00157)
(.00157)
(.0144)
(.0145)
(.0182)
(.0182)
Basecontrols
XX
XX
Detailedcontrols
XX
XX
F-statistic
(cog
nitiv
eandsocial)
110.2
138.1
41.93
81.19
12.43
8.644
6.560
5.432
F-statistic
(all10
skills)
181.6
183.1
130.3
133.2
10.96
10.06
4.072
3.993
Num
berof
firm
s85,695
85,695
85,695
85,695
3,622
3,622
3,622
3,622
R2
.246
.248
.330
.332
.511
.511
.736
.737
NOTE.—
Observatio
nsareat
thefirm
level,weigh
tedby
numberof
adspo
sted
bythefirm
.Allregression
scontrolfor
theshareof
adswith
each
oftheeigh
totherjobskill,ed-
ucation,
andexperience
requ
irem
ents.Y
ears
ofeducationandexperience
equal0
ifthefirm
hasno
adsthat
specify
requ
irem
ents.Incol.1–4,
thedepend
entv
ariableisan
indicator
equalto1ifthefirm
canbe
matched
toCom
pustat;incol.5–
8,itisequaltothelogof
revenu
eperworker,cond
ition
alon
beingmatched
toCom
pustat.B
asecontrolsinclud
etw
o-digitN
orth
American
Indu
stry
Classificatio
nSy
stem
indu
stry
fixedeffectsandthead-w
eigh
teddistribu
tions
offour-digitoccupatio
nfixedeffectsandmetropo
litan
statistic
alarea
(MSA
)characteristic
sfrom
theAmerican
Com
mun
itySu
rvey.D
etailedcontrolsinclud
eindu
stry
fixedeffectsandthead-w
eigh
teddistribu
tions
ofMSA
andsix-digitS
tand
ardOc-
cupatio
nalC
lassificatio
noccupatio
nfixedeffects.Seetable1forskillsdefinitio
ns.
*p<.1.
**p<.05.
***
p<.01.
se s
ub jec Tht tois co Un
nteive
nt drsit
owy o
nlof C
adhic
ed ago
fro Pr
m 2ess
06 Te
.25rm
3.2s an
07.d C
235on
ondit
Dion
eces (h
mtt
bep:
r 1//w
2w
, 2w.
01jo
8 1urn
6a
:04ls.u:36 PMchicago.edu/t-and-c).

Skill Requirements across Firms and Labor Markets S357
A
Columns 2 and 4 add the share of vacancies that require both types ofskills. We see strong evidence of complementarity in both specifications.A 1 standard deviation increase in the probability that both skills are re-quired (0.16) is associated with a 6 percentage point increase in the proba-bility of being publicly traded. Note also that the social and cognitive coef-ficients are jointly significant, as is the full set of skill requirements. Theseskill measures thus add explanatory power above and beyond the typicallyavailable control variables.Columns 5–8 report results for log revenue per worker among the 3,622
firms in our data that are publicly traded. Since this restriction limits oursample to the 30%of adds that are posted by a publicly tradedfirm,we viewthese results with caution. Still, it is interesting to note that the correlationbetween skill requirements and revenue per worker, a proxy for firm pro-ductivity, holds even within a small sample of large, publicly traded firms.Column 5 shows that firms with higher revenue per worker also have sig-nificantly higher cognitive skill and social skill requirements. In our basespecification, returns load primarily on the main effects of cognitive and so-cial skills and not on the requirement for both (col. 6). However, with thefull set of controls in col. 8, the return is entirely concentrated in ads that havea joint requirement. Again, in all specifications we can reject the hypothesesthat skills are jointly equal to 0. Overall, the results in table 4 show that skillrequirements are strongly correlated with proxies for firm productivity.19
In this section, we have shown that job skills have significant explanatorypower for wages and firm performance above and beyond variation ex-plained by typical controls of detailed occupation, industry, and location.Furthermore, we find evidence of a complementarity between stated pref-erences for cognitive and social skills in that they are positively related topay and firm performance, especially with our strictest set of controls.Our preferred explanation is that the stated preferences indicate differencesin skill utilization, perhaps indicating that some firms take better advantageof modern technologies (which may require cognitive skills, social skills, orboth) andwith commensurate productivity gains.Naturally, we cannot ruleout that these correlations are driven by unobserved aspects of labor mar-kets and firms. However, we add to the previous literature by showing thatthese positive correlations hold within a rich set of controls and, most no-tably, six-digit occupation fixed effects.
19 It may seem surprising that the average years of education required by the firmis not positively correlated with firm performance. However, as noted we also con-trol for the share of ads that have any education requirement. This variable is highlycorrelated with the years required, since firms demanding more skilled workers areboth more likely to post any requirement and also post for more years conditionalon having a requirement. We find that the coefficient on the share of ads with anyrequirement is positive and usually highly significant even while the number ofyears required, conditional on any, is not.
This content downloaded from 206.253.207.235 on December 12, 2018 16:04:36 PMll use subject to University of Chicago Press Terms and Conditions (http://www.journals.uchicago.edu/t-and-c).

S358 Deming/Kahn
A
IV. Heterogeneity across Firms and Skill Demand
We have shown that jobs requiring more cognitive and social skills paymore and that firms requiring more of these skills perform better. Further-more, the full set of job skills explains a significant amount of variation inworker pay and firm performance even when we include detailed controlsfor occupation, industry, and location. Variation infirmpay, controlling forworker quality, accounts for an important fraction of the rise in income in-equality over the past 30 years (Card et al. 2013; Song et al. 2015; Barth et al.2016). If firms also vary systematically in their propensity to ask for partic-ular skills in job vacancies, then perhaps skill requirements can also accountfor some share of the variation in pay across firms.On the basis of the relationship between skill requirements and pay and
performance established above, we can calculate howmuch of the variationin pay across firms can be accounted for by any variation in skill require-ments. Consider equation (3), which expresses log(Wages) for an occupa-tion, o; MSA,m; and firm, f. b f are firm fixed effects, and Controls are typ-ical controls found in other data sets. This regression is estimated at thefirm-occupation-MSA level and is weighted by the number of ads in a cell.
log Wagesð Þomf5 bf 1 Controls 1 eomf : (3)
Thefirst columnof table 5gives ageneral senseof variability in log(Wages)that can be attributed to firms. Here we present the ad-weighted standarddeviations of bf in the raw data (col. 1), including our base set of controls(col. 2), and includingour detailed controls (col. 3). Thewagemeasuremaskssubstantial heterogeneity since it simplymapsMSA-occupationOESwagesontofirmsby taking aweighted average acrossmarkets afirmposts in.How-ever, in row 1, column 1, we still find substantial variation across firms; afirm that pays a standard deviation higher wages pays about 21% more(0.19 log points). From column 2, we find that half of this variation remainswhen we include base controls. However, naturally, full controls for MSAand six-digit occupation absorb most of the variation in MSA-occupation-level wages (col. 3). This is a limitation of the fact that we cannot link wagesto actual job postings.The remaining rows of table 5 summarize firm-level variation for the re-
maining variables, obtained by estimating equation (3) separately for eachlisted dependent variable.We provide standard deviations for the firm-leveloutcomes, although since we cannot separately identify control variables,we omit estimates in columns 2 and 3. A firm that is 1 standard deviationmore likely to be publicly traded is 46 percentage points more likely tobe publicly traded, while a firm with 1 standard deviation higher revenueper worker is producing about double (0.83).The table also shows variation in the average propensity to specify each
job skill, and again, as noted in Section II.C, we find substantial variation
This content downloaded from 206.253.207.235 on December 12, 2018 16:04:36 PMll use subject to University of Chicago Press Terms and Conditions (http://www.journals.uchicago.edu/t-and-c).

20 This decomposition follows the spirit of Altonji, Kahn, and Speer (2014), whodecompose variation in the returns to college major over time into changes in thereturns to tasks preformed in jobs typically held by workers with a given major.
Skill Requirements across Firms and Labor Markets S359
This content downloaded from 206.253.207.235 on December 12, 2018 16:04:36 PMAll use subject to University of Chicago Press Terms and Conditions (http://www.journals.uchicag
across firms. The standard deviation of firm effects for skill requirements isabout 0.2 (20 percentage points) for both cognitive skills and social skills,and the variation shrinks only a little even after including detailed controls.The pattern is very similar for the other eight job skills, although the vari-ation is generally smaller for most of them (especially after including de-tailed controls in col. 3). Thus, table 5 shows substantial heterogeneity infirm skill demands even within occupation, industry, and MSA.To illustrate the importance of employer skill demands, we combine the
positive correlation between skill requirements and job outcomes shown inSection III with the variation documented in table 5 in a simple variance de-composition.20 The firm fixed effects (bf in eq. [3]) incorporate unobservedsystematic differences in earnings across firms. We express these as a func-tion of a vector of skill demands (Skillf ) and a residual (nf) in equation (4);d is the coefficient on the residual, and a is a vector of coefficients on the skillsvariables.
bf 5 Skillfa0 1 dnf : (4)
Table 5Standard Deviations of Firm Effects in Outcomes and Skills
No Controls(1)
Base Controls(2)
Detailed Controls(3)
Log hourly wages .190 .101 .027Publicly traded .459Log revenue per worker .827Cognitive .203 .176 .168Social .201 .190 .186Cognitive and social .162 .149 .145Character .188 .172 .167Customer service .180 .160 .149Writing .154 .143 .140Project management .106 .098 .081People management .125 .122 .116Financial .141 .101 .091Computer (general) .185 .168 .163Software (specific) .244 .172 .136
NOTE.—We regress the variable in each row on firm fixed effects and specified controls.The table reports standard deviations of the firm fixed effects, weighted by the number ofpostings to each firm. Base controls include metropolitan statistical area (MSA) characteris-tics, four-digit occupation fixed effects, and industry fixed effects. Detailed controls includeMSA, six-digit occupation, and industry fixed effects. Specifications including controls areomitted for “Publicly traded” and “Log revenue per worker,” since they vary only at the firmlevel.
o.edu/t-and-c).

S360 Deming/Kahn
A
Plugging equation (4) into equation (3) yields
log Wagesð Þomf5 Skillfa0 1 dnf 1 Controls 1 eomf : (5)
This model provides a way to decompose the variance of log wages acrossfirms into skill requirements and other components. In particular, the var-iance in the firm effects, Var(bf ), is equal to VarðSkillfa0 1 dnf Þ. We can cal-culate the variance in bf that is attributable to the skills variables or to a sub-set of the skills variables by setting the other coefficients (components of thevectora) to 0 and calculating the variance.21We alsouse the variance-covariancematrix of the skills variables as an input. Importantly, while variation in firmfixed effects in both wages and skill requirements is in part driven by mea-surement error, the correlations in the vector a are unlikely to include suchmeasurement error.We estimate equations (3)–(5) on a disaggregatedMSA-occupation-firm-
level data set. The results are presented in table 6. Column 1 shows a simpledecomposition that includes no controls and only the social, cognitive, andcombined skill measures. Column 2 adds the remaining eight job skills aswell as education and experience requirements. Column 3 adds our base
Table 6Decomposing Firm Effects in Wages on Skill Demands
Log(Wages)
(1) (2) (3) (4)
Total standard deviation of firm effect .190 .190 .084 .025Share attributed to skills (%):Total 11.6 33.9 20.9 6.3Social and cognitive skills 11.6 5.5 4.7 1.3Other skills 11.3 7.3 .6Education and experience 17.1 8.9 4.5Residual 88.4 66.1 79.1 93.7
Additional skills X X XBase controls XDetailed controls XNumber of firms 85,695
21 For example, to understand the fracnitive and social skills, we calculate Varcients for cognitive social and the interacponents of a and for d.
This content downloaded from 206ll use subject to University of Chicago Press Te
tion of the vðSkillfa0 1 dtion but use
.253.207.235 rms and Cond
ariance in bnf Þ using tha value of 0
on December 1itions (http://w
f attributed te estimatedfor all other
2, 2018 16:04ww.journals.u
NOTE.—Base controls are metropolitan statistical area (MSA) characteristics and four-digit occupationfixed effects. Detailed controls are MSA and six-digit occupation fixed effects. Social and cognitive skillsinclude requirements for each and the share of ads specifying both. Other skills include the eight additionaljob skills listed in table 1. Education and experience include both years required and the share of ads thathave any requirement. We regress the firm fixed effect in wages on the firm fixed effect for each of the skillmeasures (and controls if included). We use coefficients and the variance-covariance matrix of the skills tofit the share of the variance in wages that can be attributed to various components (by fitting variances withthe other coefficients set to 0).
o cog-coeffi-com-
:36 PMchicago.edu/t-and-c).

Skill Requirements across Firms and Labor Markets S361
A
controls (excluding industry fixed effects, since those are collinear with firmfixed effects bf ), and column 4 ads detailed controls.From column 1, the total standard deviation of the firmwage effect with-
out controls is 0.19 (the same number as in col. 1, row 1, of table 5). We findthat 12% of this variation can be accounted for by variation in the propen-sity to list cognitive and social skill requirements and the positive wage re-turn of these skills. The remaining 88% goes unexplained. In column 2, wealso allow the remaining skill measures to account forfirm-level variation inwages.Whenwe do, we find that the share attributed to cognitive and socialskills falls in half to 5.5% because these two skills are correlated with otherskill measures. Education and experience requirements account for the larg-est fraction, 17%, while the other eight job skills account for 11%. In total,we can account for a third of the variation in raw earnings gaps across firmswith these skill measures.Once we include our base controls (col. 3), the firmwage gap narrows by
about half (as we saw in table 5). Also, we find that the full set of skill mea-sures accounts for 21% of this residual variation. All of the skill measuresare important in accounting for this variation, with nearly half accountedfor by education and experience requirements and a third by the other eightskill measures. In both columns 2 and 3, we find that the set of 10 skills ac-count for roughly 15% of the variation in firm pay, while cognitive and so-cial skills account for 5%.The fourth column includes the detailed controls. As noted above, con-
trols for MSA and six-digit occupation fixed effects absorb almost all of thevariation in firm pay. This is because firm variation in our pay measurecomes only from variation in the MSA-occupation cells that firms postin. As such, this exercise naturally has limitations. However, the results intable 6 show that skills measures are important in accounting for firm-levelvariation in these aggregated wages. This suggests that they might also beimportant for job-level wages.We can also conduct a form of this decomposition for the firm perfor-
mance measures (table 7). These measures vary only at the firm level, sowe cannot include controls. We instead estimate an analogous version ofequations (3)–(5) with no controls or residuals. We can still report the frac-tion of the variation in performance across firms that can be attributed tovariation in skill requirements.We find that the skill measures account for a modest fraction of the vari-
ation across firms in performance. The 10 skills account for 5% of the var-iation in the probability of being publicly traded (col. 2) and roughly 12%ofthe variation in log revenue perworker. For the latter, the bulk of the explan-atory power comes from cognitive and social skill requirements. Educationand experience requirements contribute substantial explanatory power aswell. Overall, we can account for 13% and 20% of the variation in whethera firm is publicly traded and log revenue per worker, respectively, with the
This content downloaded from 206.253.207.235 on December 12, 2018 16:04:36 PMll use subject to University of Chicago Press Terms and Conditions (http://www.journals.uchicago.edu/t-and-c).

S362 Deming/Kahn
A
full set of 10 skills and the more standard education and experience require-ments.This exercise is only illustrative since we do not have ad-level variation in
wages or productivity. However, we still find that firms varywidely in bothwages (as measured by average wages in the markets they post ads in) andperformance outcomes. In addition, we find that firm-level variation in de-mand for the job skills explains substantial fractions of firm-level variationin these outcomes. Cognitive and social skill requirements alone accountfor about 5% of the variation in log(Wages) and 10% of the variation inlog(Revenue per Worker). These results suggest that the job skill measureswe introduce in this paper provide useful information about the variation inskill utilization across firms and why they have diverse outcomes.
V. Conclusion
In this paper, we use data from online job vacancies posted in the UnitedStates between 2010 and 2015 to study heterogeneity in employer skill de-mands. We use keywords and phrases from the actual text of job vacanciesto form measures of 10 distinct job skills, such as cognitive skills, socialskills, management, and finance. We show that the prevalence of advertise-ments for high-level job skills is positively correlated with relative wagesacross labor markets and performance differences across firms, even aftercontrolling for education and experience requirements and detailed occupa-tion and industry codes. This suggests that our measures of job skills addexplanatory power beyond what is available in typical labor market data.Using a simple decomposition, we show that variation in these 10 skill re-quirements can explain about 12% of the variance in wages across firms (asmeasured by average wages in the MSA occupations they tend to post in)after residualizing on occupation fixed effects and MSA characteristics. Theseskills account for between 5% and 12% of the variance in firm productivityin our sample.
Table 7Decomposing Firm Performance Outcomes on Skill Demands
Publicly Traded Log(Revenue per Worker)
(1) (2) (3) (4)
Total standard deviation of firm effect .459 .459 .685 .685Share attributed to skills (%):Total 7.2 13.2 14.8 21.4Social and cognitive skills 7.2 1.7 14.8 9.4Other skills 3.8 3.1Education and experience 7.7 8.9Residual 92.8 86.8 85.2 78.6
Additional skills X XNumber of firms 85,695 3,622
This content downloaded fromll use subject to University of Chicago Pre
206.253.207.235 on Decss Terms and Conditions
ember 12, 2018(http://www.jou
NOTE.—See table 6.
16:04:36 PMrnals.uchicago.edu/t-and-c).

Skill Requirements across Firms and Labor Markets S363
A
Turning to specific job skills, we find consistent evidence that higher-paying labor markets and firms demand higher levels of cognitive skillsand social skills from their employees. Moreover, we find particularly largecorrelations between wages and whether a job vacancy requires both typesof skill. This is consistent with recent theory and evidence fromWeinberger(2014) and Deming (2017), who focus on the growing importance of socialskills and growing complementarity between cognitive skills and social skillsin the labor market. We also find that more productive firms—as measuredby log revenue per worker as well as whether the firm is publicly traded—have greater demand for cognitive skills and social skills even after control-ling for a detailed set of job characteristics, such as industry and occupation.Our decomposition shows that cognitive and social skill requirements, inparticular, account for 5% of residual variation in wages and between 2%and 9% of variation in firm productivity.Rising variation in pay across firms, holding constant the quality of work-
ers they employ, has been shown to be a primary contributor of rising wageinequality (Card et al. 2013; Song et al. 2015; Barth et al. 2016). Our resultsshow that some of the variation in pay acrossfirms in the cross section can beaccounted for by variation in demand for cognitive and social skills.We can-notmeasure production technologies directly in theBGdata, nor dowe havevariation in skill demands over a long time horizon. However, by linkingvariation in pay in the cross section to tasks that are most associatedwith ris-ing inequality over time, we hope to provide suggestive evidence on thisfront. Our results are consistent with at least some of the rise in inequalityacross firms being driven by a differential ability to adopt better productiontechnologies that are more complementary with machines.More generally, this paper demonstrates the usefulness of job vacancy
data for studying employer skill demands and relative wages across labormarkets and occupations. Future work could pair job vacancy data with de-tailed information about firm characteristics and production technology.This would enable researchers to study changes in the returns to specificskill requirements with a better understanding of how heterogeneity in skilldemands translates to firm production technology.
This content downloaded from 206.253.207.235 on December 12, 2018 16:04:36 PMll use subject to University of Chicago Press Terms and Conditions (http://www.journals.uchicago.edu/t-and-c).

App
endix
Tab
leA1
SummaryStatistics
A.F
ullS
ample
B.F
irm
Sample
C.C
ompu
stat
Matched
Mean
SDMin
Max
Mean
SDMin
Max
Mean
SDMin
Max
Shareof
adswith
skill
requ
irem
ent:
Cog
nitiv
e.370
.170
01
.418
.203
01
.487
.173
01
Social
.363
.120
01
.422
.201
01
.501
.172
01
Cog
nitiv
eandsocial
.206
.099
01
.249
.162
01
.311
.152
01
Character
.299
.123
01
.344
.188
01
.411
.154
01
Writin
g.200
.095
01
.229
.154
01
.258
.132
0.99
Customer
service
.197
.142
01
.236
.180
01
.260
.154
01
Project
managem
ent
.117
.122
01
.130
.106
01
.162
.094
0.81
Peoplemanagem
ent
.151
.095
01
.184
.125
01
.212
.110
0.92
Financial
.157
.192
01
.165
.141
01
.196
.120
0.99
Com
puter(general)
.288
.135
01
.316
.185
01
.370
.155
01
Software(specific)
.319
.279
01
.316
.244
01
.354
.205
01
Edu
catio
n.588
.161
01
.659
.218
01
.721
.168
01
Exp
erience
.578
.131
01
.623
.201
01
.671
.170
01
Years
ofscho
ol,con
ditio
nal
15.74
1.35
1221
15.66
.92
1221
15.59
.75
1219.22
Years
ofexperience,con
ditio
nal
4.10
1.31
.08
154.14
1.49
.08
154.57
1.39
.31
10.80
S364
This content downloaded from 206.253.207.235 on December 12, 2018 16:04:36 PMAll use subject to University of Chicago Press Terms and Conditions (http://www.journals.uchicago.edu/t-and-c).

Tab
leA1(C
ontinu
ed)
A.F
ullS
ample
B.F
irm
Sample
C.C
ompu
stat
Matched
Mean
SDMin
Max
Mean
SDMin
Max
Mean
SDMin
Max
MSA
-occup
ationmedianwage
41.97
15.60
8.15
135.00
42.21
7.26
11.96
107.95
43.74
6.17
17.71
77.06
Pub
licly
traded
NA
.303
.459
01
1.000
.000
1.000
1.000
Revenue
perworker($
millions)
.473
3.329
.000
562
.473
3.329
.000
562
Num
berof
occupatio
nspo
sted
in98.22
59.45
1246
133.95
50.08
2228
Num
berof
MSA
spo
sted
in106.19
101.75
1370
172.82
104.13
1354
Num
berof
MSA
-occup
ationcells
56,611
55,241
45,154
Num
berof
adsperMSA
-occup
ation
cell(unw
eigh
ted)
793
4,911
1351,149
467
2,862
1177,690
173
1,063
159,501
Num
berof
firm
cells
85,695
3,622
Num
berof
adsperfirm
cell(unw
eigh
ted)
301
246
1254,518
2,138
8,519
5162,640
Num
berof
ads,total
44,891,978
25,803,549
7,743,967
NOTE.—
PanelA
includ
esprofession
alBurning
Glass
Techn
olog
ies(BG)a
dsfrom
2010
to2015.P
anelBisrestricted
toadswith
nonm
issing
firm
sthat
postat
least1
0adsin
the
sampleas
awho
leandadsin
atleasttwoMSA
sandtw
ooccupatio
ns.P
anelC
isrestricted
tofirm
sthatcanbe
matched
toCom
pustat.Sum
marystatistic
sareweigh
tedby
numberof
ads,un
lessotherw
iseno
ted.
Skill
requ
irem
entscomefrom
BG
data;see
table1ford
escriptio
ns.M
edianwage(from
theOccup
ationalE
mploy
mentS
tatistic
s)andrevenu
eperworker
(from
Com
pustat)aretheaveragefrom
2010
to2015
intheMSA
-occup
ationor
firm
cell,
respectiv
ely.
NA
5no
tapplicable.
S365
This content downloaded from 206.253.207.235 on December 12, 2018 16:04:36 PMAll use subject to University of Chicago Press Terms and Conditions (http://www.journals.uchicago.edu/t-and-c).
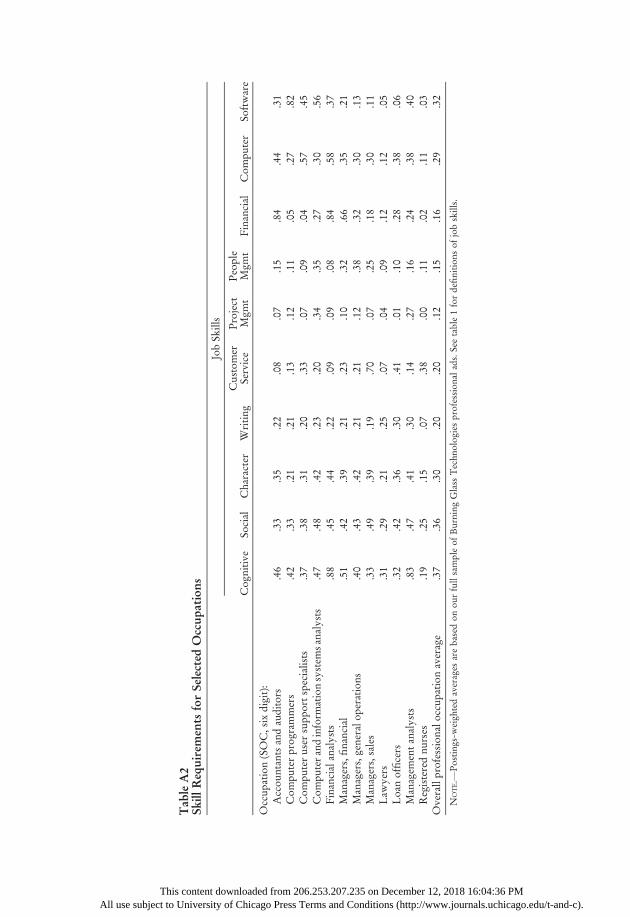
ThAll use subject t
Tab
leA2
Skill
Requiremen
tsforSelected
Occup
ations
JobSk
ills
Cog
nitiv
eSo
cial
Character
Writin
gCustomer
Service
Project
Mgm
tPeople
Mgm
tFinancial
Com
puter
Software
Occup
ation(SOC,six
digit):
Accou
ntantsandauditors
.46
.33
.35
.22
.08
.07
.15
.84
.44
.31
Com
puterprog
rammers
.42
.33
.21
.21
.13
.12
.11
.05
.27
.82
Com
puteruser
supp
ortspecialists
.37
.38
.31
.20
.33
.07
.09
.04
.57
.45
Com
putera
ndinform
ationsystem
sanalysts
.47
.48
.42
.23
.20
.34
.35
.27
.30
.56
Financialanalysts
.88
.45
.44
.22
.09
.09
.08
.84
.58
.37
Managers,financial
.51
.42
.39
.21
.23
.10
.32
.66
.35
.21
Managers,generalo
peratio
ns.40
.43
.42
.21
.21
.12
.38
.32
.30
.13
Managers,sales
.33
.49
.39
.19
.70
.07
.25
.18
.30
.11
Law
yers
.31
.29
.21
.25
.07
.04
.09
.12
.12
.05
Loanofficers
.32
.42
.36
.30
.41
.01
.10
.28
.38
.06
Managem
enta
nalysts
.83
.47
.41
.30
.14
.27
.16
.24
.38
.40
Registerednu
rses
.19
.25
.15
.07
.38
.00
.11
.02
.11
.03
Overallprofession
aloccupatio
naverage
.37
.36
.30
.20
.20
.12
.15
.16
.29
.32
NOTE.—
Postin
gs-w
eigh
tedaverages
arebasedon
ourfullsampleof
Burning
Glass
Techn
olog
iesprofession
alads.Seetable1fordefinitio
nsof
jobskills.
o
is c Unontiv
ent dowersity of
nloa Chi
dedcag
fro P
omres
20s T
6.2erm
53.s a
207nd
.23 Co
5 ond
n Ditio
ecns (
emhtt
berp://
12ww
, w
2018 16:04:36 PM.journals.uchicago.edu/t-and-c).
Skill Requirements across Firms and Labor Markets S367
A
Table A3Average Wages and Skill Requirements—Firm Sample
Dependent Variable: Log(Mean Wages) in MSA-Occupation Cells
(1) (2) (3) (4) (5) (6)
Cognitive .123*** 2.299*** .164*** .150*** .0471*** .0286***(.00886) (.0155) (.00749) (.0125) (.00704) (.00994)
Social .300*** 2.0788*** .144*** .132*** .0333*** .0167*(.0127) (.0170) (.00995) (.0135) (.00749) (.00980)
Both required .945*** .0288 .0402***(.0286) (.0220) (.0153)
Years of education .125*** .123*** .0580*** .0580*** .00486*** .00490***(.000795) (.000790) (.000840) (.000841) (.000836) (.000836)
Years of experience .165*** .167*** .0620*** .0620*** .0208*** .0208***(.00114) (.00113) (.00120) (.00120) (.000957) (.000957)
Base controls X XDetailed controls X XF-statistic (cognitiveand social) 450.8 669.5 418.2 279.4 41.01 29.63
F-statistic (all 10 skills) 2,073 2,218 406.8 369.9 30.45 28.31MSA-occupation cells 55,241 55,241 55,241 55,241 55,241 55,241R2 .696 .701 .856 .856 .943 .943
This content dll use subject to University
ownloaded of Chicag
from 206.25o Press Term
3.207.235 s and Cond
on Decembitions (http:
er 12, 2018 1//www.journ
NOTE.—See tables 1 and 3. Observations are from the firm sample. MSA 5 metropolitan statistical area.* p < .1.*** p < .01.
References
Acemoglu, D., and D. Autor. 2011. Skills, tasks and technologies: Implica-tions for employment and earnings. InHandbook of labor economics, ed.David Card and Orley Ashenfelter, vol. 4B, 1043–1171. Amsterdam: El-sevier.
Altonji, Joseph G., Lisa B. Kahn, and Jamin D. Speer. 2014. Trends in earn-ings differentials across collegemajors and the changing task compositionof jobs. American Economic Review Papers and Proceedings 104, no. 5:387–93.
Autor, David H. 2014. Polanyi’s paradox and the shape of employmentgrowth.NBERWorking Paper no. 20485,National Bureau of EconomicResearch, Cambridge, MA.
Autor, David H., and David Dorn. 2013. The growth of low-skill servicejobs and the polarization of the US labor market. American EconomicReview 103, no. 5:1553–97.
Autor, David H., Lawrence F. Katz, and Melissa S. Kearney. 2008. Trendsin US wage inequality: Revising the revisionists. Review of Economicsand Statistics 90, no. 2:300–323.
Autor, DavidH., Frank Levy, and Richard J.Murnane. 2003. The skill con-tent of recent technological change: An empirical exploration.QuarterlyJournal of Economics 118, no. 4:1279–1333.
6:04:36 PMals.uchicago.edu/t-and-c).

S368 Deming/Kahn
A
Barth, Erling, Alex Bryson, James C. Davis, and Richard Freeman. 2016.It’s where you work: Increases in the dispersion of earnings across estab-lishments and individuals in the United States. Journal of Labor Econom-ics 34, no. 2, suppl. (April): S67–S97.
Beaudry, Paul, David A. Green, and BenjaminM. Sand. 2016. The great re-versal in the demand for skill and cognitive tasks. Journal of Labor Eco-nomics 34, no. 2, suppl. (April): S199–S247.
Bloom, Nicholas, and John Van Reenen. 2007. Measuring and explainingmanagement practices across firms and countries. Quarterly Journal ofEconomics 122, no. 4:1351–1408.
Borghans, Lex, Bas ter Weel, and Bruce A. Weinberg. 2014. People skillsand the labor-market outcomes of underrepresented groups. Industrialand Labor Relations Review 67, no. 2:287–334.
Brynjolfsson, Erik, and Andrew McAfee. 2014. The second machine age:Work, progress and prosperity in a time of brilliant technologies. NewYork: Norton.
Card, David, Jörg Heining, and Patrick Kline. 2013. Workplace heteroge-neity and the rise of West German wage inequality. Quarterly Journalof Economics 128, no. 3:967–1015.
Carnevale, Anthony P., Tamara Jayasundera, and Dmitri Repnikov. 2014.Understanding online jobs data: A technical report. Washington, DC:Georgetown University Center on Education and the Workforce.
Deming, David J. 2017. The growing importance of social skills in the labormarket. Quarterly Journal of Economics 132, no. 4:1593–640.
Diamond, Rebecca. 2016. The determinants and welfare implications of USworkers’ diverging location choices by skill: 1980–2000. American Eco-nomic Review 106, no. 3:479–524.
Firpo, Sergio,NicoleM. Fortin, and Thomas Lemieux. 2009. Unconditionalquantile regressions. Econometrica 77 (May): 953–73.
Gathmann, Christina, and Uta Schonberg. 2010. How general is humancapital? A task-based approach. Journal of Labor Economics 28, no. 1:1–49.
Glaeser, Edward, and Joshua D. Gottlieb. 2009. The wealth of cities: Ag-glomeration economies and spatial equilibrium in theUnited States. Jour-nal of Economic Literature 47, no. 4:983–1028.
Goos, M., A. Manning, and A. Salomons. 2014. Explaining job polariza-tion: Routine-biased technological change and offshoring. AmericanEconomic Review 104, no. 8:2509–26.
Heckman, James J., and TimKlautz. 2012. Hard evidence on soft skills.La-bour Economics 19, no. 4:451–64.
Hershbein, Brad, and Lisa B. Kahn. 2016. Do recessions accelerate routine-biased technological change. NBERWorking Paper no. 22762, NationalBureau of Economic Research, Cambridge, MA.
This content downloaded from 206.253.207.235 on December 12, 2018 16:04:36 PMll use subject to University of Chicago Press Terms and Conditions (http://www.journals.uchicago.edu/t-and-c).
Skill Requirements across Firms and Labor Markets S369
A
Ichniowski, Casey, Kathryn Shaw, and Giovanna Prennushi. 1997. The ef-fects of human resource management practices on productivity. Ameri-can Economic Review 87, no. 3:291–313.
Kuhn, Peter, and Kailing Shen. 2013. Gender discrimination in job ads: Ev-idence from China. Quarterly Journal of Economics 128, no. 1:287–336.
Lu, Qian. 2015. The end of polarization? Technological change and em-ployment in the U.S. labor market. Unpublished manuscript.
Marinescu, Ioana. 2017. The general equilibrium impacts of unemploymentinsurance: Evidence from a large online job board. Journal of Public Eco-nomics, vol. 150:14–29.
Marinescu, Ioana, and Ronald Wolthoff. 2016. Opening the black box ofthe matching function: the power of words. Unpublished manuscript.
Moretti, Enrico. 2013. Real wage inequality. American Economic Journal:Applied Economics 5, no. 1:65–103.
Poletaev,Maxim, andChris Robinson. 2008.Human capital specificity: Ev-idence from the Dictionary of Occupational Titles and displaced workersurveys, 1984–2000. Journal of Labor Economics 26, no. 3:387–420.
Sasser Modestino, Alicia, Daniel Shoag, and Joshua Ballance. 2016. Up-skilling: Do employers demand greater skill when workers are plentiful?Unpublished manuscript.
Song, Jae, David J. Price, Fatih Guvenen, Nicholas Bloom, and Till vonWachter. 2015. Firming up inequality. NBERWorking Paper no. 21199,National Bureau of Economic Research, Cambridge, MA.
Speer, Jamin D. 2017. Pre-market skills, occupational choice, and careerprogression. Journal of Human Resources 52, no. 1:187–246.
Weinberger, Catherine J. 2014. The increasing complementarity betweencognitive and social skills. Review of Economics and Statistics 96, no. 4:849–61.
This content downloaded from 206.253.207.235 on December 12, 2018 16:04:36 PMll use subject to University of Chicago Press Terms and Conditions (http://www.journals.uchicago.edu/t-and-c).