skills & projects report - acuity · • tips on running a successfully in-house survey ... •...
TRANSCRIPT

Resident Satisfaction Workshop
Denise Raine
Director, Acuity
SHAPE members20th April 2015
Outline for session
• STAR – update STAR and emerging new questions
• Designing the optimum survey
• Getting the basics right
• Compatibility for SHAPE members
• Tips on running a successfully in-house survey
• When to bring in help

STAR Update
3
• STAR review
• Benchmarking customer experience - findings report
(April 2015)
• A guide to running StarT surveys (April 2015)
• STAR update report (July 2015)
• Annual benchmarking report (April 2015)
Findings – Customer satisfaction surveys
4
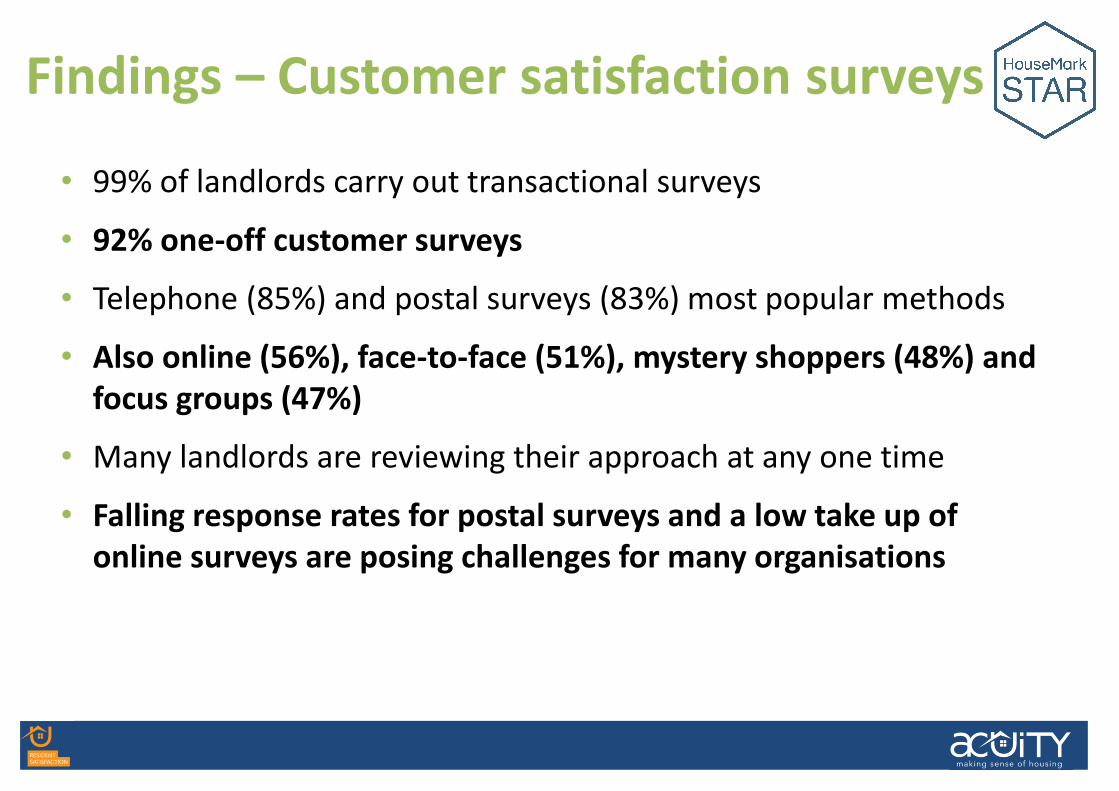
• 99% of landlords carry out transactional surveys
• 92% one-off customer surveys
• Telephone (85%) and postal surveys (83%) most popular methods
• Also online (56%), face-to-face (51%), mystery shoppers (48%) and
focus groups (47%)
• Many landlords are reviewing their approach at any one time
• Falling response rates for postal surveys and a low take up of
online surveys are posing challenges for many organisations
Findings – STAR surveys
5
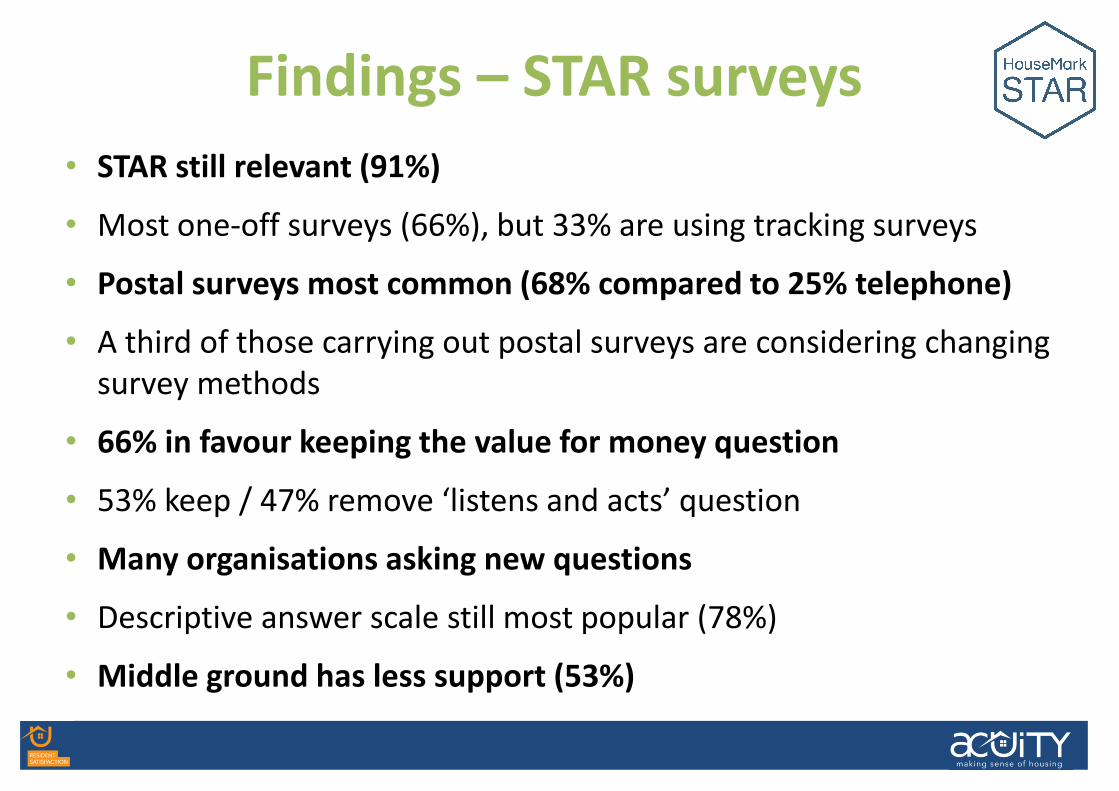
• STAR still relevant (91%)
• Most one-off surveys (66%), but 33% are using tracking surveys
• Postal surveys most common (68% compared to 25% telephone)
• A third of those carrying out postal surveys are considering changing
survey methods
• 66% in favour keeping the value for money question
• 53% keep / 47% remove ‘listens and acts’ question
• Many organisations asking new questions
• Descriptive answer scale still most popular (78%)
• Middle ground has less support (53%)
Findings – Benchmarking
6
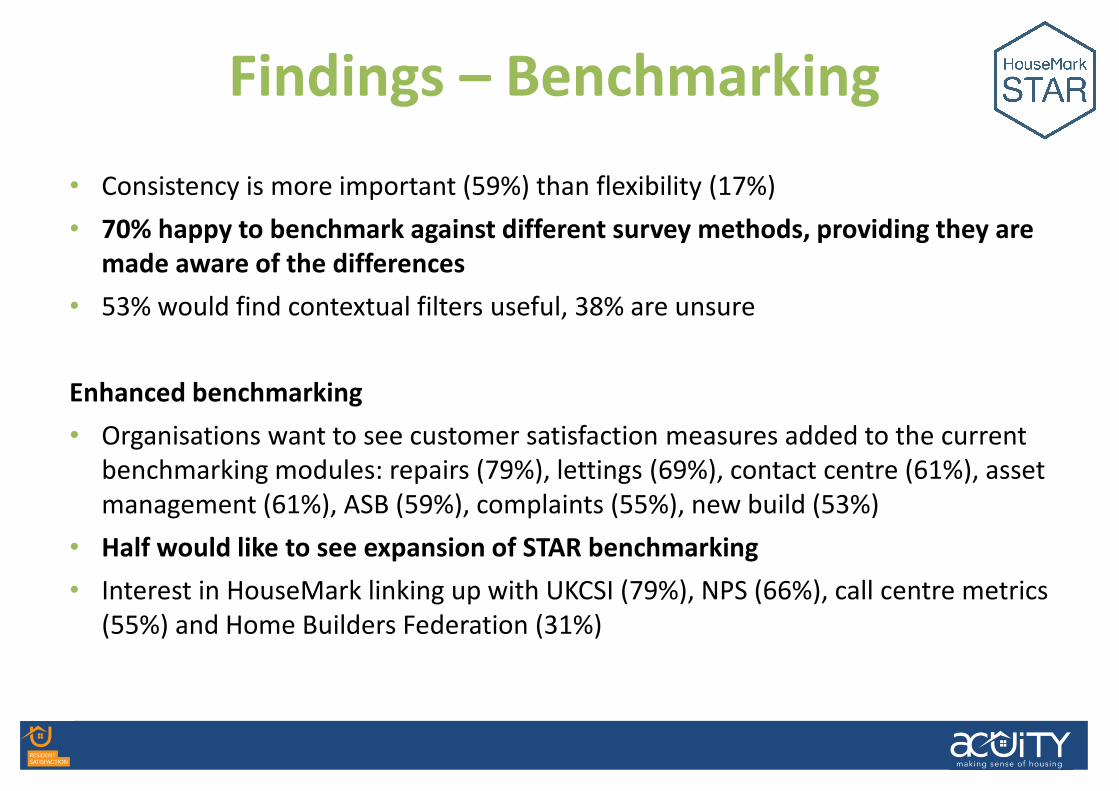
• Consistency is more important (59%) than flexibility (17%)
• 70% happy to benchmark against different survey methods, providing they are
made aware of the differences
• 53% would find contextual filters useful, 38% are unsure
Enhanced benchmarking
• Organisations want to see customer satisfaction measures added to the current
benchmarking modules: repairs (79%), lettings (69%), contact centre (61%), asset
management (61%), ASB (59%), complaints (55%), new build (53%)
• Half would like to see expansion of STAR benchmarking
• Interest in HouseMark linking up with UKCSI (79%), NPS (66%), call centre metrics
(55%) and Home Builders Federation (31%)
Collaboration and sharing good practice
7
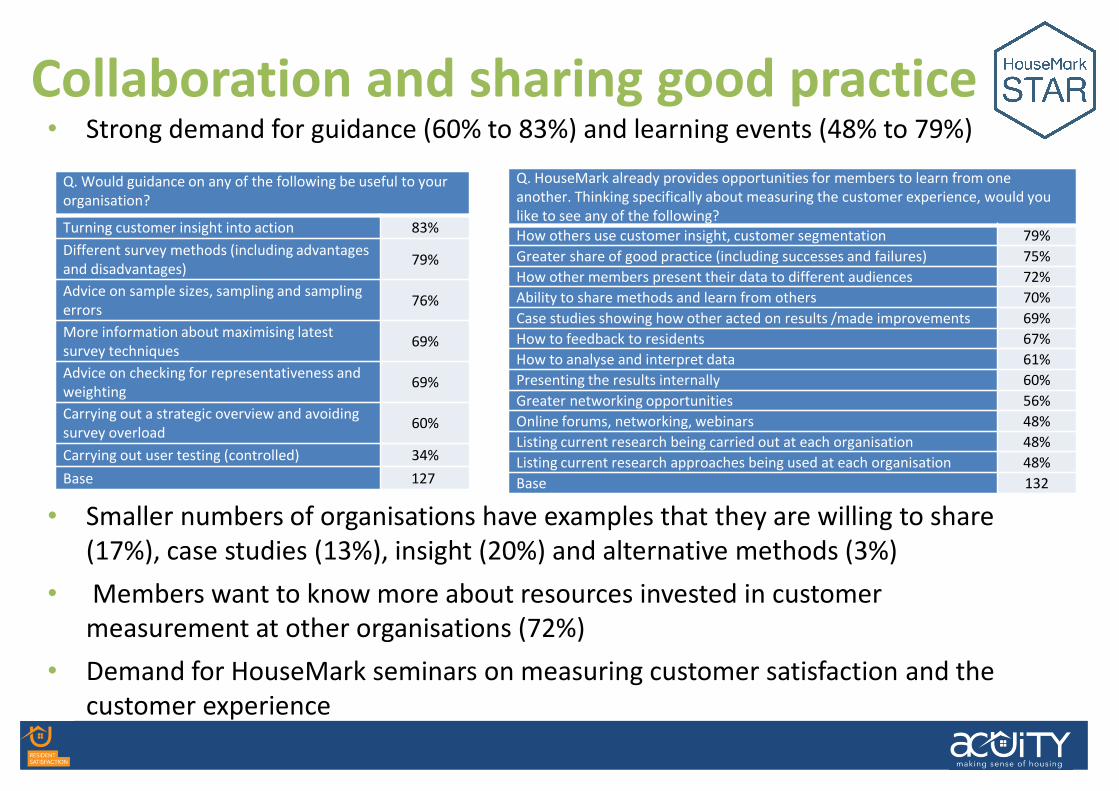
• Strong demand for guidance (60% to 83%) and learning events (48% to 79%)
• Smaller numbers of organisations have examples that they are willing to share
(17%), case studies (13%), insight (20%) and alternative methods (3%)
• Members want to know more about resources invested in customer
measurement at other organisations (72%)
• Demand for HouseMark seminars on measuring customer satisfaction and the
customer experience
Q. Would guidance on any of the following be useful to your
organisation?
Turning customer insight into action 83%
Different survey methods (including advantages
and disadvantages)79%
Advice on sample sizes, sampling and sampling
errors76%
More information about maximising latest
survey techniques69%
Advice on checking for representativeness and
weighting69%
Carrying out a strategic overview and avoiding
survey overload60%
Carrying out user testing (controlled) 34%
Base 127
Q. HouseMark already provides opportunities for members to learn from one
another. Thinking specifically about measuring the customer experience, would you
like to see any of the following?
How others use customer insight, customer segmentation 79%
Greater share of good practice (including successes and failures) 75%
How other members present their data to different audiences 72%
Ability to share methods and learn from others 70%
Case studies showing how other acted on results /made improvements 69%
How to feedback to residents 67%
How to analyse and interpret data 61%
Presenting the results internally 60%
Greater networking opportunities 56%
Online forums, networking, webinars 48%
Listing current research being carried out at each organisation 48%
Listing current research approaches being used at each organisation 48%
Base 132
STAR - emerging themes
8
• Move to more regular and shorter surveys
• Customer effort
• Well-being questions
• NPS

ONS Well-being questions
9
• Overall, how satisfied are you with
your life nowadays?
• Overall, to what extent do you feel
the things you do in your life are
worthwhile?
• Overall, how happy did you feel
yesterday?
• Overall, how anxious did you feel
yesterday?
• All are answered using a 0 to 10
scale where 0 is ‘not at all’ and 10 is
‘completely’.

Detractors Passives Promoters
3%1% 2% 3% 3%
11%7%
10%
17%
10%
34%
0 (not at all
likely)
1 2 3 4 5 6 7 8 9 10 (extremely
likely)
15
11
28
All tenants
General needs
tenants
Sheltered housing
tenants
29% 27% 44%
Detractors Passives Promoters
How likely is it that you would recommend your landlord to a friend or family? (NPS)
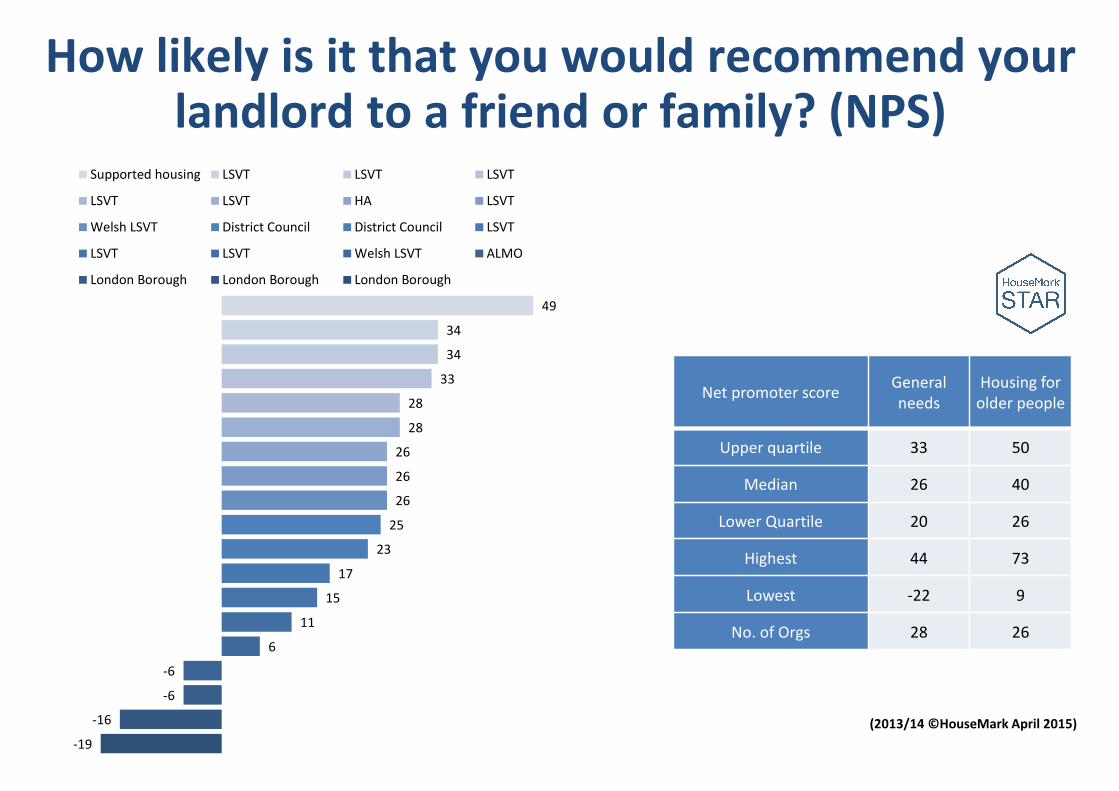
How likely is it that you would recommend your landlord to a friend or family? (NPS)
Net promoter scoreGeneral
needs
Housing for
older people
Upper quartile 33 50
Median 26 40
Lower Quartile 20 26
Highest 44 73
Lowest -22 9
No. of Orgs 28 26
(2013/14 ©HouseMark April 2015)
-19
-16
-6
-6
6
11
15
17
23
25
26
26
26
28
28
33
34
34
49
Supported housing LSVT LSVT LSVT
LSVT LSVT HA LSVT
Welsh LSVT District Council District Council LSVT
LSVT LSVT Welsh LSVT ALMO
London Borough London Borough London Borough
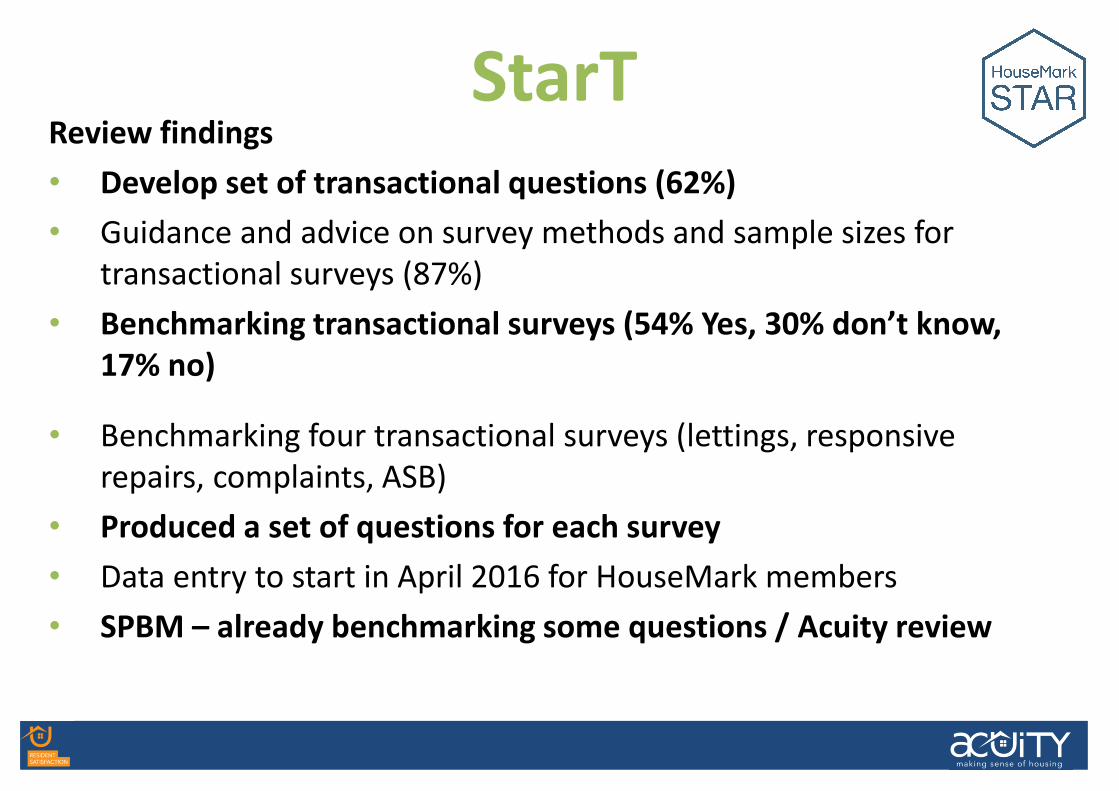
StarT
12
Review findings
• Develop set of transactional questions (62%)
• Guidance and advice on survey methods and sample sizes for
transactional surveys (87%)
• Benchmarking transactional surveys (54% Yes, 30% don’t know,
17% no)
• Benchmarking four transactional surveys (lettings, responsive
repairs, complaints, ASB)
• Produced a set of questions for each survey
• Data entry to start in April 2016 for HouseMark members
• SPBM – already benchmarking some questions / Acuity review
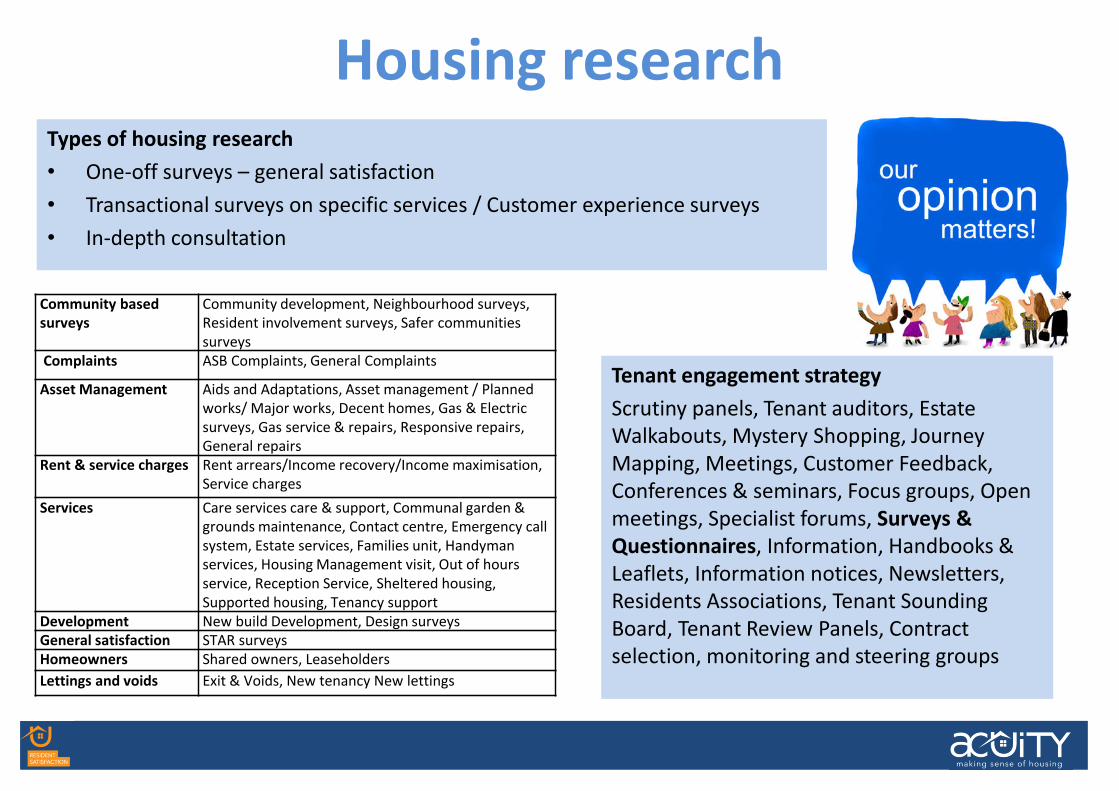
Housing researchTypes of housing research
• One-off surveys – general satisfaction
• Transactional surveys on specific services / Customer experience surveys
• In-depth consultation
Tenant engagement strategy
Scrutiny panels, Tenant auditors, Estate
Walkabouts, Mystery Shopping, Journey
Mapping, Meetings, Customer Feedback,
Conferences & seminars, Focus groups, Open
meetings, Specialist forums, Surveys &
Questionnaires, Information, Handbooks &
Leaflets, Information notices, Newsletters,
Residents Associations, Tenant Sounding
Board, Tenant Review Panels, Contract
selection, monitoring and steering groups
Community based
surveys
Community development, Neighbourhood surveys,
Resident involvement surveys, Safer communities
surveys
Complaints ASB Complaints, General Complaints
Asset Management Aids and Adaptations, Asset management / Planned
works/ Major works, Decent homes, Gas & Electric
surveys, Gas service & repairs, Responsive repairs,
General repairs
Rent & service charges Rent arrears/Income recovery/Income maximisation,
Service charges
Services Care services care & support, Communal garden &
grounds maintenance, Contact centre, Emergency call
system, Estate services, Families unit, Handyman
services, Housing Management visit, Out of hours
service, Reception Service, Sheltered housing,
Supported housing, Tenancy support
Development New build Development, Design surveys
General satisfaction STAR surveys
Homeowners Shared owners, Leaseholders
Lettings and voids Exit & Voids, New tenancy New lettings
13
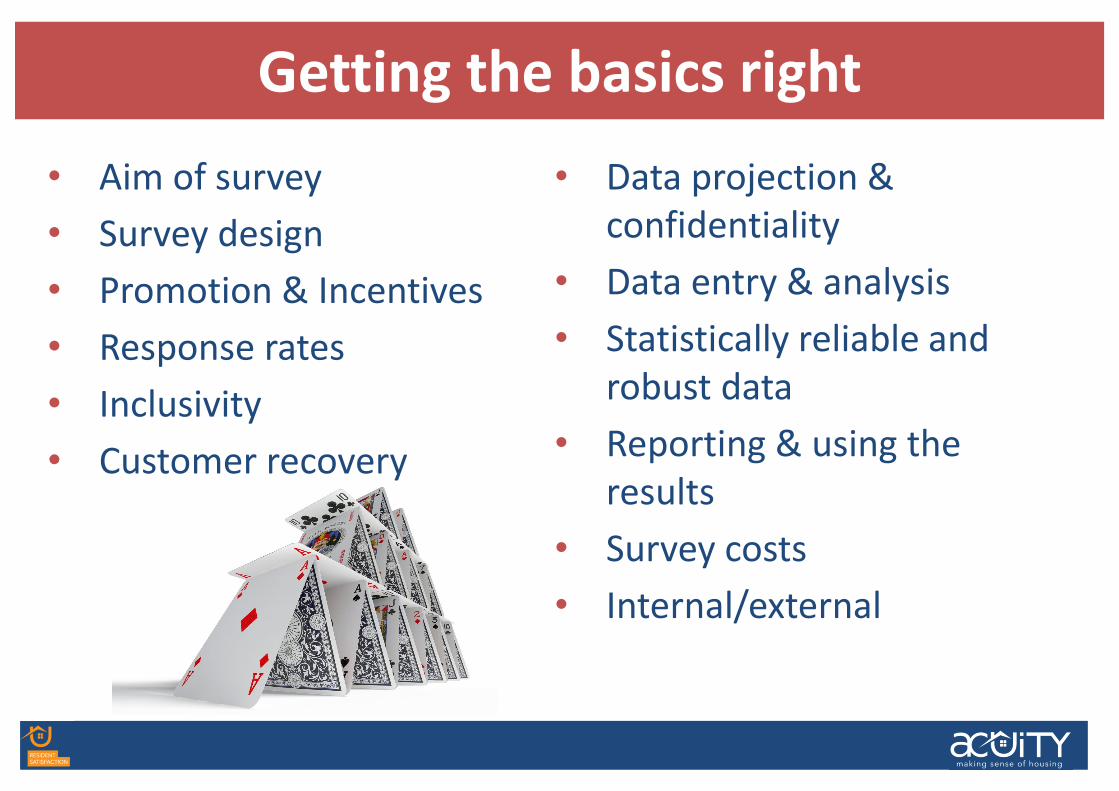
• Aim of survey
• Survey design
• Promotion & Incentives
• Response rates
• Inclusivity
• Customer recovery
• Data projection &
confidentiality
• Data entry & analysis
• Statistically reliable and
robust data
• Reporting & using the
results
• Survey costs
• Internal/external
Getting the basics right
14
To be effective you need to:
• Measure and understand levels of customer satisfaction and
customer needs
• Use data to drive up performance in service and cost
effectiveness
• In order to deliver has to be more than just insight–
incorporate action into organisational change
• Organisational fit
Clear objectives & organisational fit
15
Survey design
16
• Sample frame
• Method – postal, telephone, online, face-to-face
• Questionnaire / Question set
• Timing & priority
• Frequency
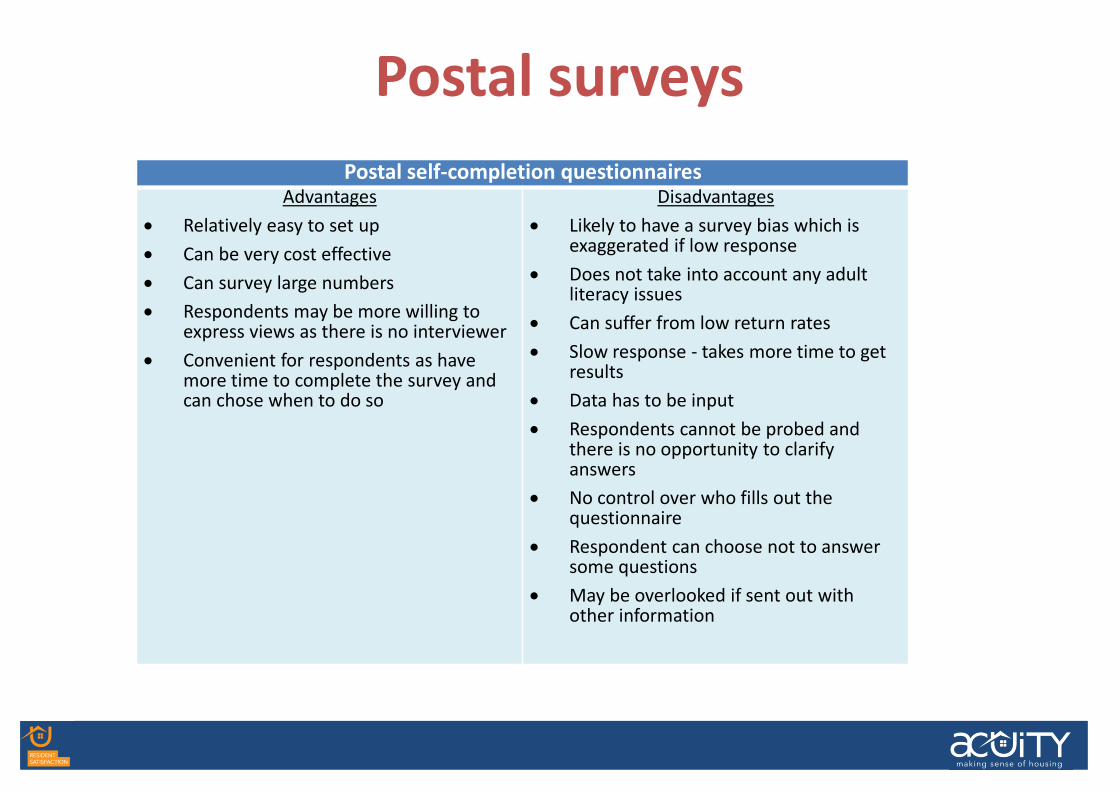
Postal surveys
Postal self-completion questionnairesAdvantages
• Relatively easy to set up
• Can be very cost effective
• Can survey large numbers
• Respondents may be more willing to express views as there is no interviewer
• Convenient for respondents as have more time to complete the survey and can chose when to do so
Disadvantages
• Likely to have a survey bias which is exaggerated if low response
• Does not take into account any adult literacy issues
• Can suffer from low return rates
• Slow response - takes more time to get results
• Data has to be input
• Respondents cannot be probed and there is no opportunity to clarify answers
• No control over who fills out the questionnaire
• Respondent can choose not to answer some questions
• May be overlooked if sent out with other information
17
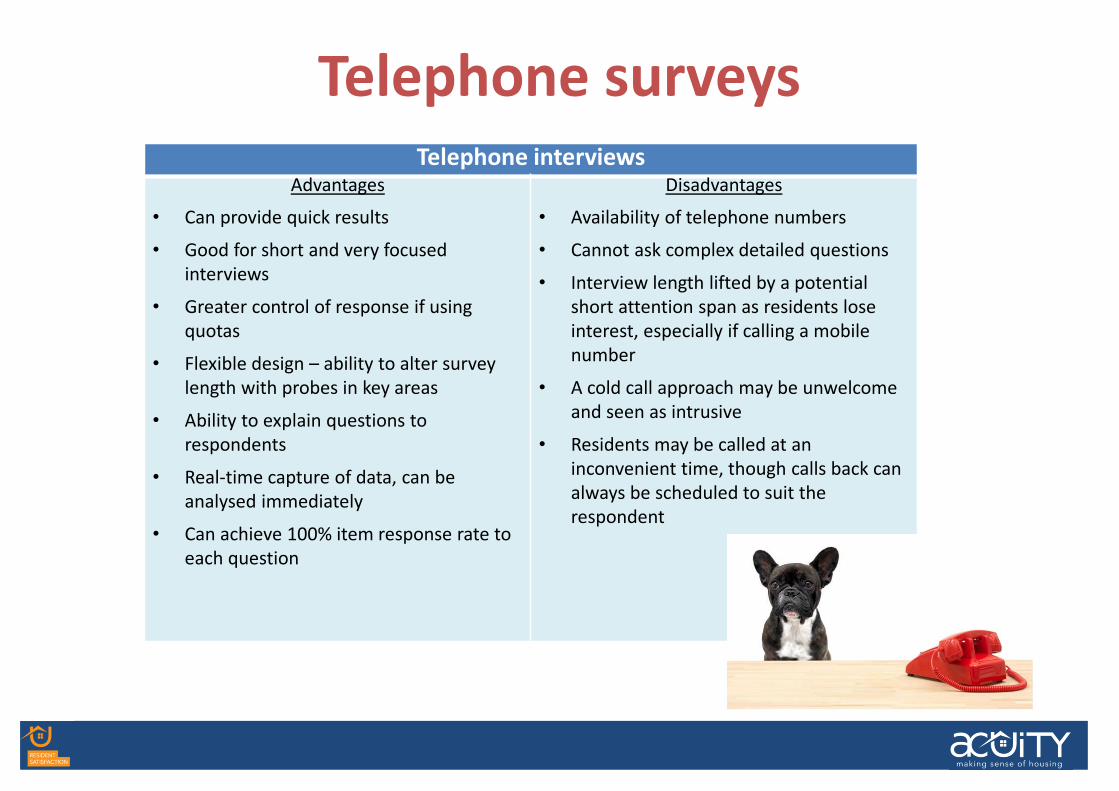
Telephone surveysTelephone interviews
Advantages
• Can provide quick results
• Good for short and very focused
interviews
• Greater control of response if using
quotas
• Flexible design – ability to alter survey
length with probes in key areas
• Ability to explain questions to
respondents
• Real-time capture of data, can be
analysed immediately
• Can achieve 100% item response rate to
each question
Disadvantages
• Availability of telephone numbers
• Cannot ask complex detailed questions
• Interview length lifted by a potential
short attention span as residents lose
interest, especially if calling a mobile
number
• A cold call approach may be unwelcome
and seen as intrusive
• Residents may be called at an
inconvenient time, though calls back can
always be scheduled to suit the
respondent
18
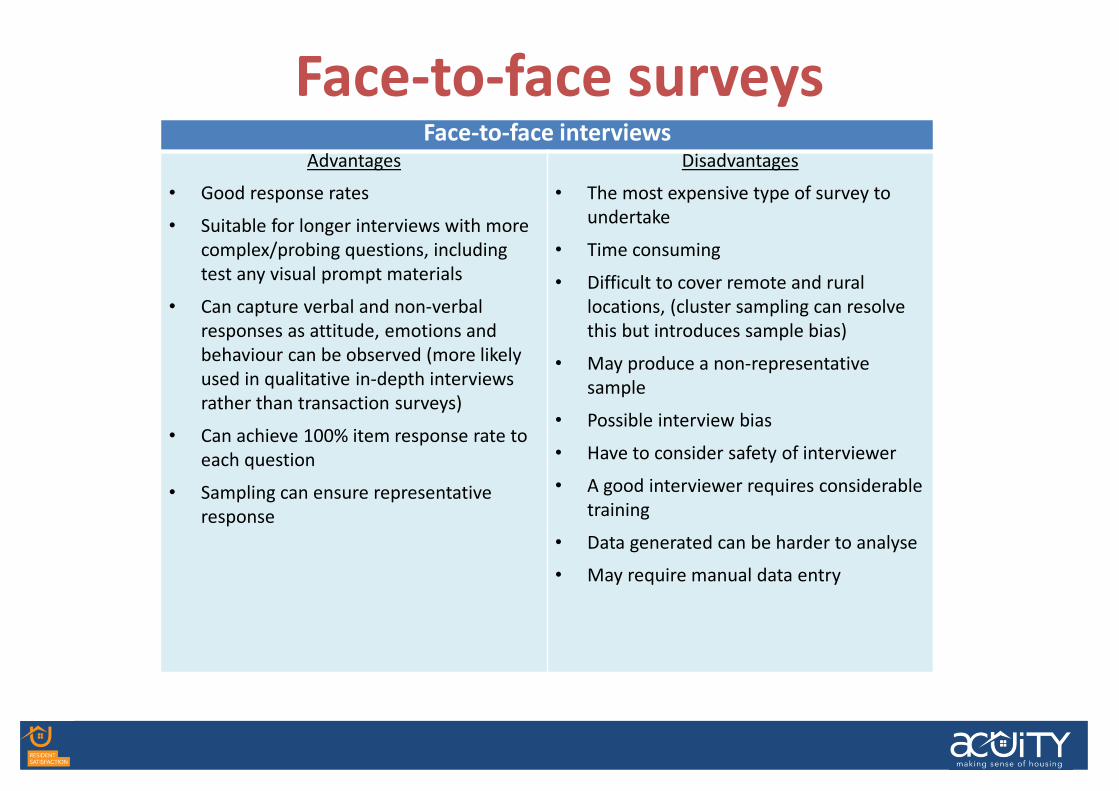
Face-to-face surveysFace-to-face interviews
Advantages
• Good response rates
• Suitable for longer interviews with more
complex/probing questions, including
test any visual prompt materials
• Can capture verbal and non-verbal
responses as attitude, emotions and
behaviour can be observed (more likely
used in qualitative in-depth interviews
rather than transaction surveys)
• Can achieve 100% item response rate to
each question
• Sampling can ensure representative
response
Disadvantages
• The most expensive type of survey to
undertake
• Time consuming
• Difficult to cover remote and rural
locations, (cluster sampling can resolve
this but introduces sample bias)
• May produce a non-representative
sample
• Possible interview bias
• Have to consider safety of interviewer
• A good interviewer requires considerable
training
• Data generated can be harder to analyse
• May require manual data entry
19
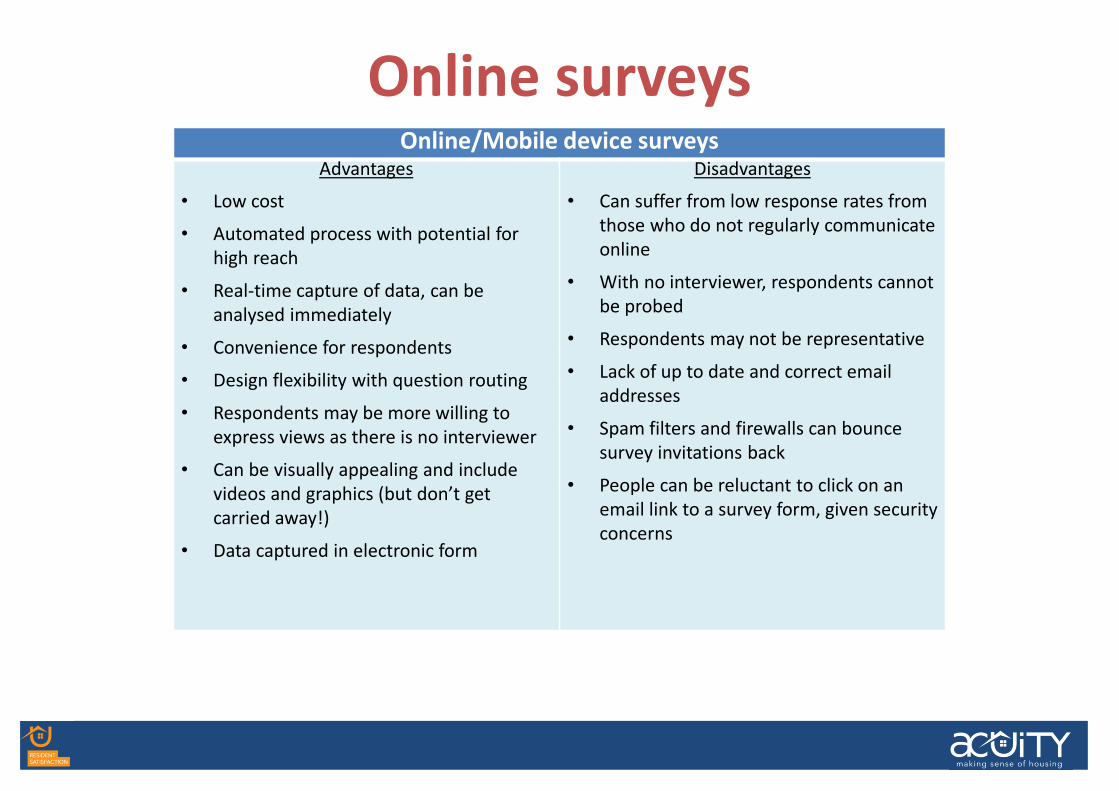
Online surveysOnline/Mobile device surveys
Advantages
• Low cost
• Automated process with potential for
high reach
• Real-time capture of data, can be
analysed immediately
• Convenience for respondents
• Design flexibility with question routing
• Respondents may be more willing to
express views as there is no interviewer
• Can be visually appealing and include
videos and graphics (but don’t get
carried away!)
• Data captured in electronic form
Disadvantages
• Can suffer from low response rates from
those who do not regularly communicate
online
• With no interviewer, respondents cannot
be probed
• Respondents may not be representative
• Lack of up to date and correct email
addresses
• Spam filters and firewalls can bounce
survey invitations back
• People can be reluctant to click on an
email link to a survey form, given security
concerns
20
Maximising participation
21
• Promotion
• Incentives
• Response rates
• Inclusivity
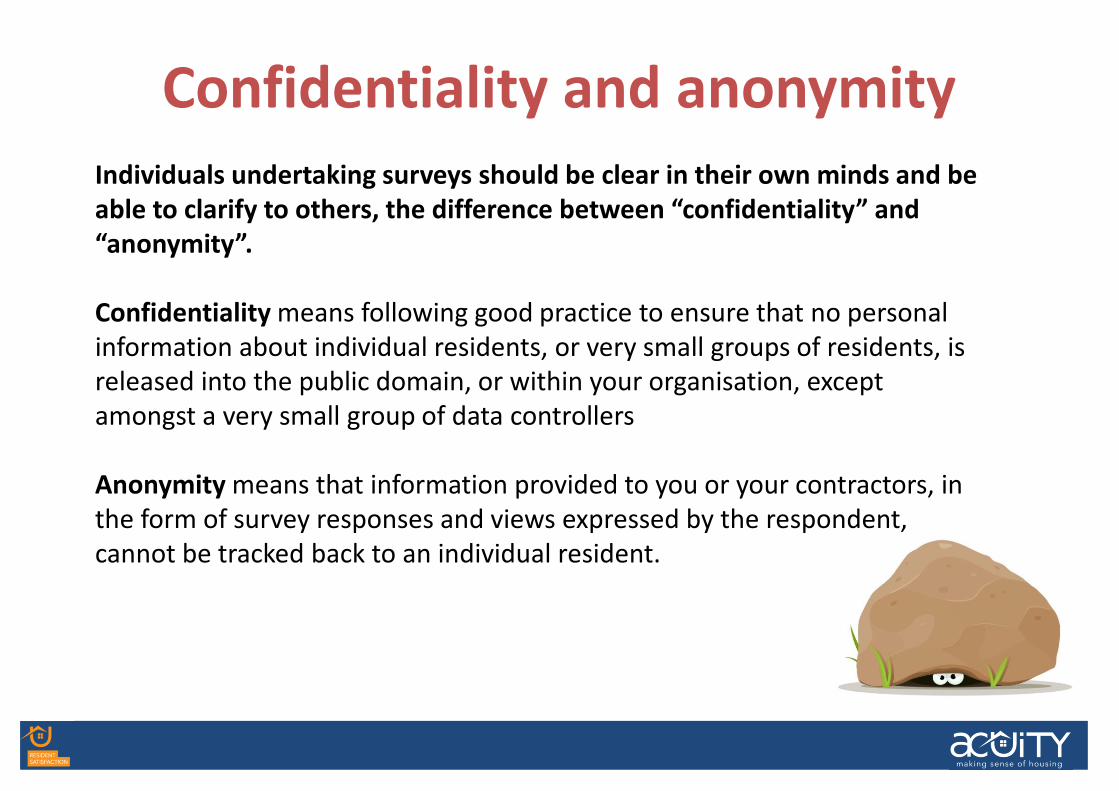
Confidentiality and anonymity
Individuals undertaking surveys should be clear in their own minds and be
able to clarify to others, the difference between “confidentiality” and
“anonymity”.
Confidentiality means following good practice to ensure that no personal
information about individual residents, or very small groups of residents, is
released into the public domain, or within your organisation, except
amongst a very small group of data controllers
Anonymity means that information provided to you or your contractors, in
the form of survey responses and views expressed by the respondent,
cannot be tracked back to an individual resident.
22
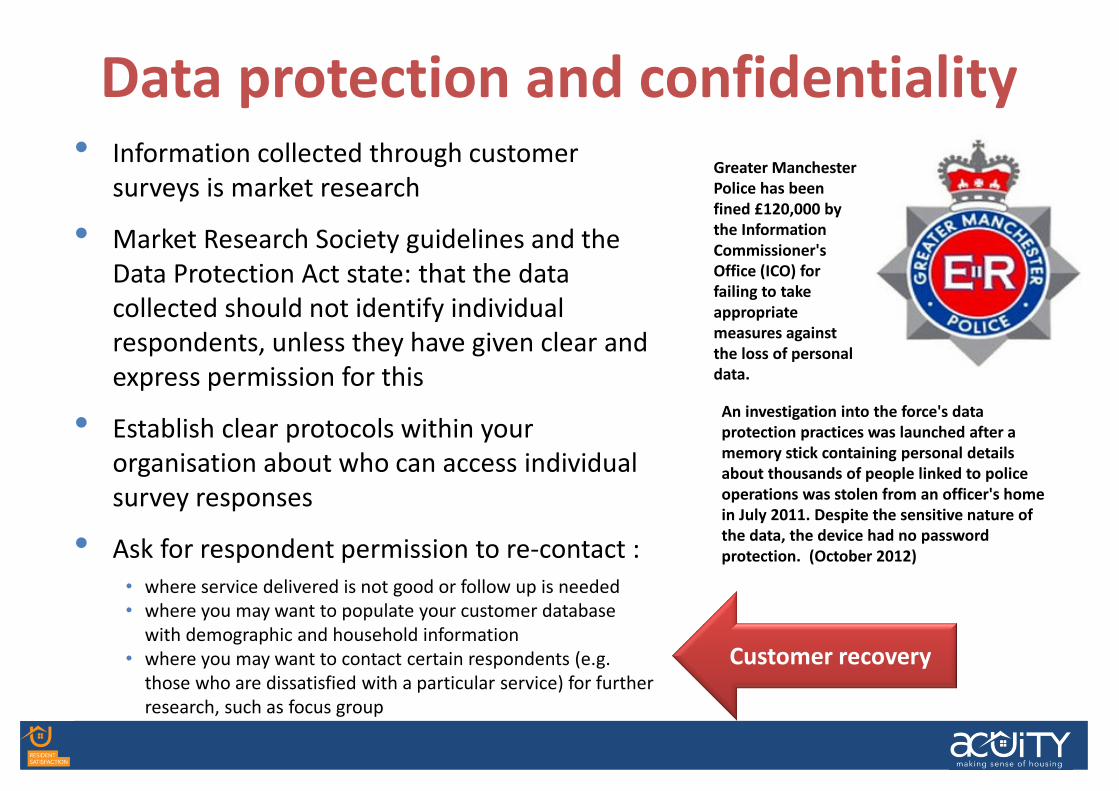
Data protection and confidentiality• Information collected through customer
surveys is market research
• Market Research Society guidelines and the
Data Protection Act state: that the data
collected should not identify individual
respondents, unless they have given clear and
express permission for this
• Establish clear protocols within your
organisation about who can access individual
survey responses
• Ask for respondent permission to re-contact :
• where service delivered is not good or follow up is needed
• where you may want to populate your customer database
with demographic and household information
• where you may want to contact certain respondents (e.g.
those who are dissatisfied with a particular service) for further
research, such as focus group
Greater Manchester
Police has been
fined £120,000 by
the Information
Commissioner's
Office (ICO) for
failing to take
appropriate
measures against
the loss of personal
data.
An investigation into the force's data
protection practices was launched after a
memory stick containing personal details
about thousands of people linked to police
operations was stolen from an officer's home
in July 2011. Despite the sensitive nature of
the data, the device had no password
protection. (October 2012)
Customer recovery
23
Designing the optimum questionnaire
24
• STAR questions
• SPBM questions
• SHAPE questions
• Other sources – ONS, HACT well-being
• Bespoke questions
• Open ended questions
• Confidentiality & Anonymity
• Questionnaire design / order
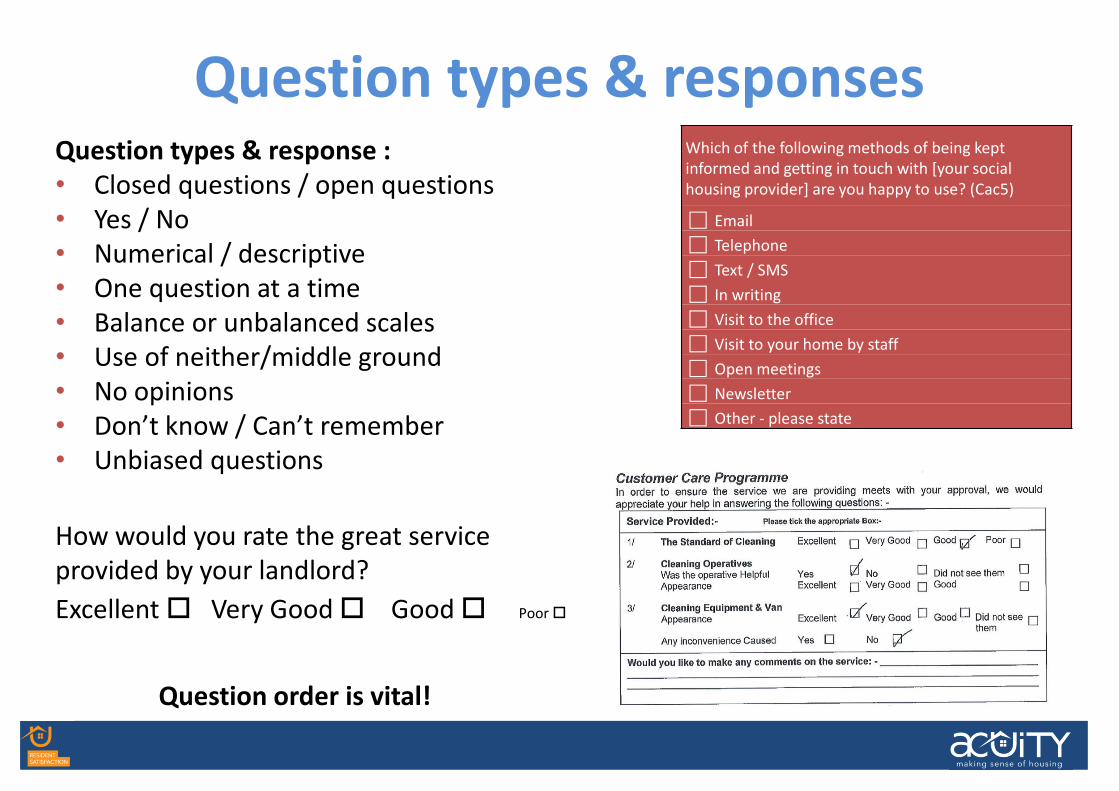
Question types & responsesQuestion types & response :
• Closed questions / open questions
• Yes / No
• Numerical / descriptive
• One question at a time
• Balance or unbalanced scales
• Use of neither/middle ground
• No opinions
• Don’t know / Can’t remember
• Unbiased questions
How would you rate the great service
provided by your landlord?
Excellent � Very Good � Good � Poor �
Question order is vital!
Which of the following methods of being kept
informed and getting in touch with [your social
housing provider] are you happy to use? (Cac5)
� Telephone
� Text / SMS
� In writing
� Visit to the office
� Visit to your home by staff
� Open meetings
� Newsletter
� Other - please state
25
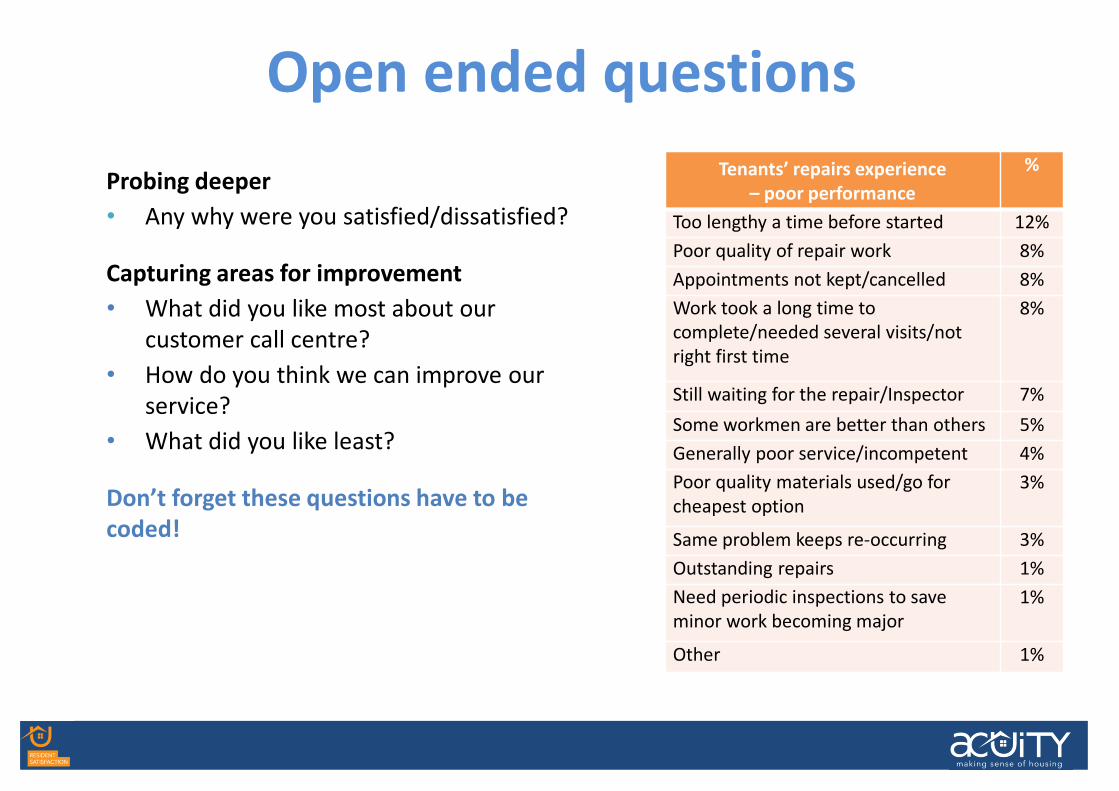
Open ended questions
Probing deeper
• Any why were you satisfied/dissatisfied?
Capturing areas for improvement
• What did you like most about our
customer call centre?
• How do you think we can improve our
service?
• What did you like least?
Don’t forget these questions have to be
coded!
Tenants’ repairs experience
– poor performance
%
Too lengthy a time before started 12%
Poor quality of repair work 8%
Appointments not kept/cancelled 8%
Work took a long time to
complete/needed several visits/not
right first time
8%
Still waiting for the repair/Inspector 7%
Some workmen are better than others 5%
Generally poor service/incompetent 4%
Poor quality materials used/go for
cheapest option
3%
Same problem keeps re-occurring 3%
Outstanding repairs 1%
Need periodic inspections to save
minor work becoming major
1%
Other 1%
26
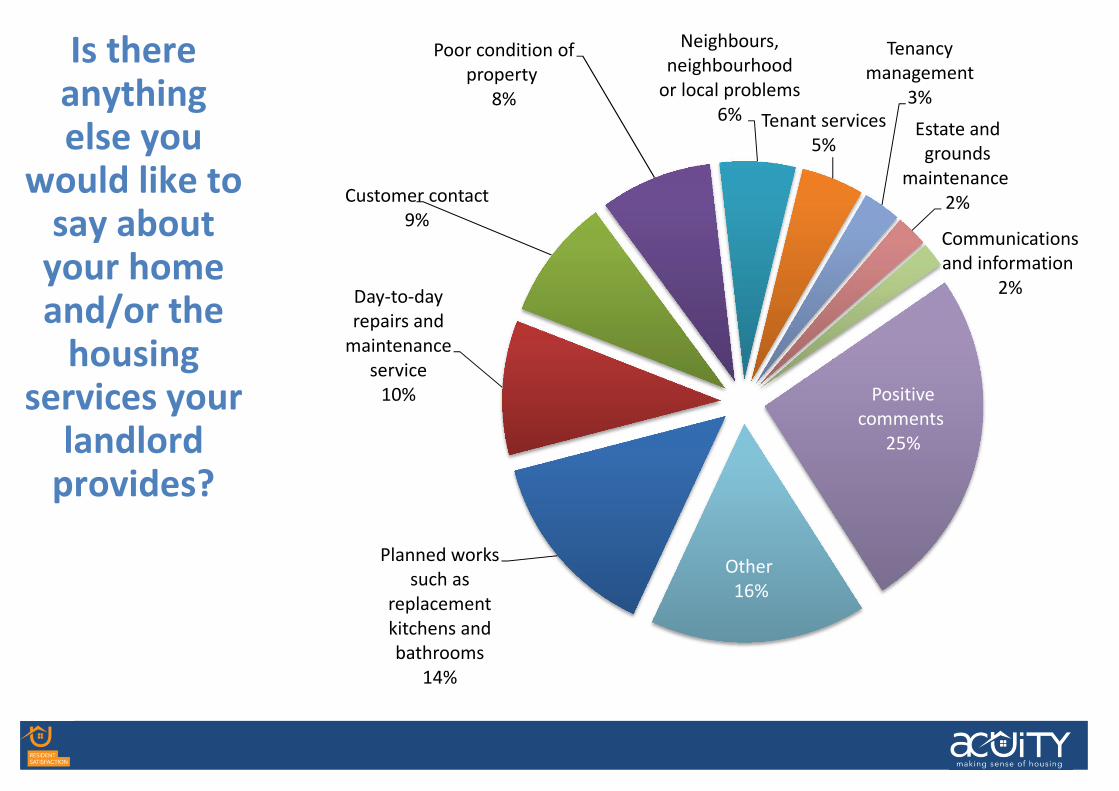
Is there anything else you
would like to say about
your home and/or the
housing services your
landlord provides?
Planned works
such as
replacement
kitchens and
bathrooms
14%
Day-to-day
repairs and
maintenance
service
10%
Customer contact
9%
Poor condition of
property
8%
Neighbours,
neighbourhood
or local problems
6% Tenant services
5%
Tenancy
management
3%
Estate and
grounds
maintenance
2%
Communications
and information
2%
Positive
comments
25%
Other
16%
27
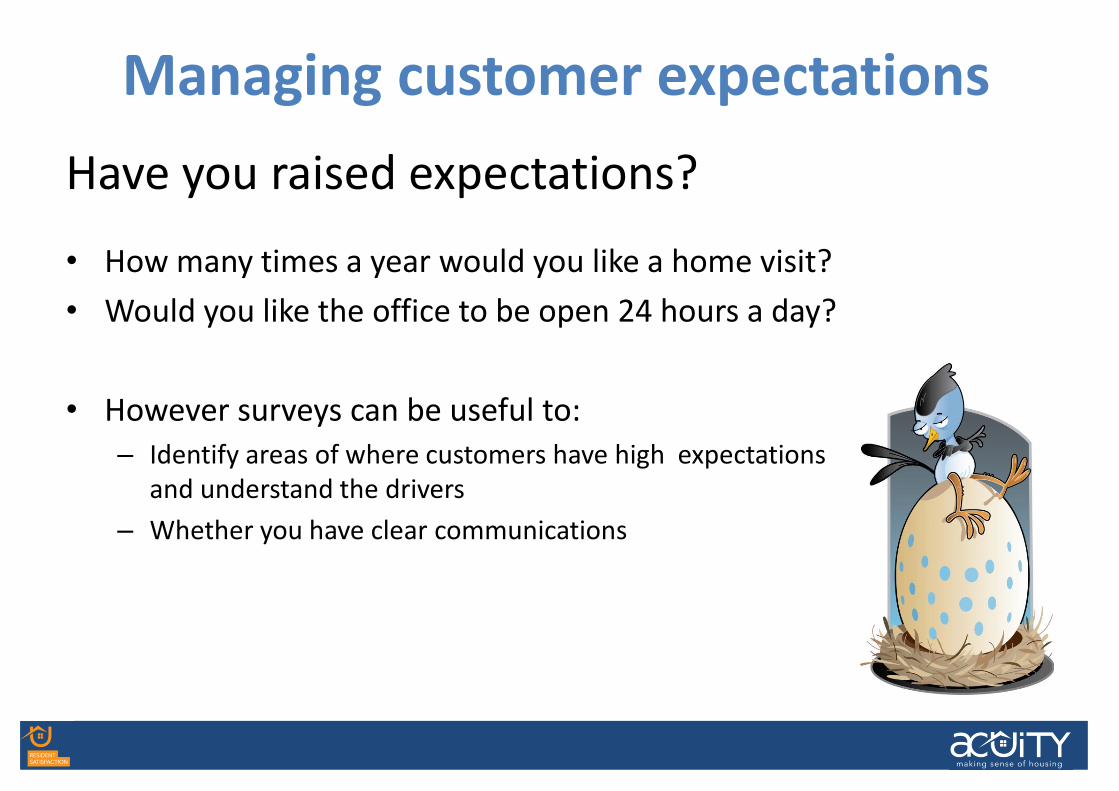
Managing customer expectations
Have you raised expectations?
• How many times a year would you like a home visit?
• Would you like the office to be open 24 hours a day?
• However surveys can be useful to:
– Identify areas of where customers have high expectations
and understand the drivers
– Whether you have clear communications
28
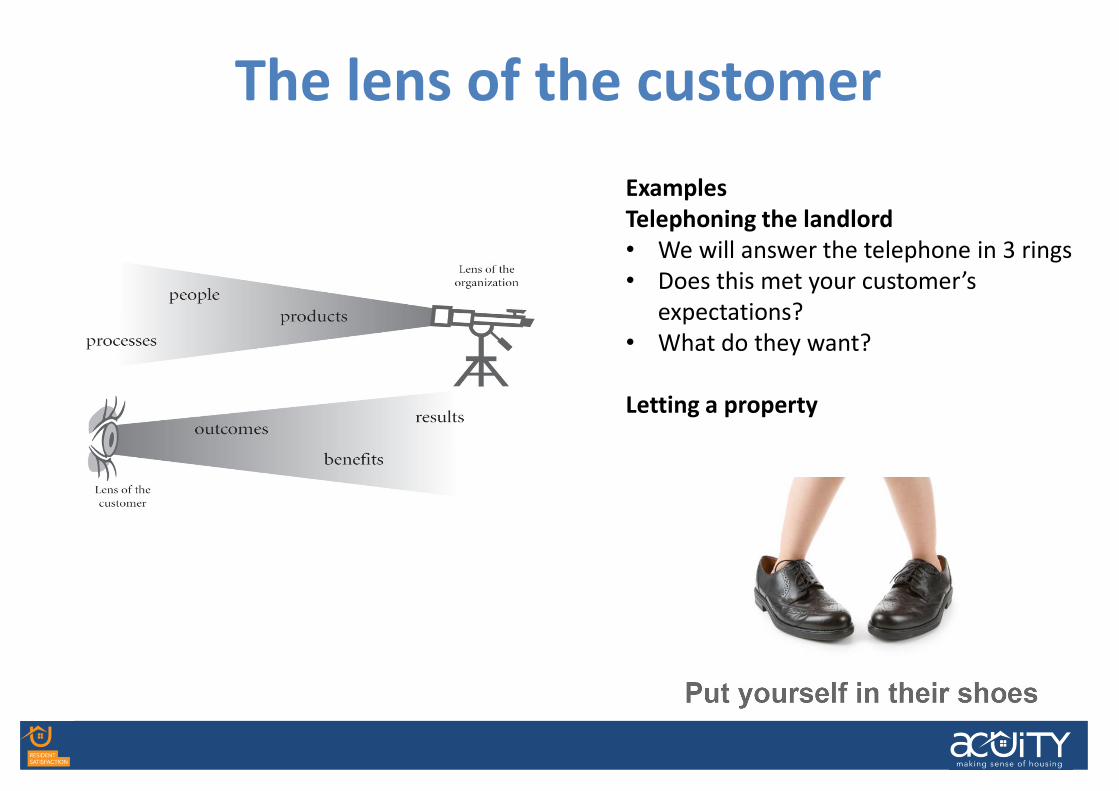
The lens of the customer
Examples
Telephoning the landlord
• We will answer the telephone in 3 rings
• Does this met your customer’s
expectations?
• What do they want?
Letting a property
29
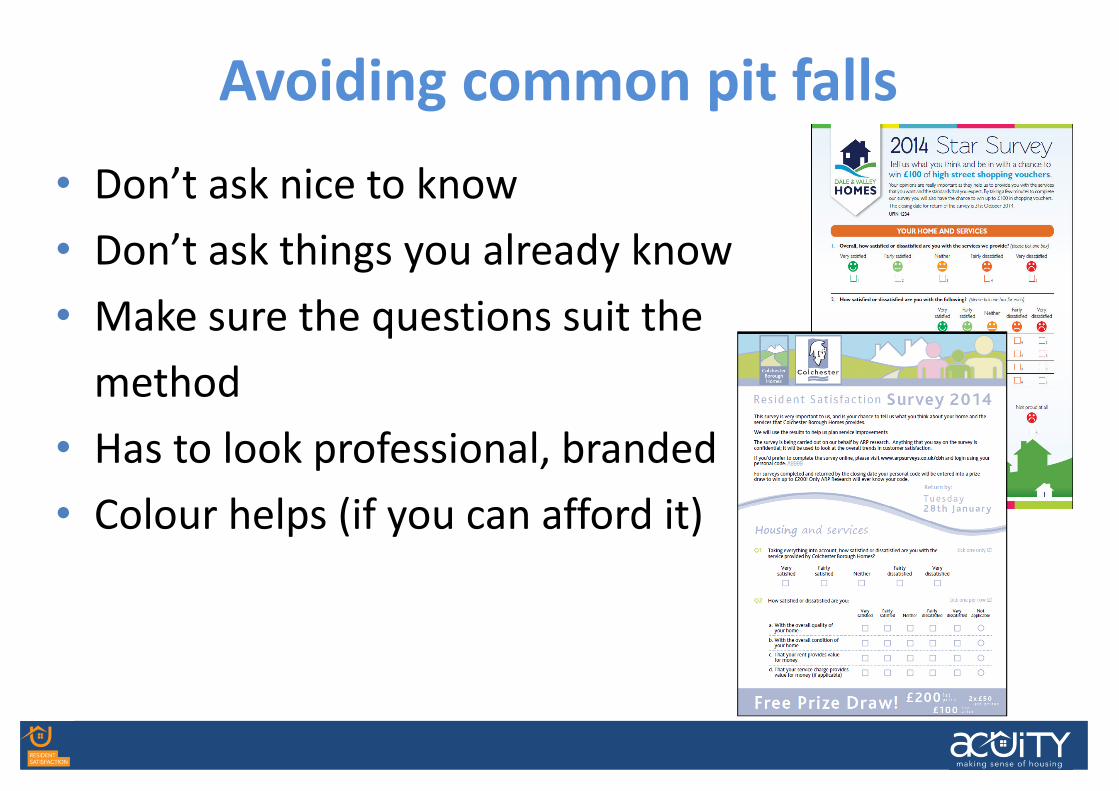
Avoiding common pit falls
30
• Don’t ask nice to know
• Don’t ask things you already know
• Make sure the questions suit the
method
• Has to look professional, branded
• Colour helps (if you can afford it)
30
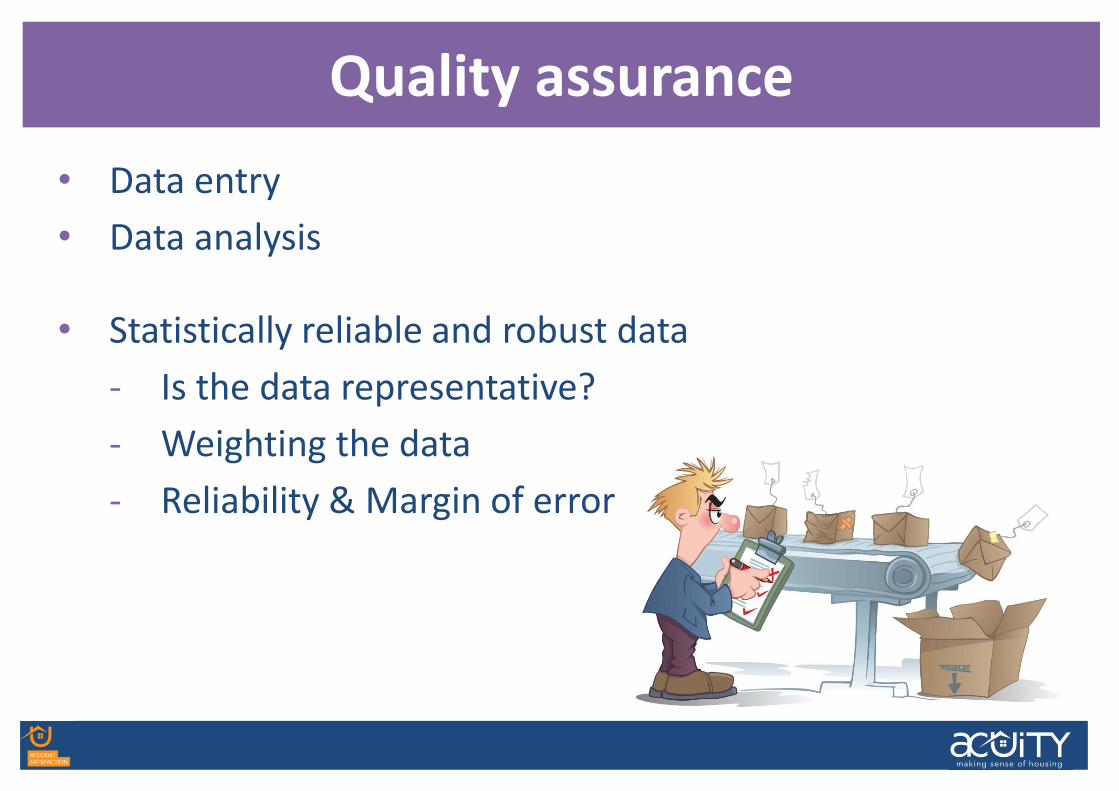
Quality assurance
• Data entry
• Data analysis
• Statistically reliable and robust data
- Is the data representative?
- Weighting the data
- Reliability & Margin of error
31
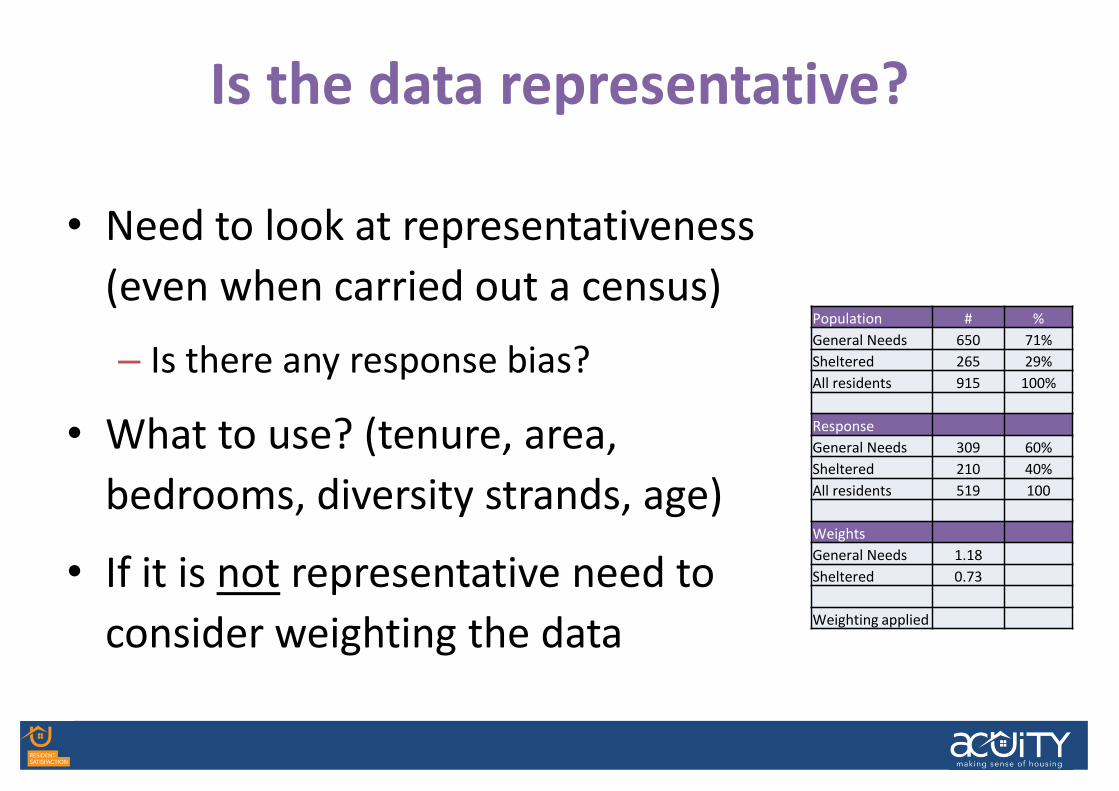
Is the data representative?
• Need to look at representativeness
(even when carried out a census)
– Is there any response bias?
• What to use? (tenure, area,
bedrooms, diversity strands, age)
• If it is not representative need to
consider weighting the data
32
Population # %
General Needs 650 71%
Sheltered 265 29%
All residents 915 100%
Response
General Needs 309 60%
Sheltered 210 40%
All residents 519 100
Weights
General Needs 1.18
Sheltered 0.73
Weighting applied
32

• Sampling error (also known as confidence interval or margin of error)
measures the accuracy of survey results in relation to the total
population
• You can decide yourself how accurate your results need to be.
HouseMark recommends a sampling error of ±5% at the 95% confidence
level for smaller landlords.
• What it means (±5%) If 85% of residents answered “Yes” to a particular
question, there are 95 chances out of 100 that the correct figure for all
residents – including those who did not respond – would be between
80% and 90%.
• Try to achieve at least 100 responses at the sub-level (e.g. area, tenure)
• Sampling error relevant for quantitative, not small-scale qualitative
surveys
Is the data reliable?
33
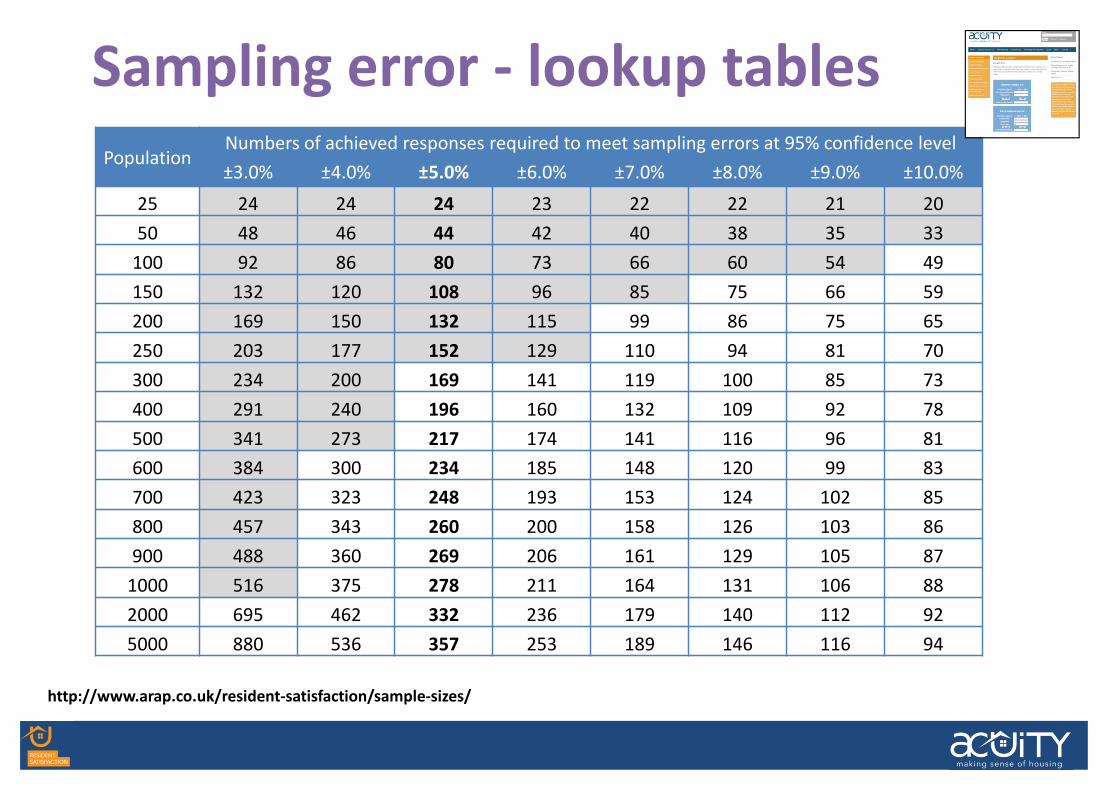
Sampling error - lookup tables
PopulationNumbers of achieved responses required to meet sampling errors at 95% confidence level
±3.0% ±4.0% ±5.0% ±6.0% ±7.0% ±8.0% ±9.0% ±10.0%
25 24 24 24 23 22 22 21 20
50 48 46 44 42 40 38 35 33
100 92 86 80 73 66 60 54 49
150 132 120 108 96 85 75 66 59
200 169 150 132 115 99 86 75 65
250 203 177 152 129 110 94 81 70
300 234 200 169 141 119 100 85 73
400 291 240 196 160 132 109 92 78
500 341 273 217 174 141 116 96 81
600 384 300 234 185 148 120 99 83
700 423 323 248 193 153 124 102 85
800 457 343 260 200 158 126 103 86
900 488 360 269 206 161 129 105 87
1000 516 375 278 211 164 131 106 88
2000 695 462 332 236 179 140 112 92
5000 880 536 357 253 189 146 116 94
http://www.arap.co.uk/resident-satisfaction/sample-sizes/
34
Reporting and feedback
• How does your performance compare with last year / over time?
• Who are you benchmarking against?
• Who do you feedback to internally?
• Do you discuss and share your the findings?
• Do you draw up action plans?
• Customer feedback - How are you feeding back your results to
your customers? Can you do anything differently? (attend coffee
mornings, participation events, hold focus groups)
• Follow up research - Do you measure and review performance
after service changes?
35

Benchmarking
• SPBM benchmarking incudes:
- core 7 STAR
- NPS
- repairs (transactional)
• Agree other questions to
use as a group
• Reports from SPBM
• Discussion rather than
formal benchmarking
• If in doubt: ask Acuity
36
90
93 93
94
91
92
87
92
82
84
86
88
90
92
94
96
GN HfOP
Satisfaction with overall services
Me SHAPE SPBM HouseMark
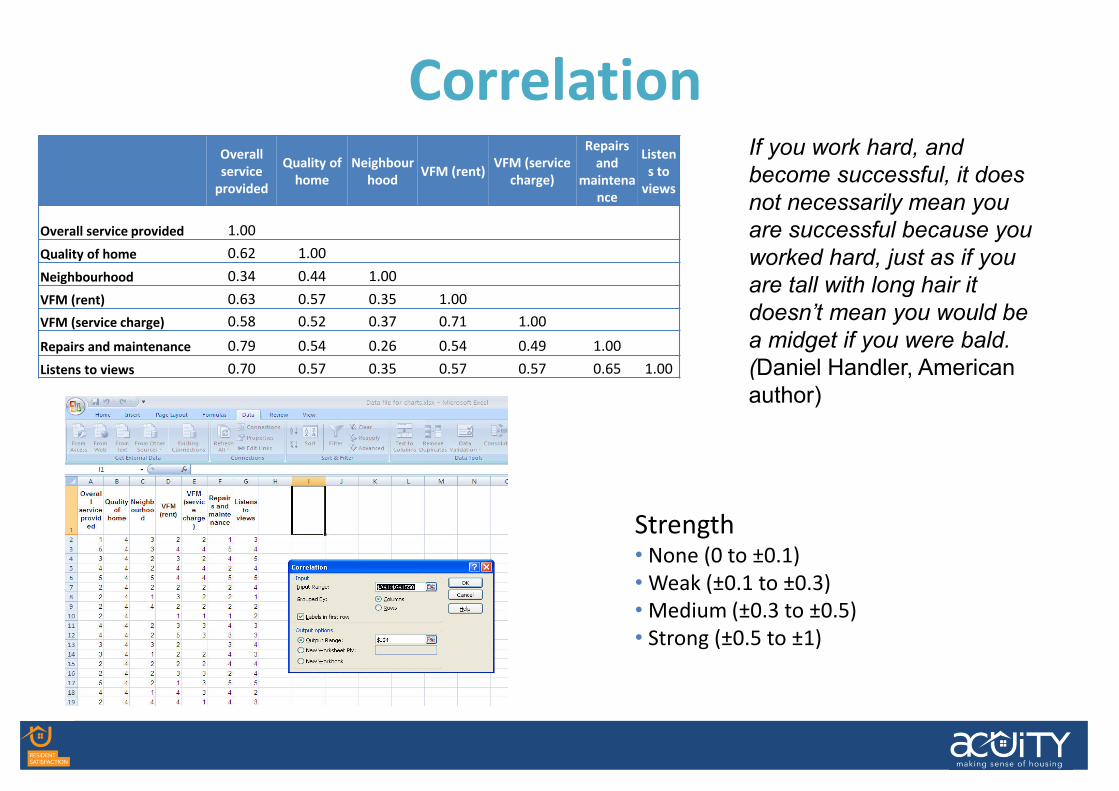
Correlation
Strength • None (0 to ±0.1)
•Weak (±0.1 to ±0.3)
•Medium (±0.3 to ±0.5)
• Strong (±0.5 to ±1)
Overall
service
provided
Quality of
home
Neighbour
hoodVFM (rent)
VFM (service
charge)
Repairs
and
maintena
nce
Listen
s to
views
Overall service provided 1.00
Quality of home 0.62 1.00
Neighbourhood 0.34 0.44 1.00
VFM (rent) 0.63 0.57 0.35 1.00
VFM (service charge) 0.58 0.52 0.37 0.71 1.00
Repairs and maintenance 0.79 0.54 0.26 0.54 0.49 1.00
Listens to views 0.70 0.57 0.35 0.57 0.57 0.65 1.00
37
If you work hard, and
become successful, it does
not necessarily mean you
are successful because you
worked hard, just as if you
are tall with long hair it
doesn’t mean you would be
a midget if you were bald.
(Daniel Handler, American
author)
37
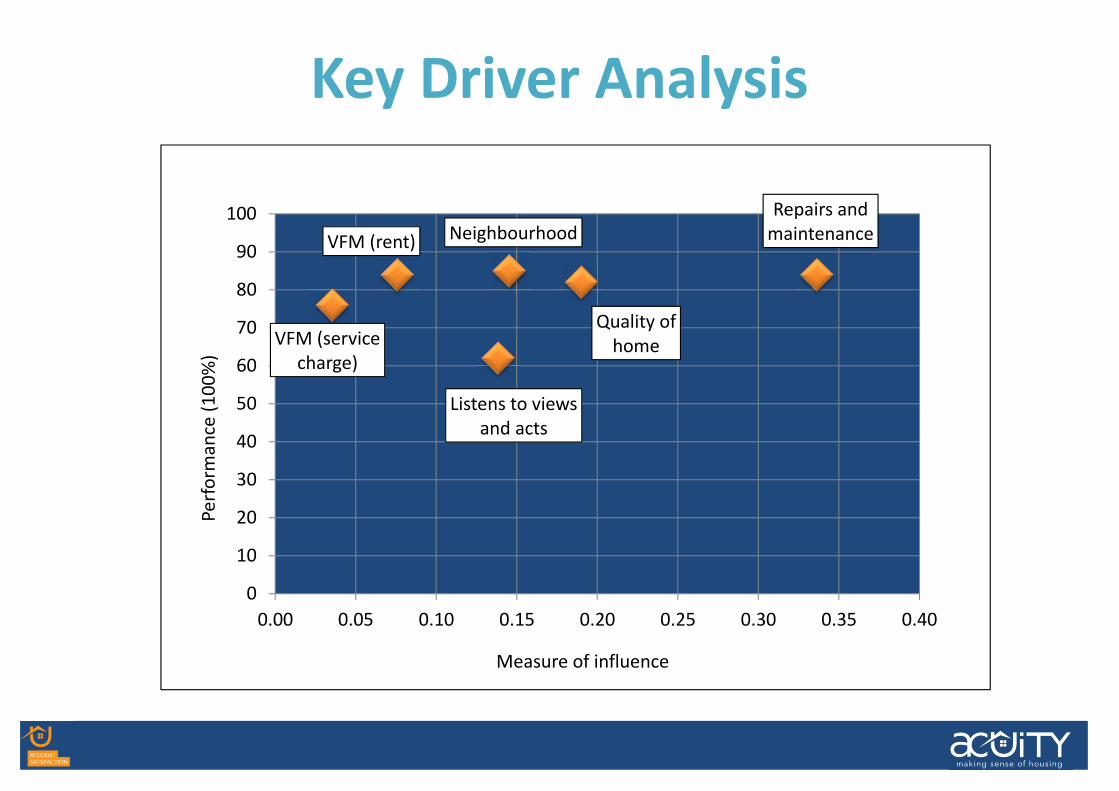
Key Driver Analysis
Repairs and
maintenanceVFM (rent) Neighbourhood
Listens to views
and acts
VFM (service
charge)
Quality of
home
0
10
20
30
40
50
60
70
80
90
100
0.00 0.05 0.10 0.15 0.20 0.25 0.30 0.35 0.40
Pe
rfo
rma
nce
(1
00
%)
Measure of influence
38
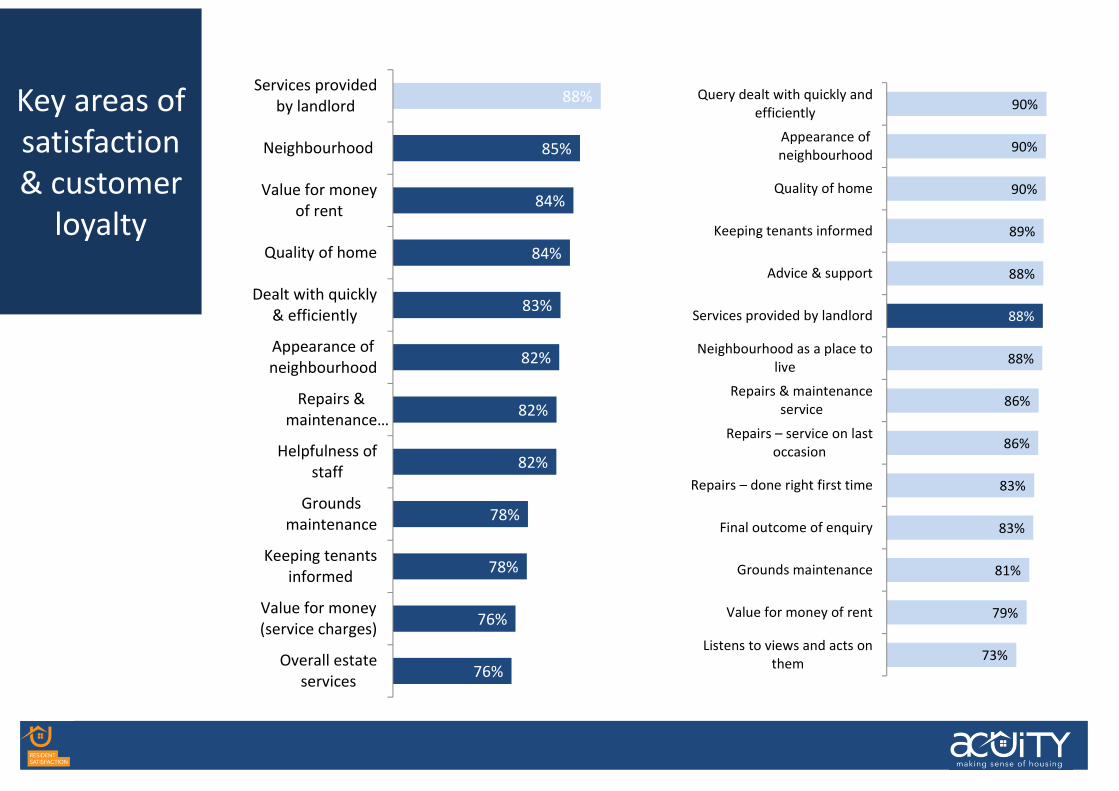
Key areas of
satisfaction
& customer
loyalty
88%
85%
84%
84%
83%
82%
82%
82%
78%
78%
76%
76%
Services provided
by landlord
Neighbourhood
Value for money
of rent
Quality of home
Dealt with quickly
& efficiently
Appearance of
neighbourhood
Repairs &
maintenance…
Helpfulness of
staff
Grounds
maintenance
Keeping tenants
informed
Value for money
(service charges)
Overall estate
services
90%
90%
90%
89%
88%
88%
88%
86%
86%
83%
83%
81%
79%
73%
Query dealt with quickly and
efficiently
Appearance of
neighbourhood
Quality of home
Keeping tenants informed
Advice & support
Services provided by landlord
Neighbourhood as a place to
live
Repairs & maintenance
service
Repairs – service on last
occasion
Repairs – done right first time
Final outcome of enquiry
Grounds maintenance
Value for money of rent
Listens to views and acts on
them
39
40
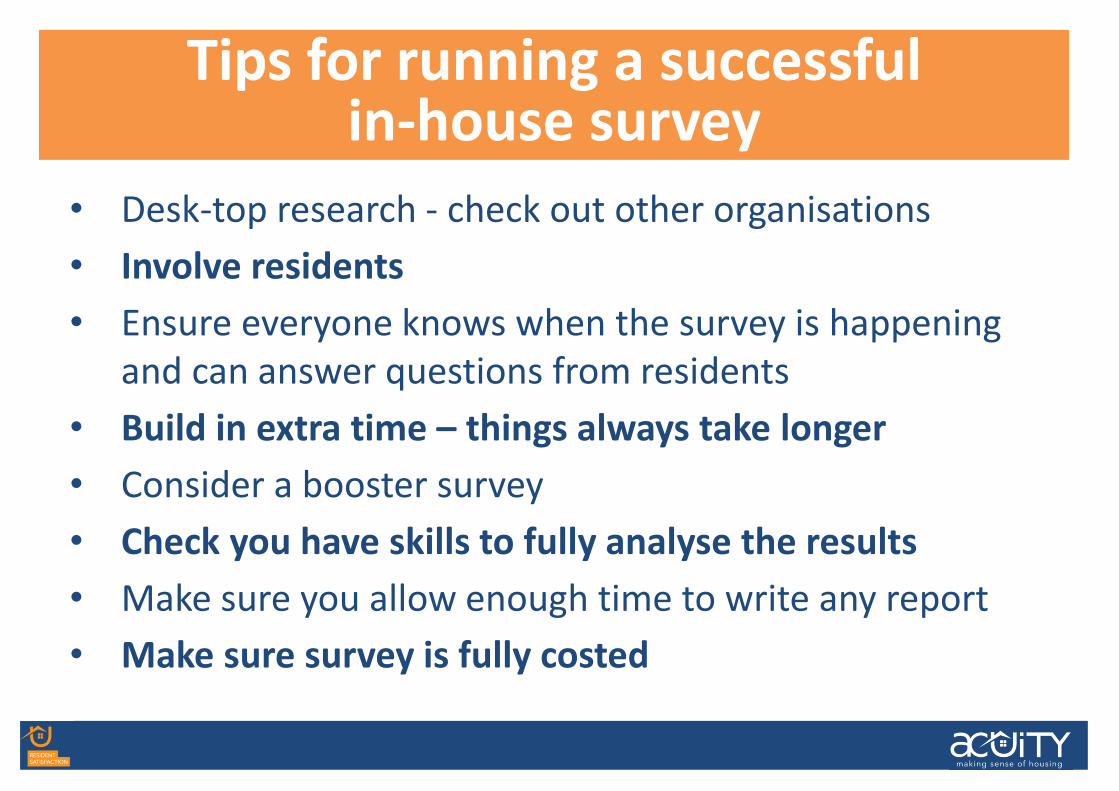
Tips for running a successful in-house survey
41
• Desk-top research - check out other organisations
• Involve residents
• Ensure everyone knows when the survey is happening
and can answer questions from residents
• Build in extra time – things always take longer
• Consider a booster survey
• Check you have skills to fully analyse the results
• Make sure you allow enough time to write any report
• Make sure survey is fully costed
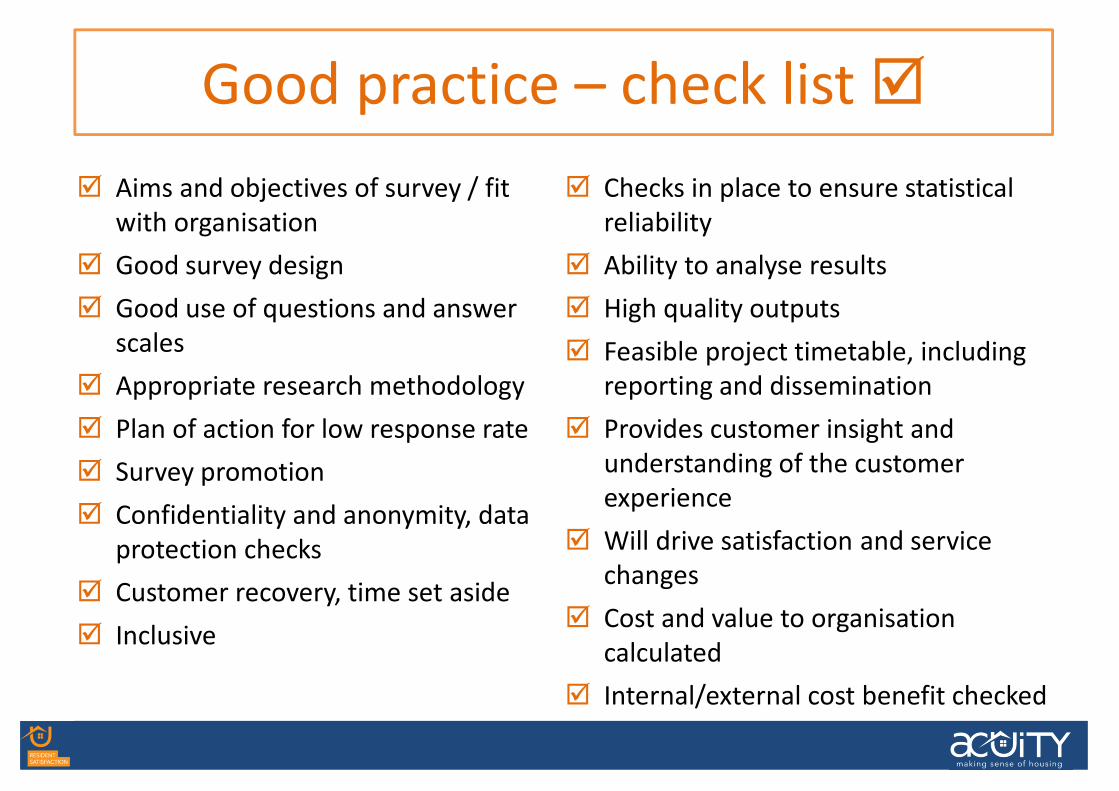
� Aims and objectives of survey / fit
with organisation
� Good survey design
� Good use of questions and answer
scales
� Appropriate research methodology
� Plan of action for low response rate
� Survey promotion
� Confidentiality and anonymity, data
protection checks
� Customer recovery, time set aside
� Inclusive
� Checks in place to ensure statistical
reliability
� Ability to analyse results
� High quality outputs
� Feasible project timetable, including
reporting and dissemination
� Provides customer insight and
understanding of the customer
experience
� Will drive satisfaction and service
changes
� Cost and value to organisation
calculated
� Internal/external cost benefit checked
Good practice – check list �
42
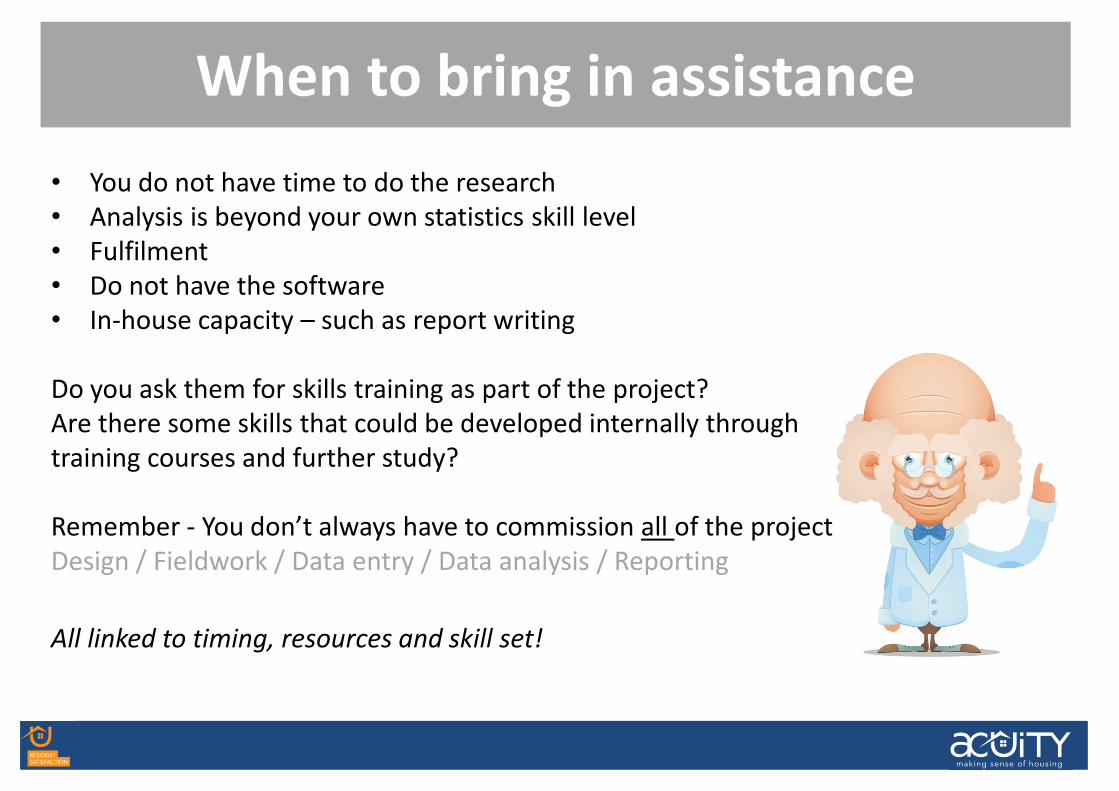
When best to commission external research
• You do not have time to do the research
• Analysis is beyond your own statistics skill level
• Fulfilment
• Do not have the software
• In-house capacity – such as report writing
Do you ask them for skills training as part of the project?
Are there some skills that could be developed internally through
training courses and further study?
Remember - You don’t always have to commission all of the project
Design / Fieldwork / Data entry / Data analysis / Reporting
All linked to timing, resources and skill set!
When to bring in assistance
43
Summary
• Any questions?
• Was the workshop useful?
• Copy of slides
• HouseMark reports
Denise Raine - Director, Acuity
T: 01865 594330 M: 07712 891656
W: arap.co.uk