skomer marine conservation zone project status …...• cafodd sawl chwysigen fôr physalia...
TRANSCRIPT

www.naturalresourceswales.gov.uk www.naturalresourceswales.gov.uk
Skomer Marine Conservation Zone Project Status Report 2017
M. Burton, K.Lock, P. Newman, J. Jones NRW Evidence Report No. 251 Date

Page 1 www.naturalresourceswales.gov.uk www.naturalresourceswales.gov.uk
About Natural Resources Wales Natural Resources Wales is the organisation responsible for the work carried out by the three former organisations, the Countryside Council for Wales, Environment Agency Wales and Forestry Commission Wales. It is also responsible for some functions previously undertaken by Welsh Government. Our purpose is to ensure that the natural resources of Wales are sustainably maintained, used and enhanced, now and in the future. We work for the communities of Wales to protect people and their homes as much as possible from environmental incidents like flooding and pollution. We provide opportunities for people to learn, use and benefit from Wales' natural resources. We work to support Wales' economy by enabling the sustainable use of natural resources to support jobs and enterprise. We help businesses and developers to understand and consider environmental limits when they make important decisions. We work to maintain and improve the quality of the environment for everyone and we work towards making the environment and our natural resources more resilient to climate change and other pressures.

Page 2 www.naturalresourceswales.gov.uk www.naturalresourceswales.gov.uk
Evidence at Natural Resources Wales Natural Resources Wales is an evidence based organisation. We seek to ensure that our strategy, decisions, operations and advice to Welsh Government and others are underpinned by sound and quality-assured evidence. We recognise that it is critically important to have a good understanding of our changing environment. We will realise this vision by:
• Maintaining and developing the technical specialist skills of our staff;
• Securing our data and information;
• Having a well-resourced proactive programme of evidence work;
• Continuing to review and add to our evidence to ensure it is fit for the challenges facing us; and
• Communicating our evidence in an open and transparent way. This Evidence Report series serves as a record of work carried out or commissioned by Natural Resources Wales. It also helps us to share and promote use of our evidence by others and develop future collaborations. However, the views and recommendations presented in this report are not necessarily those of NRW and should, therefore, not be attributed to NRW.

Page 3 www.naturalresourceswales.gov.uk www.naturalresourceswales.gov.uk
Report series: NRW Evidence Report Report number: 251 Publication date: January 2019 Title: Skomer MCZ Project Status Report 2017 Author(s): M. Burton, K. Lock, P. Newman & J. Jones Technical Editor: P. Newman Peer Reviewer(s) C. Duigan, C. Gjerlov Restrictions: None Distribution List (core) NRW Library, Bangor 2 National Library of Wales 1 British Library 1 Welsh Government Library 1 Scottish Natural Heritage Library 1 Natural England Library (Electronic Only) 1 Distribution List (others) Via NRW website Recommended citation for this volume: M. Burton, K.Lock, P.Newman, J. Jones 2018. Skomer MCZ Project Status Report 2017. NRW Evidence Report 251.

Page 4 www.naturalresourceswales.gov.uk www.naturalresourceswales.gov.uk
Contents
1. Crynodeb Gweithredol .................................................................................................... 5
2. Executive Summary ........................................................................................................ 6
3. Skomer MCZ and Sustainable Management of Natural Resources ................................ 7
4. Project Status Tables ...................................................................................................... 9
5. Skomer MCZ Sites and codes ...................................................................................... 15
6. Skomer MCZ Biological Project Summaries.................................................................. 17
6.1. Littoral Communities .........................................................................................................17
Sponge Assemblages .......................................................................................................30
Territorial Fish ..................................................................................................................36
Plankton Recording ...........................................................................................................50
Eunicella Verrucosa: Population and Growth Rate ..........................................................54
Alcyonium glomeratum Population ..................................................................................63
Parazoanthus axinellae Population ..................................................................................68
Pentapora foliacea (ross coral) Population .......................................................................71
Cup Coral Populations; Balanophyllia regia and Caryophyllia smithii ..............................78
Grey Seal (Halichoerus grypus) Population ......................................................................82
6.11 Cetacean Species Recording ...........................................................................................92
6.12 General Species Recording ..............................................................................................97
7. Skomer MCZ Meteorological and Oceanographic Project Summaries .......................... 99
Meteorological Data ..........................................................................................................99
Seawater Temperature Recording ..................................................................................111
Seawater Turbidity / Suspended Particulates and Seabed Sedimentation ....................116
8. Skomer Bibliography ................................................................................................... 122
9. Appendices ................................................................................................................. 134
Appendix 1. Skomer MCZ cetacean presence recorded by a static acoustic data logger (C-POD) ..........................................................................................................................134
Appendix 2 Weather Station Service Report. .................................................................137
Appendix 3 Note on methodology used in collecting activity data at Skomer MCZ .......138
Appendix 4 Excerpts from other non-NRW fish survey projects. ....................................140
Page 5 www.naturalresourceswales.gov.uk
1. Crynodeb Gweithredol Dyma'r 17eg adroddiad statws prosiect a gynhyrchwyd gan Barth Cadwraeth Morol Sgomer (PCM). Mae'n crynhoi cynnydd a statws cyfredol y prosiectau monitro ym Mharth Cadwraeth Morol Sgomer yn ystod 2017. Mae'r prosiectau hyn nid yn unig yn darparu'r dystiolaeth sydd ei hangen i adrodd ar gyflwr PCM Sgomer ei hun, ond hefyd yn gwneud cyfraniad pwysig i'r dystiolaeth a ddefnyddir wrth asesu cyflwr a statws cadwraeth Ardal Cadwraeth Arbennig Forol Sir Benfro, lle mae'r PCM. Mae data hirdymor PCM Sgomer, sef data biolegol yn ogystal â’r defnydd gan bobl, wedi'i ddefnyddio hefyd i sefydlu ac adrodd ar ddangosyddion biolegol ar gyfer gofynion y DU o dan y Gyfarwyddeb Fframwaith Strategaeth Forol (MSFD). Ceir manylion am achosion penodol lle defnyddiwyd data PCM Sgomer i gefnogi mentrau heblaw'r rhai sy'n uniongyrchol gysylltiedig â'r PCM mewn crynodebau prosiectau unigol. Mae tablau statws y prosiect yn Adran 4 yn rhoi crynodeb o'r holl brosiectau monitro sydd wedi'u sefydlu yn y PCM. Mae Adran 6 yn manylu ar brosiectau biolegol y gweithiwyd arnynt yn ystod 2017 a chrynodeb o'r canlyniadau hyd yma. Mae Adran 7 yn rhoi crynodeb o'r prosiectau gwyliadwriaeth eigionegol a meteorolegol. Digwyddiadau nodedig yn y tymor maes 2017
• Cwblhawyd yr arolwg pysgod tiriogaethol gan dimau o ddeifwyr gwirfoddol dros gyfnod o ddau benwythnos. Cymharwyd data'r arolwg â chanlyniadau arolygon blaenorol.
• Datgelodd dadansoddiad o blancton rai rhywogaethau nodedig. Mae Cimwch Ewropeaidd Scyllarus arctus a larfau Facetotecta yn ddau gofnod newydd i’r PCM a chafwyd trydydd cofnod o berdysen Rissoides desmaresti.
• Achosodd “Corwynt Ophelia” a “Storm Brian” dywydd stormus iawn ym mis Hydref ond nid achosodd y rhain gyflymderau gwynt anarferol o uchel. Fodd bynnag, roedd yr ymchwydd yn eithriadol, yn arbennig yn ystod “Ophelia”. Yn ôl dyfais gofnodi tonnau cafwyd rhai tonnau gymaint â 16m o uchder oddi ar St Anne’s Head.
• Cwblhawyd arolwg morloi llwyd bach ar y safle ar yr ynys ac ar y tir mawr o fis Awst i fis Rhagfyr, a chofnodwyd 383 o forloi bach. Dros y 3 blynedd diwethaf gwelwyd y nifer cyfartalog uchaf a gofnodwyd erioed mewn genedigaethau morloi bach ym Mharth Cadwraeth Morol Sgomer, gyda chyfartaledd genedigaethau morloi bach yn 369 ar gyfer 2014-17. Cofnodwyd bod 69% i gyd o forloi bach wedi goroesi a bod y stormydd wedi achosi nifer uchel o farwolaethau, yn enwedig ar safleoedd ar y tir mawr .
• Cafodd sawl Chwysigen Fôr Physalia physalis, eu canfod wedi’u golchi i’r lan ar draeth Martins Haven. Ym mis Medi a mis Hydref cafodd niferoedd uchel eu canfod wedi'u golchi i’r lan ar hyd arfordir De Orllewin Lloegr a Chymru, o ganlyniad i’r gwyntoedd cryfion a stormydd yr Iwerydd. Cofnodwyd niferoedd uchel ohonynt ar sawl traeth yn Sir Benfro gan, gynnwys traeth Marloes a thraeth Musselwick, sydd gerllaw PCM Sgomer.

Page 6 www.naturalresourceswales.gov.uk
2. Executive Summary This is the seventeenth project status report produced by the Skomer Marine Conservation Zone (MCZ). It summarises the progress and current status of monitoring projects in the Skomer MCZ during 2017. These projects not only provide the evidence needed to report on the condition of the Skomer MCZ itself, but make an important contribution to the evidence used in assessing the condition and conservation status of the Pembrokeshire Marine Special Area of Conservation, within which the MCZ is situated. Skomer MCZ long-term data, biological as well as human use, has also been used in establishing and reporting on biological indicators for UK requirements under the Marine Strategy Framework Directive (MSFD). Specific cases where Skomer MCZ data has been used to support initiatives other than those directly linked to the MCZ are detailed in individual project summaries. The project status tables in Section 4 provide a summary of all established monitoring projects in the MCZ. Section 6 details biological projects that were worked on during 2017 and a summary of the results to date. Section 7 provides a summary of the oceanographic and meteorological surveillance projects. Notable events in the 2017 field season:
• The territorial fish survey was completed by teams of volunteer divers over two weekends. The survey data was compared to previous survey results.
• Plankton analysis revealed some notable species. Scyllarus arctus, European Locust Lobster (or Slipper Lobster) and Facetotectan larva are both new records for the MCZ and there was a third record of Rissoides desmaresti (Mantis Shrimp).
• “Ex Hurricane Ophelia” and “Storm Brian” gave some very stormy conditions in October but they did not produce unusually high wind speeds. The ground swell however was exceptional, especially during “Ophelia”. A wave recording device off St Anne’s Head recorded wave heights of 16m.
• The Grey seal pupping survey was completed at both island and mainland sites from August to December, and 383 pups were recorded. Pup production in the Skomer MCZ for the past 3 years has shown the highest average totals ever recorded with average production for 2014-17 at 369 pups. The total pup survival was recorded as 69% with the storms causing high mortality, particularly at mainland sites.
• Portuguese Man-o- War, Physalia physalis, were found washed up on Martins Haven beach. In September and October high numbers were found washed up all along the coast of SW England and Wales, brought in with the strong winds and Atlantic storms. They were recorded in large numbers at many beaches in Pembrokeshire including Marloes Sands and the beach at Musselwick, which are adjacent to the Skomer MCZ.

Page 7 www.naturalresourceswales.gov.uk
3. Skomer MCZ and Sustainable Management of Natural Resources
The Environment (Wales) Act and the Wellbeing of Future Generations (Wales) Act provide the framework for NRW’s work to pursue the sustainable management of natural resources as defined in the former while maximising our contribution to the well-being goals set out in the latter. Sustainable management of natural resources follows nine main principles and the work of Skomer Marine Conservation Zone can be shown to apply (and to have been applying for many years) these principles: Adaptive management – the management of Skomer MCZ is not set in stone. Our monitoring programme provides the evidence we need to review our management actions and where necessary change them. Scale – whereas the boundary of the site was decided decades ago, our extensive knowledge of the MCZ allows us to apply aspects of our management to specific and appropriate areas. For instance, we are confident that the seabed in South Haven and parts of North Haven can tolerate current and historical levels of recreational anchoring, but the rest of the site cannot. This allows us to identify areas where recreational anchoring can happen rather than try to impose a blanket ban on anchoring. For the same reason it would be unreasonable to restrict access to the whole coastline of Skomer when it is specific small areas that are more sensitive to disturbance at different times of year. Hence our seasonal access restrictions are designed to protect breeding seals and birds at the most sensitive sites in the autumn and spring respectively. Collaboration and engagement – this report demonstrates the importance we place upon liaison with academic institutions to increase our knowledge of the site by providing help with research projects. The Skomer MCZ Annual Report further documents our connections with regulatory and recreational organisations to ensure legal and voluntary measures are effective in protecting the site. The Skomer MCZ Advisory Committee is pivotal in this respect. Public participation – without public participation we would be unable to carry out nearly as much monitoring work as we do. We are dependent on volunteers: from teams of volunteer divers carrying out intensive surveys of things like scallops and eelgrass, to individuals making up our own dive team to allow work to continue in the absence of staff. Our voluntary controls would be unworkable without public support and the local community provide valuable help in safeguarding the site through their vigilance. Evidence – NRW is an evidence-based organisation, so evidence is needed to inform policy and underpin operations, whether we are collecting it ourselves or relying on our extensive collaborative network to provide it to us. Multiple benefits – we are fully aware of the intrinsic value of a site, such as Skomer MCZ, where people can come to enjoy wildlife in as unspoilt a marine area as we are likely to have anywhere in Wales. This is all the more important when the importance

Page 8 www.naturalresourceswales.gov.uk
of tourism and recreation to the Welsh economy is considered. We can only theorise on the level of benefits to the wider marine environment of larval export from seabed communities and species deriving a high level of protection as a result of the fishery byelaws we have. Long term – at Skomer MCZ we are in an almost unique position to be able to report on the long-term consequences of marine conservation management actions taken over two decades ago. This is because we have some of the longest-running time-series data for a marine protected site in the UK. Preventative action – the site-based nature of the team at Skomer MCZ is a major contributory factor to the protection of the site. We are able to respond quickly to potentially damaging events and intervene. Sometimes this is by our mere presence acting as a deterrent, and sometimes by educating those who might cause harm unknowingly. Building resilience – by applying nature conservation principles we can help to build diversity, populations, and connectivity; all of which contribute to the maritime ecosystem’s resilience in the face of anthropogenic change.

Page 9
4. Project Status Tables Brief description Year sets Sampling
frequency Report Data
summary PHYSICAL
Meteorological data Wind, rain, sunshine, temperature, humidity, net radiation. Automatic station logging 10 minute means. New met station (2006) is compatible with the ECN and logs files daily, hourly and (since Oct 06) every ten minutes.
1993 – ongoing (Old station removed Oct 05) New Met station installed 25 /04 2006 - ongoing
Continuous No Yes-SMCZ office
Wave data
Height, period, etc. Automatic station logging every 10mins.
1993-1998 Discontinued
Continuous
No
No - raw only
Seawater data
Temperature, salinity, conductivity, suspended sediment. YSI 6600 multi parameter sonde: Temperature, salinity, dissolved O2, Chlorophyll, turbidity & depth. OSIL buoy automatically transmitting data from YSI 6600 sonde.
Buoy redeployed 2010 Buoy lost Nov 2013 Onset logger re-deployed Apr 2014 (no telemetry)
1992 – ongoing 2007 – 2013
2014 - ongoing
Weekly (May -Sept) Temp (since 99) Hourly Hourly samples Hourly samples
No
No
Yes-SMCZ office
Yes-SMCZ office

Page 10
Brief description Year sets Sampling frequency
Report Data summary
Seabed sedimentation Auto sampler 1994-1998 Discontinued
Continuous No Yes-SMCZ office
Sediment trap 1994 – ongoing 1995 to1998 2002 to 2016
Every 14 days (April-Oct)
Jones 1998 Yes-SMCZ office
Suspended sediments
Idronaut Turbidity logger
Secchi disc YSI 6600 multi parameter sonde – now stopped
2001 – failed 06
1992 - onwards 2007 - 2013
Continuous Weekly (seasonal) Hourly
No No No
No - raw only Yes – SMCZ office Yes-SMCZ office
ACTIVITY
Recreation activities Boats, divers, anglers recorded in the MCZ
1987 - ongoing Weekly (May -Sept)
Skomer MCZ annual reports
Skomer MCZ annual reports
Commercial fishing activities
Pot buoys and fishing net positions 1989 - ongoing Weekly (May -Sept)
Burton 2002 SMCZ annual reports
Yes-SMCZ office
Tankers in St Brides bay Number and names of tankers and movements. Now using AIS system
1994 - ongoing Daily 24/7 electronic AIS
No Yes-SMCZ office Yes-SMCZ office
BIOLOGICAL
Littoral communities:
Macro scale (view point photographs)
Time series photos/digitised. 1992 - ongoing Annual Internal report – Daguet 2000 and Gibbs 2007
Yes-SMCZ office
Meso scale (transects) 6 Transects. Time series photos/digitised.
1992 – 2002 2003 - ongoing
Annual Annual
Adams 1979/ Bunker 1983/ Crump 1993/96 Hudson 1995. Burton & Crump 2004
Yes-SMCZ office
Yes-SMCZ office

Page 11
Brief description Year sets Sampling frequency
Report Data summary
9 sites established in 2003 including 3 Marclim sites. Site marking completed in 2004.
Sub littoral communities:
Rocky reef communities Time series stereo photos. 1982 - ongoing Annual Bullimore1986 & 1987
Yes-SMCZ office
Algal communities Survey and report completed Survey completed report in preparation Full survey and method development
1999 2005 2007
Hiscock, S 1983 & 1986, Scott 1994, Brodie & Bunker 1999/2000, Maggs & Bunker 2007.
Yes-SMCZ office
Sponge assemblages
Time series mono-photo/digitised. Species recording at TRK
Seasonal monitoring from 15 fixed quadrats – Dr J Bell
1994 - ongoing 2002/3, 2007/8 2011, 2015 2006 – ongoing
Annual Every 4 years Next survey planned 2019
Bunker & Jones 2008 & 2012, Bell et al. 2012, Jones et al. 2012 & 2015, Berman et al. 2013.
Yes-SMCZ office
Infaunal sediment Surveys and reports completed 1993/1996/ 1998/ 2003 2007/ 2009 / 2013 & 2016
Every 4 years Next survey planned 2020
Rostron 1994 & 1996, Barfield 1998 & 2003, Barfield 2007 & 2010.
Yes-SMCZ office
Epifaunal sediment Survey and report completed 1995/ 2001 & 2004 Video 2009
Project now combined with Infauna
Rostron 1996, Moore 2002 & 2005.
Yes-SMCZ office

Page 12
Brief description Year sets Sampling frequency
Report Data summary
Plankton communities
Zooplankton samples taken with a 200um net. Vertical haul using methods that are comparable to others used in UK.
2009 ongoing Weekly samples taken during the field season.
Unpublished report with method recommendations and links to data spreadsheets – Plymouth Marine Laboratories 2015.
Yes-SMCZ office
Flora:
Zostera marina
Extent of North Haven bed & density distribution.
Biosonics Acoustic sonar survey
1997/2002/2006,2010 & 2014 (Boundary maps for 2000, 2002 & 2004) 2013, 2014 & 2015
Every 4 years Next survey planned 2018 Annual
Jones & Hodgson 1980 &1981, Jones et al. 1983, Lock et al. 1998, 2003 & 2006, Burton et al. 2010, Lock et al. 2015.
Yes-SMCZ office
Fauna:
Eunicella verrucosa 101 colonies, time series mono-photo/digitised. 4 colonies stereo-photo.
1993- ongoing 1982- ongoing
Annual Bunker et al. 1985, Bullimore1986 & 1987, Gilbert 1998.
Yes-SMCZ office
Alcyonium glomeratum
Time series stereo-photo/digitised. North wall 5 transects (% frequency) North wall East, Thorn rock &Rye rocks.
1984- ongoing 2002 new transects
Annual Bullimore1986 & 1987.
Yes-SMCZ office
Parazoanthus axinellae 6 sites, time series mono- photo/digitised.
2001- ongoing Annual Burton et al. 2002. Yes-SMCZ office

Page 13
Brief description Year sets Sampling frequency
Report Data summary
Pentapora foliacea 3 sites, time series mono-photo/digitised.
New sites established 2002 & 2003.
1994- ongoing Annual Bullimore1986 & 1987, Bunker & Mercer 1988, Gilbert 1998, Gibbs 2006.
Yes-SMCZ office
Balanophyllia regia Time series at Thorn Rock stereo-photo/digitised The Wick. 3 transects
1984 – 2002 - ongoing 2002 - ongoing
Annual Bullimore 1986 & 1987.
Yes-SMCZ office
Caryophyllia smithii Counted from sponge project quadrats (stereo-photo/digitised)
1993 - ongoing Annual No Yes-SMCZ office
Grey seal (Halichoerus grypus)
Annual pup production and survival records at Skomer Island and mainland MCZ sites. Site fidelity and other behavioural records for Skomer Island sites.
1976- ongoing Annual Grey seal breeding census, Skomer Island 1992-2017, Skomer MCZ annual reports 1992-2017.
Yes-SMCZ office
Nudibranch species
Various surveys MCZ survey completed.
1975-1991 2002, 2006, 2010 & 2014.
Every 4 years Next survey planned 2018
Hunnam & Brown 1975, Bunker et al. 1993, Luddington 2002, Locket al. 2010 & 2014.
Yes-SMCZ office
Territorial fish Survey methods developed. Survey completed. N. Sweet drop down video survey R. Bullimore video survey
1997,2001/2002 2005, 2009, 2013,2007, 2009, 2013 & 2017.
Every 4 years Next survey planned 2021
Lock 1998, Lock et al. 2006, Tompsett 2006, Sweet 2009,
Bullimore 2010.
Yes-SMCZ office

Page 14
Brief description Year sets Sampling frequency
Report Data summary
King scallop
Pecten maximus
(including Crepidula fornicata, Aequipecten opercularis and Arctica islandica from 2008)
UCS survey, Survey completed, 3 sites- 2000 Survey completed, 7 sites 2004, 2008, 2012& 2016
1979/80, 1979-82 2000, 2004, 2008, 2012, 2016
Every 4 years Next survey planned 2020
Bullimore 1985, Jones 1979 & 1980, Lock 2002, Luddington et al. 2004, Lock et al. 2009 & 2013, Burton et al. 2016.
Yes-SMCZ office
Echinoderm Survey Abundance of Echinus esculentus in Skomer MCZ using volunteer survey methods. Data for Marthasterias glacialis, Crossaster papposus & Luidia ciliate.
2003,2007 & 2011, 2015
Every 4 years Next survey planned 2019
Luddington et al. 2004, Lock et al. 2008, 2011 & 2016.
Yes-SMCZ office
Commercial Crustaceans Parlour pot and diving study (Plymouth student project) Parlour pot study – MCZ Shell disease survey Crawfish recording
2003 2011 2011 2011 onwards
Aug / Sep 2003 Jul – Oct 2011 Sep – Oct 2011 SMCZ team
Fothergill 2004 No No
Yes-SMCZ office
Cetaceans Observations of all Cetacean species.
2001 onwards Records from Skomer Island, “Dale Princess” and SMCZ team
No Yes-SMCZ office

Page 15 www.naturalresourceswales.gov.uk
5. Skomer MCZ Sites and codes
Site code Site Name Site Code Site Name Site Code Site Name
ACR Anchor Reef JNK Junko’s Reef SCA South Castle
ABY Albion Beach JHV Jeffrey’s Haven SHD Skomer Head
BEN The Bench JSD Out/JSN/JSS
Jack Sound /North /South
SHV/SHV Out
South Haven /Outer
BHO Bull Hole LCA Little Castle beach SPE South Plateau East
BLD Boulder Beach LCY “Lucy” wreck SPS South Plateau South
BRK/BRK Off
Bernie’s Rocks/ Offshore
LPT/LPT Out Low point/Outer SPT The Spit
BSE Broad Sound East
LSD/LSDN/LSDS
Little Sound /North/South
TBL The Table
BSN The Basin MDN/MDS/MDN Out
Middleholm North/South/ North Outer
TOM Tom’s House
BST Black Stones MHV/MHVE/MHVW/MHV Out/MHV Off
Martins Haven/East /West /Outer /Offshore
TRK/Out Thorn Rock /Outer
BSW Broad Sound West
MST Mew Stone TSK Tusker Rock
CBY Castle Bay NCA North Castle VIC Victoria Bay
CST Crab Stones NHV/Out North Haven/Outer WAT Watery Bay
DCF Double Cliff NNI/NNO North Neck Inner/Outer
WAY/Off Waybench /Offshore
DEY “Dead Eye” wreck
NWA/NWA Off
North Wall /Offshore
WBY/Off Waterfall Bay /Offshore
DMB Dead Man’s Bay OMS Oceanographic Monitoring Site
WGN

Page 16 www.naturalresourceswales.gov.uk
EHK/EHK Out
East Hook/Outer PBY Pig Stone Bay WGS
GST/GST Off
Garland Stone/Offshore
PEB Pebbly Beach WHK/Out West Hook /Outer
GSW Garland Stone West
POL/POL Off The Pool /Offshore WKB Wick Basin
GTH/GTH North
Gateholm/North PST Pig Stone WTB/Out Wooltack Bay /Outer
HCL High Cliff RAIN Rainy Rock WTP Wooltack Point
HCR High Court Reef REN Renney Slip WWK The Wick
HOP/HOP Out
Hopgang/Outer RFB Rockfall Bench 3DR Three Doors
HPT/HPT Out
High Point/Outer RRK Rye Rocks
HSC Horseshoe Cave RSB Renney Slip Bay
Page 17 www.naturalresourceswales.gov.uk
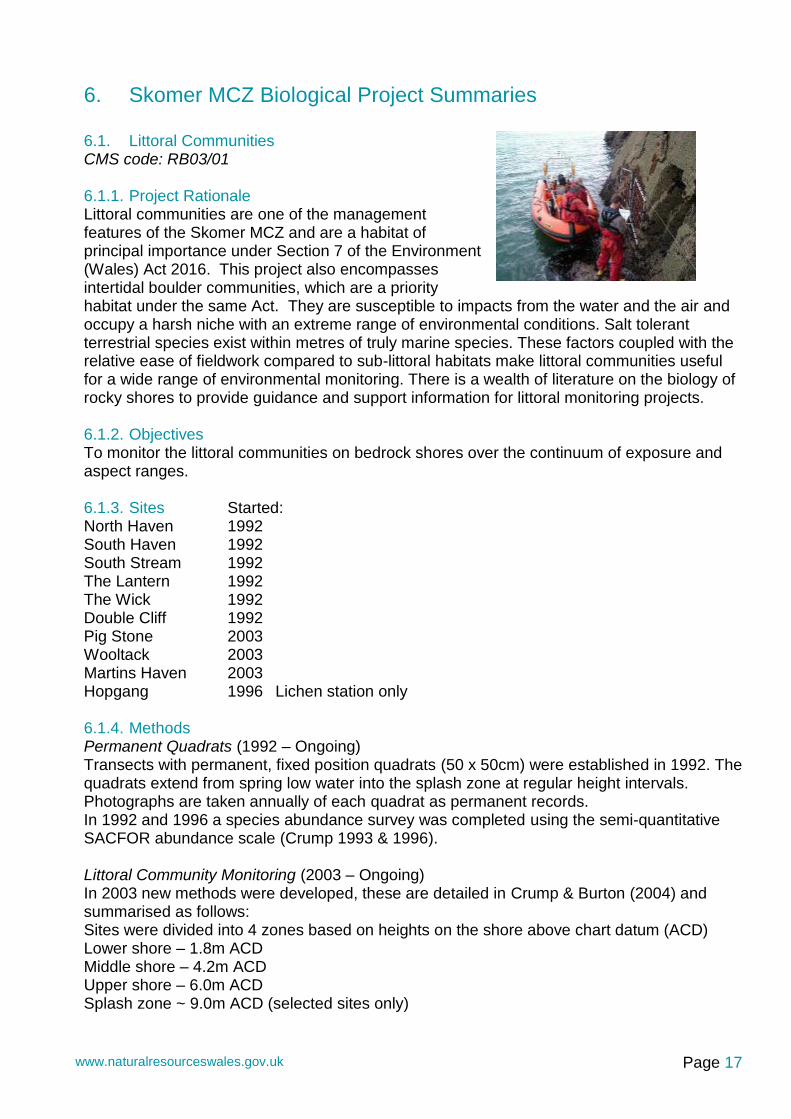
6. Skomer MCZ Biological Project Summaries 6.1. Littoral Communities CMS code: RB03/01 6.1.1. Project Rationale Littoral communities are one of the management features of the Skomer MCZ and are a habitat of principal importance under Section 7 of the Environment (Wales) Act 2016. This project also encompasses intertidal boulder communities, which are a priority habitat under the same Act. They are susceptible to impacts from the water and the air and occupy a harsh niche with an extreme range of environmental conditions. Salt tolerant terrestrial species exist within metres of truly marine species. These factors coupled with the relative ease of fieldwork compared to sub-littoral habitats make littoral communities useful for a wide range of environmental monitoring. There is a wealth of literature on the biology of rocky shores to provide guidance and support information for littoral monitoring projects. 6.1.2. Objectives To monitor the littoral communities on bedrock shores over the continuum of exposure and aspect ranges. 6.1.3. Sites Started: North Haven 1992 South Haven 1992 South Stream 1992 The Lantern 1992 The Wick 1992 Double Cliff 1992 Pig Stone 2003 Wooltack 2003 Martins Haven 2003 Hopgang 1996 Lichen station only 6.1.4. Methods Permanent Quadrats (1992 – Ongoing) Transects with permanent, fixed position quadrats (50 x 50cm) were established in 1992. The quadrats extend from spring low water into the splash zone at regular height intervals. Photographs are taken annually of each quadrat as permanent records. In 1992 and 1996 a species abundance survey was completed using the semi-quantitative SACFOR abundance scale (Crump 1993 & 1996). Littoral Community Monitoring (2003 – Ongoing) In 2003 new methods were developed, these are detailed in Crump & Burton (2004) and summarised as follows: Sites were divided into 4 zones based on heights on the shore above chart datum (ACD) Lower shore – 1.8m ACD Middle shore – 4.2m ACD Upper shore – 6.0m ACD Splash zone ~ 9.0m ACD (selected sites only)

Page 18 www.naturalresourceswales.gov.uk
At Each Lower, Middle and Upper Shore Zones: Four 1m2 quadrats positions are permanently marked. The positions were selected to cover relatively homogenous areas of inclined rock (avoiding rock pools and large fissures). At each position:
• 1m2 quadrat divided into a 25 cell grid is used to record presence/absence for all species. Some species are aggregated for recording as follows: Rough winkle species, barnacle species, limpets recorded as Patella spp., encrusting red algae.
• Four digital photographs are taken using a 50 x50 cm quadrat within each 1m2 quadrat.
• Limpets are counted in 5 randomly selected grid cells providing 20 samples at each shore height.
• % cover of barnacle species is estimated in 5 randomly selected grid cells and barnacles are photographed within the same 5 grid cells using a 5 x 5cm quadrat. The photographs provide 20 samples from each shore height, these are stored for barnacles species counts for all individuals > 2mm (currently the photos are stored and counts will be completed when time allows).
At Middle Shore Zones: Over 100 limpets (Patella spp) are measured to the nearest mm using
callipers from within the quadrats. In areas of low density at least 100 limpets were measured.
At Splash Zones: % cover of all lichen species are recorded in 50 x 50cm quadrats at selected
sites and a quadrat photograph taken. MarClim Methodology (2003 - Ongoing) The MarClim project offers an opportunity to compare Skomer MCZ shores to the rest of the UK
and contribute to the assessment of the effects of climate change. Martin’s Haven, North Haven and South Haven were selected as suitable sites for the project (see Mieszkowska et al. 2002):
The MarClim method:
• Abundance recording of a selected list of edge of range species.
• Photograph barnacles in 5 x 5cm quadrats to complete barnacles species counts.
• Limpet species counts in 50 x 50cm quadrats
• Timed searches of Phorcas lineatus and Steromphala umbilicalis and individuals measured to the nearest mm.
Shore Clingfish (Lepadogaster lepadogaster) (2004 - Ongoing) Timed counts of clingfish are carried out at Martins Haven and North Haven together with records of egg masses. Counts started in 2011 at South Haven.

Page 19 www.naturalresourceswales.gov.uk
Site Permanent
Quadrats Shore zone quadrats, Limpets, Barnacles
Lichen quadrats
MarClim Shore clingfish
North Haven Yes Yes
South Haven Yes Yes Yes
South Stream Yes Yes Yes
The Lantern Yes Yes Yes
The Wick Yes Yes Yes
Double Cliff Yes Yes
Pig Stone Yes Yes
Wooltack Yes Yes
Martins Haven Yes Yes Yes Yes
Hopgang Yes
Table 6.1.1Summary of methods completed at each littoral site.
6.1.5. Project history 1982: Bunker et al. surveyed twenty-two sites in the MNR as a baseline littoral survey. 1992: Six permanent transects were established in the MNR and surveyed/ photographed (Crump, 1993). 1992 – 2002: Photographs of the six permanent transects were taken and stored. 1996: Following the Sea Empress oil spill (February 1996) the six transects were resurveyed and a lichen monitoring site was set up at Hopgang (Crump, 1996). The littoral shores around Skomer showed no significant changes after the Sea Empress oil spill, with the exception of the lichen community at Hopgang, which showed signs of necrosis. 2001: Slide photographs from 1992 – 2000 were reviewed and abundance estimates from the photographs compared with abundance records from Crump 1993 & 1996 field data. Photograph quality was insufficient to allow accurate abundance estimates. 2001/02: Digital imaging was tested to obtain pictures of permanent quadrats. Image quality was improved; however, estimates of species abundance were still inaccurate due to difficulties with identification of species and individuals from the images. This method cannot replace collection of data in the field for quantitative assessment. 2003: New quantitative methods were tested at the six original sites and four additional sites were established, (Crump & Burton, 2004). 2004: Methods established in 2003 were continued. All site marking was completed and all results collected. Marclim surveys were started at 3 sites: Martins Haven, South Haven and North Haven. 2005: All the sites established in 2003 were resurveyed except for the lower shore at Pig Stone. 2006: All sites were completed.

Page 20 www.naturalresourceswales.gov.uk
2007: All sites were completed and temperature loggers were placed at the Martins Haven and South Haven sites. 2008: All sites resurveyed except for Double cliff, upper shore. 2009 - 2011: All sites completed. 2012: All sites complete except Double cliff (no data for any shore height). 2013 - 2015: All sites completed. 2016: All sites completed except for Pig Stone – no landing was possible (no data). 2017: All sites completed. 6.1.6. Results Whole Community Analysis All the shore zone quadrat data is entered into the PRIMER statistics software for community analysis. The results can be visualised as MDS plots.
Fig. 6.1.1 PRIMER Multi-dimensional scaling (MDS) plot of all littoral community data 2003 – 2017
General summary:
• Upper shore sites group neatly on the right.
• Lower shore sites are much more disparate and grouped on the left.
• Middle shore sites sit in between with some overlap (at 60% similarity) with the lower shores.
• Some sites form distinct clusters e.g. MHV Upper, MHV Lower.
• Some sites are very variable from year to year e.g. PST Lower & WTK Lower.
Transform: Square root
Resemblance: S17 Bray Curtis similarity
zoneUP
MD
LW
Similarity40
60
WCKWCK
WCK
SST
SST
LTN
LTN
MHV
MHV
MHV
WTK
WTK
DBC
DBC
PST
PST
WCK
WCK
WCK
SST
SST
SST
LTN
LTN
LTN
MHV
MHV
MHV
WTK
WTK
WTK
DBC
DBC
DBC
PST
PST
PST
WCKWCK
WCK
SST
SST
SST
LTN
LTN
LTN
MHV
MHV
MHV
WTK
WTK
WTK
DBC
DBC
DBC
PST
PST
WCK
WCK
WCK
SST
SST
SST
LTN
LTN
LTN
MHV
MHV
MHV
WTK
WTK
WTK
DBC
DBC
DBC
PSTPST
PST
WCK
WCK
WCK
SST
SST
SST
LTN
LTN
LTNMHV
MHV
MHV
WTK
WTK
WTK
DBC
DBC
DBC
PSTPST
PST
WCK
WCK
WCK
SST
SST
SST
LTN
LTN
LTN
MHV
MHV
MHV
WTK
WTK
WTK
DBC
DBC
PSTPST
PST
DBCPST
WCK
WCK
WCK
SST
SST
SST
LTN
LTN
LTN
MHV
MHV
MHV
WTK
WTK
WTKDBCDBC
DBC
PST
PST
PST
WCK
WCK
WCK
SST
SST
SST
LTN
LTN
LTN
MHV
MHV
MHV
WTK
WTK
WTK
DBC
DBC
DBC
PST
PST
PST
WCKWCK
WCK
SST
SST
SST
LTN
LTN
LTN
MHV
MHV
MHV WTK
WTK
WTK
DBC
DBC
DBC
PST
PST
PST
WCKWCK
WCK
SST
SST
SST LTN
LTN
LTNMHV
MHV
MHV
WTK
WTK
WTK
PSTPST
PSTDBC
DBC
DBC
WCK
WCK
WCK
SST
SST
SST
LTN
LTN
LTN
MHV
MHV
MHV
WTK
WTK
WTK
DBC
DBC
DBC
PSTPST
PST
WCKWCK
WCK SST
SST
SST
LTN
LTN
LTNMHV
MHV
MHV
WTK
WTK
WTK
DBC
DBC
DBC
PSTPST
PST
WCK
WCK
WCK
SST
SST
SST
LTN
LTN
LTN
MHV
MHV
MHV
WTK
WTK
WTK
DBC
DBC
DBC
PST
PST
PST
WCKWCK
WCK
SST
SST
SST
LTN
LTN
LTN
MHV
MHV
MHV
WTK
WTK
WTK
DBC
DBC
DBC
PST
PST
PST
WCK
WCK
WCK
SST
SST
SST
LTN
LTN
LTN
MHV
MHV
MHV
WTK
WTK
WTK
DBC
DBCDBC
PST
PST
PST
2D Stress: 0.11

Page 21 www.naturalresourceswales.gov.uk
2017 did not show any major variations from the overall trends seen since 2004. An “ANOSIM” test for differences between years showed no significant difference between any of the years. Global Test Sample statistic (Global R): -0.024 Significance level of sample statistic: 99.9% The communities on the shores have not shown any major changes during the monitoring period. Detailed analysis of some specific groups of species are given below. Mean Percentage Cover of Barnacles Barnacle coverage has been variable between sites over the last 14 years. In 2014 all sites saw a decrease in barnacle cover in the middle and lower shores. This was perhaps due to the extreme weather of the winter of 2013-14. In 2017, again, the barnacle coverage decreased slightly across all shores and zones, except for Wick (upper) and Lantern (lower).
0
10
20
30
40
50
60
70
80
Mean %
cove
r
year
Upper shore barnacle covergae
Pig Stone inside
Double cliff
MHV
Wooltack point / Jack sound
South Stream
Lantern
Wick
0
20
40
60
80
100
120
Mean %
cove
r
Year
Middle shore barnacle coverage
Pig Stone inside
Double cliff
MHV
Wooltack point / Jack sound
South Stream
Lantern
Wick

Page 22 www.naturalresourceswales.gov.uk
Fig. 6.1.2 Changes in upper, middle and lower shore barnacle coverage 2003 - 2017 95% S.E.
Barnacle Species Ratios The barnacles species counts have been completed from the photographs of the 5cm X 5cm quadrats at the 3 MarClim Sites, (photographs taken at the other sites are stored for analysis when time allows). The lower shore underwent some dramatic changes in 2004 with Semibalanus balanoides declining and being immediately replaced by Chthamalus montagui. This may be due to a poor settlement of S. balanoides spat in the winter of 2002/3 (possibly linked to mild sea temperatures), C. montagui individuals would then benefit from a lack of competition. In 2014 there was a significant drop in S. balanoides at all shore zones with an increase in C. montagui. Since then the proportion of S. balanoides has increased.
0
20
40
60
80
100
120
Mean %
cove
r
Year
Lower shore barnacle coverage
Pig Stone inside
Double cliff
MHV
Wooltack point / Jack sound
South Stream
Lantern
Wick
0.00
10.00
20.00
30.00
40.00
50.00
60.00
70.00
80.00
90.00
100.00
2002 2003 2004 2005 2006 2007 2008 2009 2010 2011 2012 2013 2014 2015 2016 2017 2018
specie
s r
atio (
%)
Year
Upper shore barnacle species ratio
Austrominius modestus
Semibalanus balanoides
Chthamalus montagui
Chthamalus stellatus

Page 23 www.naturalresourceswales.gov.uk
Fig. 6.1.6 Changes in upper, middle and lower shore barnacle species ratios 2003 - 2017
Limpet Size and Counts The mean limpet size recorded at sites shows a stable trend at most sites, the Lantern shows the greatest fluctuations.
0.0
10.0
20.0
30.0
40.0
50.0
60.0
70.0
80.0
90.0
2002 2003 2004 2005 2006 2007 2008 2009 2010 2011 2012 2013 2014 2015 2016 2017 2018
specie
s r
atio (
%)
Year
Middle shore barnacle species ratio
Austrominius modestus
Semibalanus balanoides
Chthamalus montagui
Chthamalus stellatus
Perforatus perforatus
0.0
10.0
20.0
30.0
40.0
50.0
60.0
70.0
80.0
90.0
100.0
2002 2003 2004 2005 2006 2007 2008 2009 2010 2011 2012 2013 2014 2015 2016 2017 2018
specie
s r
atio (
%)
Year
Lower shore barnacle species ratio
Austrominius modestus
Semibalanus balanoides
Chthamalus montagui
Chthamalus stellatus
Perforatus perforatus

Page 24 www.naturalresourceswales.gov.uk
Fig. 6.1.3 Changes in mean limpet size 2003 – 2017 95% S.E.
. Fig. 6.1.4 Changes in middle shore limpet counts 2003 – 2017 95% S.E.
In the middle shore the highest numbers of limpets are found on the north facing shores, but these figures tend to be the most erratic. 2007 appears to have had a dip in numbers at six of the sites, which all showed an increase the following year. On the middle shore the numbers have been stable from 2009 onwards with an increase in numbers at all sites in 2012 followed by a slight decrease in 2013 & 2014.
0.0
5.0
10.0
15.0
20.0
25.0
30.0
Mean s
ize (
mm
)
Year
Martin's haven
Lantern
South stream
The Wick
.
0
5
10
15
20
25
Count
/ 0.0
4m
2
Year
Wooltack point / Jack sound
Pig Stone inside
Martin's haven
Lantern
South stream
The Wick
Double cliff

Page 25 www.naturalresourceswales.gov.uk
Fig. 6.1.5 Changes in upper shore limpet counts 2003 - 2017 95% S.E.
In the upper shore most sites have a low abundance of limpets. Double cliff has significantly more limpets than any other site (north facing shaded cliff) and an interesting declining trend from 2003 – 2006. Lichen quadrats Lichen data has been entered into spreadsheets, and the photographs stored ready for further analysis. MarClim survey MarClim data has been entered into spreadsheets and supplied to the MarClim team. Clingfish records (Lepadogaster lepadogaster). Timed searches have been completed at North Haven and Martins Haven since 2003. In 2010 a single clingfish was also found at South Haven beach and in 2015 & 2016 they were found in greater numbers so this has been added as a monitoring site.
Figure 6.1.7 Average numbers of clingfish 2003 – 2017 at North Haven and Martins Haven
0
2
4
6
8
10
12
14
16C
ount
/ 0.0
4m
2
Year
Wooltack point / Jack sound
Pig Stone inside
Martin's haven
Lantern
South stream
The Wick
Double cliff
0.0
2.0
4.0
6.0
8.0
10.0
12.0
14.0
16.0
2002 2004 2006 2008 2010 2012 2014 2016 2018
Mean
nu
mb
ers
of
Clin
gfi
sh
Year
NHV
MHV

Page 26 www.naturalresourceswales.gov.uk
Numbers are very variable but there are always clingfish present and eggs are always seen at the time of the survey in various stages of development. Long term volunteer project – clingfish North Haven Skomer; Ruby Temple-Long. In 2017 a long-term volunteer working on Skomer Island NNR (Wildlife Trust South and West Wales) conducted a research project on the clingfish population at North Haven. The population was surveyed between 28th April and 06th September 2017 every 2 weeks. 2 x 30m transects were set up, one in the middle shore (3m above chart datum (ACD)) and one in the lower shore (~1m ACD). Counts were made of all clingfish and egg masses found within a 1m band either side of the transect (60m2). Summary of results: No Cling fish were found in the middle shore. Lower shore.
Figure 6.1.8 Number of adult clingfish and eggs masses found on the lower shore (60m2) North haven.
Adult Cling fish were seen on all visits, even when no eggs were present. Egg laying period had started before the survey began on the 28th April and extended into early July. It is hoped that this study will be repeated in future years with surveys conducted earlier in the year to see when the egg laying season starts.
0
2
4
6
8
10
12
14
16
0
20
40
60
80
100
120
140
160
No. o
f E
ggs
No. o
f A
du
lts
Adults Eggs
Page 27 www.naturalresourceswales.gov.uk
Testing for climate change effects on the intertidal community. The MarClim survey specifically addresses climate change in the intertidal. 3 sites are surveyed within the MCZ using the MarClim methodologies which allows the Skomer shores to be directly compared to all the other MarClim survey sites throughout the UK. A full summary of the MarClim results can be found in Mieszkowska, N. (2017). Trends since 2003:
• Lusitanian warm water topshells have shown increases in range and abundance at established populations in Wales throughout the 2000s in response to climate warming, and a reduction in abundance between 2010 and 2013 due to the hiatus in global warming detected during the 2000s.
• The abundance of both the cold water sponge Halichondria panicea and the warm water sponge Hymeniacidon perlevis have declined over the 2010s across Wales at MarClim sites.
• Several species of invasive, non-native macro-algae and invertebrates are recorded as part of the MarClim surveys in Wales but very few have been recorded at Skomer MCZ, (Sargassum muticum is sporadically found at Martins Haven).
Another way of looking for temperature related changes in communities is to use a technique developed by Devictor et al. (2012); Community Temperature Index (CTI). This has been further developed for marine communities by Stuart-Smith et al. (2015) and in the UK by Burrows (2016) and Burrows & Mieszkowska (SNH Report in prep.). Community Temperature Index – description from Burrows 2016; “This approach characterises each species by its thermal affinity, here taken effectively as the mid-point temperature in the geographical range and termed the Species Temperature Index (STI). The average of species thermal affinity across an entire community is obtained by weighting each species thermal midpoint (STI) value by the average abundance of that species, to give the Community Temperature Index (CTI). CTI values can be calculated for each site and averaged across all sites to give an average index for each year of the survey. Changes in annual CTI can be directly compared to annual changes in temperature, with the relationship between CTI and temperature showing the climate change response of the community.” The Marclim survey data for the Pembrokeshire and Skomer MCZ shores have been used to calculate CTI for the period 2003 – 2017 using STI values from Burrows 2016. Sea surface temperatures (SST) from temperature probes at Skomer MCZ were then used to calculate mean SST for the period. An annual mean and a summer mean (July – Sep) have been calculated.

Page 28 www.naturalresourceswales.gov.uk
Figure 6.1.9 Mean Sea Surface Temperature (Annual and Summer) with 95% S.E. bars.
The annual mean shows no sign of any change since 1990. The summer mean suggests a rise since the 1980s but all within the 95% confidence limits. This fits with the SST trends for the SW of Britain where SST has risen in the 1990’s but then there has little change, with a slight cooling in the 2000s (Burrows 2016). The CTI scores for the 3 shores surveyed at Skomer show no significant change averaging a CTI of 12oC which would match the ambient SST for the same period.
Figure 6.1.10 Community Temperature Index - Skomer shores 2002 – 2017 (95% S.E. bars).
8.00
9.00
10.00
11.00
12.00
13.00
14.00
15.00
16.00
17.00
18.00M
ean S
um
mer
Sea T
em
p o
C
Year
Summer mean SST Annual mean SST Linear (Summer mean SST) Linear (Annual mean SST)
9
10
11
12
13
14
15
CT
I S
core
oC
Year
Martin's Haven North Haven South Haven

Page 29 www.naturalresourceswales.gov.uk
6.1.7. Current Status The shores appear to be in a condition typical of the area without any unfavourable changes to the shore communities. There is no evidence of any shift in the community due to climate change, in fact the communities on the MarClim shores appear well matched to the ambient sea surface temperatures. 6.1.8. Recommendations Keep current with the development of CTI as an indicator of Good Environmental Status for reporting on littoral communities under the European Marine Strategy Framework Directive: While CTI has been adopted by the European Environment Agency as an indicator of the status of other European terrestrial species (birds and butterflies), it is not yet in widespread use. Skomer MCZ data could prove valuable in meeting NRW reporting responsibilities as it is shown here to be suitable for CTI calculation.
Page 30 www.naturalresourceswales.gov.uk
Sponge Assemblages (CMS code: RM13/01)
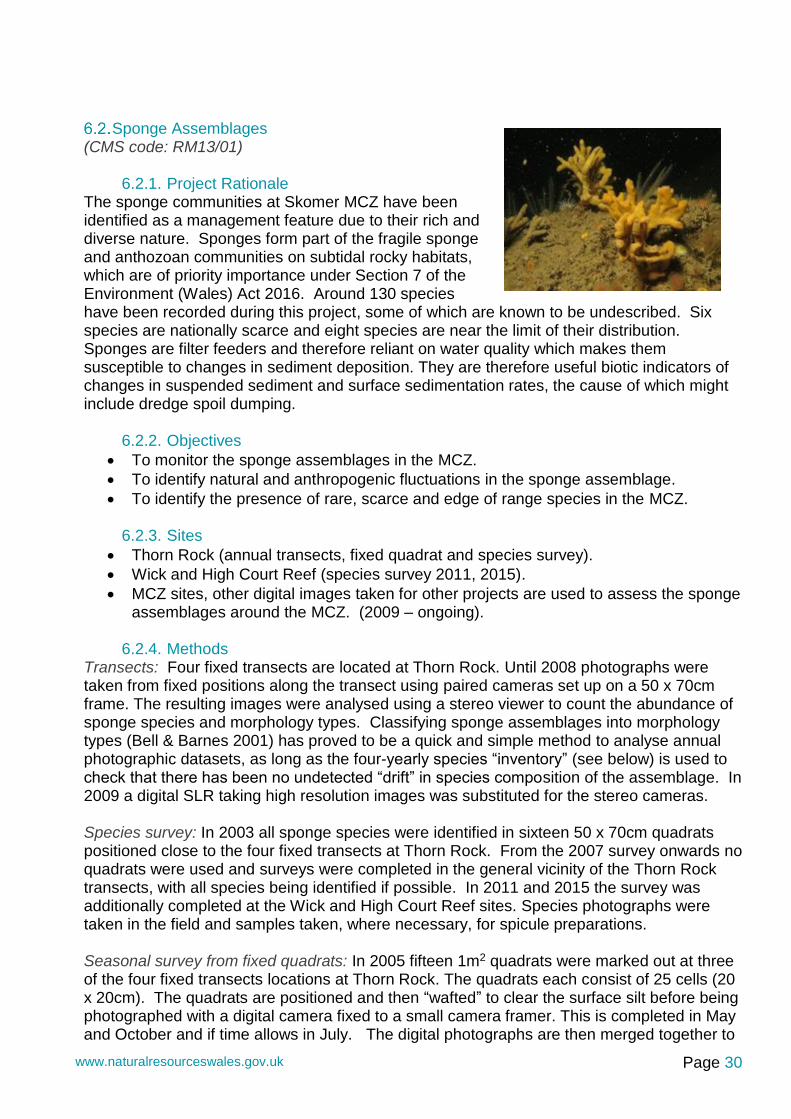
6.2.1. Project Rationale The sponge communities at Skomer MCZ have been identified as a management feature due to their rich and diverse nature. Sponges form part of the fragile sponge and anthozoan communities on subtidal rocky habitats, which are of priority importance under Section 7 of the Environment (Wales) Act 2016. Around 130 species have been recorded during this project, some of which are known to be undescribed. Six species are nationally scarce and eight species are near the limit of their distribution. Sponges are filter feeders and therefore reliant on water quality which makes them susceptible to changes in sediment deposition. They are therefore useful biotic indicators of changes in suspended sediment and surface sedimentation rates, the cause of which might include dredge spoil dumping.
6.2.2. Objectives
• To monitor the sponge assemblages in the MCZ.
• To identify natural and anthropogenic fluctuations in the sponge assemblage.
• To identify the presence of rare, scarce and edge of range species in the MCZ.
6.2.3. Sites
• Thorn Rock (annual transects, fixed quadrat and species survey).
• Wick and High Court Reef (species survey 2011, 2015).
• MCZ sites, other digital images taken for other projects are used to assess the sponge assemblages around the MCZ. (2009 – ongoing).
6.2.4. Methods
Transects: Four fixed transects are located at Thorn Rock. Until 2008 photographs were taken from fixed positions along the transect using paired cameras set up on a 50 x 70cm frame. The resulting images were analysed using a stereo viewer to count the abundance of sponge species and morphology types. Classifying sponge assemblages into morphology types (Bell & Barnes 2001) has proved to be a quick and simple method to analyse annual photographic datasets, as long as the four-yearly species “inventory” (see below) is used to check that there has been no undetected “drift” in species composition of the assemblage. In 2009 a digital SLR taking high resolution images was substituted for the stereo cameras. Species survey: In 2003 all sponge species were identified in sixteen 50 x 70cm quadrats positioned close to the four fixed transects at Thorn Rock. From the 2007 survey onwards no quadrats were used and surveys were completed in the general vicinity of the Thorn Rock transects, with all species being identified if possible. In 2011 and 2015 the survey was additionally completed at the Wick and High Court Reef sites. Species photographs were taken in the field and samples taken, where necessary, for spicule preparations. Seasonal survey from fixed quadrats: In 2005 fifteen 1m2 quadrats were marked out at three of the four fixed transects locations at Thorn Rock. The quadrats each consist of 25 cells (20 x 20cm). The quadrats are positioned and then “wafted” to clear the surface silt before being photographed with a digital camera fixed to a small camera framer. This is completed in May and October and if time allows in July. The digital photographs are then merged together to

Page 31 www.naturalresourceswales.gov.uk
form a mosaic of the full 1m2 quadrats. This data has been stored and supplied to Dr. James Bell, Wellington University, New Zealand for ongoing research and analysis.
6.2.5. Project history
Year No of samples Transects
1993 24 WG
1995 77 WG, SH, BG, DL
1996 72 WG, SH, BG, DL
1997 20 WG
1998 60 WG, SH, DL
2000 63 WG, SH, DL
2001 62 WG, SH, DL
2002 81 WG, SH, BG, DL
2003 79 WG, SH, BG, DL Species survey
2004 80 WG, SH, BG, DL
2005 80 WG, SH, BG, DL
2006 79 WG, SH, BG, DL
2007 81 WG, SH, BG, DL
2008
0 Transects were completed but the image quality was very poor and no
analysis was possible
2009
81 Digital SLR used – not stereo 35mm Results very good – better resolution
than the 35mm system
2010 81 Digital SLR used
2011 81 Digital SLR used Species survey
2012 81 Digital SLR used – lots of sediment on the surfaces
2013 81 Digital SLR – good conditions
2014 81 Digital – Poor visibility
2015 81 Digital SLR – good conditions Species Survey
2016 81 Digital SLR – good conditions
2017 81 Digital SLR – good conditions
Table 6.2.1 Data gathered from Thorn Rock sponge transects 1993 to 2017: (Windy Gully =WG, Spongy Hillocks =SH, Broad Gully =BG, Dogleg = DL)
The 2015 species survey brought the total number of sponge species and entities recorded in the MCZ to 129 (of which 31 have yet to be described or identified to species level). Sponge samples taken during the 2015 species survey were also supplied to Dr Joanne Preston, University of Portsmouth for DNA research. This is ongoing work and the results will contribute towards the National Gen-bank. Samples have also been supplied to the Natural History Museum, London, to be stored as part of the national sponge collection. Boring sponge (Cliona celata) samples were collected in 2015 and sent to Dr Joanne Preston, University of Portsmouth. Samples were taken of healthy, fouled and diseased (so-called “Black Death”) sponges for microbial community profiling.
6.2.6. Results Species surveys: Next species survey planned for 2019.

Page 32 www.naturalresourceswales.gov.uk
Transects: Sponge Morphology Analysis This method has been used for all the quadrats taken at Thorn Rock and for a series of sites around the MCZ where comparable quadrat photos are taken. The data can then be graphed or analysed using the Primer multivariate analysis software to compare similarity between sites.
Figure 6.2.1 Mean number of sponges counted in each quadrat at 4 sites –Thorn Rock 1993-2017
Improvement in image quality and resolution has meant that more sponge entities have been recorded from 2009 onwards than in previous years. However in 2012 and 2014 there was a noticeable drop in the numbers of sponges across all transects. In 2013 and 2015 all transects showed an increase in abundance of visible sponges and this increase continued in 2017, except at the BLK – P8 transect. This variability will in part be due to the image quality. “Wafting” the surface sediment away would improve consistency but does compromise the comparability of the whole time series. The morphology method for characterising sponge assemblages has also been applied to suitable monitoring photographs taken from a range of sites around Skomer MCZ. This puts the Thorn Rock transects into context. The morphology data is entered into the Primer V6 statistics package, averaged to site and year, and a similarity matrix produced using the Bray-Curtis similarity coefficient on the square root transformed data.
0.0
10.0
20.0
30.0
40.0
50.0
60.0
70.0
80.0
90.0
MEA
N N
UM
BER
OF
SPO
NG
ES IN
50
X 7
0C
M Q
UA
DR
AT
YEAR
TOTAL
WG
PE2-P8
BL-P8
BG

Page 33 www.naturalresourceswales.gov.uk
Figure 6.2.2 PRIMER Multi-dimensional scaling (MDS) plot of sponge morphology data averaged to site and year 1995 – 2017.
The sites in Figure 6.2.2 with a solid colour fill are the TRK transects, the rest of the sites are spread around the MCZ (see section 5 map). In all years, the TRK transects separate out from the rest of the MCZ. To test if this separation is significant the data was labelled with “TRK” or “MCZ” and a factor “Area” given to all sites (Figure 6.2.3).
Figure 6.2.3 PRIMER Multi-dimensional scaling (MDS) plot of sponge morphology data labelled with “TRK” or “MCZ” and a factor “Area” given to all sites.
Transform: Square root
Resemblance: S17 Bray Curtis similarity
siteWG
p2
blk
p7
smdh
waynew
wayD
ssfg
Whk
RRK
BRK
wckA
wckB
BRKD
p3
WayTx
NWE
Similarity60
2012
2012
2012
2012
2010
2010
2010
2010
2010
2010
20102009
2009
2009
2009
2009
2009
2009
2009
2009
2011
2011
2011
2011
2011
2011
2011
2011
2009
2009
2009
2009
1995
1995
1995
1995
1995
1996
1996
1996
1996
1997
1998
19981998
2000
2000
2000
2001
20012001
1993
1993
2002
2002
2002
2002
2003
2003
2003
2003
2004
2004
2004
2004
2005
2005
2005
2005
2006
2006
2006
2006
2007
2007
2007
2007
2010
2010
2010
2010
2011
2011
2011
2011
2013
20132013
2013
2012
2012
2012
2012
2012
2012
2012
2013
2013
2013
2013
2013
2013
2013
2014
2014 2014
20142014
2014
2014
2014
20142014
2014
2015
2015
2015
2015
2015
20152015
2015
2015
2015
2015
2016
2016
2016
2016
2016
2016
2016
2016
2016
2016
2016
2017
2017
2017
2017
2017
2017
2017
2017
2017
2017
2017
2D Stress: 0.09
Transform: Square root
Resemblance: S17 Bray Curtis similarity
AreaTRK
MCZ
Similarity40
2012
2012
2012
2012
2010
2010
2010
2010
2010
2010
20102009
2009
2009
2009
2009
2009
2009
2009
2009
2011
2011
2011
2011
2011
2011
2011
2011
2009
2009
2009
2009
1995
1995
1995
1995
1995
1996
1996
1996
1996
1997
1998
1998
1998
2000
2000
2000
2001
20012001
1993
1993
2002
2002
2002
2002
2003
2003
2003
2003
2004
2004
2004
2004
2005
2005
2005
2005
2006
2006
2006
2006
2007
2007
2007
2007
2010
2010
2010
2010
2011
2011
2011
2011
2013
20132013
2013
2012
2012
2012
2012
2012
2012
2012
2013
2013
2013
2013
2013
2013
2013
2014
2014 2014
2014
20142014
2014
2014
20142014
2014
2015
2015
2015
2015
2015
20152015
2015
2015
2015
2015
2016
2016
2016
2016
2016
2016
2016
2016
2016
2016
2016
2017
2017
2017
2017
2017
2017
2017
2017
2017
2017
2017
2D Stress: 0.09

Page 34 www.naturalresourceswales.gov.uk
A 2 way ANOSIM test was applied to the Bray-Curtis similarity matrix Testing for differences between area & year. TESTS FOR DIFFERENCES BETWEEN year GROUPS
(across all Area groups)
Global Test
Sample statistic (Global R): 0.062 low
Significance level of sample statistic: 1.6% (with an R value so low this cannot
be considered significant)
TESTS FOR DIFFERENCES BETWEEN Area GROUPS
(across all year groups)
Global Test
Sample statistic (Global R): 0.89 high
Significance level of sample statistic: 0.001%
These results suggest that there is very little difference between the years but that there is a very significant difference between the TRK quadrats and quadrats from the rest of the MCZ. A SIMPER analysis describes what these differences are: Groups TRK & MCZ
Average dissimilarity = 47.94
Group TRK Group MCZ
Species Av.Abund Av.Abund Av.Diss Diss/SD Contrib% Cum.%
AR/TU 3.73 0.54 9.75 2.73 20.35 20.35
AR 3.70 0.52 9.71 2.69 20.26 40.60
total number 5.39 3.48 6.18 1.63 12.89 53.49
EN 1.98 2.91 5.68 1.57 11.84 65.33
PA 1.34 0.04 4.09 1.94 8.54 73.87
PE 1.21 0.05 3.65 1.53 7.62 81.49
MA 1.82 1.51 2.64 1.31 5.51 87.00
In summary: Arborescent and tubular sponges are much more abundant at TRK. Total number of sponges (all groups) is higher at TRK. Encrusting sponges are more abundant in the rest of the MCZ. Papillate and pedunculate are more abundant at TRK. The TRK sponge assemblage is much more diverse in its morphology types and has a higher number of sponges. The number of sponges at TRK do seem to vary a lot between years. The TRK quadrats were separated out from the other quadrats and an ANOSIM test conducted to test for differences between years just on the TRK quadrats. Global Test
Sample statistic (Global R): 0.019
Significance level of sample statistic: 32.4%
There was no detectable difference in the sponges assemblage at TRK between the years.
6.2.7. Current status The species surveys show that Skomer has a very biodiverse range of sponge species, one of the highest in the UK. The sponge assemblage at TRK is a “hot spot” for sponges within the MCZ. The community at TRK is quite dynamic in terms of total number of sponges visible but the overall community structure appears stable.
Page 35 www.naturalresourceswales.gov.uk
6.2.8. Recommendations
• Continue application of morphology method for analysis of photos.
• Expand transect photo-monitoring programme to other sites in the MCZ with good diversity of sponge species.
• Expand transect photo-monitoring programme to sites outside the MCZ to provide contextual data for changes in populations seen at Skomer MCZ and thereby improve knowledge of the diversity of sponge assemblages.
• Seasonality patterns need further investigation as seasonal changes in the sponge assemblages have been found. Winter data is needed as samples have only been collected from April to October. Encourage continued research on sponge seasonality in the MCZ.
• Continue sponge species recording every 4 years, next survey due 2019.
• Continue support of sponge research carried out by academic bodies.
• Produce publications in the peer-reviewed scientific literature.

Page 36 www.naturalresourceswales.gov.uk
Territorial Fish (CMS code: RA33/01)
6.3.1. Project Rationale
Territorial fish have received little attention and are poorly described in the survey literature. There is a need to improve knowledge of the diversity and distribution of territorial fish species. They have the potential to be affected by recreational angling, by-catch in commercial potting and as a targeted species collected for the use as cleaner fish in aquaculture, (Bullimore et al 1999, Tallaksen et el 2017).
6.3.2. Objectives To assess the distribution and abundance of territorial fish species and to describe their key habitats. Nine territorial fish species were selected based on common occurrence in the MCZ. Wrasse species: Ballan wrasse, Labrus bergylta Cuckoo wrasse, Labrus mixtus Goldsinny wrasse, Ctenolabrus rupestris Corkwing wrasse, Ctenolabrus melops Rock cook wrasse, Centrolabrus exoletus Benthic species: Butterfish, Pholis gunnellus Tompot blenny, Parablennius gattorugine Sea Scorpion (short spine and long spine), Myoxocephalus scorpius / Taurulus bubalis Leopard spotted goby, Thorogobius ephippiatus.

Page 37 www.naturalresourceswales.gov.uk
6.3.3. Sites
Figure 6.3.1 Territorial fish survey sites 2001 – 2017
Survey sites are grouped into 2 main areas. Skomer Island (SK): Rye Rocks (RRK)
North Wall (NWA) Pool (POL) Bernies Rocks (BRK)
North Marloes Peninsula (NMPE): Wooltack Bay (WTB) Martins Haven (MHV) Low and High Point (LHPT) East Hook (EHK)
At each of these survey stations there are 2 or 3 replicate stations within 200m of the survey sites to allow divers to complete the transects at the same time without overlapping or interfering with each other.
6.3.4. Methods The methods have been designed for use with volunteer divers and are fully described in Lock (1998a) and Lock et al (2006a). In 2005 methods were modified to allow improved statistical analysis (Lock et al 2006b). The changes allowed some comparison with the 2001 and 2002 surveys. The study sites were marked and GPS positions taken, allowing for replicate transects to be completed and relocation of sites for future surveys. Two depth zones are surveyed: 15m and 10m below chart datum. 1. Dive pair secure a weight to the base of the site marker and swim together on a depth
contour of 15m (+/-2m) laying out the tape. The first 5m are used to obtain control in orientation and buoyancy. Fish counts are completed in a 2m corridor, 1m either side

Page 38 www.naturalresourceswales.gov.uk
of the tape. Within the 2m corridor one diver counts the wrasse and the other diver counts the benthic species. Diver pair maintain a swimming speed of 3m min-1. Use fish identification sheets to assist species identification.
2. On completion of the 45m transect rewind the tape slowly and record the transect
depth, direction (e.g. east of west transect) and a description of the seabed substrate and habitat.
3. From the site marker ascend upslope 5m, secure the weight (in a crevice or around a
boulder) and repeat the method for a second transect.
The revised methods are fully described in Lock et al. 2006 a., these were followed in 2009, 2013 & 2017.
6.3.5. Project History 2001: First Volunteer diver survey. 110 Transects from 6 sites. Very poor visibility resulted in very few fish being recorded. 2002: Repeat survey of the 2001 sites in better visibility. 110 Transects from 6 sites. 2005: Volunteer diver survey. Increased number of sites to 8, transect length increased from 25m to 45m. Methods described in Lock et al 2006 a. 113 transects completed. 2007: Drop down video. N. Sweet, Plymouth University. See section 6.3.8 2009: Volunteer diver survey. Repeat of 2005 survey using the same methodologies. 89 Transects completed. 2009: Video survey. R Bullimore, Plymouth University. See section 5.3.8 2013: Volunteer diver survey. 128 transects completed using the methodologies as in Lock et al 2006 a.

Page 39 www.naturalresourceswales.gov.uk
6.3.6. Results
2017 Distribution of territorial fish species
Figure 6.3.2 Abundance of fish (N / 90m2) 2017.
Table 6.3.1 Average abundance of fish species / 90m2 with Species richness (S) & Total Numbers of fish (N) found at each site 2017.
One notable record from the 2017 survey was a Grey triggerfish Balistes capriscus at the North wall survey site. This has not been included in the statistical analysis. Triggerfish are an annual visitor to Pembrokeshire but not often recorded at Skomer.
Ballan Wrasse Cuckoo Wrasse Goldsinny Corkwing Wrasse Rock Cook Leopard Sp. Goby Tompot Blenny Butterfish Scorpion fish S N
BRK 2.3 4.6 11.4 2.1 2.5 2.3 0.6 0.1 0.0 4.5 25.9
EHK 2.7 0.4 3.4 0.8 3.2 1.0 0.2 0.0 0.1 3.1 11.7
LHPT 3.2 0.1 1.4 0.7 1.3 1.3 0.2 0.0 0.2 3.2 8.6
MHV 2.9 1.1 1.3 0.6 0.3 1.5 1.0 0.0 0.0 3.1 8.6
NWA 5.3 1.4 7.7 0.7 2.2 2.0 0.2 0.0 0.1 4.3 19.5
POL 3.4 3.3 5.8 0.7 0.6 2.0 0.8 0.7 0.4 5.0 17.7
RRK 4.9 1.8 4.5 0.4 2.4 1.2 0.5 0.0 0.0 4.3 15.6
WTB 3.3 0.1 0.1 0.0 0.0 0.4 0.5 0.0 0.1 2.0 4.5

Page 40
Figure 6.3.3 Bubble plots of average abundance (90m2) for: a. Goldsinny wrasse, b. Ballan wrasse, c. Cuckoo wrasse, d. Rockcook wrasse
a. b.
c. d.

Page 41
Figure 6.3.3 (Continued) Bubble plots of average abundance (90m2) for: e. Corkwing wrasse, f. All wrasse species (summed),
e. f.

Page 42
Figure 6.3.3 (Continued) Bubble plots of average abundance (90m2) for: g. Butterfish, h. Leopard spot goby, i. Tompot blenny, j. Benthic species (summed).
g. h.
i. j.

Page 43 www.naturalresourceswales.gov.uk
Inter year comparison 2002 – 2017. The 2001 data is comparable to the other years, but due to the very poor survey conditions the 2002 repeat survey has been used in its place for most of the inter year analysis. The community structure of the territorial fish assemblage was tested using the Primer V6 statistical package. The data was averaged to site and year and a resemblance matrix constructed using the Bray -Curtis similarity coefficient.
Figure 6.3.4 MDS plot of Territorial fish communities averaged to site & Year 2002 – 2017. Labelled with Area.
The plot suggests a clear distinction between the NMPE area and the SK area. This was tested with a 1 way ANOSIM test: Global Test
Sample statistic (Global R): 0.359
Significance level of sample statistic: 0.1%
Although the R value is small it is still significant implying that there is a difference in the community structure of the fish assemblages between the 2 areas. A SIMPER analysis was used to describe what the differences were and which species were contributing most to the differences. Simper between areas – untransformed data (averaged across years 2002 – 2017). Examines Area groups (across all year groups) Group SK – What defines the community at SK Average similarity: 65.55 Species Av.Abund Av.Sim Sim/SD Contrib% Cum.% Goldsinny wrasse 4.36 19.31 2.45 29.46 29.46 Ballan wrasse 3.37 16.92 2.72 25.82 55.28 Cuckoo wrasse 2.26 10.95 1.88 16.70 71.98 Leopard sp. goby 1.90 8.98 2.20 13.71 85.69 Rock Cook wrasse 1.44 4.91 1.48 7.49 93.17
Transform: Square root
Resemblance: S17 Bray Curtis similarity
AreaSK
NMPE
POL2017
NWA2017
RRK2017
LHPT2017 EHK2017
MHV2017
WTB2017
BRK2017
POL2009
NWA2009
RRK2009
LHPT2009
EHK2009
NWA2002POL2002
MHV2002
LHPT2002
POL2005
NWA2005
RRK2005
MHV2005
LHPT2005
EHK2005 POL2013
NWA2013
RRK2013
LHPT2013
EHK2013
MHV2013
2D Stress: 0.18

Page 44 www.naturalresourceswales.gov.uk
Group NMPE – what defines the community at NMPE Average similarity: 62.63 Species Av.Abund Av.Sim Sim/SD Contrib% Cum.% Ballan wrasse 2.32 22.39 1.88 35.75 35.75 Leopard sp. goby 1.26 13.90 3.04 22.19 57.94 Goldsinny wrasse 1.72 13.77 1.40 21.99 79.94 Corkwing wrasse 0.48 3.36 1.36 5.37 85.31 Rock Cook wrasse 0.63 3.01 0.90 4.80 90.10 Groups SK & NMPE – What are the differences between the 2 areas Average dissimilarity = 45.19
Group SK Group NMPE Species Av.Abund Av.Abund Av.Diss Diss/SD Contrib% Cum.% Goldsinny wrasse 4.36 1.72 12.54 1.45 27.74 27.74 Cuckoo wrasse 2.26 0.35 8.85 1.76 19.58 47.32 Ballan wrasse 3.37 2.32 7.70 1.37 17.05 64.36 Rock Cook 1.44 0.63 5.22 1.12 11.56 75.92 Leopard Sp. goby 1.90 1.26 4.42 1.08 9.77 85.69 Corkwing wrasse 0.87 0.48 3.02 1.01 6.67 92.36
The highlighted area shows that over 75% of the difference between the SK and NMPE populations is due to wrasse species abundance. Wrasse are always found in higher abundance in the SK area. 2017 Differences between areas (Skomer & North Marloes Peninsula). Transects were averaged to area for the 2017 survey and the abundances of each species, the species richness (S) and the overall abundance of all fish (N) were compared.
Figure 6.3.5 Species abundances, Species richness (S) & Overall abundance (N) for 2017 data averaged to area with 95%S.E. bars.
Cuckoo wrasse and Goldsinny wrasse had significantly higher abundances in the Skomer area. There were also significant differences in Species Richness (S) <1% and overall abundance (N) <1%. Both are higher in the Skomer area.
0
5
10
15
20
25
BallanWrasse
CuckooWrasse
Goldsinny CorkwingWrasse
Rock Cook LeopardSp. Goby
TompotBlenny
Butterfish Scorpionfish
S N
NMPE SK

Page 45 www.naturalresourceswales.gov.uk
Species richness (S) 2002 – 2017 Because only certain species are recorded in the methodology used there is an artificial limit to species richness. Species richness can be compared between areas and depth zones. Raw transect data was used to calculate species richness and then values averaged to area and depth zone. 2002 methods used different depth zones so only the area averages can be compared. In 2002 a smaller transect area (60m2) was used so 2002 results are not directly comparable to the other years.
Figure 6.3.6 Species richness (S) 2002 – 2017 between Area (top graph) & Depth zone (lower graph) with 95% S.E. bars.
0
1
2
3
4
5
6
2002 2005 2009 2013 2017
S
Area
NMPE SK

Page 46 www.naturalresourceswales.gov.uk
Species richness is higher in the Skomer area for all years except 2002 and 2013. Within the separate areas there are no significant differences between the transects at 10m and 15m depths for any of the years. Between the areas, SK 15m is significantly higher than NMPE 10m and NMPE 15m when compared year by year except for 2013. Overall abundance of fish (N). Overall abundance of individuals (N) was calculated by summing the counts of all fish species. These were averaged to area by year and area / depth zone by year. 2002 data was converted to fish / 90m2.
Figure 6.3.7 Overall fish abundance (N / 90m2) for each year by area (top graph) and by area / depth zone (lower graph) with 95% S.E. bars.
The Skomer area has significantly higher numbers of fish compared to NMPE for all years except 2002.
0
5
10
15
20
25
2002 2005 2009 2013 2017
N
Year
NMPE
Skomer
0
5
10
15
20
25
30
2005 2009 2013 2017
N
Year
NMPE 10M
NMPE 15M
SK 10M
SK 15M

Page 47 www.naturalresourceswales.gov.uk
Skomer 15m depth zone always has the highest numbers of fish, with significantly more fish than NMPE 10m and NMPE 15m in all years except 2013 Summary of results The 2 areas (Skomer and North Marloes Peninsula) do have different communities of territorial fish. The differences between the two areas are mainly down to the abundance of wrasse species, especially in the 15m depth zone at Skomer. Here the surveys have consistently found the higher numbers of fish compared to the North Marloes Peninsula.
6.3.7. Discussion. Over the history of this project all the volunteer diver surveys and drop down video surveys have found a difference in the abundance and community structure of territorial fish between the mainland sites (NMPE) and the island sites (Skomer). Comparison between the two areas shows a number of similarities and differences:
• Habitat: rocky cliffs and boulder slopes occur in both areas;
• Depth: the surveys were mainly conducted at 10m and 15m BCD, however, beyond the transects where data was recorded the Skomer sites continue down to 40m whereas the NMPE sites flattens out to a sediment seabed at 18-20m BCD;
• Current: the current regime is not the same although both areas do get regular current flow across them. The Skomer sites experience stronger tidal flows over a longer period of the tidal cycle;
• Recreational diver pressure: both areas are regularly visited from May to September by divers;
• Commercial fishing: fishing effort in both areas is comparable in effort and gear type (potting);
• Angling: there is a difference in the amount of recreational angling between the two areas (see figures 6.3.8 and 6.3.9). The north Marloes coastline is very popular area for line fishing from the shore and from boats, however the number of anglers has been decreasing over the last 6 years (see figure 6.3.8). The main target species is mackerel (Scomber scombrus) but it also popular for Spurdog (Squalus acanthias). Wrasse species are not specifically targeted except in species angling competitions. Recreational angling around the Skomer Island coast (as opposed to the mainland coast) was very infrequent but has increased since the first fish survey in 2002 with commercial operators using the area more often since 2013 (fig 6.3.9). The actual level of anglers recorded at the survey sites is quite variable (see fig 6.3.8). There is always less angling recorded at the Skomer sites.
Figure 6.3.8 Number of recreational anglers / day at the fish survey sites 1994 – 2017
0.00
1.00
2.00
3.00
4.00
5.00
6.00
7.00
8.00
Angle
rs /
day
Year
NMPE SK

Page 48 www.naturalresourceswales.gov.uk
Figure 6.3.9 Distribution of recreational angling (angler sightings /day) recorded within Skomer MCZ; a. 2002, b. 2005, c. 2009, d. 2013 & e. 2017
In 2002 the majority of the recorded angling activity (as counted during fieldwork and on routine weekend boat patrols – see Newman et al. 2018) was off the north Marloes peninsula, but by 2017 the effort has spread around the north and south coasts of Skomer as well as the Marloes peninsula.
a - 2002 b - 2005
c - 2009 d - 2013
e - 2017

Page 49 www.naturalresourceswales.gov.uk
Without a detailed scientific study with a control area (i.e. an area with no fishing or other disturbing activities, but with an identical habitat and other environmental factors) it is hard to allocate a reason for the difference in fish species & abundance. The fact that the deeper area (15m) at Skomer is the area where these differences are greatest suggests that it may be the habitat differences that are causing the overall trends. There is a lot more rocky reef fish habitat extending below the Skomer sites. The NMPE sites turn into flat sediment which would not be suitable habitat for most of the fish species studied in this survey especially the wrasse species.
6.3.8. Current Status The numbers of fish recorded during the diving surveys are too variable to draw conclusions on any trends in the abundance of territorial fish over the years. There is, however, a consistent difference between the island and the mainland sites, with more fish being visible at the Skomer sites compared to the NMPE sites in all the surveys. This is supported by the findings of two non-NRW student projects carried out in 2007 and 2009 (see Appendix 4). Without control sites it is difficult to be certain as to the reason for this difference, but both the extended depth of suitable fish habitat at the island sites and the greater pressure from recreational angling at the mainland sites are possible contributory factors.
6.3.9. Recommendations
• Encourage student projects in the use of video cameras to study fish communities in different habitats around the Skomer MCZ.
• Encourage further research on the impacts of recreational angling, commercial fishing of cleaner wrasse species, wrasse by-catch in lobster pots and ‘ghost pots’.
• Maintain literature under review.

Page 50 www.naturalresourceswales.gov.uk
Plankton Recording (CMS Code RB04/01)
6.4.1. Project Rationale Whereas plankton is not identified as a management feature for Skomer MCZ its importance as a vital ecological component of the marine ecosystem makes it a major factor influencing all other MCZ features. Plankton provides primary production to drive the whole system and many feature species have planktonic larval stages. The abundance and species composition of plankton are influenced by available nutrients, water movement, temperature and light.
6.4.2. Objectives To collect seasonal abundance and species diversity data for zooplankton and phytoplankton.
6.4.3. Sites
• North coast Skomer between OMS site buoy and the Lucy buoy (2008 & 2009)
• North of the Lucy buoy (2010- ongoing)
6.4.4. Method Zooplankton: 2008 &2009: A plankton sample was collected once a week using a 63um mesh plankton net trawled at less than 2 knots between the OMS and Lucy site markers. Samples were preserved in 2% formalin and seawater. 2010 onwards: A review of the results and objectives called for a change in methods. It was proposed that the sampling from Skomer matched that from other plankton time series projects to make the results comparable. The Plymouth Marine Laboratory (PML) has a plankton sample time series (L4), which would act as a good comparison site. The methods used at L4 are replicated at Skomer and analysis completed by PML. PML method adopted: A 200um mesh net is pulled on a vertical haul from 35- 40m depth at 0.2m / second. The sample is collected in the ‘cod-end’ bottle and this is preserved in 4% formalin. Two samples are taken at each sampling event.
Phytoplankton and chlorophyll: 2011- 2012: A water sample was taken and preserved in Lugol’s solution to provide a record of the phytoplankton species present. This can be used to identify species responsible for “blooms”. A second water sample was also taken at 1m below the surface. This was then used to filter three 250ml samples over a 0.2um filter to estimate chlorophyll content. The chlorophyll samples are analysed by PML. The phytoplankton samples in Lugol’s solution are stored as a record of any plankton bloom. 2013 onwards – discontinued due to lack of analysis.
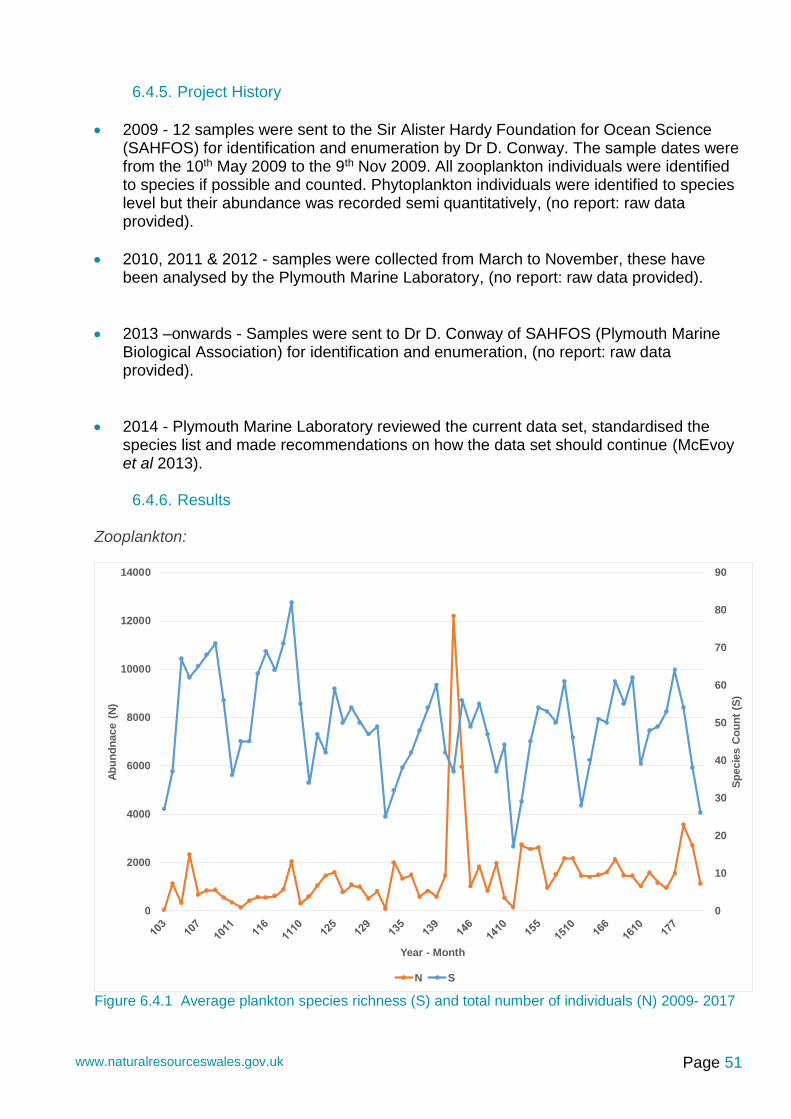
Page 51 www.naturalresourceswales.gov.uk
6.4.5. Project History
• 2009 - 12 samples were sent to the Sir Alister Hardy Foundation for Ocean Science (SAHFOS) for identification and enumeration by Dr D. Conway. The sample dates were from the 10th May 2009 to the 9th Nov 2009. All zooplankton individuals were identified to species if possible and counted. Phytoplankton individuals were identified to species level but their abundance was recorded semi quantitatively, (no report: raw data provided).
• 2010, 2011 & 2012 - samples were collected from March to November, these have been analysed by the Plymouth Marine Laboratory, (no report: raw data provided).
• 2013 –onwards - Samples were sent to Dr D. Conway of SAHFOS (Plymouth Marine Biological Association) for identification and enumeration, (no report: raw data provided).
• 2014 - Plymouth Marine Laboratory reviewed the current data set, standardised the species list and made recommendations on how the data set should continue (McEvoy et al 2013).
6.4.6. Results
Zooplankton:
Figure 6.4.1 Average plankton species richness (S) and total number of individuals (N) 2009- 2017
0
10
20
30
40
50
60
70
80
90
0
2000
4000
6000
8000
10000
12000
14000
Sp
ecie
s C
ou
nt
(S)
Ab
un
dn
ace (
N)
Year - Month
N S

Page 52 www.naturalresourceswales.gov.uk
All zooplankton data is held on file at the Skomer MCZ office in spreadsheet format and as Primer files. This allows for a wide range of data analysis: Individual species can be selected, differences between years can be analysed or the whole data set can be combined to look for seasonal trends.
Figure 6.4.2 PRIMER MDS Plot of the whole Skomer MCZ zooplankton data set – symbols denote month, figures denote year.
Statistical analysis of the differences between datasets shows a strong seasonal pattern with months grouping together. However, these groups are in lines which does suggest inter-annual variability. 2017 points appear very close to 2015/16. There were some notable species recorded in the 2017 samples: Scyllarus arctus, European Locust lobster (or Slipper lobster): this is a new record for the MCZ recorded on the 16th July 2017. It is an unusual species to find in the UK. It is related to the crawfish (Palinurus elephas) and rarely occurs in plankton samples.
Figure 6.4.3 Image of plankton larvae of Scyllarus arctus (D. Conway) found on the 16/07/2017 and an image of the adult in an aquarium.
Resemblance: S17 Bray Curtis similarity
month3
4
5
6
7
8
9
10
11
10
10
10
10
10
10
1010
10
11
11
11 1111
11
11
11
11
12
12
12
12
1212
12
12
12
13
13
13
13
1313
13
14
14
14
14 14
14
14
14
15
15
15 15
15
15
15
15
1616
16
16 16
16
16
17
17
17
17
17
17
17
2D Stress: 0.14

Page 53 www.naturalresourceswales.gov.uk
Facetotectan larva, another new record for the MCZ on the 7th Oct 2017. This is a rarely recorded group (possibly due to under recording), and are often misidentified. The adult stage is unknown and is possibly an internal parasite. The species found in the UK so far have not been classified and need describing, and it is possible they are new to science.
Figure 6.4.4 Facetotectan larva (D. Conway)
Rissoides desmaresti (Mantis Shrimp). This is the third record for the MCZ, found on the 16/07/2017 in the same sample as the Scyllarus arctus. Previous records have been in 2014 & 2015 both in August. The adult has not been recorded in the MCZ but there are several records in Cardigan bay and Lundy Island.
Figure 6.4.5 Rissoides desmaresti larvae (D. Conway) and adult (R. Holt).
6.4.7. Current Status The status of the plankton at Skomer MCZ is unknown. Further data is required to estimate natural variability.
6.4.8. Recommendations
• Continue to collect further seasonal data for zooplankton, to assess its variability.
• Restart the water sampling for chlorophyll not only to help monitor primary productivity in the plankton, but also to enable turbidity due to phytoplankton to be factored into the interpretation of overall seawater turbidity data (see Section 6.3).
• Compare data sets to Plymouth Marine Laboratory L4 site to help ascertain natural variability and give geographic context.
• Publish a descriptive paper with Plymouth Marine Laboratory.

Page 54 www.naturalresourceswales.gov.uk
Eunicella Verrucosa: Population and Growth Rate (CMS Code: RM23/01)
6.5.1. Project Rationale
The pink sea fan Eunicella verrucosa (Pallas) is a component of the Lusitanian anthozoan management feature of the Skomer MCZ. It is a UK Biodiversity Action Plan Species, is on Schedule 5 of the Wildlife and Countryside Act 1981 and is a species of principal importance under Section 7 of the Environment Act (Wales) 2016. It is also a component of the fragile sponge and anthozoan community habitat of priority importance under Section 7. E. verrucosa is a soft coral nearing the northern limit of its distribution in North Pembrokeshire. Sea fans are a slow growing, erect species susceptible to permanent damage. Recovery and reproduction rates are thought to be very slow.
6.5.2. Objectives To monitor numbers and condition of the recorded pink sea fans in Skomer MCZ and to expand the monitored population.
6.5.3. Sites Date started North Wall stereo (1987) Bernie’s Rocks (East and West) (1994) Bull Hole (2002) The Pool (1997) North Wall East (2000) Sandy Sea Fan Gully (1994) Thorn Rock (2002) Way Bench (1994) Rye Rocks (2002) South Middleholm (2002) West Hook (2005)
6.5.4. Methods
• Individual pink sea fan colonies are mapped out at each site. The maps are used to navigate to each fan and are expanded when additional mature fans are found in the area. Care is taken to search the area for small, newly established fans which are counted as ‘new recruits’.
• Photographs are taken using a single camera mounted on a 50 x 70 cm frame. Both sides of the sea fan are photographed.
• Each sea fan is visually inspected for damage, fouling by epibiota, entanglement with man-made materials, necrosis (loss of living tissue) and the nudibranch Tritonia nilsodhneri and mollusc Simnia patula.
• Where practicable detached sea fans that are found in the Skomer MCZ are re-attached artificially to the rock substrate at one of the monitoring sites if enough polyps remain alive on the colony for it to recover. These fans are then added to the monitoring programme.
• The photographs are analysed using image analysis techniques.
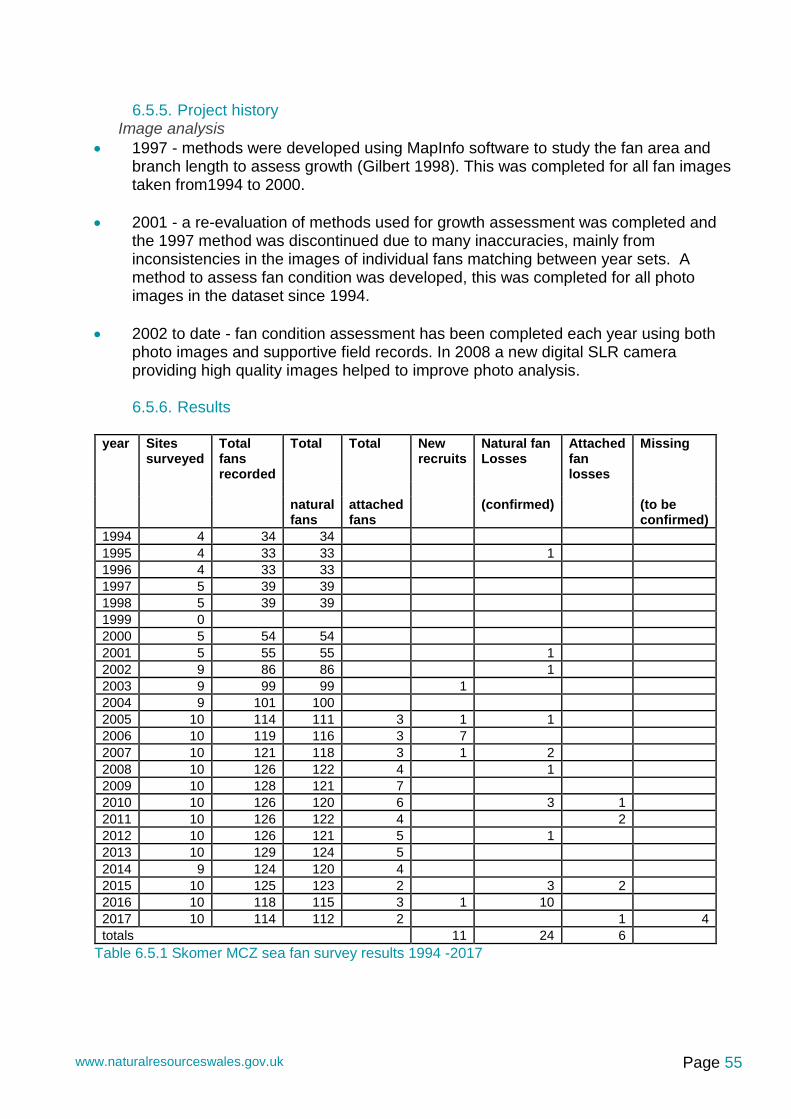
Page 55 www.naturalresourceswales.gov.uk
6.5.5. Project history
Image analysis
• 1997 - methods were developed using MapInfo software to study the fan area and branch length to assess growth (Gilbert 1998). This was completed for all fan images taken from1994 to 2000.
• 2001 - a re-evaluation of methods used for growth assessment was completed and the 1997 method was discontinued due to many inaccuracies, mainly from inconsistencies in the images of individual fans matching between year sets. A method to assess fan condition was developed, this was completed for all photo images in the dataset since 1994.
• 2002 to date - fan condition assessment has been completed each year using both photo images and supportive field records. In 2008 a new digital SLR camera providing high quality images helped to improve photo analysis.
6.5.6. Results
year Sites surveyed
Total fans recorded
Total Total New recruits
Natural fan Losses
Attached fan losses
Missing
natural
fans attached fans
(confirmed) (to be
confirmed)
1994 4 34 34
1995 4 33 33 1
1996 4 33 33
1997 5 39 39
1998 5 39 39
1999 0
2000 5 54 54
2001 5 55 55 1
2002 9 86 86 1
2003 9 99 99 1
2004 9 101 100
2005 10 114 111 3 1 1
2006 10 119 116 3 7
2007 10 121 118 3 1 2
2008 10 126 122 4 1
2009 10 128 121 7
2010 10 126 120 6 3 1
2011 10 126 122 4 2
2012 10 126 121 5 1
2013 10 129 124 5
2014 9 124 120 4
2015 10 125 123 2 3 2
2016 10 118 115 3 1 10
2017 10 114 112 2 1 4
totals 11 24 6
Table 6.5.1 Skomer MCZ sea fan survey results 1994 -2017

Page 56 www.naturalresourceswales.gov.uk
Losses A total of 24 losses of natural sea fans and 6 of artificially attached fans have been recorded throughout the period of this project.
Four additional fans were absent in 2017, BH25, BRKw2, RRK14, MDS5, these will be checked again and their status confirmed in 2018. POL4 was also recorded absent, this sea fan was a natural fan that was found broken off in 2011 and then subsequently re-attached with a ring bolt and cable tie. It was a large sea fan and it continued to thrive until last seen in 2016, as seen below. Because the ringbolt used to reattach this fan was relocated and still in position its loss can be confirmed straight away.
Figure 6.5.1 Pink sea fan, Eunicella verrucosa POL4 attached to ring bolt 2011-2016.
In 2016, 10 sea fans were reported missing, which was unusually high. Five of these, all from Bull Hole were found in 2016 reduced to small stumps or just their bases. A further five fans recorded as missing in 2016 were BH16, BRKw8, NWA11, TRK1 and TRK4. All 10 were confirmed as losses in 2017. Human activity at Skomer MCZ is recorded by staff during all fieldwork days and during weekend liaison patrols (see Appendix 3 for methodology). The results are reported in detail in the Skomer MCZ Annual Report each year (Newman, et al. 2018). This data includes details of recreational vessels anchoring or mooring in the MCZ, divers using the site, recreational angling from boat or shore and commercial fishing activity – in other words all activities with the potential to make contact with the seabed or sea fans. From this data it is possible to extract site specific activity profiles, including the sites where sea fans are monitored. In an attempt to understand potential causes behind the loss of sea fans the data for 2016 has been analysed in more detail (Fig 6.5.2). 2016 is of particular interest, not only because of the unusually high numbers of fans lost, but also because monitoring
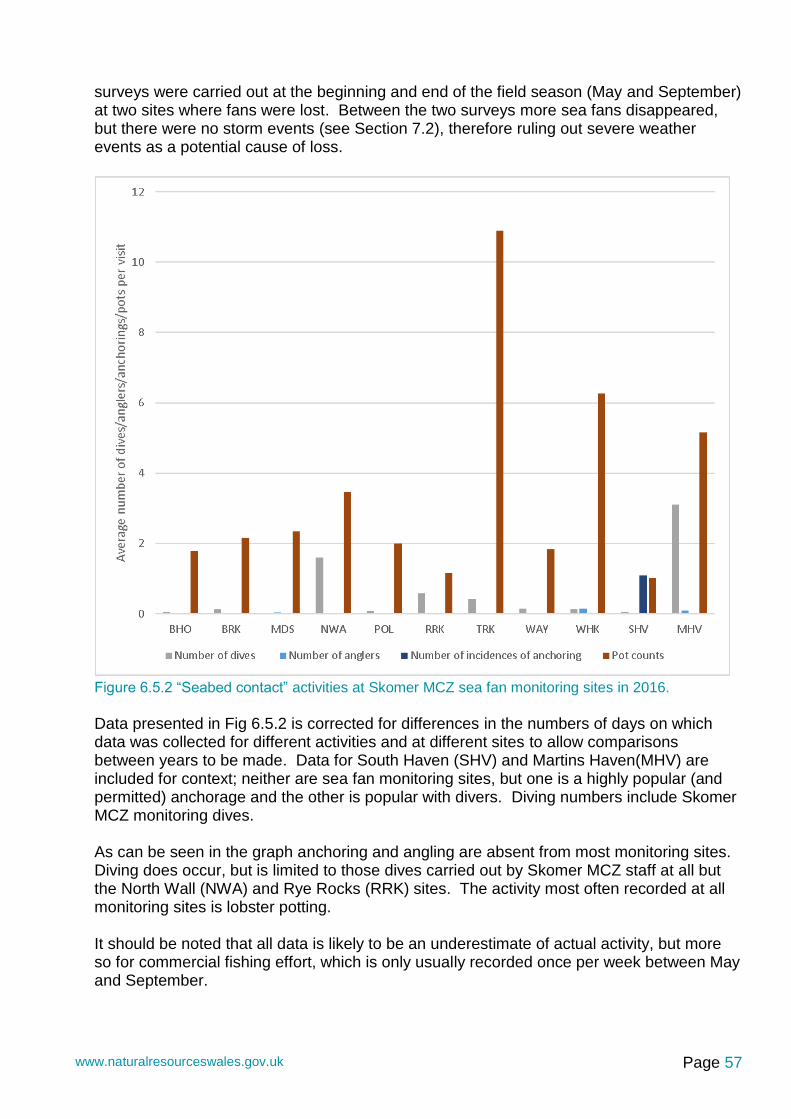
Page 57 www.naturalresourceswales.gov.uk
surveys were carried out at the beginning and end of the field season (May and September) at two sites where fans were lost. Between the two surveys more sea fans disappeared, but there were no storm events (see Section 7.2), therefore ruling out severe weather events as a potential cause of loss.
Figure 6.5.2 “Seabed contact” activities at Skomer MCZ sea fan monitoring sites in 2016.
Data presented in Fig 6.5.2 is corrected for differences in the numbers of days on which data was collected for different activities and at different sites to allow comparisons between years to be made. Data for South Haven (SHV) and Martins Haven(MHV) are included for context; neither are sea fan monitoring sites, but one is a highly popular (and permitted) anchorage and the other is popular with divers. Diving numbers include Skomer MCZ monitoring dives. As can be seen in the graph anchoring and angling are absent from most monitoring sites. Diving does occur, but is limited to those dives carried out by Skomer MCZ staff at all but the North Wall (NWA) and Rye Rocks (RRK) sites. The activity most often recorded at all monitoring sites is lobster potting. It should be noted that all data is likely to be an underestimate of actual activity, but more so for commercial fishing effort, which is only usually recorded once per week between May and September.

Page 58 www.naturalresourceswales.gov.uk
Recruitment Recruitment has been low relative to losses with a total of only 11 “new recruit” sea fan colonies being recorded at the monitoring sites since 2000. Condition and growth in the recruits has been variable. BHO23 was a confirmed loss in 2010 and the cluster of 5 “new recruits” at BHO have shown no growth in 11 years. There was no recorded recruitment in 2017.
Sea fan site and number
Year first found
Description and growth
WAY14 2000 Found close to WAY2. 3 branches in 2000 grown to a small bushy fan in 2016.
BHO23 2003 No growth recorded from 2003 to 2008. Confirmed LOSS in 2010.
SSFG23 2005 Found next to SSFG17. 8 branches in 2008 grown to small bushy fan in 2016.
NWAe15 2005 Found below NWAe13. 3 branches in 2005 grown to 6 branches in 2016.
BHO 5 “new recruits”
2006 A cluster of 5 “new recruit” sea fans on a single boulder, all single or double branched stalks. No growth recorded from 2006 to 2016.
RRK24 2006 Found next to RRK7. 5 branches in 2006 grown to 16 branches in 2016.
RRK26 2016 Found in gully close to RRK12.
Table 6.5.2 Skomer MCZ sea fan recruitment

Page 59 www.naturalresourceswales.gov.uk
Sea fan condition
Figure 6.5.3 Condition of sea fans in the Skomer MCZ from photographic images (1994-2017) and field data (2002-2017).
Necrosis: Necrosis is recorded when sea fan soft tissue has died back to leave just the black skeleton showing. In most cases just tiny tips of necrosis are recorded but, in some cases, larger sections on a fan are seen (this is then also recorded as damage). Dead tips will often fall off, but it is possible for healthy neighbouring tissue to grow over the exposed skeleton, thus a fan may have no necrosis recorded in the following year. Necrosis recording from photos from 1994 to 2001 was inconsistent due to variable image quality, therefore field recording of necrosis and the other condition parameters started in 2002 to support condition assessment. Since 2008 image quality has significantly improved with the use of a digital SLR camera allowing more accurate assessment of necrosis. In 2009 a large drop in necrosis was observed with records of its presence in only 12% of the surveyed sea fans. However, the occurrence of necrosis increased in 2010 and then fluctuated between 26% and 55% for the following 7 years - in 2017 necrosis was 35%, lower than the average level of necrosis since 2002 (16 years) of 47%. Epibiota Epibiota includes tangled and attached dog fish eggs, drift algae, bryozoans and hydroids. On occasion bryozoan sea fingers, Alcyonidium diaphanum, deadman’s fingers, Alcyonium digitatum and ross coral Pentapora foliacea have been recorded growing on a fan. Entanglement with epibiota and in particular dog fish eggs if extensive and persistent can cause damage to the sea fan tissues. An annual average of 61% of sea fans have been

Page 60 www.naturalresourceswales.gov.uk
recorded with attached or entangled epibiota for the last 16 years of surveys. In 2017 this was on 62% of the fans. Entanglement (anthropogenic) Fans have been found with fishing line entanglement, which, if extensive and persistent, has been observed to cause damage to the sea fan tissues. Evidence of damage has been shown in the photographic time series between years of individual sea fan. Whenever possible the line is cleaned off the fan to allow recovery. No entanglements were recorded in 2017. Damage Damage is recorded when entanglement in fishing line or natural epibiota results in large areas of necrosis. An example of damage can be seen in sea fan BH26, a healthy sea fan in 2009 started to develop areas of necrosis on some branches (Fig 6.5.4). In 2011 the tissue had deteriorated and by 2012 the branches were just black skeleton. The dead branches then became heavily encrusted in epibiota whilst neighbouring healthy branches continued to grow as seen in the 2017 photograph.
Figure 6.5.4 Pink sea fan, Eunicella verrucosa BH26 2009, 2011, 2012 & 2017.
In addition fans are recorded as damaged when dislodged from the rock. In some cases they are found nearby and an attempt is made to re-attach the colonies artificially.
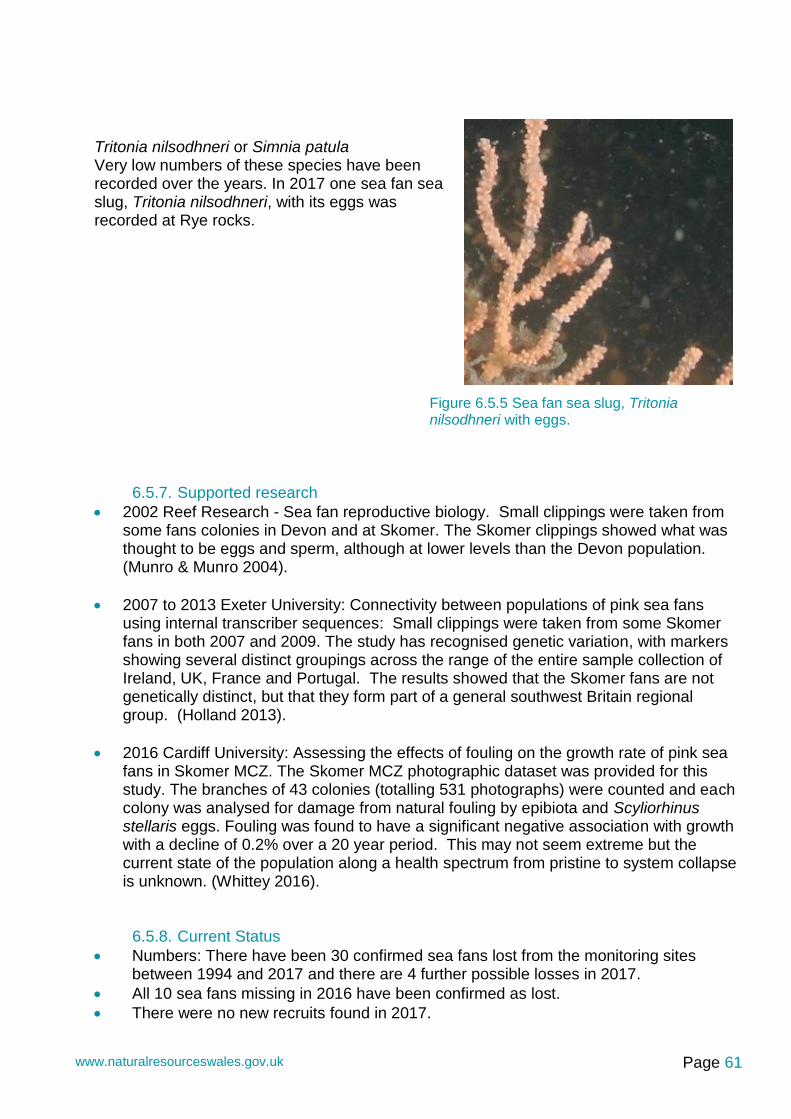
Page 61 www.naturalresourceswales.gov.uk
Tritonia nilsodhneri or Simnia patula Very low numbers of these species have been recorded over the years. In 2017 one sea fan sea slug, Tritonia nilsodhneri, with its eggs was recorded at Rye rocks.
Figure 6.5.5 Sea fan sea slug, Tritonia nilsodhneri with eggs.
6.5.7. Supported research
• 2002 Reef Research - Sea fan reproductive biology. Small clippings were taken from some fans colonies in Devon and at Skomer. The Skomer clippings showed what was thought to be eggs and sperm, although at lower levels than the Devon population. (Munro & Munro 2004).
• 2007 to 2013 Exeter University: Connectivity between populations of pink sea fans using internal transcriber sequences: Small clippings were taken from some Skomer fans in both 2007 and 2009. The study has recognised genetic variation, with markers showing several distinct groupings across the range of the entire sample collection of Ireland, UK, France and Portugal. The results showed that the Skomer fans are not genetically distinct, but that they form part of a general southwest Britain regional group. (Holland 2013).
• 2016 Cardiff University: Assessing the effects of fouling on the growth rate of pink sea fans in Skomer MCZ. The Skomer MCZ photographic dataset was provided for this study. The branches of 43 colonies (totalling 531 photographs) were counted and each colony was analysed for damage from natural fouling by epibiota and Scyliorhinus stellaris eggs. Fouling was found to have a significant negative association with growth with a decline of 0.2% over a 20 year period. This may not seem extreme but the current state of the population along a health spectrum from pristine to system collapse is unknown. (Whittey 2016).
6.5.8. Current Status
• Numbers: There have been 30 confirmed sea fans lost from the monitoring sites between 1994 and 2017 and there are 4 further possible losses in 2017.
• All 10 sea fans missing in 2016 have been confirmed as lost.
• There were no new recruits found in 2017.

Page 62 www.naturalresourceswales.gov.uk
• Condition: Necrosis occurrence was found in 35% of the sea fans, which is lower than the average of 48% recorded for the last 16 years. Epibiota was recorded on 62% of the sea fans; this is slightly above the average of 61% recorded for the last 16 years.
• Losses during 2017 have yet to be confirmed other than the reattached fan at POL, which is definitely missing. This loss could be due to the reattachment failing (although the ringbolt was still in position), or it could have been caused by some physical impact. This site is on the north side of Skomer, therefore sheltered from strong water movement at depth that is associated with wave action from south-westerly storms. It is also an area where human activity is limited to Skomer MCZ monitoring dives and shellfish potting.
• Repeat surveys carried out in 2016 at the beginning and end of the summer showed sea fans losses at the worst affected sites were not due to storm action.
• Observations were regularly made of activities that could potentially damage the sea fans. Of these, only lobster pot fishing was recorded in the vicinity of the affected sea fan sites. It should be noted that these activities were those that were observed, and it is possible, and indeed likely, that there were further unobserved activities. Physical damage could occur from a single impact, and it is not possible to give a definite cause unless direct observations are made, and no direct observations have been made to suggest the cause of damage. The data on observed activities do give a useful indication of probabilities, however, as well as areas on which to focus improved management.
• Conservation status: As an attribute of the Lusitanian anthozoan assemblages feature for Skomer MCZ, the losses to the sea fan population compared to recruitment means the feature is in unfavourable conservation status.
6.5.9. Recommendations
• Observe persistence of biotic fouling/entanglement e.g. dogfish eggs;
• Take close-up photos of all ”new recruits”/small sea fans found;
• Monitor sea temperature and suspended turbidity levels to provide background data for the biological monitoring;
• Continue to record fishing, diving and anchoring activity in Skomer MCZ;
• Work with fisheries legislators to better protect sea fans from physical damage;
• Explore the opportunities to set up a “control area” where no potentially damaging activities take place;
• Support research work on the biology of sea fans and publish results in scientific literature;
• Report status as unfavourable declining.

Page 63 www.naturalresourceswales.gov.uk
Alcyonium glomeratum Population (CMS Code: RM23/03)
6.6.1. Project Rationale Alcyonium glomeratum (red sea fingers) is a Lusitanian species near to its northern limit of distribution and is a component of the Lusitanian anthozoan management feature of the Skomer MCZ. Colonies are long-lived and possible indicators of climate change.
6.6.2. Objectives To monitor colony populations and to look for damage and disease.
6.6.3. Sites Date started: North Wall Stereo (1982) North Wall main (2002) Thorn Rock (2002) Sandy Sea Fan Gully (2002) North Wall East (2002) Rye Rocks (2003) Junko’s Reef (2015)
6.6.4. Methods Each site follows either a sequence of photos or transects that are described in site relocation pro-formas.
• North Wall Stereo: three quadrats (50 x 40cm) are photographed using stereo or high definition digital SLR photography.
• All other sites: photographs (mono) are taken using a 50 x 70cm framer.
The colonies are gently “wafted” before photographing to make them retract in an attempt to control the variability in colony size. The images are analysed by overlaying a 5 x 5cm grid and recording presence/absence of A. glomeratum within the grid squares.
Sequence
North Wall Stereo bar 3 quadrats
North Wall (main) five vertical transects
Thorn Rock mooring two fixed position quadrats
Sandy Sea Fan Gully two vertical transects
North Wall East two vertical transects
Rye Rocks one transect
Junko’s Reef one vertical transect
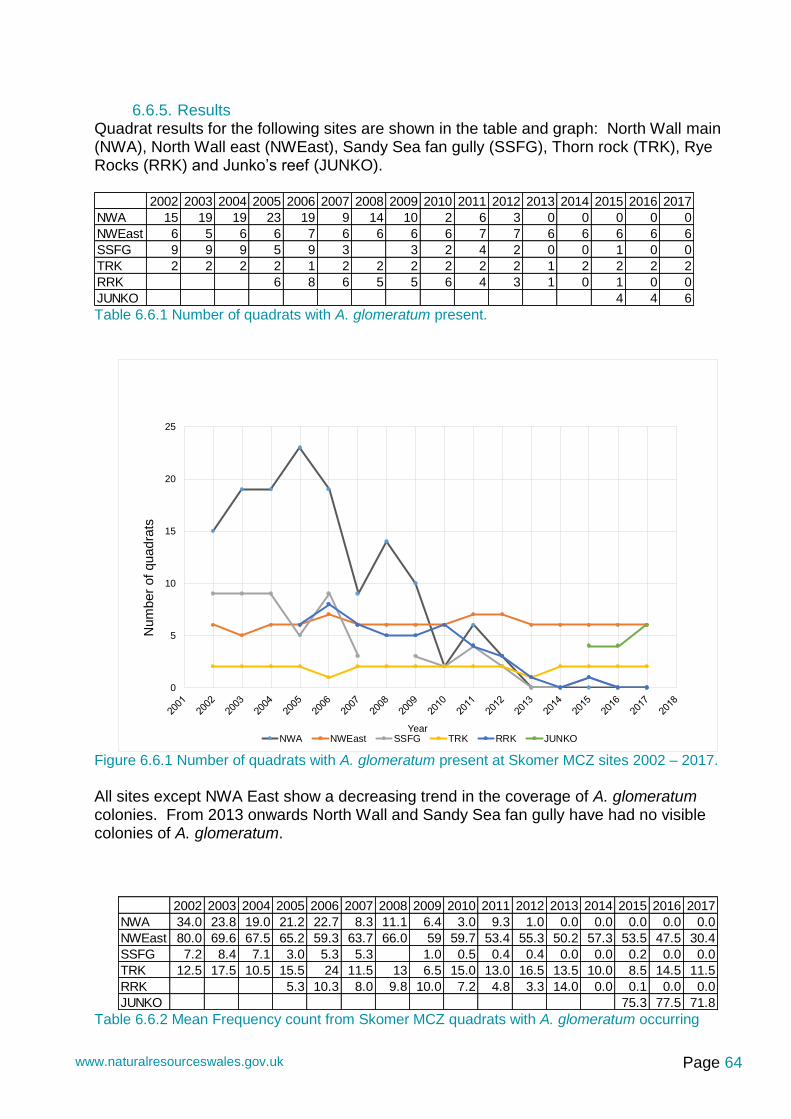
Page 64 www.naturalresourceswales.gov.uk
6.6.5. Results
Quadrat results for the following sites are shown in the table and graph: North Wall main (NWA), North Wall east (NWEast), Sandy Sea fan gully (SSFG), Thorn rock (TRK), Rye Rocks (RRK) and Junko’s reef (JUNKO).
Table 6.6.1 Number of quadrats with A. glomeratum present.
Figure 6.6.1 Number of quadrats with A. glomeratum present at Skomer MCZ sites 2002 – 2017.
All sites except NWA East show a decreasing trend in the coverage of A. glomeratum colonies. From 2013 onwards North Wall and Sandy Sea fan gully have had no visible colonies of A. glomeratum.
Table 6.6.2 Mean Frequency count from Skomer MCZ quadrats with A. glomeratum occurring
2002 2003 2004 2005 2006 2007 2008 2009 2010 2011 2012 2013 2014 2015 2016 2017
NWA 15 19 19 23 19 9 14 10 2 6 3 0 0 0 0 0
NWEast 6 5 6 6 7 6 6 6 6 7 7 6 6 6 6 6
SSFG 9 9 9 5 9 3 3 2 4 2 0 0 1 0 0
TRK 2 2 2 2 1 2 2 2 2 2 2 1 2 2 2 2
RRK 6 8 6 5 5 6 4 3 1 0 1 0 0
JUNKO 4 4 6
0
5
10
15
20
25
Count
Year
Number of quadrats with A. glomeratum present 2002-2016
NWA NWEast SSFG TRK RRK JUNKO
2002 2003 2004 2005 2006 2007 2008 2009 2010 2011 2012 2013 2014 2015 2016 2017
NWA 34.0 23.8 19.0 21.2 22.7 8.3 11.1 6.4 3.0 9.3 1.0 0.0 0.0 0.0 0.0 0.0
NWEast 80.0 69.6 67.5 65.2 59.3 63.7 66.0 59 59.7 53.4 55.3 50.2 57.3 53.5 47.5 30.4
SSFG 7.2 8.4 7.1 3.0 5.3 5.3 1.0 0.5 0.4 0.4 0.0 0.0 0.2 0.0 0.0
TRK 12.5 17.5 10.5 15.5 24 11.5 13 6.5 15.0 13.0 16.5 13.5 10.0 8.5 14.5 11.5
RRK 5.3 10.3 8.0 9.8 10.0 7.2 4.8 3.3 14.0 0.0 0.1 0.0 0.0
JUNKO 75.3 77.5 71.8
Num
ber
of
quadra
ts

Page 65 www.naturalresourceswales.gov.uk
Figure 6.6.2 Mean frequency of A. glomeratum within quadrats Skomer MCZ 2002 – 2017.
The declining trend or disappearance of A. glomeratum has continued at all sites except for Thorn Rock and Junko’s reef. North Wall Stereo colony The time series for these 3 quadrats on the north side of Skomer runs back to the 1980’s. The quadrats have been photographed annually for most years since 1988.
Figure 6.6.3 Frequency count (120 squares) of presence of A. glomeratum in 3 quadrats at the North wall – Skomer MCZ
0.0
10.0
20.0
30.0
40.0
50.0
60.0
70.0
80.0
90.0
Fre
quency
year
North wall North wall east Sandy seafan gully Thorn rock RRK JUNKO
0
20
40
60
80
100
120
Fre
quency c
ount
Year
G1 G2 G3

Page 66 www.naturalresourceswales.gov.uk
All three quadrats show a similar trend of increasing cover peaking in the late 90’s- early 2000’s and then declining from 2006 onwards. G2 now has a similar coverage of A. glomeratum to what was found in 1984. The other quadrats have considerably less. Looking at the “then and now” photographs below it is interesting to note that Alcyonium digitatum (white deadman’s fingers) has also reduced significantly in the three quadrats Example photographs of “then and now” Quadrat G1 – 1989 2005 2017
Quadrat G2 – 1988 2005 2017
Quadrat G3 – 1989 2005 2017
Figure 6.6.4 Photographic examples of declining populations of A. glomeratum at Skomer MCZ between 1989 and 2017.
6.6.6. Current Status The abundance of A. glomeratum at the monitoring sites is declining: North Wall East and Junko’s reef have sizable colonies of A. glomeratum. North Wall main, Rye Rocks and Sandy Sea Fan Gully now have no visible colonies. The reason for this decline is unknown. There is no evidence of disease or physical damage at the monitoring sites and changes in environmental conditions are not thought to be significant enough to cause colony loss.

Page 67 www.naturalresourceswales.gov.uk
6.6.7. Recommendations
• Search for further colonies in the MCZ and establish new monitoring sites.
• Improve site marking to allow accurate relocation of quadrats.
• Analyse photographs to assess what species have replaced the lost colonies of A. glomeratum and establish whether other species (e.g. Alcyonium digitatum) have also declined.
• Encourage research to investigate potential reasons for population decline.
• Keep scientific literature under review.
• Report status as declining.

Page 68 www.naturalresourceswales.gov.uk
Parazoanthus axinellae Population (CMS code: RM23/05)
6.7.1. Project Rationale The population of Parazoanthus axinellae (yellow cluster anemone) is a component of the Lusitanian anthozoan management feature of the Skomer MCZ. P. axinellae is a Lusitanian species near to the edge of its range and may act as an indicator of climatic change.
6.7.2. Objectives Monitor P. axinellae colonies for changes in polyp density and colony area.
6.7.3. Sites
• Sandy Sea Fan Gully (2002)
• Sandy Sea Fan Gully Buttress (2015)
• Thorn Rock (3 colonies) (2002)
• Way Bench (2 colonies) (2002)
6.7.4. Methods Density Estimates: Close-up photographs are taken using a digital camera. The digital camera is mounted on a 20 x 20cm framer. P. axinellae polyps are counted in each 20 x 20 cm quadrat. Area of the Colony: A series of transects are placed through the colonies. Photographs are taken using a 50 x 70cm framer. In 2008 a digital SLR camera replaced the film camera providing high quality images allowing improved photo analysis. The images are analysed by overlaying a 5 x 5cm grid and recording presence/absence of P. axinellae within the grid squares. See Burton, Lock & Newman 2002 for details.
Figure 6.7.1 Density: 20 x 20cm framer Colony area: 50 x 70cm framer

Page 69 www.naturalresourceswales.gov.uk
6.7.5. Results
Colony area Density
Site Index of Area Close up photographs
Sandy sea fan gully 5 transects (20 samples) Yes
Sandy sea fan gully Buttress
2 permanent transects set up 13 quadrats
Yes
Waybench – New Wall 9 re-locatable samples Yes
Waybench – Deep Wall 2 transects (8 samples) Yes
Waybench – Deep Wall New lower transect established – 6 quadrats
No
Thorn Rock – Piton 7 3 re-locatable samples No
Thorn Rock - Mooring 3 re-locatable samples 4 new quadrats west of mooring
No
Thorn Rock – Piton 3 3 transects (11 samples) Yes
Table 6.7.1 Fieldwork completed at Skomer MCZ in 2017
Figure 6.7.2 Density of P. axinellae polyp (numbers of polyps /m2) at Skomer MCZ sites 2001 – 2017
No significant changes in density were seen in 2017 except for Sandy Sea Fan Gully (SSFG), where polyp density has continued to increase.
0
1000
2000
3000
4000
5000
6000
7000
8000
9000
10000
density (
zooid
s /
m2)
year
SSFG TRK P3 Way New Way Deep
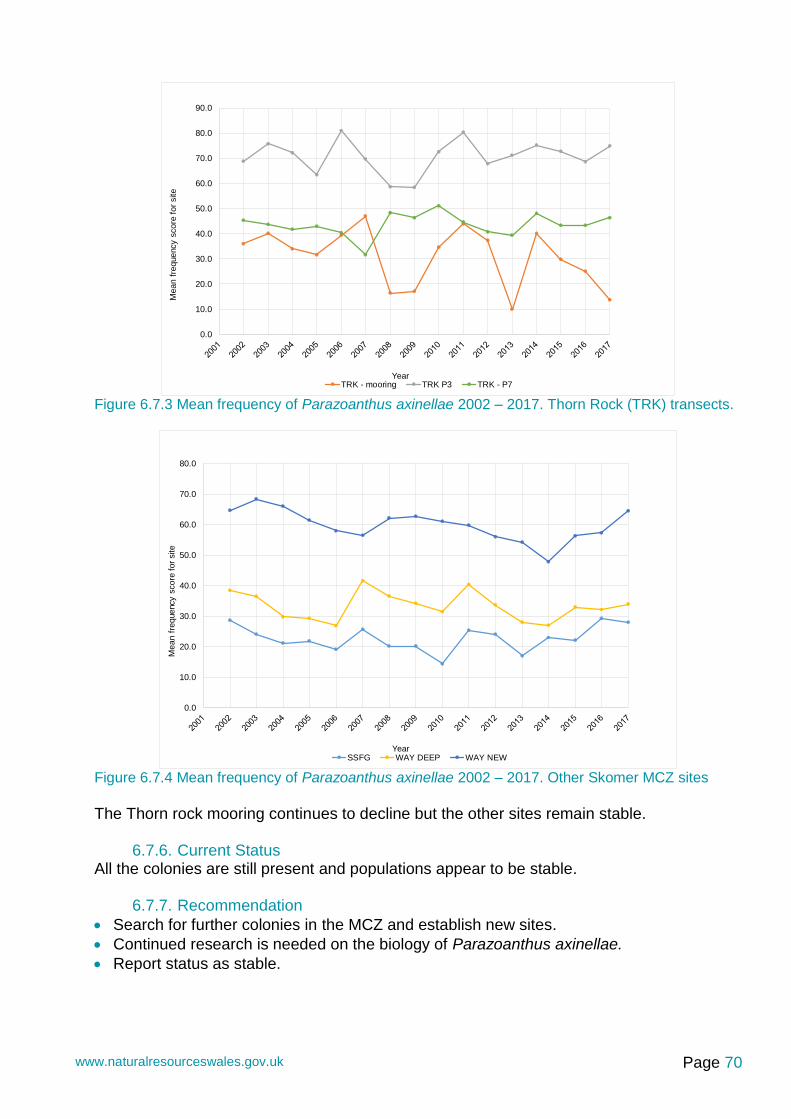
Page 70 www.naturalresourceswales.gov.uk
Figure 6.7.3 Mean frequency of Parazoanthus axinellae 2002 – 2017. Thorn Rock (TRK) transects.
Figure 6.7.4 Mean frequency of Parazoanthus axinellae 2002 – 2017. Other Skomer MCZ sites
The Thorn rock mooring continues to decline but the other sites remain stable.
6.7.6. Current Status All the colonies are still present and populations appear to be stable.
6.7.7. Recommendation
• Search for further colonies in the MCZ and establish new sites.
• Continued research is needed on the biology of Parazoanthus axinellae.
• Report status as stable.
0.0
10.0
20.0
30.0
40.0
50.0
60.0
70.0
80.0
90.0
Mean f
requency s
core
for
site
YearTRK - mooring TRK P3 TRK - P7
0.0
10.0
20.0
30.0
40.0
50.0
60.0
70.0
80.0
Mean f
requency s
core
for
site
YearSSFG WAY DEEP WAY NEW

Page 71 www.naturalresourceswales.gov.uk
Pentapora foliacea (ross coral) Population
CMS code: RM63/01
6.8.1. Project Rationale
Colonies of the bryozoan Pentapora foliacea are fragile structures which are known to survive for many years. They are important microhabitats for mobile species and are regarded as useful indicators of anthropogenic activity such as mobile fishing gear, potting and anchoring (Eno et al 2001, Munro 1996). As such they were selected as a management feature of the Skomer MCZ. They are also a component of the fragile sponge and anthozoan community habitat of priority importance under Section 7 of the Environment Act (Wales) 2016.
6.8.2. Objectives 1. To monitor the numbers and growth rate of colonies. 2. To monitor the amount of damage occurring to the colonies.
6.8.3. Sites
Site substrate dataset
North of the Neck ground ropes 2002- onwards
North wall rock and boulders 1984 – 2002
Way bench rock and boulders 1993/4 restarted 2002- onwards
Bernie’s Rocks boulders 1995 onwards
South Middleholm rock 2003- onwards
West Hook rock 2004- onwards
Pool boulders 2013 - onwards Table 6.8.1 Pentapora foliacea monitoring sites at Skomer MCZ in 2017
6.8.4. Methods
Photographs are taken using a digital camera set up on a 50 x 70 cm frame. Photographs are taken along marked transects at each site following detailed site proforma.
6.8.5. Project History Growth and community structure 1998: Gilbert tested various image analysis methods for assessing growth rate, but concluded that a three-dimensional method would be most suitable. Colonies were put into size classes using base area (cm2) however this only provided an approximate measure of colony size. (Gilbert 1998). 2005: the analysis methods were reviewed. The growth of P. foliacea colonies were found to vary dramatically; one colony showed an increase in base area of over 800cm2 in one year, whilst other large colonies had all but disappeared. In general colonies that survive tend to grow whilst other colonies of all sizes can just disappear in the space of a year. This suggests that some colonies are being physically destroyed or rapidly disintegrate naturally rather than just decrease in size by slow wastage. (Burton et al 2005). 2008: Gibbs developed an empirical calibration method by which a three-dimensional reconstruction of a P. foliacea colony may be created from stereo-photographs. This
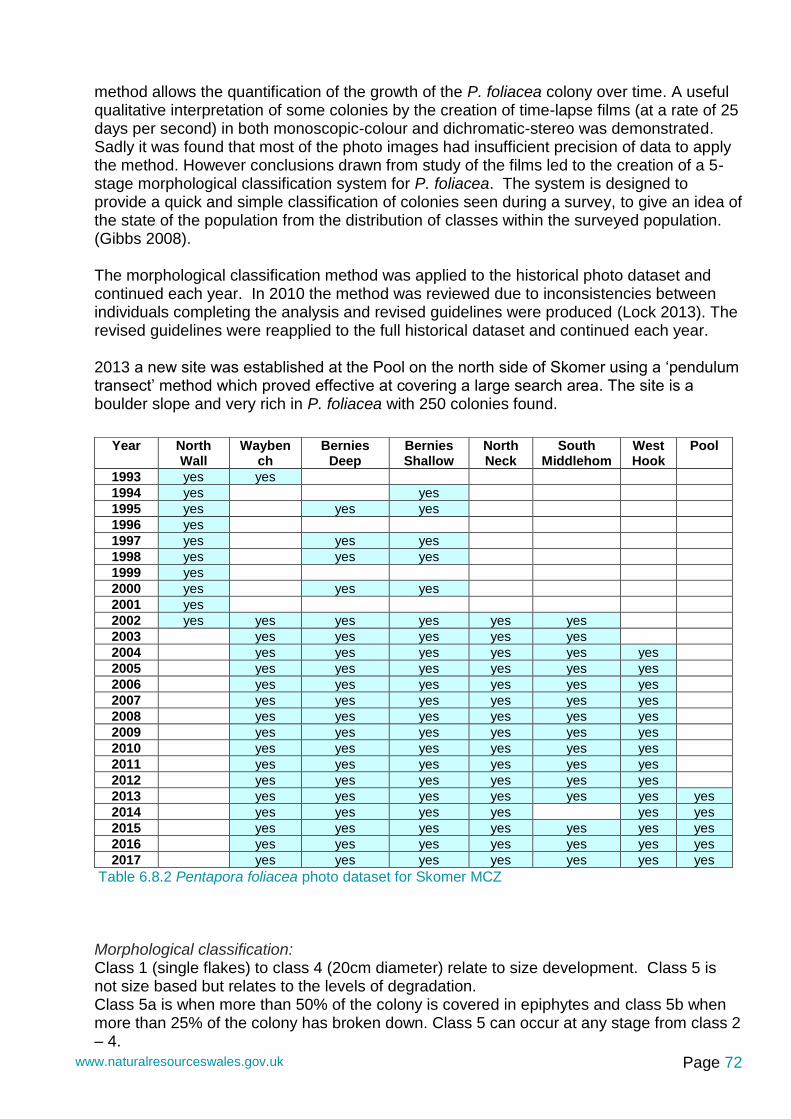
Page 72 www.naturalresourceswales.gov.uk
method allows the quantification of the growth of the P. foliacea colony over time. A useful qualitative interpretation of some colonies by the creation of time-lapse films (at a rate of 25 days per second) in both monoscopic-colour and dichromatic-stereo was demonstrated. Sadly it was found that most of the photo images had insufficient precision of data to apply the method. However conclusions drawn from study of the films led to the creation of a 5-stage morphological classification system for P. foliacea. The system is designed to provide a quick and simple classification of colonies seen during a survey, to give an idea of the state of the population from the distribution of classes within the surveyed population. (Gibbs 2008). The morphological classification method was applied to the historical photo dataset and continued each year. In 2010 the method was reviewed due to inconsistencies between individuals completing the analysis and revised guidelines were produced (Lock 2013). The revised guidelines were reapplied to the full historical dataset and continued each year. 2013 a new site was established at the Pool on the north side of Skomer using a ‘pendulum transect’ method which proved effective at covering a large search area. The site is a boulder slope and very rich in P. foliacea with 250 colonies found.
Table 6.8.2 Pentapora foliacea photo dataset for Skomer MCZ
Morphological classification: Class 1 (single flakes) to class 4 (20cm diameter) relate to size development. Class 5 is not size based but relates to the levels of degradation. Class 5a is when more than 50% of the colony is covered in epiphytes and class 5b when more than 25% of the colony has broken down. Class 5 can occur at any stage from class 2 – 4.
Year North Wall
Waybench
Bernies Deep
Bernies Shallow
North Neck
South Middlehom
West Hook
Pool
1993 yes yes
1994 yes yes
1995 yes yes yes
1996 yes
1997 yes yes yes
1998 yes yes yes
1999 yes
2000 yes yes yes
2001 yes
2002 yes yes yes yes yes yes
2003 yes yes yes yes yes
2004 yes yes yes yes yes yes
2005 yes yes yes yes yes yes
2006 yes yes yes yes yes yes
2007 yes yes yes yes yes yes
2008 yes yes yes yes yes yes
2009 yes yes yes yes yes yes
2010 yes yes yes yes yes yes
2011 yes yes yes yes yes yes
2012 yes yes yes yes yes yes
2013 yes yes yes yes yes yes yes
2014 yes yes yes yes yes yes
2015 yes yes yes yes yes yes yes
2016 yes yes yes yes yes yes yes
2017 yes yes yes yes yes yes yes

Page 73 www.naturalresourceswales.gov.uk
Figure 6.8.1 Pentapora foliacea - examples of Class 4 and Class 5b colonies.
6.8.6. Results The following graph for all Skomer sites shows a general pattern of the classes. The population pattern varies between sites as colony development is affected by both substrate and environmental conditions at sites. Figure 6.8.2 Pentapora foliacea - normalised population curve for all Skomer MCZ sites
Class 4
Class 5b
Pro
po
rtio
n o
f
each
siz
e c
lass

Page 74 www.naturalresourceswales.gov.uk
Waybench is a large bedrock site, on the north side of the island, and divided into two sections: an exposed rock ridge and a neighbouring boulder area. On the ridge colonies tend to be class 1-3 and rarely reach a class 4, whilst in the more sheltered boulder area high numbers of colonies are found and many of them reach large class 4 before developing into a class 5. Bernies Rock is located on the north side of the island. There is a shallow site and a deep site, both consisting of boulder substrate. The number of colonies has varied at both sites year by year, with some years no colonies being found. All classes of colonies are found with many developing into a class 4, before progressing to a class 5. The Pool is a new site started in 2013 located on the north side of Skomer. The site is a boulder slope from 10m down to 22m below chart datum. A large survey area is covered and large numbers of colonies are found (up to 250 individuals) with an even spread of classes present. It will be interesting to monitor the population pattern for this site with the high numbers of colonies present. Figure 6.8.3 Pentapora foliacea - normalised population curve at Pool
North Neck is unusual as colonies are growing on ground ropes laid upon a mixed sediment seabed. Movement of the ropes due to wave and current action restricts growth of most of the colonies to class 1 and 2. Some individuals grow to class 3 but there are no class 4 individuals. South Middleholm is a small bedrock site on the south side of the island and subjected to the prevailing south-westerly swell. Class 1 to 3 individuals are the most common, with very few developing into class 4, instead developing directly to class 5. West Hook is a small bedrock site located on the North Marloes Peninsula, most colonies reach class 4 before developing into class 5.
Pro
po
rtio
n o
f
each
siz
e c
lass
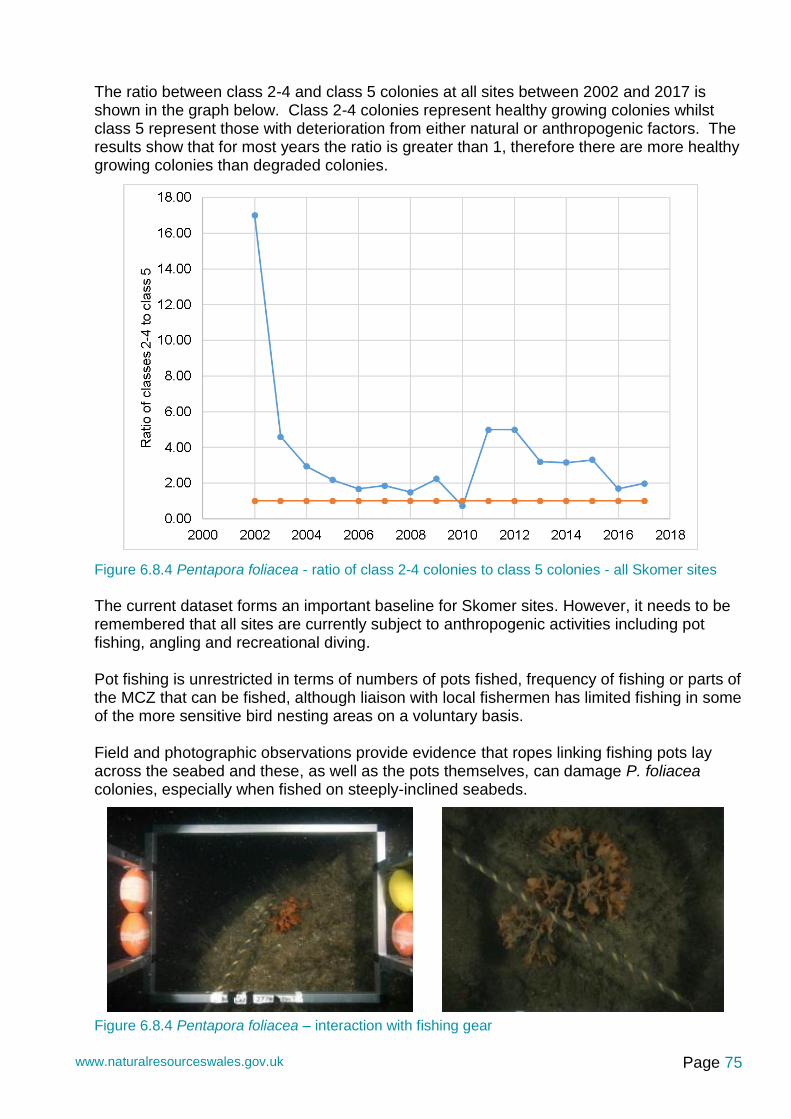
Page 75 www.naturalresourceswales.gov.uk
The ratio between class 2-4 and class 5 colonies at all sites between 2002 and 2017 is shown in the graph below. Class 2-4 colonies represent healthy growing colonies whilst class 5 represent those with deterioration from either natural or anthropogenic factors. The results show that for most years the ratio is greater than 1, therefore there are more healthy growing colonies than degraded colonies.
Figure 6.8.4 Pentapora foliacea - ratio of class 2-4 colonies to class 5 colonies - all Skomer sites
The current dataset forms an important baseline for Skomer sites. However, it needs to be remembered that all sites are currently subject to anthropogenic activities including pot fishing, angling and recreational diving. Pot fishing is unrestricted in terms of numbers of pots fished, frequency of fishing or parts of the MCZ that can be fished, although liaison with local fishermen has limited fishing in some of the more sensitive bird nesting areas on a voluntary basis. Field and photographic observations provide evidence that ropes linking fishing pots lay across the seabed and these, as well as the pots themselves, can damage P. foliacea colonies, especially when fished on steeply-inclined seabeds.
Figure 6.8.4 Pentapora foliacea – interaction with fishing gear

Page 76 www.naturalresourceswales.gov.uk
Angling is also only regulated by voluntary codes, where bottom fishing is discouraged in the nearshore zone. Collection, destruction or disturbance of marine wildlife by divers is prohibited by byelaw (although this does not include commercial crustacean species). Anchoring of boats is restricted, on a voluntary basis, to certain areas and this restriction is generally well adhered to.
Figure 6.8.5 “Seabed contact” activities at Skomer MCZ Pentapora foliacea monitoring sites in 2017
Levels of these different activities can be seen in Fig 6.8.5. Data for South Haven (SHV) and Martins Haven(MHV) are included for context; neither are sea fan monitoring sites, but one is a highly popular (and permitted) anchorage and the other is popular with divers. Diving numbers include Skomer MCZ monitoring dives (see Appendix 3 for data collection methodologies). It should be noted that all data is likely to be an underestimate of actual activity, but more so for commercial fishing effort, which is only usually recorded once per week between May and September. A study area that excludes all potentially impacting anthropogenic activities is needed to provide an understanding of a normal functioning ecosystem.
6.8.7. Current Status In most years of recording there has been a higher number of intact and growing colonies (Classes 2-4) compared to “degraded” (Class 5) P. foliacea colonies. This proportion of “healthy” colonies increased in 2011 and 2012, and then reduced slightly with the inclusion of a much larger number of colonies from the Pool site in 2013. After three years of apparent stability the proportion of “healthy colonies has slightly decreased again, but remains higher than the proportion of “degraded” colonies. The question remains as to whether this ratio is a “healthy” one, or whether a population not subjected to any anthropogenic activities would demonstrate different characteristics.

Page 77 www.naturalresourceswales.gov.uk
Given that some potentially damaging anthropogenic activities are unrestricted and occur in the MCZ, but that we are unable to judge whether the population exhibits a “healthy” ratio of degraded to intact colonies this feature is judged to be unknown (Alexander, 2005).
6.8.8. Recommendations
• Maintain long-term photographic datasets of individual colonies at a number of different sites to establish the longevity of the colonies and their response to damage.
• Apply the morphological classification system to identify community structure at a number of different sites.
• Establish a totally non-impacted study area. Until all potentially damaging anthropogenic impacts can be removed from the ecosystem, understanding of its normal functioning cannot begin.
• Continued research is needed on the biology of P. foliacea.
• Keep literature under review.
• Report status as unknown.

Page 78 www.naturalresourceswales.gov.uk
Cup Coral Populations; Balanophyllia regia and Caryophyllia smithii
(CMS code: RM23/04)
6.9.1. Project Rationale Cup corals are slow growing filter feeders, which are susceptible to changes in water quality and planktonic food supply. Balanophyllia regia is a Lusitanian species and Skomer MCZ is close to the northern edge of its range in the UK. It is only found at limited locations within the MCZ. Caryophyllia smithii is a common species of the sub-littoral benthic community of south-western Britain and is found across the whole MCZ on hard substrates. Both species are components of the Lusitanian anthozoan management feature of the Skomer MCZ.
6.9.2. Objectives Monitor the population for changes in densities and to look for evidence of recruitment.
6.9.3. Sites
• Thorn Rock B. regia 1985 to current and C. smithii 1993 to current
• The Wick B. regia 2002 to current
6.9.4. Methods Balanophyllia regia
• Thorn Rock: A fixed position quadrat using a 50 x 40 cm framer at Thorn Rock has been photographed since 1985.
• The Wick: Three transects with 51 quadrats were established at the Wick in 2002. A 50 x 40 cm framer was used up until 2008 when it was replaced with a larger 50 x 70cm framer using a digital SLR camera. This provides high quality images allowing improved photo analysis.
• Counts are carried out using GIS techniques described in Burton et al 2002. Caryophyllia smithii: Approximately 70 quadrats have been analysed on an annual basis since 1993 from photographs taken for the sponge community project at Thorn Rock. Photographs are taken using a 50 x 70cm framer and counts are carried out using GIS techniques.
6.9.5. Results Balanophyllia regia: At the Wick all data has been adjusted to 1m2 to enable the data from the 50 x 40 cm and the 50 x 70 cm framer to be comparable.

Page 79 www.naturalresourceswales.gov.uk
Table 6.9.1 Mean abundance (and standard error) of Balanophyllia regia in The Wick (adjusted to 1m2).
Figure 6.9.1 Balanophyllia regia abundance at Transects A, B and C at the Wick.
The average number/m2 of B. regia has fluctuated at transects A, B and C. The variability is most likely to be caused by the dense covering of silt that occurs across the site from time to time and occasional very poor photographic conditions (e.g. 2010). This might explain why counts were higher in 2017 when silt was reduced and more cup corals were visible.
Site Year 2002 2003 2004 2005 2006 2007 2008 2009
WCK A Mean 203 252 275 334 218 455 415
S.E. 32 39 43 49 50 62 53
WCK C Mean 323 360 476 397 445 579 530 516
S.E. 50 51 52 62 42 65 73 75
WCK B Mean 253 214 284 239 183 483 402 337
S.E. 38 47 63 55 46 98 76 96
Site Year 2010 2011 2012 2013 2014 2015 2016 2017
WCK A Mean 205 412 329 435 236 455 409 479
S.E. 35 59 40 66 39 55 51 62
WCK C Mean 178 674 453 608 399 541 702 259
S.E. 53 93 71 83 62 85 97 36
WCK B Mean 332 344 232 295 291 356 386 170
S.E. 46 79 49 69 80 96 92 32

Page 80 www.naturalresourceswales.gov.uk
At Thorn Rock individual cup corals have been traced for 30 years in a single 40 x 50cm quadrat. Some evidence of recruitment has been observed, numbers have shown a general increase between 1998 and 2017. Variability will occur due to changes in surface sediment which obscures small individuals. Due to very poor photographic conditions no counts were possible in 2014 and 2016, but fortunately conditions improved in 2017.
Figure 6.9.2 Thorn Rock boulder Balanophyllia regia counts (per 40 x 50cm quadrat) Caryophyllia smithii The average number/m2 of C. smithii has fluctuated at each of the Thorn Rock sites. This may be due to variable levels of surface sediment affecting the actual numbers visible during recording. The Windy gully (WG) quadrats show significantly higher counts compared to the other sites. This is most likely due to it being the only vertical wall site where less surface sediment accumulates. The other three sites are all on horizontal rock.
30
50
70
90
110
130
150
Count
Year

Page 81 www.naturalresourceswales.gov.uk
Figure 6.9.3 Mean Number of Caryphyllia smithii per 50 x 70 cm quadrat at Thorn Rock (4 transects) 1996 – 2016
6.9.6. Current Status Variability in numbers of both B. regia and C. smithii is partly due to varying levels of surface sediment. The populations appear stable although there is no firm evidence of recruitment.
6.9.7. Recommendations
• Records of surface sediment levels may help determine whether reduced abundance of cup corals is significant or due to recording inconsistencies.
• Review photographs to test the possibility of tracing individuals from year to year.
• Support research work and publish results in scientific literature.
• Report status as stable.
0.00
20.00
40.00
60.00
80.00
100.00
120.00
Mean n
um
ber
of cup c
ora
ls /
quadra
t
Year
SH
WG
DL
BG

Page 82 www.naturalresourceswales.gov.uk
Grey Seal (Halichoerus grypus) Population (CMS code: RA03/01)
6.10.1. Project Rationale Grey seals are a protected species under the Conservation of Seals Act 1970. They live and breed in the Skomer MCZ as part of the west Wales population, which is the largest in south west Britain. Seals are listed under Annex II of the European Union Habitats Directive and one of the features of the Pembrokeshire Marine SAC. Seals are also a management feature of the Skomer MCZ. This project supplies data for reporting on SAC, MCZ and Site of Special Scientific Interest feature condition (Dale and South Marloes coast SSSI, and Skomer island and Middleholm SSSI).
6.10.2. Objectives To monitor the number and survival rate of seal pups born in the MCZ as an indication of the state of the general seal population.
6.10.3. Sites All pupping beaches and caves in the MCZ.
6.10.4. Methods The pups are recorded from birth through to their first moult using the “Smith 5-fold classification system” (Poole 1996). Reason for death is recorded if possible. Additional behavioural observations are recorded for the Island seals (full method described and Skomer MCZ and Skomer Island seal management plan Alexander 2015). The Skomer sites are completed through a contract and a full survey report is produced, the mainland sites are completed by MCZ staff. The results are combined to provide the full Skomer MCZ results.
6.10.5. Project History Regular recording began at Skomer MCZ in 1974. From 1992 onwards a standard protocol has been adopted to record the pupping success on both the island and the mainland each year.
Additional Seal Studies carried out at Skomer MCZ 2002 - Methods to study seal disturbance at mainland sites were tested and a further survey done in 2003 by placement students from Pembrokeshire College. A trial MCZ ‘seal watching’ leaflet was produced and distributed at the National Trust car park at Martins Haven. The leaflet included information on how to behave whilst watching seals. The 2003 survey included a questionnaire on the usefulness of the leaflet, which indicated that the leaflet successful. A professionally produced version was published ready for the 2004 season and a full report on the seal disturbance study was completed (Lock, 2004). 2004 - A project to identify individual seals at mainland sites was started by a placement student from Pembrokeshire College. This followed methods set out in the ‘Grey Seal Monitoring Handbook’ (Poole, 1996 b.) and tested photographic and video methods.

Page 83 www.naturalresourceswales.gov.uk
2005 - Photographic methods were introduced to the adult seal identification project on Skomer (Matthews, 2006). A Pembrokeshire college student, Liz Coutts, completed a study on the behaviour of bull seals at two island sites (Coutts, 2006). 2007 - A project was completed by Dave Boyle studying the bull seals at all Skomer sites during September and October through funding secured by the Wildlife Trust South and West Wales. The bulls were individually identified by their scars and markings. All bulls were sketched and photographed along with dates, location and dominance being recorded (Matthews & Boyle, 2008). 2008 - 2017 - At Skomer sites photography included pupping cows to help increase knowledge of site fidelity, longevity and pupping frequency. In 2011 - 2015 the work also expanded to some cows and bulls from mainland sites. (Matthews 2009, Boyle 2009, 2010, 2011 & 2012, Buche & Stubbings 2013, 2014, 2015, 2016 & 2017). 2010 - 2015 - Collaboration work with Sue Sayer, Cornwall Seal Group, who has maintained extensive catalogues of seals photographed in Cornwall since 2000. In the ‘Skomer Seal Photo Identification Project Report 2007 – 2012’ photographs taken at Cornwall/Devon and at Skomer sites were compared and 36 seals were identified as having been at both areas. Most of these seals seemed to be spending the breeding season on Skomer, returning to Cornwall for the winter and spring, but disappearing during the summer, presumably going somewhere else to feed up before the next breeding season (Boyle, 2011). Between 2007 and 2013 there were a total of 43 “matches” of individual seals in the Cornwall and Skomer MCZ datasets (Sayer, pers. comm.). NRW have developed an EIRPHOT database called the Wales Seal ID database in collaboration with the Sea Mammal Research Unit. Head and neck profiles of individual seals are extracted from photographs and entered into the database, and “matching” is then carried out on these extracted images. In 2014 a NRW contract allowed all 2007 to 2014 Pembrokeshire photos to be entered, in addition to the North Wales seal ID datasets. 2015 and 2016 photos are stored ready for entry. 2014 - 2016 Collaboration work with Swansea University researchers Dr James Bull and Dr Luca Borger. Long- term Skomer MCZ pup production data from the Marloes Peninsula (1992-2014) has been used to look at temporal trends and phenology in grey seal pups (Bull et al., 2017a). The same team have also used statistical models to look at the long-term data sets (1985-2015) for the Skomer Island sites (Bull et al., 2017b). 2016 - ongoing. PhD student William Kay, co-supervised between Swansea University and NRW, began research on seal movements in the Irish Sea in relation to potential marine renewable energy projects. The research started by mapping the historical Pembrokeshire seal ringing/tagging data collected between the 1950s and the 1970s, including many seal pups from Skomer. 2016- 2017 Callan Lofthouse, a student at Swansea University, completed analyse on seal scat samples collected from Skomer sites in the 2015 and 2016 seasons (Lofthouse, 2017).

Page 84 www.naturalresourceswales.gov.uk
6.10.6. Results
In 2017 225 pups were born at Skomer Island sites and 158 pups at mainland sites giving a
total of 383 pups born in the MCZ.
Figure 6.10.1 Skomer MCZ pup production 1992 - 2016
Pup production in the Skomer MCZ for the past 5 years has shown the highest totals recorded for the area with average production for 2013-17 at 360 pups. The pup production from 1992 to 2008 remained fairly consistent, within expected natural fluctuations, and with an average of 208 pups. Since 2009 there has been a steady increase in pup production at both the island and mainland sites. Pup production at the Marloes peninsula sites versus the Skomer island sites expressed as a percentage of the total pup production for the Skomer MCZ is shown in Figure 6.10.2. From 1992 to 2002 Marloes peninsula contributed an average of 22% of total production. This has then gradually increased to a peak of 45% in 2013 and the average over the last five years is 41% of total production.

Page 85 www.naturalresourceswales.gov.uk
Figure 6.10.2 Skomer MCZ pup production – proportion born on Island vs. mainland sites
In 2017 8% of pup production occurred in August, 62% in September, 27% in October and 3% in November, and the peak week of production was week 38 (17th – 23rd September). The trend over the last 23 years shows that the peak week of production has fluctuated between weeks 38 to 40 (17th September to 7th October).
Figure 6.10.3 Skomer MCZ pup production – peak seal birth number seasonality

Page 86 www.naturalresourceswales.gov.uk
In 2017 pup survival through to moult (following the standard method) was recorded as
76% for Skomer sites and 60% for Marloes Peninsula sites, with a combined survival for the
Skomer MCZ of 69%.
Figure 6.10.4 Skomer MCZ pup production and pup survival 1992 - 2017
The standard method for survival assessment is based on the following:
Size E. A Smith’s age classification
Assessment
Very small Class 1 or 2 Assumed not to survive
Small but healthy Class 2, 3, 4 or 5 In good condition, reasonable chance of survival
Good size Class 3, 4 or 5 Most should survive
Very good size Class 3, 4 or 5 All should survive
Super moulter Class 4 or 5 All should survive
Mortality will occur for different reasons including still-birth, abandonment, starvation, disease, insufficient growth, injury and severe weather. It is not always possible to know the reason for death so for analysis purposes it has been simplified into three groups:
Stillborn These include both stillborn and those that died immediately after birth and were not seen alive.
Died All pups seen alive but subsequently recorded dead. These can be from class 1 to 5.
Assumed mortality These include pups assessed not to have survived following the survival assessment.
Every autumn, there are regular storms and large tides, which impact on pup survival. In 2017 there were two ‘super storms’ that impacted the seal pups – these storms were significantly greater than the average autumn storm. Ophelia (16th October) and Brian (21st October). Storm Ophelia developed wind speeds of over 100km/h and the weather station at St. Ann’s Head measured wave heights of more than 16 metres. Many white coated pups were washed off the beaches and Storm Brian, only five days later, was less severe but no less devastating, sweeping some of the remaining pups away.
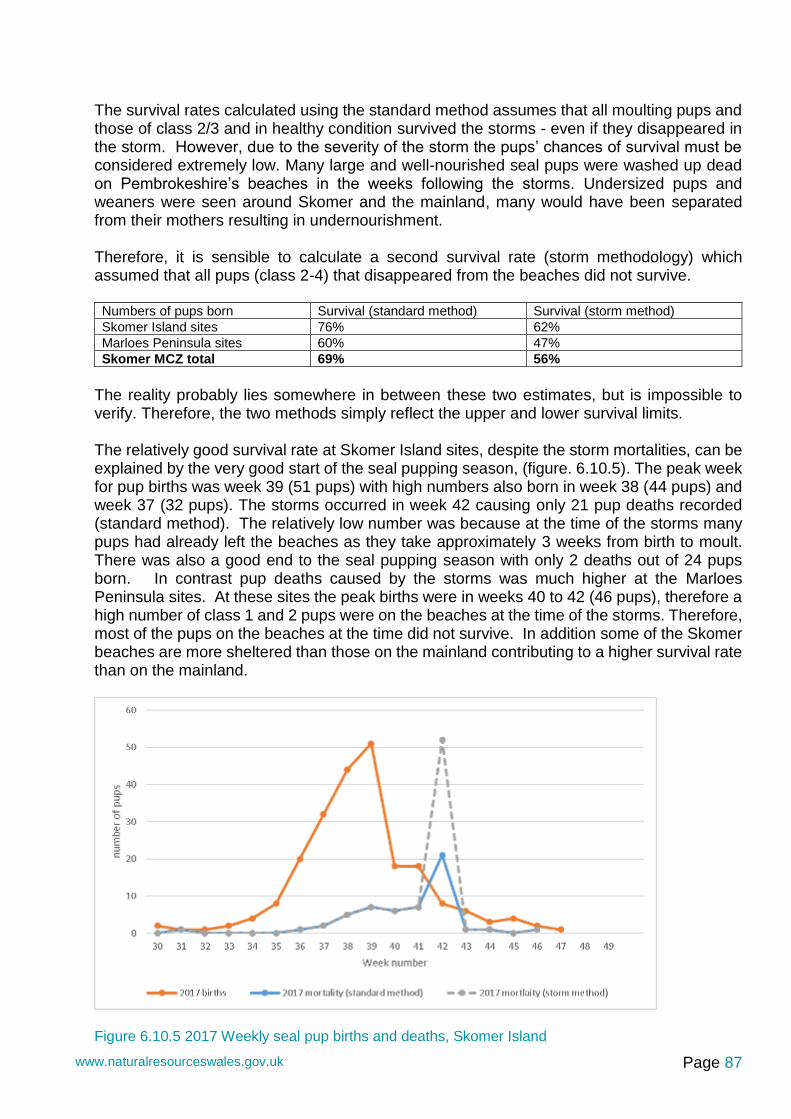
Page 87 www.naturalresourceswales.gov.uk
The survival rates calculated using the standard method assumes that all moulting pups and those of class 2/3 and in healthy condition survived the storms - even if they disappeared in the storm. However, due to the severity of the storm the pups’ chances of survival must be considered extremely low. Many large and well-nourished seal pups were washed up dead on Pembrokeshire’s beaches in the weeks following the storms. Undersized pups and weaners were seen around Skomer and the mainland, many would have been separated from their mothers resulting in undernourishment. Therefore, it is sensible to calculate a second survival rate (storm methodology) which assumed that all pups (class 2-4) that disappeared from the beaches did not survive.
Numbers of pups born Survival (standard method) Survival (storm method)
Skomer Island sites 76% 62%
Marloes Peninsula sites 60% 47%
Skomer MCZ total 69% 56%
The reality probably lies somewhere in between these two estimates, but is impossible to verify. Therefore, the two methods simply reflect the upper and lower survival limits. The relatively good survival rate at Skomer Island sites, despite the storm mortalities, can be explained by the very good start of the seal pupping season, (figure. 6.10.5). The peak week for pup births was week 39 (51 pups) with high numbers also born in week 38 (44 pups) and week 37 (32 pups). The storms occurred in week 42 causing only 21 pup deaths recorded (standard method). The relatively low number was because at the time of the storms many pups had already left the beaches as they take approximately 3 weeks from birth to moult. There was also a good end to the seal pupping season with only 2 deaths out of 24 pups born. In contrast pup deaths caused by the storms was much higher at the Marloes Peninsula sites. At these sites the peak births were in weeks 40 to 42 (46 pups), therefore a high number of class 1 and 2 pups were on the beaches at the time of the storms. Therefore, most of the pups on the beaches at the time did not survive. In addition some of the Skomer beaches are more sheltered than those on the mainland contributing to a higher survival rate than on the mainland.
Figure 6.10.5 2017 Weekly seal pup births and deaths, Skomer Island

Page 88 www.naturalresourceswales.gov.uk
Figure 6.10.6 2017 Weekly seal pup births and deaths, Marloes Peninsula
Figure 6.10.7 Storm Ophelia and dead seal pups on Marloes Peninsula beach 2017.

Page 89 www.naturalresourceswales.gov.uk
A full report for the 2017 Skomer seal census details the production for the island sites (Buche & Stubbings, 2017). The report includes a section on seal behaviour which describes the story of some seal pups which demonstrated incredible resilience to the storms. For example, one pup disappeared off North Haven beach during the storm on 16/10/17 but was seen on St. Bride’s beach (mainland) the next day. The pup was found by a member of the public and Welsh Marine Life Rescue were called to investigate its health. As it was found to be in good health it was marked blue/red above the original purple/orange mark and left on the beach. Astonishingly, it returned to Skomer, North Haven beach on 22/10/17.
Figure 6.10.8 Skomer seal pup 175, 2017. (Buche & Stubbings 2017).
Pollution
Monofilament line and netting were the most obvious pollutants affecting seals. In 2017 25 animals (15 females, 6 males, 4 immature) were photographed with obvious signs of being entangled in nets at some time in their lives, most commonly a deep scar around their necks, often with netting still embedded. Seven of the animals were known from previous years. (Buche & Stubbings 2017). The problem with netting entanglement is a growing concern especially with the high numbers recorded.
6.10.7. Summary of other seal survey projects. Seal diet investigation, Callan Lofthouse, Swansea University 2017. Seal scat samples collect on Skomer Island during the 2015 and 2016 seasons were analysed. The samples were washed through a fine sieve and sorted for identifiable remains. Small ear bones called otoliths, unique for each species, were used to identify fish species present. The results showed that pollack, cod, sea bass and flounder were all present, with pollack the most common and cod the least.
Pup 175, Skomer, North Haven on 3/10/17
Pup 175, Skomer, North Haven marked purple/orange on 8/10/17
Pup 175, St Bride’s Beach (mainland) 17/01/17 photographed by A.Sutcliffe
Pup 175 back on Skomer, North Haven 22/10/17

Page 90 www.naturalresourceswales.gov.uk
The samples also revealed that plastics had also been ingested by the seals, with small pieces of plastic and micro beads found in the samples.
Figure 6.10.9 Seal scat processing, fish otoliths and plastics (photos: Callum Lofthouse).
6.10.8. Current Status
Grey seals at Skomer MCZ are considered to be in favourable condition:
• In 2017 pup numbers reached 383, 16 pups higher than the management plan target
pup production lower limit of 369 pups.
• Pup survival was 69%, 6% below the target percentage survival lower limit of 75%. In 2016 the survival of 73% was also below the lower limit however this offset by a good survival of 79% in 2015.
All Skomer and Marloes Peninsula adult seal photos are stored ready for entry into the NRW Wales Seal ID database.

Page 91 www.naturalresourceswales.gov.uk
6.10.9. Recommendations
• To use the combined Marloes peninsula and Skomer island seal survey results to report on the status of seals in the Skomer MCZ using criteria set out in the Skomer MCZ and Skomer Island NNR Seal Management Plan;
• To use the Skomer MCZ seal survey results to report on the status of seals in the Pembrokeshire Marine SAC;
• To continue recording seal disturbance at mainland and island sites;
• Develop a photo database for Pembrokeshire and neighbouring areas. To continue the adult seal identification project and contribute to the development of the Wales Seal ID database. To continue collaboration with the Cornwall Seal Group;
• Provide visitors with information about grey seals both in the visitor centre and through the distribution of the ‘seal watching’ leaflet developed in 2002 in order to minimise disturbance to breeding seals.
Dave Boyle

Page 92 www.naturalresourceswales.gov.uk
6.11Cetacean Species Recording (CMS Code RA01/ 01) 6.11.1 Project Rationale Cetaceans are regularly recorded in and adjacent to the MCZ. Harbour porpoise (Phocoena phocoena) are most frequently recorded around the island from spring to autumn. However as individual animals are unidentifiable it is not possible to establish whether the MCZ waters are used regularly by a large number of peripatetic animals or whether a smaller group remains in the immediate area. P. phocoena are an internationally protected species listed on: CITES, the Berne Convention, the EC Habitats Directive and under the Agreement on the Conservation of Small Cetaceans in the Baltic, North East Atlantic, Irish and North Seas (ASCOBANS). In British waters they are legally protected under the Wildlife and Countryside Act 1981 and species of principal importance in Wales (Environment Act (Wales) 2016, Section 7). The proposed West Wales Marine SAC for harbour porpoise, which includes the waters of the MCZ, became a candidate SAC following submission to the European Commission in January 2017. Bottlenose dolphin (Tursiops truncatus), Common dolphin (Delphinus delphis) and Risso’s dolphin (Grampus griseus) are occasional visitors to the Skomer MCZ. This project could potentially provide data for reporting on SAC as well as MCZ feature condition. 6.11.2 Objectives To record numbers of cetaceans and the locations used by them in the Skomer MCZ. 6.11.3 Method Recording effort varies annually but includes:
• Skomer Island NNR staff and volunteers using binoculars and telescopes from cliff locations around the island.
• Dale Princess crew maintaining records in a diary of sightings during the ferry run between Martins Haven and North Haven and on the round island trips.
• MCZ staff recording all sightings whilst at sea. Species, numbers, sites, date and time are recorded for each sighting. 6.11.4 Results All sightings of cetaceans have been collated for the period between 2001 and 2017. There are no records in years 2003, 2007, 2010 & 2011. The effort is variable not just between years but also during the season which makes the data difficult to effort correct. In 2016 a standard set of site names and recording system was applied to all data collected by Skomer MCZ and Skomer NNR staff. Very few records were received from the Dale Princess in 2017.

Page 93 www.naturalresourceswales.gov.uk
Figure 6.11.1 Harbour porpoise sightings within Skomer MCZ 2001 - 2017
This data is not effort corrected and there was a more concerted effort to collate all the records in a consistent way in 2016. Harbour porpoise are sighted throughout the whole year and are assumed to be resident / regular users within the MCZ. Common Dolphins are predominantly seen in July – September (fig 6.11.2).
Figure 6.11.2 % of sightings / month 2001 – 2017. Harbour porpoise & Common dolphin.
0
50
100
150
200
250
300
350
400
0
500
1000
1500
2000
2500
No o
f sig
htings
No o
f In
div
iduals
/
year
Year
Total Numbers Sightings
0
5
10
15
20
25
30
0 1 2 3 4 5 6 7 8 9 10 11 12
% o
f all
sig
htings
Month
Com Dolphin Harbour Porpoise

Page 94
Figure 6.11.3 Harbour porpoise sightings Skomer MCZ 2016.
This data is not effort-corrected but is useful in showing areas that harbour porpoise frequent. All vagrant and mobile species records are now
recorded using this site code format.

Page 95 www.naturalresourceswales.gov.uk
Common dolphin (Delphinus delphis) use the area infrequently but they can appear in large numbers. There were no observations in 2010 and 2011 but since then they seem to be increasing. This data is not effort corrected but common dolphin sightings are much more unusual and tend to get recorded. There were more sightings in 2016 but no big pods were seen. In 2017 there were regular sightings throughout August of family groups using the waters on the North side of Skomer Island. Common dolphin sights tend to occur in the summer months – see fig 6.12.2.
Figure 6.11.4 Common dolphin sightings within Skomer MCZ 2001 - 2017
Bottlenose dolphins (Tursiops truncatus) are not often seen within the MCZ, but in 2017 there was a sighting of 12 individuals off the Garland stone in August. That was the first confirmed record within the MCZ since 2002. Risso’s dolphin (Grampus griseus) are regularly seen around Ramsey Island , 8 miles to the north but there are only infrequent sightings within the MCZ. There were 2 sightings in 2016 but no sightings within the MCZ in 2017.
0
10
20
30
40
50
60
70
0
200
400
600
800
1000
1200
1400
No o
f S
ightings
No o
f In
div
iduals
/
year
Axis TitleTotal Numbers Sightings

Page 96 www.naturalresourceswales.gov.uk
Research Projects 2018. In 2018 a static acoustic data logger was placed in the
MCZ by the SEACAMS2 research group based at
Swansea University. This was a trial deployment to see
what data could be collected and what type of species of
cetacean could be detected. A summary of the results can
be found in Appendix 1 – “Skomer MNR cetacean
presence recorded by a static acoustic data logger (C-
POD)”.
6.11.5 Current status Cetaceans continue to be recorded in apparently increasing numbers within Skomer MCZ, although it is unclear whether the increase an artefact of the lack of consistency of recording. 6.11.6 Recommendations
• A standardised method of recording needs to be developed and used by all recorders. Standard method needs to include an estimate of days / time spent recording as well as the sightings data.
• Encourage Swansea University to continue to deploy acoustic loggers and provide data to Skomer MCZ.

Page 97 www.naturalresourceswales.gov.uk
6.12 General Species Recording (CMS code: RB06/01) This section also includes: “vagrant and alien species recording” (CMS code: RB01/01) and “record commercial crustacean populations” (CMS code: RM44/01) projects. 6.12.1 Project Rationale There are many species in the Skomer MCZ that do not have a dedicated monitoring project. However, it is important that species lists are maintained, particularly for phyla that are under-recorded or of particular conservation importance. Recording of species of principal importance as defined under Section 7 of the Environment Act (Wales) 2016 and ‘Alien’ invasive and non-native species (INNS) are just two examples. General recording of unusual, rare, scarce or vagrant species are also maintained. Records are entered into the JNCC-administered Marine Recorder database for access via the National Biodiversity Network on-line gateway. 6.12.2 Crawfish Crawfish Palinurus elephas became a national Biodiversity Action Plan species in 2008, and is now an Environment Act (Wales) 2016, Section 7 species of principal importance. From 2009 to 2017 it was recorded in low numbers in Skomer MCZ by staff and volunteers. These records have been submitted to the recording scheme set up by Seasearch (www.seasearch.org.uk) in an effort to gain better knowledge of the current status of this species in the UK. 6.12.3 Sunfish Sunfish Mola mola is the largest bony fish in the world; they are an ocean vagrant that can be found in both tropical and temperate waters. They feed mainly on jellyfish so are found often when there are jellyfish blooms around the coast. Sunfish are often recorded in the Skomer MCZ in low numbers from July to September when seawater temperatures are around 15oC or warmer. Sunfish records are from both MCZ staff and from Dale Princess crew. Although they can grow up to 1000kg, those recorded are usually relatively small individuals. Some years several individuals have been spotted whilst in other years there have been no records.
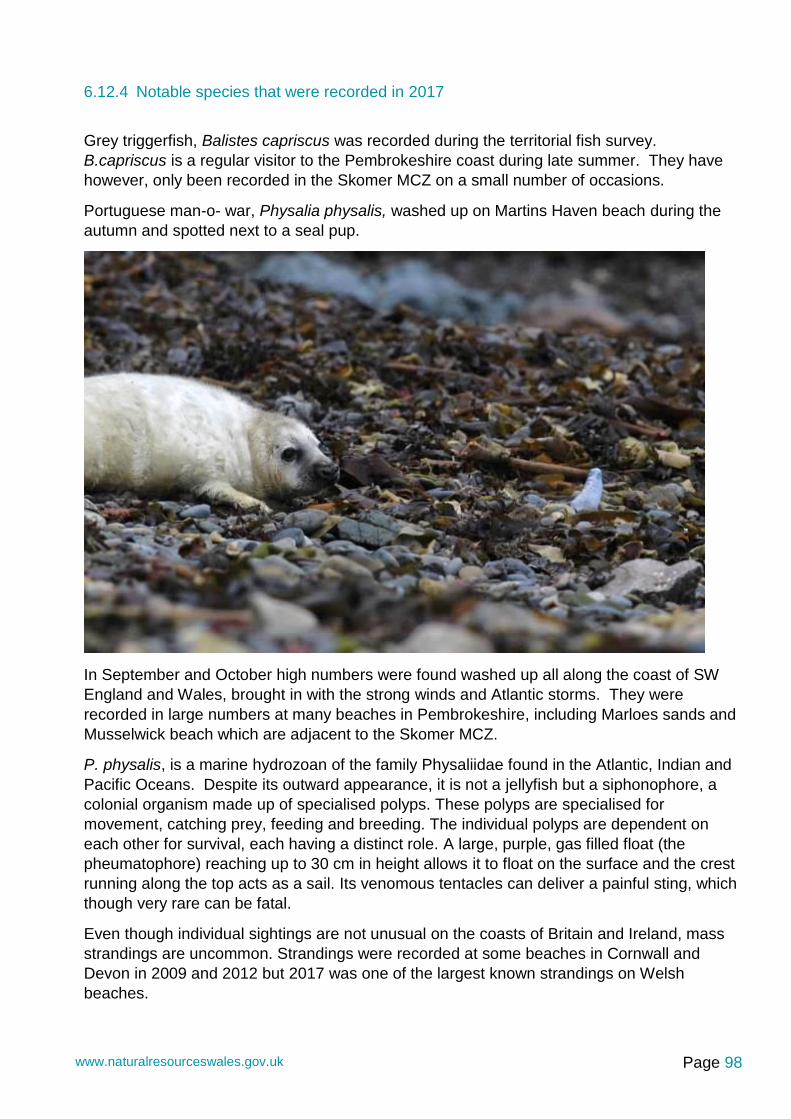
Page 98 www.naturalresourceswales.gov.uk
6.12.4 Notable species that were recorded in 2017
Grey triggerfish, Balistes capriscus was recorded during the territorial fish survey.
B.capriscus is a regular visitor to the Pembrokeshire coast during late summer. They have
however, only been recorded in the Skomer MCZ on a small number of occasions.
Portuguese man-o- war, Physalia physalis, washed up on Martins Haven beach during the
autumn and spotted next to a seal pup.
In September and October high numbers were found washed up all along the coast of SW
England and Wales, brought in with the strong winds and Atlantic storms. They were
recorded in large numbers at many beaches in Pembrokeshire, including Marloes sands and
Musselwick beach which are adjacent to the Skomer MCZ.
P. physalis, is a marine hydrozoan of the family Physaliidae found in the Atlantic, Indian and
Pacific Oceans. Despite its outward appearance, it is not a jellyfish but a siphonophore, a
colonial organism made up of specialised polyps. These polyps are specialised for
movement, catching prey, feeding and breeding. The individual polyps are dependent on
each other for survival, each having a distinct role. A large, purple, gas filled float (the
pheumatophore) reaching up to 30 cm in height allows it to float on the surface and the crest
running along the top acts as a sail. Its venomous tentacles can deliver a painful sting, which
though very rare can be fatal.
Even though individual sightings are not unusual on the coasts of Britain and Ireland, mass
strandings are uncommon. Strandings were recorded at some beaches in Cornwall and
Devon in 2009 and 2012 but 2017 was one of the largest known strandings on Welsh
beaches.

Page 99 www.naturalresourceswales.gov.uk
7. Skomer MCZ Meteorological and Oceanographic Project Summaries
Meteorological Data
CMS Code: RP 04/01
7.1.1. Project Rationale
The weather is an important factor that directly affects species / communities on the shore and in the sub-littoral. Climate change is by definition a change in long-term weather patterns so it is essential to have meteorological data for the site. Meteorological data is used to improve the interpretation of biological changes seen in monitoring projects by putting them into a climatic context. This application of Skomer MCZ data can also be made for Skomer Island NNR and Pembrokeshire Marine monitoring data.
7.1.2. Objectives To provide continuous meteorological data for the Skomer MCZ.
7.1.3. Sites Coastguard lookout station, Wooltack Point, Martins Haven. Grid Ref: SM 7588 0922 (LL 51.44.78N 005.14.78W)
7.1.4. Methods May 1993 to October 2005. A Fairmount EMS1200 weather station was mounted on the coastguard hut. The station included an anemometer, wind vane, air temperature and humidity sensors, shaded and un-shaded solarimeter, net radiometer, barometric pressure sensor and a tipping bucket rain gauge. The data was automatically downloaded to a computer in the Skomer MCZ office where it was stored. An uninterruptible power supply was used, but there were occasional problems with data dropout. April 2006 – current. A Campbell Scientific Environmental Change Network (ECN) compatible weather station with a CR1000 measurement and control system was installed. Hardware consists of: switching anemometer, potentiometer wind vane, temperature and relative humidity probe, 3 temperature probes (air, ground and below ground), tipping bucket rain gauge, pyranometer, net radiometer, water content reflectometers and barometric pressure sensor. The CR1000 is capable of storing the data internally, but as with the Fairmount weather station the data is automatically downloaded to a computer in the Skomer MCZ office using “Loggernet” software. The data is saved in three files: daily, hourly and 10 minute intervals. In January 2009 a rain collector and ammonia detector were added to the equipment suite. Monthly collections were made for precipitation chemistry and atmospheric ammonia concentration records. A GMS communicator has been added to the CR1000 allowing mobile telephone access to the data. This enabled the data to be automatically updated into an external website.

Page 100 www.naturalresourceswales.gov.uk
7.1.5. Project history relevant to data A continuous data set has been maintained since May 1993. However, there are some gaps due to equipment failure, these are: March 1994, January 1998 and from November 2005 to April 2006. The Fairmount weather station was already aging before it was replaced and the solarimeter, net radiometer and rain gauge readings were all unreliable during 2005. In 2010 the weather station and oceanographic buoy data were put onto a website where it could be viewed and downloaded. The ammonia tubes were discontinued in 2010 due to a lack of funding. In January 2012, the rain water chemistry sample was reduced to a 250ml sub-sample. In January 2014, the anemometer failed and there was no data from 2nd -13th Jan 2014. A new anemometer was installed on the 13th January 2014. The weather station was serviced by Campbell Scientific in 2012 and 2014. Between 2015 – 2017 there was no service contract in place but there were no problems with the station. In 2018 the weather station was serviced (see Appendix for report). The rain gauge had failed and the Pyranometer sensor was reading outside the required tolerance. These will have to be repaired in the 2018 season.
7.1.6. Results
Rainfall The rain gauge was not calibrated properly in 2009 and 2010 so a correction has been added to the records.
Figure 7.1.1 Skomer MCZ automatic weather station total rainfall (mm) data
There was some extreme weather in February 2014 with 100mph winds recorded on the 12th Feb 2014. The rain gauge recorded 199mm of rain for that day, but it is likely that this was a false reading and this has been removed from the data. The winds will have vibrated the rain

Page 101 www.naturalresourceswales.gov.uk
gauge causing it to “tip” when there was no water in the bucket. To prevent this happening in future the gauge was fixed more securely. However, during routine servicing in 2018 it was discovered that the rain gauge had stopped working during mid- March 2018. A new rain gauge is on order and should be functioning in April 2018. Wind speed and direction Extreme wind speeds can affect littoral and sublittoral habitats and communities by subjecting them to damaging levels of exposure. Changes in wind direction can also affect normally sheltered habitats
Figure 7.1.2 Skomer MCZ automatic weather station – average wind direction 1993 - 2017
A radar plot of frequency of wind direction shows that the prevailing winds come from the WSW and this has not changed over the period data has been gathered. The stronger winds (>34 Kts) are more bimodal in distribution with peaks from the SW and the NW.
0.00
2.00
4.00
6.00
8.00
10.00
12.00
14.00
16.00
18.00N
NNE
NEE
E
ESE
SSE
S
SSW
WSW
W
WNW
NNW
>22Kts
all wind
>34 Kts
40
50
60
70
80
90
100
1990 1992 1994 1996 1998 2000 2002 2004 2006 2008 2010 2012 2014 2016 2018 2020
Win
d s
peed (
Knots
)
Year

Page 102 www.naturalresourceswales.gov.uk
Figure 7.1.3 Skomer MCZ automatic weather station – maximum wind strength (knots) 1993 - 2017
The maximum gust recorded for 2008, 2009 and 2010 was exactly the same (75.28 knots). This led to the suspicion that the anemometer bearings were faulty. After the bearings were replaced in 2011 higher gusts were recorded; 2017 saw a maximum gust of 77.7 knots. In 2017 “Ex Hurricane Ophelia” and “Storm Brian” gave some very stormy conditions in October but they did not produce exceptional wind speeds. However, the ground swell was exceptional, especially during “Ophelia”. The closest wave recording device is situated at the entrance to Milford Haven and operated by Milford Haven Port Authority. (see http://www.stannsweather.org.uk/info.asp for details). At the Port Authority site a Vega Vegapuls 61 radar unit provides water level, wave height and wave period information installed at a height of 22 metres above chart datum. During “ex hurricane Ophelia” this device recorded wave heights of 16m. These peak heights coincided with high water (5.7m ACD) which would mean that the device was unable to record the true height of larger waves as they would have been breaking over the top on the device!
Figure 7.1.4 Graph showing wave height and period during “ex Hurricane Ophelia” 16th Oct 2017. Taken from http://www.stannsweather.org.uk/index.asp (Milford Haven Port Authority)
The swell from these 2 storms had a dramatic effect on the breeding seal population (see Section 7.10) and built infrastructure across all the Pembrokeshire Islands.
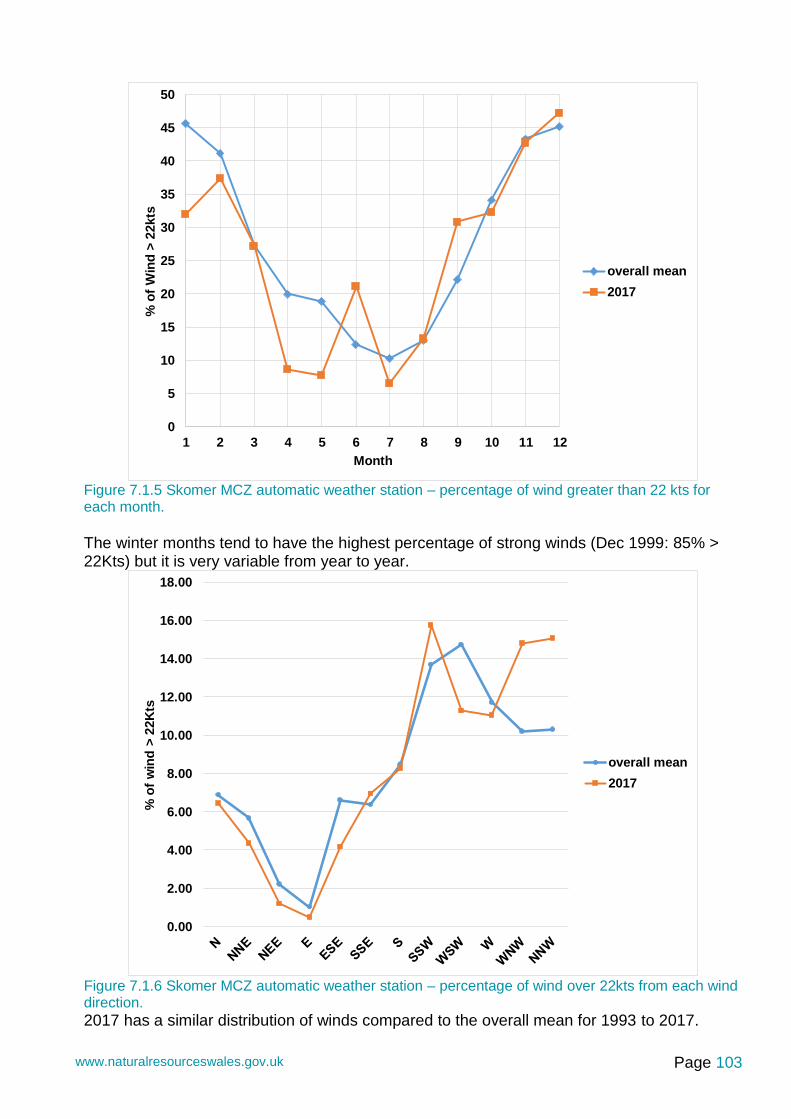
Page 103 www.naturalresourceswales.gov.uk
Figure 7.1.5 Skomer MCZ automatic weather station – percentage of wind greater than 22 kts for each month. The winter months tend to have the highest percentage of strong winds (Dec 1999: 85% > 22Kts) but it is very variable from year to year.
Figure 7.1.6 Skomer MCZ automatic weather station – percentage of wind over 22kts from each wind direction. 2017 has a similar distribution of winds compared to the overall mean for 1993 to 2017.
0
5
10
15
20
25
30
35
40
45
50
1 2 3 4 5 6 7 8 9 10 11 12
% o
f W
ind
> 2
2kts
Month
overall mean
2017
0.00
2.00
4.00
6.00
8.00
10.00
12.00
14.00
16.00
18.00
% o
f w
ind
> 2
2K
ts
overall mean
2017

Page 104 www.naturalresourceswales.gov.uk
Most of the stronger winds come from the SW, WSW and W. The east tends to have the lowest percentage of strong winds (Fig. 7.1.6). Another ecologically important measure of exposure is total annual wind, which is a measure of the energy that littoral and sublittoral habitats are subject to. The total amount of wind is calculated from the percentage of wind recorded in each year at each Beaufort force multiplied by the mid wind strength (knots) for that wind force. The windier the year the higher the “Total amount of wind”. The amount of wind recorded over 22 knots, less than 10 knots and in between 10 to 22 knots is then shown as a percentage. 2002 was the windiest year with 35% of all the wind greater than 22 knots. 2010 was the calmest year with only 17% of the wind stronger than 22 knots and 33% of the wind less than 10 knots Fig. 7.1.7).
Figure 7.1.7 Skomer MCZ automatic weather station – “total annual wind” 1993 to 2017.
0
500
1000
1500
2000
2500
0.00
10.00
20.00
30.00
40.00
50.00
60.00
Tota
l am
ount
of w
ind
Year
%>22 kts % < 10 kts 10 - 22 kts % Total wind

Page 105
Table 7.1.8 Skomer MCZ automatic weather station – 2017 annual meteorological summary
Summary table shown for information. Contact MCZ staff for more details.
Jan Feb Mar Apr May Jun Jul Aug Sep Oct Nov Dec
AIR TEMP MEAN 7.5 7.5 8.5 9.2 12.0 13.9 15.2 15.1 14.1 13.3 10.1 8.3
T107_1 0c MAX 11.5 11.3 14.1 16.0 22.8 23.3 24.4 21.2 17.0 20.7 14.5 12.7
MIN 0.8 0.3 3.3 1.9 5.9 9.1 12.0 11.6 8.7 6.3 3.6 1.3
BAROMETRIC PRESSUREMEAN 1015.3 1004.6 1006.4 1016.5 1008.6 1006.4 1007.0 1009.1 1005.6 1010.8 1010.0 1007.0
MAX 1031.0 1022.0 1028.0 1031.0 1021.0 1022.0 1019.0 1021.0 1019.0 1020.0 1024.0 1031.0
MIN 995.0 971.0 975.0 989.0 985.0 981.0 990.0 993.0 982.0 999.0 974.0 965.0
RELATIVE HUMIDITY MEAN 86.3 87.8 88.4 84.1 88.5 92.9 90.3 89.7 88.3 88.1 82.4 85.2
MAX 100.0 100.0 100.0 100.0 100.0 100.0 100.0 100.0 100.0 100.0 100.0 100.0
MIN 49.0 51.6 38.6 47.6 40.8 50.4 51.5 59.6 64.0 58.7 48.2 47.2
RAINFALL TOTAL(mm) 65.7 47.0 37.3 10.1 14.2 29.5 34.6 8.3 27.6 89.5 33.2 58.5
SUNSHINE MEAN(kw/m2) 0.0 0.1 0.1 0.2 0.2 0.2 0.2 0.2 0.1 0.1 0.0 0.0
sunshine hours 65.0 116.0 206.0 303.0 345.0 342.0 354.0 310.0 248.0 214.0 98.0 49.0
Sunshine hrs (10min) 62.2 114.3 205.0 301.7 341.7 340.3 347.0 304.5 242.7 205.7 94.8 46.5
NET RADIATION MEAN -10.2 3.5 28.1 72.3 87.0 105.7 108.3 82.5 48.2 17.6 -7.6 -12.2
MAX GUST m/s 31.7 37.9 37.1 22.5 22.1 30.0 29.2 26.7 39.2 40.0 35.4 38.3
direction 303.0 285.5 268.5 143.1 183.5 284.2 201.9 267.1 253.9 189.0 291.8 275.6
Knots 61.5 73.7 72.0 43.7 42.9 58.3 56.7 51.8 76.1 77.7 68.8 74.5
Days > F7 MEAN 1 2 0 0 0 0 0 0 0 2 1 5
Days > F7 Gust 16 21 20 8 6 12 6 11 22 23 24 21
days max hr av>F7 3 8 4 0 0 3 1 0 7 8 9 13
NotesNo maintenance service in 2017

Page 106
Figure 7.1.9 Skomer MCZ automatic weather station – monthly average air temperatures 1993 - 2017 with monthly min / max error bars:
0
5
10
15
20
25
30
Te
mp
era
ture
oC
Date

Page 107
Figure 7.1.10 Skomer MCZ automatic weather station – annual and seasonal mean air temperatures (oC) 2006 – onwards:
0.00
2.00
4.00
6.00
8.00
10.00
12.00
14.00
16.00
18.00
Mean T
em
pera
ture
Year / Season
Seasonal Annual

Page 108
Figure 7.1.11 Skomer MCZ automatic weather station – relative humidity 1993 - 2016:
The increasing trend in relative humidity from 1997 to 2005 may well be due to equipment error. From 2006 onwards there is no obvious trend.
0
20
40
60
80
100
120
Jan-9
3
Jan-9
4
Jan-9
5
Jan-9
6
Jan-9
7
Jan-9
8
Jan-9
9
Jan-0
0
Jan-0
1
Jan-0
2
Jan-0
3
Jan-0
4
Jan-0
5
Jan-0
6
Jan-0
7
Jan-0
8
Jan-0
9
Jan-1
0
Jan-1
1
Jan-1
2
Jan-1
3
Jan-1
4
Jan-1
5
Jan-1
6
Jan-1
7
Jan-1
8
Reative
Hum
idity
Mean
max
min

Page 109
Figure 7.1.12 Skomer MCZ automatic weather station – solar radiation (W/m2) and sunshine hours 1993 - 2017
There was an obvious change in the data when the weather station equipment was changed in 2006. This will be due to a change in the equipment type used.
-50.00
0.00
50.00
100.00
150.00
200.00
250.00
300.00
350.00
400.00
450.00
Apr-
93
Apr-
94
Apr-
95
Apr-
96
Apr-
97
Apr-
98
Apr-
99
Apr-
00
Apr-
01
Apr-
02
Apr-
03
Apr-
04
Apr-
05
Apr-
06
Apr-
07
Apr-
08
Apr-
09
Apr-
10
Apr-
11
Apr-
12
Apr-
13
Apr-
14
Apr-
15
Apr-
16
Apr-
17
Sunshine hrs Radiation

Page 110 www.naturalresourceswales.gov.uk
7.1.7. Current Status Skomer MCZ weather data demonstrates no significant anomalies other than those attributable to equipment changes or failures
7.1.8. Recommendations
• Keep meteorological equipment maintained and calibrated.
• Change the bearings in the anemometer every 2 years.
• Make Skomer MCZ meteorological data available via the internet.

Page 111 www.naturalresourceswales.gov.uk
Seawater Temperature Recording (CMS Code: RP64 / 01)
7.2.1. Project Rationale Temperature is one of the most important physical factors controlling the distribution of living creatures. Climate change has been highlighted as a potential threat to all ecosystems. Data collected at Skomer MCZ is relevant to the Pembrokeshire Marine SAC and potentially to the West Wales Marine cSAC for harbour porpoise.
7.2.2. Objectives
• To provide accurate seawater temperature records for near seabed, water column and shore sites.
• To record temperature as continuously as possible to produce an ongoing long-term data set for the site.
7.2.3. Sites
• Oceanographic Monitoring Site (LL 51.73913 N 5.26976 W).
• Shore sites: Martins Haven, South Haven;
• Non MCZ shore sites: West Angle, Jetty beach, Castle beach and Pembroke power station outfall
7.2.4. Methods
Ocean monitoring site
• Oceanographic Monitoring site (OMS): from 1992 onwards a Valeport series 600 MKII CTD probe. A drop down CTD probe used to take a depth profile of temperature at intervals: 1m, 5m, 10m, 15m below sea level and 2m above seabed. This is completed weekly during the field season (March to October).
• Vemco minilog is attached to a fixed steel frame on the seabed at 19m below chart datum (BCD). The logger maintains a record every hour and is retrieved every six months to download the data. Two loggers are used alternately at the site to allow uninterrupted data.
• 2007, YSI 6600 multi parameter sonde was attached to a fixed steel frame on the seabed (19m below chart datum). It recorded temperature along with salinity, turbidity, dissolved oxygen, chlorophyll and pressure (=depth). In 2008 the sonde was linked up to a telemetry buoy to provide live 10 minute readings. The data was sent via VHF to the coastguard look out hut and then onto the Skomer MCZ office via a fibre- optic link. 2010 the YSI sonde was repositioned onto the buoy. It recorded from 06.m below the water surface. The telemetry system was changed to a GSM system to allow remote updates to the ECN website. In Nov 2013 the data buoy was lost in a storm. A replacement logger (Onset watertemp pro v2) was deployed in Martins Haven for the 2013/14 winter period.
• 2014 the OMS site was re-established with a marker buoy and a logger attached at 1m below sea level.

Page 112 www.naturalresourceswales.gov.uk
Shore Sites
• 2007, Onset “Hobo” pendant loggers have been deployed at: Martins Haven and South Haven shores (lower, middle and upper shore).
• Loggers have been deployed at sites outside of the Skomer MCZ as follows: Dale Fort Field Centre: Jetty beach (mid shore) and Castle beach (mid shore). West Angle bay: upper shore rock pools. Pembroke Power station Outfall upper and middle shore.
7.2.5. Project history
Seabed temperature is not commonly measured in UK waters, sea surface temperatures being the most common records. Since July 1999 only 1 month of data is missing from the temperature logger record and since June 2001 there have been continuous hourly records for seabed temperature. By adding in the water profile records there is a fairly complete sea temperature record going back to 1992. This makes this dataset not only unusual, but highly important not only for putting MCZ/SAC monitoring into context, but also for other applications, including academic and fisheries research. Valeport series 600 MKII CTD probe water profile records: 1992 Jul – Nov 1999 May – Nov 2006 Mar – Oct 2013 Apr - Oct 1993 Jan – Dec 2000 Mar- Oct 2007 Apr – Oct 2014 Apr - Nov 1994 Feb – Dec 2001 May – Nov 2008 Apr – Dec 2015 Mar - Oct 1995 Jul – Dec 2002 May – Oct 2009 Feb – Oct 2016 Apr - Oct 1996 Mar – Dec 2003 Jun – Sept 2010 Mar – Nov 2017 Apr - Oct 1997 Aug – Dec 2004 May – Oct 2011 Mar – Nov 1998 Mar – Nov 2005 May – Oct 2012 Mar – Nov Vemco minilog seabed temperature logger deployment:
• Aug 1993 – Nov 1994
• Dec 1996 – Sept 1997
• Jul 1999 – Apr 2001
• Jun 2001 – 8th May 2002
• 30th May 2002 – ongoing
7.2.6. Results Oceanographic monitoring site:
Temperature oC 2000 2001 2002 2003 2004 2005 2006 2007 2008 2009 2010
Minimum 8.4 7.27 8.7 7.6 7.7 7.36 7.5 8.8 8.4 7 6.9
Maximum 16.27 16.3 15.6 17.1 16.76 16.4 16.3 16.3 16.3 16.8 16.8
Year 2011 2012 2013 2014 2015 2016 2017 2018
Minimum 7.6 8.0 6.98 8.14 7.8 8.5 8.3 6.6
Maximum 15.9 16.6 16.82 16.72 15.98 16.8 16.4
Table 7.2.1 Skomer MCZ maximum and minimum annual seabed temperatures 2000 – 2017 (19m BCD)
2009,2010and 2018 had very cold air temperatures in the winter and the seawater temperature also dropped to below 7 oC, the coldest recorded this decade. Seabed temperatures in 2012 were mild in the winter and average in the summer. 2013 had a cold April/ May with sea temperatures remaining -1oC below average. 2015’s

Page 113 www.naturalresourceswales.gov.uk
seawater temperatures were mild both in the winter and the summer. The winter of 2016 was very mild (the mildest December in the MCZ records). The winter for 2017 -2018 has recorded the lowest sea temperature for the last 18 years (6.6oC) with March temperatures 1oC below the average. A summary of the seabed temperature (data from Vemco minilog at 19m BCD) is shown in Figure 7.2.1. Monthly means have been calculated from seabed temperature but substituted with the CTD probe seabed temperature data where logger data was absent.
Figure 7.2.1 Skomer MCZ summary of monthly mean seabed temperature (19m BCD) 1992 - 2018
0.00
1.67
3.35
5.02
6.69
8.37
10.04
11.72
13.39
15.06
16.74
18.41
Tem
p (
oC
)
Date

Page 114 www.naturalresourceswales.gov.uk
Figure 7.2.2 Skomer MCZ summary of monthly mean sea surface temperature1985 – 2018
A summary of the sea surface temperature is shown in Figure 7.2.2. This is made up of:
• CEFAS data taken from North Haven, Skomer at high tide and only recorded when the Skomer warden was on site;
• Skomer MCZ drop down CTD probe data from a depth profile at intervals: 1m, 5m, 10m, 15m below sea level and 2m above seabed. Only 1m and 5m are used as sea surface temperature records;
• Mixture of data from shore loggers (when covered by the tide) and YSI 6600 sonde at the OMS site (Logger mean).
Comparing the overall monthly mean with the monthly mean for each year. By taking the mean for a specific month across the whole dataset (grand monthly mean) and comparing this with the same month’s mean for a specific year (specific monthly mean) the “monthly anomaly” can be calculated. Repeating this calculation for each month of each year in the dataset gives an indication of how cold or warm that particular month was compared to the whole data set (Figure 7.2.3).
4.00
6.00
8.00
10.00
12.00
14.00
16.00
18.00
Jan-8
5
Jan-8
6
Jan-8
7
Jan-8
8
Jan-8
9
Jan-9
0
Jan-9
1
Jan-9
2
Jan-9
3
Jan-9
4
Jan-9
5
Jan-9
6
Jan-9
7
Jan-9
8
Jan-9
9
Jan-0
0
Jan-0
1
Jan-0
2
Jan-0
3
Jan-0
4
Jan-0
5
Jan-0
6
Jan-0
7
Jan-0
8
Jan-0
9
Jan-1
0
Jan-1
1
Jan-1
2
Jan-1
3
Jan-1
4
Jan-1
5
Jan-1
6
Jan-1
7
Jan-1
8
logger mean CEFAS CTD
Tem
pera
ture
(oC
)
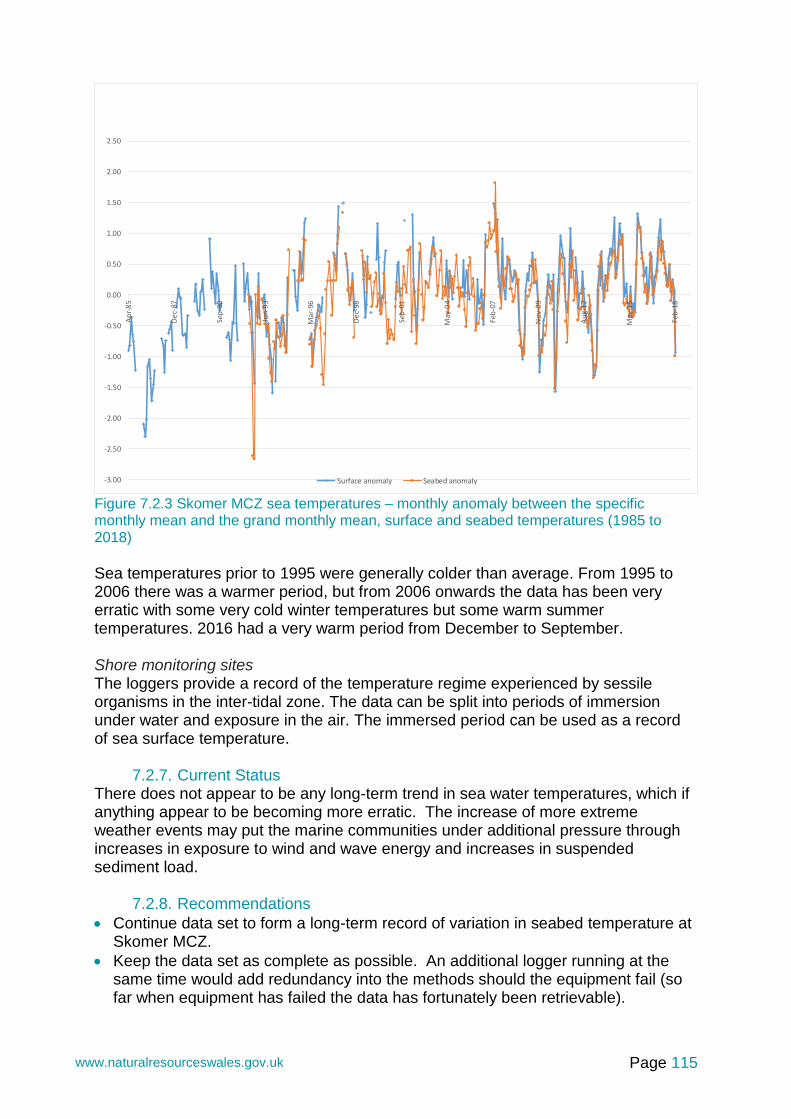
Page 115 www.naturalresourceswales.gov.uk
Figure 7.2.3 Skomer MCZ sea temperatures – monthly anomaly between the specific monthly mean and the grand monthly mean, surface and seabed temperatures (1985 to 2018)
Sea temperatures prior to 1995 were generally colder than average. From 1995 to 2006 there was a warmer period, but from 2006 onwards the data has been very erratic with some very cold winter temperatures but some warm summer temperatures. 2016 had a very warm period from December to September. Shore monitoring sites The loggers provide a record of the temperature regime experienced by sessile organisms in the inter-tidal zone. The data can be split into periods of immersion under water and exposure in the air. The immersed period can be used as a record of sea surface temperature.
7.2.7. Current Status There does not appear to be any long-term trend in sea water temperatures, which if anything appear to be becoming more erratic. The increase of more extreme weather events may put the marine communities under additional pressure through increases in exposure to wind and wave energy and increases in suspended sediment load.
7.2.8. Recommendations
• Continue data set to form a long-term record of variation in seabed temperature at Skomer MCZ.
• Keep the data set as complete as possible. An additional logger running at the same time would add redundancy into the methods should the equipment fail (so far when equipment has failed the data has fortunately been retrievable).
-3.00
-2.50
-2.00
-1.50
-1.00
-0.50
0.00
0.50
1.00
1.50
2.00
2.50
Ap
r-8
5
De
c-87
Sep
-90
Jun
-93
Mar
-96
De
c-98
Sep
-01
May
-04
Feb
-07
No
v-0
9
Au
g-1
2
May
-15
Feb
-18
Surface anomaly Seabed anomaly
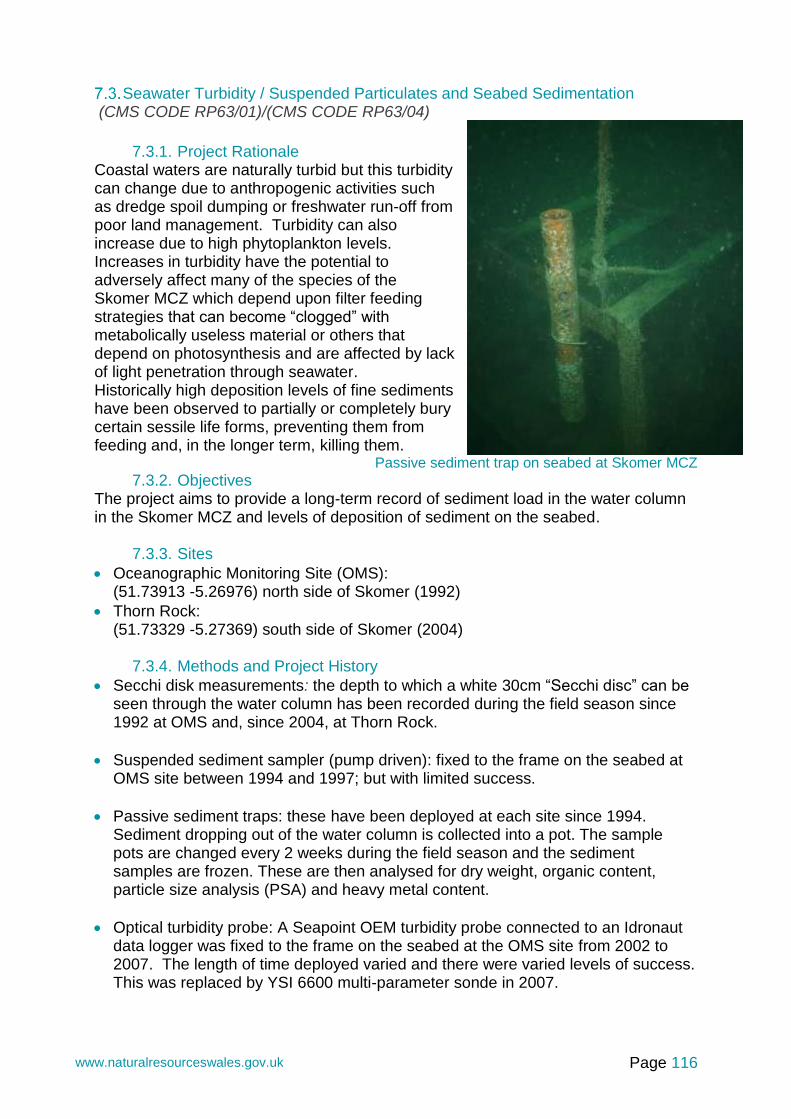
Page 116 www.naturalresourceswales.gov.uk
Seawater Turbidity / Suspended Particulates and Seabed Sedimentation (CMS CODE RP63/01)/(CMS CODE RP63/04)
7.3.1. Project Rationale
Coastal waters are naturally turbid but this turbidity can change due to anthropogenic activities such as dredge spoil dumping or freshwater run-off from poor land management. Turbidity can also increase due to high phytoplankton levels. Increases in turbidity have the potential to adversely affect many of the species of the Skomer MCZ which depend upon filter feeding strategies that can become “clogged” with metabolically useless material or others that depend on photosynthesis and are affected by lack of light penetration through seawater. Historically high deposition levels of fine sediments have been observed to partially or completely bury certain sessile life forms, preventing them from feeding and, in the longer term, killing them.
Passive sediment trap on seabed at Skomer MCZ
7.3.2. Objectives The project aims to provide a long-term record of sediment load in the water column in the Skomer MCZ and levels of deposition of sediment on the seabed.
7.3.3. Sites
• Oceanographic Monitoring Site (OMS): (51.73913 -5.26976) north side of Skomer (1992)
• Thorn Rock: (51.73329 -5.27369) south side of Skomer (2004)
7.3.4. Methods and Project History
• Secchi disk measurements: the depth to which a white 30cm “Secchi disc” can be seen through the water column has been recorded during the field season since 1992 at OMS and, since 2004, at Thorn Rock.
• Suspended sediment sampler (pump driven): fixed to the frame on the seabed at OMS site between 1994 and 1997; but with limited success.
• Passive sediment traps: these have been deployed at each site since 1994. Sediment dropping out of the water column is collected into a pot. The sample pots are changed every 2 weeks during the field season and the sediment samples are frozen. These are then analysed for dry weight, organic content, particle size analysis (PSA) and heavy metal content.
• Optical turbidity probe: A Seapoint OEM turbidity probe connected to an Idronaut data logger was fixed to the frame on the seabed at the OMS site from 2002 to 2007. The length of time deployed varied and there were varied levels of success. This was replaced by YSI 6600 multi-parameter sonde in 2007.

Page 117 www.naturalresourceswales.gov.uk
• YSI 6600 multi-parameter sonde was fixed to the frame on the seabed at the OMS site in 2007. The sonde includes an optical turbidity probe. This has been deployed several times to date and again, with varying levels of success. From 2010 onwards the YSI sonde was repositioned to a surface mounting on the OMS buoy taking readings 0.6m below the surface. This was discontinued in 2013.
Year Months with samples
Sites Notes
1994 Jul – Dec OMS & TRK
1995 Jan – Dec OMS & TRK
1996 Feb – Dec OMS & TRK
1997 Mar – Dec OMS & TRK
1998 Mar – Sep OMS & TRK
1999- 2001 No samples Re-established 02 Nov 2001
2002 Mar – Nov OMS & TRK TRK site damaged
2003 May – Sep OMS only
2004 May – Sep OMS only
2005 Jun- Oct OMS only Collector damaged
2006 Jun - Oct OMS & TRK Repaired and TRK re-established
2007 May - Sep OMS & TRK
2008 May - Sep OMS & TRK
2009 Apr - Sep OMS & TRK Shell fragments in samples.
2010 Apr - Sep OMS & TRK
2011 Apr - Nov OMS & TRK
2012 Apr - Sep OMS & TRK
2013 Apr - Oct OMS & TRK New Lab used
2014 Apr - Oct OMS & TRK
2015 Apr - Oct OMS & TRK
2016 Apr - Oct OMS & TRK
2017 Apr - Oct OMS & TRK Table 7.3.1 Skomer MCZ sediment trap sampling effort from 1994 to 2017 at OMS and Thorn rock (TRK).
7.3.5. Results Turbidity Secchi disc: Measurements have been taken with reasonable consistently for the months of May to October since 1992. The mean monthly Secchi disc readings for
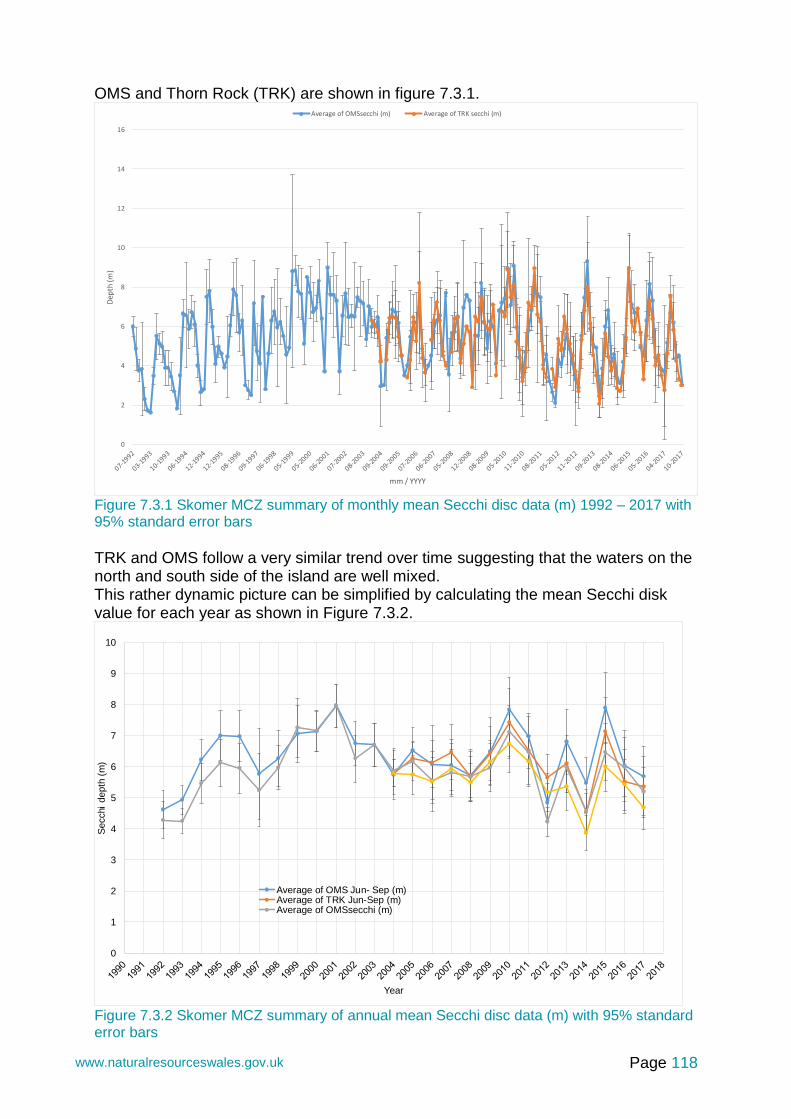
Page 118 www.naturalresourceswales.gov.uk
OMS and Thorn Rock (TRK) are shown in figure 7.3.1.
Figure 7.3.1 Skomer MCZ summary of monthly mean Secchi disc data (m) 1992 – 2017 with 95% standard error bars
TRK and OMS follow a very similar trend over time suggesting that the waters on the north and south side of the island are well mixed. This rather dynamic picture can be simplified by calculating the mean Secchi disk value for each year as shown in Figure 7.3.2.
Figure 7.3.2 Skomer MCZ summary of annual mean Secchi disc data (m) with 95% standard error bars
0
2
4
6
8
10
12
14
16
Dep
th (m
)
mm / YYYY
Average of OMSsecchi (m) Average of TRK secchi (m)
0
1
2
3
4
5
6
7
8
9
10
Secchi
depth
(m
)
Year
Average of OMS Jun- Sep (m)Average of TRK Jun-Sep (m)Average of OMSsecchi (m)

Page 119 www.naturalresourceswales.gov.uk
The Secchi disc readings for Thorn Rock in 2014 are the lowest in the MCZ records. There were very high levels of silt deposited on the south side of the MCZ during the winter storms and it is thought that this silt was continually being re-suspended into the water column throughout the year. In 2015 and 2016 the readings have returned towards average levels but in 2017 there was a drop in water clarity at both OMS and TRK. Seabed sedimentation Passive sediment traps The samples from the sediment traps were analysed for: dry weight, organic content, particle size analysis (PSA) and metal content.
Table 7.3.2 Skomer MCZ sediment trap sample analysis - OMS site
Table 7.3.3 Skomer MCZ sediment trap sample analysis - TRK site
OMS g/day oms % organic content % gravel % sand % mud
1995 2.17 9.33 7.37 18.56 74.07
1996 2.16 9.95 0.40 17.08 82.52
1997 1.69 9.64 0.18 20.43 79.40
1998 1.25 9.24 5.08 42.73 52.19
2002 1.05 7.91 0.17 73.51 26.32
2003 1.29 8.14 0.37 79.54 20.09
2004 1.91 7.90 0.00 75.27 24.72
2005 2.20 8.80 0.00 76.86 23.14
2006 2.33 8.79 0.00 76.80 23.21
2007 2.94 7.05 0.00 74.93 25.07
2008 0.56 7.34 0.00 81.48 18.23
2009 0.68 8.90 0.00 47.27 52.73
2010 1.75 7.66 4.93 77.99 16.88
2011 1.26 9.73 4.36 60.54 30.81
2012 2.00 7.87 9.12 45.39 45.14
2013 1.01 13.79 26.48 32.25 41.30
2014 2.46 13.57 10.55 48.65 40.11
2015 2.61 13.80 25.94 43.63 30.34
2016 0.79 12.38 5.54 53.42 29.51
2017 1.36 11.72 2.99 49.45 40.50
TRK g/day trk % organic content % gravel % sand % mud
1994 3.32 9.80 0.10 16.83 83.07
1995 5.76 8.59 0.41 55.76 43.83
1996 3.53 9.90 0.21 22.56 77.23
1997 5.81 9.43
1998 4.15 10.25 0.23 23.89 75.89
2002 2.44 7.61 0.00 61.63 38.36
2006 1.74 8.65 0.00 60.35 39.65
2007 1.54 7.73 0.00 69.81 30.19
2008 1.91 7.13 0.00 78.39 21.23
2009 1.78 8.66 0.00 44.06 55.94
2010 2.73 7.70 3.66 79.47 16.67
2011 1.51 9.31 2.73 68.80 24.61
2012 2.96 7.55 1.43 41.12 57.08
2013 2.53 15.34 3.14 35.04 61.86
2014 2.67 13.33 0.18 31.04 68.77
2015 3.26 11.18 2.23 51.32 46.47
2016 2.01 10.85 1.07 51.33 45.21
2017 2.48 11.12 0.47 39.20 56.07

Page 120 www.naturalresourceswales.gov.uk
The samples from 2002 to 2012 were analysed by British Geological Society (BGS). In 2013 the sediment samples were sent to the NRW Llanelli laboratories for analysis, using a different set of analysis tools / machines to BGS. Another change in 2013 was that the organic content analysis included heating the sample to 550oC rather than 450oC resulting in more carbonates being included in the % organic content. This explains the sudden rise in the 2013 values. The ignition temperature used from 2014 onwards at the NRW laboratories is 480oC. The NRW laboratories carry out a slightly different suit of metals analysis, but it is more comprehensive: cobalt and antimony are not done but manganese, mercury, lithium, aluminium, barium, tin and iron are all now added to the metal analysis. The methodology for quantifying the coarse (gravel) element of the PSA has also changed. PSA for the sand fraction for 1995 to 1998 is estimated and the 2009 PSA results have been adjusted to remove the effect of large amounts shell fragments contaminating the samples.
Figure 7.3.3 Skomer MCZ sediment trap sample total sediment, PSA and organic content analysis – both sites combined
General trends: 1994 to1998 samples were characterised by higher mud content to sand content. 2002 to 2008 samples had higher sand content to mud content and a reduced overall sedimentation rate overall, whereas from 2009 the trend has reverted to higher mud content and higher levels of gravel.
0.00
0.50
1.00
1.50
2.00
2.50
3.00
3.50
4.00
4.50
0.00
10.00
20.00
30.00
40.00
50.00
60.00
70.00
80.00
90.00
1994 1995 1996 1997 1998 2002 2003 2004 2005 2006 2007 2008 2009 2010 2011 2012 2013 2014 2015 2016 2017
ALL SITES COMBINED
% organic content % gravel % sand % mud g/day
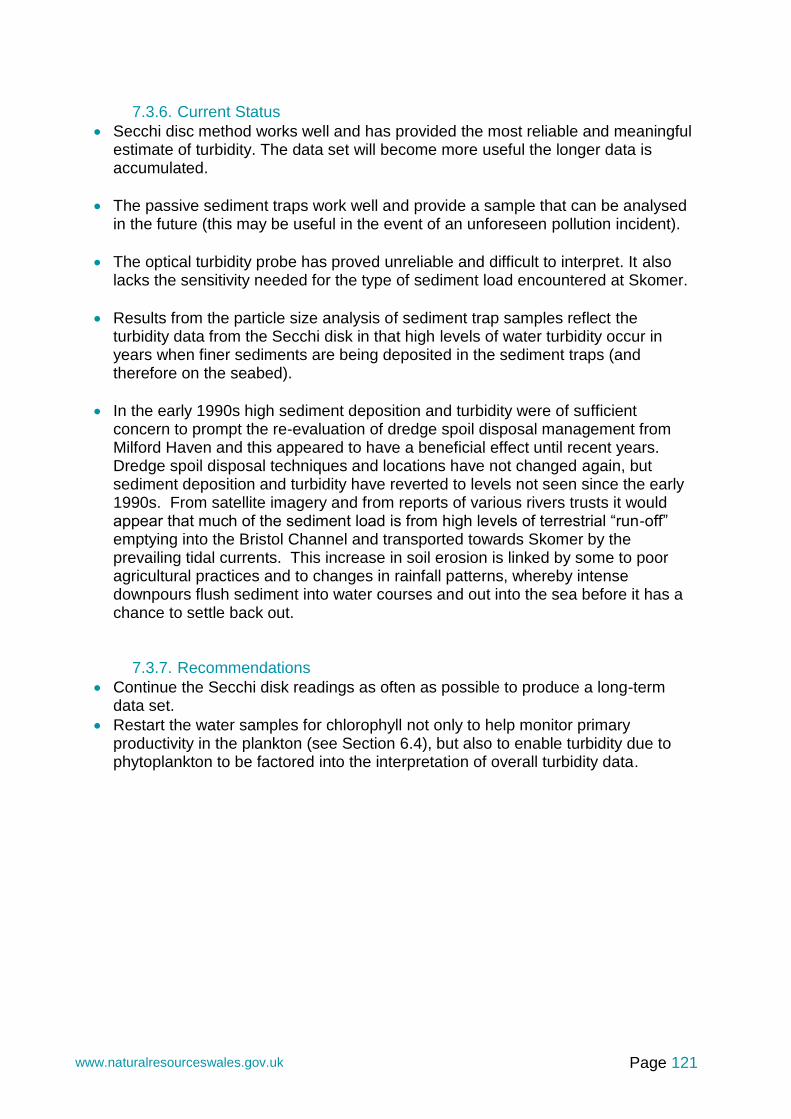
Page 121 www.naturalresourceswales.gov.uk
7.3.6. Current Status
• Secchi disc method works well and has provided the most reliable and meaningful estimate of turbidity. The data set will become more useful the longer data is accumulated.
• The passive sediment traps work well and provide a sample that can be analysed in the future (this may be useful in the event of an unforeseen pollution incident).
• The optical turbidity probe has proved unreliable and difficult to interpret. It also lacks the sensitivity needed for the type of sediment load encountered at Skomer.
• Results from the particle size analysis of sediment trap samples reflect the turbidity data from the Secchi disk in that high levels of water turbidity occur in years when finer sediments are being deposited in the sediment traps (and therefore on the seabed).
• In the early 1990s high sediment deposition and turbidity were of sufficient concern to prompt the re-evaluation of dredge spoil disposal management from Milford Haven and this appeared to have a beneficial effect until recent years. Dredge spoil disposal techniques and locations have not changed again, but sediment deposition and turbidity have reverted to levels not seen since the early 1990s. From satellite imagery and from reports of various rivers trusts it would appear that much of the sediment load is from high levels of terrestrial “run-off” emptying into the Bristol Channel and transported towards Skomer by the prevailing tidal currents. This increase in soil erosion is linked by some to poor agricultural practices and to changes in rainfall patterns, whereby intense downpours flush sediment into water courses and out into the sea before it has a chance to settle back out.
7.3.7. Recommendations
• Continue the Secchi disk readings as often as possible to produce a long-term data set.
• Restart the water samples for chlorophyll not only to help monitor primary productivity in the plankton (see Section 6.4), but also to enable turbidity due to phytoplankton to be factored into the interpretation of overall turbidity data.

Page 122 www.naturalresourceswales.gov.uk
8. Skomer Bibliography
Adams, E. J. (1979) A littoral survey of the flora and fauna of the North and South Havens, Skomer Island. Undergraduate dissertation, Swansea. Alexander, M. (2005). The CMS Management Planning Guide. CMS Consortium, Talgarth, Wales, UK. (www.esdm.co.uk/cms). Alexander, M (2015) Skomer MCZ and Skomer Island seal management plan. Ayling, A. L. (1983). Growth and regeneration rates in thinly encrusting Demospongiae from temperate waters. Biological Bulletin 165: 343-352. Baines, M. E. (1992) The West Wales grey seal census. Interim report on the 1991 survey. Dyfed Wildlife Trust. Baines, M. E. (1993) The West Wales grey seal census. Interim report on the 1992 season. Dyfed Wildlife Trust. Baines, M. E., Earl, S.J. & Strong, P.G. (1994) The West Wales grey seal census. Interim report on the 1993 season. Dyfed Wildlife Trust. Baines, M.E., Earl S.J., Pierpoint, C.J.L & Poole, J. (1995) The West Wales grey seal census. CCW Contract Science Report no. 131. Barfield, P. (CORDAH) (1998) Skomer MNR: A repeat survey of the sublittoral macrobenthos. CCW 009/1998 Barfield, P. Sea Nature studies (2004) Skomer MNR: A repeat survey of the sublittoral macrobenthos 2003. CCW West Area Report 28 Barfield, P. Sea Nature studies (2008) Skomer MNR: A repeat survey of the sublittoral macrobenthos 2007. CCW Regional report CCW/WW/08/ Barfield, P. (EMU) (2010) Skomer MNR: A repeat survey of the sublittoral macrobenthos 2009. A Report for CCW. Bell, J.J & Barnes, D.K.A., (2001) Sponge morphological diversity: a qualitative predictor of species diversity? Aquatic Conserv: Mar. Freshw. Ecosyst. 11: 109-121 (2001). Bell J.J & Barnes D.K.A. (2002) Modelling sponge species diversity using a morphological predictor: a tropical test of a temperate model. J.Nat. Conserv. 10: 41-50 (2002). Bell J.J, Burton M., Bullimore B., Newman P. & Lock K. (2006) Morphological monitoring of sub-tidal sponge assemblages. Marine Ecological Progress Series. Vol 311: 79 – 91 Berman J, Burton M, Gibbs R, Lock K, Newman P, Jones J and Bell J. (2013) Testing the suitability of a morphological monitoring approach for identifying

Page 123 www.naturalresourceswales.gov.uk
Temporal variability in a temperate sponge assemblage. Journal of Nature Conservation. Vol 21, 2013 No.3. Bettridge, M. (2003) Visitor disturbance on the Atlantic Grey Seal Halichoerus grypus during the pupping season, Pebbly beach, Skomer Marine Nature Reserve. HND 2nd year project, Pembrokeshire College. Bishop, G.M. (1982) A survey of the edible sea urchin Echinus esculentus in the Skomer Marine Nature Reserve. Underwater Conservation Society. 10pp. Boyle, D.P. (2001) Grey seal breeding census: Skomer Island 2001. CCW Report no. 507. Boyle, D.P. (2009) Grey seal breeding census: Skomer Island 2008. CCW Regional Report CCW/WW/09/1. Boyle, D.P. (2010) Grey Seal Breeding Census: Skomer Island, 2010. Wildlife Trust of South and West Wales CCW Regional Report CCW/WW/10/07 Boyle, D.P. (2011) Grey Seal Breeding Census: Skomer Island, 2011. Wildlife Trust of South and West Wales CCW Regional Report CCW/WW/11/01 Boyle, D.P. (2012) Grey Seal Breeding Census: Skomer Island, 2012. Wildlife Trust of South and West Wales CCW Regional Report CCW/WW/13/01 Brodie, J. & Watson, D. (1999) Skomer MNR community and species monitoring: algal communities. Advice on conservation objectives. CCW report no. 334 Brodie, J & Bunker, F. (2000) Skomer MNR community and species monitoring: algal communities. CCW report 387 Brown, A. (2001) Habitat Monitoring for Conservation Management and Reporting. 3: Technical Guide. Life – Nature project No LIFE95 NAT/UK/000821. Buche, B & Stubbings E. (2013) Grey Seal Breeding Census: Skomer Island, 2013. Wildlife Trust of South and West Wales. NRW report. Buche, B & Stubbings E. (2014) Grey Seal Breeding Census: Skomer Island, 2014. Wildlife Trust of South and West Wales. NRW Evidence Report No.65. Buche, B & Stubbings E. (2015) Grey Seal Breeding Census: Skomer Island, 2015 Wildlife Trust of South and West Wales. NRW Evidence Report No.147. Buche, B & Stubbings E. (2016) Grey Seal Breeding Census: Skomer Island, 2016 Wildlife Trust of South and West Wales. NRW Evidence Report No.194. Buche, B & Stubbings E. (2017) Grey Seal Breeding Census: Skomer Island, 2017 Wildlife Trust of South and West Wales. NRW Evidence Report No.252. Bull JC, Börger L, Banga R, Franconi N, Lock KM, Morris CW, Newman PB, Stringell TB. (2017a). Temporal trends and phenology in grey seal (Halichoerus grypus) pup counts at Marloes Peninsula, Wales. NRW Evidence Report No: 155, 23pp, Natural Resources Wales, Bangor.

Page 124 www.naturalresourceswales.gov.uk
Bull JC, Börger L, Franconi N, Banga R, Lock KM, Morris CW, Newman PB, Stringell TB. (2017b). Temporal trends and phenology in grey seal (Halichoerus grypus) pup counts at Skomer, Wales. NRW Evidence Report No: 217, 23pp, Natural Resources Wales, Bangor. Bullimore, B. (1983) Skomer Marine Reserve subtidal monitoring project, 1982-83. Bullimore, B. (1983, 1986) Photographic monitoring of subtidal epibenthic communities on Skomer Marine Reserve, 1984-85. SMRSMP Report No 5 Bullimore, B. (1983, 1986, 1987) Photographic monitoring of subtidal epibenthic communities on Skomer Marine Reserve, 1986. SMRSMP Report No 6 Bullimore, B. (1985) Diving survey of scallop stocks around SW Wales. Bullimore, B., Newman, P., Kaiser, M., Gilbert, S. & Lock. K. (1999) A study of catches in a fleet of ‘ghost fishing’ pots. Fishery bulletin 99 (2). Bullimore, R & Foggo, A. 2010. Assessing the effects of recreational fishing upon fish assemblages in a temperate Marine Nature Reserve with remote underwater video Marine Biology and Ecology Research Centre, University of Plymouth. Bunker, F. et al. (1982) Skomer MNR littoral survey 1982 Vol 1 /2 FSC report FSC/(ofc) /3/83 Bunker, F.StP.D., Iball, K. & Crump, R. (1983) Skomer Marine Reserve, littoral survey, July to September 1982. Bunker, F.StP.D. (1983) Studies on the macrofauna and sediments of a bed of Zostera marina (L) in North Haven, Skomer. Bunker, F. & Hiscock, S. (1987) Sublittoral habitats, communities and species around Skomer Marine Reserve- a review. FSC/(OFC)/1/87 Bunker, F. & Hiscock, S. (1984) Surveys of sublittoral habitats and communities around Skomer Marine Reserve, 1983.FSC/(OFC)/1/84 Bunker, F.StP.D. & Hiscock, S. (1985) Surveys of sublittoral habitats & communities around Skomer Marine Reserve in 1984. FSC / (OFC)/ 2/85 Bunker, F.StP.D. (1986) A survey of the broad sea fan Eunicella verrucosa around Skomer Island Marine Reserve in 1985 FSC report No FSC/(ofc)/ 1/86 Bunker, F. and Mercer, T. (1988) A survey of the ross coral Pentapora foliacea around Skomer Marine Reserve in 1986 (together with data concerning previously unsurveyed or poorly documented areas).FSC report fsc/(ofc)/1/88. Bunker, F., Picton, B. & Morrow, C. (1992) New information on species and habitats in SMNR and other sites off the Pembrokeshire coast.

Page 125 www.naturalresourceswales.gov.uk
Bunker, F & Jones J. (2008) Sponge monitoring Studies at Thorn Rock, Skomer Marine Nature Reserve in autumn 2007. CCW regional report CCW/WW/08/7 Burrows M.T. (2016). Analysis of long-term trends in the SOTEAG rocky shore monitoring programme: responses to climate change 1976-2014. A report to SOTEAG by SAMS. Burrows, M.T., & Mieszkowska, N. (In preparation) Development of an MSFD intertidal rocky shore indicator for climate change response and an interim assessment of UK shores. Scottish Natural Heritage Commissioned Report. Burton, M. (2002) Summary of commercial potting activities in the Skomer MNR 1989 - 2002. CCW West Area Report No 19 Burton, M., Lock, K. & Newman, P.(2002) Skomer Marine Nature Reserve Monitoring Method Development. Yellow Trumpet Anemone Parazoanthus axinellae. CCW West Area Report 14. Burton, M., Lock, K. Luddington, L. & Newman, P. (2004) Skomer Marine Nature Reserve Project Status Report 2003/4. CCW West Area Report 29. Burton, M., Lock, K. Ludington L. & Newman, P. (2005) Skomer Marine Nature Reserve Project Status Report 2004/5. CCW Regional Report CCW/WW/04/5 Burton, M., Lock, K. Gibbs, R & Newman, P. (2007) Skomer Marine Nature Reserve Project Status Report 2006/07. CCW Regional Report CCW/WW/08/3. Burton, M., Lock, K. & Newman, P (2010). Skomer Marine Nature Reserve. Distribution and Abundance of Zostera marina in North Haven 2010. CCW Regional Report CCW/WW/10/10 Burton, M., Lock, K. Gibbs, R & Newman, P. (2011) Skomer Marine Nature Reserve Project Status Report. CCW Regional Report CCW/WW/10/8. Burton, M., Lock, K. Jones, J & Newman, P. (2014) Skomer Marine Nature Reserve Project Status Report 2013/14. NRW Evidence Report. Burton, M., Clabburn, P., Griffiths, J., Lock, K., Newman, P. (2015). Skomer Marine Conservation Zone. Distribution & Abundance of Zostera marina in North Haven 2014. NRW Evidence Report No.69. Burton M., Lock, K., Newman, P & Jones, J. (2016) Skomer Marine Conservation Zone Project Status Report 2015/16. NRW Evidence Report No. 148. Burton M., Lock, K., Newman, P & Jones, J. (2016) Skomer Marine Conservation Zone Distribution and abundance of Echinus esculentus and selected starfish species 2015. NRW Evidence Report No. 158. Burton, M., Lock, K., Newman, P. & Jones, J. Skomer MCZ Scallop Report 2016. NRW Evidence Report No: 196.

Page 126 www.naturalresourceswales.gov.uk
Butler, P.G.; Wanamaker, A.D.; Scourse, J.D.; Richardson, C.A.; Reynolds, D.J. (2013). Variability of marine climate on the North Icelandic Shelf in a 1357-year proxy archive based on growth increments in the bivalve Arctica islandica. Palaeogeography, Palaeoclimatology, Palaeoecology. 373: 141–151. Chauvaud, L., Patry, Y., Jolivet, A., Cam, E., Le Goff, C., et al. (2012) Variation in Size and Growth of the Great Scallop Pecten maximus along a Latitudinal
Gradient. PLoS ONE 7(5): e37717. doi:10.1371/journal.pone.0037717 Clarke, K.R. & Warwick, R.M. (2001) Changes in marine communities: and approach to statistical analysis and interpretation, 2nd Edition. PRIMER-E: Plymouth. Coutts, E (2006) Bull dominance behaviour patterns for the Grey seal, Halichoerus grypus, at South Haven, Skomer Island 2005. BSc dissertation, Pembrokeshire College. Crump, R. (1993) Skomer Marine Nature Reserve littoral monitoring project (permanent quadrats) CCW report FC 73 01 27 Crump, R. (1996) Skomer Marine Nature Reserve littoral monitoring project (permanent quadrats) Post Sea Empress oil spill. FC 73-02-48F Crump, R.G. & Burton, M (2004) Skomer MNR littoral monitoring: development of methods. CCW West Area Report 27. Devictor, V., C. van Swaay, T. Brereton, L. S. Brotons, D. Chamberlain, J. Heliölä, S. Herrando, R. Julliard, M. Kuussaari, Å. Lindström, J. Reif, D. B. Roy, O. Schweiger, J. Settele, C. Stefanescu, A. Van Strien, C. Van Turnhout, Z. Vermouzek, M. Wallis DeVries, I. Wynhoff, F. Jiguet. (2012). Differences in the climatic debts of birds and butterflies at a continental scale. Nature Climate Change, 2, 121. Duffield, S. E. (2003) Grey seal breeding census: Skomer Island 2002. Wildlife trust of South and West Wales CCW report no 555 Earl, R.C. (1979) A survey of the edible urchin, Echinus esculentus in the Skomer Marine Reserve. 9 pp. Edwards, E. Bunker, F. Maggs, C.A. & Johnson, M.P. (2003) Biodiversity within eelgrass (Zostera marina) beds on the Welsh coast: analysis of epiflora and recommendations for conservation. Eno, C., NacDonald, D., Kinnear, J., Amos, S., Chapman, C., Bunker, F & Munro, C (2001). Effect of crustacean traps on benthic fauna. ICES Jo7urnal of Marine Science 58:11-20. Field, R. (2000) Grey seal breeding census: Skomer Island 1999. Wildlife Trust West Wales, CCW report no. 388. Fothergill, B (2004) A comparison of the effectiveness of two surveying techniques for obtaining population information of economically important crustaceans within the Skomer Marine Nature Reserve. Undergraduate project. Institute of Marine Studies, University of Plymouth.

Page 127 www.naturalresourceswales.gov.uk
Furby, G.L. (2003) Eunicella verrucosa: A study of biology, conservation and growth rates. Under graduate project, University of Cardiff. No 000521837. Gibbs, R (2007) Summary of work on Pentapora foliacea at Skomer Marine Nature Reserve Autumn 2006. CCW Regional Report CCW/WW/07/1. Gilbert, S. (1998) Skomer MNR monitoring field data analysis. summary report. Sea Empress contract FC 73-02-84 Garrabou J. (1999) Life history traits of Alcyonium acule and Parazoanthus axinellae, with emphasis on growth. Marine Ecological Progress Series, vol 178. pp 193-204. Hiscock, K. (1980) SWBSS field survey of sublittoral habitats and species in West Pembrokeshire (Grassholm, Skomer and Marloes Peninsula), 1977-79. Hiscock, K. (1983) Sublittoral surveys in the region of the Skomer Marine Nature Reserve, 1982. FSC/(OPRU)/5/83 Hiscock, K. (1990) Marine Nature Conservation Review: Methods. Nature Conservancy Council, CSD Report No. 1072. Marine Nature Conservation Review Occasional Report MNCR/OR/05. Peterborough: Nature Conservancy Council. Hiscock, K. (1998) Biological monitoring of marine S.A.C.’s: a review of methods for detecting change. JNCC Report No 284 Procedural guideline 6-2. Hiscock, S. (1983) Skomer Marine Reserve Seaweed Survey 1982 FSC report fsc/(ofc)/2/83 Hiscock, S. (1986) Skomer Marine Reserve Subtidal Monitoring Project: Algal results August 1984 to February 1986. SMRSMP report No4 Holland, L (2013) Genetic assessment of connectivity in the temperate octocorals Eunicella verrucosa and Alcyonium digitatum in the North East Atlantic. PhD thesis, University of Exeter. Hudson, K. (1996) Changes in rocky shore communities on Skomer Island between 1992 and 1995. Hughes, R.N. Cancino, J.N. (1985). An ecological overview of cloning in metazoa. In Jackson JBC, Buss LW, Cook RE (eds) Population biology and evolution of colonial organisms. Yale University Press, New Haven 9 153-186. Hunnam, P., J.(1976) Description of the sublittoral habitats and associated biota within the Skomer MNR. Isojunno, S (2008). Temporal habitat use of the harbour porpoise around Skomer and Skokholm islands. CCW Species challenge project report. Jackson J.B.C. (1977) Competition on marine hard substrata; adaptive significance of solitary and colonial strategies. Am. Nat. vol 3, pp 743 – 767.

Page 128 www.naturalresourceswales.gov.uk
Jones, H. (1990) Survey of scallops of the Skomer MNR. University of Manchester, Underwater Conservation Society. Jones, B., Jones, J. & Bunker, F. (1983) Monitoring the distribution and abundance of Zostera marina in North Haven Skomer. Skomer MNR report vol 3 FSC report No FC73-01-168 Jones, J., Bunker, F., Newman, P., Burton, M. & Lock, K. (2012). Sponge diversity of Skomer Marine Nature Reserve. CCW Regional Report CCW/WW/12/3 Jones, J., Burton, M., Lock, K & Newman, P. (2016). Skomer Marine Conservation Zone Sponge Diversity Survey 2015. NRW Evidence Report No.159. Lindenbaum, C., Sanderson, W.G., Holt, R.H.F., Kay, L., McMath, A.J. & Rostron, D.M. (2002) An assessment of appropriate methods for monitoring a population of colonial anemone at Bardsey island (Ynys Enlli), Wales, UK. CCW Marine Monitoring Report No: 2, 31pp. Lock, K. (1998a). Development of method to assess nearshore territorial fish populations. A Skomer Marine Nature Reserve Report, CCW science report 276. Lock, K. (1998b). Distribution and abundance of Zostera marina in North Haven Skomer 1997. CCW science report no.277. Lock, K. & Newman, P. (2001) Skomer MNR Scallop Pecten maximus survey 2000. CCW West Area Report No 16. Lock, K. (2003) Distribution and abundance of Zostera marina in North Haven Skomer 2002. CCW West Area Report No. 22. Lock, K, Burton, M & Newman, P. (2003) Skomer Marine Nature Reserve Project Status Report 2002/3. CCW West Area Report 24. Lock, K. (2004) Skomer Marine Nature Reserve Seal Disturbance Study 2002 & 2003. CCW Regional Report CCW/WW/04/6. Lock, K., Burton M., Newman, P. & Luddington, L. (2006a). Skomer Marine Nature Reserve Territorial Fish Population Study. CCW Regional Report CCW/WW/05/8 Lock, K, Burton, M, Luddington, L. & Newman, P. (2006b). Skomer Marine Nature Reserve Project Status Report 2005/06. CCW Regional Report CCW/WW/05/9. Lock, K, Burton M, Gibbs R & Newman P (2007) Distribution and abundance of Zostera marina in North Haven, Skomer 2006. CCW Regional Report CCW/WW/08/2. Lock, K, Gibbs, R, Burton, M & Newman, P (2008). Skomer Marine Nature Reserve Distribution & abundance of Echinus esculentus and selected starfish species. CCW Regional Report CCW/WW/08/2. Lock, K, Gibbs R, Burton M & Newman P (2009). Skomer Marine Nature Reserve Scallop, Pecten maximus survey 2008. CCW Regional Report CCW/WW/09/4.
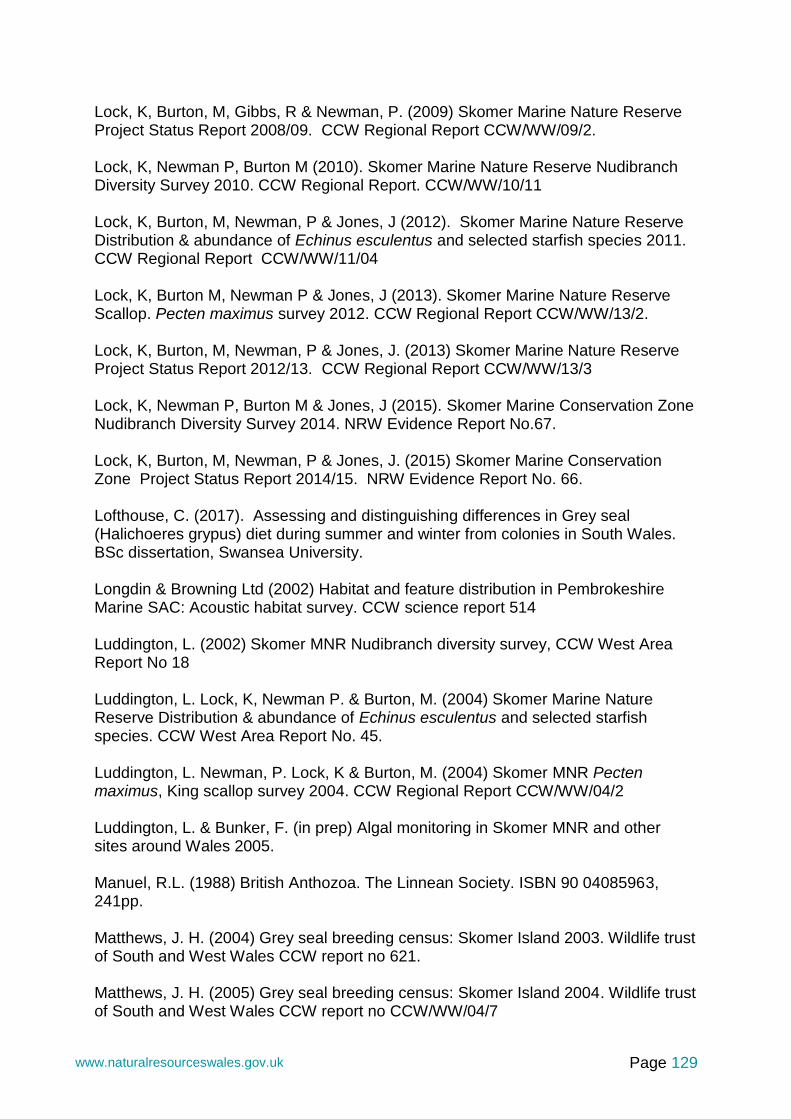
Page 129 www.naturalresourceswales.gov.uk
Lock, K, Burton, M, Gibbs, R & Newman, P. (2009) Skomer Marine Nature Reserve Project Status Report 2008/09. CCW Regional Report CCW/WW/09/2. Lock, K, Newman P, Burton M (2010). Skomer Marine Nature Reserve Nudibranch Diversity Survey 2010. CCW Regional Report. CCW/WW/10/11 Lock, K, Burton, M, Newman, P & Jones, J (2012). Skomer Marine Nature Reserve Distribution & abundance of Echinus esculentus and selected starfish species 2011. CCW Regional Report CCW/WW/11/04 Lock, K, Burton M, Newman P & Jones, J (2013). Skomer Marine Nature Reserve Scallop. Pecten maximus survey 2012. CCW Regional Report CCW/WW/13/2. Lock, K, Burton, M, Newman, P & Jones, J. (2013) Skomer Marine Nature Reserve Project Status Report 2012/13. CCW Regional Report CCW/WW/13/3 Lock, K, Newman P, Burton M & Jones, J (2015). Skomer Marine Conservation Zone Nudibranch Diversity Survey 2014. NRW Evidence Report No.67. Lock, K, Burton, M, Newman, P & Jones, J. (2015) Skomer Marine Conservation Zone Project Status Report 2014/15. NRW Evidence Report No. 66. Lofthouse, C. (2017). Assessing and distinguishing differences in Grey seal (Halichoeres grypus) diet during summer and winter from colonies in South Wales. BSc dissertation, Swansea University. Longdin & Browning Ltd (2002) Habitat and feature distribution in Pembrokeshire Marine SAC: Acoustic habitat survey. CCW science report 514 Luddington, L. (2002) Skomer MNR Nudibranch diversity survey, CCW West Area Report No 18 Luddington, L. Lock, K, Newman P. & Burton, M. (2004) Skomer Marine Nature Reserve Distribution & abundance of Echinus esculentus and selected starfish species. CCW West Area Report No. 45. Luddington, L. Newman, P. Lock, K & Burton, M. (2004) Skomer MNR Pecten maximus, King scallop survey 2004. CCW Regional Report CCW/WW/04/2 Luddington, L. & Bunker, F. (in prep) Algal monitoring in Skomer MNR and other sites around Wales 2005. Manuel, R.L. (1988) British Anthozoa. The Linnean Society. ISBN 90 04085963, 241pp. Matthews, J. H. (2004) Grey seal breeding census: Skomer Island 2003. Wildlife trust of South and West Wales CCW report no 621. Matthews, J. H. (2005) Grey seal breeding census: Skomer Island 2004. Wildlife trust of South and West Wales CCW report no CCW/WW/04/7

Page 130 www.naturalresourceswales.gov.uk
Matthews, J. H. (2006) Grey seal breeding census: Skomer Island 2005. Wildlife trust of South and West Wales CCW report no CCW/WW/05/7 Matthews, J. H. & Boyle, D. (2008) Grey seal breeding census: Skomer Island 2007. Wildlife trust of South and West Wales CCW report no CCW/WW/08/1 McEvoy, A. Burton, M. Somerfield, P & Atkinson, A. (2013) Cost-effective method for establishing an ecological baseline of the zooplankton at Skomer Marine Nature Reserve. Plymouth Marine Laboratory Scientific Poster. Mieszkowska, N. Kendal, M., R. Leaper, A. Southward, S. Hawkins & M. Burrows (2002) MARCLIM monitoring network: provisional sampling strategy and standard operating procedure. Mieszkowska, N. 2017. MarClim Annual Welsh Intertidal Climate Monitoring Survey 2016. Natural Resources Wales Evidence Report No. 205 pp 27 + viii, Natural Resources Wales, Bangor. Moore, J. (2001) Monitoring baseline for sediment surface and burrowing macro and mega fauna in Skomer Marine Nature Reserve. A report to the Countryside Council for Wales from Coastal Assessment, Liaison and Monitoring, Cosheston, Pembrokeshire. 39pp Moore, J. (2005) Repeat monitoring for sediment surface and burrowing macro and mega fauna in Skomer Marine Nature Reserve. A report to the Countryside Council for Wales from Coastal Assessment, Liaison and Monitoring, Cosheston, Pembrokeshire. 46pp MNCR (unpublished) (1994) MNCR sublittoral survey of South Pembrokeshire, Dyfed, 1994. Munro, C (1996) Lyme Bay potting impacts study. Report to JNCC and ESFJC. Munro, L. & Munro, C. (2003a) Reef Research. Determining the reproductive cycle of Eunicella verrucosa. Interim report March 2003. RR Report 3/2003 ETR 07 Munro, L. & Munro, C. (2003b) Reef Research. Determining the reproductive cycle of Eunicella verrucosa. Interim report Nov 2003. RR Report 10 Nov 2003 Munro, L. & Munro, C. (2004) Reef Research. Genetic variation in populations of Eunicella verrucosa. Interim report Jan 2004. RR Report ETR 11 Jan 2004. Newman, P. (1992) Skomer MNR Seal breeding on the Marloes Peninsula, Sept – Dec1991 Newman, P. & Lock, K. (2000) Skomer Marine Nature Reserve Management Plan. Working document. Countryside Council for Wales. Newman, P. Lock, K, Burton, M, Jones, J. (2018). Skomer Marine Conservation Zone Annual Report 2017. NRW Evidence Report No. 250.

Page 131 www.naturalresourceswales.gov.uk
Orsman, C. (1990) Grey seal breeding success- Skomer Island 1989. Dyfed Wildlife Trust. Orsman, C. (1991) Grey seal breeding success- Skomer Island 1990. Dyfed Wildlife Trust. Pegg, L. (2004) Human disturbance on Atlantic Grey Seal (Halichoerus grypus) during the pupping season at Jeffery’s Haven, Skomer Marine Nature Reserve, Pembrokeshire. HND project report. Picton, B.E. & Goodwin, C.E. (2007). Sponge biodiversity of Rathlin Island, northern Ireland. Journal of the Marine Biological Association of the UK 87 (6): 1441-1458 Pilsworth, M. (2001) Grey seal breeding census: Skomer Island 2000. CCW report no. 445. Poole, J. (1992) Grey Seal breeding census, Skomer Island 1991. Dyfed Wildlife Trust. Poole, J. (1993) Grey Seal breeding census, Skomer Island 1992. Dyfed Wildlife Trust. Poole, J. (1994) Grey Seal breeding census, Skomer Island 1993. Dyfed Wildlife Trust. Poole, J. (1995) Grey Seal breeding census, Skomer Island 1994. Dyfed Wildlife Trust. Poole, J. (1996a). Grey seal breeding census: Skomer Island 1995. CCW report. Poole, J. (1996b). Skomer Island Grey Seal Monitoring Handbook. Poole, J. (1997) Grey seal breeding census: Skomer Island 1996. CCW report no 191. Poole, J. (1998) Grey seal breeding census: Skomer Island 1997. CCW report no 252. Poole, J. (1999) Grey seal breeding census: Skomer Island 1998. CCW report no 316. Ronowicz, M., Kuklinski, P., Lock, K., Newman, P., Burton, M. & Jones, J. (2014) Temporal and spatial variability of zoobenthos recruitment in a north-east Atlantic marine reserve. Journal of the Marine Biological Association of the United Kingdom 94(7), 1367-1376. Rosta da Costa Oliver, T & Mc Math, M (2012) Grey seal (Halichoerus grypus) movement and site use connectivity with in the Irish sea: Implications of Management. CCW Poster. Rostron, D.M. (1983) Systematic descriptive surveys of animal species and habitats at two sites around Skomer Island.

Page 132 www.naturalresourceswales.gov.uk
Rostron, D.M. (1988) Skomer Marine Reserve subtidal monitoring project: animal communities on stones March 1987 to January 1988 Rostron, D.M. (1994) The sediment infauna of the Skomer Marine Nature Reserve. CCW report 55 Rostron, D.M. (1996) Sediment interface studies in the Skomer Marine Nature Reserve. CCW 133. FC 73-01-109 Rostron, D.M. (1997) Sea Empress Subtidal Impact Assessment: Skomer Marine Nature Reserve Sediment Infauna. Salomonsen, H. M., Lambert, G. I., Murray, L.G. & Kaiser, M.J. (2015). The spawning of King scallop, Pecten maximus, in Welsh waters – A preliminary study. Fisheries & Conservation report No. 57, Bangor University. pp.21 Sayer, S (2013) Skomer – Cornwall seal photo identification project 2007 – 2012. Cornwall Seal Group. Scott, S. (1994) Skomer MNR: recommendations for monitoring of algal populations. CCW report 63. Stuart-Smith, R., G. Edgar, N. Barrett, S. Kininmonth, and A. Bates. 2015. Identifying and tracking resilience to ocean warming in marine ecological communities using the Community Temperature Index.in The 52nd Australian Marine Science Association Annual Conference. Sharp, J.H., Winson, M.K., Wade, S., Newman, P., Bullimore, B., Lock, K., Burton, M., Gibbs, R. & Porter, J.S. (2008). Differential microbial fouling on the marine bryozoan Pentapora fascialis. Journal of Marine Biological Association of the United Kingdom, 2008, 88(4), 705-710. P.J. Somerfield , M. Burton , W.G. Sanderson (2014) Analyses of sublittoral macrobenthic community change in a marine nature reserve using similarity profiles (SIMPROF). Journal of Marine Environmental Research (2014) 1e8. Sweet, N.A. (2007) An Investigation into the Effects of Shore Angling Pressure on Fish Assemblage Structure within Skomer Marine Nature Reserve. Undergraduate dissertation, University of Plymouth.
Tallaksen, K., Torkel, L., Knutsen, T., Asvjorn Vollestad, L., Knutsen, H & Moland, E. (2017) Impact of harvesting cleaner fish for salmonid aquaculture from replicated coastal marine protected areas. Marine Biology Research pages 359 – 369. Published online: 02 Mar 2017.
Trigg, J. (1998) Temporal changes in distribution and abundance of Zostera marina and possible effects on benthic community structure. Undergraduate thesis, Newcastle University.

Page 133 www.naturalresourceswales.gov.uk
Whittey, K. E. (2016) Assessing the fouling on the growth rate of pink sea fan, Eunicella verrucosa, in the Skomer Marine Conservation Zone. Undergraduate dissertation, Cardiff University. Woods, C. (2003) Pink sea fan survey 2001/2. A report for the Marine Conservation Society. Woods, C. (2008) Seasearch pink sea fan surveys 2004/6. A report for the Marine Conservation Society.
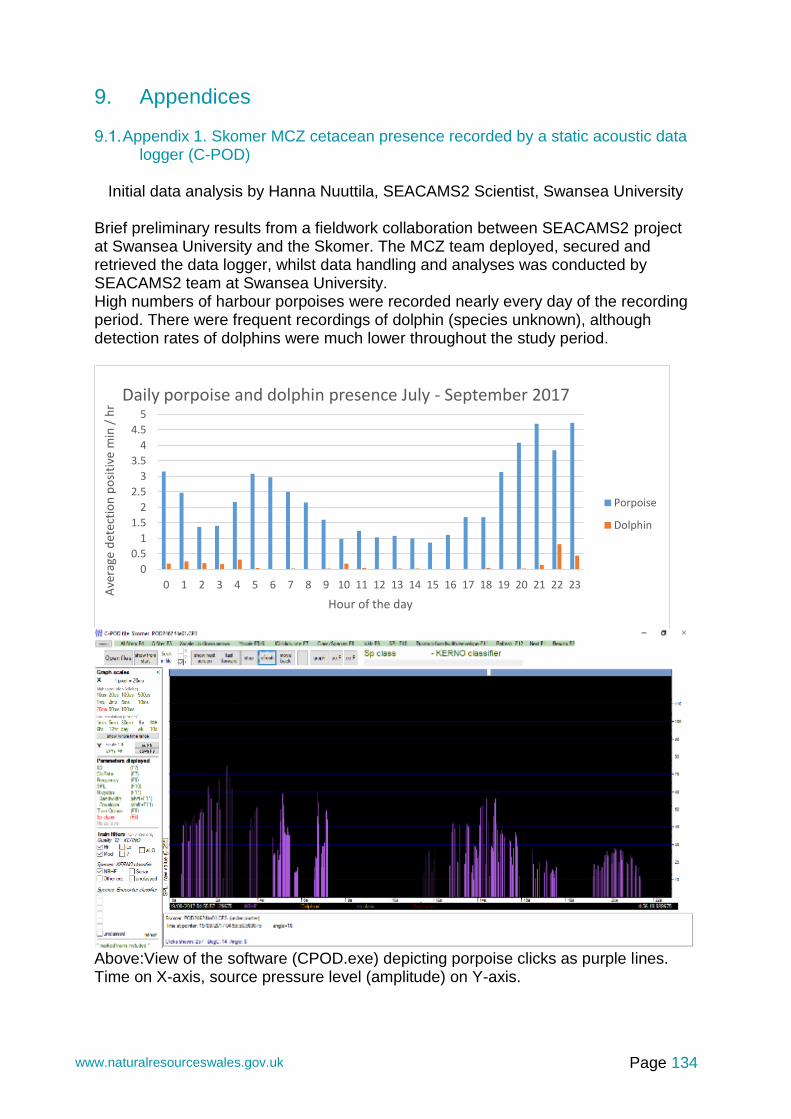
Page 134 www.naturalresourceswales.gov.uk
9. Appendices
Appendix 1. Skomer MCZ cetacean presence recorded by a static acoustic data logger (C-POD)
Initial data analysis by Hanna Nuuttila, SEACAMS2 Scientist, Swansea University
Brief preliminary results from a fieldwork collaboration between SEACAMS2 project at Swansea University and the Skomer. The MCZ team deployed, secured and retrieved the data logger, whilst data handling and analyses was conducted by SEACAMS2 team at Swansea University. High numbers of harbour porpoises were recorded nearly every day of the recording period. There were frequent recordings of dolphin (species unknown), although detection rates of dolphins were much lower throughout the study period.
Above:View of the software (CPOD.exe) depicting porpoise clicks as purple lines. Time on X-axis, source pressure level (amplitude) on Y-axis.
0
0.5
1
1.5
2
2.5
3
3.5
4
4.5
5
0 1 2 3 4 5 6 7 8 9 10 11 12 13 14 15 16 17 18 19 20 21 22 23
Ave
rage
det
ecti
on
po
siti
ve m
in /
hr
Hour of the day
Daily porpoise and dolphin presence July - September 2017
Porpoise
Dolphin

Page 135 www.naturalresourceswales.gov.uk
Above: Average porpoise detection rates for July-September. The software can distinguish porpoise clicks from dolphin clicks by their characteristics, one of which is the difference in their peak frequency. Porpoise clicks contain their energy around 130 kHz, whereas dolphin clicks have energy in much wider band, around 50-70 kHz. Unfortunately the software cannot (yet) identify different dolphin species.

Page 136 www.naturalresourceswales.gov.uk
Below: The software (CPOD.exe) depicting typical dolphin clicks – with energy centred around 50-70 kHz.
Above: The software (CPOD.exe) depicting typical porpoise clicks – with energy centred around 130 kHz.

Page 137 www.naturalresourceswales.gov.uk
Appendix 2 Weather Station Service Report.

Page 138 www.naturalresourceswales.gov.uk
Appendix 3 Note on methodology used in collecting activity data at Skomer MCZ
Human activity at Skomer MCZ is recorded by staff during all fieldwork days and during weekend liaison patrols. The results are reported in detail in the Skomer MCZ Annual Report each year (Newman, et al. 2018). 9.3.1. Recreational data. All recreational activity observed within Skomer MCZ is recorded whenever staff are engaged in fieldwork or carrying out on the water liaison “patrols”. In order to meet and record as many users as possible, given the restraints on staff resources, these patrols are normally carried out on all Sundays between the early Spring bank holiday and the end of the school summer holiday in early September, together with the Saturdays and Mondays that fall on the bank holiday weekends in this period. Additional data is provided by Skomer Island NNR staff observing from the island. Also noted by both NNR and MCZ staff are any infractions of byelaws, or of the voluntary codes of conduct covering, for example, access to sensitive areas or anchoring outside the permitted anchorages in North and South Havens. All observations are recorded with reference to the site map shown in Section 5. Recording effort can vary between years due to poor weather or staff occupied away from the site on other duties. For this reason, an estimate of effort is made from the number of days spent at sea, which is routinely recorded as part of MCZ boat operations. Although the data collected in this way is as complete as possible, it will inevitably be an underestimate as staff cannot be present at all times. By correcting for effort, however, it can give a valuable indication of trends. 9.3.2. Commercial data. Commercial vessels, including fishing vessels, diving and angling charter vessels and sightseeing cruises are recorded as part of the process in 9.3.1. In addition, commercial fishing activity (mainly shellfish potting) is recorded in order to estimate relative levels of fishing effort from year to year. This is done during the same period of the year as recreational activity, but only once per week, usually in combination with the liaison patrols. GPS positions of pot marker buoys are taken and the registration number of the vessel (if marked on the buoy) recorded. The positions are put into Geographical Information System software (GIS) and lines plotted to represent the most likely position of the string of pots between the buoys. Observations of distances between pots along actual strings of pots are used to calculate where pots would most likely occur on the mapped “string”. The GIS software is then able to calculate an estimate of the number of pots in each roughly 200m x 200m square (Fig. 9.3.1). This is at a finer resolution than the recreational data, particularly for the offshore area, but the inshore squares correspond closely to the site map in Section 5. As with recreational activity recording effort varies from year to year but is recorded and used to correct data allowing comparisons between years.
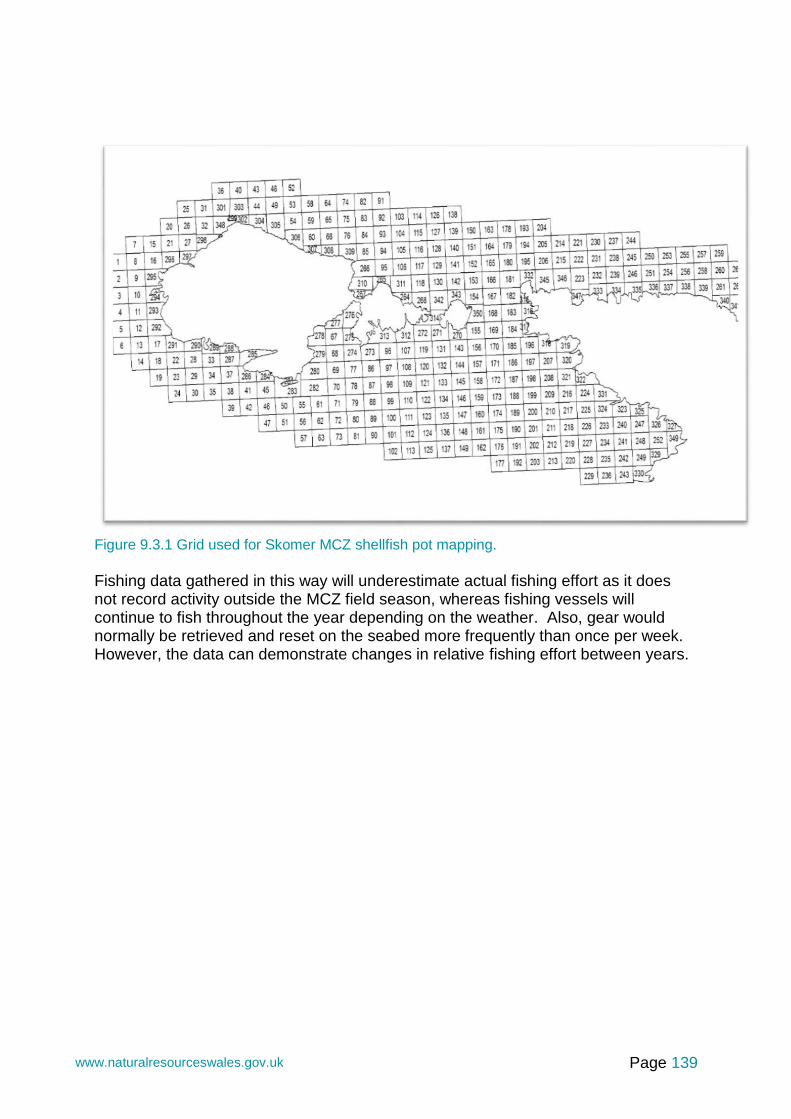
Page 139 www.naturalresourceswales.gov.uk
Figure 9.3.1 Grid used for Skomer MCZ shellfish pot mapping.
Fishing data gathered in this way will underestimate actual fishing effort as it does not record activity outside the MCZ field season, whereas fishing vessels will continue to fish throughout the year depending on the weather. Also, gear would normally be retrieved and reset on the seabed more frequently than once per week. However, the data can demonstrate changes in relative fishing effort between years.
Page 140 www.naturalresourceswales.gov.uk
Appendix 4 Excerpts from other non-NRW fish survey projects. Fish Drop-down video survey, Natalie Sweet 2007. Undergraduate project, Plymouth University. Abstract: In this study, the effects of recreational shore angling pressure on fish assemblage structure and population density within Skomer Marine Nature Reserve were investigated using baited and non-baited remote underwater video camera. Footage was recorded at three sites on the North Marloes Peninsula, popular with recreational anglers, and three sites adjacent to Skomer Island, inaccessible to shore anglers. Relative abundance, species richness and diversity were measured for each sequence, and assemblage structure was examined in order to discover whether significant differences were apparent between fished and non-fished sites. A total of ten fish species were recorded with the underwater video camera. Kruskal-Wallis tests revealed that the use of bait did not significantly increase the number of fish recorded, and that relative mean abundance and species richness were significantly greater at Skomer sites (p < 0.01). ANOVA highlighted significantly greater Shannon diversity at Skomer sites (p < 0.01). A significant negative correlation was evident between the number of shore anglers recorded during 2005 and Shannon diversity (p < 0.05). Analysis of similarity (ANOSIM) revealed significant differences in assemblage structure between NMPE and Skomer sites, and similarity percentages (SIMPER) analysis indicated that Goldsinny, Cuckoo wrasse and Poor cod accounted for 73.5% of total abundance. “These results have implications for the management of marine reserves and demonstrate that recreational fishing pressure may have the potential to alter fish assemblage structure and deplete local fish populations”. Fish Drop-down video survey, Ross Bullimore, 2009 Undergraduate project, Plymouth University. Abstract: The value of marine protected areas to the conservation of marine biodiversity is increasingly being recognised on a global scale. Failure to acknowledge the potential contribution of recreational fishing to fishery declines, however, has resulted in the exemption of recreational extraction from many marine protection initiatives. This study developed and deployed remote underwater video equipment to compare nearshore territorial fish assemblages from two areas of differing recreational fishing pressure in the Skomer Marine Nature Reserve, UK. Fish assemblages were significantly lower in diversity and abundance on the North Marloes Peninsula coast, where more than 89% of recreational angling in the Marine Nature Reserve is focused, than on comparable areas of the Skomer Island coast which is subject to minimal boat-based recreational fishing only. Although sample data indicated fish assemblages varied considerably between individual sites and across habitats, there were significant differences in assemblages between island and mainland sample samples. The absence of discernible differences in environmental conditions, other anthropogenic activities or natural predation on sampled fish species suggests that the observed differences in fish assemblages in the Skomer Marine Nature Reserve may be, at least in part, attributable to the impacts of recreational fishing pressure on the North Marloes Peninsula. We therefore recommend conservation strategies to

Page 141 www.naturalresourceswales.gov.uk
recognise the impacts of recreational fishing, and encompass it as a managed impact in the design and management of future marine protected areas. (Bullimore, R & Foggo, A. 2010).
A multivariate analysis using PRIMER ANOVA – R 0.6872 p=0.008** for differences between the areas (Skomer & North Marloes Peninsula). SIMPER analysis allocated 57.96% of dissimilarity between groups to two species: cuckoo wrasse (contribution = 30.78%) and goldsinny wrasse (contribution = 27.17%).

Published by: Natural Resources Wales Address line one Address line two Address line three Post Code 0000 000 000 © Natural Resources Wales 2017 All rights reserved. This document may be reproduced with prior permission of Natural Resources Wales Further copies of this report are available from: Email:[email protected]