Íslandsbanki research april 2015 united states … 2015 united states seafood market report cover...
TRANSCRIPT
Íslandsbanki Research April 2015
United StatesSeafood Market Report

Cover page: Eastern Point Light, Gloucester, Massachusetts
Publication and Contact InformationPublisher: Íslandsbanki ResearchIssue date: April 21, 2015Editor: Ingólfur Bender, Executive Director, Research (+ 354 440 4635)Authors: Timothy H. Spanos (+ 354 440 4540) and Elvar Orri Hreinsson (+ 354 440 4747)
Foreword Dear reader,
It is a pleasure to present the latest in our series of Seafood Market Reports. Íslandsbanki has served the Icelandic seafood industry for over a century, financing the first Icelandic motorized trawler in 1904. The Bank began its international operations in 1999 by providing financing solutions to the fishery sector on the East Coast of Canada.
In 2013, we published a report covering the North Atlantic Seafood Market, which we defined as Norway, the Faroe Islands, Greenland, Canada and the United States. Last year, we narrowed our focus by writing about the U.S. and Canadian industries. This year’s report further sharpens our focus by concentrating on the key regions within the United States - the Atlantic Coast, Gulf of Mexico and Pacific Coast. These distinct regions have different characteristics, species and fisheries management regimes. Through these reports, we strive to provide insights into the key trends and issues shaping the industry.
For additional information about Íslandsbanki’s Seafood Industry services, and to access prior reports, please visit our website at www.islandsbanki.is/seafood.
Íslandsbanki Seafood Industry Team
• The U.S. is the fourth largest fishing country in the world and one of the most important markets for seafood
• During the past 20 years, total landings averaged 4.3 million MT. Landings increased by 5.6% to 4.5 million MT in 2013
• The total value of the U.S. catch has increased steadily since the early 2000s reaching $5.5 billion in 2013
• The Pacific Coast is the largest U.S. fishery accounting for approximately 70% of total volume and half of total value
• The Atlantic and Gulf Coast regions are smaller when measured by volume, but generally consist of higher value shellfish species
• Key fishing states include Massachusetts, Maine, Virginia, Louisiana and Alaska
Key Highlights

United States Seafood Market Report
About Íslandsbanki Íslandsbanki is a universal bank in Iceland with a vision to be #1 for service. With roots extending back to 1875, Íslandsbanki provides a full range of financial services to individuals, corporates and institutions. The Bank is a leader in financial services in Iceland with a 25-50% market share across all domestic franchise areas, including Retail Banking, Corporate Banking, Capital Markets and Wealth Management. Íslandsbanki was named the best bank in Iceland by both Euromoney and The Banker and ranked as the number one bank in the Icelandic Customer Satisfaction Index.
Building on over 135 years of servicing key industries in Iceland, Íslandsbanki has developed specific expertise in the Seafood, Energy and Offshore industries domestically and within the North Atlantic region.
The Bank had total assets of USD 7.2 billion as of December 31, 2014. Seafood accounted for approximately 22% of the Bank´s commercial loan portfolio, underscoring the importance of the sector to the Bank.
Source: Íslandsbanki
Íslandsbanki’s Commercial Loan Portfolio by Industry
27%
22%21%
17%
14%
Real Estate
Seafood
Commerce & Services
Industrials & Transp.
Other Sectors

United States Seafood Market Report
Seafood Industry Team
Elvar Orri HreinssonAnalystResearchelvar.orri.hreinsson @islandsbanki.is
Timothy H. SpanosExecutive Director International Lending timothy.spanos @islandsbanki.is
Runölfur Geir BenediktssonExecutive Director Seafood and International Lendingrunolfur.benediktsson @islandsbanki.is
Vilhelm Mar ThorsteinssonManaging Director Corporate Banking vilhelm.thorsteinsson @islandsbanki.is
Ragnar GudjonssonBusiness Manager [email protected]
Olafur Hrafn OlafssonBusiness ManagerSeafoodolafur.hrafn.olafsson @islandsbanki.is
Íslandsbanki has established a dedicated team within its Corporate Banking Division focusing on the seafood industry. This team of seasoned professionals utilizes its deep industry knowledge to provide a full range of banking services to domestic and foreign seafood companies.
Íslandsbanki’s Seafood team members have participated in many of the industry’s leading transactions. The Bank also publishes industry research on domestic and international seafood markets. For more information about Íslandsbanki’s Seafood team and for access to the industry reports, please visit our website at www.islandsbanki.is/seafood.
Íslandsbanki Seafood Industry Team
United States Seafood Market Report
Table of Contents
The Global Seafood Industry
Global Seafood Market 8
Global Seafood Production 9
Major Commercial Fisheries 14
Marine Capture Production 15
Global Seafood Trade 17
Global Seafood Consumption 18
The United States Seafood Industry
Fisheries Management 21
U.S. Main Fishing Areas 26
Overview of U.S. Seafood Industry 27
U.S. Atlantic Coast 31
U.S. Gulf Coast 37
U.S. Pacific Coast 42
U.S. Seafood Trade 47
The Global Seafood Industry
Grótta, Reykjavík, Iceland
8 United States Seafood Market Report
Global Seafood Market Fish and other seafood products are an important source of protein. According to the Food and Agricultural Organization of the United Nations (FAO), seafood accounted for 16.7% of the world population’s intake of animal protein in 2010 and 6.5% of all protein consumed. Seafood supply grew at an average rate of 2.5% per year during the period from 1980-2013, outpacing the average annual growth rate in the world population of 1.4%. Increasing demand for seafood has been driven by growth in the world population and increasing per capita consumption, reflecting a shift to healthier eating choices and rising income levels in developing countries.
Compared to other sources of animal protein, the seafood industry is extremely diverse. There are almost 2,000 species in FAO’s capture production database with many different types of species and products being produced to meet consumer demands which vary based on regional preferences, income levels, supply, distribution infrastructure and other factors. Although there has been a recent trend towards consolidation, the seafood industry remains highly fragmented.
Source: FAO
9United States Seafood Market Report
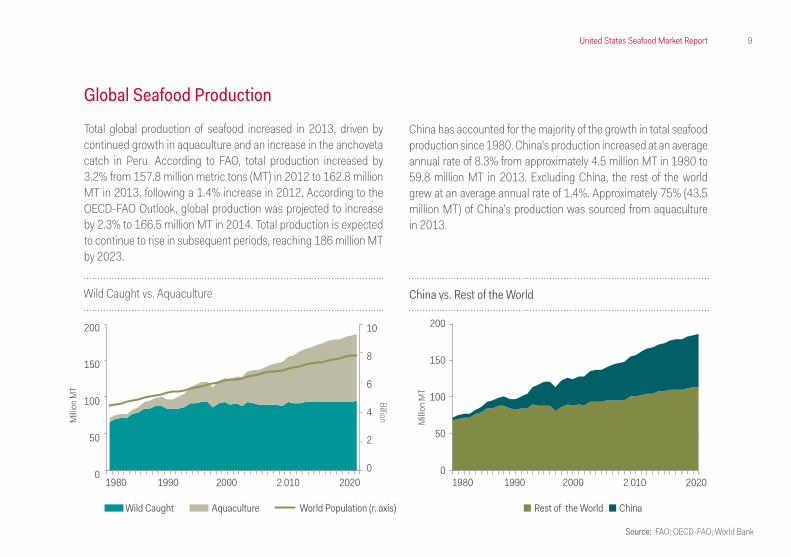
Global Seafood Production Total global production of seafood increased in 2013, driven by continued growth in aquaculture and an increase in the anchoveta catch in Peru. According to FAO, total production increased by 3.2% from 157.8 million metric tons (MT) in 2012 to 162.8 million MT in 2013, following a 1.4% increase in 2012. According to the OECD-FAO Outlook, global production was projected to increase by 2.3% to 166.5 million MT in 2014. Total production is expected to continue to rise in subsequent periods, reaching 186 million MT by 2023.
China has accounted for the majority of the growth in total seafood production since 1980. China’s production increased at an average annual rate of 8.3% from approximately 4.5 million MT in 1980 to 59.8 million MT in 2013. Excluding China, the rest of the world grew at an average annual rate of 1.4%. Approximately 75% (43.5 million MT) of China’s production was sourced from aquaculture in 2013.
Source: FAO; OECD-FAO; World Bank
Wild Caught vs. Aquaculture China vs. Rest of the World
1980 1990 2000 2 010 2020 1980 1990 2000 2 010 2020
200
150
100
50
0
200
150
100
50
0
Milli
on M
T
Milli
on M
TBillion
10
8
6
4
2
0
Wild Caught Aquaculture Rest of the World ChinaWorld Population (r. axis)

10 United States Seafood Market Report
(Million MT) 1980 1990 2000 2010 2011 2012 2013 2020F
Wild Caught 67.2 84.7 93.5 89.0 93.7 91.3 92.7 92.8 % of Total 93% 87% 74% 60% 60% 58% 57% 52%
Aquaculture 4.7 13.1 32.4 59.7 62.0 66.5 70.1 86.1 % of Total 7% 13% 26% 40% 40% 42% 43% 48%
Total 71.9 97.8 125.9 148.7 155.7 157.8 162.8 178.9
The volume of fish harvested in wild fisheries has stabilized at approximately 90 million MT while aquaculture production has steadily increased. Aquaculture is one of the fastest growing food producing sectors. Since 1995, aquaculture production has grown at an average annual rate of approximately 6.1% and is expected to surpass wild caught seafood as the main source for human consumption by 2015. This share is expected to rise to 62% by 2030. Wild caught seafood accounted for 57% of total production in 2013 compared to approximately 70% in the early 2000s.
Source: FAO; OECD-FAO
Global Seafood Production
The majority of wild caught seafood is harvested in marine fisheries. The volume of fish caught in inland waters has been increasing, reaching a record 11.7 million MT in 2013, but represents less than 15% of total capture production. In contrast, inland waters account for roughly 60% of total aquaculture production.
11United States Seafood Market Report
Source: FAO
Asia is by far the largest aquaculture producer accounting for 89% of total production in 2013. America and Europe accounted for 4.4% and 4.0% of total aquaculture production, respectively. Asia is the only region that produces more fish from aquaculture (54% in 2012) than capture fisheries. Despite the large number of farmed species, the majority of total aquaculture production is concentrated in several dozen species.
There has been an increasing trend in the proportion of seafood production used for direct human consumption. In 2012, approximately 85% of total production was for direct human consumption with the remaining 15% used for non-food purposes, including the production of fishmeal and fish oil.

12 United States Seafood Market Report
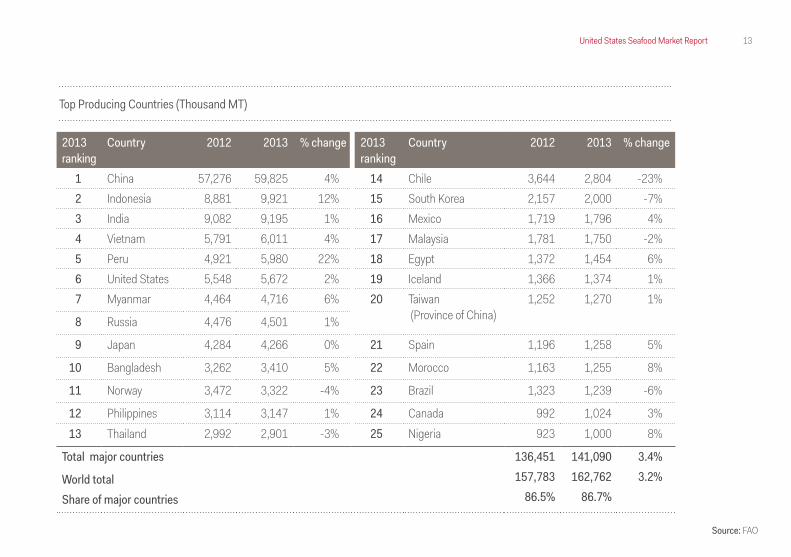
China is the world’s largest seafood producer with total production of 59.8 million MT in 2013. China accounted for 62% of global aquaculture production and 18% of total capture production. In the last five years, China’s production has grown by 11.6 million MT, which is more than the total amount produced by the second largest country.
Twenty-five countries had total production in excess of 1.0 million MT in 2013. Together, these countries accounted for 87% of global production.
More than half of the total marine catch was harvested in the Pacific Ocean.
Ten Largest Producing Countries, 2013
Milli
on M
T
70605040302010
0
ChinaIndia
Indonesia
VietnamPeru U.S.
MyanmarJapan
BangladeshRussia
Wild Caught Aquaculture
Three Largest Producing Countries, 2009-2013
Milli
on M
T
70
60
50
40
30
20
10
0China IndiaIndonesia
2009 2010 2011 2012 2013
Source: FAO; OECD-FAO
13United States Seafood Market Report
Source: FAO
Top Producing Countries (Thousand MT)
2013 ranking
Country 2012 2013 % change
1 China 57,276 59,825 4% 2 Indonesia 8,881 9,921 12% 3 India 9,082 9,195 1% 4 Vietnam 5,791 6,011 4% 5 Peru 4,921 5,980 22% 6 United States 5,548 5,672 2% 7 Myanmar 4,464 4,716 6%
8 Russia 4,476 4,501 1%
9 Japan 4,284 4,266 0%
10 Bangladesh 3,262 3,410 5%
11 Norway 3,472 3,322 -4%
12 Philippines 3,114 3,147 1% 13 Thailand 2,992 2,901 -3%
Total major countries
World totalShare of major countries
2013 ranking
Country 2012 2013 % change
14 Chile 3,644 2,804 -23% 15 South Korea 2,157 2,000 -7% 16 Mexico 1,719 1,796 4% 17 Malaysia 1,781 1,750 -2% 18 Egypt 1,372 1,454 6% 19 Iceland 1,366 1,374 1% 20 Taiwan
(Province of China) 1,252 1,270 1%
21 Spain 1,196 1,258 5%
22 Morocco 1,163 1,255 8%
23 Brazil 1,323 1,239 -6%
24 Canada 992 1,024 3% 25 Nigeria 923 1,000 8%
136,451 141,090 3.4% 157,783 162,762 3.2%
86.5% 86.7%
14 United States Seafood Market Report
Source: FAO; OECD-FAO
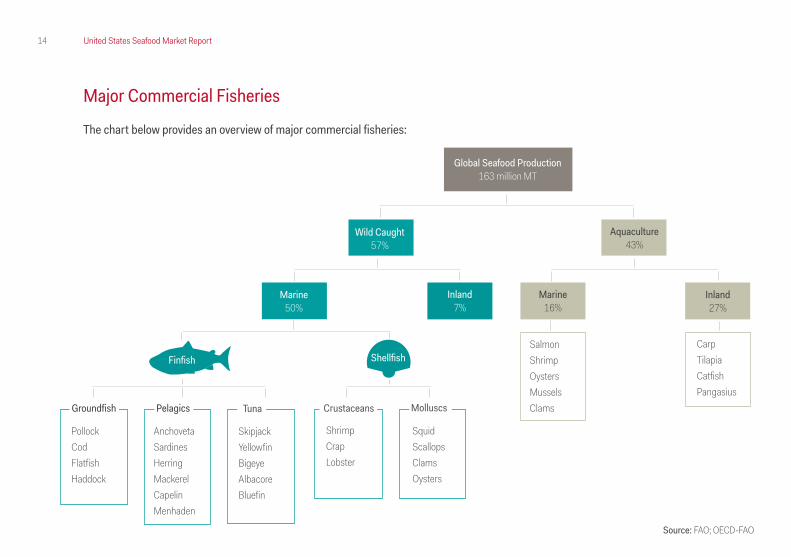
Major Commercial Fisheries The chart below provides an overview of major commercial fisheries:
Aquaculture43%
Wild Caught57%
Inland27%
CarpTilapiaCatfishPangasius
SalmonShrimpOystersMusselsClams
SquidScallopsClamsOysters
ShrimpCrapLobster
SkipjackYellowfinBigeyeAlbacoreBluefin
AnchovetaSardinesHerringMackerelCapelinMenhaden
PollockCodFlatfishHaddock
Inland7%
Marine16%
Marine50%
Shellfish
MolluscsCrustaceansTunaPelagicsGroundfish
Global Seafood Production163 million MT
Finfish
15United States Seafood Market Report
Marine Capture Production
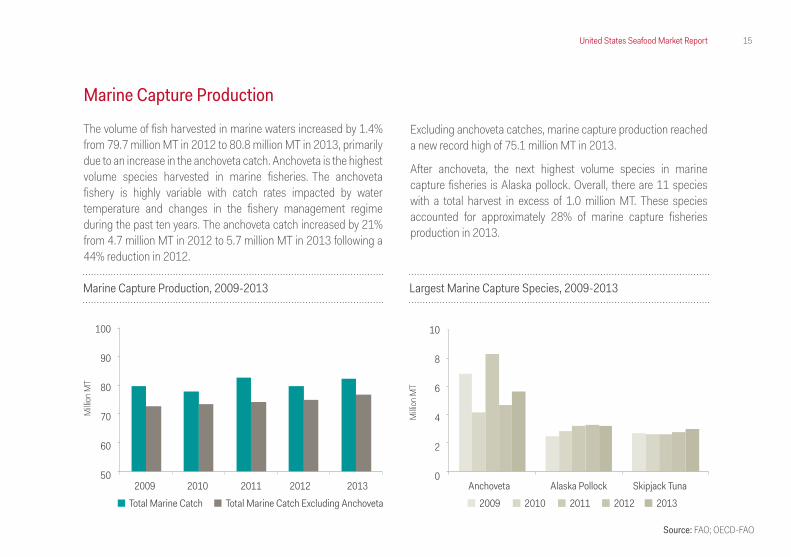
The volume of fish harvested in marine waters increased by 1.4% from 79.7 million MT in 2012 to 80.8 million MT in 2013, primarily due to an increase in the anchoveta catch. Anchoveta is the highest volume species harvested in marine fisheries. The anchoveta fishery is highly variable with catch rates impacted by water temperature and changes in the fishery management regime during the past ten years. The anchoveta catch increased by 21% from 4.7 million MT in 2012 to 5.7 million MT in 2013 following a 44% reduction in 2012.
Source: FAO; OECD-FAO
Excluding anchoveta catches, marine capture production reached a new record high of 75.1 million MT in 2013.
After anchoveta, the next highest volume species in marine capture fisheries is Alaska pollock. Overall, there are 11 species with a total harvest in excess of 1.0 million MT. These species accounted for approximately 28% of marine capture fisheries production in 2013.
Milli
on M
T
Total Marine Catch Total Marine Catch Excluding Anchoveta
Marine Capture Production, 2009-2013
100
90
80
70
60
502009 2010 2011 2012 2013
2009 2010 2011 2012 2013
Largest Marine Capture Species, 2009-2013
Milli
on M
T
10
8
6
4
2
0Anchoveta Alaska Pollock Skipjack Tuna
16 United States Seafood Market Report
Source: FAO; OECD-FAO
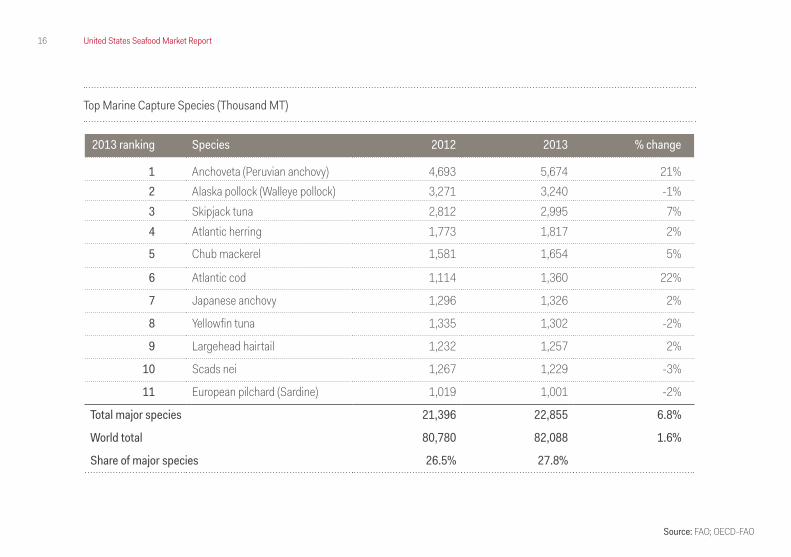
Top Marine Capture Species (Thousand MT)
2013 ranking Species 2012 2013 % change
1 Anchoveta (Peruvian anchovy) 4,693 5,674 21% 2 Alaska pollock (Walleye pollock) 3,271 3,240 -1% 3 Skipjack tuna 2,812 2,995 7% 4 Atlantic herring 1,773 1,817 2%
5 Chub mackerel 1,581 1,654 5%
6 Atlantic cod 1,114 1,360 22%
7 Japanese anchovy 1,296 1,326 2%
8 Yellowfin tuna 1,335 1,302 -2%
9 Largehead hairtail 1,232 1,257 2%
10 Scads nei 1,267 1,229 -3%
11 European pilchard (Sardine) 1,019 1,001 -2%
Total major species 21,396 22,855 6.8%
World total 80,780 82,088 1.6%
Share of major species 26.5% 27.8%
17United States Seafood Market Report
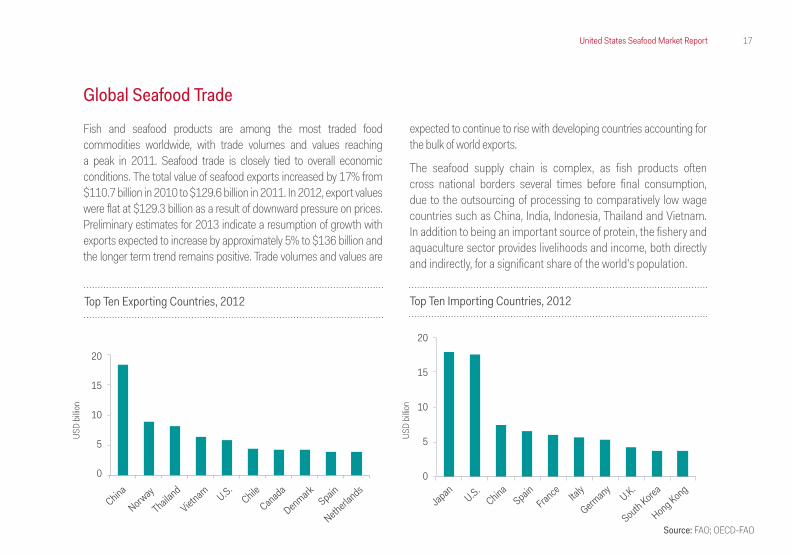
Global Seafood Trade Fish and seafood products are among the most traded food commodities worldwide, with trade volumes and values reaching a peak in 2011. Seafood trade is closely tied to overall economic conditions. The total value of seafood exports increased by 17% from $110.7 billion in 2010 to $129.6 billion in 2011. In 2012, export values were flat at $129.3 billion as a result of downward pressure on prices. Preliminary estimates for 2013 indicate a resumption of growth with exports expected to increase by approximately 5% to $136 billion and the longer term trend remains positive. Trade volumes and values are
Source: FAO; OECD-FAO
expected to continue to rise with developing countries accounting for the bulk of world exports.
The seafood supply chain is complex, as fish products often cross national borders several times before final consumption, due to the outsourcing of processing to comparatively low wage countries such as China, India, Indonesia, Thailand and Vietnam. In addition to being an important source of protein, the fishery and aquaculture sector provides livelihoods and income, both directly and indirectly, for a significant share of the world’s population.
USD
billio
n
20
15
10
5
0
China
Norway
Thailand
Vietnam U.S.Chile
DenmarkCanada
Spain
Netherlands
Top Ten Exporting Countries, 2012 Top Ten Importing Countries, 2012
USD
billio
n
20
15
10
5
0
JapanU.S.
SpainChina
FranceItaly
Germany
U.K.
South Korea
Hong Kong
18 United States Seafood Market Report
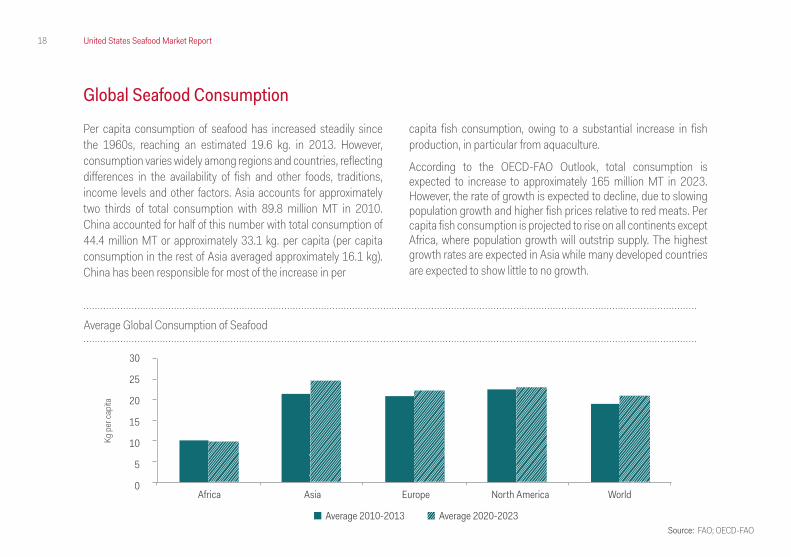
Global Seafood Consumption Per capita consumption of seafood has increased steadily since the 1960s, reaching an estimated 19.6 kg. in 2013. However, consumption varies widely among regions and countries, reflecting differences in the availability of fish and other foods, traditions, income levels and other factors. Asia accounts for approximately two thirds of total consumption with 89.8 million MT in 2010. China accounted for half of this number with total consumption of 44.4 million MT or approximately 33.1 kg. per capita (per capita consumption in the rest of Asia averaged approximately 16.1 kg). China has been responsible for most of the increase in per
capita fish consumption, owing to a substantial increase in fish production, in particular from aquaculture.
According to the OECD-FAO Outlook, total consumption is expected to increase to approximately 165 million MT in 2023. However, the rate of growth is expected to decline, due to slowing population growth and higher fish prices relative to red meats. Per capita fish consumption is projected to rise on all continents except Africa, where population growth will outstrip supply. The highest growth rates are expected in Asia while many developed countries are expected to show little to no growth.
Average Global Consumption of Seafood
Africa Asia Europe North America World
30
25
20
15
10
5
0
Average 2010-2013 Average 2020-2023
Kg p
er ca
pita
Source: FAO; OECD-FAO
19United States Seafood Market Report
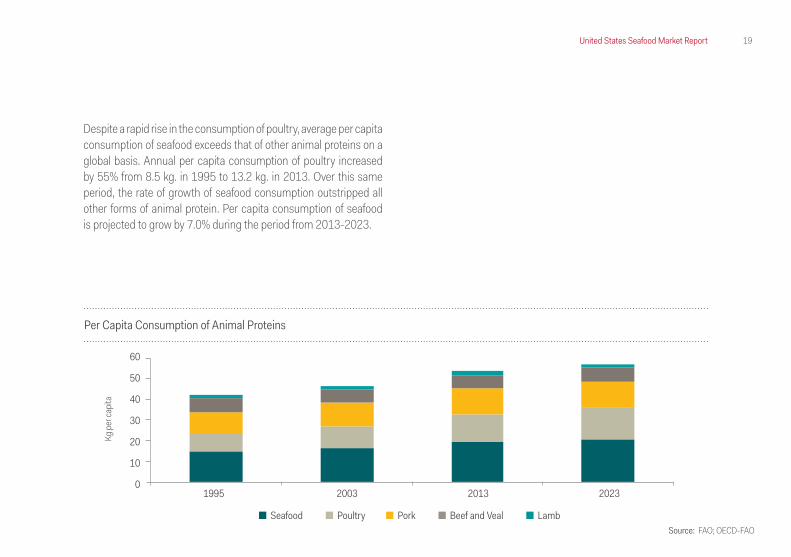
Despite a rapid rise in the consumption of poultry, average per capita consumption of seafood exceeds that of other animal proteins on a global basis. Annual per capita consumption of poultry increased by 55% from 8.5 kg. in 1995 to 13.2 kg. in 2013. Over this same period, the rate of growth of seafood consumption outstripped all other forms of animal protein. Per capita consumption of seafood is projected to grow by 7.0% during the period from 2013-2023.
Per Capita Consumption of Animal Proteins
1995 2003 2013 2023
60
50
40
30
20
10
0
Seafood Poultry Pork Beef and Veal Lamb
Kg p
er ca
pita
Source: FAO; OECD-FAO
The United States Seafood Industry
Yaquina Head Lighthouse, Newport, Oregon
21United States Seafood Market Report
Fisheries Management The Magnuson-Stevens Act is the primary law governing marine fisheries in U.S. federal waters. Enacted in 1976, the Act established eight Regional Fishery Management Councils, which serve as the front line of fisheries management where region specific management measures (such as fishing seasons, quotas and closed areas) are initiated, developed and ultimately adopted in a fully transparent and public process. Under the Act, the Regional Fishery Management Councils are required to:
• Develop and amend fishery management plans
• Convene committees and advisory panels and conduct public meetings
• Develop research priorities in conjunction with a Scientific and Statistical Committee
• Select fishery management options
• Set annual catch limits based on the best available science
• Develop and implement rebuilding plans
Source: NOAA Fisheries
22 United States Seafood Market Report
Lobster
American lobster is one of the most valuable commercial fisheries in North America. There are three stocks of American lobster - Gulf of Maine, Georges Bank and Southern New England. The Gulf of Maine and Southern New England areas are mainly inshore fisheries, while the Georges Bank area is predominantly an offshore fishery. Most of the U.S. harvest is caught in inshore waters.
The American lobster’s range is not only divided into three stock areas but also into seven management areas with a separate Lobster Conservation Management Team for each management area. Each area has unique regulations that include size limits, trap limits, gear restrictions, harvesting limits and monitoring and reporting requirements.
Generally, lobster stocks are assessed every 2 to 5 years. Although lobster fisheries are highly regulated and harvests in some areas are at their peak, recent assessments of the lobster resource paint a mixed picture, with record high abundance, reproduction and survival rates throughout most of the Gulf of Maine and Georges Bank, but decreasing abundance, reproduction and survival rates in southern New England.
Crab
U.S. commercial fishermen harvest several different species of crab, including blue crab, Dungeness crab, Alaska snow crab and Alaska king crab. As a group, crab is the most valuable species in the United States. There are different fishery management regimes in place for the various species of crab. As an example, the Alaska snow crab fishery is managed according to size, sex and season. Only male crabs of a certain size may be harvested, and fishing is not allowed during mating and molting periods. Every year, managers set the harvest limit for the next fishing season using the most recent estimates of crab abundance. Managers allocate harvest shares among harvesters, processors and coastal communities through the Crab Rationalization Program.
Blue crabs are managed by various state jurisdictions, including the Maryland Department of Natural Resources and Virginia Marine Resource Commission in the Chesapeake Bay region and the Louisiana Department of Wildlife and Fisheries in Louisiana state waters.
23United States Seafood Market Report
Menhaden
Menhaden is the largest species by volume along the U.S. Atlantic coast and Gulf of Mexico and the second highest volume species in the country, behind only pollock. Menhaden fisheries are among the oldest fisheries in the U.S. The commercial menhaden fishery consists of a reduction fishery and a bait fishery. The reduction fishery processes whole fish into fishmeal and fish oil, while the bait fishery supplies fisherman with bait for popular commercial and sport fish.
The Atlantic menhaden fishery is managed by the Atlantic States Marine Fisheries Commission, which tracks and regulates harvest under Amendment 2 to the Interstate Fishery Management Plan for Atlantic menhaden. Amendment 2 established a TAC of 170,800 MT from 2013 through the next benchmark stock assessment, which was scheduled for peer review in December 2014. The TAC represents a 20% reduction from average landings in 2009-2011 and an approximately 25% reduction from 2011 landings. The TAC allocates a catch limit to each state. Management of the Gulf menhaden stock is coordinated by the Gulf States Marine Fisheries Commission.
Pollock
The Eastern Bering Sea Alaska pollock fishery is one of the largest, most valuable fisheries in the world. It is one of the first U.S. fisheries to be managed with catch shares or “quotas” and is considered to be one of the best managed fisheries in the world. The two primary global pollock resources are the U.S. Bering Sea fishery and the Russian fishery in the sea of Okhotsk.
During the 20 year period from 1995-2014, the TAC for Eastern Bering Sea pollock averaged 1.23 million MT. The TAC dipped to historic lows of approximately 815,000 MT in 2009 and 2010 due to poor recruitment in the mid-2000s before returning to average levels in the subsequent years. During this period, the average catch rate was in excess of 99% of the TAC. The TAC for 2015 was set at 1,325,000 MT, a 4.6% increase compared to 2014.
The Bering Sea and Aleutian Islands pollock fishery was certified as sustainable by the Marine Stewardship Council (MSC) in February 2005 and re-certified in December 2010. The fishery has entered full reassessment for a second time.

24 United States Seafood Market Report
Salmon
Pacific salmon species include pink, sockeye, chum, coho and Chinook. Pacific salmon are harvested in fisheries operating along North America’s West Coast, from Alaska to California. In 2013, Pacific salmon surpassed crab as the most valuable species in the U.S. Pacific salmon are managed by the Pacific and North Pacific Fishery Management Councils and the Alaska Department of Fish and Game. In Alaska, management of salmon fisheries in federal waters is deferred to the State.
Salmon fishery management largely relies on in-season assessment of how many salmon return to freshwater to spawn. Management measures include size limits, season length, quotas and gear restrictions.
Commercial fishing for Atlantic salmon is currently prohibited by law. Only farm raised Atlantic salmon can be found in the market.
Scallop
The U.S. Atlantic sea scallop fishery is the most valuable wild scallop fishery in the world. The principal U.S. commercial scallop fisheries are in the Mid-Atlantic from Virginia to New York and on Georges Bank and neighboring areas. Most scallops are landed in Massachusetts, Virginia and New Jersey. Atlantic sea scallops are harvested year round, primarily using scallop dredges.
The fishery has grown considerably since the early-1990s when overfishing reduced scallop populations. Since 1994, management measures allowed the scallop population to increase to near record highs and the fishery currently operates at sustainable levels.
Managers determine a TAC for the scallop fishery based on estimates of the population. The TAC is allocated to different groups of the fishery, depending on their permit type and historical catch, through days at sea and number of trips to closed access areas. Other management measures include gear restrictions and limits on crew size. The U.S. sea scallop fishery now supports the largest harvests in its history averaging 24,000 MT from 2003-2010, about twice the long-term average.
25United States Seafood Market Report
Source: NOAA Fisheries
Shrimp
Shrimp are one of the most valuable commercial fisheries across the U.S. and have a wide range of sizes, flavors and textures. The most important shrimp species in the U.S. are brown shrimp and white shrimp, which are harvested in the South Atlantic and Gulf of Mexico (although shrimp are among the highest value species harvested in the U.S., farm raised imports make up the majority of the supply).
Shrimp are short lived and heavily influenced by environmental factors. Therefore, although scientists monitor shrimp abundance to ensure the stock is healthy, managers primarily consider historic harvest amounts and fishing rates to set catch levels.
NOAA Fisheries and the South Atlantic and Gulf of Mexico Fishery Management Councils manage shrimp fisheries in offshore waters; state resource management agencies are responsible for inshore state waters. In general, fishermen must have a permit to harvest shrimp in federal waters and submit reports on catch and fishing effort for each trip.
26 United States Seafood Market Report
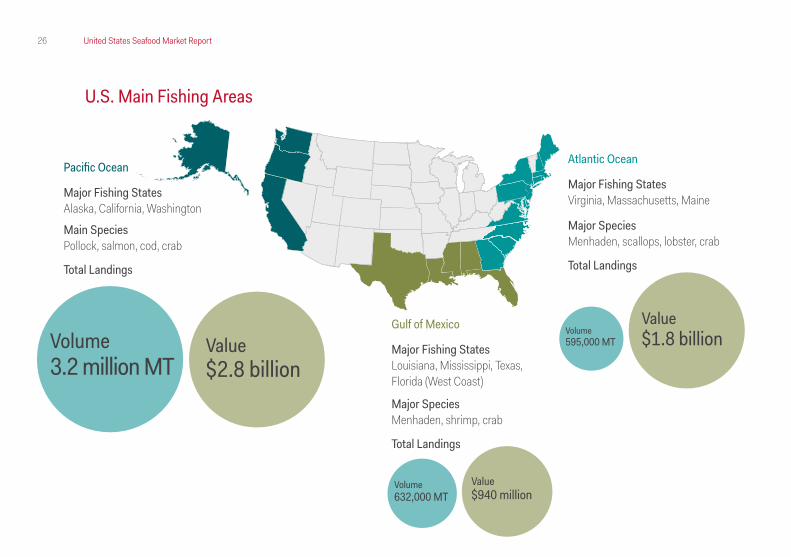
Atlantic Ocean Major Fishing StatesVirginia, Massachusetts, Maine
Major SpeciesMenhaden, scallops, lobster, crab
Total Landings
Volume595,000 MT
Value$1.8 billion
Pacific Ocean Major Fishing StatesAlaska, California, Washington
Main SpeciesPollock, salmon, cod, crab
Total Landings
Volume3.2 million MT
Value$2.8 billion
Volume632,000 MT
Value$940 million
Gulf of Mexico Major Fishing StatesLouisiana, Mississippi, Texas,Florida (West Coast)
Major SpeciesMenhaden, shrimp, crab
Total Landings
U.S. Main Fishing Areas

Overview of U.S. Seafood Industry
West Point Lighthouse, Seattle, Washington
28 United States Seafood Market Report
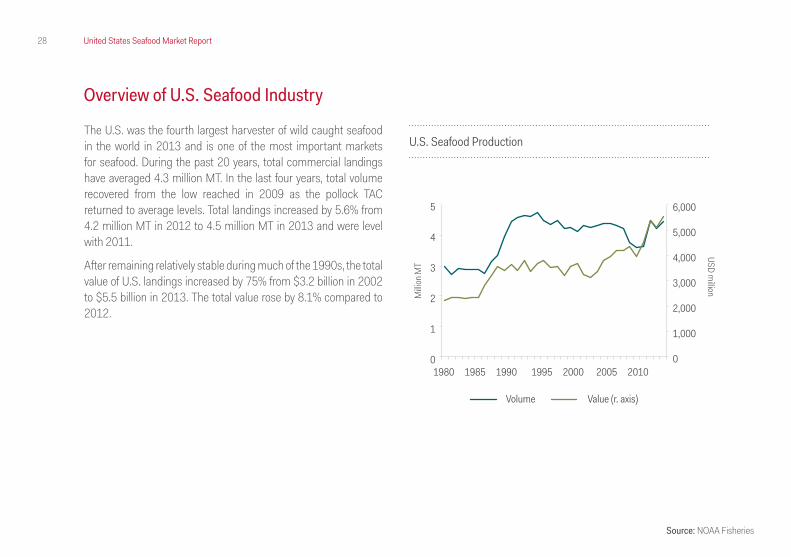
Overview of U.S. Seafood Industry
Source: NOAA Fisheries
The U.S. was the fourth largest harvester of wild caught seafood in the world in 2013 and is one of the most important markets for seafood. During the past 20 years, total commercial landings have averaged 4.3 million MT. In the last four years, total volume recovered from the low reached in 2009 as the pollock TAC returned to average levels. Total landings increased by 5.6% from 4.2 million MT in 2012 to 4.5 million MT in 2013 and were level with 2011.
After remaining relatively stable during much of the 1990s, the total value of U.S. landings increased by 75% from $3.2 billion in 2002 to $5.5 billion in 2013. The total value rose by 8.1% compared to 2012.
U.S. Seafood Production
1980 1985 1990 1995 2000 2005 2010
5
4
3
2
1
0
6,000
5,000
4,000
3,000
2,000
1,000
0
Volume Value (r. axis)
Milli
on M
T
USD million
29United States Seafood Market Report
Source: NOAA Fisheries
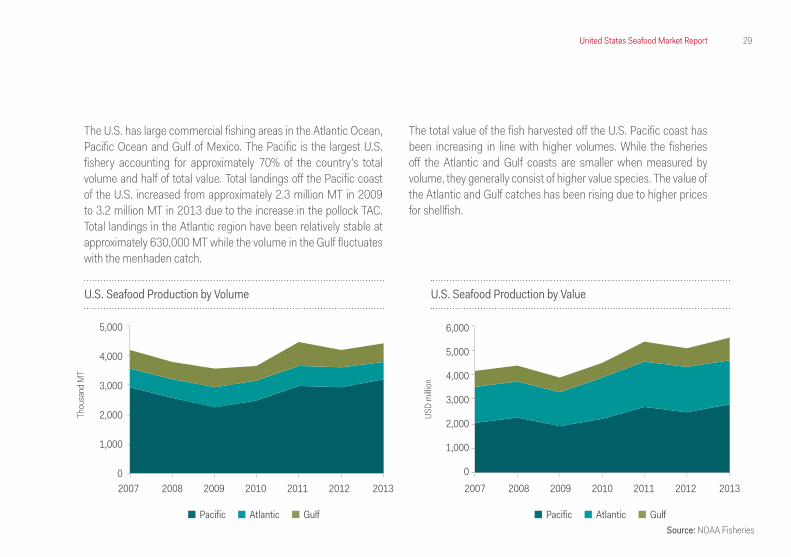
The total value of the fish harvested off the U.S. Pacific coast has been increasing in line with higher volumes. While the fisheries off the Atlantic and Gulf coasts are smaller when measured by volume, they generally consist of higher value species. The value of the Atlantic and Gulf catches has been rising due to higher prices for shellfish.
U.S. Seafood Production by Volume U.S. Seafood Production by Value
Thou
sand
MT
USD
milli
on
5,000
4,000
3,000
2,000
1,000
0
6,000
5,000
4,000
3,000
2,000
1,000
0
Pacific Atlantic Gulf Pacific Atlantic Gulf
2007 2008 2009 2010 2011 2012 2013 2007 2008 2009 2010 2011 2012 2013
The U.S. has large commercial fishing areas in the Atlantic Ocean, Pacific Ocean and Gulf of Mexico. The Pacific is the largest U.S. fishery accounting for approximately 70% of the country’s total volume and half of total value. Total landings off the Pacific coast of the U.S. increased from approximately 2.3 million MT in 2009 to 3.2 million MT in 2013 due to the increase in the pollock TAC. Total landings in the Atlantic region have been relatively stable at approximately 630,000 MT while the volume in the Gulf fluctuates with the menhaden catch.
30 United States Seafood Market Report
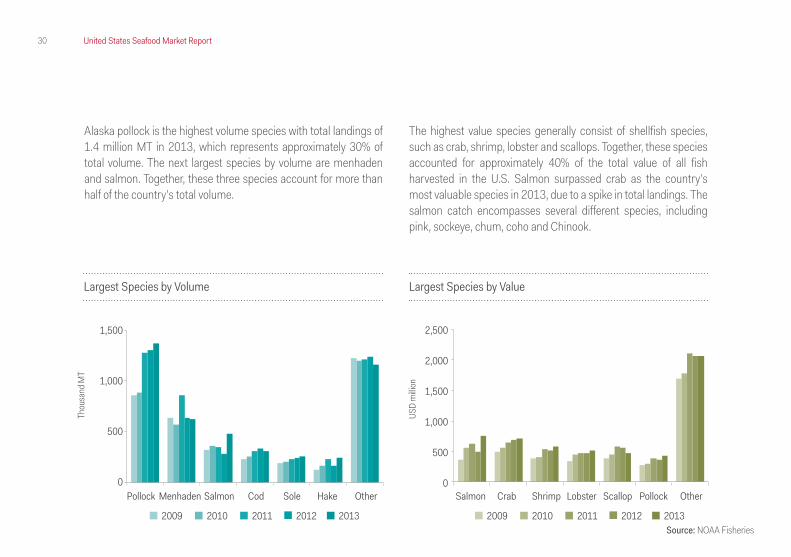
Alaska pollock is the highest volume species with total landings of 1.4 million MT in 2013, which represents approximately 30% of total volume. The next largest species by volume are menhaden and salmon. Together, these three species account for more than half of the country’s total volume.
The highest value species generally consist of shellfish species, such as crab, shrimp, lobster and scallops. Together, these species accounted for approximately 40% of the total value of all fish harvested in the U.S. Salmon surpassed crab as the country’s most valuable species in 2013, due to a spike in total landings. The salmon catch encompasses several different species, including pink, sockeye, chum, coho and Chinook.
Largest Species by Volume Largest Species by Value
Thou
sand
MT
USD
milli
on
1,500
1,000
500
0
2,500
2,000
1,500
1,000
500
0Pollock SalmonMenhaden CrabSalmon ShrimpCod LobsterSole ScallopHake PollockOther Other
2009 2010 2011 2012 2013 2009 2010 2011 2012 2013Source: NOAA Fisheries

U.S. Atlantic Coast
Portland Head Light, Portland, Maine
32 United States Seafood Market Report
U.S. Atlantic Coast
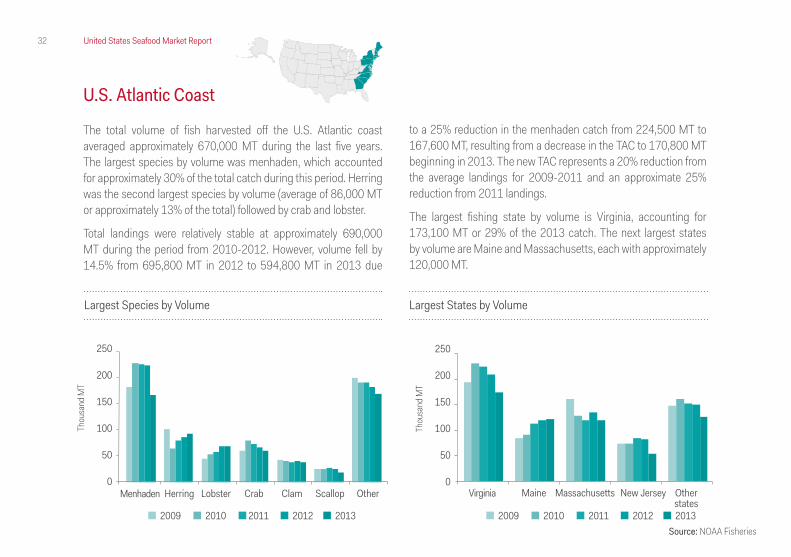
The total volume of fish harvested off the U.S. Atlantic coast averaged approximately 670,000 MT during the last five years. The largest species by volume was menhaden, which accounted for approximately 30% of the total catch during this period. Herring was the second largest species by volume (average of 86,000 MT or approximately 13% of the total) followed by crab and lobster.
Total landings were relatively stable at approximately 690,000 MT during the period from 2010-2012. However, volume fell by 14.5% from 695,800 MT in 2012 to 594,800 MT in 2013 due
to a 25% reduction in the menhaden catch from 224,500 MT to 167,600 MT, resulting from a decrease in the TAC to 170,800 MT beginning in 2013. The new TAC represents a 20% reduction from the average landings for 2009-2011 and an approximate 25% reduction from 2011 landings.
The largest fishing state by volume is Virginia, accounting for 173,100 MT or 29% of the 2013 catch. The next largest states by volume are Maine and Massachusetts, each with approximately 120,000 MT.
Largest Species by Volume Largest States by Volume
250
200
150
100
50
0Menhaden Herring Lobster Crab ScallopClam Other
Thou
sand
MT
2009 2010 2011 2012 2013 2009 2010 2011 2012 2013
250
200
150
100
50
0Virginia Maine Massachusetts New Jersey Other
states
Thou
sand
MT
Source: NOAA Fisheries
33United States Seafood Market Report
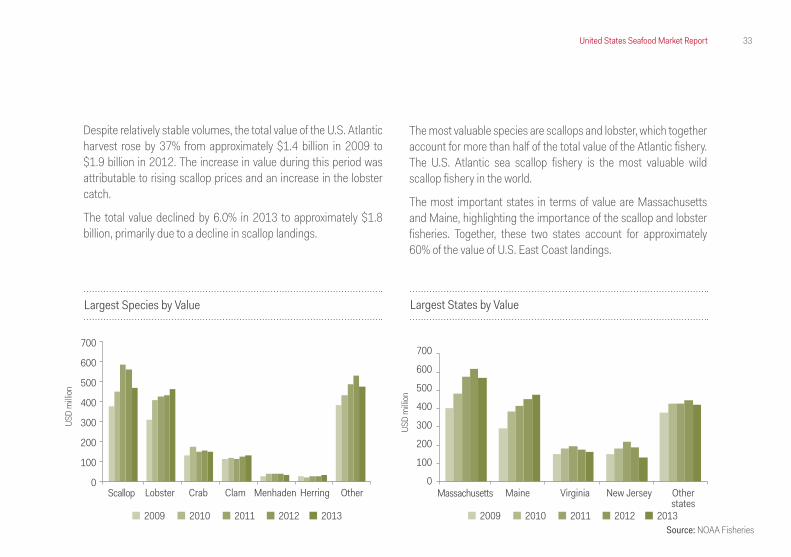
Despite relatively stable volumes, the total value of the U.S. Atlantic harvest rose by 37% from approximately $1.4 billion in 2009 to $1.9 billion in 2012. The increase in value during this period was attributable to rising scallop prices and an increase in the lobster catch.
The total value declined by 6.0% in 2013 to approximately $1.8 billion, primarily due to a decline in scallop landings.
The most valuable species are scallops and lobster, which together account for more than half of the total value of the Atlantic fishery.The U.S. Atlantic sea scallop fishery is the most valuable wild scallop fishery in the world.
The most important states in terms of value are Massachusetts and Maine, highlighting the importance of the scallop and lobster fisheries. Together, these two states account for approximately 60% of the value of U.S. East Coast landings.
Largest Species by Value Largest States by Value
700
600
500
400
300
200
100
0Massachusetts Maine Virginia New Jersey Other
states 2009 2010 2011 2012 2013
USD
milli
on
Source: NOAA Fisheries
700
600
500
400
300
200
100
0Scallop Lobster Crab Clam HerringMenhaden Other
2009 2010 2011 2012 2013
USD
milli
on
34 United States Seafood Market Report
Virginia
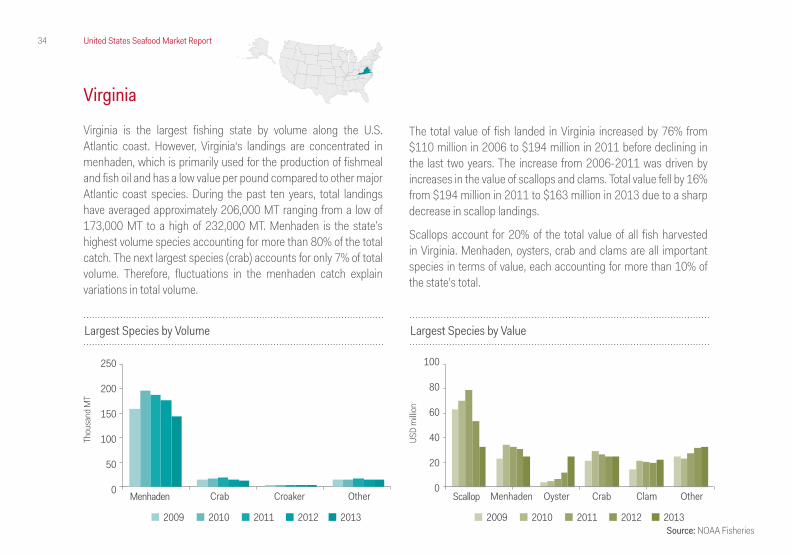
Virginia is the largest fishing state by volume along the U.S. Atlantic coast. However, Virginia‘s landings are concentrated in menhaden, which is primarily used for the production of fishmeal and fish oil and has a low value per pound compared to other major Atlantic coast species. During the past ten years, total landings have averaged approximately 206,000 MT ranging from a low of 173,000 MT to a high of 232,000 MT. Menhaden is the state’s highest volume species accounting for more than 80% of the total catch. The next largest species (crab) accounts for only 7% of total volume. Therefore, fluctuations in the menhaden catch explain variations in total volume.
The total value of fish landed in Virginia increased by 76% from $110 million in 2006 to $194 million in 2011 before declining in the last two years. The increase from 2006-2011 was driven by increases in the value of scallops and clams. Total value fell by 16% from $194 million in 2011 to $163 million in 2013 due to a sharp decrease in scallop landings.
Scallops account for 20% of the total value of all fish harvested in Virginia. Menhaden, oysters, crab and clams are all important species in terms of value, each accounting for more than 10% of the state’s total.
Largest Species by Volume Largest Species by Value
250
200
150
100
50
0
100
80
60
40
20
0Menhaden ScallopCrab MenhadenCroaker Oyster ClamOther Crab Other
2009 2010 2011 2012 2013 2009 2010 2011 2012 2013
Thou
sand
MT
USD
milli
on
Source: NOAA Fisheries

35United States Seafood Market Report
Massachusetts
The total volume of fish harvested in Massachusetts has generally been decreasing since 2006 with annual fluctuations accentuated by changes in the herring catch. Total volume declined by 33% from approximately 180.000 MT in 2006 to 120.000 MT in 2013, primarily due to a decrease in the mackerel catch, which fell from 40,600 MT to 3,300 MT during this period. Herring is Massachusett’s largest volume species accounting for 29% of the total catch in 2013. The next largest species by volume are clams and scallops. Together, these three species represent more than half of Massachusett’s annual harvest.
In contrast to the declining volumes, the total value of fish landed in Massachusetts has been increasing since the late 2000s.
Total value increased by 54% from approximately $400 million in 2009 to $616 million in 2012 due to an increase in scallop landings and prices. Total value fell by 8% in 2013 due to a reduction in the scallop TAC.
Scallops are the State’s most valuable species accounting for approximately 60% of the total value. Lobster is Massachusett’s second most valuable species. New Bedford is the leading U.S. port in terms of value with total landings of $379 million. New Bedford and the Hampton Roads Area of Virginia are the only two ports on the Atlantic coast that rank in the top 20 in terms of value.
100
80
60
40
20
0Herring Clam Scallop Lobster Other
2009 2010 2011 2012 2013
Thou
sand
MT
Largest Species by Volume Largest Species by Value
500
400
300
200
100
0Scallop Lobster Clam Other
2009 2010 2011 2012 2013
USD
milli
on
Source: NOAA Fisheries

36 United States Seafood Market Report
Maine
The total volume of fish harvested in Maine has been increasing since the late 2000s.
Total landings increased by 41% from approximately 85,000 MT in 2009 to 120,000 MT in 2013 primarily due to increases in the State’s two largest species lobster and herring. The total volume of lobster and herring each increased by more than 50% during this period. Maine has led the nation in total lobster landings for more than 30 years.
The increase in the lobster catch drove a steady increase in the value of seafood harvested in Maine. Total value increased by 63% from approximately $290 million in 2009 to $475 million in 2013.
While still accounting for less than 10% of the State’s total value (and less than 1% of total landings), there has been notable increase in the value of American eel harvested in Maine driven by increased demand from foreign markets.
Largest Species by Volume Largest Species by Value
80
60
40
20
0
500
400
300
200
100
0Lobster LobsterHerring Eel Clam HerringOther Other
2009 2010 2011 2012 2013 2009 2010 2011 2012 2013
Thou
sand
MT
USD
milli
on
Source: NOAA Fisheries

U.S. Gulf Coast
New Canal Lighthouse, New Orleans, Louisiana
38 United States Seafood Market Report
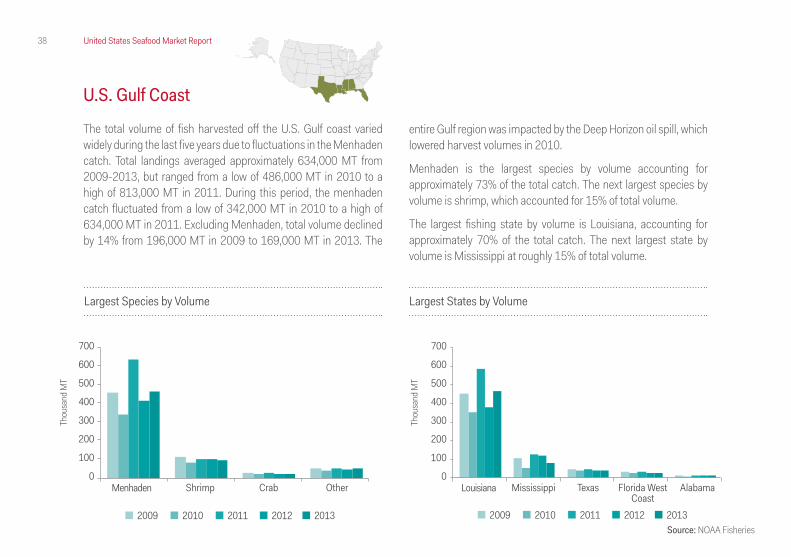
U.S. Gulf Coast The total volume of fish harvested off the U.S. Gulf coast varied widely during the last five years due to fluctuations in the Menhaden catch. Total landings averaged approximately 634,000 MT from 2009-2013, but ranged from a low of 486,000 MT in 2010 to a high of 813,000 MT in 2011. During this period, the menhaden catch fluctuated from a low of 342,000 MT in 2010 to a high of 634,000 MT in 2011. Excluding Menhaden, total volume declined by 14% from 196,000 MT in 2009 to 169,000 MT in 2013. The
13%
17%
entire Gulf region was impacted by the Deep Horizon oil spill, which lowered harvest volumes in 2010.
Menhaden is the largest species by volume accounting for approximately 73% of the total catch. The next largest species by volume is shrimp, which accounted for 15% of total volume.
The largest fishing state by volume is Louisiana, accounting for approximately 70% of the total catch. The next largest state by volume is Mississippi at roughly 15% of total volume.
Largest Species by Volume Largest States by Volume
700
600
500
400
300
200
100
0
700
600
500
400
300
200
100
0Menhaden LouisianaShrimp Mississippi Florida West
CoastCrab TexasOther Alabama
2009 2010 2011 2012 2013 2009 2010 2011 2012 2013
Thou
sand
MT
Thou
sand
MT
Source: NOAA Fisheries
39United States Seafood Market Report
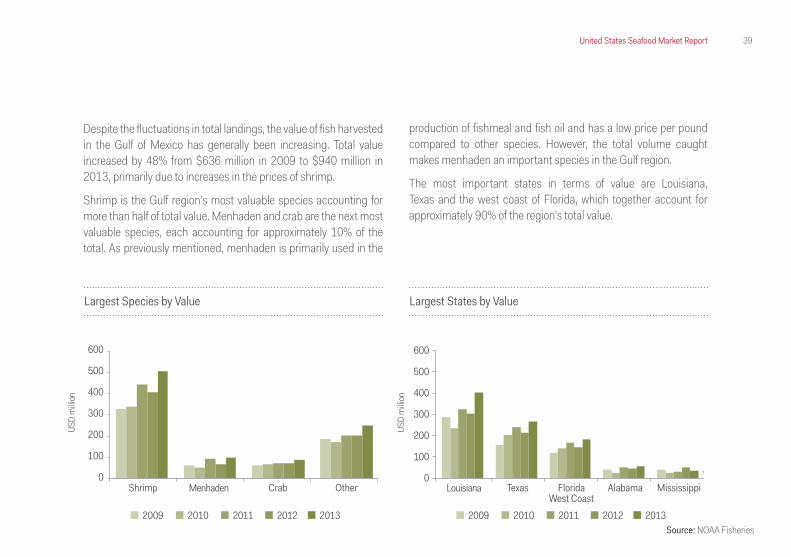
Despite the fluctuations in total landings, the value of fish harvested in the Gulf of Mexico has generally been increasing. Total value increased by 48% from $636 million in 2009 to $940 million in 2013, primarily due to increases in the prices of shrimp.
Shrimp is the Gulf region’s most valuable species accounting for more than half of total value. Menhaden and crab are the next most valuable species, each accounting for approximately 10% of the total. As previously mentioned, menhaden is primarily used in the
production of fishmeal and fish oil and has a low price per pound compared to other species. However, the total volume caught makes menhaden an important species in the Gulf region.
The most important states in terms of value are Louisiana, Texas and the west coast of Florida, which together account for approximately 90% of the region’s total value.
Largest Species by Value Largest States by Value
600
500
400
300
200
100
0
600
500
400
300
200
100
0Menhaden LouisianaShrimp TexasCrab Florida
West CoastOther Alabama Mississippi
2009 2010 2011 2012 2013 2009 2010 2011 2012 2013
USD
milli
on
USD
milli
on
Source: NOAA Fisheries
40 United States Seafood Market Report
Source: NOAA Fisheries
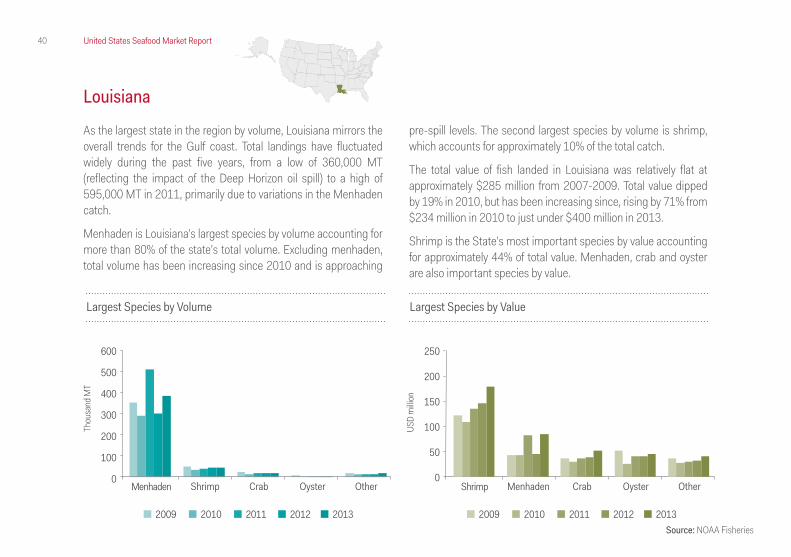
Louisiana
As the largest state in the region by volume, Louisiana mirrors the overall trends for the Gulf coast. Total landings have fluctuated widely during the past five years, from a low of 360,000 MT (reflecting the impact of the Deep Horizon oil spill) to a high of 595,000 MT in 2011, primarily due to variations in the Menhaden catch.
Menhaden is Louisiana’s largest species by volume accounting for more than 80% of the state’s total volume. Excluding menhaden, total volume has been increasing since 2010 and is approaching
pre-spill levels. The second largest species by volume is shrimp, which accounts for approximately 10% of the total catch.
The total value of fish landed in Louisiana was relatively flat at approximately $285 million from 2007-2009. Total value dipped by 19% in 2010, but has been increasing since, rising by 71% from $234 million in 2010 to just under $400 million in 2013.
Shrimp is the State’s most important species by value accounting for approximately 44% of total value. Menhaden, crab and oyster are also important species by value.
Largest Species by Volume Largest Species by Value
600
500
400
300
200
100
0
250
200
150
100
50
0Menhaden ShrimpShrimp MenhadenCrab CrabOyster OysterOther Other
2009 2010 2011 2012 2013 2009 2010 2011 2012 2013
Thou
sand
MT
USD
milli
on
41United States Seafood Market Report
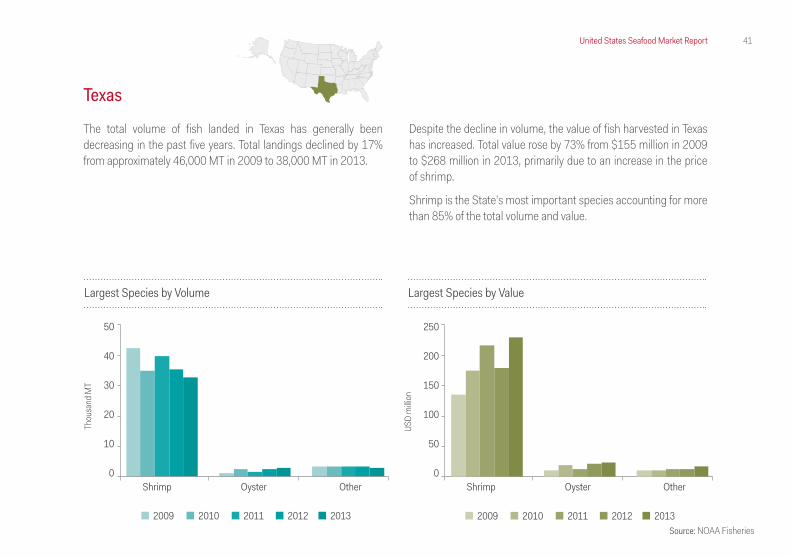
Texas The total volume of fish landed in Texas has generally been decreasing in the past five years. Total landings declined by 17% from approximately 46,000 MT in 2009 to 38,000 MT in 2013.
Largest Species by Volume Largest Species by Value
50
40
30
20
10
0
250
200
150
100
50
0Shrimp ShrimpOyster OysterOther Other
2009 2010 2011 2012 2013 2009 2010 2011 2012 2013
Thou
sand
MT
USD
milli
on
Source: NOAA Fisheries
Despite the decline in volume, the value of fish harvested in Texas has increased. Total value rose by 73% from $155 million in 2009 to $268 million in 2013, primarily due to an increase in the price of shrimp.
Shrimp is the State’s most important species accounting for more than 85% of the total volume and value.
U.S. Pacific Coast
Inland Passage, Alaska
43United States Seafood Market Report
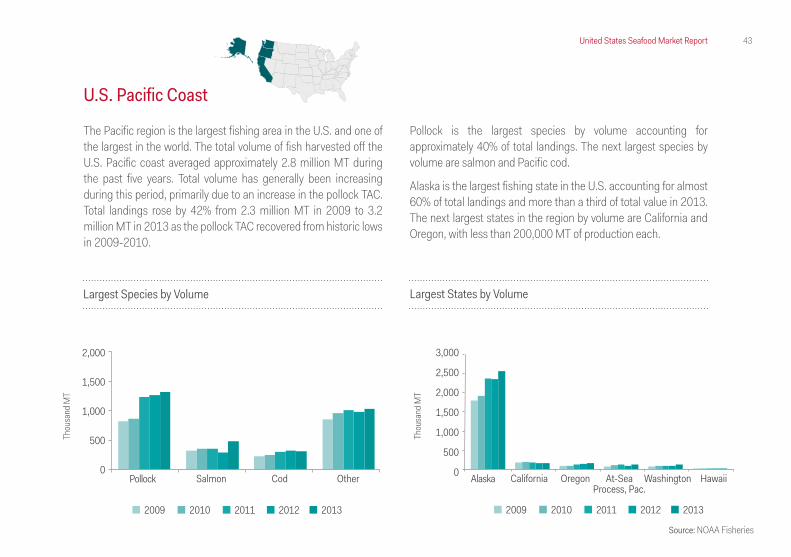
U.S. Pacific Coast
The Pacific region is the largest fishing area in the U.S. and one of the largest in the world. The total volume of fish harvested off the U.S. Pacific coast averaged approximately 2.8 million MT during the past five years. Total volume has generally been increasing during this period, primarily due to an increase in the pollock TAC. Total landings rose by 42% from 2.3 million MT in 2009 to 3.2 million MT in 2013 as the pollock TAC recovered from historic lows in 2009-2010.
Pollock is the largest species by volume accounting for approximately 40% of total landings. The next largest species by volume are salmon and Pacific cod.
Alaska is the largest fishing state in the U.S. accounting for almost 60% of total landings and more than a third of total value in 2013. The next largest states in the region by volume are California and Oregon, with less than 200,000 MT of production each.
Largest Species by Volume
2,000
1,500
1,000
500
0Pollock Salmon Cod Other
2009 2010 2011 2012 2013
Thou
sand
MT
Largest States by Volume
3,000
2,500
2,000
1,500
1,000
500
0 Alaska California Oregon WashingtonAt-SeaProcess, Pac.
Hawaii
2009 2010 2011 2012 2013
Thou
sand
MT
Source: NOAA Fisheries
44 United States Seafood Market Report
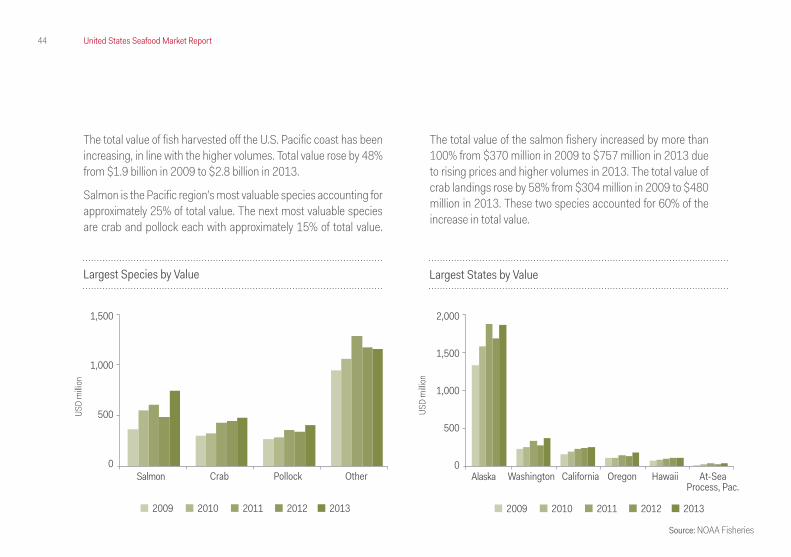
The total value of fish harvested off the U.S. Pacific coast has been increasing, in line with the higher volumes. Total value rose by 48% from $1.9 billion in 2009 to $2.8 billion in 2013.
Salmon is the Pacific region’s most valuable species accounting for approximately 25% of total value. The next most valuable species are crab and pollock each with approximately 15% of total value.
The total value of the salmon fishery increased by more than 100% from $370 million in 2009 to $757 million in 2013 due to rising prices and higher volumes in 2013. The total value of crab landings rose by 58% from $304 million in 2009 to $480 million in 2013. These two species accounted for 60% of the increase in total value.
Largest Species by Value
1,500
1,000
500
0Salmon Crab Pollock Other
2009 2010 2011 2012 2013
USD
milli
on
Source: NOAA Fisheries
Largest States by Value
2,000
1,500
1,000
500
0Alaska Washington California HawaiiOregon At-Sea
Process, Pac.
2009 2010 2011 2012 2013
USD
milli
on

45United States Seafood Market Report
Alaska
Alaska is the largest fishing state in the U.S. If Alaska was a country, it would be among the top ten producers in the world measured by wild caught production. The total volume of fish harvested in Alaska has increased in the last five years due to the recovery in the pollock TAC. Total landings rose by 43% from 1.8 million MT in 2009 to 2.6 million MT in 2013.
Pollock is Alaska’s largest species by volume accounting for half of total production. The next largest species by volume are salmon and Pacific cod. Together, these three species accounted for approximately 80% of total volume in 2013.
During the 20 year period from 1995-2014, the TAC for Eastern Bering Sea pollock averaged 1.23 million MT. The TAC dipped to historic lows of approximately 815,000 MT in 2009 and 2010 before returning to average levels in the subsequent years. The average catch rate is approximately 99.2% of the TAC, so the level of the pollock TAC is an important driver of overall harvest volumes in Alaska.
Source: NOAA Fisheries
Eastern Bering Sea Pollock TAC
2.0
1.5
1.0
0.5
1995 2000 2005 2010 2015
TAC Average TAC Catch
Milli
on M
T
46 United States Seafood Market Report
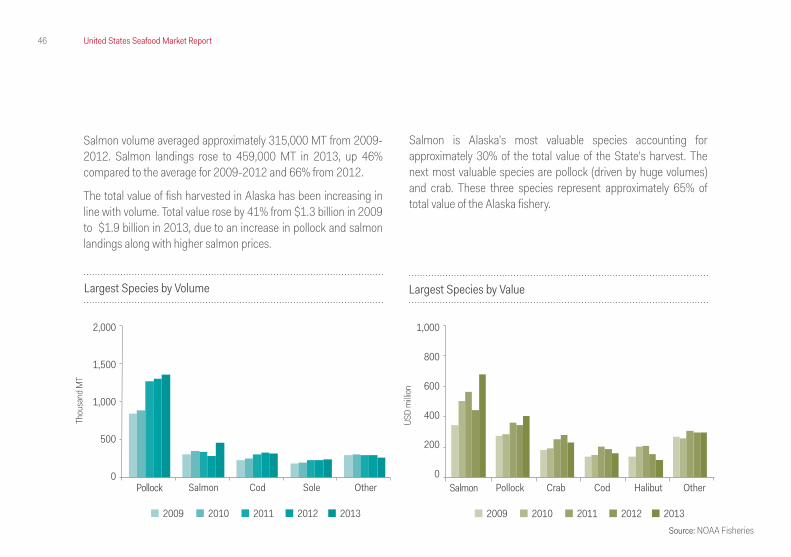
Salmon volume averaged approximately 315,000 MT from 2009-2012. Salmon landings rose to 459,000 MT in 2013, up 46% compared to the average for 2009-2012 and 66% from 2012.
The total value of fish harvested in Alaska has been increasing in line with volume. Total value rose by 41% from $1.3 billion in 2009 to $1.9 billion in 2013, due to an increase in pollock and salmon landings along with higher salmon prices.
Salmon is Alaska’s most valuable species accounting for approximately 30% of the total value of the State’s harvest. The next most valuable species are pollock (driven by huge volumes) and crab. These three species represent approximately 65% of total value of the Alaska fishery.
Largest Species by Volume
2,000
1,500
1,000
500
0Pollock Salmon Cod Sole Other
2009 2010 2011 2012 2013
Thou
sand
MT
Largest Species by Value
1,000
800
600
400
200
0Salmon Pollock Crab HalibutCod Other
2009 2010 2011 2012 2013
USD
milli
on
Source: NOAA Fisheries
47United States Seafood Market Report
U.S. Seafood Trade
Montauk Point Light, Montauk, New York
48 United States Seafood Market Report
U.S. Seafood Trade
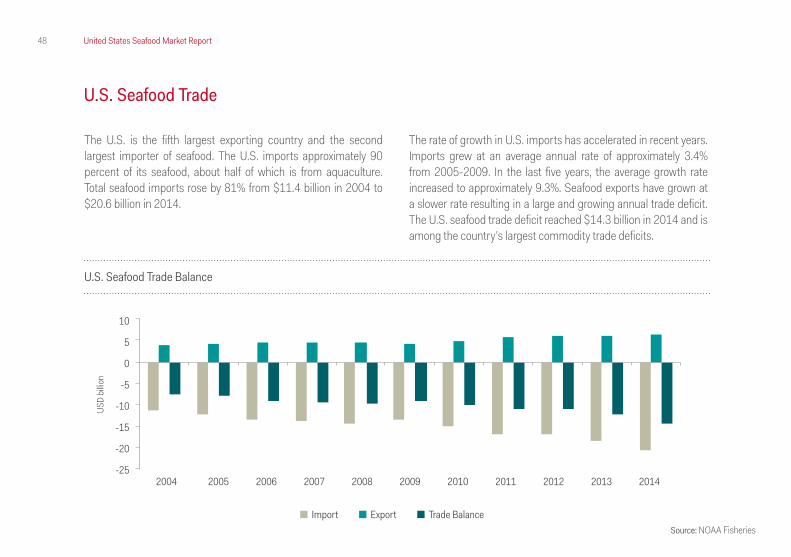
The U.S. is the fifth largest exporting country and the second largest importer of seafood. The U.S. imports approximately 90 percent of its seafood, about half of which is from aquaculture. Total seafood imports rose by 81% from $11.4 billion in 2004 to $20.6 billion in 2014.
Source: NOAA Fisheries
The rate of growth in U.S. imports has accelerated in recent years. Imports grew at an average annual rate of approximately 3.4% from 2005-2009. In the last five years, the average growth rate increased to approximately 9.3%. Seafood exports have grown at a slower rate resulting in a large and growing annual trade deficit. The U.S. seafood trade deficit reached $14.3 billion in 2014 and is among the country’s largest commodity trade deficits.
U.S. Seafood Trade Balance
2004 2005 2006 2007 2008 2009 2010 2011 2012 2013 2014
10
5
0
-5
-10
-15
-20
-25
Import Export Trade Balance
USD
billio
n
49United States Seafood Market Report
Source: NOAA Fisheries
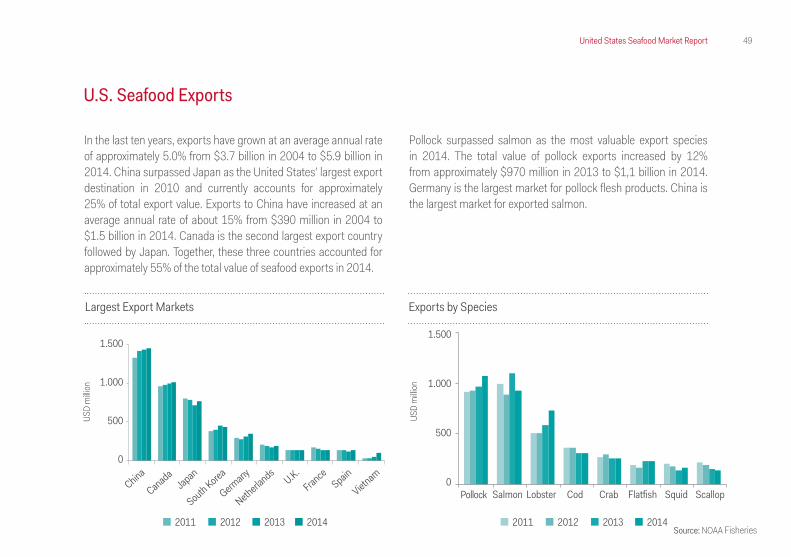
U.S. Seafood Exports
In the last ten years, exports have grown at an average annual rate of approximately 5.0% from $3.7 billion in 2004 to $5.9 billion in 2014. China surpassed Japan as the United States’ largest export destination in 2010 and currently accounts for approximately 25% of total export value. Exports to China have increased at an average annual rate of about 15% from $390 million in 2004 to $1.5 billion in 2014. Canada is the second largest export country followed by Japan. Together, these three countries accounted for approximately 55% of the total value of seafood exports in 2014.
Pollock surpassed salmon as the most valuable export species in 2014. The total value of pollock exports increased by 12% from approximately $970 million in 2013 to $1,1 billion in 2014. Germany is the largest market for pollock flesh products. China is the largest market for exported salmon.
Largest Export Markets Exports by Species
USD
milli
on
1.500
1.000
500
0
2011 2012 2013 2014
China
CanadaJapan
South Korea
Germany
NetherlandsFrance
U.K.Spain
Vietnam
1.500
1.000
500
0Pollock Salmon Lobster Cod FlatfishCrab Squid Scallop
2011 2012 2013 2014
USD
milli
on
50 United States Seafood Market Report
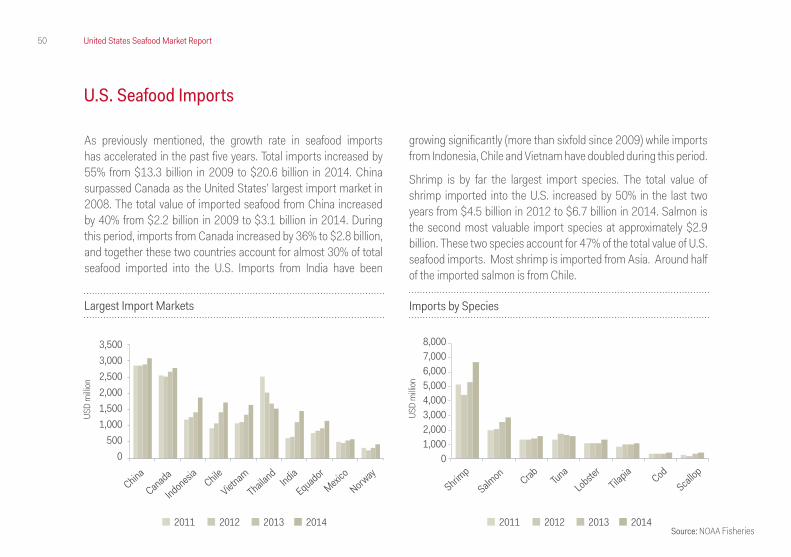
U.S. Seafood Imports
As previously mentioned, the growth rate in seafood imports has accelerated in the past five years. Total imports increased by 55% from $13.3 billion in 2009 to $20.6 billion in 2014. China surpassed Canada as the United States’ largest import market in 2008. The total value of imported seafood from China increased by 40% from $2.2 billion in 2009 to $3.1 billion in 2014. During this period, imports from Canada increased by 36% to $2.8 billion, and together these two countries account for almost 30% of total seafood imported into the U.S. Imports from India have been
growing significantly (more than sixfold since 2009) while imports from Indonesia, Chile and Vietnam have doubled during this period.
Shrimp is by far the largest import species. The total value of shrimp imported into the U.S. increased by 50% in the last two years from $4.5 billion in 2012 to $6.7 billion in 2014. Salmon is the second most valuable import species at approximately $2.9 billion. These two species account for 47% of the total value of U.S. seafood imports. Most shrimp is imported from Asia. Around half of the imported salmon is from Chile.
Largest Import Markets Imports by Species
USD
milli
on
USD
milli
on
3,5003,0002,5002,0001,5001,000
5000
8,0007,0006,0005,0004,0003,0002,0001,000
0
2011 2012 2013 2014 2011 2012 2013 2014
ChinaShrim
p
CanadaSalmon
Indonesia CrabChile Tuna
VietnamLobster
Tilapia
Equador
ThailandIndia Cod
Mexico
NorwayScallop
Source: NOAA Fisheries
51United States Seafood Market Report
Legal DisclaimerThis report was produced by Íslandsbanki hf.
The information in this report is based on publicly available data and information from various sources deemed to be reliable. The information has not been independently verified by Islandsbanki hf. (“Islandsbanki”) and Islandsbanki does not guarantee that the information is comprehensive or accurate. All views expressed herein are those of the author(s) at the time of writing and may change without notice. Islandsbanki holds no obligation to update, modify or amend this report or to otherwise notify readers or recipients of this report in the event that any matter contained herein changes or subsequently becomes inaccurate.
This report is informative in nature and should not be interpreted as a recommendation to take, or not to take, any particular investment action. This report does not represent an offer or a solicitation to buy, sell or subscribe to any particular financial instruments.
Islandsbanki accepts no liability for any potential losses or other consequences arising from decisions based on information in this report. Any loss arising from the use of the information in this report shall be the sole and exclusive responsibility of the investor. Before making an investment decision, it is important to seek expert advice and to become familiar with the investment market and different investment alternatives.
Various financial risks are at all times present during investment activities, such as the risk of no yield or the risk of losing the capital invested. International investments include risks related to political and economic uncertainties as well as currency risk. Each investor’s investment objectives and financial situation is different. Past
performance does not indicate or guarantee the future performance of an investment.
Reports and other information received from Islandsbanki are intended for private use only.
This material may not be copied, quoted or distributed, in whole or in part, without the prior written consent of Islandsbanki.
This report is a brief summary and does not purport to contain all available information on the subject covered herein.
Regulator: The Financial Supervision Authority of Iceland (www.fme.is)
United States. Neither this report nor copies of this report may be distributed in the United States. Distributing the report in the United States may be a breach of applicable laws or regulations.
Canada. The information provided in this publication is not intended to be distributed or circulated in any manner in Canada and should not be construed as any kind of financial recommendation or advice provided within the meaning of Canadian securities law.
Other countries. Laws and regulations of other countries may also restrict the distribution of this report.
This summary does not constitute any solicitation of services by Islandsbanki in the United States or Canada.
For further information relating to this disclaimer see: https://www.islandsbanki.is

52 United States Seafood Market Report
Íslandsbanki ResearchÍslandsbanki, Kirkjusandi, 155 Reykjavík, IcelandTel.: +354 440 4000
For more information, please visit our website:www.islandsbanki.is/seafood [email protected]