sleep deprivation and cardiovascular risk f.p. cappuccio md, msc, frcp, ffph, faha cephalon...
TRANSCRIPT
Sleep Deprivation and Sleep Deprivation and Cardiovascular RiskCardiovascular Risk
F.P. Cappuccio MD, MSc, FRCP, FFPH, FAHA
Cephalon Professor of Cardiovascular Medicine & Epidemiology
University of Warwick, “Sleep Health & Society Programme”,
Warwick Medical School, Coventry, UK
1
No conflicts of interest to declare

Publication trends in the field of sleep research Publication trends in the field of sleep research (Medline search 1945-2008 for *sleep*)(Medline search 1945-2008 for *sleep*)
Cappuccio FP, Miller MA, Lockley SW. Sleep, Health and Society, Oxford University Press 2010
1955 1965 1975 1985 1995 2005
REM
OSAS
SCNEDS
cPAP
Epidemiology
2
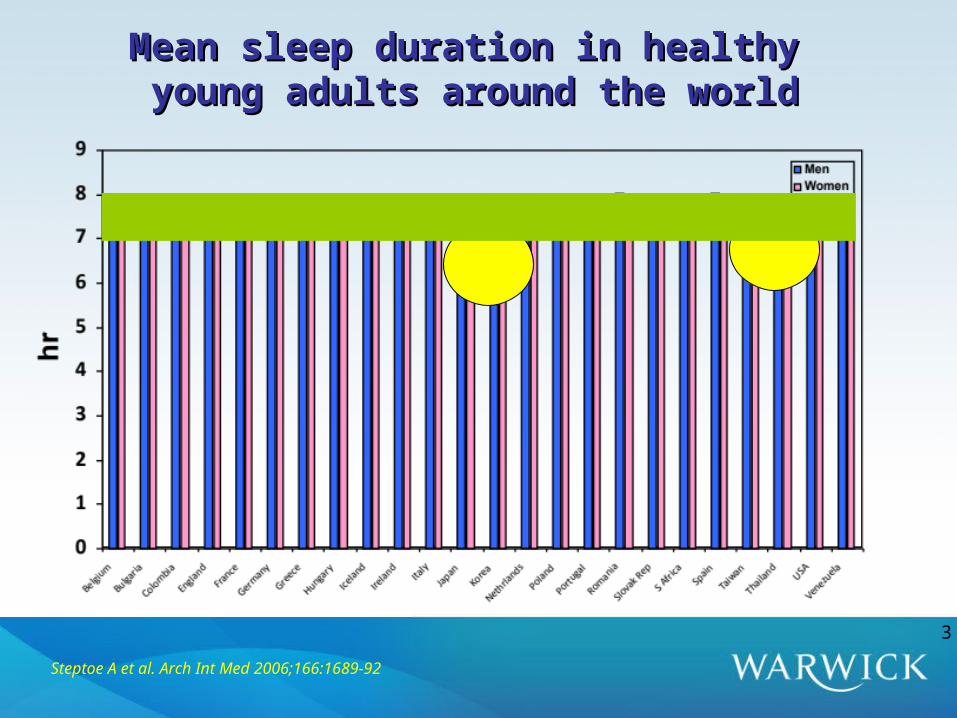
Mean sleep duration in healthy Mean sleep duration in healthy young adults around the worldyoung adults around the world
Steptoe A et al. Arch Int Med 2006;166:1689-92
3

Sleep duration and self-rated health problemsSleep duration and self-rated health problems
Steptoe A et al. Arch Int Med 2006;166:1689-92
Japan
Taiwan
Korea
Thailand
4
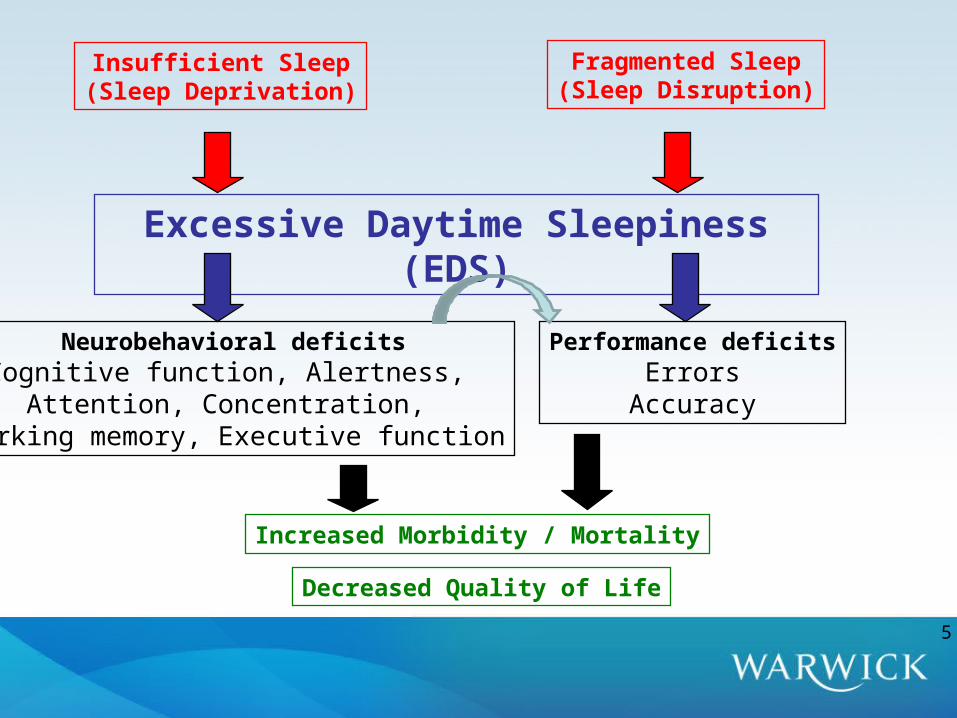
Increased Morbidity / Mortality
Decreased Quality of Life
Fragmented Sleep(Sleep Disruption)
Insufficient Sleep(Sleep Deprivation)
Excessive Daytime Sleepiness (EDS)
Neurobehavioral deficitsCognitive function, Alertness,
Attention, Concentration, Working memory, Executive function
Performance deficitsErrors
Accuracy
5
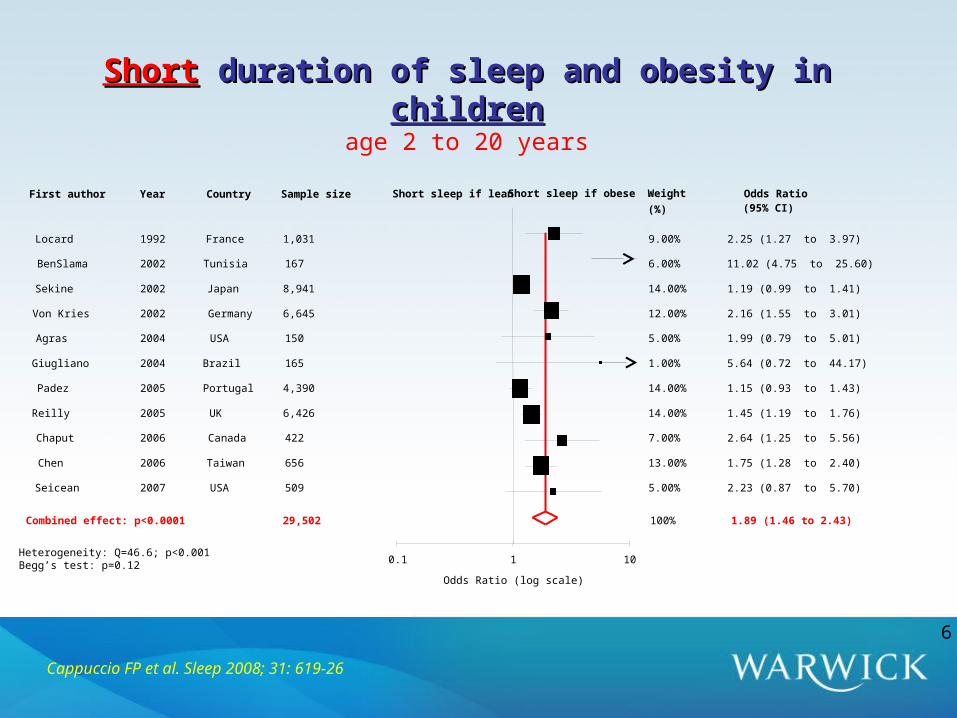
Weight Odds RatioFirst author Year Country Sample size
(%) (95% CI)
Locard 1992 France 1,031 9.00% 2.25 (1.27 to 3.97)
BenSlama 2002 Tunisia 167 6.00% 11.02 (4.75 to 25.60)
Sekine 2002 Japan 8,941 14.00% 1.19 (0.99 to 1.41)
Von Kries 2002 Germany 6,645 12.00% 2.16 (1.55 to 3.01)
Agras 2004 USA 150 5.00% 1.99 (0.79 to 5.01)
Giugliano 2004 Brazil 165 1.00% 5.64 (0.72 to 44.17)
Padez 2005 Portugal 4,390 14.00% 1.15 (0.93 to 1.43)
Reilly 2005 UK 6,426 14.00% 1.45 (1.19 to 1.76)
Chaput 2006 Canada 422 7.00% 2.64 (1.25 to 5.56)
Chen 2006 Taiwan 656 13.00% 1.75 (1.28 to 2.40)
Seicean 2007 USA 509 5.00% 2.23 (0.87 to 5.70)
Combined effect: p<0.0001 100% 1.89 (1.46 to 2.43)
0.1 1 10
Odds Ratio (log scale)
29,502
Heterogeneity: Q=46.6; p<0.001Begg’s test: p=0.12
Short sleep if obeseShort sleep if lean
ShortShort duration of sleep and obesity in duration of sleep and obesity in childrenchildrenage 2 to 20 years
Cappuccio FP et al. Sleep 2008; 31: 619-26
6

Cappuccio FP et al. Sleep 2008; 31: 619-26
Short Short duration of sleep and obesity in duration of sleep and obesity in adultsadultsage 15 to 102 years
Weight Odds RatioFirst author Year Country Sample size(%) (95% CI)
Vioque 2000 Spain 1,772 3.00% 3.35 (2.22 to 5.06)
Shigeta 2001 Japan 437 1.00% 1.97 (1.03 to 3.77)
Kripke 2002 USA 497,037 12.00% 1.52 (1.46 to 1.58)
Cournot 2004 France 3,127 4.00% 1.38 (0.97 to 1.96)
Hasler 2004 Switzerland 457 0.00% 10.8 (0.99 to 118.1)
Bjorkelund 2005 Sweden 1,460 1.00% 1.52 (0.68 to 3.40)
Gangwisch 1 2005 USA 3,682 5.00% 1.84 (1.40 to 2.42)
Gangwisch 2 2005 USA 3,324 6.00% 1.38 (1.07 to 1.78)
Gangwisch 3 2005 USA 2,582 4.00% 0.95 (0.67 to 1.35)
Singh 2005 USA 3,158 5.00% 1.70 (1.27 to 2.28)
Moreno 2006 Brazil 4,878 9.00% 1.22 (1.06 to 1.40)
Vahtera 2006 Finland 26,468 11.00% 1.43 (1.35 to 1.52)
Watari (men) 2006 Japan 19,894 2.00% 1.95 (1.20 to 3.19)
Watari (women) 2006 Japan 5,418 0.00% 2.97 (0.77 to 11.50)
Bjortvan 2007 Norway 8,860 3.00% 1.88 (1.22 to 2.89)
Chaput (men) 2007 Canada 323 1.00% 4.01 (1.73 to 9.33)
Chaput (women) 2007 Canada 417 1.00% 2.64 (1.25 to 5.56)
Ko 2007 Hong Kong 4,793 9.00% 1.30 (1.13 to 1.49)
Tuomilehto 2007 Finland 2,770 7.00% 1.30 (1.05 to 1.61)
Fogelholm (men) 2007 Finland 3,377 6.00% 1.46 (1.13 to 1.89)
Fogelholm (women) 2007 Finland 4,264 6.00% 1.75 (1.36 to 2.26)
Stranges 2008 UK 5,021 6.00% 2.01 (1.56 to 2.60)
Combined effect: p<0.0001 100% 1.55 (1.43 to 1.68)
0.1 1 10
Odds Ratio (log scale)
Heterogeneity: Q=64.0, p<0.001Begg’s test: p=0.09
603,519
Short sleep if obeseShort sleep if lean
7
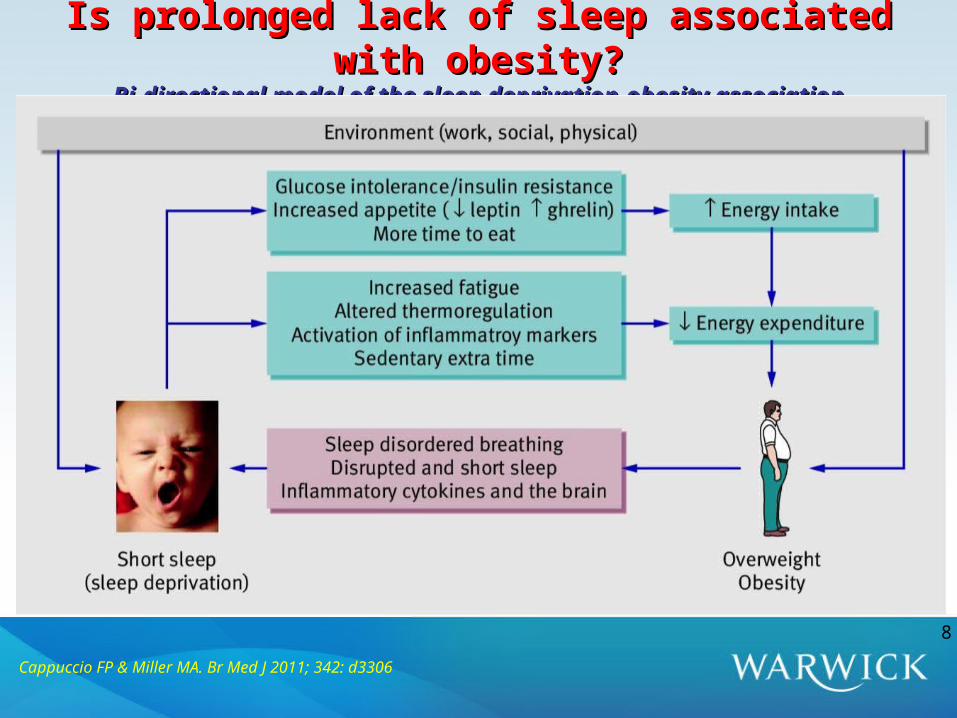
Is prolonged lack of sleep associated with obesity?Is prolonged lack of sleep associated with obesity?Bi-directional model of the sleep deprivation-obesity associationBi-directional model of the sleep deprivation-obesity association
8
Cappuccio FP & Miller MA. Br Med J 2011; 342: d3306
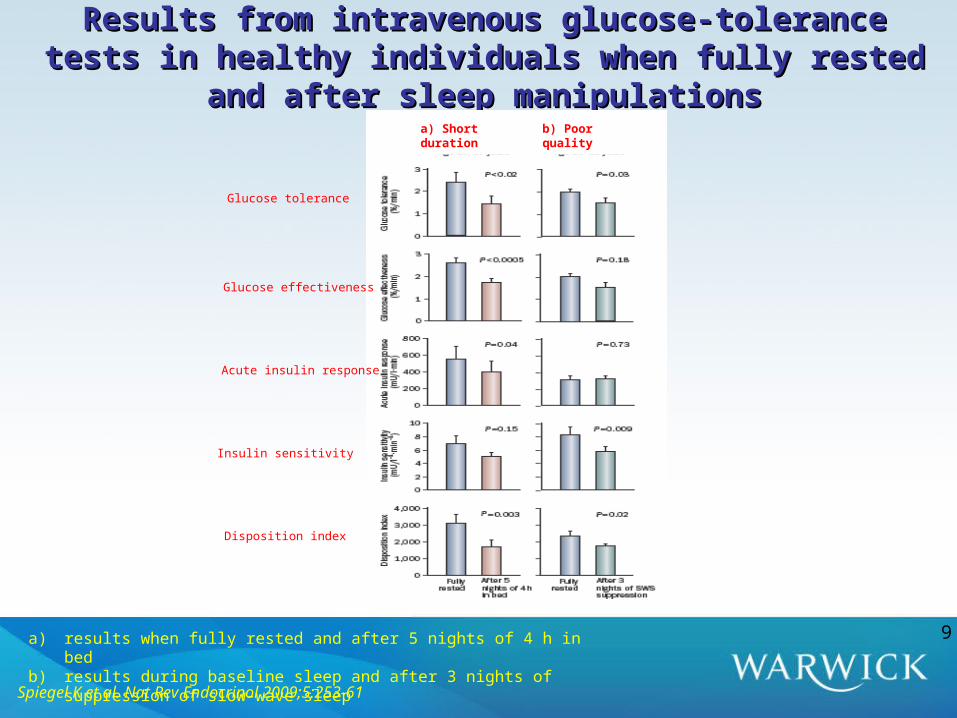
Results from intravenous glucose-tolerance tests in healthy Results from intravenous glucose-tolerance tests in healthy individuals when fully rested and after sleep manipulationsindividuals when fully rested and after sleep manipulations
Spiegel K et al. Nat Rev Endocrinol 2009;5:253-61
a) results when fully rested and after 5 nights of 4 h in bedb) results during baseline sleep and after 3 nights of suppression of slow-wave sleep
9
a) Short duration b) Poor quality
Glucose tolerance
Glucose effectiveness
Acute insulin response
Insulin sensitivity
Disposition index
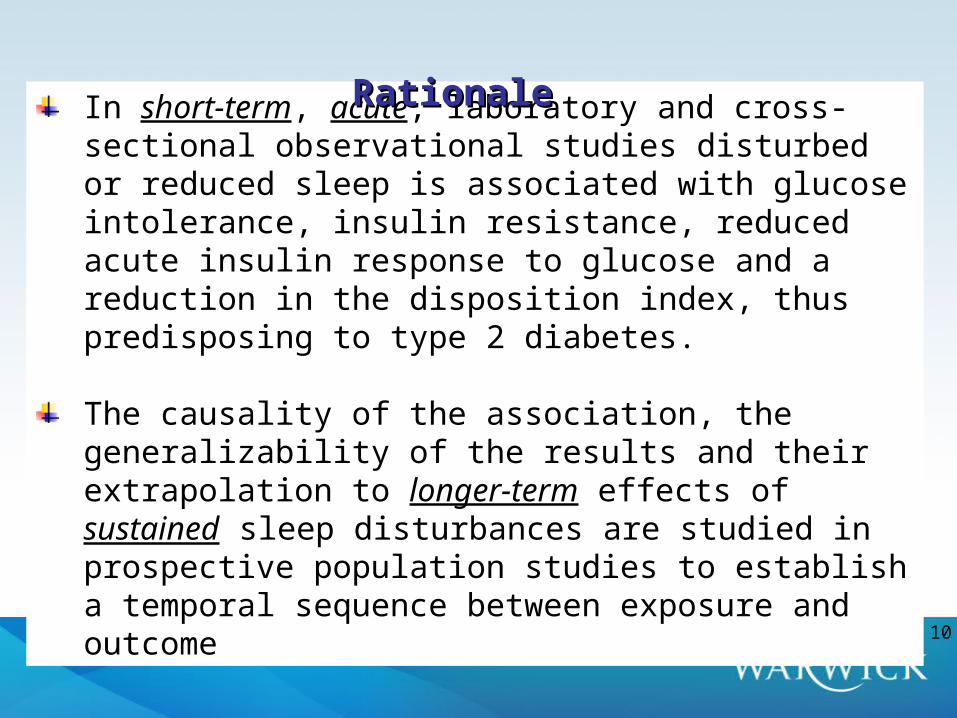
In short-term, acute, laboratory and cross-sectional observational studies disturbed or reduced sleep is associated with glucose intolerance, insulin resistance, reduced acute insulin response to glucose and a reduction in the disposition index, thus predisposing to type 2 diabetes.
The causality of the association, the generalizability of the results and their extrapolation to longer-term effects of sustained sleep disturbances are studied in prospective population studies to establish a temporal sequence between exposure and outcome
RationaleRationale
10

ShortShort duration of sleep and incidence of type-2 diabetes duration of sleep and incidence of type-2 diabetes
Author (ref)
Ayas8
Biorkelund10
Mallon (men)11
Mallon (women)11
Yaggi12
Gangwisch13
Hayashino15
Beihl (white)14
Beihl (black)14
Combined effect (random model): p=0.024
Reference Short sleepShort Sleep v Ref Relative RiskYear Country Sample size
(95% CI)
2003 USA 70,026 <5h v 8h 1.19 (0.97 to 1.44)
2005 Sweden 1,462 <6h v >6h 0.97 (0.83 to 1.14)
2005 Sweden 550 <5h v 6-8h 2.80 (1.09 to 7.18)
2005 Sweden 620 <5h v 6-8h 1.80 (0.49 to 6.71)
2006 USA 1,564 <5h v 7h 1.72 (0.81 to 3.61)
2007 USA 8,992 <5h v 7h 1.48 (1.04 to 2.11)
2007 Japan 6,509 <6h v 6-7h 1.15 (0.76 to 1.74)
2009 USA 662 <7h v 8h 2.16 (1.22 to 3.81)
2009 USA 238 <7h v 8h 0.47 (0.16 to 1.37)
1.28 (1.03 to 1.60)
IncidentCases
1,969
126
50
38
90
430
230
107
39
90,623 3,079
Heterogeneity: I2=58% (11 to 80); Q=18.9, p=0.015 Publication bias: Egger’s test p=0.14
Prevalenceof short sleep
4.3%
6.8%
6.9%
7.1%
9.4%
8.9%
n/a
66%
84%
0.1 1 10
Relative Risk (log scale)
Cappuccio FP et al. Diabetes Care; 2010;33:414-20
11
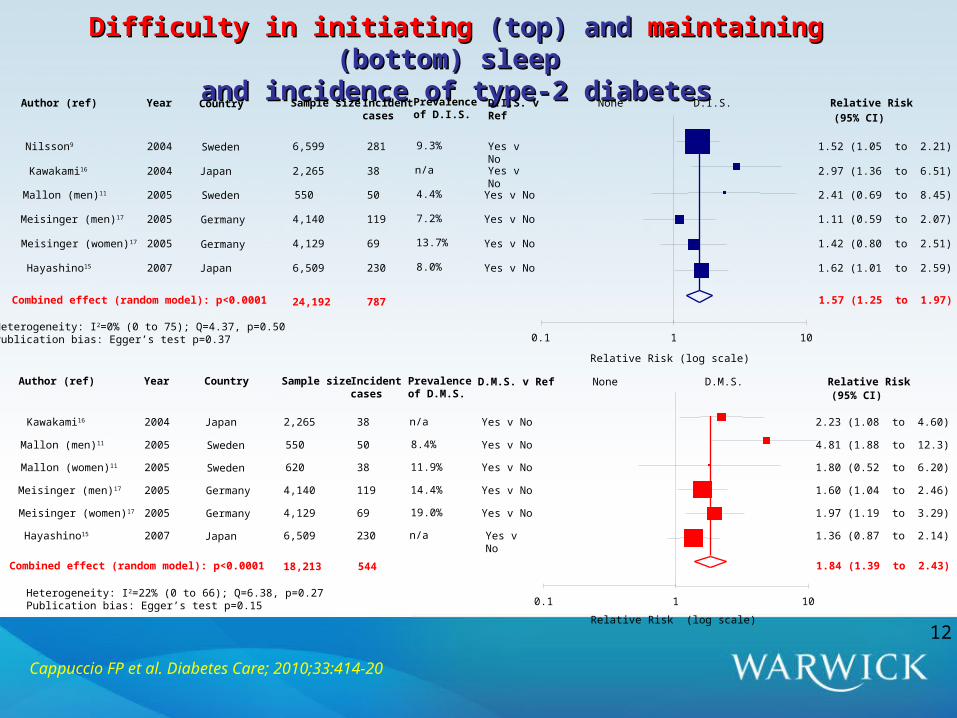
Difficulty in initiatingDifficulty in initiating (top) and (top) and maintainingmaintaining (bottom) sleep (bottom) sleep and incidence of type-2 diabetesand incidence of type-2 diabetes
None D.I.S.D.I.S. v Ref
Relative RiskAuthor (ref) Year Sample size Incidentcases (95% CI)
Nilsson9 2004 6,599 281 Yes v No
1.52 (1.05 to 2.21)
Kawakami16 2004 2,265 38 Yes v No
2.97 (1.36 to 6.51)
Mallon (men)11 2005 550 50 Yes v No 2.41 (0.69 to 8.45)
Meisinger (men)17 2005 4,140 119 Yes v No 1.11 (0.59 to 2.07)
Meisinger (women)17 2005 4,129 69 Yes v No 1.42 (0.80 to 2.51)
Hayashino15 2007 6,509 230 Yes v No 1.62 (1.01 to 2.59)
Combined effect (random model): p<0.0001 1.57 (1.25 to 1.97)
0.1 1 10
Relative Risk (log scale)
Country
Sweden
Japan
Sweden
Germany
Germany
Japan
24,192 787
Heterogeneity: I2=0% (0 to 75); Q=4.37, p=0.50 Publication bias: Egger’s test p=0.37
Prevalenceof D.I.S.
9.3%
n/a
4.4%
7.2%
13.7%
8.0%
Cappuccio FP et al. Diabetes Care; 2010;33:414-20
D.M.S. v Ref Relative RiskAuthor (ref) Year Sample size Incident cases (95% CI)
Kawakami16 2004 2,265 38 Yes v No 2.23 (1.08 to 4.60)
Mallon (men)11 2005 550 50 Yes v No 4.81 (1.88 to 12.3)
Mallon (women)11 2005 620 38 Yes v No 1.80 (0.52 to 6.20)
Meisinger (men)17 2005 4,140 119 Yes v No 1.60 (1.04 to 2.46)
Meisinger (women)17 2005 4,129 69 Yes v No 1.97 (1.19 to 3.29)
Hayashino15 2007 6,509 230 Yes v No
1.36 (0.87 to 2.14)
Combined effect (random model): p<0.0001 1.84 (1.39 to 2.43)
0.1 1 10
Relative Risk (log scale)
Heterogeneity: I2=22% (0 to 66); Q=6.38, p=0.27 Publication bias: Egger’s test p=0.15
Country
Japan
Sweden
Sweden
Germany
Germany
Japan
18,213 544
None D.M.S.Prevalenceof D.M.S.
n/a
8.4%
11.9%
14.4%
19.0%
n/a
12
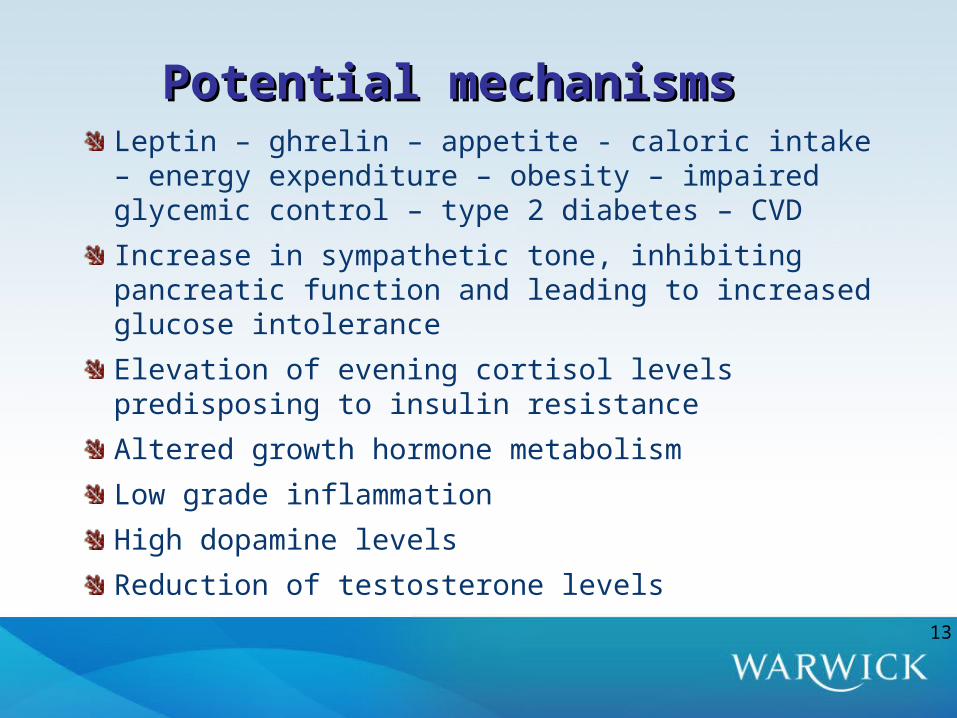
Potential mechanismsPotential mechanismsLeptin – ghrelin – appetite - caloric intake – energy expenditure – obesity – impaired glycemic control – type 2 diabetes – CVD
Increase in sympathetic tone, inhibiting pancreatic function and leading to increased glucose intolerance
Elevation of evening cortisol levels predisposing to insulin resistance
Altered growth hormone metabolism
Low grade inflammation
High dopamine levels
Reduction of testosterone levels13
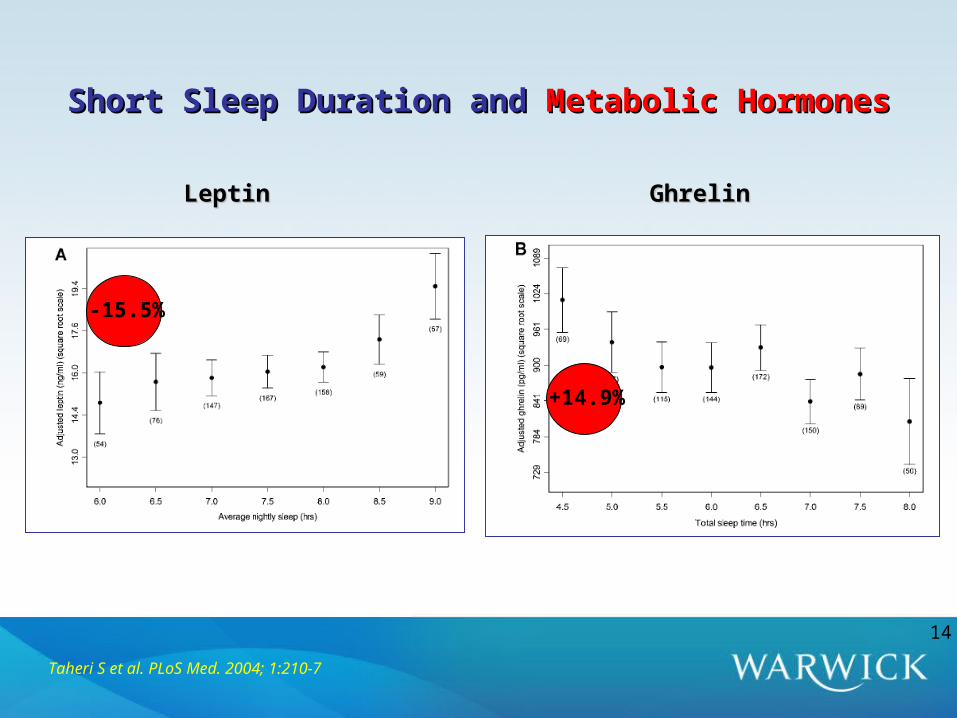
Short Sleep Duration and Short Sleep Duration and Metabolic HormonesMetabolic Hormones
Taheri S et al. PLoS Med. 2004; 1:210-7
LeptinLeptin GhrelinGhrelin
-15.5%
+14.9%
14

Effect of sleep duration on leptin and ghrelin levelsEffect of sleep duration on leptin and ghrelin levels
a) Mean (seM) leptin and serum plasma ghrelin levels in healthy individuals after 2 days with 4 h or 10 h sleep periods b) Mean (seM) 24 h serum leptin profiles after 6 days of 4 h, 8 h and 12 h in bed in nine healthy, lean men, studied at bed rest who ate
three identical carbohydrate-rich meals. At the end of these study periods, the participants slept an average of 3 h 48 min in the 4 h in bed group, 6 h 52 min in the 8 h in bed group, and 8 h 52 min in the 12 h in bed group. All characteristics of the 24 h leptin profile increased from the 4 h to the 12 h bedtime condition. The bars represent sleep periods
Spiegel K et al. Nat Rev Endocrinol 2009;5:253-61
15
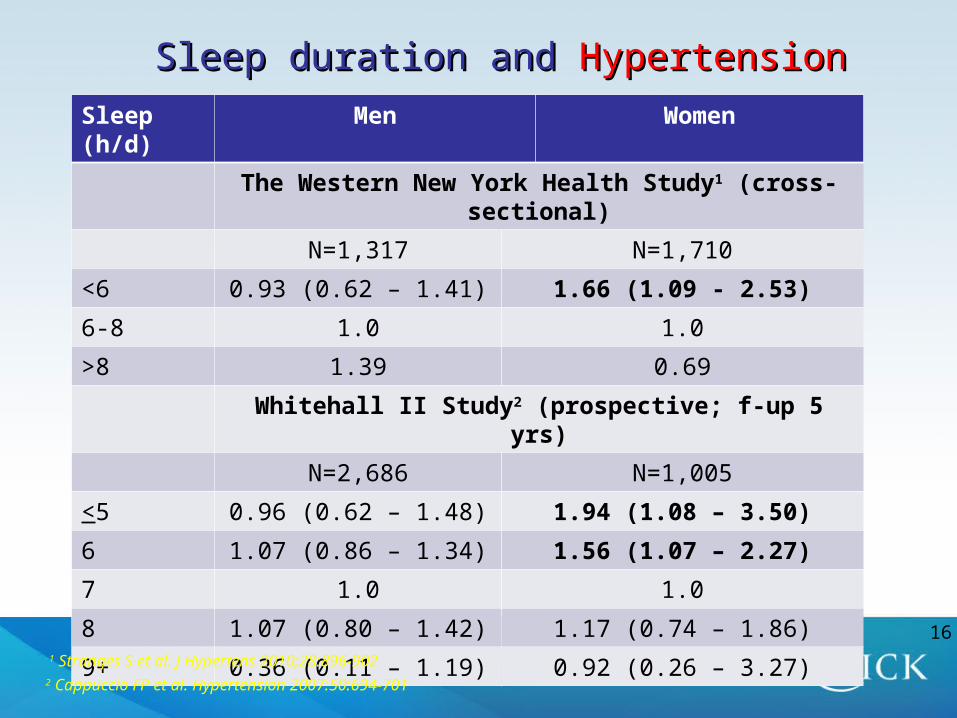
Sleep duration and Sleep duration and HypertensionHypertension
Sleep (h/d) Men Women
The Western New York Health Study1 (cross-sectional)
N=1,317 N=1,710
<6 0.93 (0.62 – 1.41) 1.66 (1.09 - 2.53)
6-8 1.0 1.0
>8 1.39 0.69
Whitehall II Study2 (prospective; f-up 5 yrs)
N=2,686 N=1,005
<5 0.96 (0.62 – 1.48) 1.94 (1.08 – 3.50)
6 1.07 (0.86 – 1.34) 1.56 (1.07 – 2.27)
7 1.0 1.0
8 1.07 (0.80 – 1.42) 1.17 (0.74 – 1.86)
9+ 0.36 (0.11 – 1.19) 0.92 (0.26 – 3.27)
1 Stranges S et al. J Hypertens 2010;28:896-9022 Cappuccio FP et al. Hypertension 2007:50:694-701
16
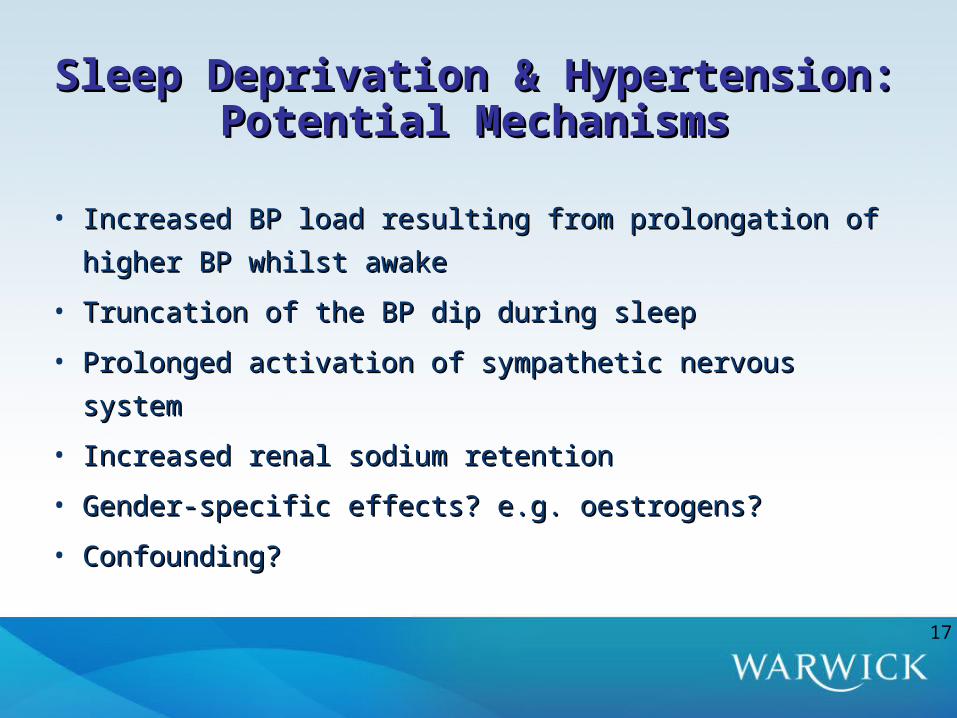
• Increased BP load resulting from prolongation of higher BP Increased BP load resulting from prolongation of higher BP
whilst awakewhilst awake
• Truncation of the BP dip during sleepTruncation of the BP dip during sleep
• Prolonged activation of sympathetic nervous systemProlonged activation of sympathetic nervous system
• Increased renal sodium retentionIncreased renal sodium retention
• Gender-specific effects? e.g. oestrogens?Gender-specific effects? e.g. oestrogens?
• Confounding?Confounding?
Sleep Deprivation & Hypertension:Sleep Deprivation & Hypertension:Potential MechanismsPotential Mechanisms
17
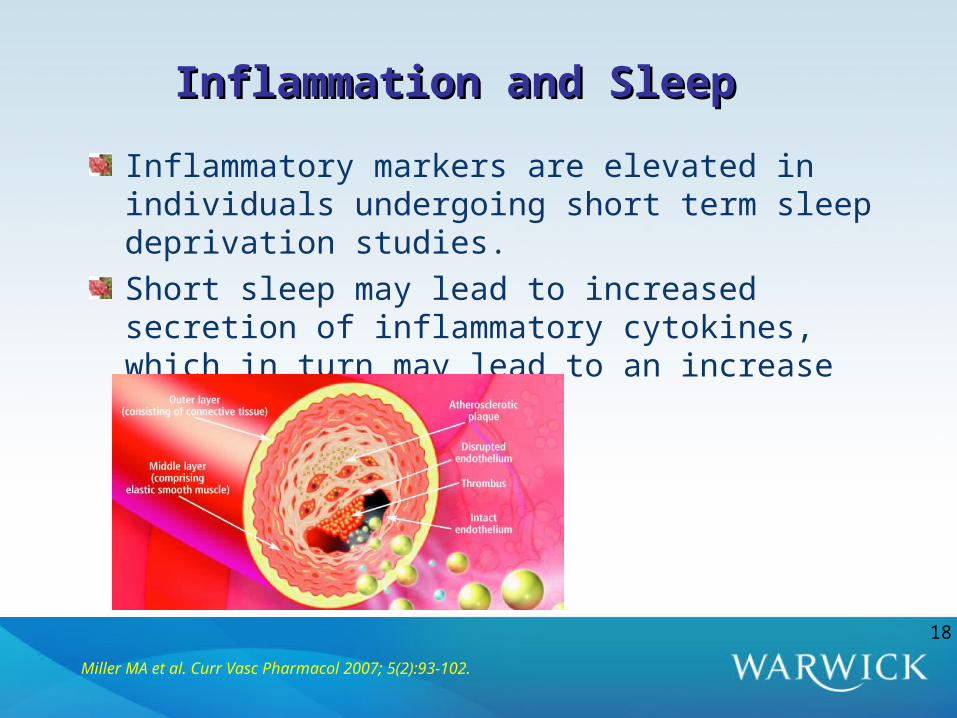
Inflammation and SleepInflammation and Sleep
Inflammatory markers are elevated in individuals undergoing short term sleep deprivation studies. Short sleep may lead to increased secretion of inflammatory cytokines, which in turn may lead to an increase in cardiovascular risk
Miller MA et al. Curr Vasc Pharmacol 2007; 5(2):93-102.
18
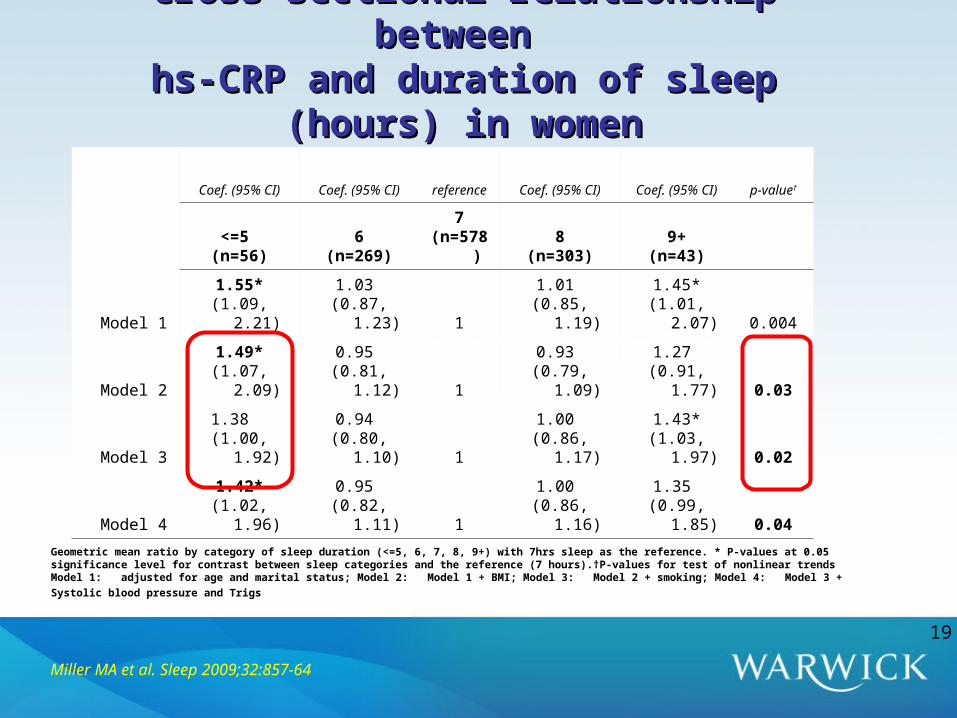
Cross sectional relationship between Cross sectional relationship between hs-CRP and duration of sleep (hours) in womenhs-CRP and duration of sleep (hours) in women
Coef. (95% CI) Coef. (95% CI) reference Coef. (95% CI) Coef. (95% CI) p-value†
<=5 (n=56)
6(n=269)
7(n=578)
8(n=303)
9+(n=43)
Model 11.55*
(1.09, 2.21)1.03
(0.87, 1.23) 11.01
(0.85, 1.19)1.45*
(1.01, 2.07) 0.004
Model 21.49*
(1.07, 2.09)0.95
(0.81, 1.12) 10.93
(0.79, 1.09)1.27
(0.91, 1.77) 0.03
Model 31.38
(1.00, 1.92)0.94
(0.80, 1.10) 11.00
(0.86, 1.17)1.43*
(1.03, 1.97) 0.02
Model 41.42*
(1.02, 1.96)0.95
(0.82, 1.11) 11.00
(0.86, 1.16)1.35
(0.99, 1.85) 0.04
Geometric mean ratio by category of sleep duration (<=5, 6, 7, 8, 9+) with 7hrs sleep as the reference. * P-values at 0.05 significance level for contrast between sleep categories and the reference (7 hours).†P-values for test of nonlinear trendsModel 1: adjusted for age and marital status; Model 2: Model 1 + BMI; Model 3: Model 2 + smoking; Model 4: Model 3 + Systolic blood pressure and Trigs
Miller MA et al. Sleep 2009;32:857-64
19
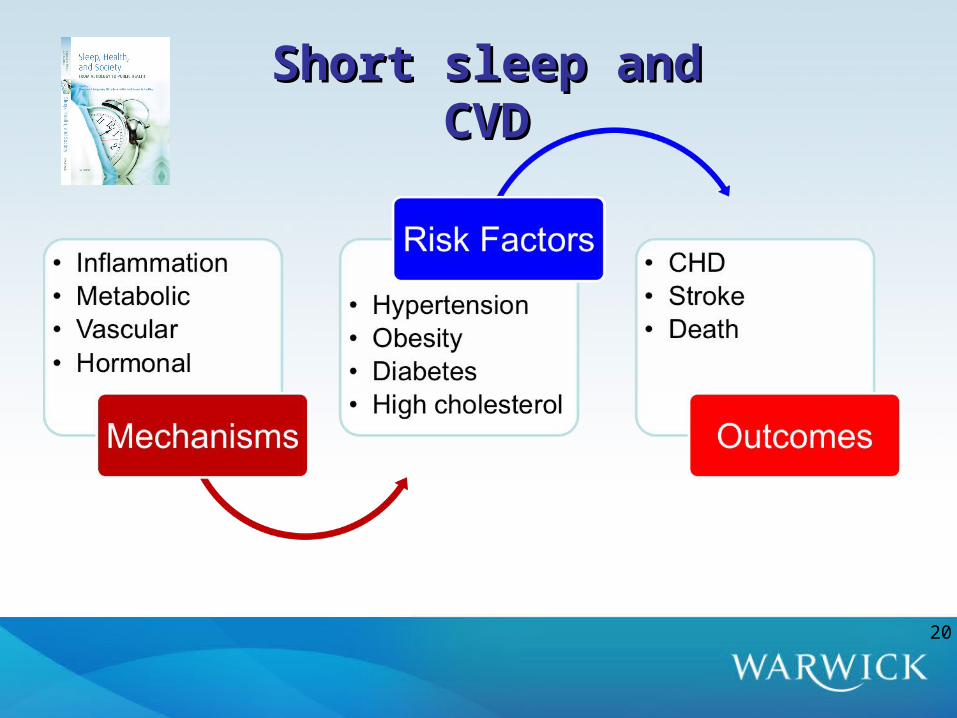
Short sleep and CVDShort sleep and CVD
20
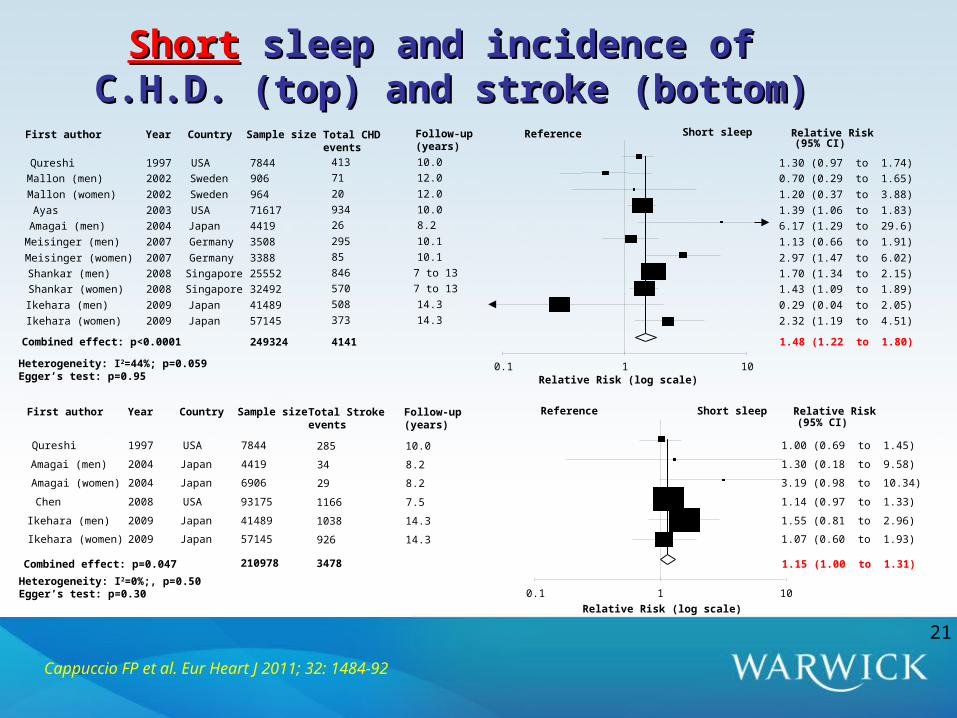
ShortShort sleep and incidence of sleep and incidence of C.H.D. (top) and stroke (bottom)C.H.D. (top) and stroke (bottom)
Relative RiskFirst author Year Country Sample size(95% CI)
Qureshi 1997 USA 7844 1.30 (0.97 to 1.74)
Mallon (men) 2002 Sweden 906 0.70 (0.29 to 1.65)
Mallon (women) 2002 Sweden 964 1.20 (0.37 to 3.88)
Ayas 2003 USA 71617 1.39 (1.06 to 1.83)
Amagai (men) 2004 Japan 4419 6.17 (1.29 to 29.6)
Meisinger (men) 2007 Germany 3508 1.13 (0.66 to 1.91)
Meisinger (women) 2007 Germany 3388 2.97 (1.47 to 6.02)
Shankar (men) 2008 Singapore 25552 1.70 (1.34 to 2.15)
Shankar (women) 2008 Singapore 32492 1.43 (1.09 to 1.89)
Ikehara (men) 2009 Japan 41489 0.29 (0.04 to 2.05)
Ikehara (women) 2009 Japan 57145 2.32 (1.19 to 4.51)
Combined effect: p<0.0001 1.48 (1.22 to 1.80)
Follow-up(years)
Total CHD events
Reference
413 10.0
71 12.0
20 12.0
934 10.0
26 8.2
295 10.1
85 10.1
846 7 to 13
570 7 to 13
508 14.3
373 14.3
249324 4141
Short sleep
Heterogeneity: I2=44%; p=0.059Egger’s test: p=0.95
0.1 1 10Relative Risk (log scale)
Relative RiskFirst author Year Country Sample size(95% CI)
Qureshi 1997 USA 7844 1.00 (0.69 to 1.45)
Amagai (men) 2004 Japan 4419 1.30 (0.18 to 9.58)
Amagai (women) 2004 Japan 6906 3.19 (0.98 to 10.34)
Chen 2008 USA 93175 1.14 (0.97 to 1.33)
Ikehara (men) 2009 Japan 41489 1.55 (0.81 to 2.96)
Ikehara (women) 2009 Japan 57145 1.07 (0.60 to 1.93)
Combined effect: p=0.047 1.15 (1.00 to 1.31)
0.1 1 10
Relative Risk (log scale)
ReferenceTotal Stroke events
Follow-up(years)
285 10.0
34 8.2
29 8.2
1166 7.5
1038 14.3
926 14.3
Heterogeneity: I2=0%;, p=0.50Egger’s test: p=0.30
210978 3478
Short sleep
Cappuccio FP et al. Eur Heart J 2011; 32: 1484-92
21

Relative RiskFirst author Year Sample size Deaths (95% CI)
Tsubono 1993 4,318 207 1.26 (0.80 to 1.98)
Ruigomez (men) 1995 395224
1.06 (0.61 to 1.84)
Ruigomez (women) 1995 594 0.66 (0.37 to 1.16)
Gale 1998 1,299 1,158 1.00 (0.54 to 1.84)
Kojima (men) 2000 2,438 147 1.93 (1.12 to 3.35)
Kojima (women) 2000 2,884 109 0.90 (0.50 to 1.61)
Heslop (men) 2002 6,022 2,303 1.00 (0.89 to 1.12)
Heslop (women) 2002 1,006 262 0.98 (0.70 to 1.37)
Kripke (men) 2002 480,841 45,200 1.11 (1.04 to 1.17)
Kripke (women) 2002 636,095 32,440 1.07 (1.01 to 1.14)
Mallon (men) 2002 906 165 1.11 (0.32 to 3.80)
Mallon (women) 2002 964 101 1.00 (0.58 to 1.73)
Amagai (men) 2004 4,419 289 2.41 (1.34 to 4.34)
Amagai (women) 2004 6,906 206 0.70 (0.21 to 2.35)
Patel 2004 82,969 5,409 1.08 (0.96 to 1.22)
Ferrie 2007 9,871 566 1.25 (0.93 to 1.67)
Hublin (men) 2007 9,529 1,850 1.26 (1.12 to 1.42)
Hublin (women) 2007 10,265 1,850 1.21 (1.05 to 1.39)
Lan (men) 2007 1,748 816 0.98 (0.76 to 1.26)
Lan (women) 2007 1,331 522 1.14 (0.77 to 1.69)
Gangwisch (32-59) 2008 5,806 273 0.67 (0.43 to 1.05)
Gangwisch (60-86) 2008 3,983 1,604 1.27 (1.07 to 1.52)
Ikehara (men) 2009 41,489 8,548 1.28 (1.01 to 1.62)
Ikehara (women) 2009 57,145 5,992 1.28 (1.04 to 1.59)
Stone 2009 8,101 1,922 1.02 (0.87 to 1.19)
Combined effect: P<0.01 1.12 (1.06 to 1.18)
0.1 1 10Relative Risk (log scale)
Heterogeneity: I2=39%; Q=39.4, p=0.02Publication bias: Egger’s test: p=0.74
Short Sleep v Reference SHORT SLEEPREFERENCE
<6 v 7-8h
<7 v 7-9h
<7 v 9h
<7 v 7-8.9h
<7 v 7-8h
5 v 7h
<6 v 7h
<6 v 7-7.9h
<5 v 7h
<5 v 7h
<7 v 7-8h
<7 v 7-7.9h
<5 v 7h
<4 v 7h
<6 v 6-8h
1,381,324 112,163
ShortShort duration of sleep and all-cause mortalityduration of sleep and all-cause mortality
Cappuccio FP et al. Sleep 2010; 33:585-92
22

CVD mortalityCVD mortality from Phase 3 by the change from Phase 3 by the change in sleep between Phase 1 and Phase 3in sleep between Phase 1 and Phase 3
Increase from 5 or 6h(16 deaths)
Decrease from 6, 7 or 8h(24 deaths)
Increase from 7 or 8h(12 deaths)
Hazard Ratio (95% CI)
Age-adjustedFully adjusted
Ferrie JE et al. Sleep 2007; 30: 1659-66
23
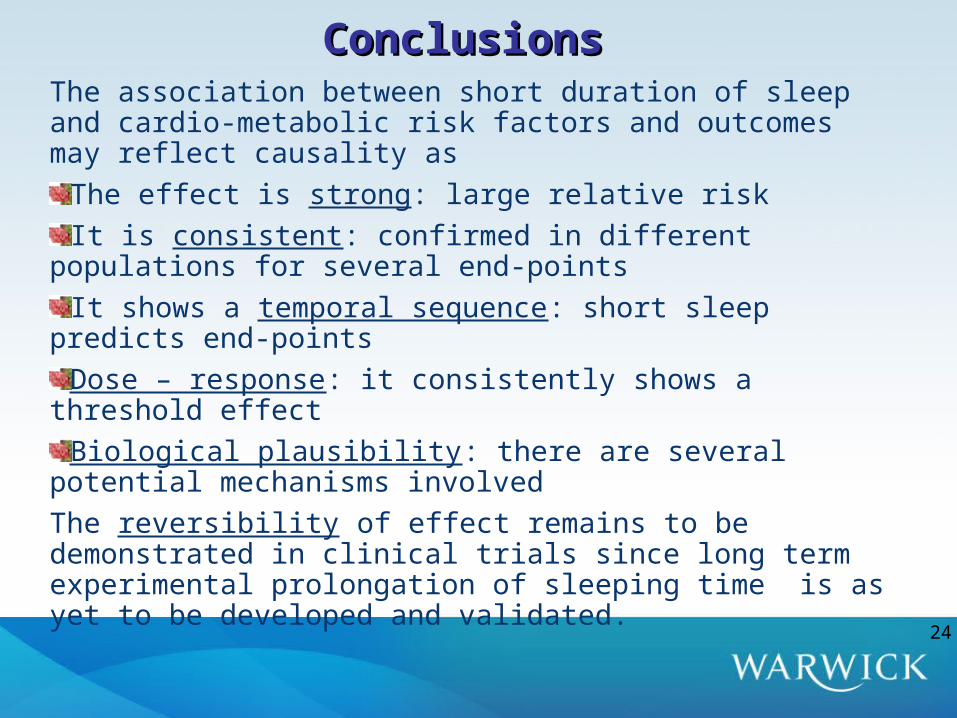
ConclusionsConclusionsThe association between short duration of sleep and cardio-metabolic risk factors and outcomes may reflect causality as
The effect is strong: large relative riskIt is consistent: confirmed in different populations for several
end-pointsIt shows a temporal sequence: short sleep predicts end-pointsDose – response: it consistently shows a threshold effectBiological plausibility: there are several potential mechanisms
involvedThe reversibility of effect remains to be demonstrated in clinical trials since long term experimental prolongation of sleeping time is as yet to be developed and validated.
24
25
SLEEP, HEALTH & SOCIETYSLEEP, HEALTH & SOCIETYUniversity of Warwick, Warwick Medical SchoolUniversity of Warwick, Warwick Medical School
[email protected]@warwick.ac.uk
Leads:Leads: FP Cappuccio & MA MillerFP Cappuccio & MA Miller
Warwick Team:Warwick Team: E Peile, S Stranges, N-B Kandala, FM Taggart, E Peile, S Stranges, N-B Kandala, FM Taggart,
C Ji, G Ward, A Bakewell, A Currie, A Lowe, D CooperC Ji, G Ward, A Bakewell, A Currie, A Lowe, D Cooper
Collaborators: Collaborators:
WarwickWarwick S WilliamsS Williams
R.C.P.R.C.P. R Pounder R Pounder
U.C.L.U.C.L. MG Marmot, E Brunner, M Kumari, M Shipley, JE Ferrie, MG Marmot, E Brunner, M Kumari, M Shipley, JE Ferrie,
M KivimakiM Kivimaki
Boston Boston ((Harvard)Harvard) C Czeisler, SW Lockley, CP Landrigan, JP SullivanC Czeisler, SW Lockley, CP Landrigan, JP Sullivan
Naples (Federico II)Naples (Federico II) P Strazzullo, L DP Strazzullo, L D’’EliaElia
AvellinoAvellino (CNR)(CNR) G BarbaG Barba
Buffalo (SUNY)Buffalo (SUNY) J Dorn, R Donhaue, M TrevisanJ Dorn, R Donhaue, M Trevisan
Funding:Funding: Cephalon Inc., Wingate Foundation, Whitehall II, Cephalon Inc., Wingate Foundation, Whitehall II,
RDF University of Warwick, NHS WorkforceRDF University of Warwick, NHS Workforce25