sleeping giant or mirage? - viridis-iq.de giant or mirage? the potential of pv in and for saudi...
TRANSCRIPT
SLEEPING GIANT OR MIRAGE?The potential of PV in and for Saudi Arabia
Gold SponsorsPartner Silver Sponsors


3
THE POTENTIAL OF PV IN AND FOR SAUDI ARABIA
Summary
The Kingdom of Saudi Arabia plans to introduce a support scheme for renewable energy.
Details of the program are still under discussion but a decision is expected in the short term.
The Gross Domestic Product (GDP) in Saudi Arabia grew by 6.8% in 2012. The observed
economic growth goes hand in hand with an increasing electricity demand. As a result,
an increasing share of oil production is required for domestic electricity generation.
Due to the high solar irradiation PV is a cost competitive alternative in the Kingdom of
Saudi Arabia. Oil and gas powered plants can be utilized flexibly and therefore match the
volatile renewable generation patterns. Solar has a huge offsetting potential: Oil which is
currently used for domestic electricity generation can be sold on the world market instead.
The benefits of the deployment of the renewable program will not be limited to cost ef-
ficient power generation alone. Saudi Arabia will further ramp up a local PV manufactur-
ing industry: The closing of existing gaps in the c-Si PV value chain (i.e. the establishment
of a production for metallurgical silicon and solar cells) will lead to many benefits for the
involved partners. When choosing the right technology path, region-specific character-
istics could be taken into account to reveal attractive niche markets. Four cost categories
determine the viability and competitiveness of a distributed or co-located integrated PV
cluster: local procurement conditions, labor costs, depreciation on fixed assets and long-
term electricity prices which are amongst the lowest in KSA.
Besides creating direct and indirect jobs within the country, the social benefits will also be
increased by spill-over effects on adjacent industries. Long-term educational benefits are
likely to arise in academic fields as well that could help KSA to develop a unique know-
ledge basis and take the leading position within the region.
ةيالمستقبل تايمكاناإل :عوديةسال العربية المملكة في الضوئية أللواحا
االقتراحاتموجز/الاتخاذ ا متوقعكان انالبحث و وال تزال تفاصيل هذا البرنامج قيد برنامج دعم للطاقة المتجددةتخطط المملكة العربية السعودية لطرح
.في القريب العاجلبهذا الصدد قرار
هذا النمو ويقترن .2012في عام % 6.8بنسبة ا نمو قد شهد المحلي اإلجمالي في المملكة العربية السعودية الناتج وكان
إنتاج النفط لتوليد الطاقة من حصة الزيادة أصبح من الضروريونتيجة لذلك، االقتصادي الملحوظ بزيادة الطلب على الكهرباء.
الالزمة لألغراض المنزلية.
تحويليمكن إذ ، تعد األلواح الضوئية بديال منخفض التكلفةالتي تتمتع بها المملكة العربية السعودية الوفيرة شمسيةال لطاقةلونتيجة
صورمع هذه المصانع تتماشى س وبالتالي ،لتعمل بالطاقة الشمسية شديدة النفط والغاز بمرونة التي تستمد طاقتها من مصانعال
ا لتوليد الكهرباء الذي يستخدم حالي للنفط المتوازن دور البديل الطاقة الشمسية تلعبس ،بهذه الصورةو المتقلبة. توليد الطاقة المتجددة
.عوضا عن استخدامه في توليد الطاقةحيث يمكن بيع هذا النفط في السوق العالمية لألغراض المنزلية
بل تسعى المملكة العربية السعودية ، فحسبفضة التكلفة توليد طاقة منخ علىمزايا تفعيل برنامج الطاقة المتجددة ولن تقتصر
(أي c-SI PVأللواح الضوئية الحالية انتاج افي لسد العجز الموجود األلواح الضوئية محلي لتصنيعال االنتاجلتوسيع نطاق
لشركاء المعنيين. فعند اختيار المسار التقني ا على مما سيعود بالنفعوالخاليا الشمسية) المعدنيتأسيس خط إنتاج للسيليكون
. باستيعابها للمنتجتتسم متخصصة الصحيح، يمكن أخذ الخصائص المميزة لمنطقة محددة بعين االعتبار لكشف النقاب عن أسواق
ذات ه المجموعة هذسواء كانت -لواح الضوئية لأل المنتجةمجموعات الإحدى وقابلية تنافسية وتحدد أربع فئات من التكلفة مدى
شروط الشراء المحلية، وتكاليف العمل، واستهالك األصول الثابتة وأسعار واالزدهار: للنمو -واحد موقعمتمركزة في أو جد موزعاتو
تأتي ضمن األسعار األقل على اإلطالق في المملكة العربية السعودية.طويلة األجل التي الالكهرباء
ما ستحظى بهمن خالل رة وغير مباشرة داخل حدود الدولة، ستتزايد المنافع االجتماعيةفضال عن إيجاد فرص عمل مباشو
األمر الذي من شأنه ،. ومن المحتمل أيضا أن ترتفع المزايا التعليمية في المجاالت األكاديميةمن آثار جمة مجاورةالصناعات ال
المنطقة. فيمكانة رائدة وتبوؤمن نوعه مساعدة المملكة العربية السعودية في تطوير أساس معرفي فريد


5
TABLE OF CONTENT
THE POTENTIAL OF PV IN AND FOR SAUDI ARABIA ..............................................3
Summary ...........................................................................................................................3
ENERGY SCENARIOS FOR KSA – NEED FOR RENEWABLE ENERGIES ......................6
Dependency on oil and gas jeopardize economic growth ...................................................6
Solar resources in KSA .......................................................................................................6
PV INSTALLATIONS IN KSA ..................................................................................7
In KSA solar is a cost competitive alternative ......................................................................7
Installation targets .............................................................................................................8
Cost saving potential .........................................................................................................8
LEARNING FROM OTHER MARKETS .....................................................................9
Feed-in-tariffs are a phase out model .................................................................................9
PV in KSA: Different market drivers ....................................................................................9
DOMESTIC PV MANUFACTURING – GENERATING LOCAL VALUE .........................10
Motivation factors for local manufacturing .........................................................................10
Social benefits from the establishment of a c-Si PV manufacturing cluster ..........................11
Spill-over effects from local manufacturing.........................................................................12
Social impacts resulting from a c-Si PV manufacturing cluster .............................................13
Manufacturing along the PV value chain – Developing the Saudi solar industry ..................14
Current trend to local manufacturing .................................................................................16
PV Solar technology roadmap: Adapting to the region .......................................................17
Best practice: Developing a PV industry step by step ...........................................................18
Cost categories for PV manufacturing ................................................................................19
Ecological impacts ..............................................................................................................20
KSA – GREEN LIGHTHOUSE PROJECT FOR THE ENTIRE REGION ............................21
KSA – Technology and production hub in the MENA region ...............................................21
ABOUT THE AUTHORS .........................................................................................22
EuPD Research ...................................................................................................................22
Viridis.iQ GmbH .................................................................................................................22
COOPERATION PARTNER ......................................................................................23
Saudi Arabia Solar Industry Association (SASIA) ..................................................................23
MEYER BURGER TECHNOLOGY LTD .....................................................................25
SMA SOLAR TECHNOLOGY AG ...........................................................................26
SIC PROCESSING (DEUTSCHLAND) GMBH ...........................................................28
SINGULUS TECHNOLOGIES .................................................................................29
AIR LIQUIDE ........................................................................................................30
IMPRINT ...............................................................................................................32

6
ENERGY SCENARIOS FOR KSA – NEED FOR RENEWABLE ENERGIES
Dependency on oil and gas jeopardize economic
growth
With a surface of 2,149,690 sq.km1, the Kingdom of Sau-
di Arabia is the 13th largest country in the world. Accord-
ing to 2013 estimates, the population of the country is ap-
proximately 27,000,0002 and growing at a rate of 1.51%
per year. Since the year 2000, the country has shown a
steady growth in gross domestic product (GDP) figures –
barring a one-time dip in 2009. In 2012, the GDP grew at
the rate of 6.8%. Saudi Arabia is an oil-based economy
with the petroleum industry accounting for 45% of the
GDP.
1 CIA Factbook: https://www.cia.gov/library/publications/the-world-fact-book/geos/sa.html
2 CIA Factbook: https://www.cia.gov/library/publications/the-world-fact-book/geos/sa.html
An increasing energy demand has accompanied the King-
dom’s economic growth and the generation capacities
have been extended. Generation capacities grew by 13%
per year between 1971 and 2009 and 6.2% during the
years from 1999 to 2009. Applying a similar compound
annual growth rate (6.2%) for the upcoming years, 300
TWh would be reached in 2015.3 The peak power de-
mand is expected to nearly triple in the next 20 years.
In 2000, 24% of the country’s oil and gas production
was used to cover domestic needs. In 2010, this share
increased to 35% and estimates suggest that more than
40% of the oil and gas production will be required in
order to cover the domestic demand by 2020. Further-
more, domestic oil consumption is expected to exceed oil
exports by the year 2025. This trend towards domestic
consumption of oil jeopardizes economic growth.
In order to counter this trend, Saudi Arabia’s Alternative
Energy Program aims to:
• CONTRIBUTE to a sustainable future for Saudi Arabia
• PRESERVE non-renewable fossil fuel resources
• SAFEGUARD KSA‘s international energy leadership
• ENSURE long-term global energy market stability
• TRANSFORM KSA into the Kingdom of Sustainable Energy
3 KSA does not import or export electricity to a significant amount and therefore electricity generation almost equals to electricity consumption
Solar resources in KSA
Different generation technologies do have specific (dis)
advantages, such as external cost or base load capabil-
ity. These (dis)advantages
are to be taken into ac-
count when replacing one
technology with another.
However, in order to gain
clarity of this aspect, an
important question to ask
is: How much PV energy
would be required in order
to cover the entire electri-
cal demand in KSA?
Depending on the precise location a ground mounted one
MWp PV power plant will produce an average of 1,800
MWh/year. Thus, in order to produce 300 TWh/year,
167 GWp of installed PV capacity would be required. On
average, such a one MWp system requires 0.014 sq.km
of land area and therefore the installation of 167 GWp
would require an area of 2,300 sq.km or 0.11% of the
Kingdom’s territory.
Figure 1: Solar potential in KSA
Graph 1: Electricity generation capacities in Saudi Arabia
Source: IEA
0
50
100
150
200
250
300
[TWh]
13%
6.2%
Year
1972
1974
1976
1978
1980
1982
1984
1986
1988
1990
1992
1994
1996
1998
2000
2002
2004
2006
2008
2010
e
2012
e
2014
e
Required PV area in order to porduce 300,000 GWh / year
Saudi Arabia
Source: EuPD Research 2013

7
PV INSTALLATIONS IN KSA
Graph 2: LCOE of PV depending on PV system price for three different irradiation levels in KSA
In KSA solar is a cost competitive alternative
Since 2006 several European countries have introduced
feed-in-tariffs (FiT) in order to stimulate PV demand. FiTs
used to be significantly higher than electricity prices. The
intersection point between electricity prices and the cost
per kWh of solar generated electricity was considered as
benchmark for competitiveness. Due to falling system
prices this intersection point – so called grid parity – has
been reached in several of the European markets but this
did not lead to a booming demand.
In order to assess the true competitiveness of solar the
benchmark must not be the electricity price, but the gen-
eration cost of other power plants. In order to analyze the
cost competitiveness of PV, the levelized cost of electricity
(LCOE) of PV shall be compared to the fuel cost (rated at
market price of 107 USD) which is required in order to
produce one kWh of electricity from oil. Capital equip-
ment costs of a conventional power plant are not consid-
ered in the calculation.
On average 1.3 barrels of oil are required to generate
one MWh of electricity – 1.3 barrels worth 139 USD that
cannot be sold on the world market. Thus, the opportu-
nity cost for the usage of oil for electricity production is
139 USD per MWh, respectively 0.139 USD per kWh. As
mentioned, this cost does not consider any CAPEX for the
power plant but just fuel costs rated at market price.
Graph 2 compares LCOE4 of PV for three different loca-
tions in KSA with the 0.139 USD fuel cost. In high yield
regions PV is a competitive source if a system price below
2,475 USD/kWp is achieved. At average irradiation levels
a system price as low as 1,750 USD/kWp is required. From
today’s point of view 1,750 USD/kWp is ambitious in a
non-mature market like KSA and some learning curve ef-
fects are required in order to achieve this price. Against
the background of system prices below 1,300 USD in
more mature PV markets the benchmark is definitely
achievable. It should be considered that this calculation
does not include external cost which are much lower
in the case of PV compared to conventional generation
sources.
4 Discount rate = 8% | degradation = 0,25% | OPEX = 1% of initial invest-ment | Inflation = 1.5% | system runtime = 25 years
Source: EuPD Research 2013
1,0
00
1,1
00
1,2
00
1,3
00
1,4
00
1,5
00
1,6
00
1,7
00
1,8
00
1,9
00
2,0
00
2,1
00
2,2
00
2,3
00
2,4
00
2,5
00
LCO
E / f
uel c
ost [
USD
/kW
h]
PV System Price [USD/kWp]
PV yield LCOE low irradiation (1250 kWh/kWp)
PV yield LCOE average (1550 kWh/kWp)
PV yield LCOE high irradiation(2200 kWh/kWp)
Fuel cost for electricity generation per kWh
< 1200 1600 2000 2400 2800 > kWh/m²
0
0.05
0.10
0.15
0.20
0.25
0.30
© 2010-2013 GeoModel Solar
Project Cost +
LCOE =
-
Initial KWh X (1 - System Degradation rate)n
(1 + DR)n
n=1∑N
n=1∑N
RV
(1 + DR)n
AO
(1 + DR)n
1,7501,400 2,475
8
PV INSTALLATIONS IN KSA
Installation targets
The PV market in KSA is at a nascent stage with cur-
rently very little installed PV capacity. However, a legal
framework for the roll-out of a renewable energy support
scheme is currently under development with K.A.CARE at
the helm. Details of the program are still under discussion,
but the initial published proposal provides estimates and
indicates cumulated PV installation targets of 6 GWp by
2020 and 16 GWp by the end of 2031. The proposal out-
lines KSA’s ambition to be one of the top 20 PV markets
worldwide.
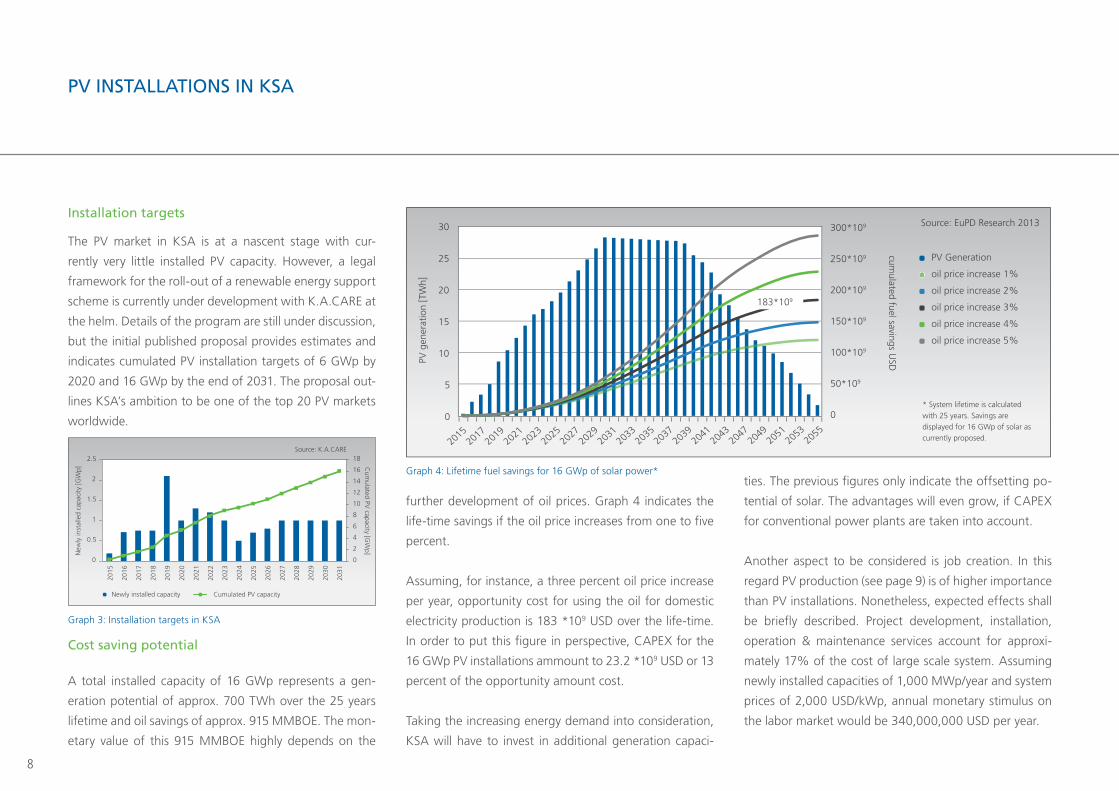
Cost saving potential
A total installed capacity of 16 GWp represents a gen-
eration potential of approx. 700 TWh over the 25 years
lifetime and oil savings of approx. 915 MMBOE. The mon-
etary value of this 915 MMBOE highly depends on the
further development of oil prices. Graph 4 indicates the
life-time savings if the oil price increases from one to five
percent.
Assuming, for instance, a three percent oil price increase
per year, opportunity cost for using the oil for domestic
electricity production is 183 *109 USD over the life-time.
In order to put this figure in perspective, CAPEX for the
16 GWp PV installations ammount to 23.2 *109 USD or 13
percent of the opportunity amount cost.
Taking the increasing energy demand into consideration,
KSA will have to invest in additional generation capaci-
ties. The previous figures only indicate the offsetting po-
tential of solar. The advantages will even grow, if CAPEX
for conventional power plants are taken into account.
Another aspect to be considered is job creation. In this
regard PV production (see page 9) is of higher importance
than PV installations. Nonetheless, expected effects shall
be briefly described. Project development, installation,
operation & maintenance services account for approxi-
mately 17% of the cost of large scale system. Assuming
newly installed capacities of 1,000 MWp/year and system
prices of 2,000 USD/kWp, annual monetary stimulus on
the labor market would be 340,000,000 USD per year.
Source: K.A.CARE
Newly installed capacity
0
0.5
1
1.5
2
2.5
0
2
4
6
8
10
12
14
16
18
New
ly in
stal
led
capa
city
[GW
p]
Cum
ulated PV capacity [G
Wp]
Cumulated PV capacity
2015
2016
2017
2018
2019
2020
2021
2022
2023
2024
2025
2026
2027
2028
2029
2030
2031
Source: EuPD Research 2013
PV Generation
2015
2017
2019
2021
2023
2025
2027
2029
2031
2033
2035
2037
2039
2041
2043
2047
2049
2051
2053
2055
0
5
10
15
20
25
30cum
ulated fuel savings USDPV
gen
erat
ion
[TW
h]
* System lifetime is calculated with 25 years. Savings are displayed for 16 GWp of solar as currently proposed.
oil price increase 1%
oil price increase 2%
oil price increase 3%
oil price increase 4%
oil price increase 5%
0
50*109
100*109
150*109
200*109
250*109
300*109
183*109
Graph 3: Installation targets in KSA
Graph 4: Lifetime fuel savings for 16 GWp of solar power*
9
LEARNING FROM OTHER MARKETS
Feed-in-tariffs are a phase out model
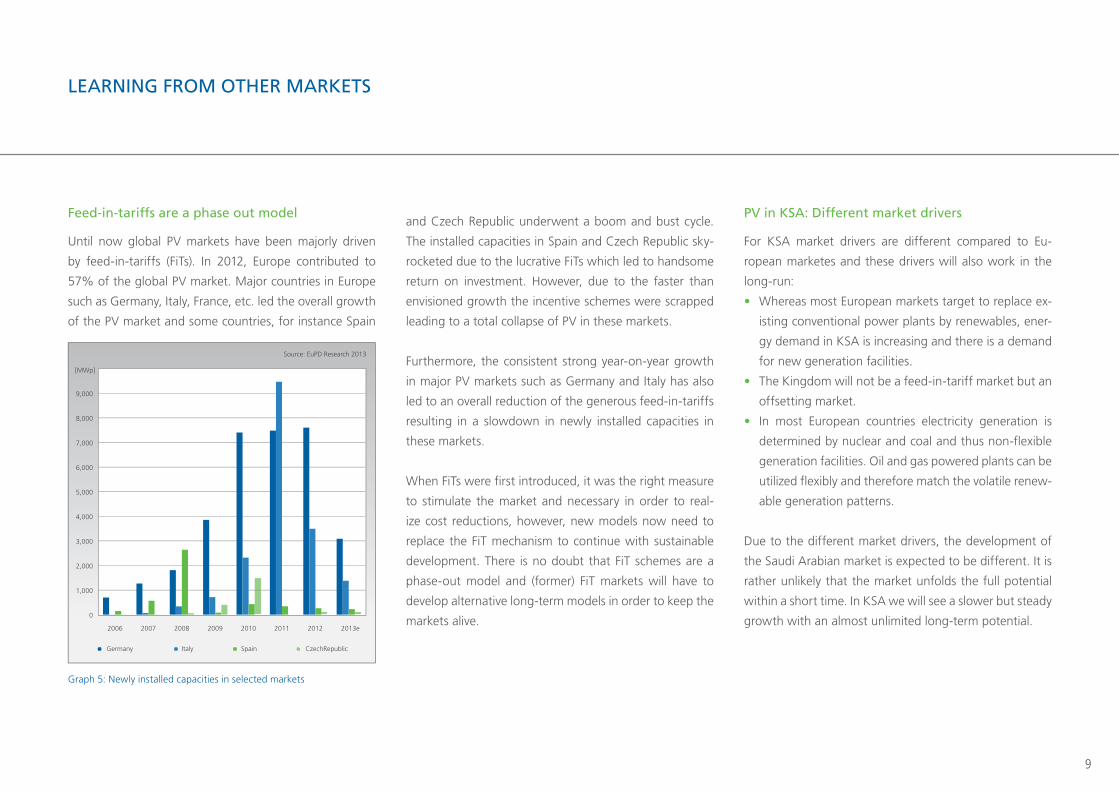
Until now global PV markets have been majorly driven
by feed-in-tariffs (FiTs). In 2012, Europe contributed to
57% of the global PV market. Major countries in Europe
such as Germany, Italy, France, etc. led the overall growth
of the PV market and some countries, for instance Spain
and Czech Republic underwent a boom and bust cycle.
The installed capacities in Spain and Czech Republic sky-
rocketed due to the lucrative FiTs which led to handsome
return on investment. However, due to the faster than
envisioned growth the incentive schemes were scrapped
leading to a total collapse of PV in these markets.
Furthermore, the consistent strong year-on-year growth
in major PV markets such as Germany and Italy has also
led to an overall reduction of the generous feed-in-tariffs
resulting in a slowdown in newly installed capacities in
these markets.
When FiTs were first introduced, it was the right measure
to stimulate the market and necessary in order to real-
ize cost reductions, however, new models now need to
replace the FiT mechanism to continue with sustainable
development. There is no doubt that FiT schemes are a
phase-out model and (former) FiT markets will have to
develop alternative long-term models in order to keep the
markets alive.
PV in KSA: Different market drivers
For KSA market drivers are different compared to Eu-
ropean marketes and these drivers will also work in the
long-run:
• Whereas most European markets target to replace ex-
isting conventional power plants by renewables, ener-
gy demand in KSA is increasing and there is a demand
for new generation facilities.
• The Kingdom will not be a feed-in-tariff market but an
offsetting market.
• In most European countries electricity generation is
determined by nuclear and coal and thus non-flexible
generation facilities. Oil and gas powered plants can be
utilized flexibly and therefore match the volatile renew-
able generation patterns.
Due to the different market drivers, the development of
the Saudi Arabian market is expected to be different. It is
rather unlikely that the market unfolds the full potential
within a short time. In KSA we will see a slower but steady
growth with an almost unlimited long-term potential.
Source: EuPD Research 2013
[MWp]
Germany Italy Spain CzechRepublic
0
1,000
2,000
3,000
4,000
5,000
6,000
7,000
8,000
9,000
2006 2007 2008 2009 2010 2011 2012 2013e
Graph 5: Newly installed capacities in selected markets

10
DOMESTIC PV MANUFACTURING – GENERATING LOCAL VALUE
Motivation factors for local manufacturing
As PV is about to become the cheapest form of energy
generation in the foreseeable future, KSA – like many oth-
er regions in the world - has started to explore opportuni-
ties and risks associated with industrial PV manufactur-
ing. Apart from shareholder-value oriented targets, many
projects have secondary objectives that follow from direct
or indirect government involvement. The most important
consideration within the set of secondary objectives is
usually the benefit for people or communities located
near the sites, where production facilities will eventually
be situated. These objectives are usually defined by the
project owner in collaboration with government agencies
and if required with the support of external PV experts.
Figure 2 shows potential goals that may play a role in the
decision to pursue an industrial PV project.
Diversificationand broadening
of nationalindustrial profilesegmentation
Jobcreation and
skill-setbuildingEnergy
security andbroadening
of generationprofile
Conservation ofnatural resources,
e.g. depletinghydro-carbon
in KSA
Compliancewith
internationalCO2 emission
targets
Leverageof regionalresources
Development of a regional PV excellence
cluster
Regionaltechnology
leaderpotential
Competitiveadvantages,
e.g. lowelectricity price
Increase in depth ofvertical integrationand value creation
incl. entrepreneurialbusiness opportunities
for domesticsuppliers
Source: Viridis.iQ GmbH 2013
Figure 2: Potential goals when setting-up a local PV manufacturing industry

11
DOMESTIC PV MANUFACTURING – GENERATING LOCAL VALUE
Social benefits from the establishment of a c-Si
PV manufacturing cluster
Social benefits from the establishment of an integrated
c-Si PV cluster can be differentiated in direct and indirect
or short- and medium-term effects. Furthermore, with the
location of an mg-Si smelter and a c-Si cell-plant on the
grounds of the Arabian Peninsula, KSA would close exist-
ing gaps in its c-Si manufacturing project portfolio. Ad-
vantages from integration are discussed on page 12/13.
Direct social benefits will be realized in the communities
adjacent to the eventual sites or single agglomerations.
Even though labor intensity is lower in the capital intensive
silicon part of the value chain, the impact on regional job
quotas should not be underestimated, especially if spill-
over effects to supplier and service segments are taken
into consideration. For example, in the case that suitable
quartz reserves are available for silicon production, a sus-
tainable explorative mining industry could be established
for the region. Additional political objectives relating to
industrial diversification, trade, environmental and social
aspects could be tackled by an intelligent, prudent and
sensible site selection. Taking multiple and interrelated
economic objectives on a national level into consideration
increases project complexity significantly, while the list of
involved stakeholders expands.
Source: Viridis.iQ GmbH 2013
MetallurgicalSilicon
Polysilicon Ingot/Wafer Cell Module
Prod
uctio
n la
bor
per
GW
of p
rodu
ctio
n ca
paci
ty
0
200
400
600
800
1000
1200
spread
Graph 6: Needed production labor per GW of production capacity

12
Spill-over effects from local manufacturing
Longer-term educational benefits are likely to arise in
the academic fields of mechanical engineering, chemical
engineering, semiconductor physics and manufacturing
operations. Furthermore, an increase in demand for tech-
nically skilled operators will most probably have positive
and lasting effects on the statistics of highly skilled labor
in KSA. Figure 3 illustrates the relationship between short-
term direct effects and medium-term indirect spill-over
effects: As outlined above, effects from the settlement of
a fully integrated, industrial silicon-solar cluster can be dif-
ferentiated in direct and indirect effects as well as short-
to medium-term consequences. The first wave of visible
effects will be felt within the local communities where the
parts of or the complete cluster will eventually be located.
Apart from the creation of construction jobs, infrastruc-
tural projects are likely to have a positive impact on other
segments of the economy, which do not necessarily stand
in a direct relation to the industrial project itself.
In addition, medium- to longer-term effects on the
growth rate for the economy are likely to result from an
increase in the relative amount of skilled labor within the
workforce of the respective community but also within
the overall skill-set composition of the labor force in the
overall economy. Further, possible collaborations with lo-
cal universities could help to create a globally renowned
cluster for industrial scale c-Si based PV production in
KSA.
DOMESTIC PV MANUFACTURING – GENERATING LOCAL VALUE
Source: Viridis.iQ GmbH 2013
Community benefits, per capitaincome increase
Utilization of localquartz
reservoirs
Lower dependencyon imports
Integratedc-Si PVcluster
Opportunisticprocurement
strategy
Educationalbenefits
(academics, skilled labor)
Cluster benefits:
e.g. process gases
Academic knowledge
cluster
Higher taxes
Spill-over on
adjacent industries
...
Figure 3: Spill-over effects from a domestic PV manufacturing cluster

13
DOMESTIC PV MANUFACTURING – GENERATING LOCAL VALUE
Social impacts resulting from a c-Si PV manufac-
turing cluster
If potential sites are chosen in accordance to pre-deter-
mined selection criteria that also take other economic de-
velopment targets into account, multiple goals could be
served by a large industrial PV development program. For
example, some regions might lack infrastructural connec-
tions which put them into a disadvantage to better de-
veloped communities. If all other factors are comparable
to an alternative site that is situated in a region with a
more advanced infrastructure, it might be advantageous
to consider the site with the mediocre infrastructure in
order to set impulses for growth.
Another set of direct benefits might result from an in-
crease in the average per capita income, sustainable re-
ductions in unemployment rates, increases in community
and state taxes as well as consumption levels.
Secondary effects might arise from spill-over effects on
other areas of the local economy (local trade, craftsmen,
service providers, etc.) and the targeted development of
adjacent fields, e.g. from increasing the proportion of
supplies sourced from local companies. Another advan-
tage comes from the possibility to tap existing industrial
gas supply of the petro-chemical industry. Further sec-
ondary economic benefits could be realized through the
exploitation of possible local quartz reserves.
Short-term Medium-term
Direct
• Creation of jobs related to PV production
• Know-how transfer on silicon processing and semiconductor physics
• Creation of construction jobs with industrial scope
• Creation of construction jobs for civil engi-neering (infrastructure, utility connection)
• Creation of a global center of competency for c-Si based production in collaboration with universities
• Increase in the ratio of skilled- to unskilled labor within the national labor force
• Increase in per capita income with increased consumption
• Increase in local- and state taxes
Indirect
• Short-term indirect effects will depend on the timing of parallel initiatives (e.g. potential development of explorative industries)
• Increase of local service providers within respective communities
• Example: mg-Si know-how can easily be leveraged to access basic chemical and alu-minum industry
• Increase in mobility and educational levels likely to have positive impacts in non-related fields of the economy
• Increase of local supply of materials with lasting effects on adjacent industries
• Increased usage of solar energy frees-up fossil resources for export
Table 1: Social impact matrix

14
Manufacturing along the PV value chain – Devel-
oping the Saudi solar industry
The announcement by Polysilicon Technology Co., Ltd. in
February of 2011 to build a 3,000mt production facility
made clear that KSA plans to supply the PV power plants
set forth in the ambitious K.A.CARE targets with locally
manufactured products. This became even more evident
after Green Gulf released plans to erect a 750MW wafer
and 200MW module plant in June 2013. A major stra-
tegic motivation for the establishment of an integrated
silicon-based production infrastructure within the realm
of KSA could be to close the gap between existing natural
resources in the form of quartz minerals (SiO2) and mod-
ule production. If implemented, the KSA would achieve
a depth of integration within the c-Si based value chain
that is hardly matched by any single other region, globally.
One obvious advantage from a fully integrated c-Si manu-
facturing approach is the reduction of uncertainty result-
ing from long-term sourcing decisions, e.g. the relative
extent of feedstock sourced through long-term contracts
versus the proportion sourced in spot markets. Although,
each individual investment within the integrated cluster
should earn an adequate risk-adjusted return on capital
over the project lifetime, temporal pricing induced market
imbalances can better be absorbed over a fully integrated
manufacturing cluster, as currently witnessed in the pho-
tovoltaic market. The figure on the next page gives an
indication as to the relative resistance of integrated vs.
specialized business models in the PV downstream.
DOMESTIC PV MANUFACTURING – GENERATING LOCAL VALUE
Polysilicon Technology
Company (PTC)
IDEA
Saudi Arabia’s position in the PV value chain
characteristics
Notpresent
Mg Silicon Poly Si Ingot Wafer Cell Module
similar to steel industry
chemical factory like, petrochemical
environment; large electricity
needs
Green Gulf
Polysilicon Technology Company (PTC)
Notpresent
Green Gulf
Desert Technologies
thermal and mechanical processing; energy- and labor intensive
semiconductor manufacturing like;
technology important
for solar module power output
glass processing like; large number of operators required
Source: Viridis.iQ GmbH 2013
Figure 4: Photovoltaic value chain: KSA´s position and characteristics

15
DOMESTIC PV MANUFACTURING – GENERATING LOCAL VALUE
This strategic position over the complete value chain gives
integrated manufacturers a superior position to follow an
opportunistic sourcing approach in times of severe mar-
ket imbalances on different steps of the value chain. This
means if a certain intermediate product is priced below
the marginal costs, a temporal halt of production and ex-
ternal sourcing approach could give an integrated manu-
facturer a competitive advantage. In addition, in times
where prices for photovoltaic products exhibit a high vol-
atility a more stabilized pricing policy over the complete
value chain of an integrated manufacturer can alleviate
temporal uncertainties that otherwise could arise and dis-
tract the organization.
The last strategic aspect that should be considered is that
the increased depth of knowledge and control over the
full value chain within a PV cluster can shorten innova-
tion cycles. For example, by aligning engineered and op-
timized silicon feedstock with tighter specifications on
predetermined key parameters an optimization of inter-
mediate or final products, e.g. higher efficiency cells with
lower standard deviation, can be achieved.
The benefits of co-located production integration along
the supply chain can be distinguished in the categories
displayed in table 2.
InfrastructureShared facilities (power, water, etc.), roads, substations, buildings, construction costs, administration costs, etc.
LogisticsLower cost packaging requirements, shorter distances, less breakage, opportunities for bulk transit, less fees to brokers, insurances, transportation costs, etc.
Process OptimizationCustomization of one step in the supply chain specifically to the next one (at the co-located factory), consolidated quality control, alignment of process steps, in-ter-process communication, shorter innovation cycles, etc.
Financial and Economic Lower working capital, streamlined process flows, faster time-to-market, etc.
Recycling and byproduct synergies
Reuse and optimization of by-products between process steps, synergies in common on site production requirements (gases, acids, etc.), etc.
Q2
´05
Q4
´05
-20%
-10%
0%
10%
20%
30%
40%
Q2
´06
Q4
´06
Q2
´07
Q4
´07
Q2
´08
Q4
´08
Q2
´09
Q4
´09
Q2
´10
Q4
´10
Q2
´11
Q4
´11
Q2
´12
Q4
´12
Integrated wafer-to-module
capa
city
wei
ghte
d gr
oss
mar
gin
Specialized / cell
Source: Viridis.iQ GmbH 2013
Table 2: Agglomeration benefitsGraph 7: Downstream gross margin of specialized & integrated manufacturers

16
DOMESTIC PV MANUFACTURING – GENERATING LOCAL VALUE
Current trend to local manufacturing
In the last couple of months many announcements were
made regarding set-up of production sites in not yet es-
tablished PV production markets. The reasons are mani-
fold:
• Production (of modules, sometimes also of cells) in
close proximity to installation markets due to relative
increase of transportation cost and low price of com-
modity product.
• Chinese cost advantages decrease with increasing la-
bor cost in China.
• Depending on the PV value chain step benefitting from
ideal local conditions and competitive advantages.
• Government-driven industry settlement with establish-
ment of local supply chain.
• Established producers diversify to fully tap market po-
tential.
• Strategies to avoid trade barriers.
• Adaptation to local conditions (“desert module”, “salt-
water module”).
Examples:
• In July 2013 Samsung Renewable Energy reached a
partnership agreement with Canadian Solar to open a
new module manufacturing facility in Ontario.
• The president of the local energy agency announced
at the beginning of 2013 that the Argentinan province
of San Juan plans a fully-integrated PV production with
70MW equipped by German turnkey provider Schmid
to be finalized by the end of 2014.
• CSUN started their cell and module production in Tur-
key in 2013 (100 resp. 150MW). It was announced that
parts of the module production equipment would be
transfered from Shanghai to Turkey.
• Two months ago Comtec Solar started construction of
a 1GW N-type mono wafer plant in Malaysia that is
suppost to be completed by the end of 2013.
Source: Viridis.iQ GmbH 2013
Indu
stria
l Ele
ctric
ity P
rices
(US$
/MW
h)
KSA
Uni
ted
Stat
es
Braz
il
Fra
nce
Kiz
ad
Can
ada
Aus
tral
ia
Spai
n
Om
an
Thai
land
Chi
na
Sout
h A
fric
a
Ger
man
y
Nor
way
80
20
30
40
50
60
70
Graph 8: KSA‘s competitive edge: electricity price

17
DOMESTIC PV MANUFACTURING – GENERATING LOCAL VALUE
PV Solar technology roadmap: Adapting to the
region
• The vast majority of solar panels installed utilize c-Si
multi- & mono-wafers.
• The proportion of “standard” c-Si based technologies
increased even further throughout the current market
correction phase (2011-2013).
• The technology selection can also reveal attractive
niches. However, from a risk-reward perspective, a
balance must be found between advantages of main-
stream (established supply chain, economy of scale,
low risk) and an innovative path opting for USP, but
taking higher risk.
• The specific needs of the Arabian peninsula with re-
spect to extreme temperatures and sand storms re-
quire the adaption of the solar module designs. The
hereof resulting emerging domestic market provides
promising perspectives for local PV producers.
Source: Viridis.iQ GmbH 2013
a-Si/uc-Si5-10%
0%
10%
20%
30%
40%
50%
60%
70%
80%
90%
100%
Prod
uctio
n vo
lum
e 20
12
CIGS + CdTe10-13%
c-Si mono/multi13-17%
High-Efficiency-Segment17-21%
total area efficiency
3%7%
86%
3%
One reasonable strategy: Establish leadingposition within the high volume-segmentof “standard“ c-Si module producers, while leaving enough headroom for further developments, e.g. passivated rearside, long-lifetime-modules adapted tothe region.The technology roadmap needs to be defined with tight eye side on Cost of Ownership (CoO).
Graph 9: Global technology segmentation

18
DOMESTIC PV MANUFACTURING – GENERATING LOCAL VALUE
Best practice: Developing a PV industry step by
step
The previous pages have demonstrated that the complex-
ity of an integrated PV project is a consequence of the
diverse nature of involved industries that reaches from
heavy metallurgy, to chemical refining, from material
processing to high-tech high-volume material processing
and assembling under clean room environment. Further
complexity can be added by different stakeholders with
varying objectives and scopes. As such, a rigorous plan-
ning, monitoring and managing process by an experi-
enced interdisciplinary team of industry experts becomes
a necessary side-condition for a successful project imple-
mentation over the various project planning, realization
and operation stages. Table 3 provides an overview on
general project steps which are typically performed.
Project White Paper A conceptual overview of the project at the highest level with a description of the motivation of the project. This can be used to motivate govern-ments and policy makers to understand the project and its importance.
Feasibility Study
A technical, economic, commercial and strategic factor review for the project. Includes technology overviews, supply chain details, cost modeling, site requirements review, mass flows, and other technical information. Additionally, it includes detailed market information, forecasts, fundamentals, critical requirements for market entry and other strategic concepts and plans. The outcome of the study is not decided before the study is complete and the report should be a critical analysis of the project that can withstand investor scrutiny.
Pre-engineering Process descriptions, basic equipment, estimated space requirements, shift schedules, output estimates, process and mass flows, etc.
Basic Engineering Building and equipment requirements, bill of materials, facilities and utilities matrix, block layouts, staff requirements, recycling potential, process design, quality control plan, FMEA, production risk assessment, safety, etc.
Permitting Site, environmental, personnel, etc.
Logistics and Supply Audits Logistics planning, supplier qualification/audits, raw material specification designs, procurement strategy.
Environmental Study Waste stream and off gas effects, disposal and landfill planning, establishment of limits, monitoring, etc.
Investor Acquisition Business case, cost models, financial models, project evaluation, etc.
Project Planning Organization of equipment, utilities, site requirements, earthworks, infrastructure and buildings, installation and construction coordination and management, usually requires an experienced EPC contractor.
Project Execution Training, scheduling, cost controlling, claims, move in planning, coordination, document management, reporting, etc.
Commissioning and Start Up Equipment commissioning, start-up sequences, acceptance process, process optimization, etc.
Market Entry Marketing plan, strategic roadmap, technology planning, R&D, etc.
Table 3: Description of industrial project realization stages

19
DOMESTIC PV MANUFACTURING – GENERATING LOCAL VALUE
Cost categories for PV manufacturing
The economic viability and competitiveness of a distribut-
ed or co-located integrated PV cluster is ultimately deter-
mined by four broad cost categories: local procurement
conditions, long-term electricity prices, labor costs and
depreciation on fixed assets. A rigorous benchmarking of
capital requirements to international PV plants in combi-
nation with local labor and electricity rates can already
lead to a reasonable estimate of production costs before
a costly procurement study is initiated, e.g. at an early
planning stage.
The capital intensity of the individual production facilities
of an integrated manufacturing cluster for c-Si based PV
modules declines from the up- to the downstream, mean-
ing that poly-Si sites typically have the highest-, while
module assembling sites exhibit the lowest investment
need expressed in units of output.
A major reason for this is the extended engineering and
project management complexity associated with the ma-
terial purification and crystal formation steps of the c-Si
PV value chain. In turn, engineering costs are influenced
to a great extent from numerous location specific factors,
such as experience and availability of local construction
firms. In the poly-Si segment the relative proportion of
unit investment costs attributable to EPC and technology
transfer typically ranges between 40-60%, an invest-
ment coefficient of 110 US$/kg is in accordance with the
average capital intensity deduced from an industry peer
group of new entrants to this segment.
The EPC related portion decreases in the downstream as
building and infrastructure related complexities decline.
The relation of infrastructure, facility & building induced
spending to total invest for the structural complex in-
cluding equipment are 20-30% for the ingot & wafer-,
15-25% for the cell- and 30-40% for the module plant.
The actual relative capital distribution within the fixed as-
set basis will depend on nameplate capacities, selected
technologies, state of development of available sites,
civil-engineering & environmental regulations as well as
industrial focus of locally available engineering and con-
struction partners.
A benchmarking process of actual project announce-
ments reveals that the correlation between manufactur-
ing capacity and unit investment costs for the individual
production steps is not particularly high. This indicates
that most of the fixed capital investments depends on
technology choice, supplier selection, negotiation efforts
(that -to a great extent- are a function of the design &
facilitation of bids) as well as the market environment and
location specific factors. An exception constitutes the ca-
pacity expansions derived through process optimizations,
e.g. debottlenecking carried out by established poly-Si
manufacturers. Here we see a strong correlation between
capital spend and capacity.
A technology selection pre-determines the short-list of
globally available equipment manufacturers. Hence, tech-
nology selection is a critical path as it narrows down the
capital equipment supplier choice, confines the technol-
ogy roadmap and thereby ultimately impacts the selec-
tion of addressable markets for the end-product, e.g. the
c-Si module. Last but not least this decision will have a
tremendous impact on the unit production costs, as capi-
tal related expenses in the form of depreciation charges
contribute up to 20% to total unit costs.
mg-Si 5.2-7.2 US$/kg
poly-Si 79-153.8 US$/kg
ingot-wafering 0.30-0.47 US$/Wp
cell 0.16-0.30 US$/Wp
module 0.09-0.16 US$/Wp
Table 4: Bandwidth of relative capital investment needs

20
DOMESTIC PV MANUFACTURING – GENERATING LOCAL VALUE
Ecological impacts
The technology selection also determines the list of criti-
cal or hazardous materials that need to be treated with
specific care and disposed of in accordance to local and
international hazardous waste treatment regulations.
The list of chemicals dealt within a PV facility is to be con-
sidered in conjunction with the technology choice. The
goal is usually to increase the recycling quota in order to
minimize or even eliminate the effective emissions. Haz-
ardous chemicals that need to be considered in an envi-
ronmental analysis are for example:
• TCS - Trichlorsilane
• STC - Tetrachlorosilane
• HCl - Hydrogen-chloride (tt forms hydrochloric acid
which can easily be neutralized by using lime.)
• HF - Hydrofluoric acids (can be turned into harmless
fluorspar by lime treatment.)
• Coal – if it is used in the metallurgical plant as reduc-
tion source (Carbon)
• Silane gases and other exhausts (they are discarded
through a scrubber/burner turning them into harmless
compounds.)
All substances are well known and if applying state-of-
the-art handling they do not cause health issues. No carci-
nogenic substance will be used. For example in the met-
allurgical silicon step, the off gas from the mgSi plant will
be cleaned and treated in the baghouse system where it
is in principle possible to burn the CO (carbon monoxide)
and generate energy for local consumption. In addition,
particle emission from the furnace can be used in the
concrete manufacturing. Similar recycling and byproduct
strategies must be developed based on location specific
environmental regulations.
Ultimately, waste products that cannot be fed back into
the process flow need to be disposed of at a hazardous
waste dump. Potential sites need to be earmarked by the
awarding authority.
Additional considerations that need to be taken into ac-
count are:
• Control and protection of fresh water resources
• Conservation of identified production sites
• Air emissions and gas treatment
• Generation of a systematic process of solid waste man-
agement
• Development of a Green Concept for the local and re-
gional communities
• Energy generation by gas and biomass
• Conservation of ecosystem (biodiversity)
21
KSA – GREEN LIGHTHOUSE PROJECT FOR THE ENTIRE REGION
KSA – Technology and production hub in the
MENA region
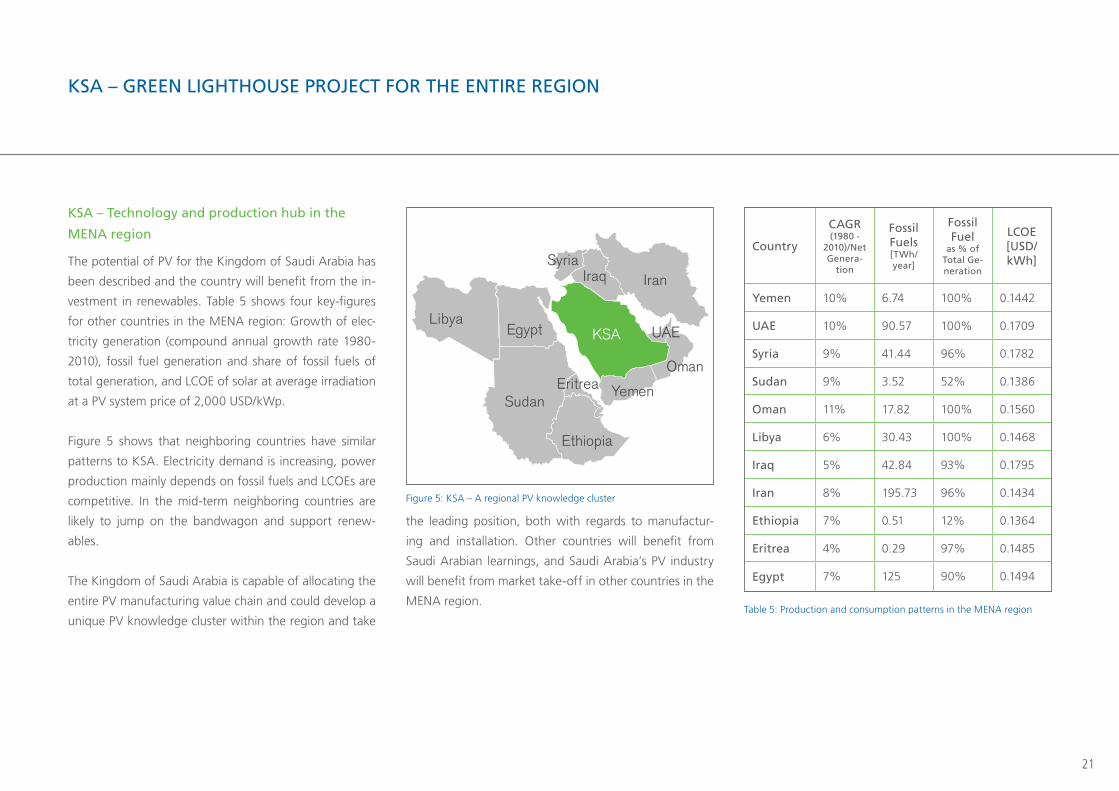
The potential of PV for the Kingdom of Saudi Arabia has
been described and the country will benefit from the in-
vestment in renewables. Table 5 shows four key-figures
for other countries in the MENA region: Growth of elec-
tricity generation (compound annual growth rate 1980-
2010), fossil fuel generation and share of fossil fuels of
total generation, and LCOE of solar at average irradiation
at a PV system price of 2,000 USD/kWp.
Figure 5 shows that neighboring countries have similar
patterns to KSA. Electricity demand is increasing, power
production mainly depends on fossil fuels and LCOEs are
competitive. In the mid-term neighboring countries are
likely to jump on the bandwagon and support renew-
ables.
The Kingdom of Saudi Arabia is capable of allocating the
entire PV manufacturing value chain and could develop a
unique PV knowledge cluster within the region and take
the leading position, both with regards to manufactur-
ing and installation. Other countries will benefit from
Saudi Arabian learnings, and Saudi Arabia’s PV industry
will benefit from market take-off in other countries in the
MENA region.
Iran
Oman
Yemen
UAEKSA
IraqSyria
Egypt
Sudan
Ethiopia
Eritrea
Libya
Country
CAGR (1980 -
2010)/Net Genera-
tion
Fossil Fuels [TWh/ year]
Fossil Fuel
as % of Total Ge-neration
LCOE [USD/kWh]
Yemen 10% 6.74 100% 0.1442
UAE 10% 90.57 100% 0.1709
Syria 9% 41.44 96% 0.1782
Sudan 9% 3.52 52% 0.1386
Oman 11% 17.82 100% 0.1560
Libya 6% 30.43 100% 0.1468
Iraq 5% 42.84 93% 0.1795
Iran 8% 195.73 96% 0.1434
Ethiopia 7% 0.51 12% 0.1364
Eritrea 4% 0.29 97% 0.1485
Egypt 7% 125 90% 0.1494
Figure 5: KSA – A regional PV knowledge cluster
Table 5: Production and consumption patterns in the MENA region
22
ABOUT THE AUTHORS
EuPD Research pursues a strategy that values providing customers with integrated solu-
tions based on first-rate market intelligence, consulting know-how, communications ex-
cellence and implemented go-to market strategies. We have completed more than 2,000
exclusive projects for multinationals, global associations and governments. Our global
reach allows us to serve customers in their target markets and deliver solutions custom-
ized to what they need and where they are.
We pride ourselves on compiling data specific to your requirements, applying rigorous
methodologies and critical thinking as well as deep and diverse industry insight to deliver
products that add measureable value to your bottom line, and, embody the principles of
sustainability.
Founded in 2000 and part of the Hoehner Research and Consulting Group, our interna-
tional presence enables us to analyze markets, industries and stakeholders closely and
accurately as well as providing proximity to our customers.
Our customers come from a multitude of backgrounds including CleanTech with particu-
lar focus on renewable and smart energy as well as enterprises and public institutions that
strive for sustainable excellence and practice sustainable management.
Our commitment and dedication to securing the role of renewable energies in the energy
mix of the future has shown us that success goes beyond the generation of green profit.
Investing in the well-being of employees and promoting sustainable business practices
sees the transfer of the strategies we implement to better our environment to the way we
run companies and conduct business.
Viridis.iQ GmbH is an independent German technology and engineering consulting firm
with unique technical expertise on every step of the PV value chain (from metallurgical
silicon to systems) that is grounded in hands-on industrial experience with a focus on inte-
gration value and innovative technologies. Our interdisciplinary specialists have extensive
experience in providing feasibility and detailed technical studies on all industrial phases of
PV manufacturing along with a strong foundation in financial and economic modeling,
costs of ownership, environmental impact, market entry advice, competitive strategies and
industrial development planning.
• Strategic: roadmapping, critical path analysis, market entry, competitive advantage and
process intelligence, value-oriented business management, project owner representation.
• Technical: process flows, mass balance, material specifications, equipment, technol-
ogy, layouts, benchmarking analysis and value stream mapping.
• Market: risks and opportunities, player analysis, consolidation effects and tier dynamics.
• Academy: Lean Six Sigma and technical trainings, education, know-how transfer,
games and dynamics applied for business.
• Financial: project evaluation, scenario-driven multi-layer sensitivity analysis, ROI, IRR,
business planning, costs of ownership, TCO and other economic modeling.
• Logistics/ trade: import/export, trade, supply chain analysis, cost simulations and sup-
pliers evaluation.
• Environmental: waste streams, treatment/ handling, recycling options, local laws and
regulation analysis.
• Human resources: skills, labor requirements, organizational structure and O&M evaluation.
EuPD Research Viridis.iQ GmbH

23
COOPERATION PARTNER
The Saudi Arabia Solar Industry Association (SASIA) is a non profit, non governmental as-
sociation which aims to promote solar power in the Saudi Arabia and across the Middle
East. The organization aims to: Facilitate business opportunities for its members through
face to face meetings, workshops and lectures; Expand the use of all solar technologies at
national and regional level; Offer assistance to international solar companies establishing
or contemplating the establishment; Publish white papers and research reports that aim to
assist policy-makers on matters related to solar policies, standards, and product certifica-
tions.
Saudi Arabia Solar Industry Association (SASIA)
24
PASSIONATE ABOUT PV
COMMITTED TO SYSTEMS AND PROCESSESProcesses and systems from the Meyer Burger Group play a vital role in increasing overall performance and effi ciency throughout the photovoltaic value chain. We enhance the crucial key factors for all manufacturing processes - for optimum yield, lowest possible costs and maximum availability.
Meyer Burger Technology Ltdwww.meyerburger.com
25
Passionate about PV
We are a comprehensive system supplier in photovoltaics,
in the semiconductor and optoelectronics industries, as well
as in other industrial sectors utilising semiconductor materi-
als. In our core business of photovoltaics, we are among
the pioneers of the industry. We use our expert know-how
to constantly advance the industrialisation of trendsetting,
cost-effective production processes. In the field of building
technology, we set global standards for building-integrated
solar systems for the efficient and environmentally-friendly
production of electricity from sunlight.
Core expertise along the entire PV value chain
Our spectrum of systems, production equipment and ser-
vices along the photovoltaic value chain encompasses wa-
fering, solar cell, solar module and solar system processes.
Thanks to a focus on the entire value chain, we create clear
added value for customers and set ourselves apart from our
competitors. In addition, our Group is a leader in systems
designed to monitor and support the entire production pro-
cess.
Atacama Slate – the technology designed for hot
desert climates
Our innovative solar module “Atacama Slate” is a cost-ef-
fective solution for producing electricity in regions with high
solar irradiance, sand storms and high temperatures. Ataca-
ma Slate is based on a robust combination of high efficiency
technologies and an innovative module design adapted to
the specific requirements of delicate desert regions.
Atacama Slate consists of a bi-facial, frameless, glass/glass
module design combining the high efficiency heterojunc-
tion and SmartWire connection technologies. This leading
technology combination meets the challenge presented by
desert regions in order to achieve optimum energy yield
under delicate climatic conditions while lowering the total
cost of ownership and module maintenance. High solar ir-
radiance, high environmental temperatures, sand storms as
well as a different light spectrum need to be considered in
the design and technology of solar modules for these chal-
lenging regions.
Our Atacama Slate module is the solution for reach-
ing maximum energy yield by combining high effi-
ciency technologies with a dedicated module design
adapted to desert regions like Saudi Arabia.
Atacama Slate relies on the high performance combination
of heterojunction cells connected with SmartWire connec-
tion technology. Heterojunction cells have a low tempera-
ture coefficient of approx. 0.20% and are designed for high
irradiance conditions. The cost effective SmartWire connec-
tion technology electrically connects solar cells using thin
copper wires on both sides of the cell instead of bus bars
and is capable of achieving up to 5% higher power output
compared to best-in-class bus bar technology., The inno-
vative bi-facial Atacama Slate also enables vertical module
installation while its frameless design effectively counters
sand and dust retention. A robust glass/glass construction
ensures long module endurance. The Atacama Slate com-
bines leading high efficiency technologies with a dedicated
module design to tackle tough desert climatic conditions
and deliver a cost-effective solution for producing electricity.
MEYER BURGER TECHNOLOGY LTD
Schorenstrasse 39
CH-3645 Gwatt (Thun)
Switzerland
www.meyerburger.com
MEYER BURGER TECHNOLOGY LTD
26
READY FOR SAUDI ARABIA
The SMA Group is the world market leader for solar invert-
ers, a key component of all PV plants, and as an energy
management group, offers innovative key technologies for
future power supply structures. SMA offers first-class prod-
ucts, system solutions and worldwide servicing for every
PV system. The company generated sales of € 1.5 billion in
2012 and is headquartered in Niestetal, Germany. It is rep-
resented internationally in 21 countries, employs more than
5,000 people and maintains 90 service stations worldwide.
LEADING SOLUTIONS AND EXPERTISE FOR UTILITY-
SCALE PV POWER PLANTS
More than 30 years of experience and PV power plant proj-
ects in the multi megawatt range in more than 30 countries
show the outstanding competence of the company. Invert-
ers are the intelligent central component at the heart of
every PV system and their quality and reliability determine
the performance of the entire PV power plant. As a pioneer
in grid integration, SMA furthermore offers worldwide tai-
lor-made solutions that fulfill the complex requirements for
PV power plants in the local markets. SMA’s experts work
together with various bodies and committees to establish
the necessary regulations worldwide. SMA central invert-
ers have been meeting the requirements of country-specific
connection conditions for years in a number of countries,
including Germany, Japan, and the US.
CHALLENGING ENVIRONMENTAL CONDITIONS IN
SUNBELT COUNTRIES
The world’s sunbelt regions with countries such as Saudi
Arabia are extremely attractive for large-scale PV projects.
Countries with rising populations, booming economies and
increasing demand for energy supply not only profit from
vaster possibilities of energy production but also from the
creation of jobs through new technologies. Saudi Arabia
has favorable irradiation conditions for the deployment of
PV energy generation and therefore the chance to save oil
and thus extent the nominal lifetime of this fossil energy
resource. When it comes to water desalination PV power
is indispensable in countries with dry and hot environmen-
tal conditions. The implementation of PV technologies also
represents a great opportunity in value chain development.
In addition to high efficiency and low energy self-consump-
tion, SMA central inverters are designed for extreme con-
ditions such as extreme heat or sandstorms. Only invert-
ers with excellent technical properties will guarantee the
long-term benefits of PV projects in climatically challenging
regions.
FLAGSHIP PROJECTS IN THE GULF REGION
SMA is the local market leader in Saudi Arabia and has al-
ready installed a base of 16 MW in Saudi Arabia specifi-
cally and more than 65 MW in the Gulf Region – continuing
to rise. Flagship projects are the solar parc KAPSARC (King
Abdullah Petroleum Studies and Research Center) equipped
with SMA Sunny Central 720 CP inverters and the world’s
largest parking lot to be covered with PV panels in Khobar
with 10.5 MW PV power utilizing 18 Sunny Central inverters.
These are only two examples of recent PV power plant proj-
ects in the kingdom which expects its energy consumption
tripling until 2032. SMA shows local presence with a ser-
vice company in Dammam, provides local on-site service,
local trainings and education as well as sales and technical
support from its presence in Dubai and Abu Dhabi. SMA
is optimally positioned in the market and preparing for an
even stronger engagement in Saudi Arabia according to the
local requirements.
SMA SOLAR TECHNOLOGY AG
Sonnenallee 1
34266 Niestetal Germany
www.SMA.de
SMA SOLAR TECHNOLOGY AG

27

28
SIC PROCESSING (DEUTSCHLAND) GMBH
SiC Processing (Deutschland) GmbH
YOUR PARTNER TO REDUCE WAFER COSTS.
The SiC Processing (Deutschland) GmbH is a leading, worldwide operating service partner for processing
of used sawing suspension (slurry) with outstanding market position and product quality. Improved process
performance, lower consumption of virgin resources, significant waste reduction and finally lower total
wafer costs are the motivation for our customers using our slurry management capabilities.
Photovoltaic and semiconductor industry are using slurry to produce wafers out of mono- or multi-crys-
talline silicon blocks on wire saws. The suspension consists of a fine-grained, sharp edged abrasive (most
silicon carbide) and a viscose carrier liquid (most glycol) which acts as a transportation- and cooling medium.
During the wire sawing process the slurry is collecting the removed fine silicon (kerf) and other impurities
(Fe, H2O), the cutting efficiency is decreasing and the used slurry has to be replaced.
Our multi-step technology separates solid and liquid components, eliminates all residues and recovers SiC-
abrasive and liquid with customized characteristics.Recovery rates of 80 to 95 % are possible for the com-
ponents. We can provide the recycled materials separately or the ready to use slurry according to customer
process specifications. For almost all residues applications are available to ensure waste avoidance.
Also for other materials our processing concept can be modified. Separation, classification and cleaning of
fine solid powders as well as filtration, purification and distillation of technical liquids are part of our busi-
ness. In our plants in Bautzen/ Germany it is possible to process up to 40,000 tons per year. R&D projects,
lab analyses and logistics are additional services.
For further information please contact: SiC Processing (Deutschland) GmbH
Neuteichnitzer Straße 46 , 02625 Bautzen , Germany
Phone: +49 3591 529330 , [email protected] , www.sic-processing-bautzen.de
• Worldwide operating service partner for sawing suspension
(slurry)
• 12 year experience and technical know-how improvement
• Complete slurry management (recycling, virgin compo-
nents, logistics, plant construction)
• Supply of specified components or ready to use slurry
• Own R&D center; highly qualified laboratory; own TCO
models
• Separation, classification and purification of other solid
materials/ powders/ liquids

29
Optical Disc >
Solar >
Semiconductor >
Mastering
Molding
Replication
Crystalline Photovoltaic
Thin FilmPhotovoltaic
MRAMThin Film HeadsSensor
SINGULUS TECHNOLOGIESInnovative Technology for Photovoltaic
Optical DiscSolarSemiconductor
anzeige_Indien_2013:Layout 1 31.07.13 12:10 Seite 1
SINGULUS TECHNOLOGIES
DEVELOPER, ENABLER AND SUPPLIER FOR THE PV MARKET
SINGULUS TECHNOLOGIES is a supplier of manufacturing solutions and production equipment for the Mar-
kets Optical Disc, Semiconductor and Solar. With new machine concepts and manufacturing processes in
the crystalline and thin-film solar technology SINGULUS TECHNOLOGIES establishes itself as development
partner and equipment supplier for investments in new high-performance solar cell concepts. SINGULUS
TECHNOLOGIES continues to expand its activities in the Solar segment. and cooperates with cell manufac-
turers worldwide and develop processes, which improve the efficiency of solar cells and at the same time
reduce production costs. In addition, SINGULUS TECHNOLOGIES has set up development partnerships with
universities, institutes and leading solar companies to establish a proprietary technology as standard for the
development of the new cell concepts.
Evolutionary improvement in cell concepts like PERC (PERL/PERT), n-type material, IBC – back con-
tacted cell or Heterojunction cells will drive the future of crystalline solar cells.
SINGULUS is the market leader for the application of CIS/CIGS processes. New plant concepts expand the
value-added chain of the company in the area of thin-film solar technology.
SINGULUS offers modern production systems such as Selenisation furnace for an optimized CIGS absorber
formation, Sputtering & Evaporation machines as well as Wet-chemical systems.
SINGULUS TECHNOLOGIES AG
Hanauer Landstrasse 103 , 63796 Kahl am Main , Germany
Tel.: +49 [0] 61 88 - 4 40 - 0 , E-mail: [email protected]

30
Air Liquide, world leader in gases for industry, health and the environment
Gases and Precursors for the Solar PV Industry
Air Liquide serves >50% of PV Manufacturing Worldwide
AIR LIQUIDE
AIR LIQUIDE IS THE WORLD LEADER IN GASES FOR INDUSTRY, HEALTH AND THE ENVIRONMENT, AND IS PRESENT IN OVER 80 COUNTRIES WITH NEARLY 50,000 EMPLOYEES.
Oxygen, nitrogen, hydrogen and rare gases have been at the core of Air Liquide’s activities since its creation
in 1902. Using these molecules, Air Liquide continuously reinvents its business, anticipating the needs of
current and future markets. The Group innovates to enable progress, to achieve dynamic growth and a
consistent performance.
Air Liquide explores the best that air can offer to preserve life, staying true to its sustainable development
approach. In 2012, the Group’s revenues amounted to €15.33 billion, of which almost 80% were generat-
ed outside France. With over 1400 employees in the Middle East and North Africa Air Liquide is present in
Morocco, Tunisia, Algeria, Egypt, Lebanon, Kuwait, Oman, Qatar, Saudi Arabia, Syria and the United Arab
Emirates, where the Group has its Middle East and North Africa headquarters.
Its Electronics business line supplies advanced materials and services to over 50% of Photovoltaic manufac-
turers globally in an effort to advance the industry and help achieve grid parity.
Air Liquide has decided around one billion dollars investments over the 2002-2012 period in the MENA
region.
A partner for the long term, Air Liquide relies on employee commitment, customer trust and shareholder
support to pursue its vision of sustainable, competitive growth.
Air Liquide is listed on the Paris Euronext stock exchange (compartment A) and is a member of the CAC 40
and Dow Jones Euro Stoxx 50 indexes.

31

32
Editor
EuPD Research
Adenauerallee 134
53113 Bonn
Germany
Tel +49 (0) 228 – 971 43 - 0
Fax +49 (0) 228 – 971 43 -11
www.eupd-research.com
Authors
Martin Ammon
Markus Lohr
Picture Index
Cover
fotolia.de | industry robotic © industrieblick
fotolia.de | Solar enegery © Mark Smith
fotolia.de | solar panel with desert house © xiaoliangge
fotolia.de | Hi Tech factory inside © industrieblick
fotolia.de | High Tech industrie factory © industrieblick
IMPRINT
Editor
Viridis.iQ GmbH
Reichenaustr. 21
78467 Konstanz
Germany
Telefon (+49) 7531 3610 4953
Telefax (+49) 7531 3610 4882
www.viridis-iq.de
Authors
Magdalena Ulmer
Matthias Grossmann
Dr. Wolfgang Herbst
Art Direction
360|Concept
www.360concept.de
Stefanie Becker
Rebecca Ohagen
© EuPD Research 09/2013
EuPD Research® is a trade of
HOEHNER RESEARCH & CONSULTING GROUP GmbH.


www.eupd-research.com | www.viridis-iq.de