slicing the aurora - innovis -...
TRANSCRIPT
Slicing the AuroraSebastian Lay†,∗, Jo Vermeulen†, Charles Perin†, Eric Donovan†, Raimund Dachselt∗, Sheelagh Carpendale†
†University of Calgary∗Technische Universitat Dresden
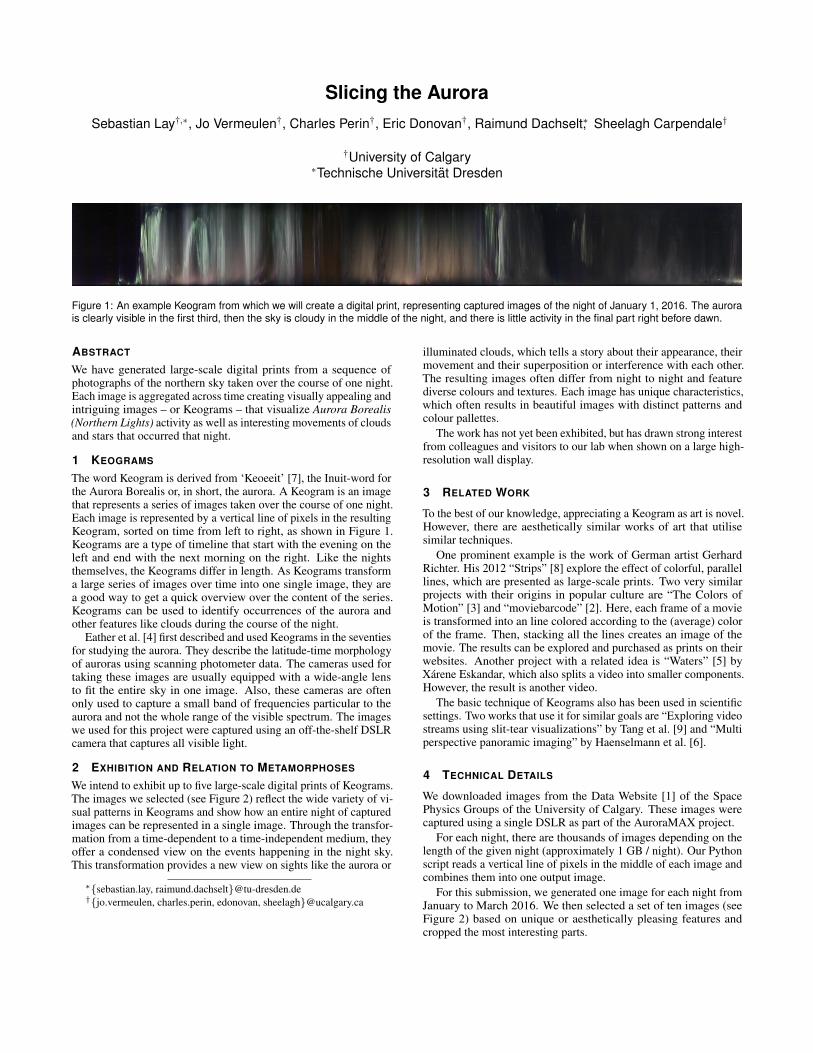
Figure 1: An example Keogram from which we will create a digital print, representing captured images of the night of January 1, 2016. The aurorais clearly visible in the first third, then the sky is cloudy in the middle of the night, and there is little activity in the final part right before dawn.
ABSTRACT
We have generated large-scale digital prints from a sequence ofphotographs of the northern sky taken over the course of one night.Each image is aggregated across time creating visually appealing andintriguing images – or Keograms – that visualize Aurora Borealis(Northern Lights) activity as well as interesting movements of cloudsand stars that occurred that night.
1 KEOGRAMS
The word Keogram is derived from ‘Keoeeit’ [7], the Inuit-word forthe Aurora Borealis or, in short, the aurora. A Keogram is an imagethat represents a series of images taken over the course of one night.Each image is represented by a vertical line of pixels in the resultingKeogram, sorted on time from left to right, as shown in Figure 1.Keograms are a type of timeline that start with the evening on theleft and end with the next morning on the right. Like the nightsthemselves, the Keograms differ in length. As Keograms transforma large series of images over time into one single image, they area good way to get a quick overview over the content of the series.Keograms can be used to identify occurrences of the aurora andother features like clouds during the course of the night.
Eather et al. [4] first described and used Keograms in the seventiesfor studying the aurora. They describe the latitude-time morphologyof auroras using scanning photometer data. The cameras used fortaking these images are usually equipped with a wide-angle lensto fit the entire sky in one image. Also, these cameras are oftenonly used to capture a small band of frequencies particular to theaurora and not the whole range of the visible spectrum. The imageswe used for this project were captured using an off-the-shelf DSLRcamera that captures all visible light.
2 EXHIBITION AND RELATION TO METAMORPHOSES
We intend to exhibit up to five large-scale digital prints of Keograms.The images we selected (see Figure 2) reflect the wide variety of vi-sual patterns in Keograms and show how an entire night of capturedimages can be represented in a single image. Through the transfor-mation from a time-dependent to a time-independent medium, theyoffer a condensed view on the events happening in the night sky.This transformation provides a new view on sights like the aurora or
∗{sebastian.lay, raimund.dachselt}@tu-dresden.de†{jo.vermeulen, charles.perin, edonovan, sheelagh}@ucalgary.ca
illuminated clouds, which tells a story about their appearance, theirmovement and their superposition or interference with each other.The resulting images often differ from night to night and featurediverse colours and textures. Each image has unique characteristics,which often results in beautiful images with distinct patterns andcolour pallettes.
The work has not yet been exhibited, but has drawn strong interestfrom colleagues and visitors to our lab when shown on a large high-resolution wall display.
3 RELATED WORK
To the best of our knowledge, appreciating a Keogram as art is novel.However, there are aesthetically similar works of art that utilisesimilar techniques.
One prominent example is the work of German artist GerhardRichter. His 2012 “Strips” [8] explore the effect of colorful, parallellines, which are presented as large-scale prints. Two very similarprojects with their origins in popular culture are “The Colors ofMotion” [3] and “moviebarcode” [2]. Here, each frame of a movieis transformed into an line colored according to the (average) colorof the frame. Then, stacking all the lines creates an image of themovie. The results can be explored and purchased as prints on theirwebsites. Another project with a related idea is “Waters” [5] byXarene Eskandar, which also splits a video into smaller components.However, the result is another video.
The basic technique of Keograms also has been used in scientificsettings. Two works that use it for similar goals are “Exploring videostreams using slit-tear visualizations” by Tang et al. [9] and “Multiperspective panoramic imaging” by Haenselmann et al. [6].
4 TECHNICAL DETAILS
We downloaded images from the Data Website [1] of the SpacePhysics Groups of the University of Calgary. These images werecaptured using a single DSLR as part of the AuroraMAX project.
For each night, there are thousands of images depending on thelength of the given night (approximately 1 GB / night). Our Pythonscript reads a vertical line of pixels in the middle of each image andcombines them into one output image.
For this submission, we generated one image for each night fromJanuary to March 2016. We then selected a set of ten images (seeFigure 2) based on unique or aesthetically pleasing features andcropped the most interesting parts.
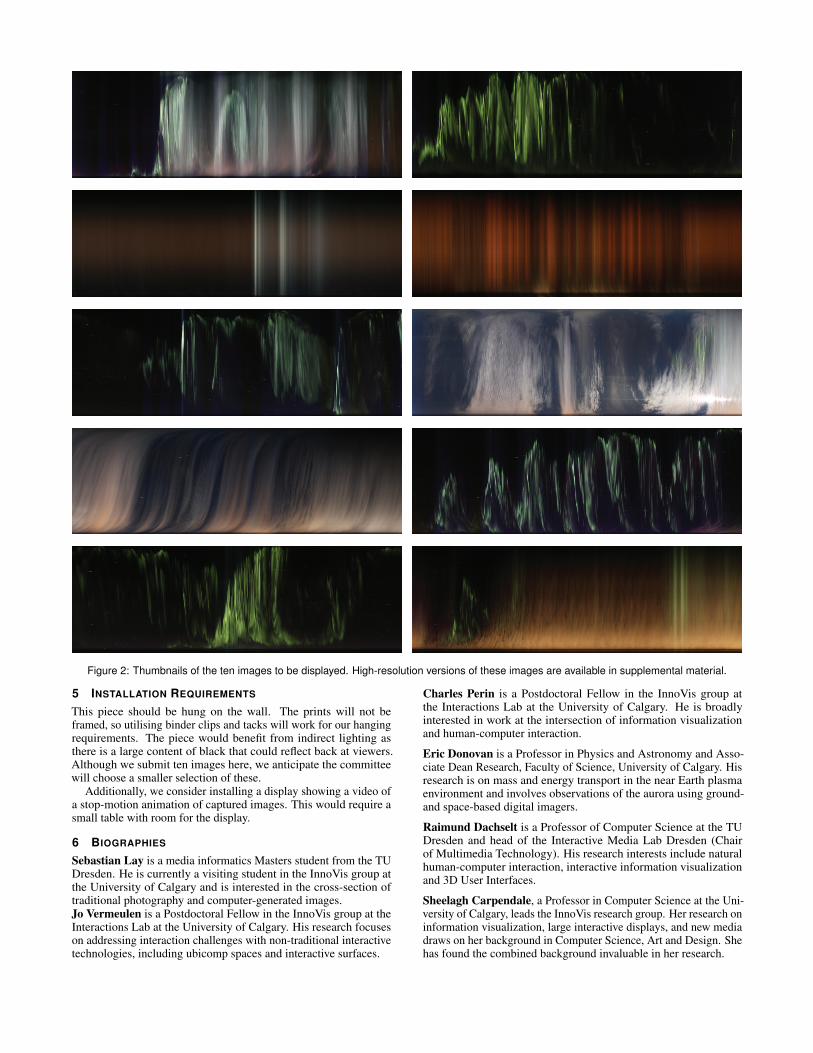
Figure 2: Thumbnails of the ten images to be displayed. High-resolution versions of these images are available in supplemental material.
5 INSTALLATION REQUIREMENTS
This piece should be hung on the wall. The prints will not beframed, so utilising binder clips and tacks will work for our hangingrequirements. The piece would benefit from indirect lighting asthere is a large content of black that could reflect back at viewers.Although we submit ten images here, we anticipate the committeewill choose a smaller selection of these.
Additionally, we consider installing a display showing a video ofa stop-motion animation of captured images. This would require asmall table with room for the display.
6 BIOGRAPHIES
Sebastian Lay is a media informatics Masters student from the TUDresden. He is currently a visiting student in the InnoVis group atthe University of Calgary and is interested in the cross-section oftraditional photography and computer-generated images.Jo Vermeulen is a Postdoctoral Fellow in the InnoVis group at theInteractions Lab at the University of Calgary. His research focuseson addressing interaction challenges with non-traditional interactivetechnologies, including ubicomp spaces and interactive surfaces.
Charles Perin is a Postdoctoral Fellow in the InnoVis group atthe Interactions Lab at the University of Calgary. He is broadlyinterested in work at the intersection of information visualizationand human-computer interaction.
Eric Donovan is a Professor in Physics and Astronomy and Asso-ciate Dean Research, Faculty of Science, University of Calgary. Hisresearch is on mass and energy transport in the near Earth plasmaenvironment and involves observations of the aurora using ground-and space-based digital imagers.
Raimund Dachselt is a Professor of Computer Science at the TUDresden and head of the Interactive Media Lab Dresden (Chairof Multimedia Technology). His research interests include naturalhuman-computer interaction, interactive information visualizationand 3D User Interfaces.
Sheelagh Carpendale, a Professor in Computer Science at the Uni-versity of Calgary, leads the InnoVis research group. Her research oninformation visualization, large interactive displays, and new mediadraws on her background in Computer Science, Art and Design. Shehas found the combined background invaluable in her research.

ACKNOWLEDGEMENTS
We would like to thank Lindsay MacDonald for her input and sug-gestions on how to show this work.
REFERENCES
[1] Space physics group data landing page. http://data.phys.ucalgary.ca.[2] moviebarcode, 2011. http://moviebarcode.tumblr.com.[3] C. Clark. The colors of motion, 2014. http://thecolorsofmotion.com.[4] R. H. Eather, S. B. Mende, and R. J. R. Judge. Plasma injection at
synchronous orbit and spatial and temporal auroral morphology. Journalof Geophysical Research, 81(16):2805–2824, 1976.
[5] X. Eskandar. Waters, 2013. http://cargocollective.com/Waters.[6] T. Haenselmann, M. Busse, S. Kopf, T. King, and W. Effelsberg. Multi
perspective panoramic imaging. Image and Vision Computing, 27(4):391– 401, 2009.
[7] S. B. Mende. Photometric investigation of precipitating particle dy-namics. Journal of geomagnetism and geoelectricity, 30(4):407–418,1978.
[8] G. Richter. Strips, 2011. Digital Print on Paper.[9] A. Tang, S. Greenberg, and S. Fels. Exploring video streams using
slit-tear visualizations. In CHI EA ’09: CHI ’09 Extended Abstracts onHuman Factors in Computing Systems, pages 3509–3510, New York,NY, USA, 2009. ACM.