slide 1 august 31, 2004 steward & stakeholder consultation topics: update on stewards’...
TRANSCRIPT
Slide 1
August 31, 2004
Steward & Stakeholder Consultation
TOPICS:
Update on Stewards’ Registration
Governance & Market Development: Phase II
Preliminary Stewards’ Fees for 2005

Consultation Process
• Two phased consultation to address issues identified in approved Blue Box Program Plan (BBPP) governance structure
market development
• Phase I – Round Table Discussion held July 15 Circulated discussion notes to registrants for accuracy
Posted notes for comments from all stakeholders
Received comments
Slide 2

Phase II
Considering Options:
• Seek opinions on issues in approved BBPP only
• Timing of “enhancements” requested by Minister; potential impact on fees unknown
August 6 Week of Aug. 15 Aug. 31 Early September
Phase 2Options
Closing Date forRound TableComments
Post & DistributeRound Table
Findings
Webcast & open consultation todiscuss options
Draft finalrecommen-
dationson issues
identified inapproved BBPP
Slide 3

Today’s Objectives
• Inform stewards about key activities of the organization
• Ensure fee setting is transparent
• Request feedback on matters before the Board of Directors
• Fulfill requirements of approved BBPP
Slide 4

Today’s Agenda - Morning10:15 Welcome, Damian Bassett
10:30 Update, Stewardship Ontario RegistrationQuestions & CommentsGordon Day
10:55 GovernanceQuestions & CommentsDerek Stephenson & Dennis Darby, Chair of Board
11:45 Market DevelopmentQuestions & CommentsGeoff Love
12:10 (approx.)
Lunch Slide 5

Today’s Agenda - Afternoon12:45 Resume Meeting
Preliminary Stewards 2005 FeesQuestions & CommentsGuy Perry
2:20 - 2:30 (approx.)
Adjourn
Slide 6

Today’s Instructions
• New participants from all stakeholder groups
• 2nd audience listening on-line
• Those on-line: we’ll note the number as we change the slide
e-mail questions/comments from your regular email program to the address below
• Webcast available in archives – 180 days Slide 7

Gordon Day
Update on Stewards’ Registration
Slide 8

Update on Stewards’ Registration
• Summary of steward reports to date
• Summary by sector categories
• Compliance & enforcement procedures
Slide 9

Summary Of Steward Reports*
• 2,484 organizations have registered• 1,416 declared as stewards
481 Blue Box Waste (BBW) but under $2 million 587 registered as “no BBW”
• Reported weight: 75.6% of projection/basis for setting fees
• Reported fees: 90.2% of projection/basis for setting fees
* As of August 20
Slide 10

Still Outstanding
• Adjustments to stewards submissions (<50)
• Registered, but have not reported (300)
• No response to notification letter (2,000)
• New steward notifications (400)
Slide 11

Summary of Reported Stewards
Consumable
Durable
Retail/Distributors
PrintedMedia
OtherServices
De minimis
LCBO
0%
10%
20%
30%
40%
50%
Stewards Levies Kg
Slide 12

Compliance Procedures – 4 Stages
• Stage 1 – Notification of Potential Stewards
• Stage 2 – MOE Confirmation Letter
• Stage 3 – MOE Enforcement
• Stage 4 – Stewardship Ontario Audits
Slide 13

Stage 1- Notification
• First class letter to all identified potential steward organizations in January
• Phone calls to key potential stewards (Top 300)
• Thorough review & paring of original list
• Follow-up phone call (call centre) to all non-respondents in May/June
• Final warning letter part of procedures before MOE Enforcement
Slide 14

Stage 2 – MOE Confirmation Letter
• Primary purpose to confirm legitimacy of Stewardship Ontario (feedback following call centre activities)
• Supported by MOE Enforcement
• Mailed August 30th with supporting Stewardship Ontario instructions
• Letter targeted at the outstanding notified & registered potential stewards
Slide 15
Stage 3 – MOE Enforcement
• MOE recruiting & training two dedicated enforcement officers
• Preparing 2-3 test cases for enforcement procedures
• Stewardship prepares & transfers file of evidence & contacts
• Once enforcement procedures begins, MOE proceeds to charging
Slide 16

Stage 4 – Stewardship Ontario Audits
• Initial advisory group meeting set for September 1st
• Members include RCC, CCGD, FCPMC, LCBO, Refreshments Canada, BDO Dunwoody
• Decision to be taken on percent of stewards & percent of reported quantities to audit
• Target start date is October
Slide 17


Derek Stephenson & Dennis Darby, Chair of the Board
“Governance”
Slide 19

Process to Date
Future Structure Committee reviewed:
• Slides presented at July workshop & webcast
• Notes on Round Table discussions circulated for review & comment by participants
• Comments/submissions received following workshop & notes posted
• Draft discussion paper prepared
Recommendations of Committee approved by Board of Directors for purposes of consultation
Slide 20

Discussion Paper Included:
• Overview of consultation process & timing
• Profile of registered stewards
• Key functions of Stewardship Ontario & key stakeholders identified
• Key governance issues to be addressed
• Broad options for structuring board
• Copies of all background material
Slide 21

Options Identified
• Board consisting of stewards only with voting allocated on basis of:
a) fees only
b) modify existing board to reflect fees paid by sector, or
c) combination of fees paid & quantities of Blue Box waste reported
• Board consisting of stewards & representatives from industry supply chain
• Board consisting of stewards, suppliers & other stakeholders
Slide 22

Principles Identified
• Structure must fairly represent members who pay fees
• Basis for setting fees must be transparent
• Information used to set fees must be accessible
• Board must be accountable to membership
Slide 23

Preliminary Recommendation
Rationale:
• WDO serves as multi-stakeholder body provides oversight of activities of Stewardship
Ontario
• Other affected stakeholders have successfully made their views known to WDO, the Government of Ontario & Stewardship Ontario
Voting representation for board by stewards only
Slide 24

Preliminary Recommendation
Rationale, continued:
• Key issue for AMO is calculation of annual net cost of Ontario’s Blue Box program input is assured through equal representation on MIPC
(which undertakes this work) & through their role on WDO
• Need remains for an industry-only body to manage obligated stewards’ affairs
• Effective mechanism required for input from other key stakeholders NGOs, waste management companies, suppliers
Slide 25

Current Board Structure
• Founding Board of Directors represent 7 existing industry sectors represented on WDO expected to be designated stewards
Food & Consumer Products Manufacturers of Canada
Canadian Council of Grocery Distributors
Retail Council of Canada
Refreshments Canada
Canadian Newspaper Association
Liquor Control Board of Ontario
Canadian Paint & Coatings Association & Canadian Consumer Specialty Products Association
Stewardship Ontario CEO (ex-officio) Slide 26

Size & Composition of Revised Board
• 10 - 15 members with representation by industry sector through delegate steward or trade association
Consumable Products: FCPMC, Refreshments Canada, CCSPA
Retail & Distribution: RCC, CCGD, ORHMA
Beverage Alcohol: LCBO
Printed Media: CNA, OCNA
Other Sectors (TBD): durables (appliances, shoes, etc.)
At large: Stewardship Ontario CEO
Slide 27

Board Sectors
• Should be weighted to reflect fees paid by sector
• Preliminary weightings based upon stewards reports to date:
SECTOR SEATS
Consumables 6
Retail & Distribution 4
Beverage Alcohol 1
Printed Media 1
Other Sectors (TBD) 2
At large 1
Total (maximum) 15
Slide 28

Review Sectors Annually
• Adjust defined sectors & sector weightings if the relative percentage of fees paid by any sector varies by ± 10%
• Staggered appointments for individuals to board would be for three year periods
• Board restructuring through election by membership at Stewardship Ontario’s 2005 Annual General Meeting
Slide 29

Feedback Appreciated On…
• Proposed board governance model• Sector weightings• Inclusion of “other” industry sectors• Options for other stakeholders to have access
to board top-to-top meetings with industry sectors committees of board observers
• Size of board Slide 30

Next Steps
• Review of comments by Future Structure Committee by September 7
• Review & decision of board on September 14
• Forward to WDO
Slide 31


Geoff Love
Market Development
Slide 33

Market Development Backgrounder
3 Part Presentation
1) Review 2003 Blue Box Recovery Rates
2) Present Market Development planned activities for 2005 & impact on fees
3) Invite comment for final input to Stewardship Ontario Board of Directors
Slide 34

Background
• Discuss market development activities as per approved Blue Box Program Plan (BBPP) – i.e. 50% Blue Box recovery by 2006
• Recognize that Minister’s request for 60% diversion of Blue Box materials by 2008 will likely require: additional market development
enhanced recovery efforts (i.e. beyond approved plan)
Slide 35

Summary of 2003 Residential Blue Box Recovery by Material Category (tonnes)
2002 20032002 to 2003
% Change WDO
Reported Recovery
MaterialStewardship
Ontario Projected
Generation
WDO Reported Recovery
Stewardship Ontario
Projected Generation
WDO Reported Recovery
Printed Paper 732,000 409,754 635,200 430,614 5.1%
Paper-Based Packaging* 332,300 134,980 328,100 156,902 16.2%
Aluminum Cans 27,000 10,776 26,100 10,113 -6.2%
Steel Cans 69,100 33,472 66,900 32,583 -2.7%
Glass Total 179,400 106,097 194,700 114,249 7.7%
Plastics Total 238,700 31,928 219,000 35,382 10.8%
Totals 1,578,500 727,007 1,470,000 779,844 7.3%
* Including polycoat Slide 36

Blue Box Recovery Summary
• Approved BBPP set target of 50% recovery by 2006 system needed addition of about 35,000 tonnes/year of curbside
recycling from 2002 to 2006 (i.e. total of 145,000 tonnes)
• In 2003, almost 53,000 more tonnes were recycled up from about 33,000 more tonnes in 2002
• Generation of obligated printed papers & plastics are down based on additional waste audit information & in the case of ONP, stewards’ reports
• Projected Blue Box recovery rate has increased from 46.1% in 2002 to 53% for 2003
• Steward reports & an aggressive audit program (through the E&E fund) will be used in 2005 to continue to improve accuracy of Blue Box generation estimates
Slide 37

Three Part Market Development
• The BBPP contains a three part market development program to meet material specific targets: mixed glass,
“green” procurement &
“other material” plans
Slide 38

Glass Market Development Investment Program
Two Glass Funds
1. REOI (longer term)
2. Glass Business Planning/Feasibility Study: “Glass Diversion Fund” (nearer term)
Slide 39

1) REOI (longer term)
• Up to $2 M (from glass Stewards) for 2004/05
• Initiating meetings with GTA municipalities re: mixed glass tonnes available
• Detailed RFP for qualified applicants (fall/winter)
Glass Market Development Investment Program
Slide 40

2) Glass Business Planning/Feasibility Study: “Glass Diversion Fund” (nearer term)
• $500K business planning & feasibility study fund to support projects up to $25K (matching funding basis) e.g. local investment opportunities
• Funding guidelines now posted on Stewardship Ontario website - first project funding expected in fall 2004
Glass Market Development Investment Program
PROGRAM GOAL - stabilize markets, higher value uses, reduce net costs by at least $10/tonne focused on GTA/Golden Horseshoe tonnes
Slide 41

Heard at July Consultation
• Five written responses to July 15 workshop materials: 1 steward; 4 material suppliers
• Common comments: Quality control & increased recovery are of higher importance
for most materials than market development Need for regular “state of the market” meeting for all
stakeholders Limited interest in green procurement Concern regarding Stewardship Ontario’s role on the issue of
cooperative marketing Two targeted materials requiring market development are
mixed broken glass & plastics #3 to #7
Slide 42

Stewardship Ontario Green Procurement Plans for 2005
• BBPP commits Stewardship Ontario to a business planning process that examines potential benefits of launching a new green procurement program
• Steward reaction to research to date has been neutral at best Stewards want to see tangible benefits before making a
major investment Whatever might be done must be voluntary in nature
• Not seen as a 2005 high priority given other pressures & current overall system performance against 50% target
Slide 43
Green Procurement Recommendation
• Focus procurement activities on tangible opportunities (e.g. examine/promote glass-in-aggregate applications developed through the glass fund)
• Participate in MOE & /or WDO – led procurement discussions that may result from Minister’s 60% goal
• On-going business planning to examine potential benefits & costs
Slide 44

“Other Material” Market Recommendations
• No substantial new “Other Material” market development activities recommended until 2005/2008 targets are established by Minister
• Initiate planning for film/other plastics REOI in mid 2005 (for 2006 fees) = $100K in 2005 fees
• Develop “Enhanced Recovery” program plan in 2005 (for 2006 implementation) based on detailed analysis of February 3, 2004 datacall results
• Priorize “least cost next tonne”/enhanced recovery projects though E&E Fund in 2005
Slide 45

Lunch Break
Slide 47
Guy Perry
Preliminary Stewards’ Fees for 2005
Slide 48

Overview
• Key Factors affecting Fees Overall 2005 Blue Box program costs
Generation & reporting of Blue Box waste
• Board decisions for 2005 fee setting
• Preliminary 2005 fee calculations Relative changes for each material
• Next Steps
Slide 49

Background Information
• February 2003 Blue Box Program Plan (BBPP),
particularly,
Section 9.10 - Setting Fees
Appendix XI - Pay In Model, and
Appendix IX - Cost Allocation Principles
• On the Stewardship Ontario website March 2 Presentation on preliminary fees for 2004
Cost Allocation Study - Final Report, March 2004
Slide 50

What Are The 2005 Fees?
• Fees for 2005 are significantly higher than for 2003 & 2004
• Increase in per-kg fee rates range from increases of 1to 2%
to very high increases on % basis
Objective of presentation
• Explain how these increases arise & fall on various material groups
Slide 51

Obligation & Fees• Size of the obligation
was:Municipal BB system cost
+ admin & program costs
• Apportion to all BB Materials
• Cost to manage
• Revenue from sale
• Recovery rate
• All different for each All different for each materialmaterial
2004 => $50.2M
paper pckg
plastic
steel
aluminum
glassmagazines
newsprint
other printed
directories
Slide 52

paper pckg
plastic
steel
aluminum
glassnewsprint
magazines
other printeddirectories
2004 => $50.2M2005 => $63.8M
Apportion to BB Materials in same way
Different
• Cost to manage each material
• Revenue for each material
• Recovery rates for each material
Changing Obligation & Fees
Slide 53

Key Factors Causing Increase1. The law requires industry to pay 50%50% of the cost of the
Blue Box system
Until now the industry share has been significantly lessless than 50%
The system is growing – CPI, population, performance
2. The entire obligation must be paid - must make up any shortfall due to fee rates too low
Initial fees set without data from stewards
cost spread over too many tonnes – fee rates generally lower than required
Slide 54

1st – The Rising Obligation
1. By how much has industry paid less than 50% & why?
2. How much is the actual cost increasing & why?
Slide 55

Industry Contribution 2003-2005
Note: Effective discount greater since actual revenues lower than agreed for fee setting
2003 Fees (2001 Data)
2004 Fees (2002 Data)
2005 Fees (2003 Data)
Tonnes Recovered 693,547 726,726 779,844Estimated Gross Cost $152 m $162.2 m $182.9 mEstimated Cost/tonne $219 $223 $234 Effective Discount $22.8 m $11.7 m -Agreed Gross Cost $129.2 m $150.5 m $182.9 mAgreed Revenue $66.7 m $66.5 m $64.9 mAgreed Net Cost $62.5 M $84.0 M $118.0 MEquivalent Paid Share 36% 44% 50%
Slide 56

Blue Box System Cost ($M)
0
20
40
60
80
100
120
140
2003 (2001) 2004 (2002) 2005 (2003)
Program Year
Net
co
st (
mil
lio
n $
)
Net Cost (actual gross cost less actual revenue)
Net Cost (actual gross cost less agreed revenue)
Agreed Net Cost
Slide 57

Blue Box System Cost ($/Tonne)
0
20
40
60
80
100
120
140
160
2003 (2001) 2004 (2002) 2005 (2003)
Program Year
Ne
t C
ost
($
/to
nn
e)
Net Cost/tonne (actual gross cost less actual revenue)
Net Cost/tonne (actual gross cost less agreed revenue)
Agreed Net Cost/tonne
Slide 58
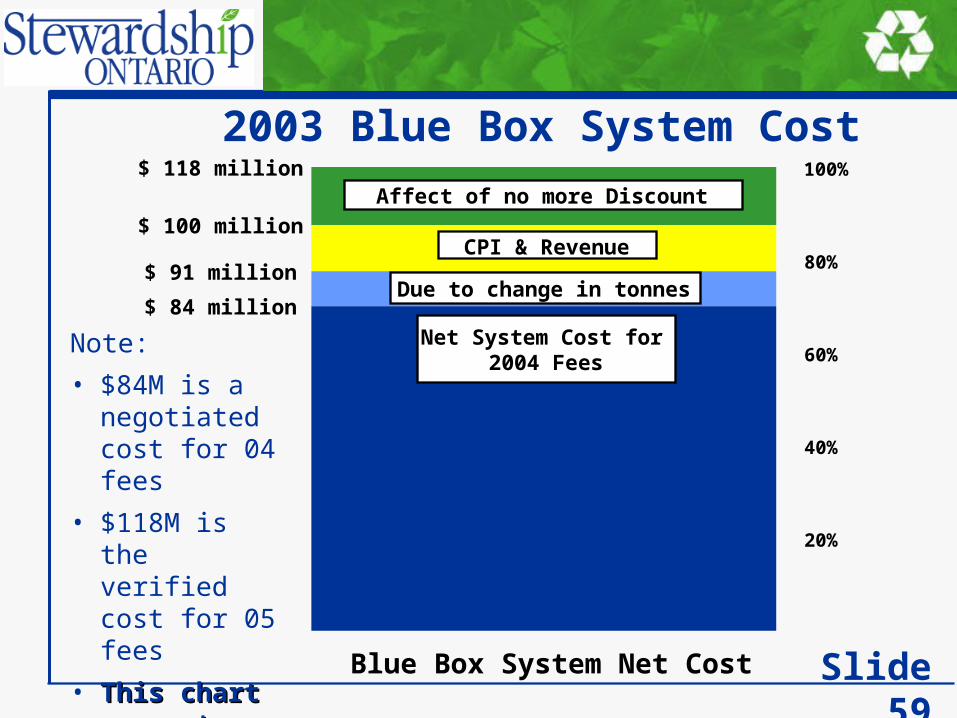
2003 Blue Box System Cost
Note:
• $84M is a negotiated cost for 04 fees
• $118M is the verified cost for 05 fees
• This chart This chart accounts for accounts for the differencethe difference
$ 100 million
Blue Box System Net Cost
100%
20%
$ 84 million
$ 91 million
$ 118 million
40%
60%
80%
Net System Cost for 2004 Fees
Affect of no more Discount
Due to change in tonnes
CPI & Revenue
Slide 59

1st Key Cause For Change In Fees• The law requires industry to pay 50%50% of the cost of the Blue Box
system
Until now the industry share has been significantly lessless than 50%
The discount has now been removed
System Cost has increased ▪ Tonnes recovered up▪ CPI▪ Market revenues down
• The affects are not equal across all materials
Changes in
▪ Recovery rates▪ Cost to manage each material▪ Revenue for each material
Slide 60

2nd – Obligation & Generation
The entire obligation must be paid - must make up any shortfall due to fee rates too low
Initial fees set without data from stewards
cost spread over too many tonnes – fee rates generally lower than required
Slide 61

Status Of Collecting Fees
As of August 20:
• Registrations: 2,484
• Obligated stewards reported:1,022
• Amount of targeted packaging tonnage reported: 75.6%
• Amount of projected fees reported: 90.2%
• Projected additional recoverable levies considering possible re-filing: 5.9%
• Projected fees collected: 96.1%
Slide 62

Generation & Filing
Packaging & Printed Paper Generation For '04 Fees
20%
40%
60%
100%
1,285,000 tonnes
1,516,000 tonnes1,578,500 tonnes
80%
Estimated Generation for 04 Fees
Revised 04 Waste Comp Data
Stewards Reports
Slide 63

Why The Shortfall?
• There are four reasons for this difference: Imprecision of waste audit data Misreporting by registered stewards Unidentified stewards Non-compliance
• Model allowed for 5% non-compliance & 5% de minimis Meaning fees spread over 90% of estimated generation
Slide 64
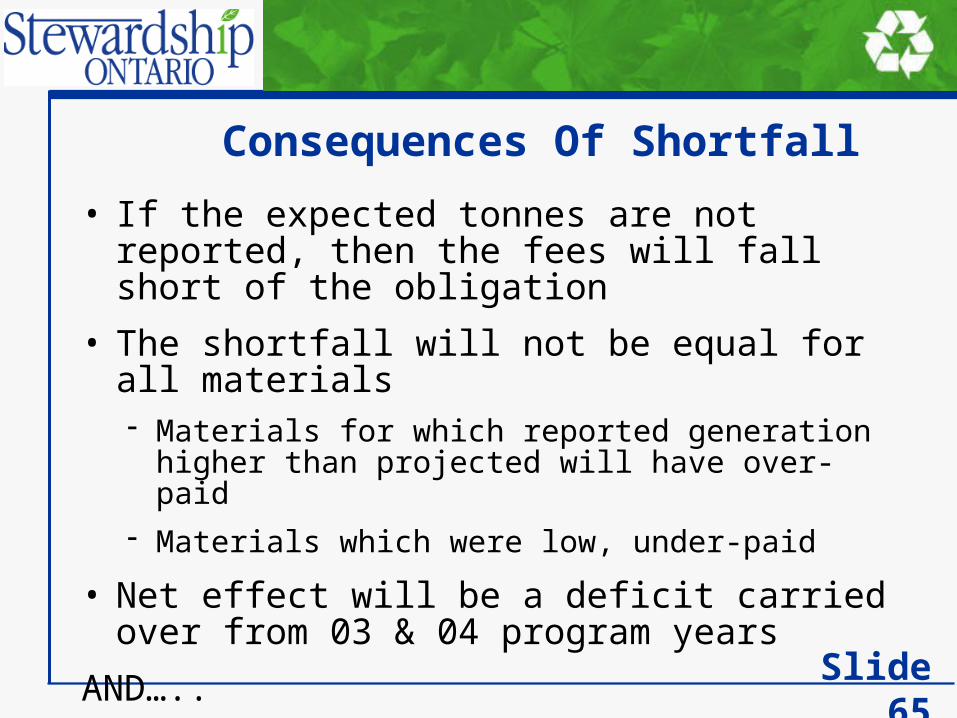
Consequences Of Shortfall
• If the expected tonnes are not reported, then the fees will fall short of the obligation
• The shortfall will not be equal for all materials Materials for which reported generation higher than
projected will have over-paid
Materials which were low, under-paid
• Net effect will be a deficit carried over from 03 & 04 program years
AND…..
Slide 65

Consequences cont’d• Potential for shortfall in future years:
if we distribute the fees over generation projections that exceed reported generation
▪ $ allocation divided by tonnes generated
Therefore…..
• Decisions considered by Board to address the two issues: Avoid shortfall in future years
Deal with shortfall from 03 & 04
Slide 66
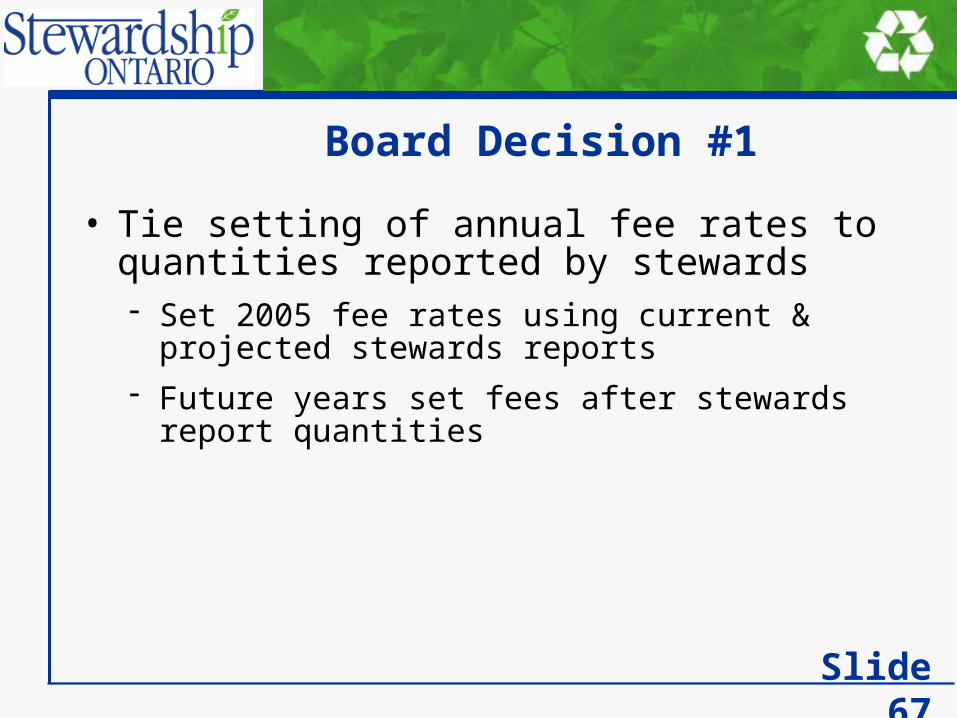
Board Decision #1
• Tie setting of annual fee rates to quantities reported by stewards Set 2005 fee rates using current & projected
stewards reports
Future years set fees after stewards report quantities
Slide 67

Board Decision #2• Shortfall for 2003 & 2004 => $1.6 million (~2.5% of projected 05
costs including allowance for re-filing)
• To be reduced using unexpended program funds of $500,000 Green procurement Market development planning Compliance Waste audits & program reviews
• Remaining shortfall to be made up in 05 fees =>$1.1 million (<2% of 05 costs)
Slide 68

Board Decision #3Approaches to distribution of shortfall
1. Apply shortfall to specific materials for which shortfall exists
Alternatively,
2. Put a portion (or all) of shortfall across all materials in same way as other general costs (e.g. admin) Since non-compliance is not related to complying
stewards in any specific material
• As reporting improves, resulting over-reporting can be reallocated in future years
Slide 69

2nd Key Cause for Change in Fees• The entire obligation must be paid
Making up the 03 & 04 shortfall in 05
Spreading the fees over a reduced number of tonnes
▪ To prevent compounding shortfall
▪ In future, stewards report before fees set
• The affects are not equal across all materials
Slide 70

Summary Of IncreasesIncreases due to:
1. Increased municipal obligation 40%(removal of discount, increased tonnes, CPI, revenue)
2. Shortfall in fees collected <2%
3. Smaller base of tonnes 23%
Offset by decrease:
• admin & other program costs 48%
Overall increase in fees => 26.7%
Materials not affected equally
Slide 71

Basis of Fee Payments• Same funding formula as in BBPP
• Based on data for 2003: Generation
Recovery
Gross municipal cost
Municipal revenue
• Apportioned to materials using three factors relative cost (40%) recovery rate (40%) Equalization (20%) - cost to achieve 75% recovery
• Add allocations for admin & other program costs Slide 72

Material Specific Changes
RecoveryRecovery
RateGross
Cost/tonneRevenue ($/tonne)
PRINTED PAPER
Newsprint (CNA/OCNA) -17.9% 5.5% 10.78% -6.35%
Newsprint (Non-CNA/OCNA) -17.9% 5.5% 10.78% -6.35%
Magazines and Catalogues 357.0% 47.7% 10.78% -6.35%
Telephone Books 75.9% 32.1% 11.09% -6.35%
Other Printed Paper 129.7% 22.6% 10.56% 12.67%
PACKAGING
Paper Based Packaging 16.2% 7.2% 10.73% -3.62%
Plastics Packaging 10.8% 2.8% 6.72% 5.61%
Steel Packaging -2.7% 0.3% 10.96% -12.88%
Aluminum Packaging -6.2% -1.2% 10.76% -7.56%
Clear Glass Packaging 29.1% 4.1% 10.50% -
Colour Glass Packaging -19.8% -8.0% 10.40% -
Overall 7.3% 7.0% 13.29% -9.00%
Material Category% Change 2004 => 2005
Note:
Changes are different for each material
The absolute & relative magnitude of the changes affect fee allocations
Slide 73

Admin & Program Costs
Note: admin & program allocation in 04 fees was higher than 04 budget due to items not included in 03 fees
2004 Budget (000$)
2005 Forecast
(000$)
Change (000$)
Stewardship OntarioAdministration $2,739 $2,465 -$274Programs
Market Development $2,500 $100 -$2,400Enforcement & Compliance $300 $400 $100
other programs $462 $270 -$192Start-up Costs $750 $894 $144WDO Contribution $710 $700 -$10
including datacall
Total $7,461 $4,829 -$2,633
Slide 74

Distribution of Admin & Program CostsFor 04 fees
• Distribute program & admin costs according to est. relative # stewards in each material group
• Reduced fixed allocation to LCBO & Newspaper Thinking at the time that relatively few stewards meant a low driver
of cost
But, for 05 fees,
• Recognize need to consider sharing cost not only for members services, but also program work e.g. datacall, verification, cost allocation & program optimization which affect all materials
• # stewards in each material from registration & filing Slide 75

(%) (%) ($)
PRINTED PAPER 8.4% 22.0%
Newsprint 1.8% 10.0% $351,233
Magazines and Catalogues 0.4% 3.8% $152,440
Telephone Books 0.1% 0.6% $21,672
Other Printed Paper 6.1% 7.6% -$56,591
PACKAGING 91.6% 78.0%
Paper Based Packaging 35.9% 27.0% -$1,165,810
Plastics Packaging 37.8% 27.0% -$1,294,370
Steel Packaging 4.7% 9.0% $104,210
Aluminum Packaging 4.7% 7.0% $9,630
Clear Glass Packaging 4.9% 5.3% -$82,065
Colour Glass Packaging 3.6% 2.7% -$119,348
TOTAL 100.0% 100.0% -$2,079,000
Notes1. Allocations exclude market development fees 2004 ~ $2.4 million to glass => share of costs for glass significantly higher in '04 than shown in chart 2005 ~ $100,000 to plastics => share of costs for plastics slightly higher for '05 than shown in chart
ChangeCategory
Allocation for 2005
2004 Allocation
Distribution of Admin & Program Costs
Slide 76

Preliminary 2005 FeesNote:
Table reflects distribution of shortfall according to stewards reports by material
Alternative being considered by Board:Distribute 100% of shortfall in same way as admin & other program costs
Category2004 Fee
Allocation2005 Fee
AllocationChange in Fee 2004 => 2005
(cents/kg) (cents/kg) ($)
PRINTED PAPER
Newsprint 0.026 ¢/kg 0.320 ¢/kg 804,295$
Newsprint - Non-CNA/OCNA 0.026 ¢/kg 0.787 ¢/kg 901,841$
Magazines and Catalogues 0.310 ¢/kg 0.907 ¢/kg 644,195$
Telephone Books 0.687 ¢/kg 1.324 ¢/kg 114,363$
Other Printed Paper 1.318 ¢/kg 10.125 ¢/kg 2,665,506$
PACKAGING
Paper Based Packaging 5.987 ¢/kg 7.850 ¢/kg 3,237,587$
Plastics Packaging 9.610 ¢/kg 14.254 ¢/kg 4,262,541$
Steel Packaging 4.391 ¢/kg 4.455 ¢/kg 425,955$
Aluminum Packaging -3.193 ¢/kg -0.124 ¢/kg 927,456$
Clear Glass Packaging 3.682 ¢/kg 3.357 ¢/kg 391,552$
Colour Glass Packaging 3.916 ¢/kg 4.485 ¢/kg (962,650)$ Slide 77

Key Drivers Of Fee Rates• Net cost ($) of all materials increased, except glass
• Overall 3-yr average revenue down, but some more than others
Glass, because of shift to mixed glass, Aluminum, steel down
• Some material revenue increased
Plastics increased on average Other printed paper due to increased share of ONP prices
Slide 78

Key Drivers of Fee Rates cont’d• Relative recovery rates
Other printed paper still low relative to newsprint etc. Aluminum recovery rate reported by municipalities down Paper packaging & plastics up relative to others
• Credit for aluminum lower – realizing lower price & reduced relative recovery rate
• Redistribution of admin & program costs No market development fees for glass Increased allocation (% stewards) to printed paper, aluminum,
steel, glass
Slide 79

Key Drivers of Fee Rates cont’d
• Shortfall in fees due to under-reporting
Combination of fee rates & variance in reporting
Under-reporting for plastic laminants, other printed paper & over-reporting for aluminum leads to shortfall
Over-reporting for steel & clear glass leads to credit
Slide 80

Key Drivers of Fee Rates cont’d
• Removal of in-kind contribution from non-CNA/OCNA newsprint
Contribution also no longer covers CNA/OCNA municipal obligation
• Fee rates higher due to use of reduced base of tonnes (stewards reports)
Note: aluminum credit lower due to higher reporting
Slide 81

In SummaryIncreases in overall fees due to:
1. Increased municipal obligation(removal of discount, increased tonnes, CPI, revenue)
2. Shortfall in fees collected
3. Smaller base of tonnes
Offset by decrease in:
• admin & other program costs
Materials not affected equally Relative recovery rates, costs & revenue
Slide 82
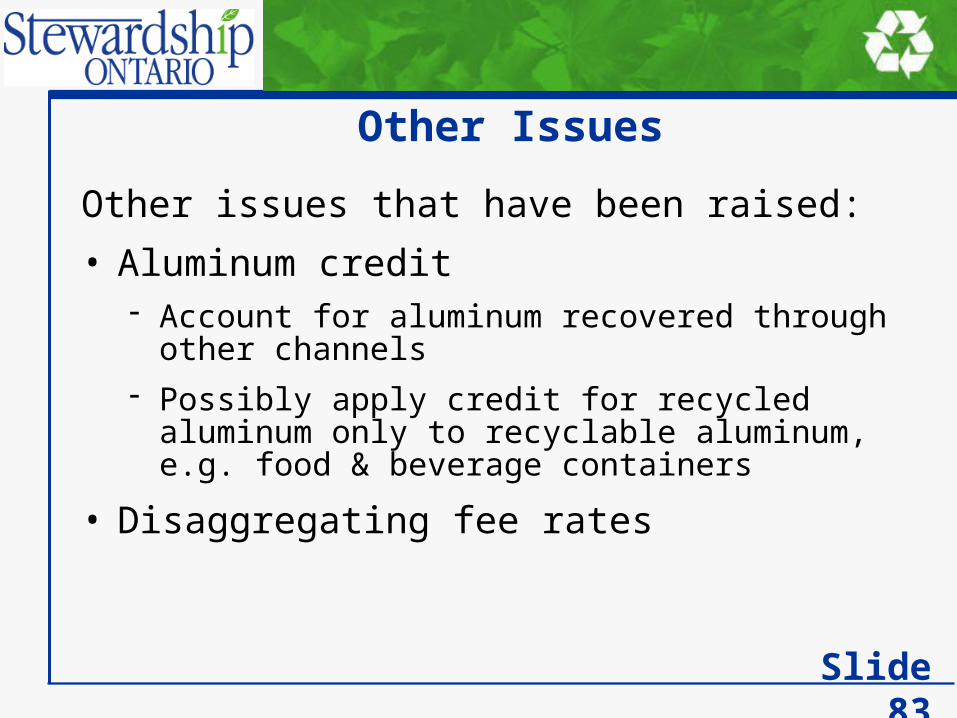
Other Issues
Other issues that have been raised:
• Aluminum credit Account for aluminum recovered through other
channels
Possibly apply credit for recycled aluminum only to recyclable aluminum, e.g. food & beverage containers
• Disaggregating fee rates
Slide 83
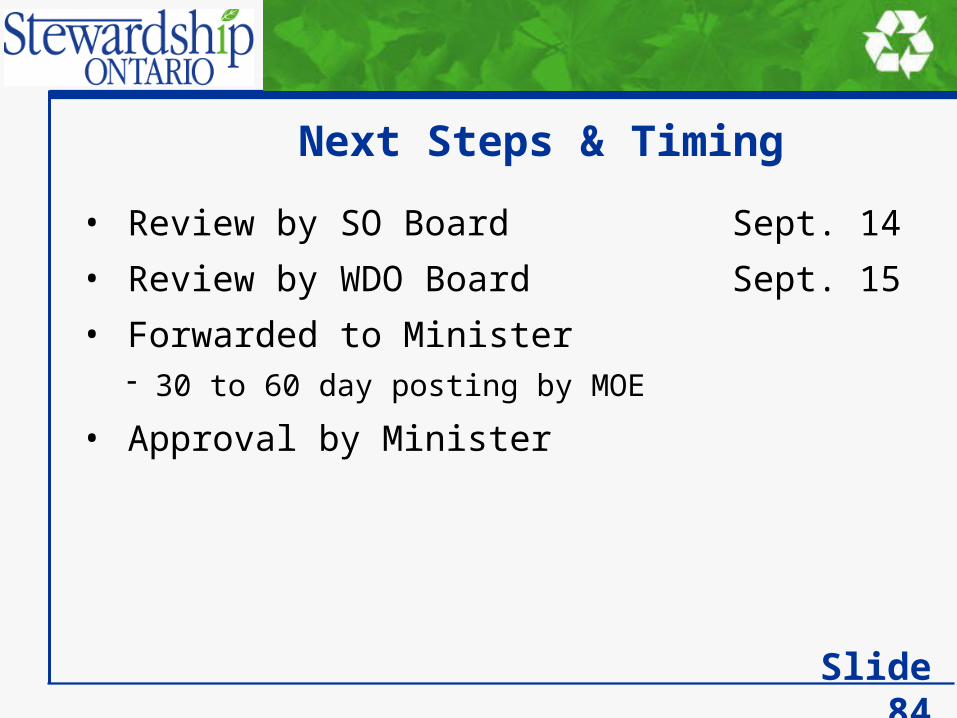
Next Steps & Timing
• Review by SO Board Sept. 14
• Review by WDO Board Sept. 15
• Forwarded to Minister 30 to 60 day posting by MOE
• Approval by Minister
Slide 84


Thank You
Slide 86