slide 1 of 15 energy efficiency in india – challenges & lessons ajay mathur bureau of energy...
TRANSCRIPT

Slide 1 of 15
Energy Efficiency in India –
Challenges & Lessons
Ajay MathurBureau of Energy Efficiency

• Page 2 of 15
Energy demand in India will increase by a factor of 1.5 to 2.5 by 2030
Energy consumption in India was about 750 mln toe in 2011
• Per capita supply was about 0.6 toe• Per capita consumption was 0.4 toe
Supply is expected to grow to 1200 mln toe (IEA) to 1700 mln toe (India Inte- grated Energy Policy) by 2030

Slide 3 of 15
How much energy is required ?
A minimum energy consumption of 2.3 toe/year/cap is needed today to achieve HDI of 0.9 Countries which “develop” later achieve transition at lower energy levels Probable that transition may occur at 1.5 toe in the future Enhanced energy efficiency is essential to enable early transition

• Page 4 of 15
Energy efficiency in India – the context
Energy prices are high in India• Industrial and commercial consumers pay
electricity and petroleum product prices that are amongst the highest in the world
• Household consumers pay electricity and petrol prices that are highest in the world relative to their incomes
• Increasing imports will keep prices high• Consistent reduction in energy intensity; Investment in energy-efficient goods
is estimated to be about Rs. 50-100 billion annually Energy efficiency reduces costs, energy imports, GHG
emissions, and pollution, but penetration is limited because: • High first costs deter users, especially households• New technologies are perceived as being risky, especially by industry• Costs and benefits accrue to different people, especially in the case of
buildings

• Page 5 of 15
Regulatory Framework for energy efficiency in India
Energy Conservation Act, 2001 Created Bureau of Energy Efficiency Appliance standards and labeling Energy consumption norms, and energy-use reporting
requirements for energy-intensive industrial units Energy Conservation Building Code for commercial
buildings Certified Energy Managers and auditors
National Action Plan for Climate Change, 2008 National Mission on Enhanced Energy Efficiency
provides mandate for market-based mechanisms to promote energy efficiency
National Mission on Sustainable Habitat seeks to incorporate energy-efficiency requirements in building byelaws

• Page 6 of 15
Information helps consumer decisions
STAR RATING FORBUILDINGS
Energy Performance Index:
Category of Building :
Type :
Climatic Zone :
Connected Load :Build up Area :
Name of the Building :
kWh/ sq m/ year

• Page 7 of 15
Labels built up as a “brand”
Voluntary labels for refrigerators and airconditioners introduced in December 2006
Aggressive advertising and outreach promoted labels as a brand of superior products – manufacturers piggybacked on label advertising
Labeling became mandatory for four products (where market transformation was well under way) from 7th January, 2010
Voluntary labels in place for eleven other appliances Refrigerator and air conditioner standards and labels
tightened periodically Labeled products bought for check testing Labeling seldom works if payback period is more than 4-5
years; maximum sales is of products with 2-3 years payback

• Page 8 of 15
Super Efficient Equipment Programme
Focus on LED Lighting Encouraged cities and villages to procure and install LED lights Notified LED standards – first in the world Repeated bulk procurement of streetlights and bulbs LED bulb (60-W eqvt) prices have come down from Rs 1200 in 2010 to
Rs. 290 in 2014
Incentives for Super Efficient Fans 30 million fans are sold annually with an average rating of 70 W Share of 5-star (50 W) fans is less than 3%; payback period is +4 years SEEP will offer an incentive of upto Rs. 500 for each fan sold that has a
rating of 35 W, or less; Incentive will be released to manufacturers after third-party verification of sales and energy consumption tests of samples; Incentive will be tapered off in last two years
Large market outreach programme Demand is expected to stimulate production lines and volumes, leading
to cost reductions, and a sustainable market share for SEEP fans

• Page 9 of 15
New buildings have huge potential – which very difficult to achieve
Approximately two-thirds of the buildings that will exist in 2030 are yet to be built
Energy Conservation Building Code (ECBC) issued in 2007 to guide design of new commercial buildings – where there is largest scope for efficiency improvements
ECBC has to be notified by states, and incorporated into building byelaws and enforced by municipalities; currently seven states (out of 35) have notified it; enforcement mechanisms are being strengthened
ECBC-compliant buildings use less-than-half the energy used by conventional buildings; incremental costs have reduced from 20% in 2007 to less than 5% now

Slide 10 of 15
Large bandwidth in specific energy consumption in all sectors In almost every sector, the most energy-efficient unit is also amongst the most efficient units in the world
0
2
4
6
8
10
12
14
16
550-600 600-650 650-700 700-750 750-800 800-850 850-900 900-950
Thermal Specific Energy consumption, Kcal/kg-clinker
Nu
mb
er o
f U
nit
s
2005-06
0
1
2
3
4
5
6
3.0 - 5.5 5.5 - 8.0 8.0 - 10.5
GCal/ton of paperN
o.
of
Ind
ust
ries
Huge Diversity in Specific Energy Consumption within industrial sectors

Slide 11 of 15
Perform Achieve and Trade
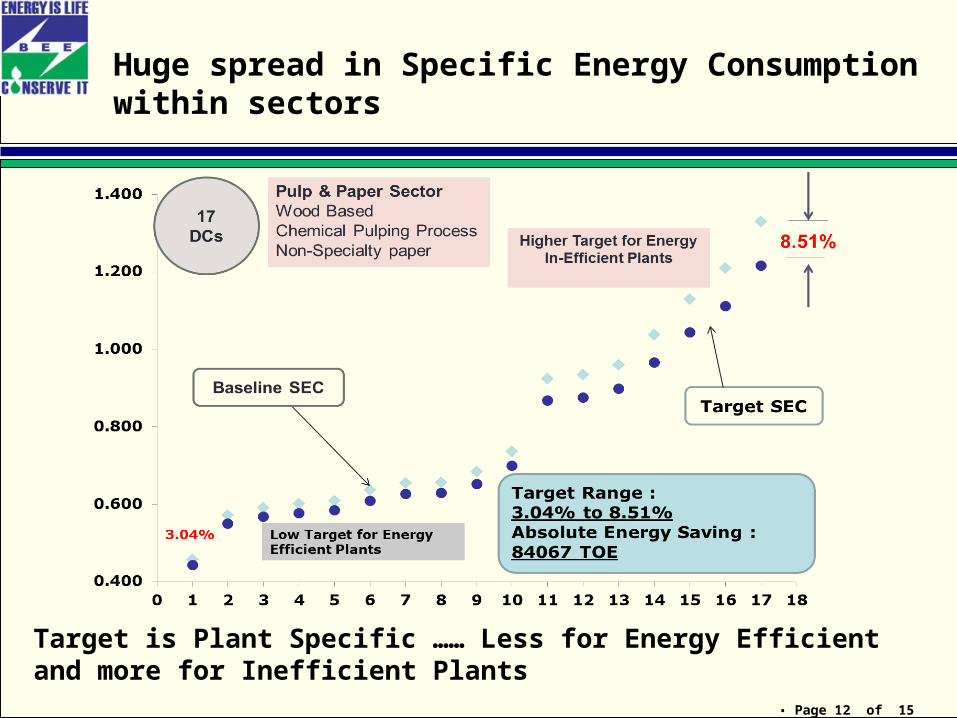
Specific Energy Consumption (SEC) targets mandated for 478 units in 8 energy intensive sectors• The sectors are: Aluminum, Cement, Iron & Steel, Chlor
Alkali, Thermal Power Plants, Fertilizer, Pulp & Paper, and Textiles
• They account for one-third of fossil-fuel consumption• Targets are less (in % terms) for efficient units; more for
less-efficient units• Targets to be accomplished in 2014-15; new cycle with
new targets after that Energy Savings Certificates will be issued for excess
savings; can be traded and used for compliance by other units
Financial penalties for non compliance Baseline conditions have changed; normalization factors
being developed
• Page 12 of 15
Huge spread in Specific Energy Consumption within sectors
Target is Plant Specific …… Less for Energy Efficient and more for Inefficient Plants

• Page 13 of 15
Energy Savings Achieved
11th Plan (2007-12) target has been surpassed, but pattern of savings is very different from that originally estimated
Breakup of targeted avoided capacity during IX plan & Target achieved
Sl.No. SchemesTarget for XI Plan
(in MW)
Achieved during XI Plan(in MW)
1 Standards & Labeling 3000 77662 Energy Conservation Building
Code & Existing Buildings.500 14
3 Bachat Lamp Yojana 4000 3244 SDA Strengthening Programme 1065
5 DC & SMEs 500 26 Agriculture & Municipal DSM. 2000 1
7 EC Awards 1664TOTAL 10000 10836

• Page 14 of 15
Impact of Energy Efficiency on the National Economy
Energy savings: 26.4 million toe (29% of the total energy saved due to EE) during 2000 to 2011.
Avoided generation capacity during 2007-12: 10,836 MW
• Page 15 of 15
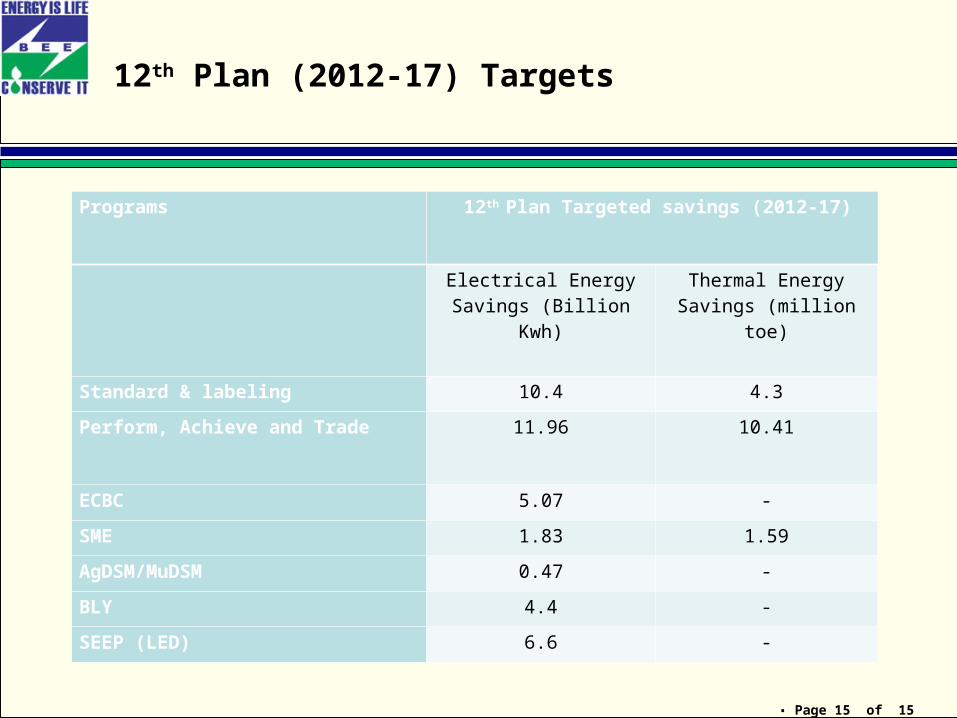
12th Plan (2012-17) Targets
Programs 12th Plan Targeted savings (2012-17)
Electrical Energy Savings (Billion Kwh)
Thermal Energy Savings (million toe)
Standard & labeling 10.4 4.3
Perform, Achieve and Trade 11.96 10.41
ECBC 5.07 -
SME 1.83 1.59
AgDSM/MuDSM 0.47 -
BLY 4.4 -
SEEP (LED) 6.6 -

• Page 16 of 15
Challenges & Lessons
Difficult to predict outcomes of programmes; feedback mechanisms and decision processes to enable constant monitoring and adjustments are essential
Benchmarking – of use patterns and energy performance of technologies - is very country specific; enabling it is an essential first step
Human and institutional capacity to measure, analyse and to integrate into mainstream sectors is limited; this is further confounded by multi-level governance regimes
National and international programmes to strengthen capacity around policy, technological or commercial transactions is important
Enforcement and monitoring are major challenges, and can add significantly to costs; public policies need to rapidly convert technological opportunities into “branded products”; targeted outreach programmes can be very effective
Higher first cost is a barrier; with adequate and credible information, people and organizations can make investments with paybacks of 2-5 years; higher payback periods require incentivization

• Page 17 of 15
Energy Imports are increasing
70% of petroleum/ products are imported Expected to increase to
80% by 2016-17 All additional demand
would be imported
Coal is now being imported ! Current imports are 10% Expected to increase to
30% by 2016-17