slide 6-1 copyright © 2004 pearson education, inc
TRANSCRIPT
Slide 6-1 Copyright © 2004 Pearson Education, Inc.
Slide 6-2 Copyright © 2004 Pearson Education, Inc.
The Standard Deviation as a Ruler and the Normal Model
Chapter 6
Created by Jackie Miller, The Ohio State University
Slide 6-3 Copyright © 2004 Pearson Education, Inc.
The Standard Deviation as a Ruler
• The trick in comparing very different-looking values is to use the standard deviations as our rulers.
• As the most common measure of variation, the standard deviation plays a crucial role in how we look at data.

Slide 6-4 Copyright © 2004 Pearson Education, Inc.
Standardizing
• We compared individual data values to their mean, relative to their standard deviation using the following formula:
• We call the resulting values standardized values, denoted as z. They can also be called z-scores.
y yz
s
Slide 6-5 Copyright © 2004 Pearson Education, Inc.
z-scores
• z-scores allow us to use the standard deviation as a ruler to measure statistical distance from the mean.
• A negative z-score tells us that the data value is below the mean, while a positive z-score tells us that the data value is above the mean.
Slide 6-6 Copyright © 2004 Pearson Education, Inc.
Benefits of Standardizing
• Standardized values have been converted from their original units to the standard statistical unit of standard deviations from the mean.
• Thus, we can compare values that are measured on different scales, with different units, or from different populations.

Slide 6-7 Copyright © 2004 Pearson Education, Inc.
Shifting Data
• Shifting data:– Adding (or subtracting) a constant amount to
each value just adds (or subtracts) the same constant to (from) the mean. This is true for the median and other measures of position too.
– In general, adding a constant to every data value adds the same constant to measures of center and percentiles, but leaves measures of spread unchanged.
Slide 6-8 Copyright © 2004 Pearson Education, Inc.
Shifting Data (cont.)
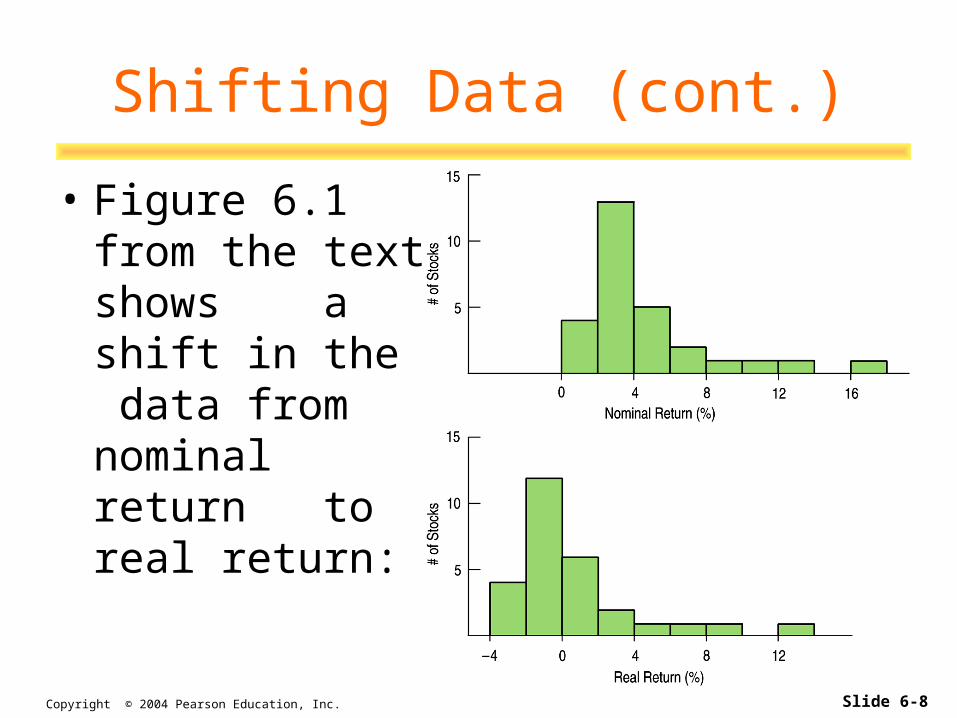
• Figure 6.1 from the text shows a shift in the data from nominal return to real return:

Slide 6-9 Copyright © 2004 Pearson Education, Inc.
Rescaling Data
• Rescaling data:– When we divide or multiply all the data values
by any constant value, both measures of location (e.g., mean and median) and measures of spread (e.g., range, IQR, standard deviation) are divided and multiplied by the same value.
Slide 6-10 Copyright © 2004 Pearson Education, Inc.
Rescaling Data (cont.)
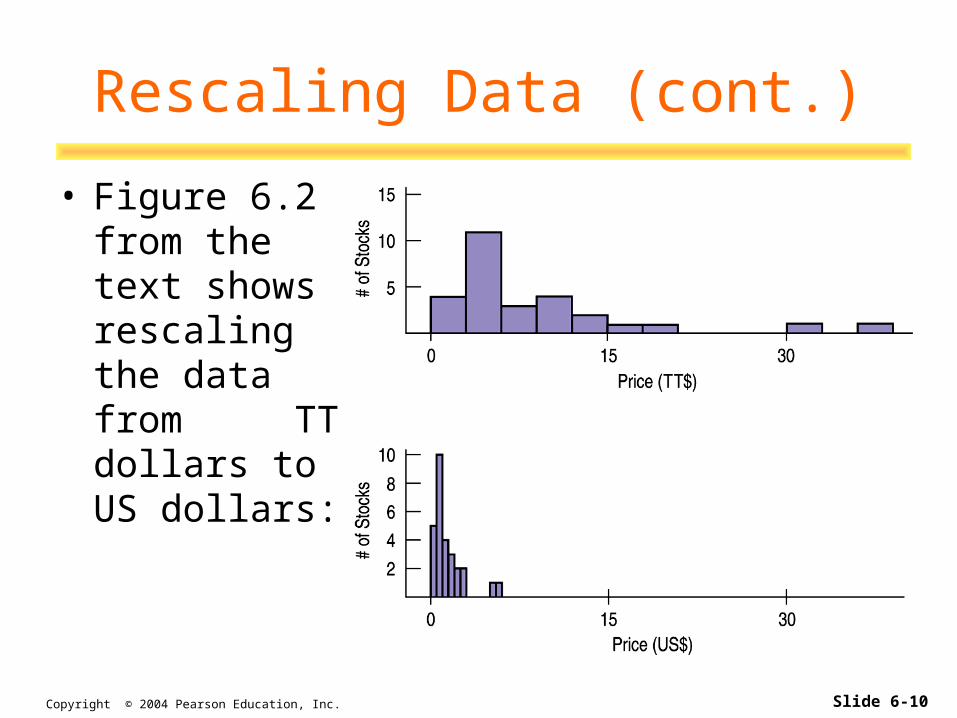
• Figure 6.2 from the text shows rescaling the data from TT dollars to US dollars:

Slide 6-11 Copyright © 2004 Pearson Education, Inc.
What Happens With z-scores?
• Standardizing data into z-scores shifts the data by subtracting the mean and rescales the values by dividing by their standard deviation.
• Note: standardizing does not change the shape of the distribution. However, it does shift the mean to zero and rescale the standard deviation to one.
Slide 6-12 Copyright © 2004 Pearson Education, Inc.
What Do z-scores Tell Us?
• A z-score gives us an indication of how unusual a value is because it tells us how many standard deviations the data value is from the mean.
• Remember that a negative z-score tells us that the data value is below the mean, while a positive z-score tells us that the data value is above the mean.
Slide 6-13 Copyright © 2004 Pearson Education, Inc.
Normal Models
• A model that shows up time and time again in Statistics is the Normal model (You may have heard of “bell-shaped curves.”).
• Normal models are appropriate for distributions whose shapes are unimodal and roughly symmetric.
Slide 6-14 Copyright © 2004 Pearson Education, Inc.
Normal Models (cont.)
• There is a Normal model for every possible combination of mean and standard deviation. – We write N(μ,σ) to represent a Normal model
with a mean of μ and a standard deviation of σ.
• We use Greek letters because this mean and standard deviation do not come from data—they are numbers (called parameters) that specify the model.
Slide 6-15 Copyright © 2004 Pearson Education, Inc.
Normal Models (cont.)
• Summaries of data, like the sample mean and standard deviation, are written with Latin letters. Such summaries of data are called statistics.
• When we standardize Normal data, we still call the standardized value a z-score, and we write y
z

Slide 6-16 Copyright © 2004 Pearson Education, Inc.
Normal Models (cont.)
• Once we have standardized using , we need only the model. – The N(0,1) model is called the standard
Normal model (or the standard Normal distribution).
• Be careful—don’t use a Normal model for just any data set, since standardizing does not change the shape of the distribution.
yz
Slide 6-17 Copyright © 2004 Pearson Education, Inc.
The 68-95-99.7 Rule
• Normal models give us an idea of how extreme a value is by telling us how likely it is to find one that far from the mean.
• We can find these numbers precisely, but until then we will use a simple rule that tells us a lot about the Normal model…
Slide 6-18 Copyright © 2004 Pearson Education, Inc.
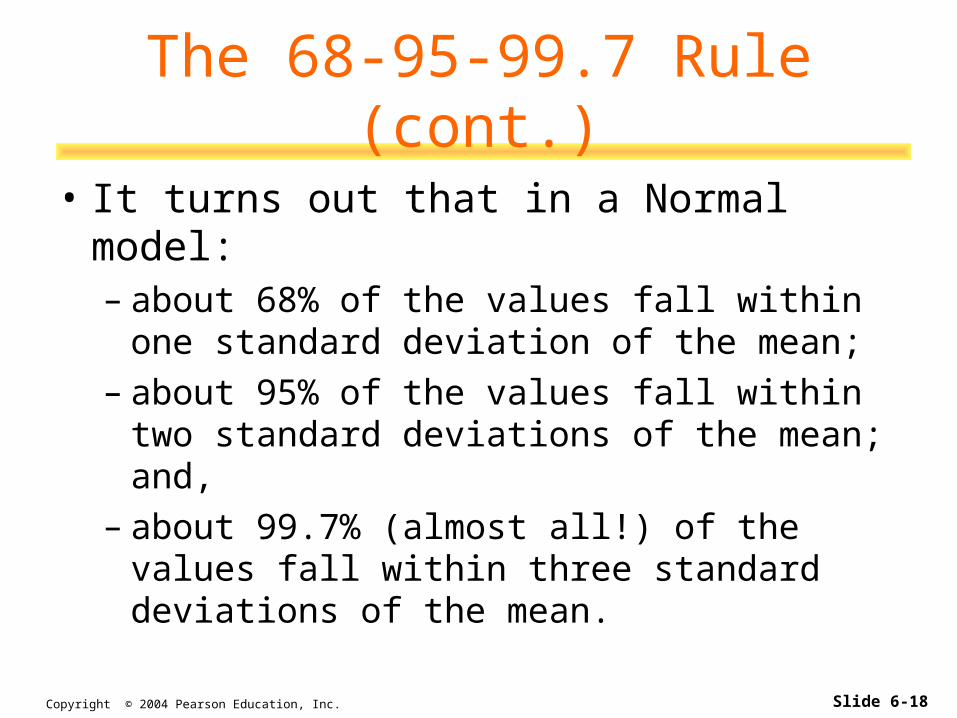
The 68-95-99.7 Rule (cont.)
• It turns out that in a Normal model:– about 68% of the values fall within one
standard deviation of the mean;– about 95% of the values fall within two
standard deviations of the mean; and,– about 99.7% (almost all!) of the values fall
within three standard deviations of the mean.
Slide 6-19 Copyright © 2004 Pearson Education, Inc.
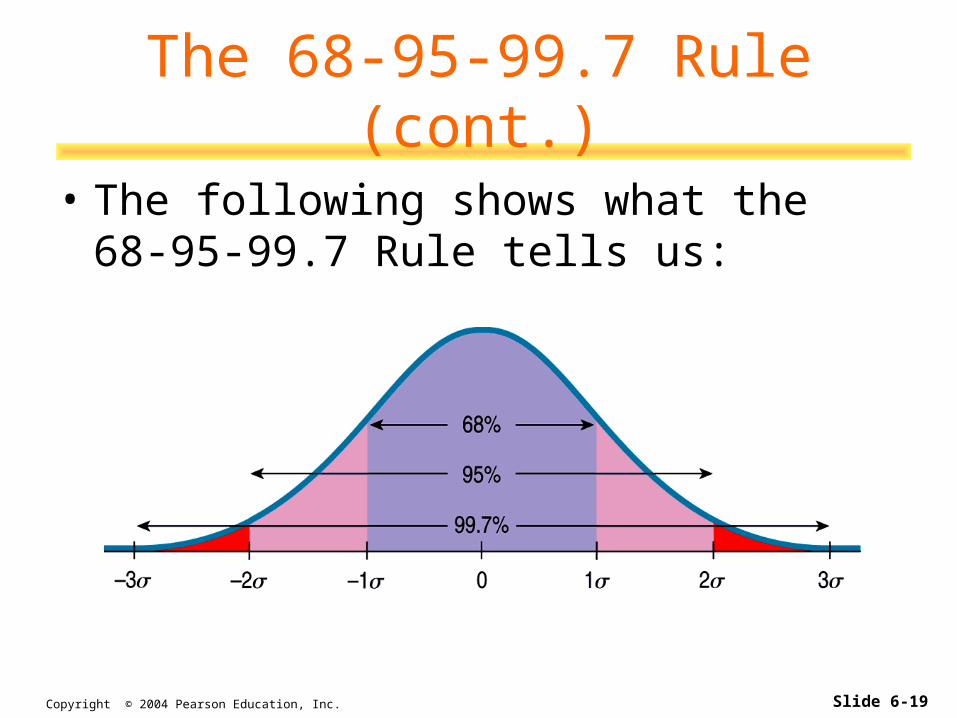
The 68-95-99.7 Rule (cont.)
• The following shows what the 68-95-99.7 Rule tells us:
Slide 6-20 Copyright © 2004 Pearson Education, Inc.
Finding Normal Percentiles by Hand
• When a data value doesn’t fall exactly 1, 2, or 3 standard deviations from the mean, we can look it up in a table of Normal percentiles.
• Table Z in Appendix E provides us with normal percentiles, but many calculators and statistics computer packages provide these as well.

Slide 6-21 Copyright © 2004 Pearson Education, Inc.
Normal Percentiles by Hand (cont.)
• Table Z is the standard Normal table. We have to convert our data to z-scores before using the table.
• Figure 6.4 shows us how to find the area to the right of 1.8 above the mean:
Slide 6-22 Copyright © 2004 Pearson Education, Inc.
Normal Percentiles Using Technology
• Many calculators and statistics programs have the ability to find normal percentiles for us.
• The ActivStats Multimedia Assistant offers two methods for finding normal percentiles:
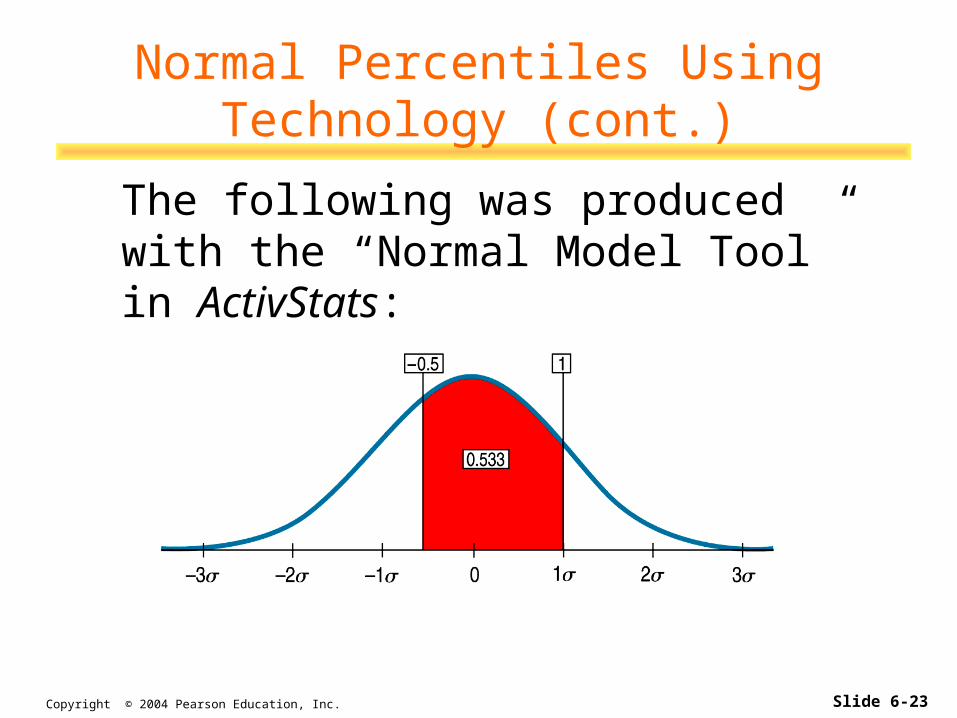
1. The “Normal Model Tool” makes it easy to see how areas under parts of the Normal model correspond to particular cut points.
2. There is also a Normal table in which the picture of the normal model is interactive.
Slide 6-23 Copyright © 2004 Pearson Education, Inc.
Normal Percentiles Using Technology (cont.)
The following was produced with the “Normal Model Tool” in ActivStats:

Slide 6-24 Copyright © 2004 Pearson Education, Inc.
Are You Normal? How Can You Tell?
• When you actually have your own data, you must check to see whether a Normal model is reasonable.
• Looking at a histogram of the data is a good way to check that the underlying distribution is roughly unimodal and symmetric.
Slide 6-25 Copyright © 2004 Pearson Education, Inc.
Are You Normal? (cont.)
• A more specialized graphical display that can help you decide whether a Normal model is appropriate is the Normal probability plot.
• If the distribution of the data is roughly Normal, the Normal probability plot approximates a diagonal straight line. Deviations from a straight line indicate that the distribution is not Normal.
Slide 6-26 Copyright © 2004 Pearson Education, Inc.
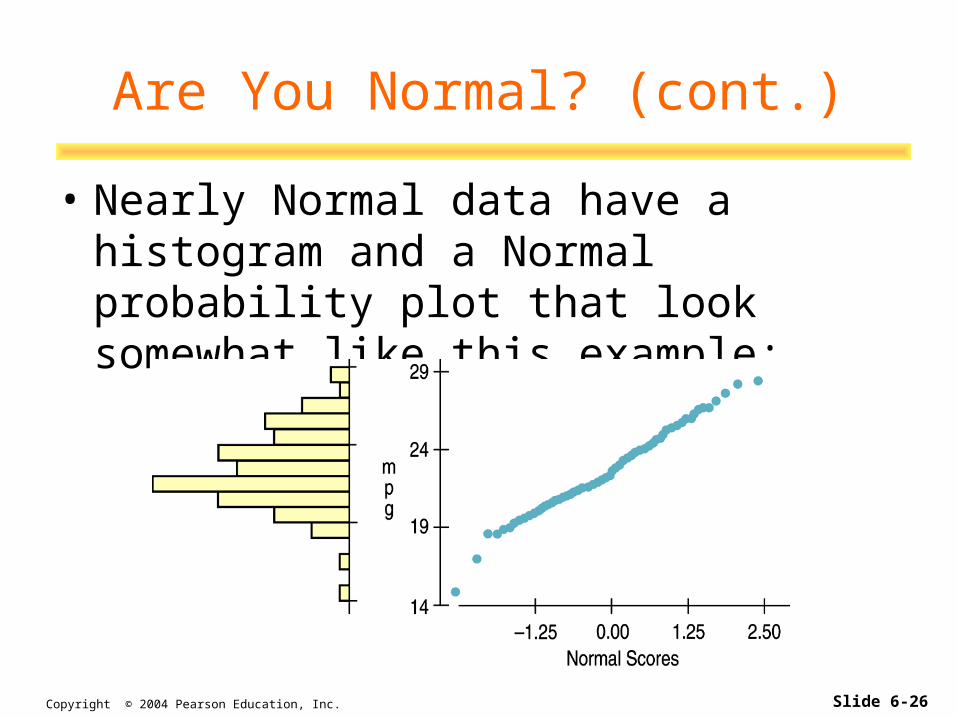
Are You Normal? (cont.)
• Nearly Normal data have a histogram and a Normal probability plot that look somewhat like this example:
Slide 6-27 Copyright © 2004 Pearson Education, Inc.
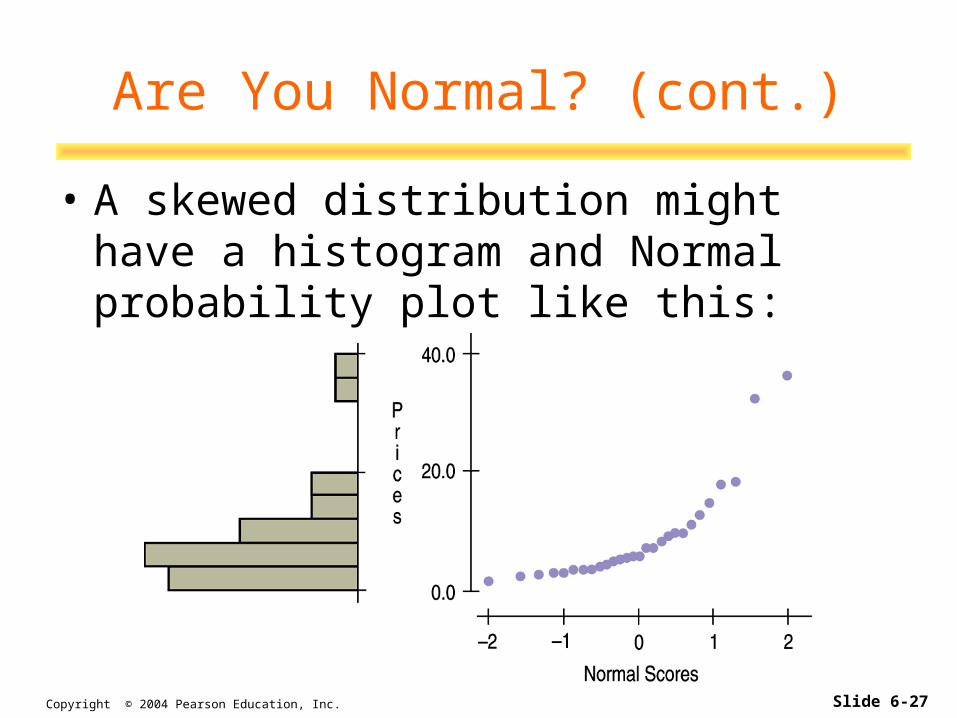
Are You Normal? (cont.)
• A skewed distribution might have a histogram and Normal probability plot like this:
Slide 6-28 Copyright © 2004 Pearson Education, Inc.
What Can Go Wrong?
• Don’t use Normal models when the distribution is not unimodal and symmetric.
• Don’t use the mean and standard deviation when outliers are present—the mean and standard deviation can both be distorted by outliers.
Slide 6-29 Copyright © 2004 Pearson Education, Inc.
Key Concepts
• We now know how to standardize data values into z-scores.
• We know how to recognize when a Normal model is appropriate.
• We can invoke the 68-95-99.7 Rule when we have approximately Normal data.
• We can find Normal percentiles by hand or with technology.