slides at: greg crabtree · pdf fileslides at: greg crabtree [email protected]...
TRANSCRIPT

www.SimpleNumbers.me
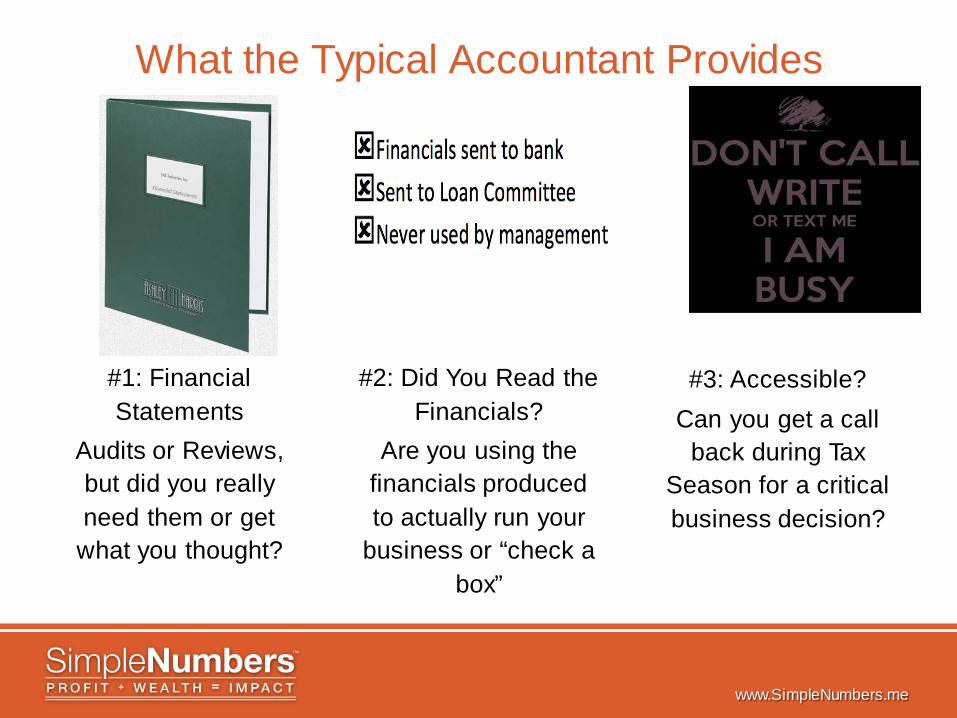
What the Typical Accountant Provides
#1: Financial Statements
Audits or Reviews, but did you really need them or get
what you thought?
#2: Did You Read the Financials?
Are you using the financials produced to actually run your
business or “check a box”
#3: Accessible? Can you get a call
back during Tax Season for a critical business decision?
www.SimpleNumbers.me
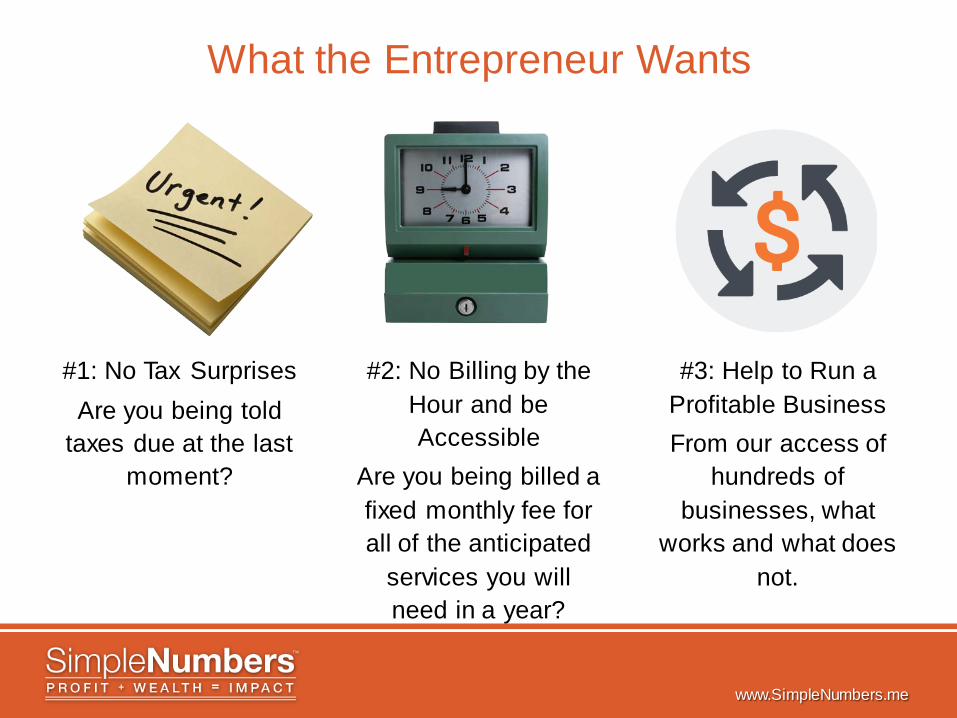
What the Entrepreneur Wants
#1: No Tax Surprises Are you being told
taxes due at the last moment?
#2: No Billing by the Hour and be Accessible
Are you being billed a fixed monthly fee for all of the anticipated
services you will need in a year?
#3: Help to Run a Profitable Business From our access of
hundreds of businesses, what
works and what does not.
www.SimpleNumbers.me
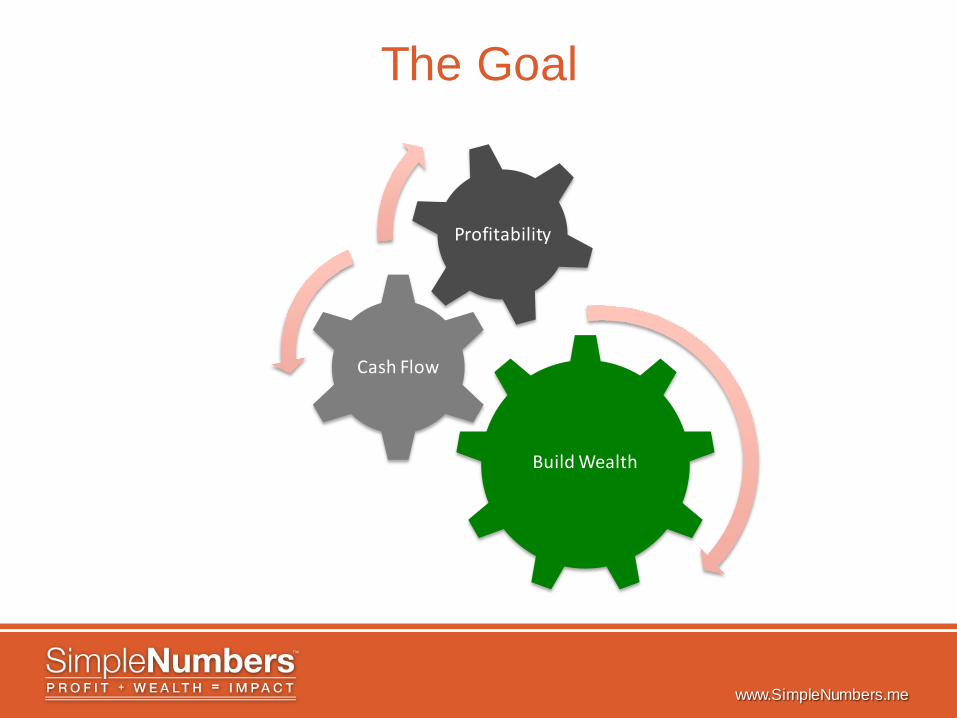
The Goal
Build Wealth
Cash Flow
Profitability
www.SimpleNumbers.me
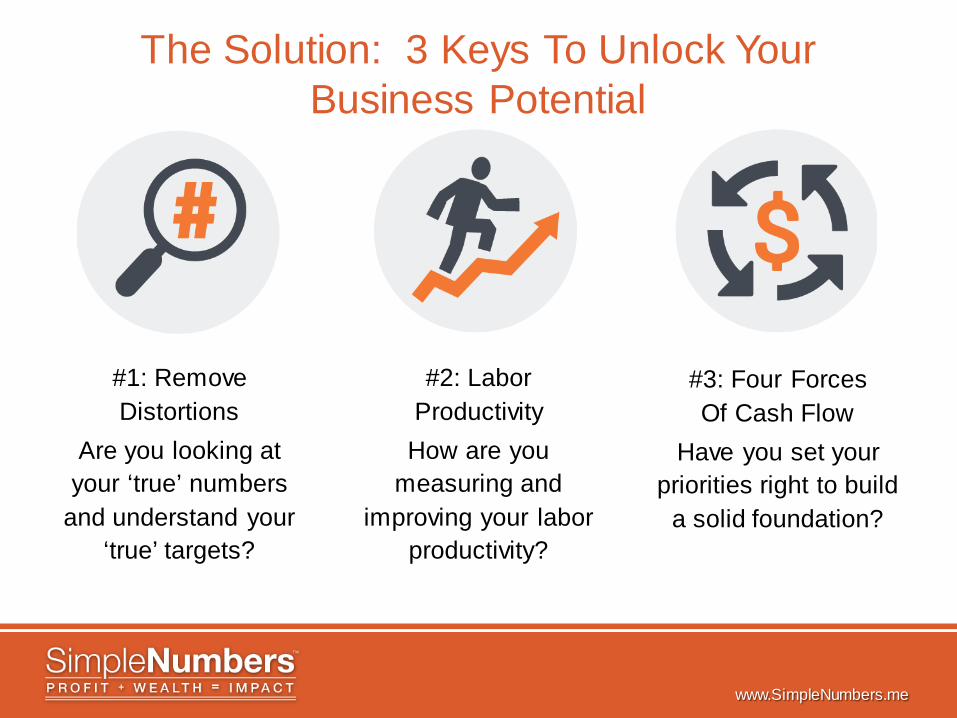
The Solution: 3 Keys To Unlock Your Business Potential
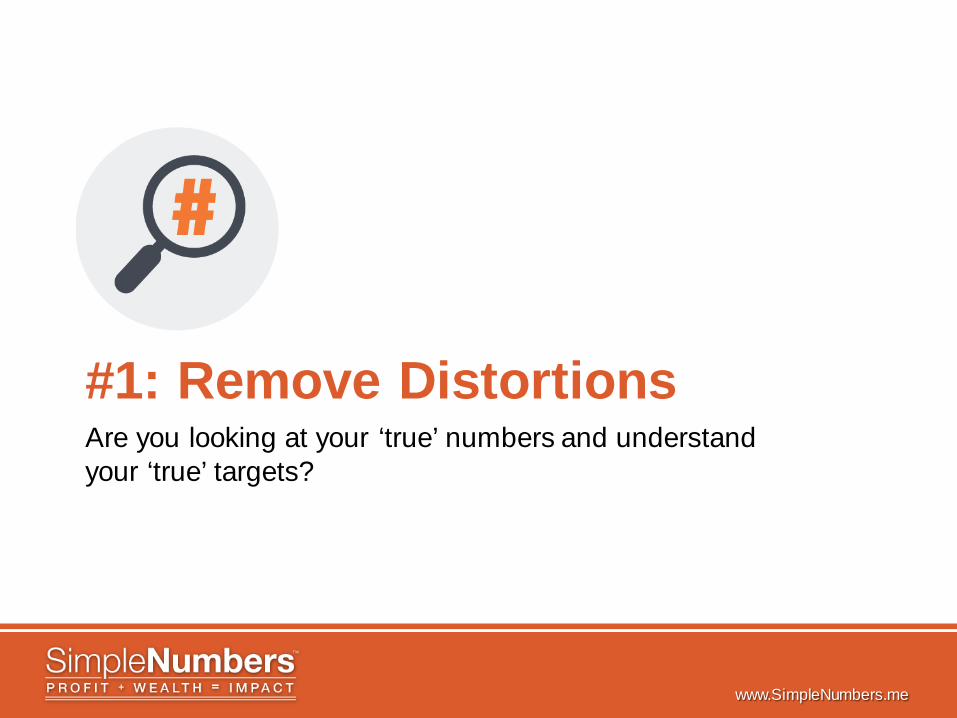
#1: Remove Distortions
Are you looking at your ‘true’ numbers
and understand your ‘true’ targets?
#2: Labor Productivity
How are you measuring and
improving your labor productivity?
#3: Four Forces Of Cash Flow
Have you set your priorities right to build
a solid foundation?
www.SimpleNumbers.me
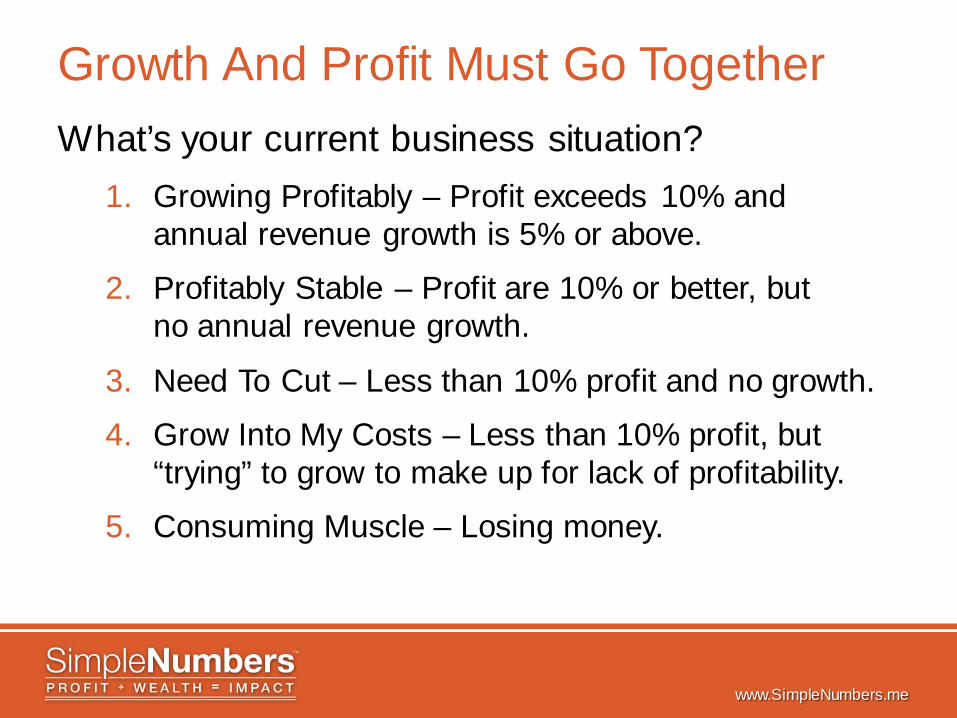
Growth And Profit Must Go Together What’s your current business situation?
1. Growing Profitably – Profit exceeds 10% and annual revenue growth is 5% or above.
2. Profitably Stable – Profit are 10% or better, but no annual revenue growth.
3. Need To Cut – Less than 10% profit and no growth.
4. Grow Into My Costs – Less than 10% profit, but “trying” to grow to make up for lack of profitability.
5. Consuming Muscle – Losing money.
www.SimpleNumbers.me
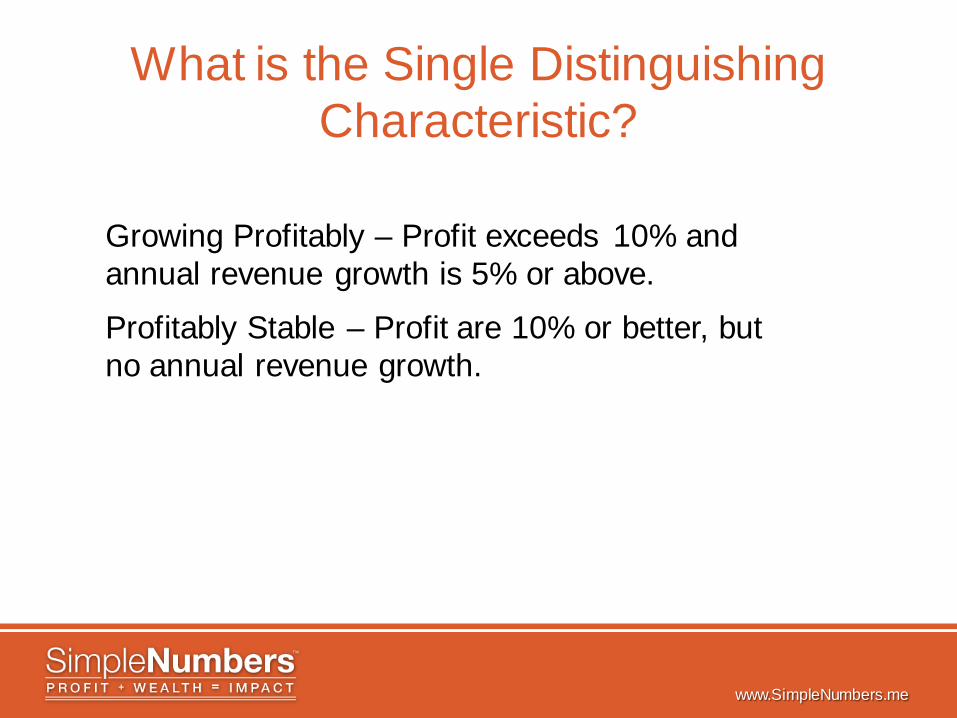
What is the Single Distinguishing Characteristic?
Growing Profitably – Profit exceeds 10% and annual revenue growth is 5% or above.
Profitably Stable – Profit are 10% or better, but no annual revenue growth.
www.SimpleNumbers.me
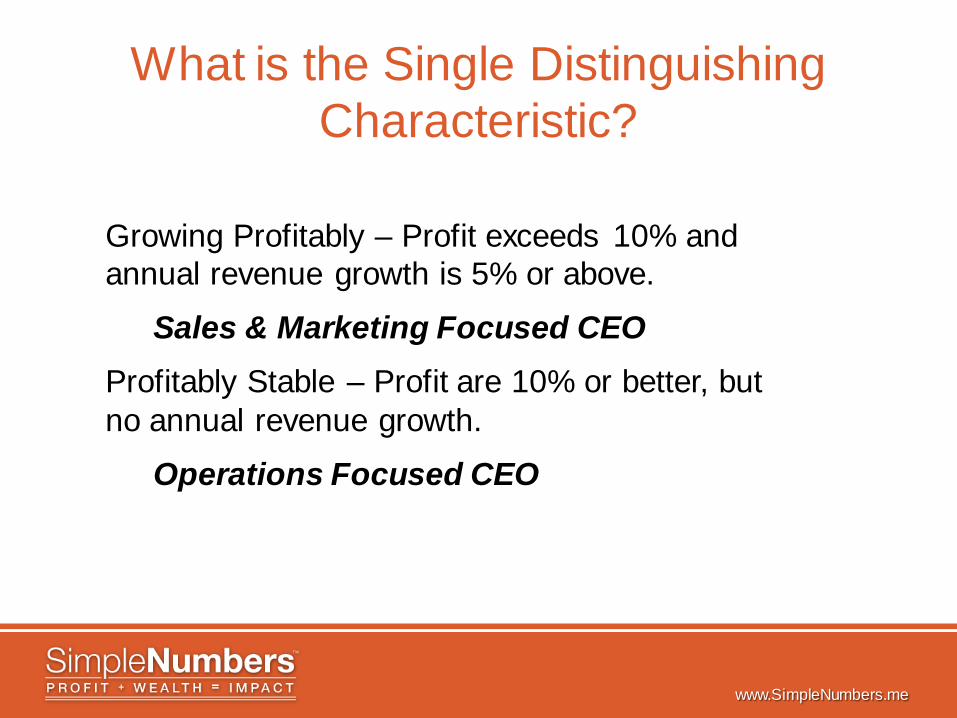
What is the Single Distinguishing Characteristic?
Growing Profitably – Profit exceeds 10% and annual revenue growth is 5% or above.
Sales & Marketing Focused CEO Profitably Stable – Profit are 10% or better, but no annual revenue growth.
Operations Focused CEO
www.SimpleNumbers.me
#1: Remove Distortions Are you looking at your ‘true’ numbers and understand your ‘true’ targets?
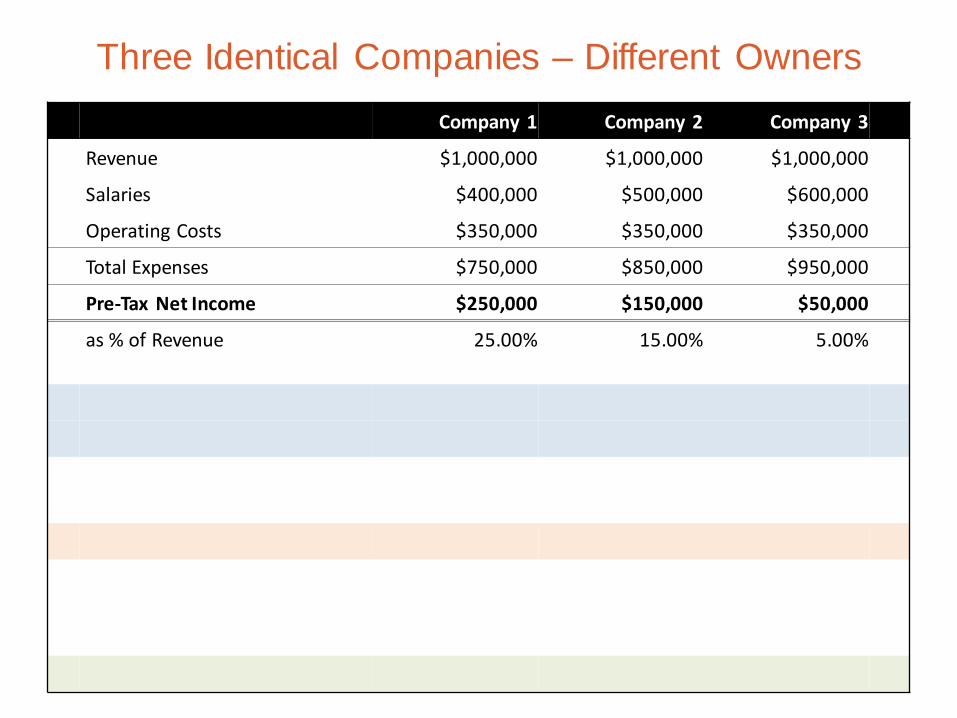
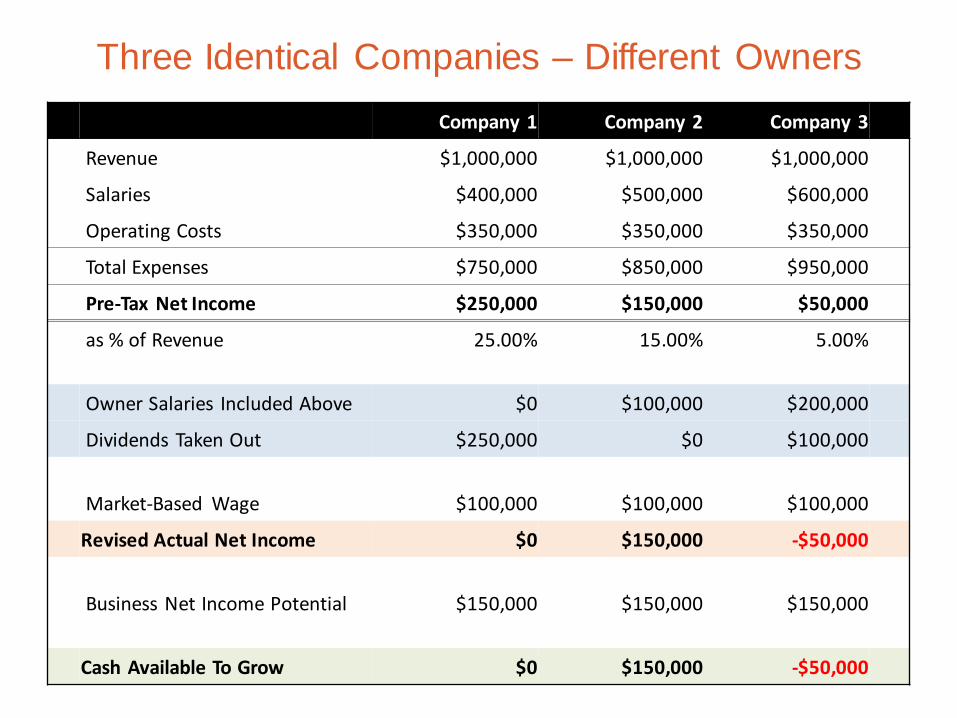
Three Identical Companies – Different Owners Company 1 Company 2 Company 3
Revenue $1,000,000 $1,000,000 $1,000,000
Salaries $400,000 $500,000 $600,000
Operating Costs $350,000 $350,000 $350,000
Total Expenses $750,000 $850,000 $950,000
Pre-Tax Net Income $250,000 $150,000 $50,000
as % of Revenue 25.00% 15.00% 5.00%
Owner Salaries Included Above $0 $100,000 $200,000
Dividends Taken Out $250,000 $0 $100,000
Market-Based Wage $100,000 $100,000 $100,000
Revised Actual Net Income $0 $150,000 -$50,000
Business Net Income Potential $150,000 $150,000 $150,000
Cash Available To Grow $0 $150,000 -$50,000
www.SimpleNumbers.me
Common Distortions Of Owner Comp
Trying to save taxes instead of business clarity
Multi-owner business where shareholders all make the same wage
“Sweat equity” in a startup No guaranteed payments in an LLC
“Leftover’s are mine to consume” mindset
Not paying a market-based wage (too high or low): “As the owner, pick any job you want, but the market determines your wage.”
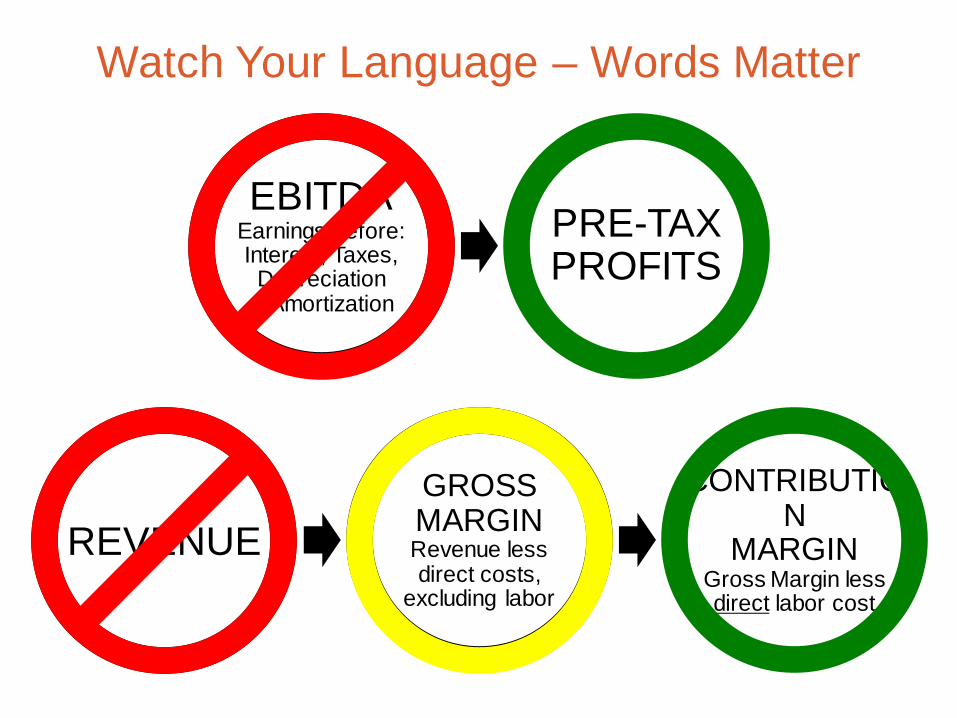
REVENUE
Watch Your Language – Words Matter
EBITDA Earnings before: Interest, Taxes,
Depreciation & Amortization
PRE-TAX PROFITS
GROSS MARGIN Revenue less direct costs,
excluding labor
CONTRIBUTION
MARGIN Gross Margin less direct labor cost
Busin
ess E
ngin
e Bu
sines
s Cha
ssis
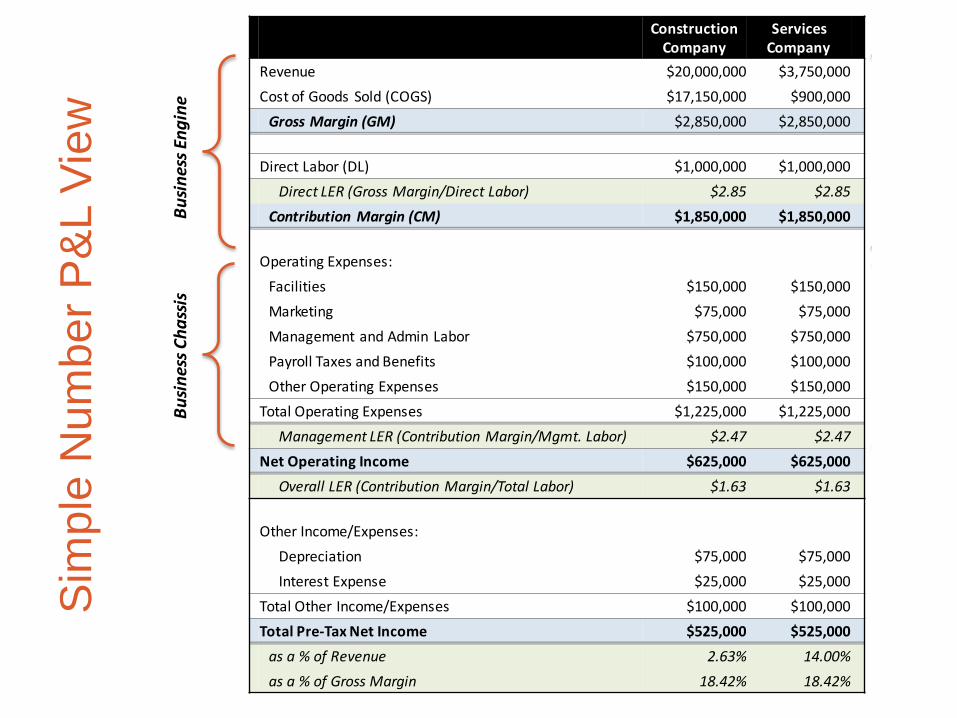
Construction Company
Services Company
Revenue $20,000,000 $3,750,000 Cost of Goods Sold (COGS) $17,150,000 $900,000 Gross Margin (GM) $2,850,000 $2,850,000 Direct Labor (DL) $1,000,000 $1,000,000 Direct LER (Gross Margin/Direct Labor) $2.85 $2.85 Contribution Margin (CM) $1,850,000 $1,850,000
Operating Expenses: Facilities $150,000 $150,000 Marketing $75,000 $75,000 Management and Admin Labor $750,000 $750,000 Payroll Taxes and Benefits $100,000 $100,000 Other Operating Expenses $150,000 $150,000 Total Operating Expenses $1,225,000 $1,225,000 Management LER (Contribution Margin/Mgmt. Labor) $2.47 $2.47 Net Operating Income $625,000 $625,000 Overall LER (Contribution Margin/Total Labor) $1.63 $1.63
Other Income/Expenses: Depreciation $75,000 $75,000 Interest Expense $25,000 $25,000 Total Other Income/Expenses $100,000 $100,000 Total Pre-Tax Net Income $525,000 $525,000 as a % of Revenue 2.63% 14.00% as a % of Gross Margin 18.42% 18.42%
Sim
ple
Num
ber P
&L
View
www.SimpleNumbers.me
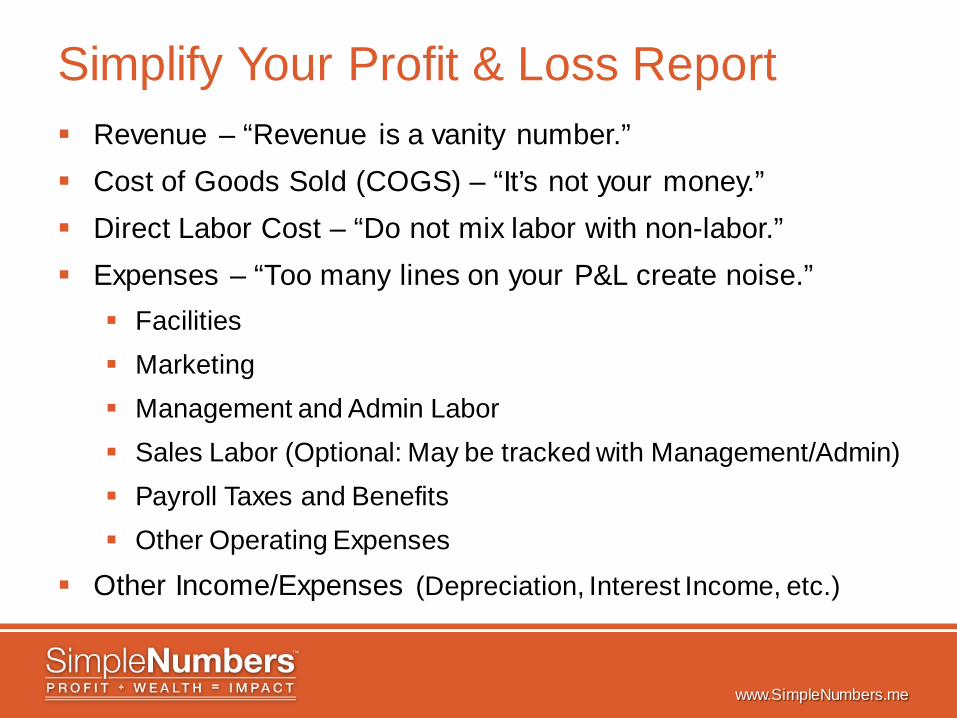
Simplify Your Profit & Loss Report Revenue – “Revenue is a vanity number.” Cost of Goods Sold (COGS) – “It’s not your money.” Direct Labor Cost – “Do not mix labor with non-labor.” Expenses – “Too many lines on your P&L create noise.” Facilities Marketing Management and Admin Labor Sales Labor (Optional: May be tracked with Management/Admin) Payroll Taxes and Benefits Other Operating Expenses
Other Income/Expenses (Depreciation, Interest Income, etc.)
www.SimpleNumbers.me
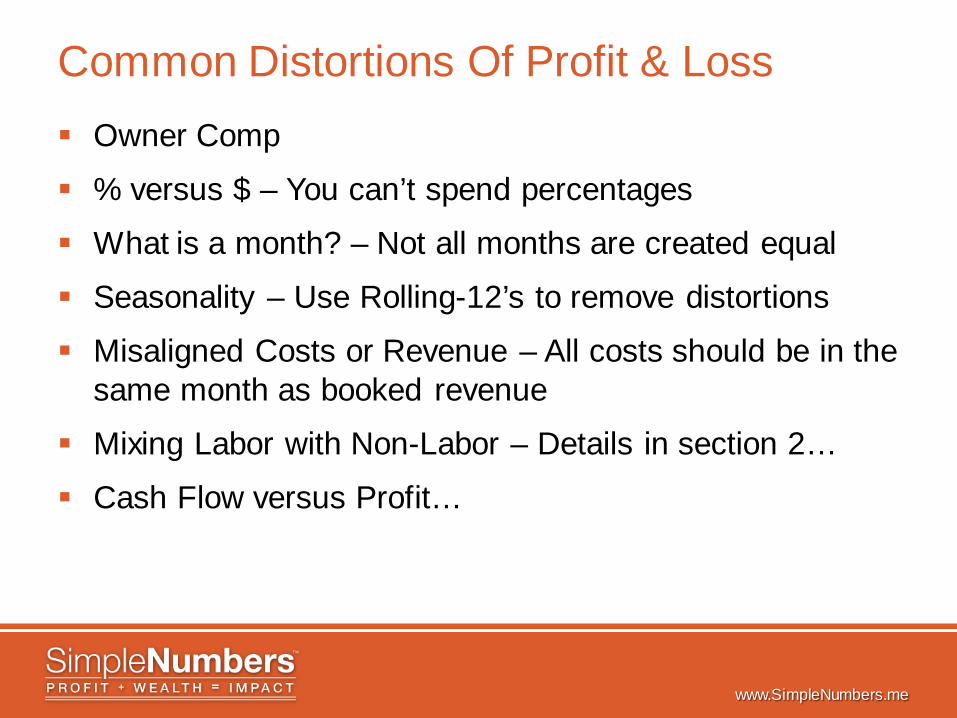
Common Distortions Of Profit & Loss Owner Comp
% versus $ – You can’t spend percentages
What is a month? – Not all months are created equal
Seasonality – Use Rolling-12’s to remove distortions
Misaligned Costs or Revenue – All costs should be in the same month as booked revenue
Mixing Labor with Non-Labor – Details in section 2…
Cash Flow versus Profit…
www.SimpleNumbers.me
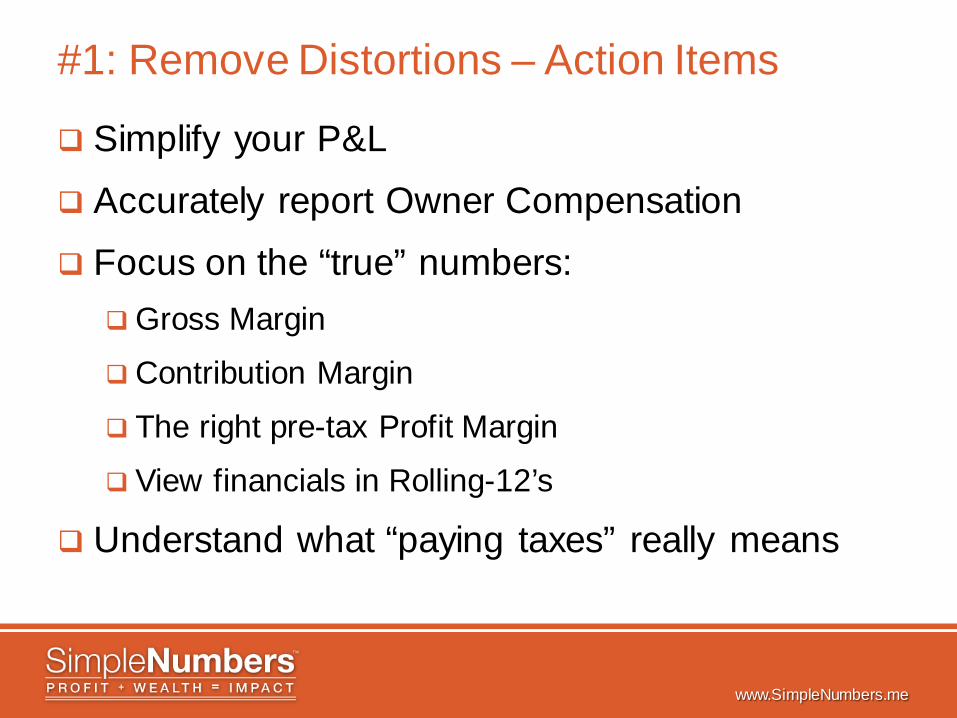
#1: Remove Distortions – Action Items
Simplify your P&L
Accurately report Owner Compensation
Focus on the “true” numbers: Gross Margin
Contribution Margin
The right pre-tax Profit Margin
View financials in Rolling-12’s
Understand what “paying taxes” really means
www.SimpleNumbers.me
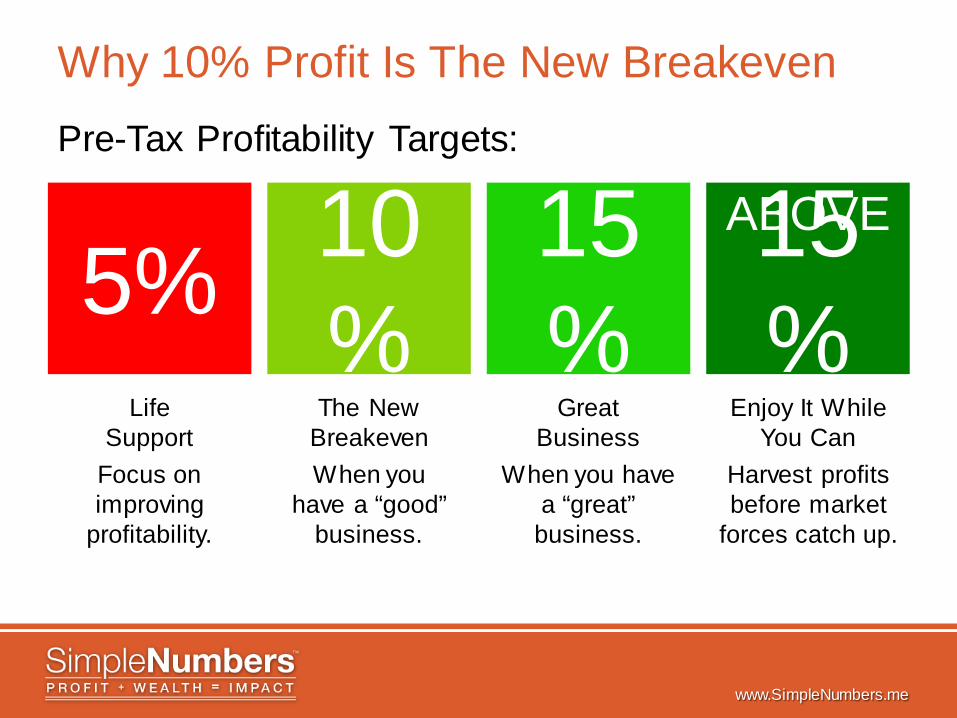
Why 10% Profit Is The New Breakeven Pre-Tax Profitability Targets:
Life Support
Focus on improving
profitability.
The New Breakeven When you
have a “good” business.
Great Business
When you have a “great”
business.
Enjoy It While You Can
Harvest profits before market
forces catch up.
5% 10%
15%
15%
ABOVE
www.SimpleNumbers.me
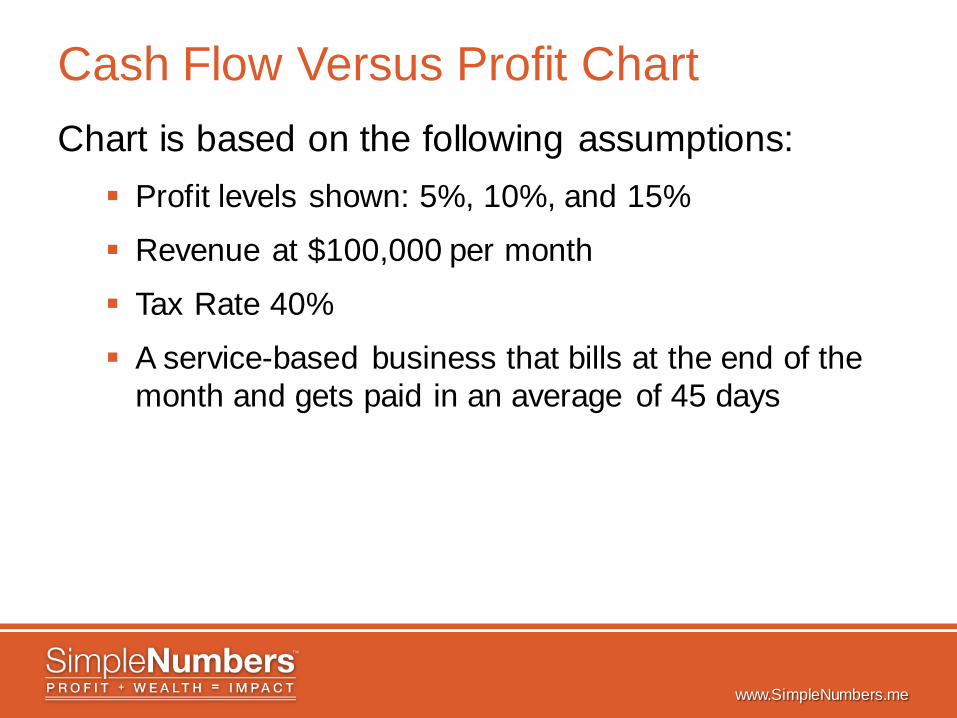
Cash Flow Versus Profit Chart Chart is based on the following assumptions: Profit levels shown: 5%, 10%, and 15%
Revenue at $100,000 per month
Tax Rate 40%
A service-based business that bills at the end of the month and gets paid in an average of 45 days
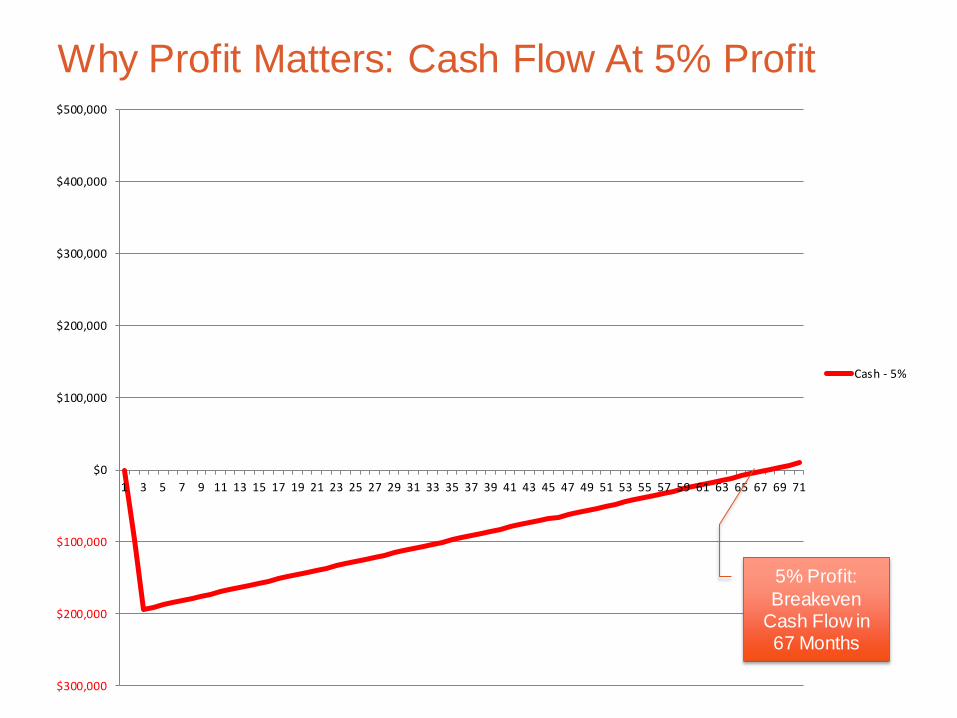
Why Profit Matters: Cash Flow At 5% Profit
$300,000
$200,000
$100,000
$0
$100,000
$200,000
$300,000
$400,000
$500,000
1 3 5 7 9 11 13 15 17 19 21 23 25 27 29 31 33 35 37 39 41 43 45 47 49 51 53 55 57 59 61 63 65 67 69 71
Cash - 5%
Cash - 10%
Cash - 15%
5% Profit: Breakeven
Cash Flow in 67 Months
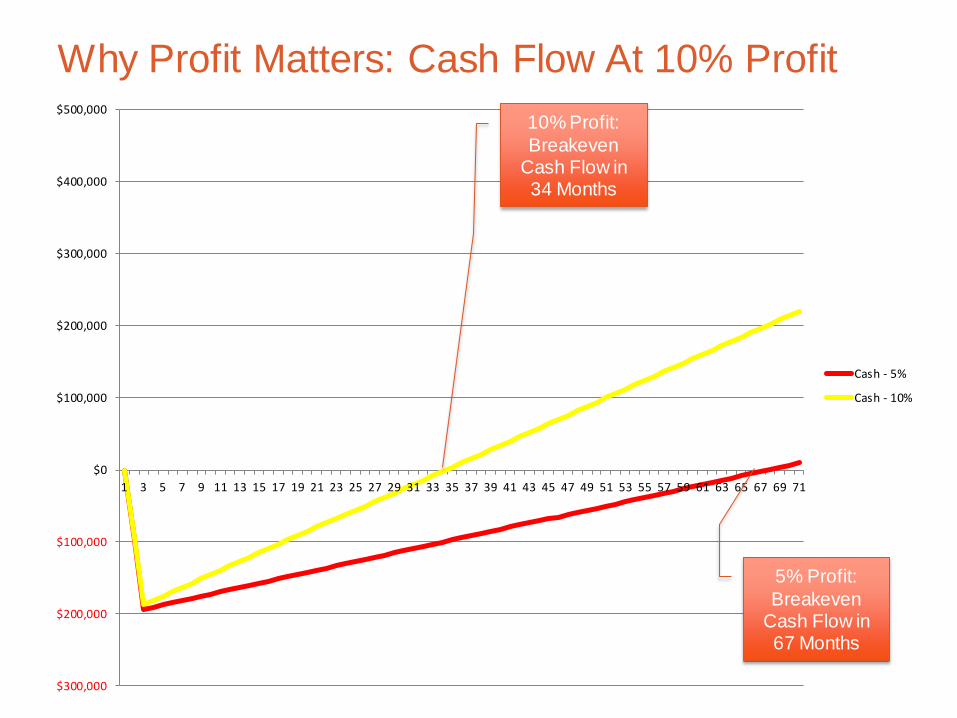
Why Profit Matters: Cash Flow At 10% Profit
$300,000
$200,000
$100,000
$0
$100,000
$200,000
$300,000
$400,000
$500,000
1 3 5 7 9 11 13 15 17 19 21 23 25 27 29 31 33 35 37 39 41 43 45 47 49 51 53 55 57 59 61 63 65 67 69 71
Cash - 5%
Cash - 10%
Cash - 15%
5% Profit: Breakeven
Cash Flow in 67 Months
10% Profit: Breakeven
Cash Flow in 34 Months
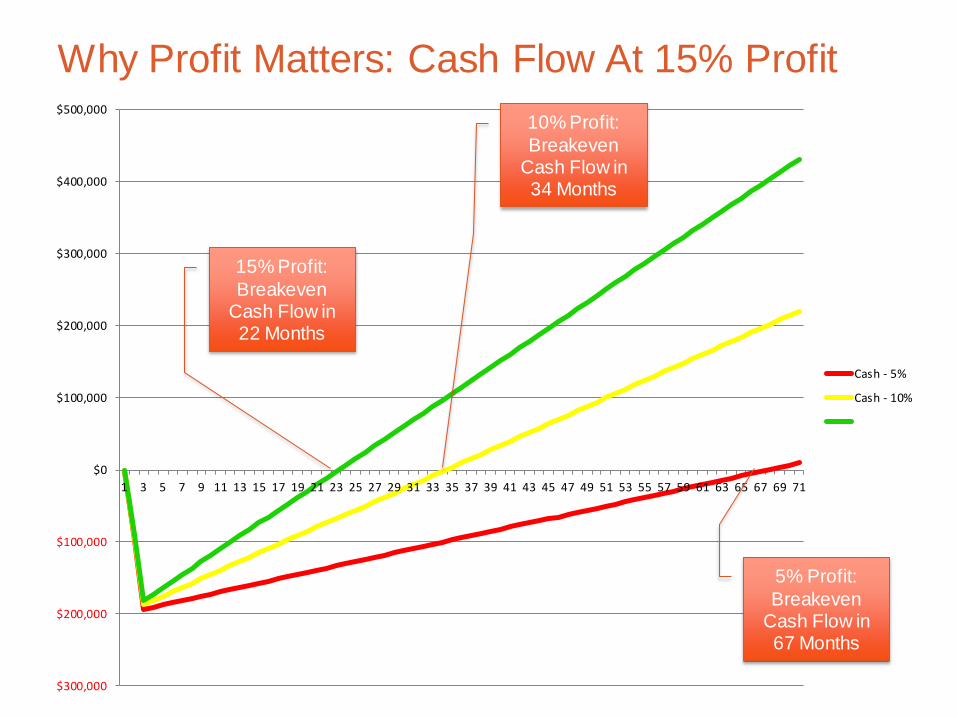
Why Profit Matters: Cash Flow At 15% Profit
$300,000
$200,000
$100,000
$0
$100,000
$200,000
$300,000
$400,000
$500,000
1 3 5 7 9 11 13 15 17 19 21 23 25 27 29 31 33 35 37 39 41 43 45 47 49 51 53 55 57 59 61 63 65 67 69 71
Cash - 5%
Cash - 10%
Cash - 15%
5% Profit: Breakeven
Cash Flow in 67 Months
10% Profit: Breakeven
Cash Flow in 34 Months
15% Profit: Breakeven
Cash Flow in 22 Months
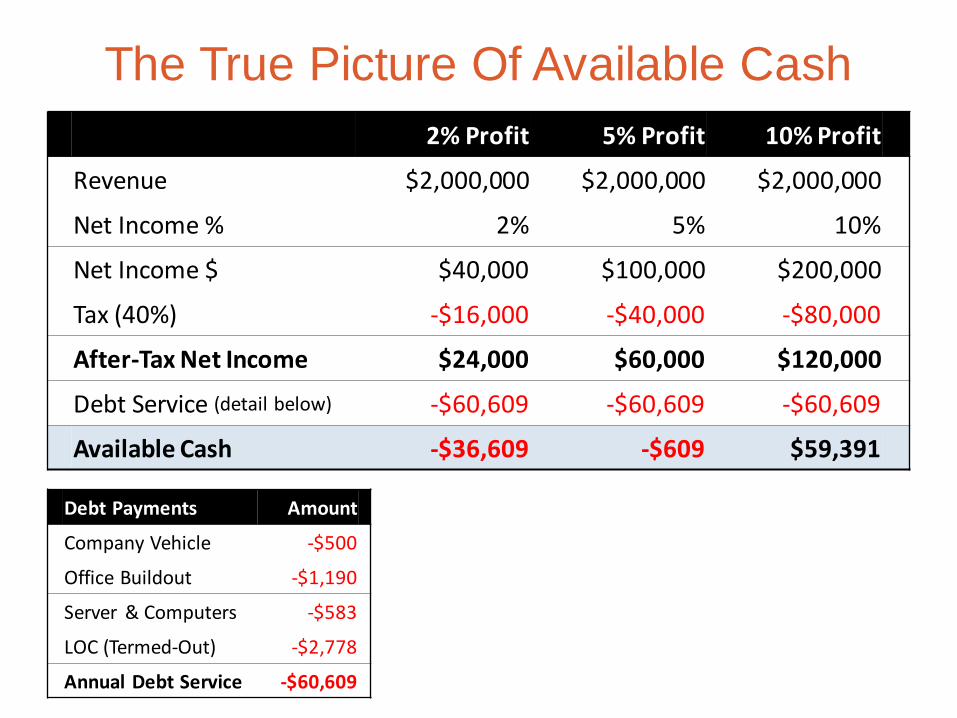
The True Picture Of Available Cash 2% Profit 5% Profit 10% Profit
Revenue $2,000,000 $2,000,000 $2,000,000
Net Income % 2% 5% 10%
Net Income $ $40,000 $100,000 $200,000
Tax (40%) -$16,000 -$40,000 -$80,000
After-Tax Net Income $24,000 $60,000 $120,000
Debt Service (detail below) -$60,609 -$60,609 -$60,609
Available Cash -$36,609 -$609 $59,391
Debt Payments Amount
Company Vehicle -$500
Office Buildout -$1,190
Server & Computers -$583
LOC (Termed-Out) -$2,778
Annual Debt Service -$60,609
www.SimpleNumbers.me
Getting To 15% Pre-Tax Profit Know your current capacity
Being profitable and maintaining market share can be better than growth
Remember that 10% is the new breakeven Use the “baffle” concept to grow to 15% profit
before increasing labor cost
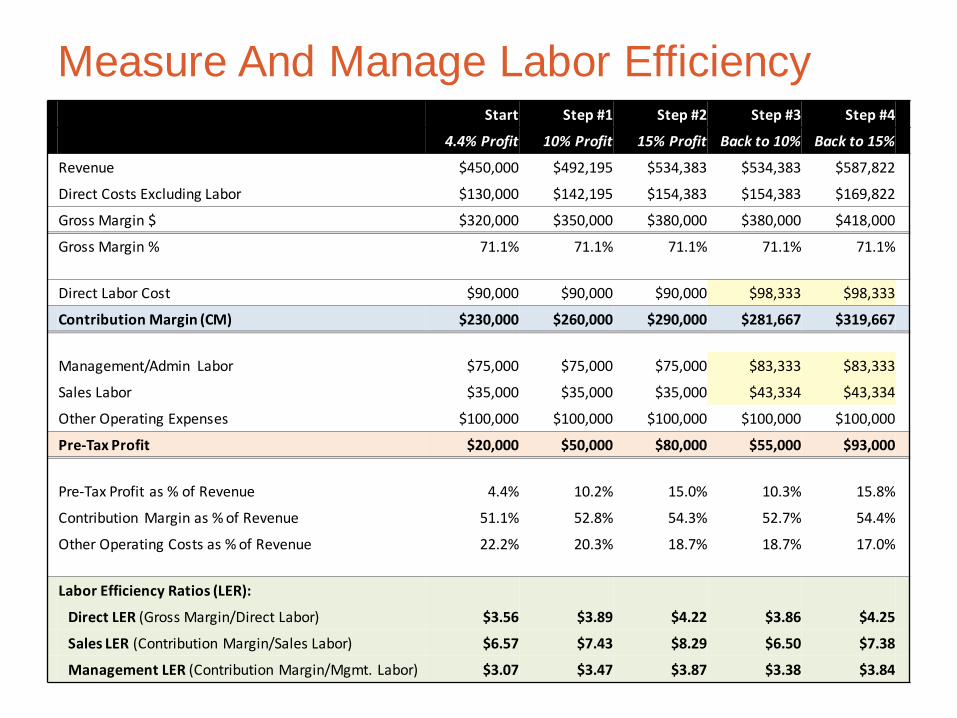
Start Step #1 Step #2 Step #3 Step #4
4.4% Profit 10% Profit 15% Profit Back to 10% Back to 15%
Revenue $450,000 $492,195 $534,383 $534,383 $587,822
Direct Costs Excluding Labor $130,000 $142,195 $154,383 $154,383 $169,822
Gross Margin $ $320,000 $350,000 $380,000 $380,000 $418,000
Gross Margin % 71.1% 71.1% 71.1% 71.1% 71.1% Direct Labor Cost $90,000 $90,000 $90,000 $98,333 $98,333
Contribution Margin (CM) $230,000 $260,000 $290,000 $281,667 $319,667 Management/Admin Labor $75,000 $75,000 $75,000 $83,333 $83,333
Sales Labor $35,000 $35,000 $35,000 $43,334 $43,334
Other Operating Expenses $100,000 $100,000 $100,000 $100,000 $100,000
Pre-Tax Profit $20,000 $50,000 $80,000 $55,000 $93,000 Pre-Tax Profit as % of Revenue 4.4% 10.2% 15.0% 10.3% 15.8%
Contribution Margin as % of Revenue 51.1% 52.8% 54.3% 52.7% 54.4%
Other Operating Costs as % of Revenue 22.2% 20.3% 18.7% 18.7% 17.0% Labor Efficiency Ratios (LER):
Direct LER (Gross Margin/Direct Labor) $3.56 $3.89 $4.22 $3.86 $4.25
Sales LER (Contribution Margin/Sales Labor) $6.57 $7.43 $8.29 $6.50 $7.38
Management LER (Contribution Margin/Mgmt. Labor) $3.07 $3.47 $3.87 $3.38 $3.84
Measure And Manage Labor Efficiency
www.SimpleNumbers.me
#2: Labor Productivity How are you measuring and improving your labor productivity?
www.SimpleNumbers.me
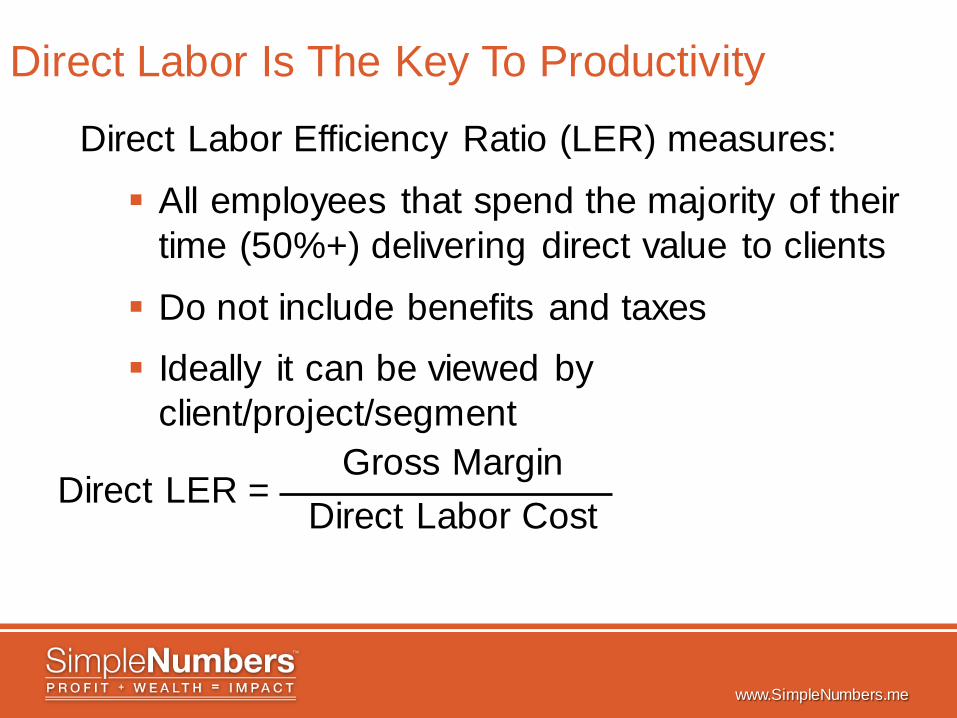
Direct Labor Is The Key To Productivity
Direct Labor Efficiency Ratio (LER) measures:
All employees that spend the majority of their time (50%+) delivering direct value to clients
Do not include benefits and taxes Ideally it can be viewed by
client/project/segment Gross Margin
Direct Labor Cost
Direct LER =
www.SimpleNumbers.me
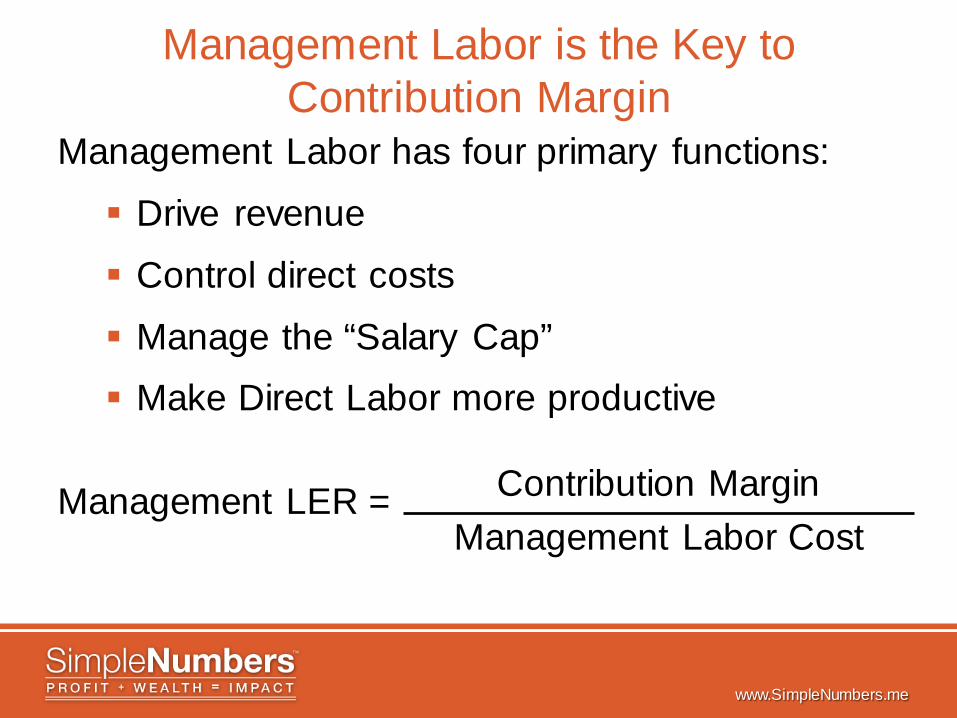
Management Labor is the Key to Contribution Margin
Management Labor has four primary functions:
Drive revenue
Control direct costs
Manage the “Salary Cap” Make Direct Labor more productive
Contribution Margin Management Labor Cost
Management LER =
www.SimpleNumbers.me
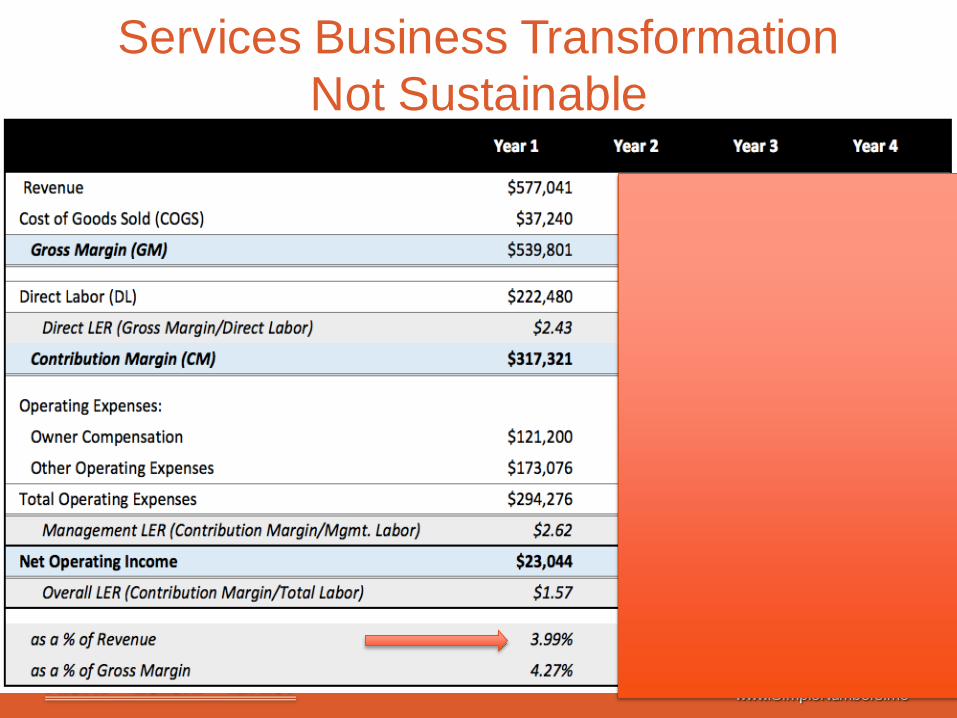
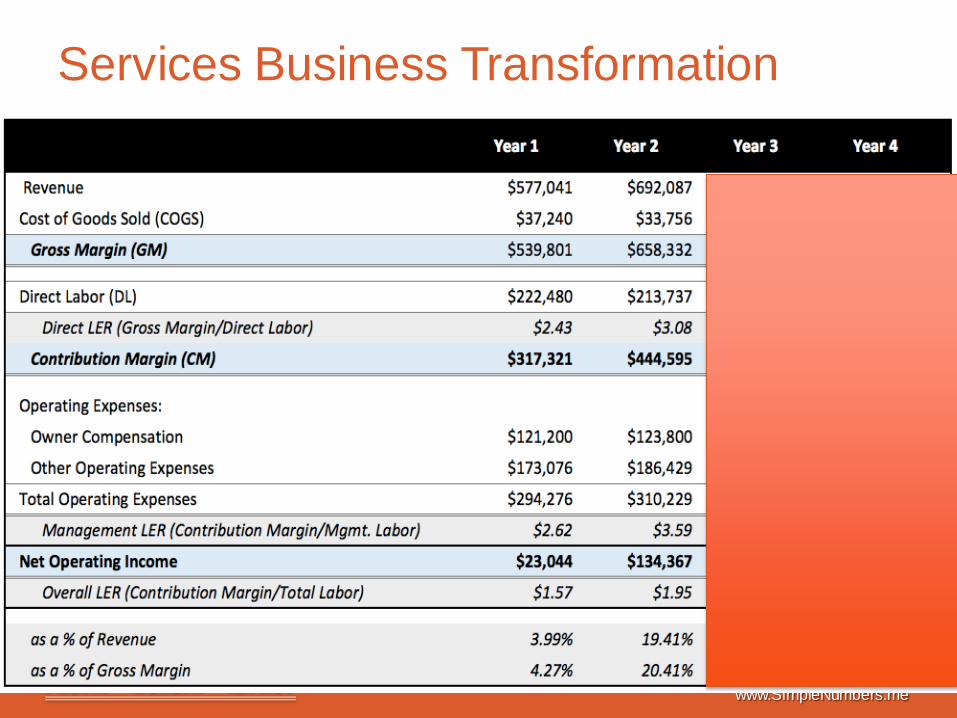
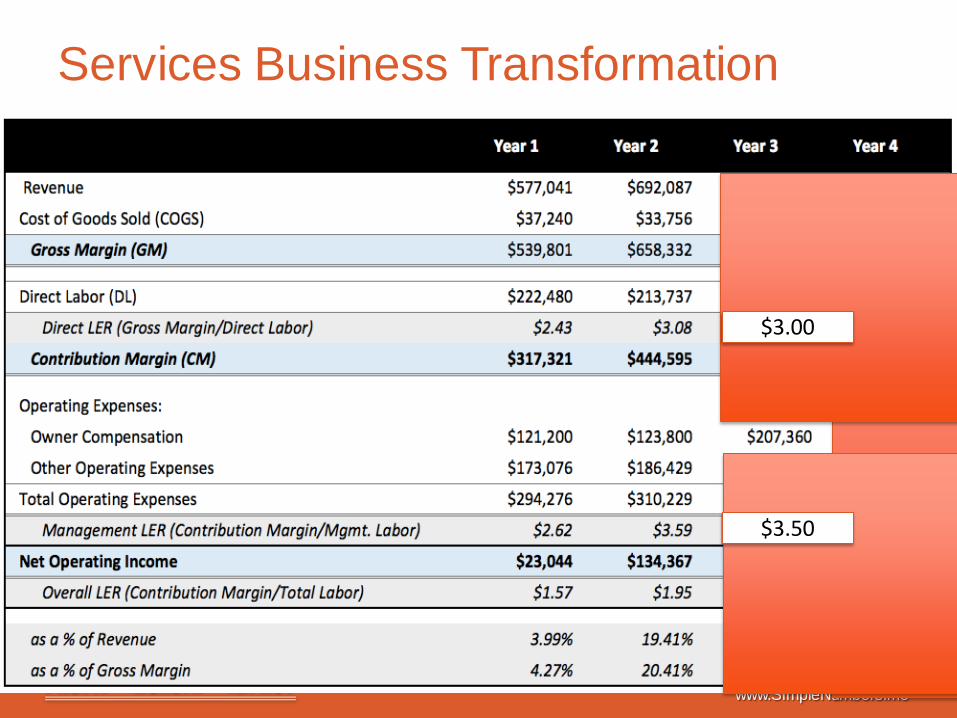
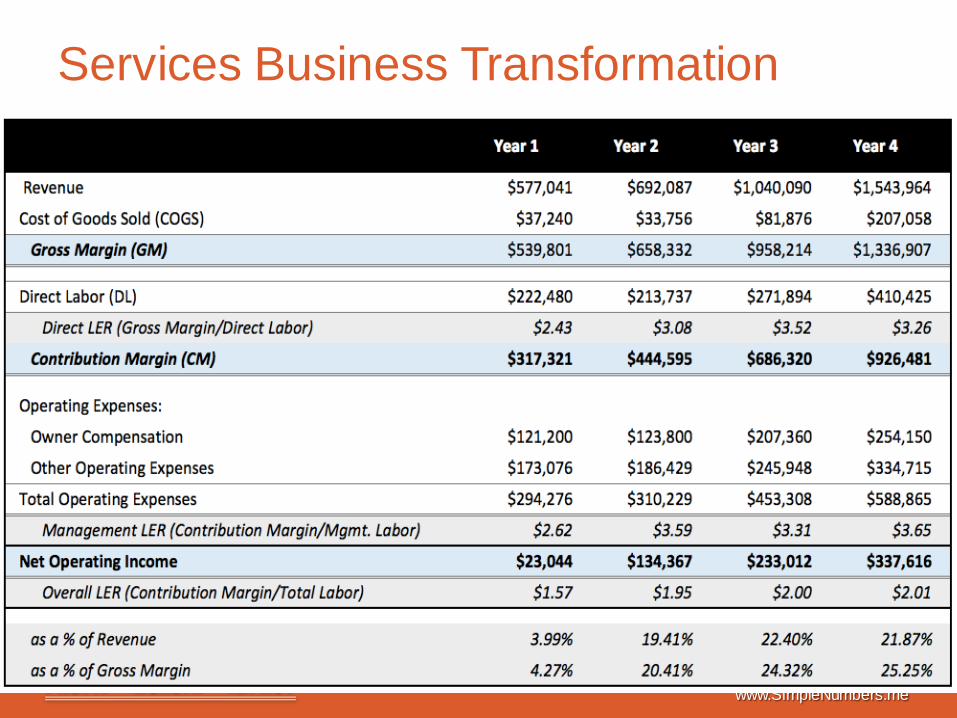
Services Business Transformation Not Sustainable
www.SimpleNumbers.me
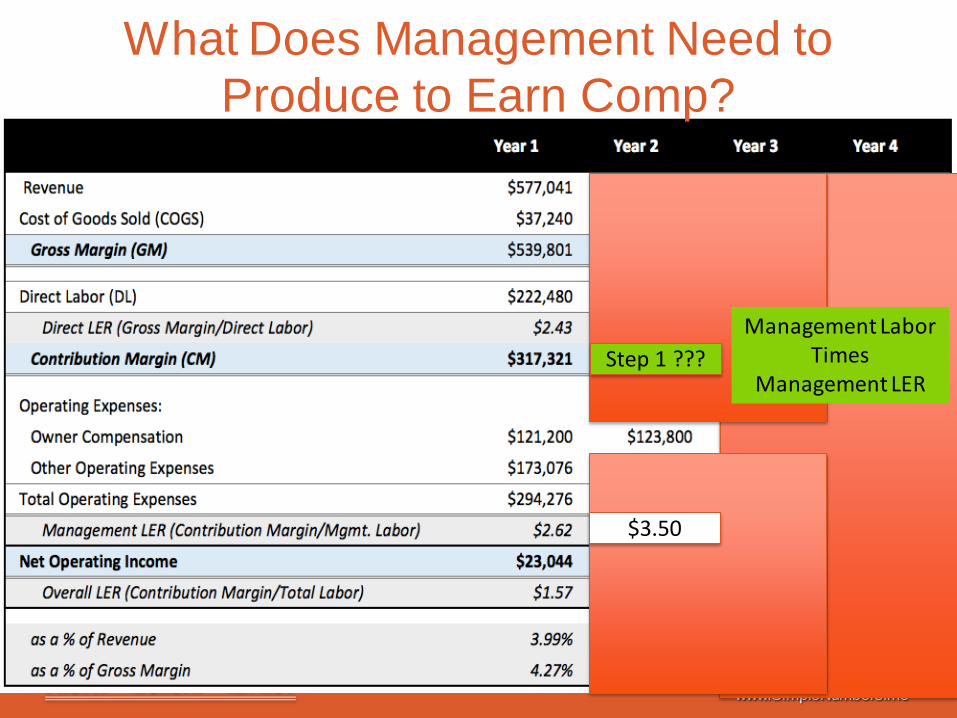
What Does Management Need to Produce to Earn Comp?
$3.50
Step 1 ??? Management Labor
Times Management LER
www.SimpleNumbers.me
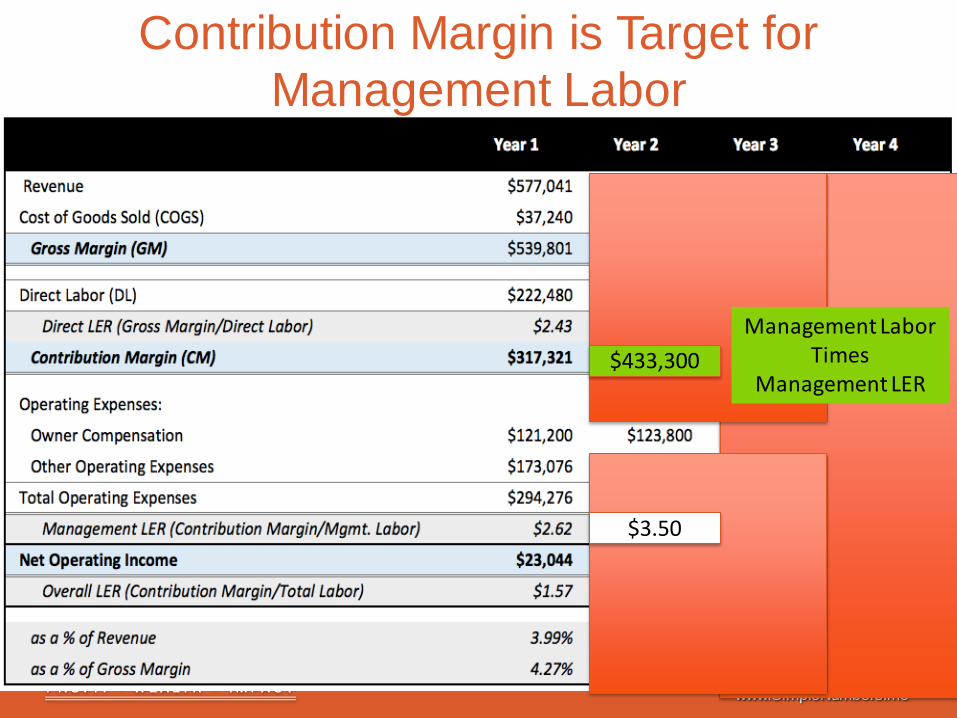
Contribution Margin is Target for Management Labor
$3.50
Management Labor Times
Management LER $433,300
www.SimpleNumbers.me
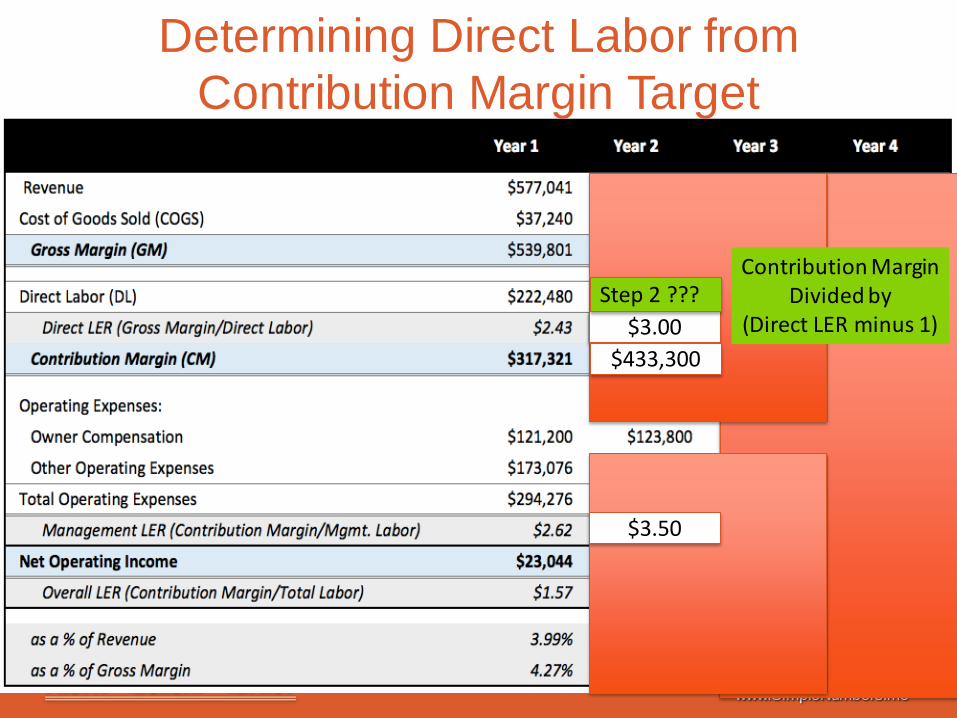
Determining Direct Labor from Contribution Margin Target
$3.50
$3.00 Step 2 ???
$433,300
Contribution Margin Divided by
(Direct LER minus 1)
www.SimpleNumbers.me
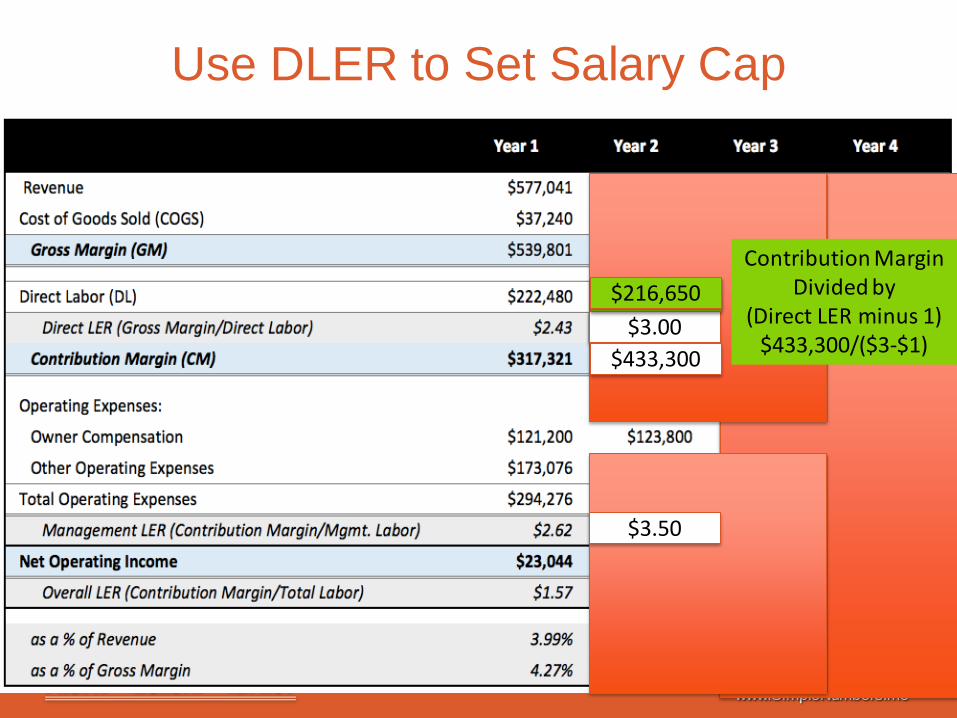
Use DLER to Set Salary Cap
$3.50
$3.00 Step 2 ???
$433,300
Contribution Margin Divided by
(Direct LER minus 1) $433,300/($3-$1)
$216,650

www.SimpleNumbers.me
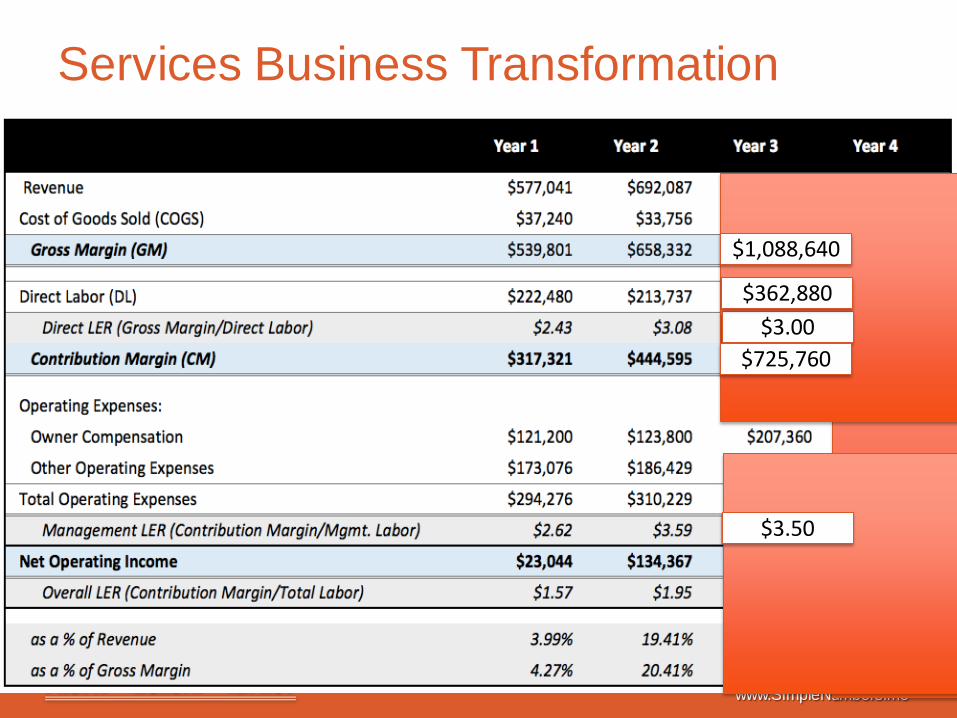
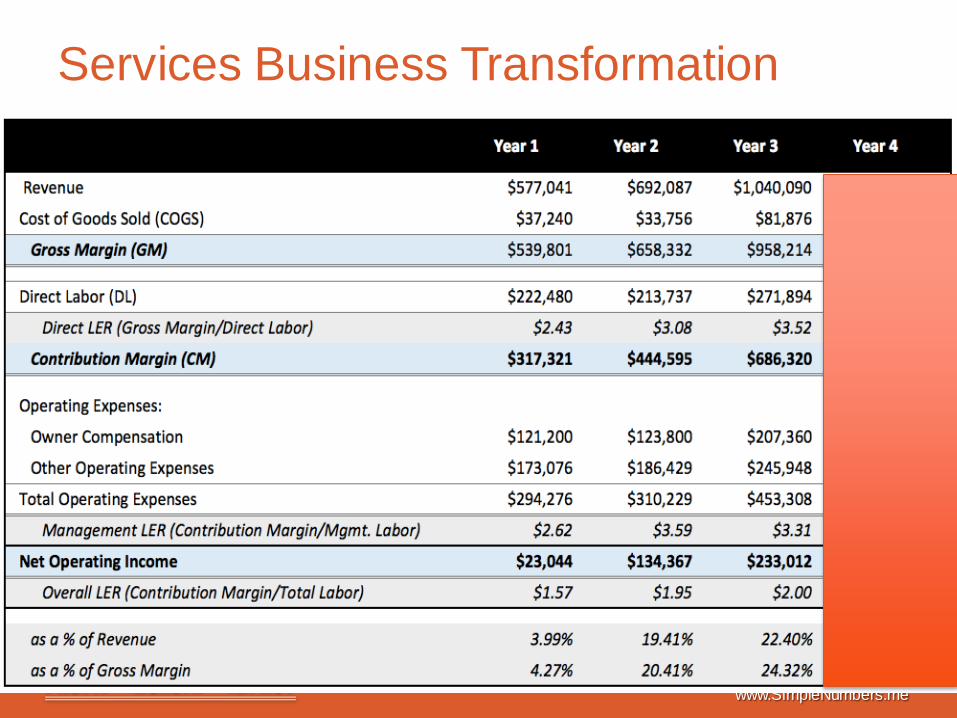
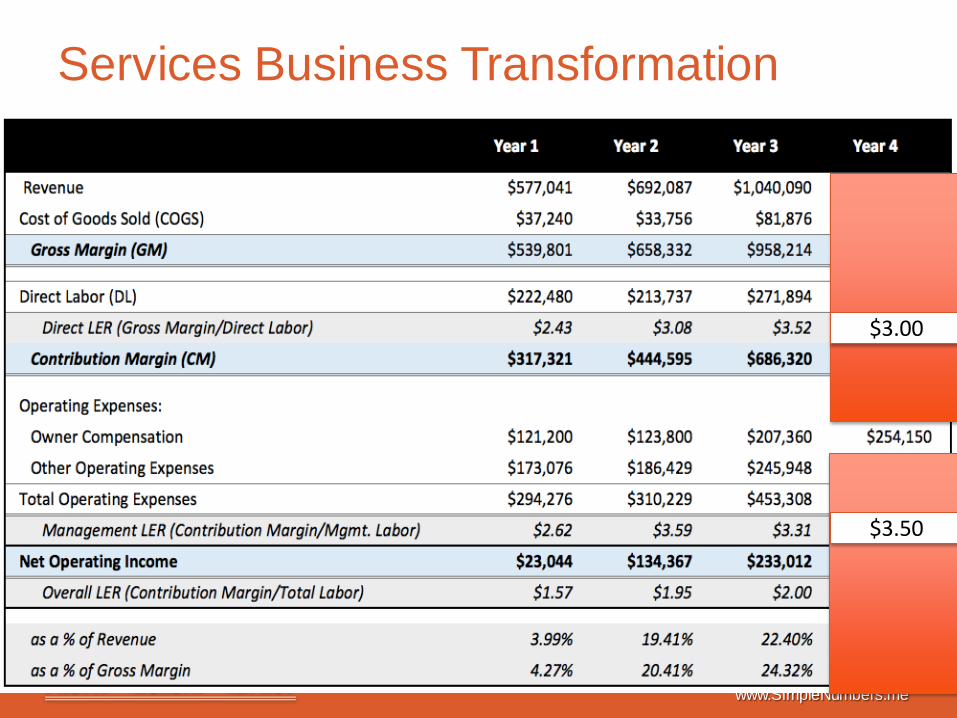
Services Business Transformation
$3.50
$3.00
Step 3 ???
$433,300
$216,650 $216,650
Contribution Margin Plus
Direct Labor
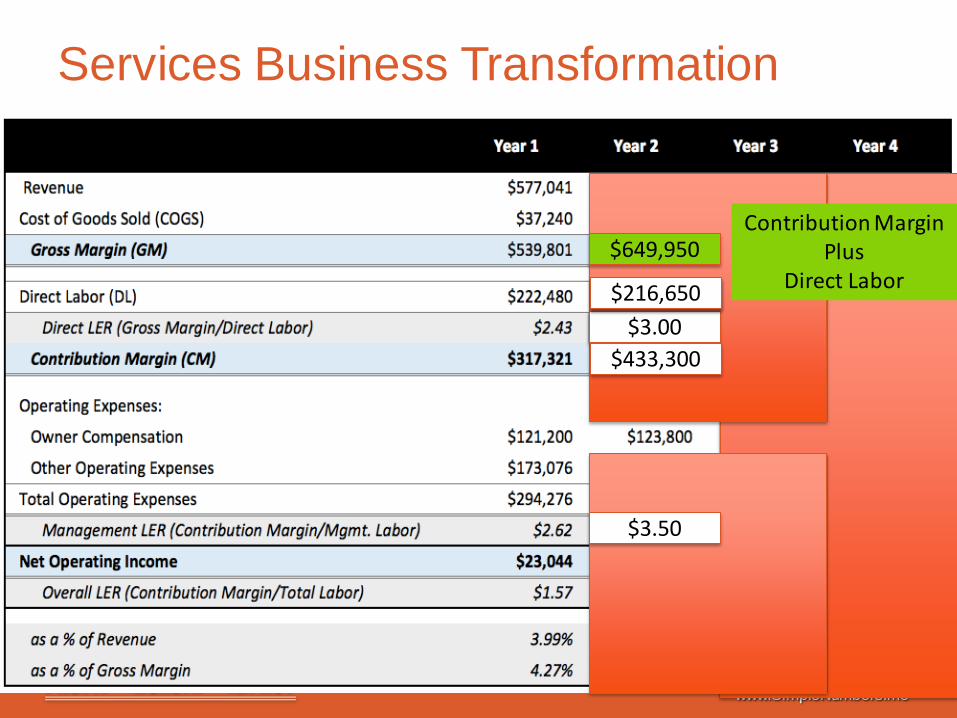
www.SimpleNumbers.me
Services Business Transformation
$3.50
$3.00 $433,300
$216,650 $216,650
Contribution Margin Plus
Direct Labor $649,950
www.SimpleNumbers.me
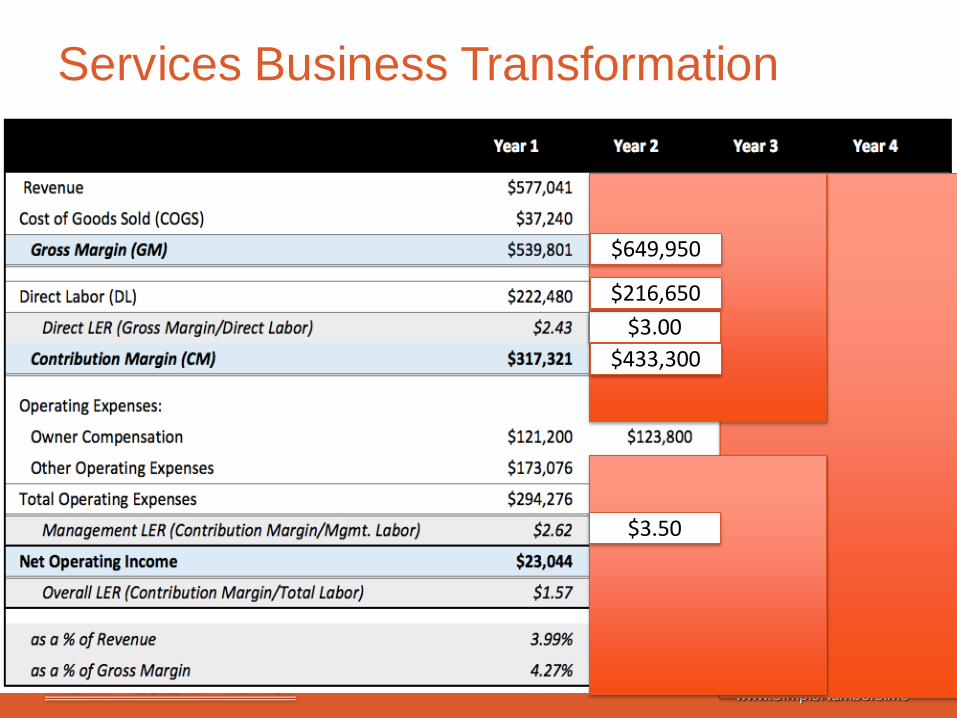
Services Business Transformation
$3.50
$3.00
$649,950
$433,300
$216,650
www.SimpleNumbers.me
Services Business Transformation
www.SimpleNumbers.me
Services Business Transformation
$3.50
$3.00
www.SimpleNumbers.me
Services Business Transformation
$3.50
$3.00
$1,088,640
$725,760
$362,880
www.SimpleNumbers.me
Services Business Transformation
www.SimpleNumbers.me
Services Business Transformation
$3.50
$3.00
www.SimpleNumbers.me
Services Business Transformation
$3.50
$3.00
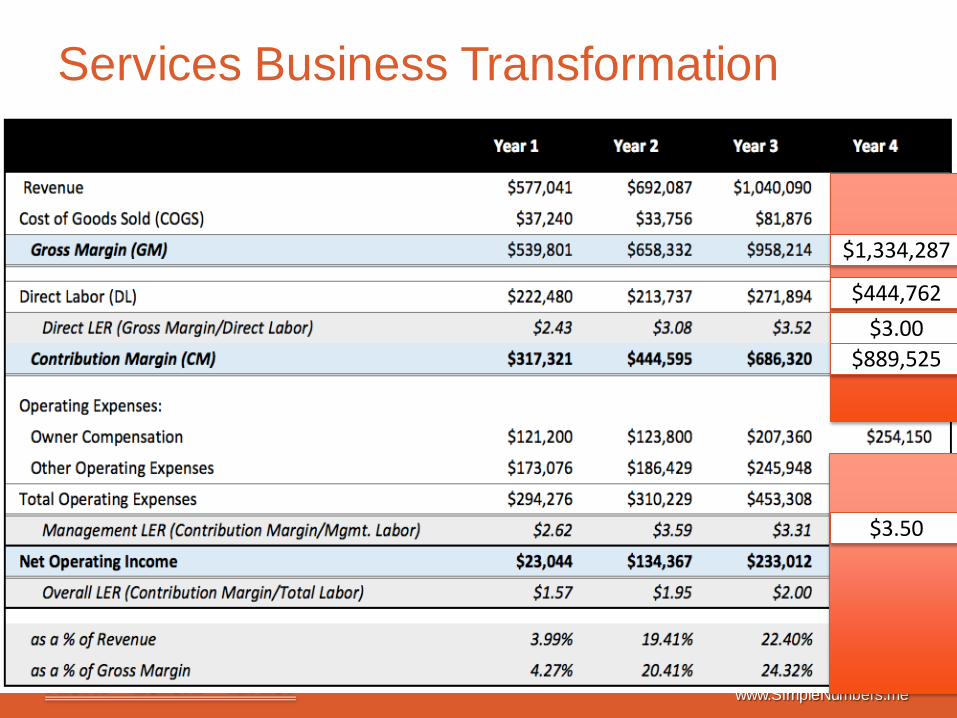
$1,334,287
$889,525
$444,762
www.SimpleNumbers.me
Services Business Transformation
www.SimpleNumbers.me
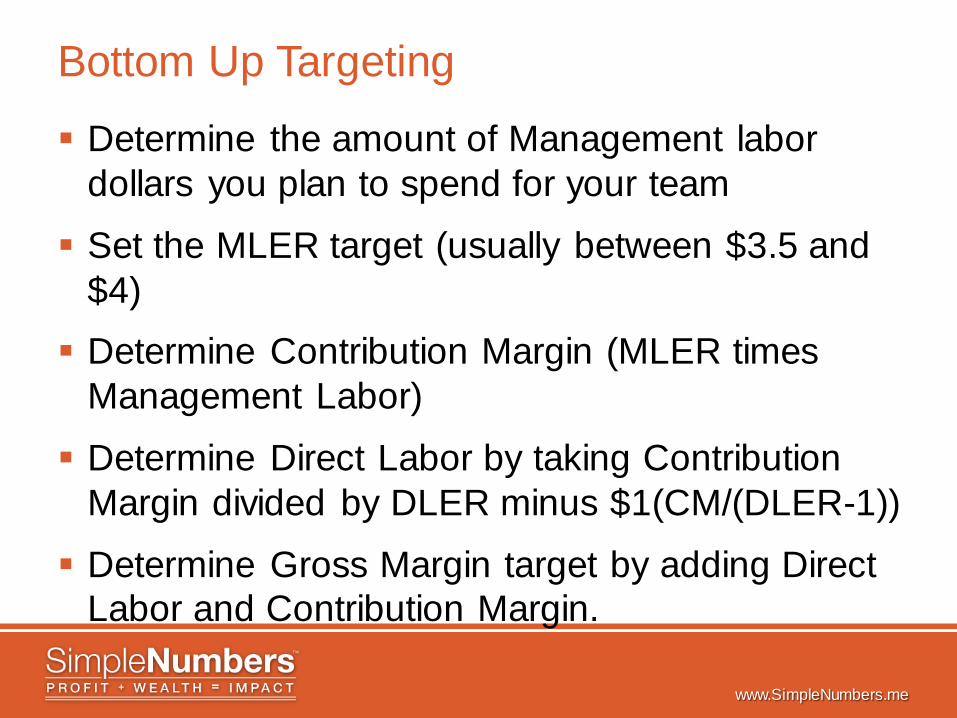
Bottom Up Targeting
Determine the amount of Management labor dollars you plan to spend for your team
Set the MLER target (usually between $3.5 and $4) Determine Contribution Margin (MLER times
Management Labor)
Determine Direct Labor by taking Contribution Margin divided by DLER minus $1(CM/(DLER-1))
Determine Gross Margin target by adding Direct Labor and Contribution Margin.
www.SimpleNumbers.me
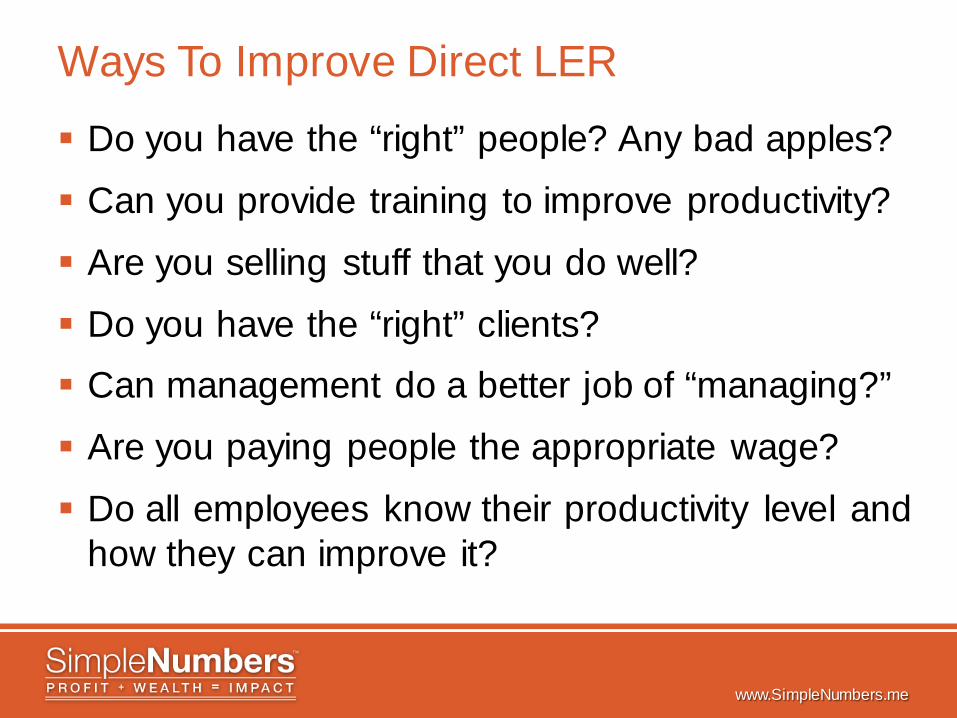
Ways To Improve Direct LER
Do you have the “right” people? Any bad apples?
Can you provide training to improve productivity?
Are you selling stuff that you do well?
Do you have the “right” clients? Can management do a better job of “managing?”
Are you paying people the appropriate wage?
Do all employees know their productivity level and how they can improve it?
www.SimpleNumbers.me
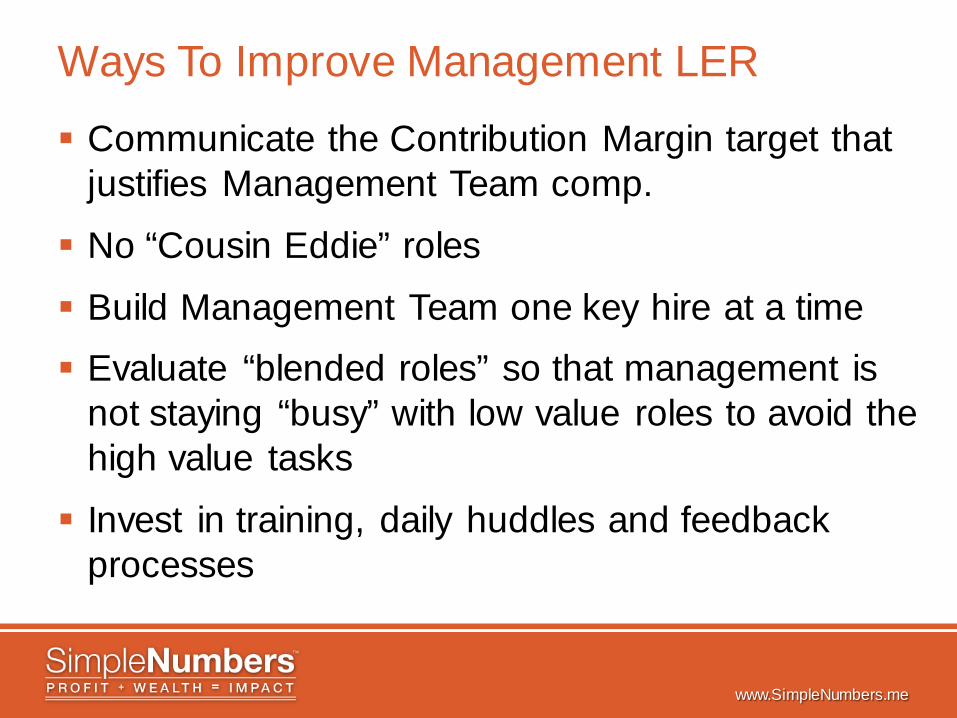
Ways To Improve Management LER
Communicate the Contribution Margin target that justifies Management Team comp.
No “Cousin Eddie” roles
Build Management Team one key hire at a time Evaluate “blended roles” so that management is
not staying “busy” with low value roles to avoid the high value tasks
Invest in training, daily huddles and feedback processes
www.SimpleNumbers.me
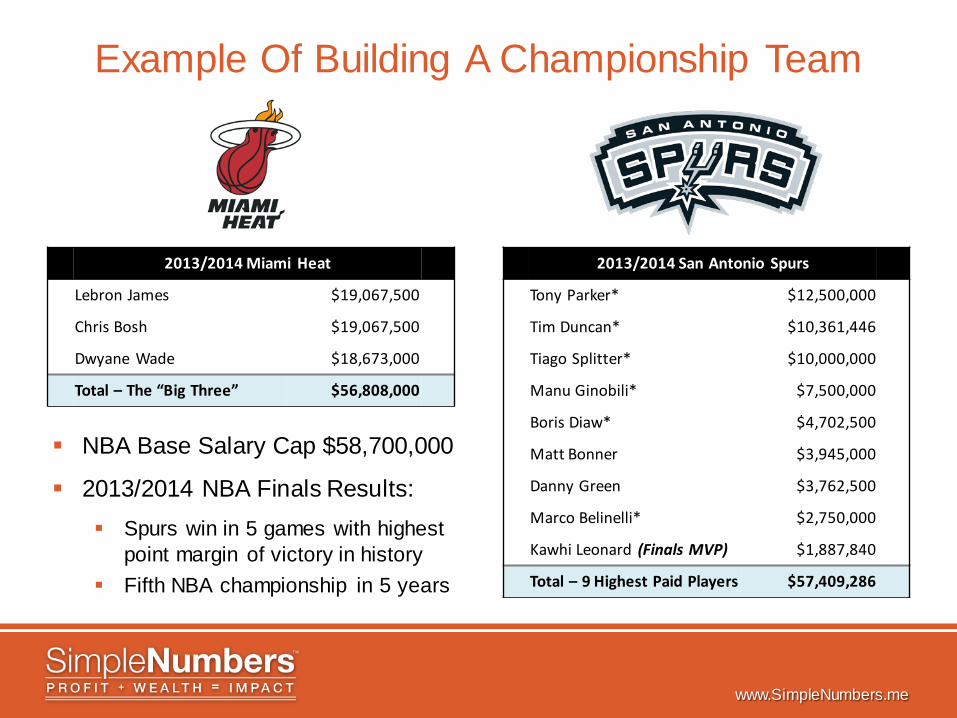
Example Of Building A Championship Team
NBA Base Salary Cap $58,700,000
2013/2014 NBA Finals Results: Spurs win in 5 games with highest
point margin of victory in history Fifth NBA championship in 5 years
2013/2014 Miami Heat
Lebron James $19,067,500
Chris Bosh $19,067,500
Dwyane Wade $18,673,000
Total – The “Big Three” $56,808,000
2013/2014 San Antonio Spurs
Tony Parker* $12,500,000
Tim Duncan* $10,361,446
Tiago Splitter* $10,000,000
Manu Ginobili* $7,500,000
Boris Diaw* $4,702,500
Matt Bonner $3,945,000
Danny Green $3,762,500
Marco Belinelli* $2,750,000
Kawhi Leonard (Finals MVP) $1,887,840
Total – 9 Highest Paid Players $57,409,286
www.SimpleNumbers.me
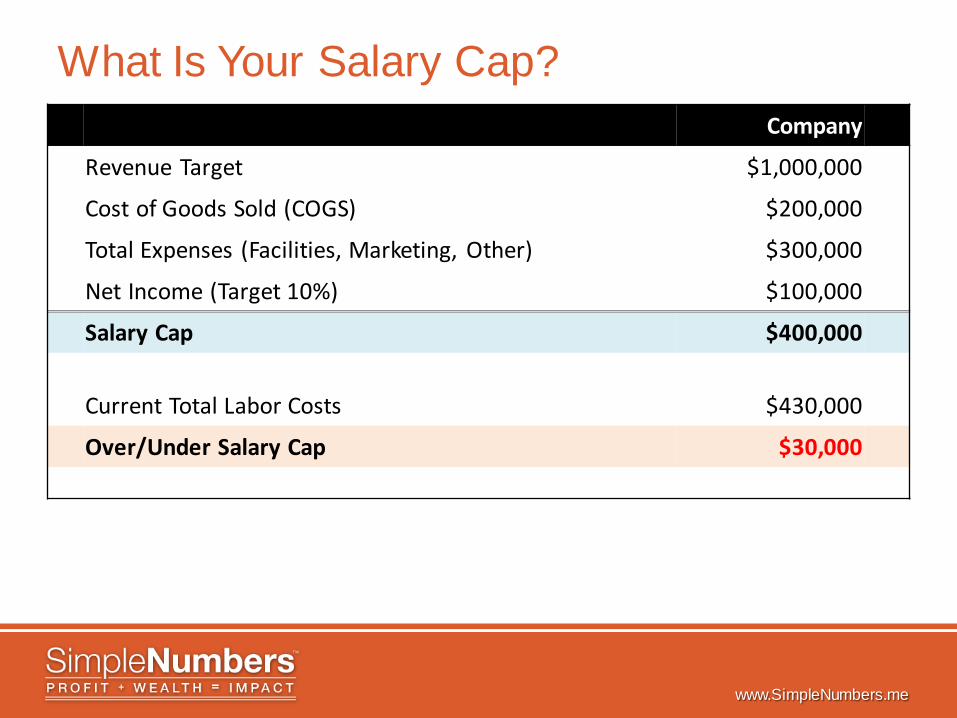
What Is Your Salary Cap? Company
Revenue Target $1,000,000
Cost of Goods Sold (COGS) $200,000
Total Expenses (Facilities, Marketing, Other) $300,000
Net Income (Target 10%) $100,000
Salary Cap $400,000 Current Total Labor Costs $430,000
Over/Under Salary Cap $30,000
www.SimpleNumbers.me
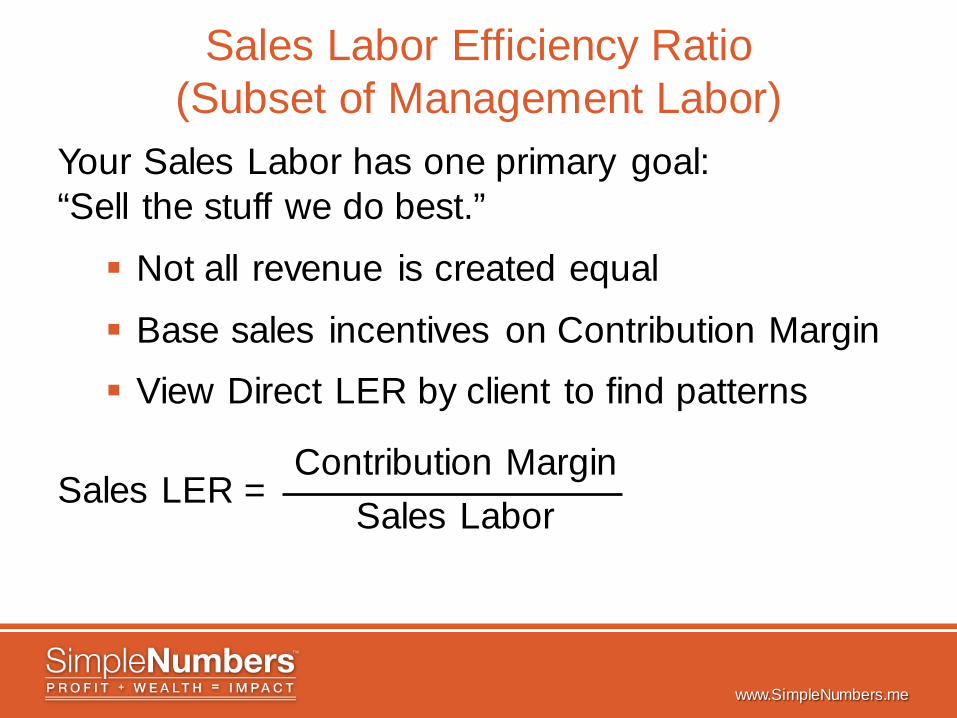
Sales Labor Efficiency Ratio (Subset of Management Labor)
Your Sales Labor has one primary goal: “Sell the stuff we do best.”
Not all revenue is created equal
Base sales incentives on Contribution Margin View Direct LER by client to find patterns
Contribution Margin Sales Labor
Sales LER =
www.SimpleNumbers.me
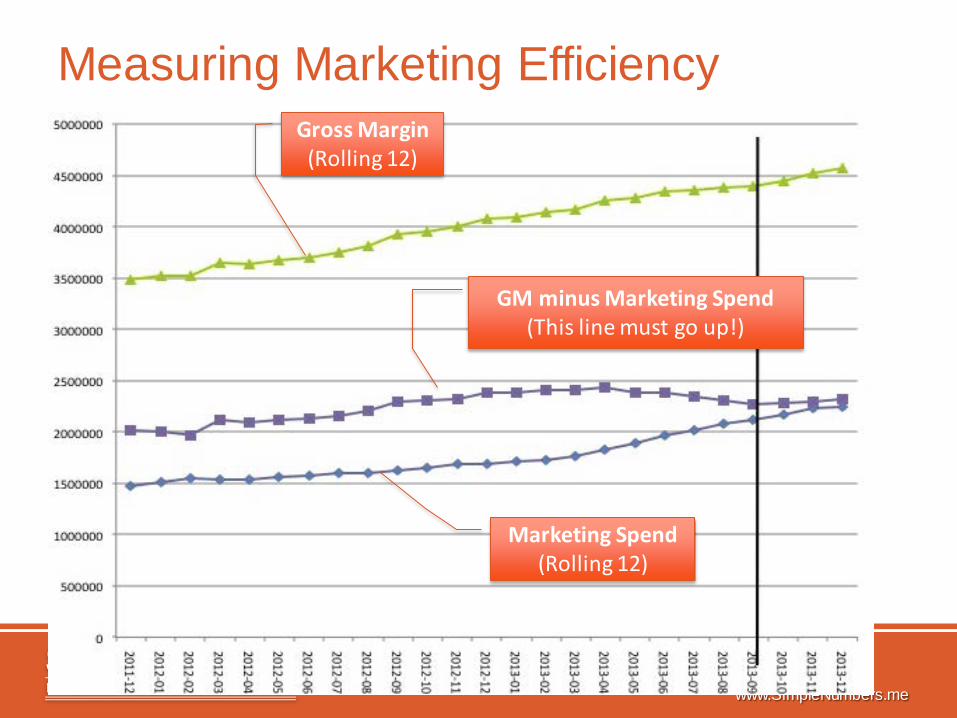
Measuring Marketing Efficiency Gross Margin
(Rolling 12)
Marketing Spend (Rolling 12)
GM minus Marketing Spend (This line must go up!)
www.SimpleNumbers.me
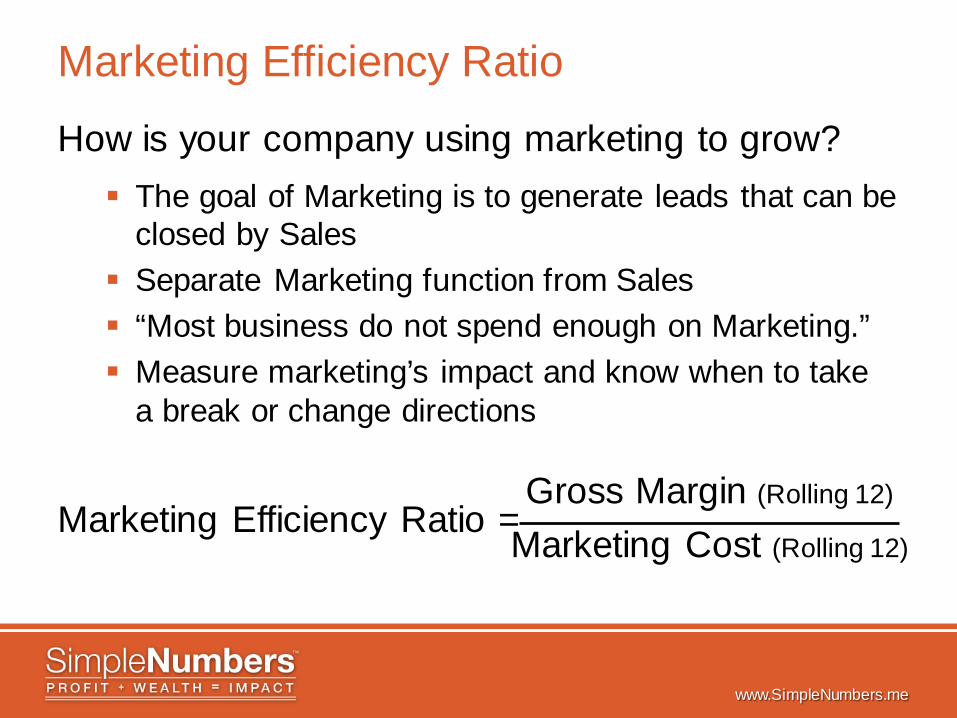
Marketing Efficiency Ratio
How is your company using marketing to grow? The goal of Marketing is to generate leads that can be
closed by Sales Separate Marketing function from Sales “Most business do not spend enough on Marketing.” Measure marketing’s impact and know when to take
a break or change directions
Gross Margin (Rolling 12)
Marketing Cost (Rolling 12)
Marketing Efficiency Ratio =
www.SimpleNumbers.me
#2: Labor Productivity – Action Items
Track Direct Labor Costs separate of other costs
Use Direct LER to measure and manage productivity for individuals, team, segments, and clients
Identify and manage to a “Salary Cap”
Use Management LER to measure and manage admin staff
Use Sales LER to measure and manage sales team
Measure Marketing Efficiency
www.SimpleNumbers.me
3 Year Planning Template Start with the Big Picture Before Getting Bogged Down in the Details
www.SimpleNumbers.me
3 Year Template Process
Summarize P&L into Simple NumbersTM Format
Labor Identify who is Direct Labor, by default, everyone else is
in Management Labor
Do not split people “a butt in a bucket”
Salespeople are generally management labor unless “selling” is your primary activity
Review LER for last 3 years and look for “best performance periods
www.SimpleNumbers.me
3 Year Template Process- Continued
Forecast P&L Top Down Method Set Revenue, GM targets
Set DLER & MLER targets to then determine salary cap for both labor buckets
Bottom Up Method Set Management Labor $
Determine Contribution Margin $ Target
Set Direct LER at rate needed to cover current Direct Labor levels
www.SimpleNumbers.me
3 Year Template Process- Continued
Forecast Operating Expenses Facilities – input from historical. Typically includes rent,
utilities, repairs, telecommunications, IT
Marketing – control as a % of sales (below P&L in highlighted area
Payroll taxes and benefits – avoid combining with Labor, control as a % of all labor in highlighted area
Other Operating Expenses – the “Great Catchall” – all the noise but little you can really do about it. Forecast it as a % of Contribution Margin based on history.
www.SimpleNumbers.me
3 Year Template Process- Continued
Balance Sheet Limited to the items that really matter
Inventory – put in Other Assets if you have Inventory
Forecast A/R DSO – input days sales outstanding to drive A/R balances
Profit Distributions – only include the distributions that are not for tax coverage
Taxes – Taxes have been accounted for as “Tax Distributions”. If you pay taxes inside the company, it should represent a similar amount.

www.SimpleNumbers.me
Power of One Template From Scaling Up by Verne Harnish (original concept developed by Alan Miltz)

www.SimpleNumbers.me
Power of One Template
Gary’s Furniture Example Review the data from the Gary’s Furniture tab in relation
to the discussion in Scaling Up by Verne Harnish. This will give you a good understanding on how to use the template
LER – I have added the LER component to the original work that Alan Miltz did for Scaling Up so that you can match to the Simple Numbers P&L
Template Tab is an example of a smaller business without inventory as comparison
Blank tab is for you to input your own data
www.SimpleNumbers.me
Communicating Compensation How talk about compensation drives what you get.
www.SimpleNumbers.me
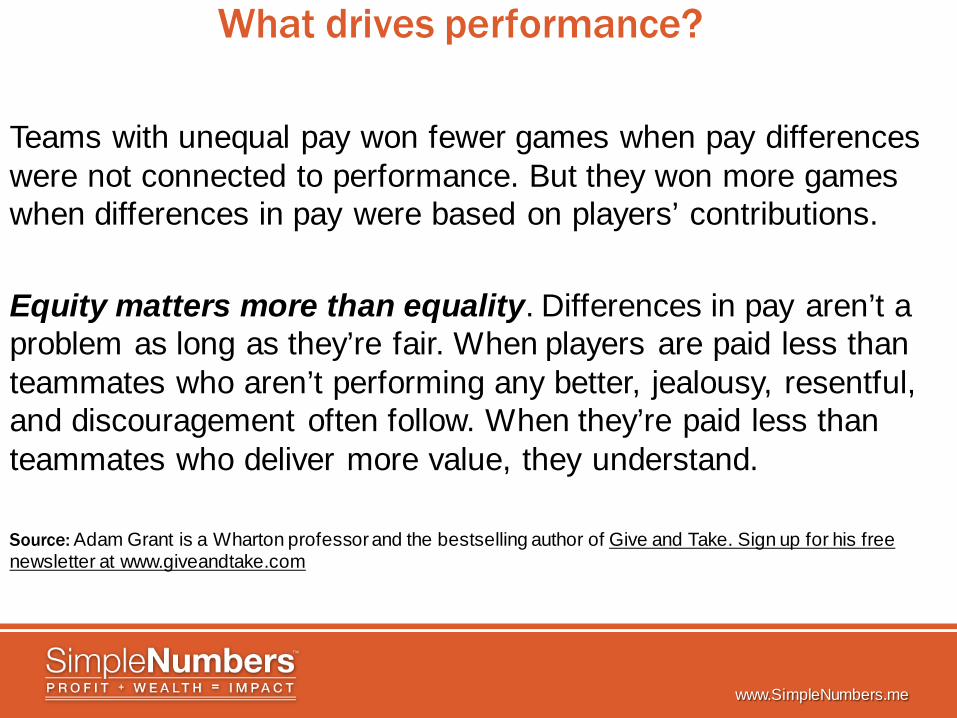
What drives performance?
Teams with unequal pay won fewer games when pay differences were not connected to performance. But they won more games when differences in pay were based on players’ contributions. Equity matters more than equality. Differences in pay aren’t a problem as long as they’re fair. When players are paid less than teammates who aren’t performing any better, jealousy, resentful, and discouragement often follow. When they’re paid less than teammates who deliver more value, they understand. Source: Adam Grant is a Wharton professor and the bestselling author of Give and Take. Sign up for his free newsletter at www.giveandtake.com
www.SimpleNumbers.me
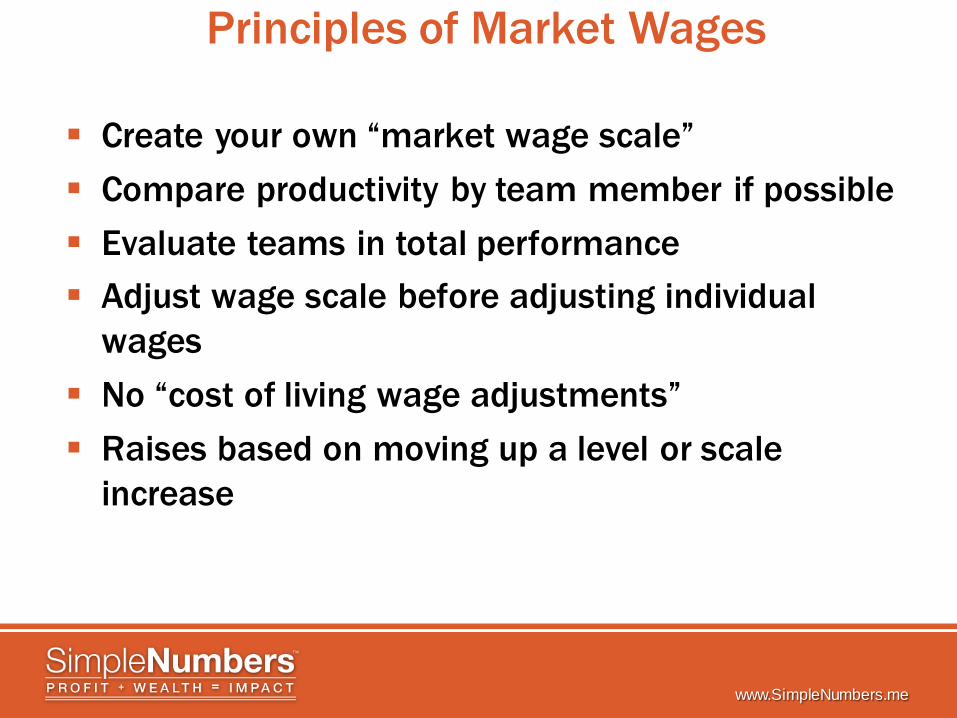
Principles of Market Wages
Create your own “market wage scale” Compare productivity by team member if possible Evaluate teams in total performance Adjust wage scale before adjusting individual
wages No “cost of living wage adjustments” Raises based on moving up a level or scale
increase
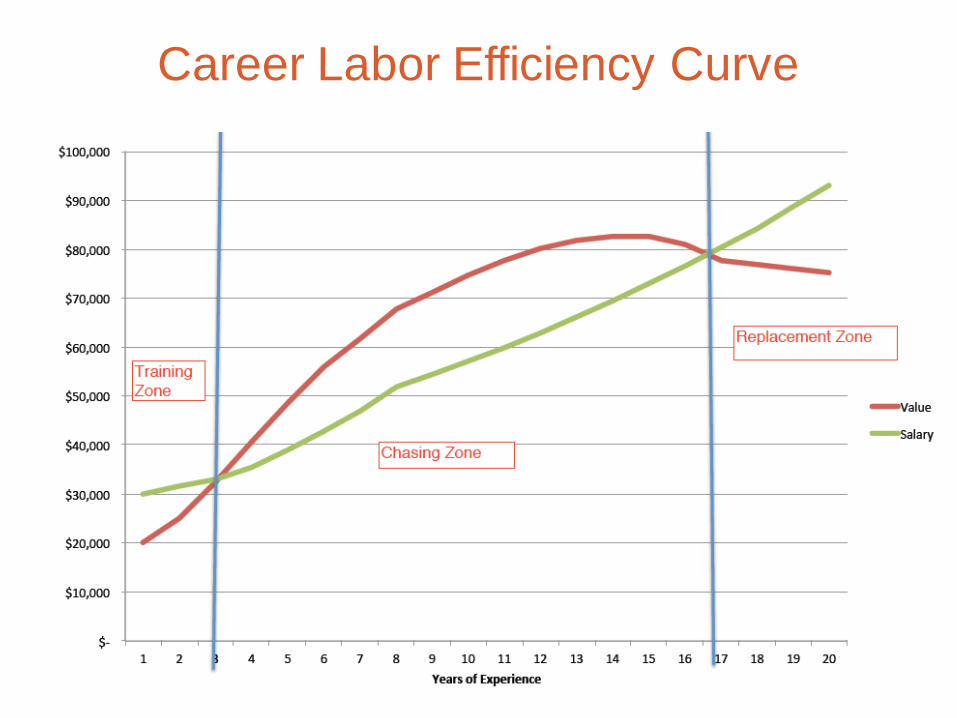
Career Labor Efficiency Curve
www.SimpleNumbers.me
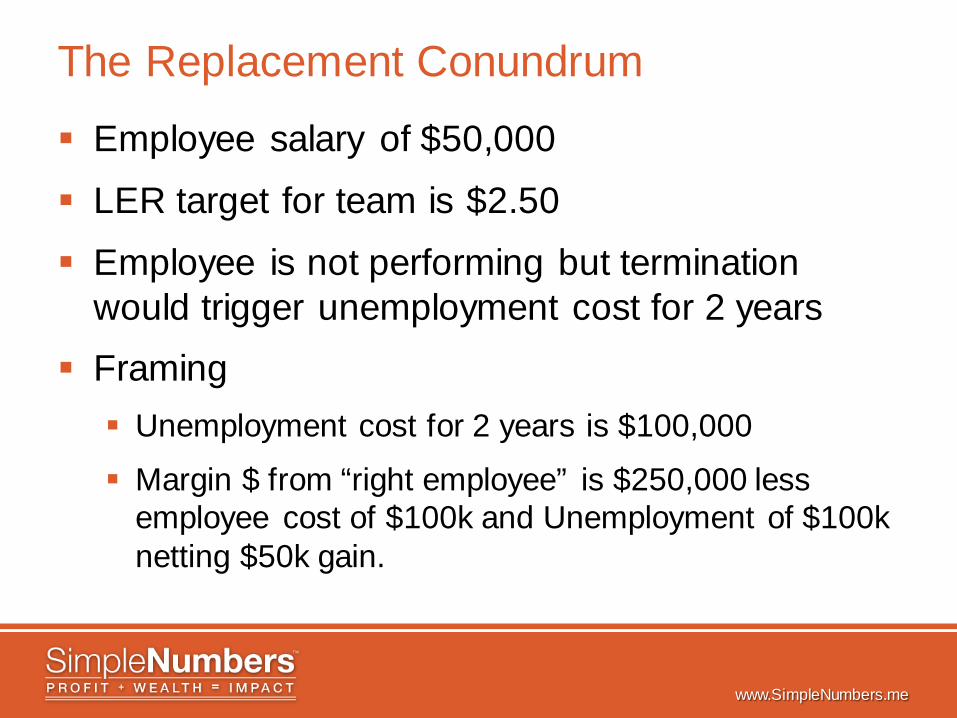
The Replacement Conundrum
Employee salary of $50,000
LER target for team is $2.50
Employee is not performing but termination would trigger unemployment cost for 2 years
Framing Unemployment cost for 2 years is $100,000
Margin $ from “right employee” is $250,000 less employee cost of $100k and Unemployment of $100k netting $50k gain.
www.SimpleNumbers.me
Incentive Compensation Incentive pay will never get you out of management and leadership of your team. Make sure your incentives are grounded in principles and ties to company output in a win/win.
www.SimpleNumbers.me
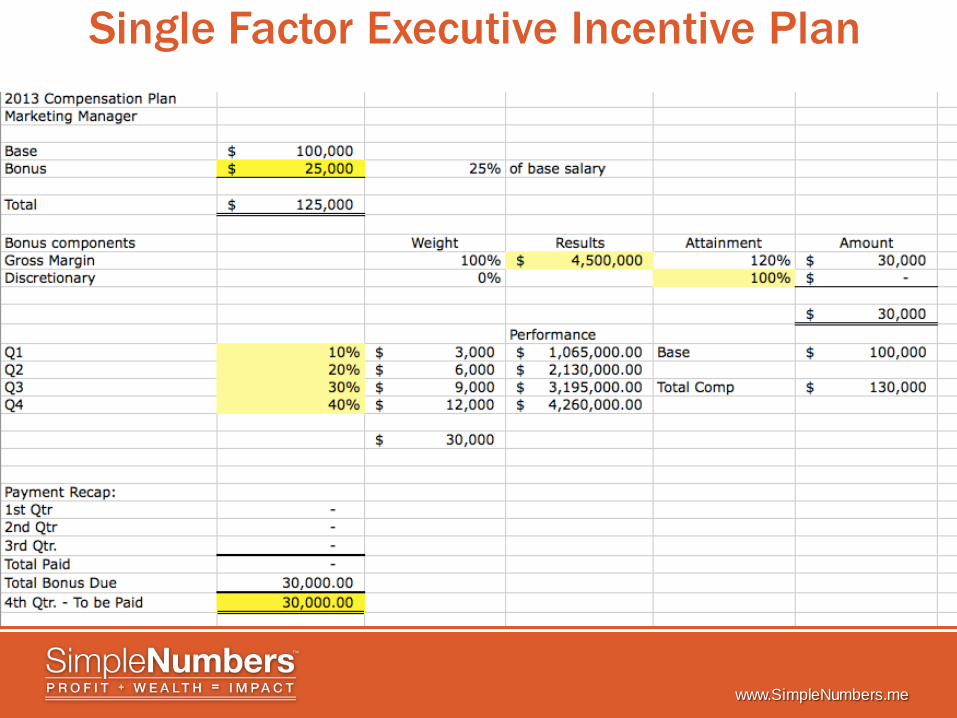
Principles of Incentives
Outcome must produce a win/win scenario Needs to be relatively simple to calculate and is
based on a true “driver” metric that can be significantly influenced by the recipient (we like contribution margin)
Establish Minimum, Target and Stretch and reset scale each year
Base Target as a % of Base pay Payout Quarterly but back end load
www.SimpleNumbers.me
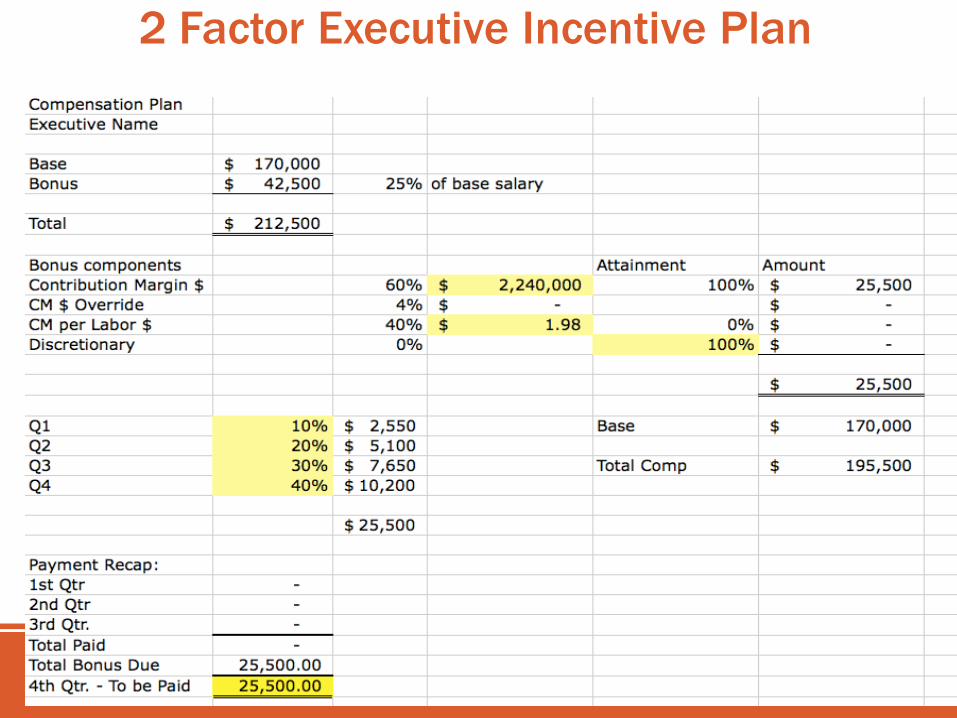
2 Factor Executive Incentive Plan
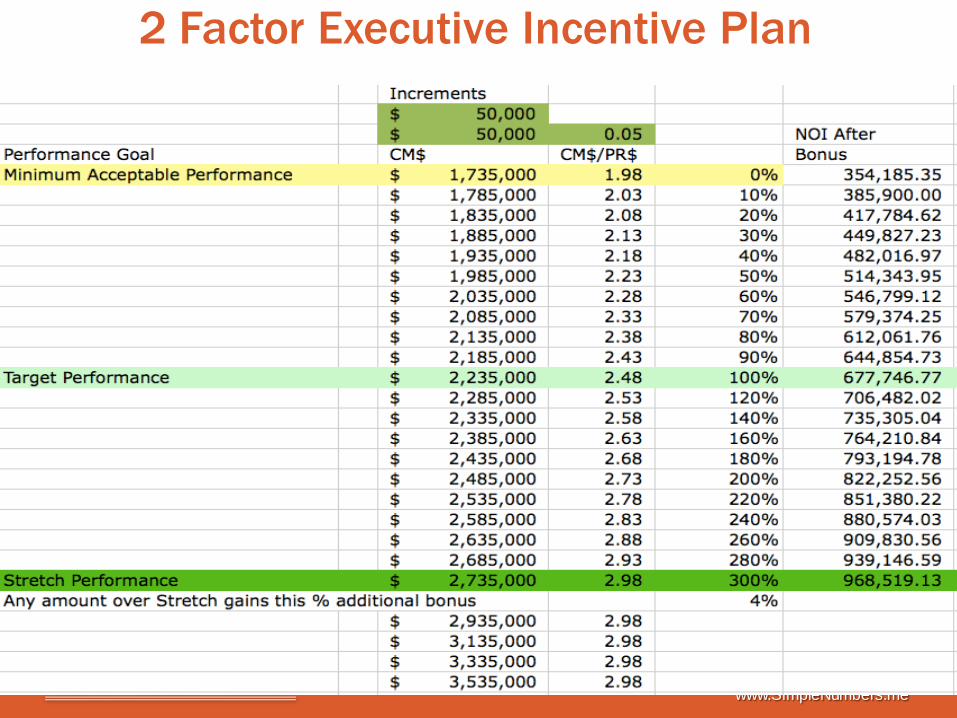
www.SimpleNumbers.me
2 Factor Executive Incentive Plan
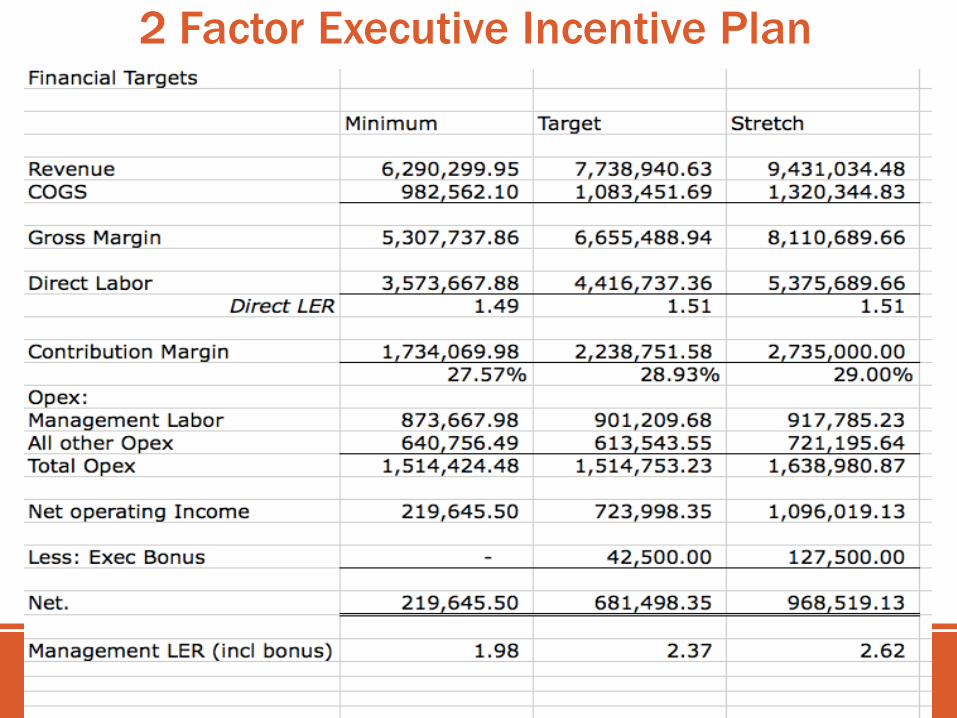
www.SimpleNumbers.me
2 Factor Executive Incentive Plan
www.SimpleNumbers.me
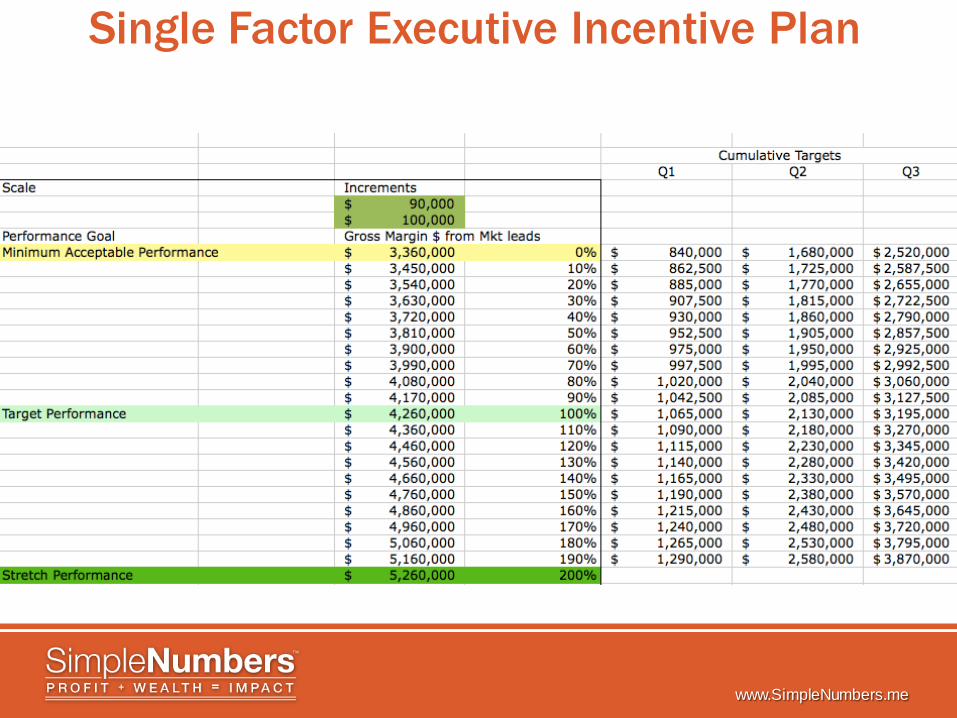
Single Factor Executive Incentive Plan
www.SimpleNumbers.me
Single Factor Executive Incentive Plan
www.SimpleNumbers.me
Owner Participation
1. Owners should only participate in incentive plans when
1. There are multiple owners that work in the business that each have different roles
2. There are outside investors who do not work in the business
3. You want to participate with other executive team members who are not owners
2. Don’t do an incentive thinking it will change your performance.
www.SimpleNumbers.me
#3: Four Forces of Cash Flow Have you set your priorities right to build a solid foundation?
www.SimpleNumbers.me
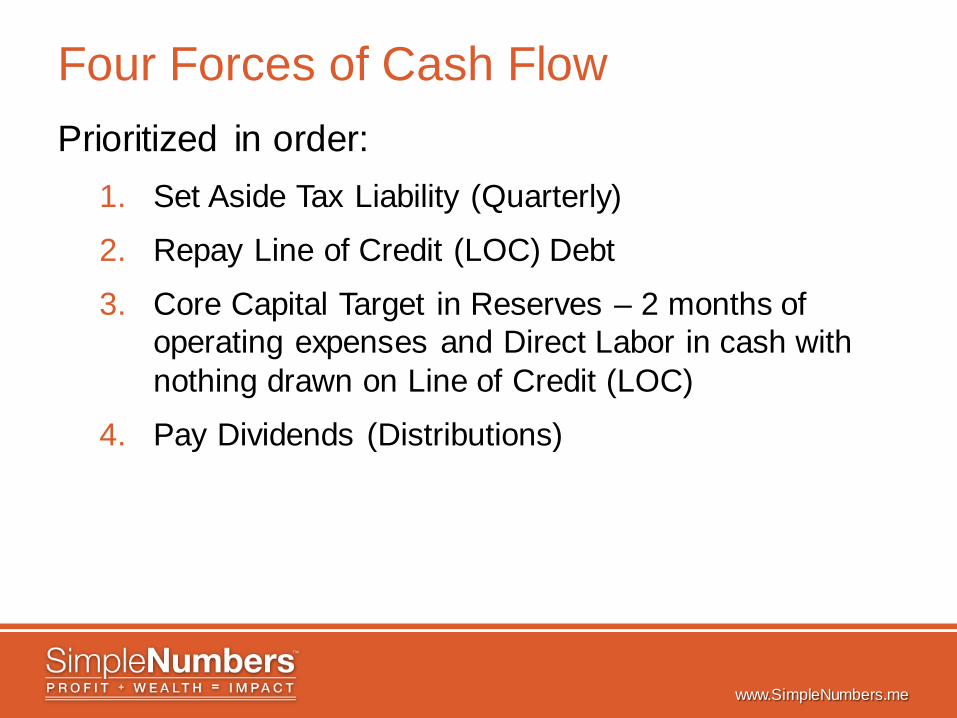
Four Forces of Cash Flow Prioritized in order:
1. Set Aside Tax Liability (Quarterly)
2. Repay Line of Credit (LOC) Debt
3. Core Capital Target in Reserves – 2 months of operating expenses and Direct Labor in cash with nothing drawn on Line of Credit (LOC)
4. Pay Dividends (Distributions)
www.SimpleNumbers.me
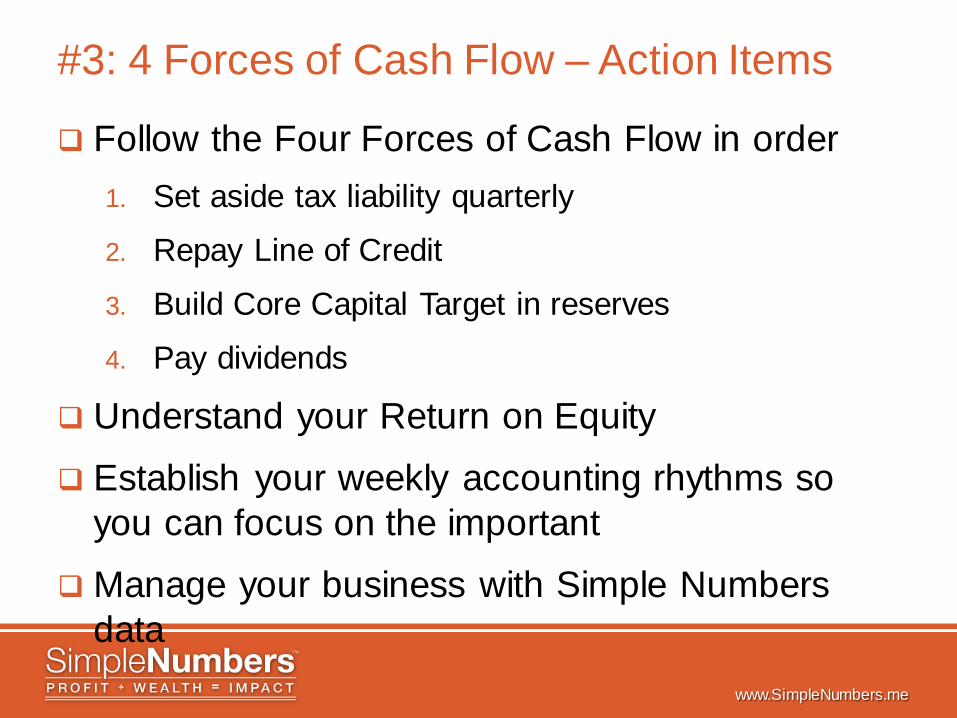
#3: 4 Forces of Cash Flow – Action Items
Follow the Four Forces of Cash Flow in order 1. Set aside tax liability quarterly
2. Repay Line of Credit
3. Build Core Capital Target in reserves
4. Pay dividends
Understand your Return on Equity
Establish your weekly accounting rhythms so you can focus on the important
Manage your business with Simple Numbers data
www.SimpleNumbers.me
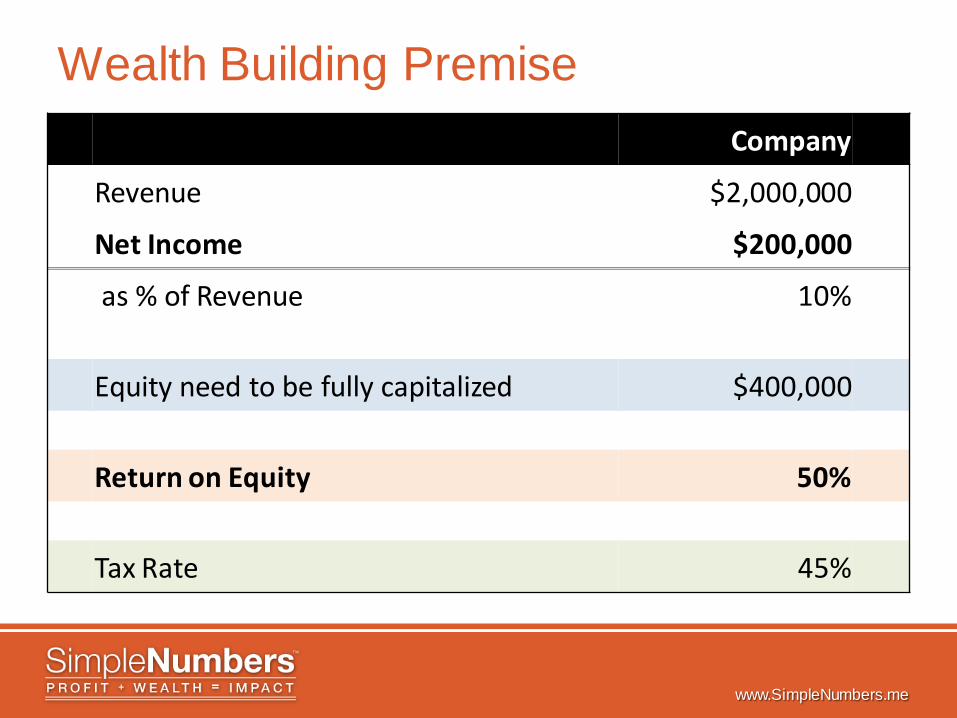
Wealth Building Premise Company
Revenue $2,000,000
Net Income $200,000
as % of Revenue 10%
Equity need to be fully capitalized $400,000
Return on Equity 50%
Tax Rate 45%
www.SimpleNumbers.me
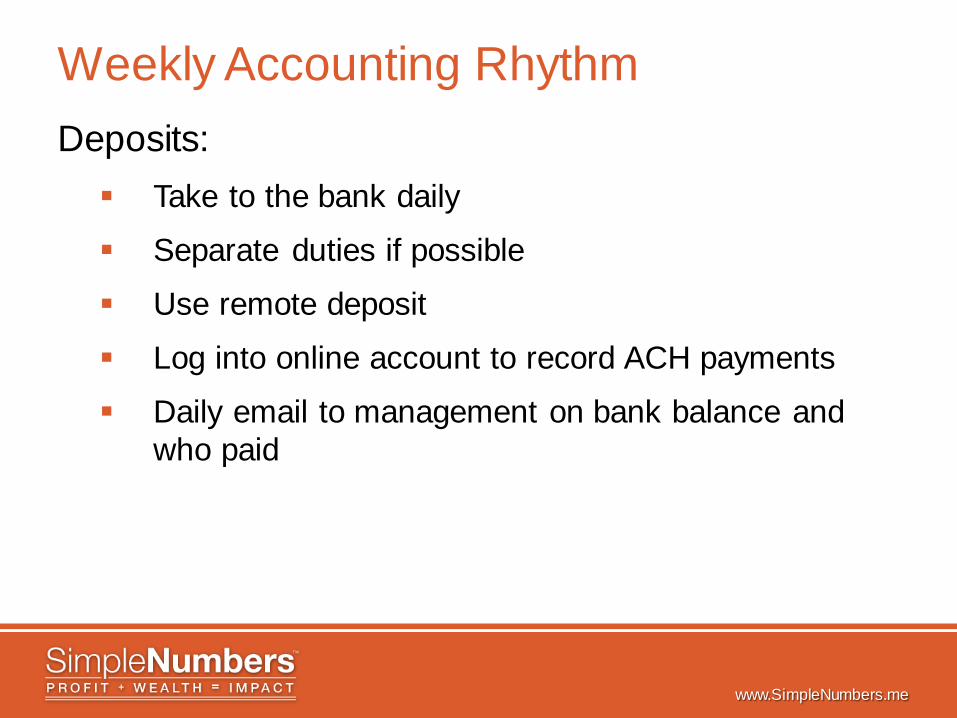
Weekly Accounting Rhythm Deposits: Take to the bank daily
Separate duties if possible
Use remote deposit
Log into online account to record ACH payments
Daily email to management on bank balance and who paid
www.SimpleNumbers.me
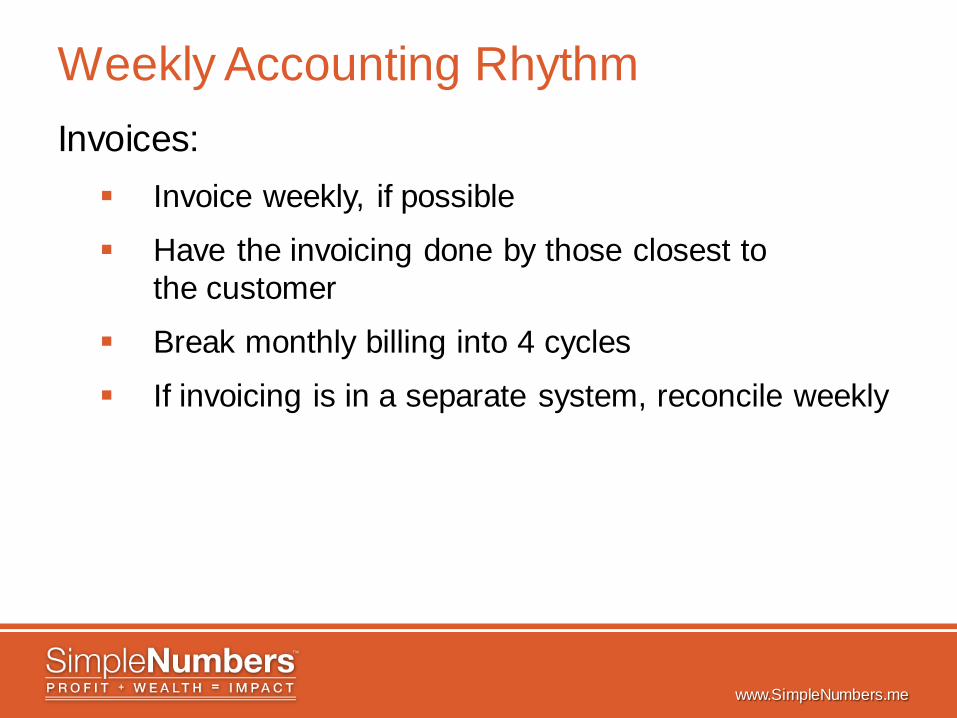
Weekly Accounting Rhythm Invoices: Invoice weekly, if possible
Have the invoicing done by those closest to the customer
Break monthly billing into 4 cycles
If invoicing is in a separate system, reconcile weekly
www.SimpleNumbers.me
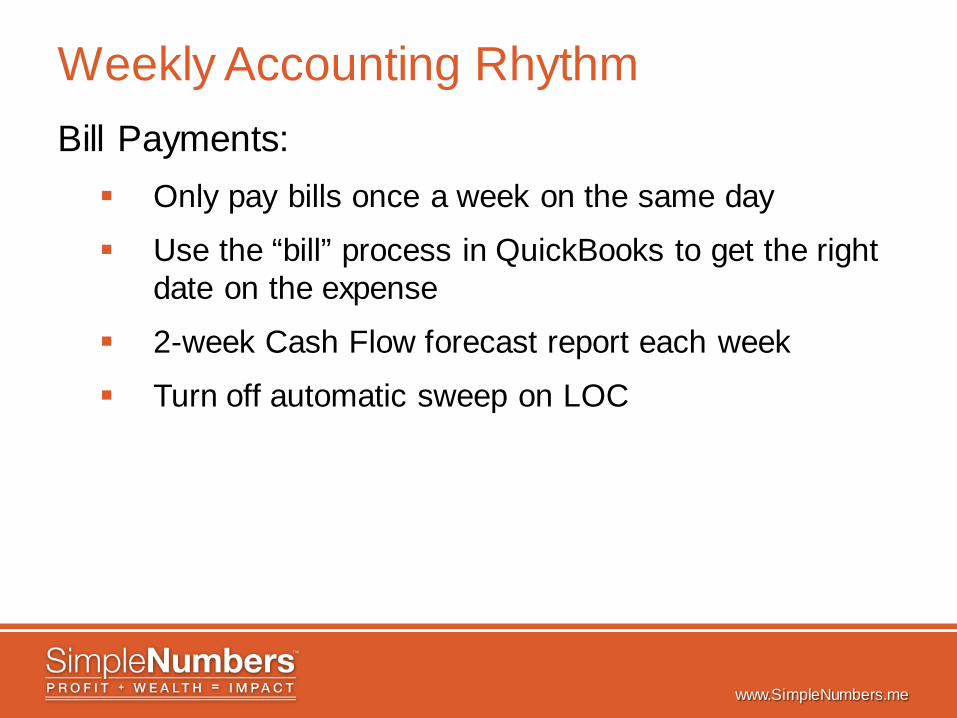
Weekly Accounting Rhythm Bill Payments: Only pay bills once a week on the same day
Use the “bill” process in QuickBooks to get the right date on the expense
2-week Cash Flow forecast report each week
Turn off automatic sweep on LOC
www.SimpleNumbers.me
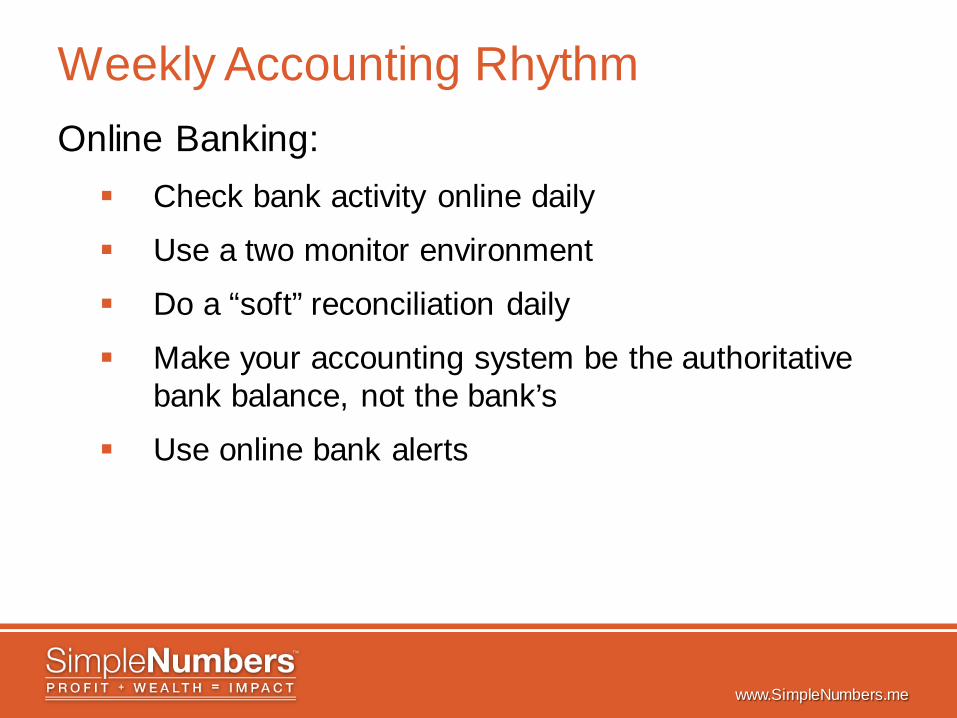
Weekly Accounting Rhythm Online Banking: Check bank activity online daily
Use a two monitor environment
Do a “soft” reconciliation daily
Make your accounting system be the authoritative bank balance, not the bank’s
Use online bank alerts
www.SimpleNumbers.me
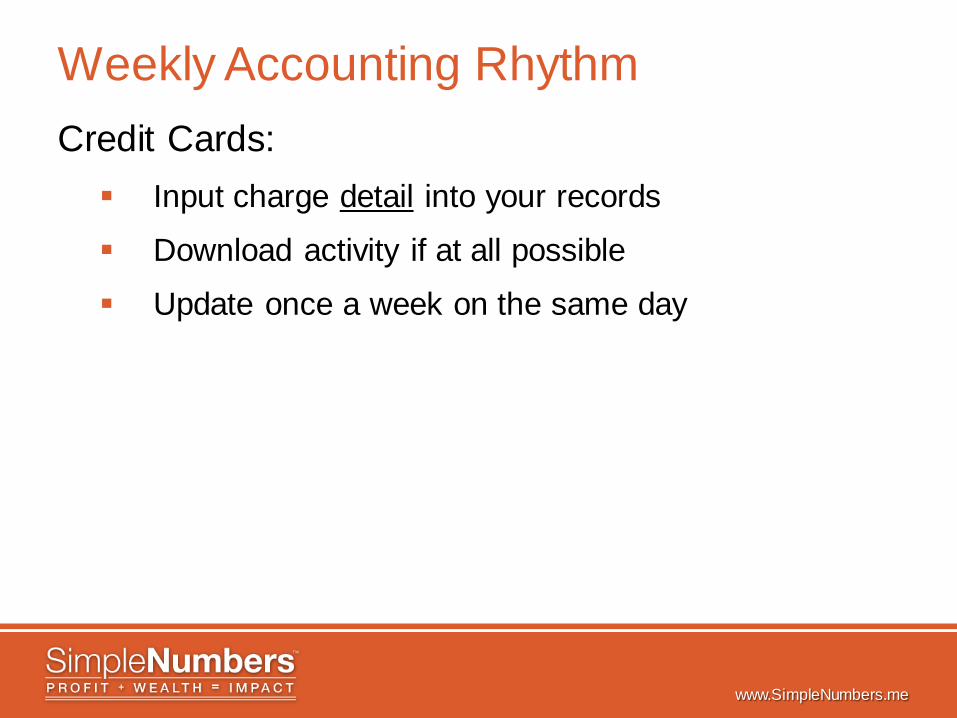
Weekly Accounting Rhythm Credit Cards: Input charge detail into your records
Download activity if at all possible
Update once a week on the same day
www.SimpleNumbers.me
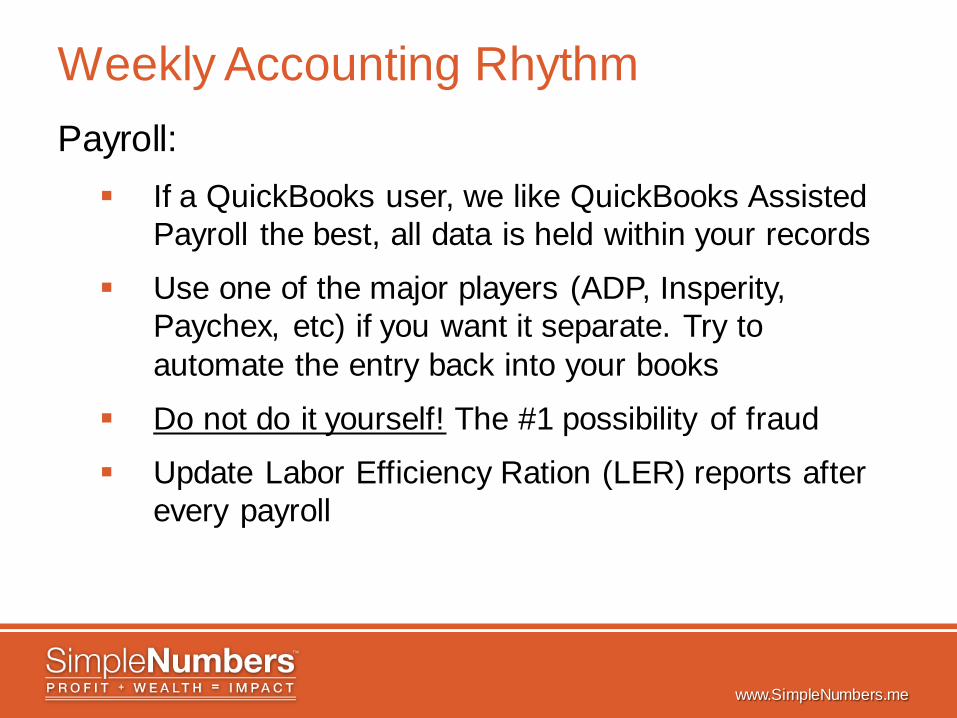
Weekly Accounting Rhythm Payroll: If a QuickBooks user, we like QuickBooks Assisted
Payroll the best, all data is held within your records
Use one of the major players (ADP, Insperity, Paychex, etc) if you want it separate. Try to automate the entry back into your books
Do not do it yourself! The #1 possibility of fraud
Update Labor Efficiency Ration (LER) reports after every payroll
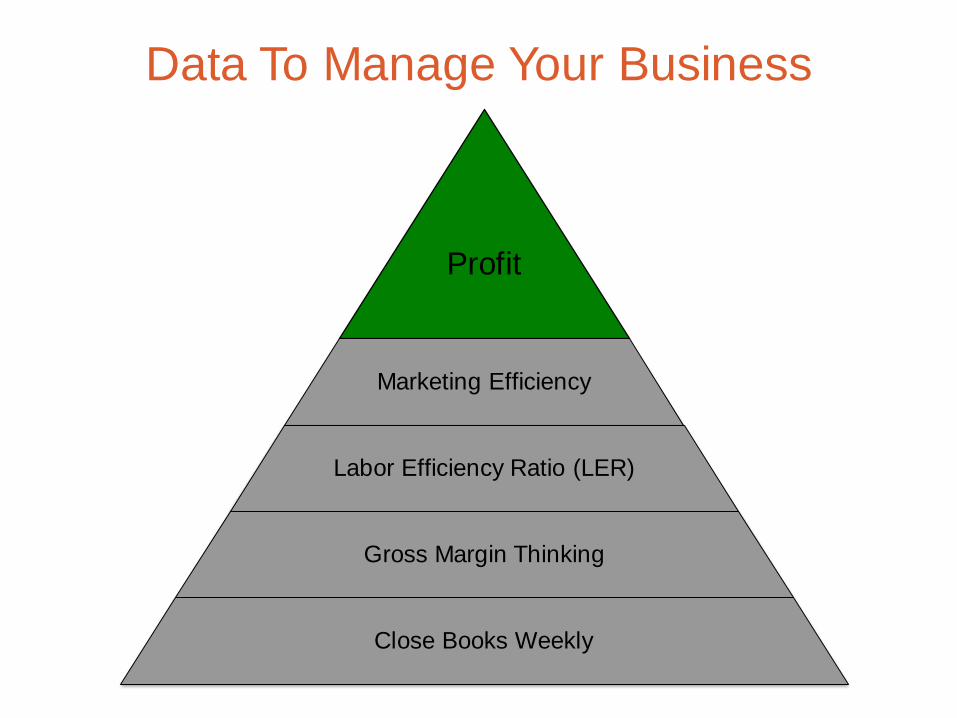
Profit
Marketing Efficiency
Labor Efficiency Ratio (LER)
Gross Margin Thinking
Close Books Weekly
Data To Manage Your Business
www.SimpleNumbers.me
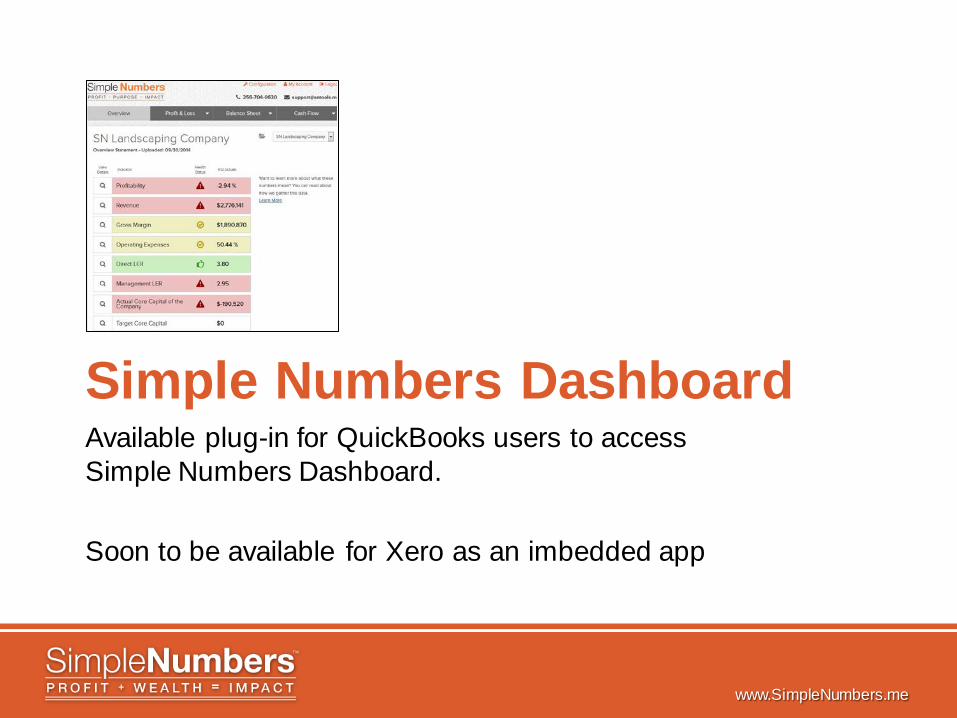
Simple Numbers Dashboard Available plug-in for QuickBooks users to access Simple Numbers Dashboard. Soon to be available for Xero as an imbedded app
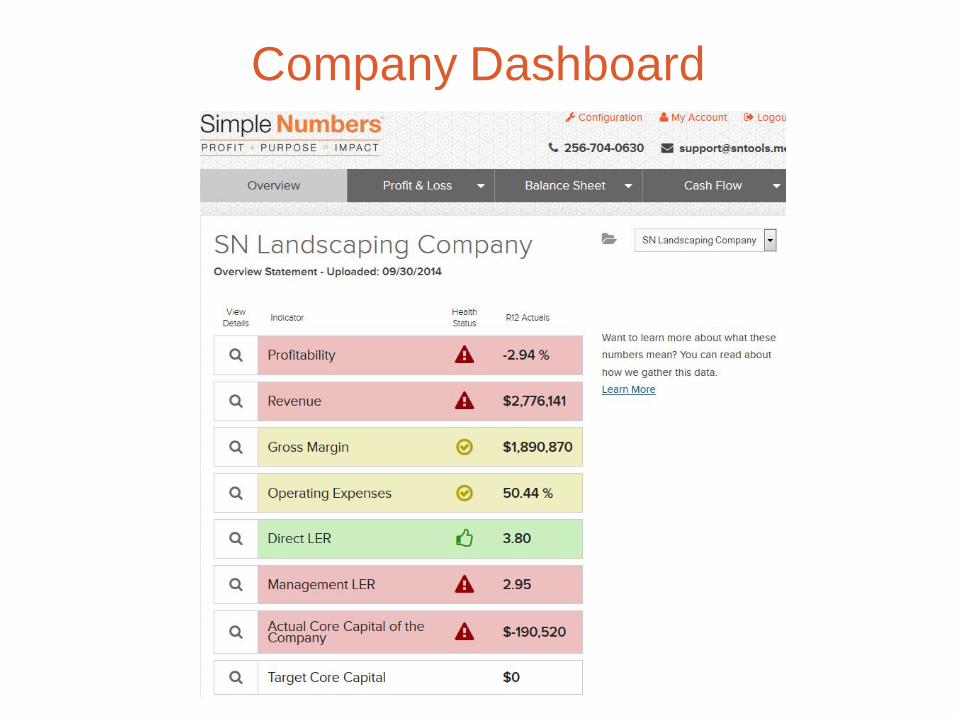
Company Dashboard
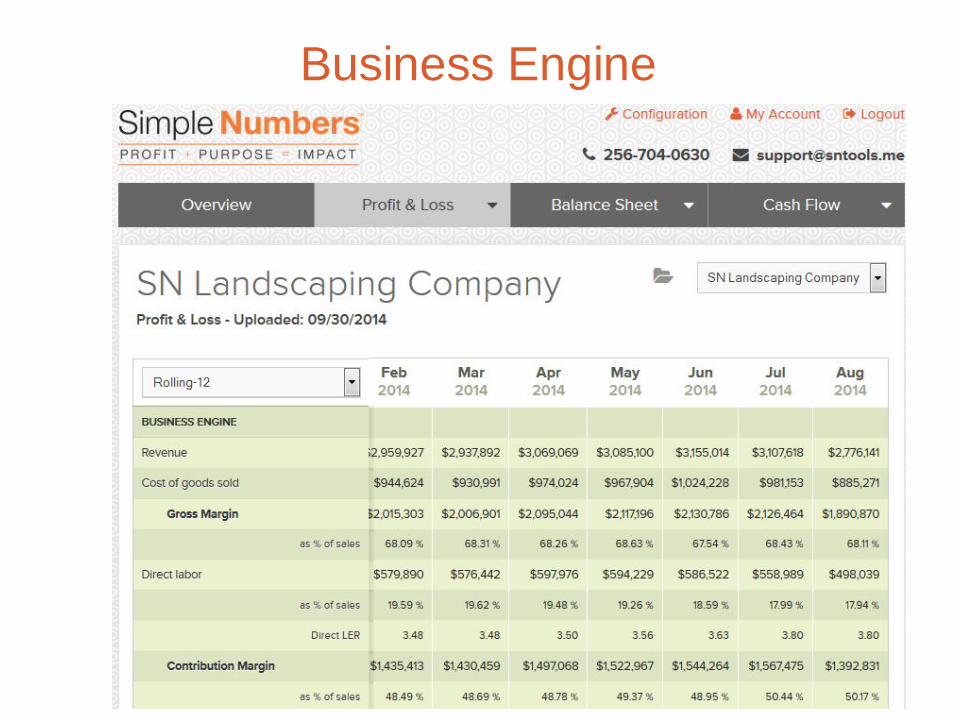
Business Engine
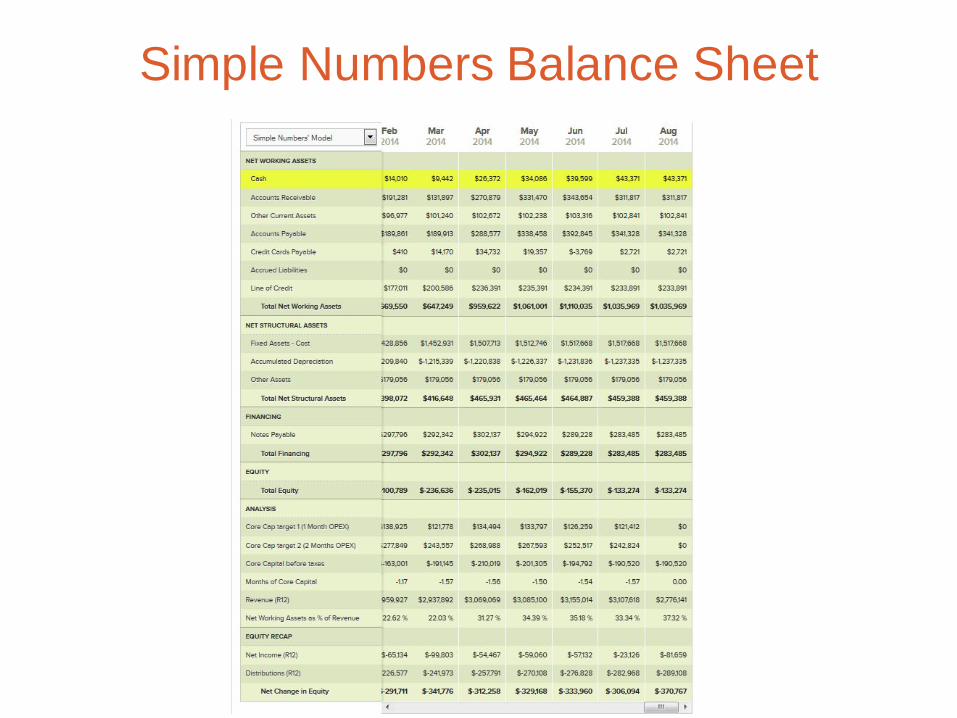
Simple Numbers Balance Sheet
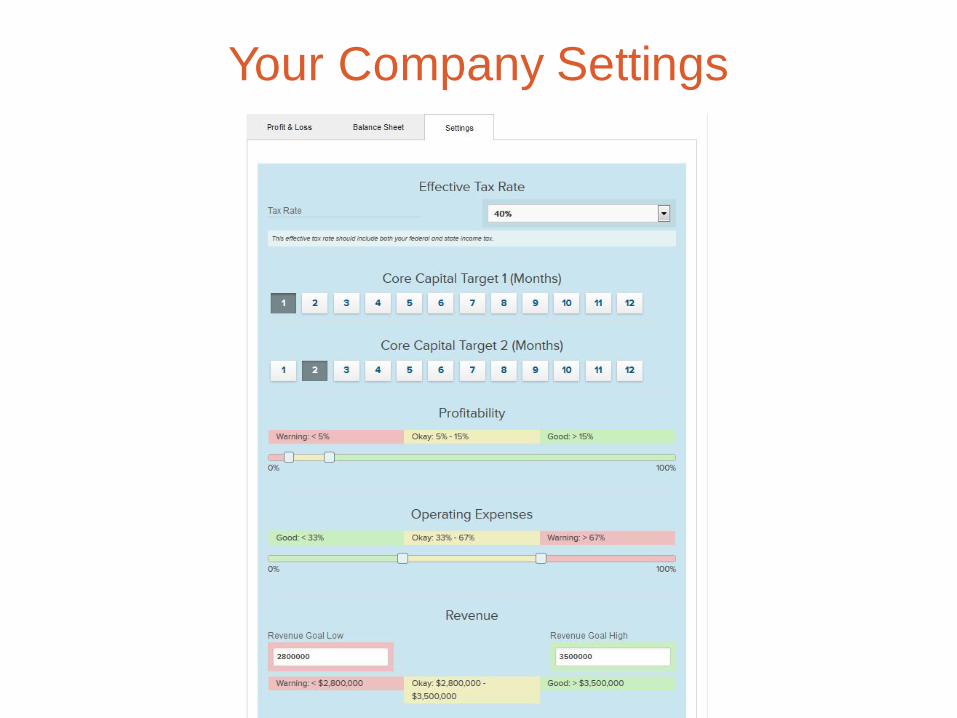
Your Company Settings
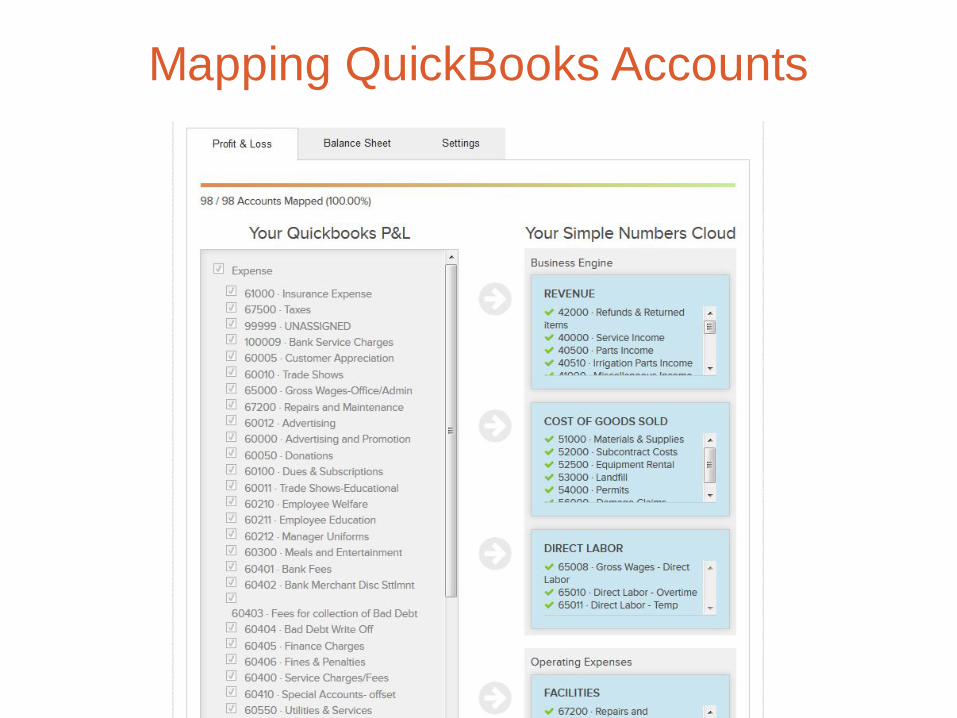
Mapping QuickBooks Accounts
www.SimpleNumbers.me
SimpleNumbers Profit Tool
Works with QuickBooks desktop versions
Soon to be released for Xero
Mapping and consulting packages available
Go to www.simplenumbers.me for pricing and to subscribe