sliding and jumping of single ecorv restriction enzymes on non
TRANSCRIPT
4118–4127 Nucleic Acids Research, 2008, Vol. 36, No. 12 Published online 10 June 2008doi:10.1093/nar/gkn376
Sliding and jumping of single EcoRV restrictionenzymes on non-cognate DNAIsabelle Bonnet1, Andreas Biebricher1, Pierre-Louis Porte1, Claude Loverdo2,
Olivier Benichou2, Raphael Voituriez2, Christophe Escude3, Wolfgang Wende4,
Alfred Pingoud4 and Pierre Desbiolles1,*
1Laboratoire Kastler Brossel, ENS, UPMC-Paris 6, CNRS UMR 8552, 24 rue Lhomond, 2Laboratoire de PhysiqueTheorique de la Matiere Condensee, CNRS UMR 7600, Universite Pierre et Marie Curie-Paris 6, 4 place Jussieu,3Museum National d’Histoire Naturelle, INSERM U565, CNRS UMR 8646, 43 rue Cuvier, F-75005 Paris, Franceand 4Justus-Liebig-Universitat Gießen, Institut fur Biochemie, FB 8, Heinrich-Buff-Ring 58, D-32392 Gießen,Germany
Received February 26, 2008; Revised May 27, 2008; Accepted May 28, 2008
ABSTRACT
The restriction endonuclease EcoRV can rapidlylocate a short recognition site within long non-cognate DNA using ‘facilitated diffusion’. Thisprocess has long been attributed to a slidingmechanism, in which the enzyme first binds to theDNA via nonspecific interaction and then movesalong the DNA by 1D diffusion. Recent studies, how-ever, provided evidence that 3D translocations (hop-ping/jumping) also help EcoRV to locate its targetsite. Here we report the first direct observation ofsliding and jumping of individual EcoRV moleculesalong nonspecific DNA. Using fluorescence micro-scopy, we could distinguish between a slow 1D dif-fusion of the enzyme and a fast translocationmechanism that was demonstrated to stem from3D jumps. Salt effects on both sliding and jumpingwere investigated, and we developed numericalsimulations to account for both the jump frequencyand the jump length distribution. We deduced fromour study the 1D diffusion coefficient of EcoRV, andwe estimated the number of jumps occurring duringan interaction event with nonspecific DNA. Ourresults substantiate that sliding alternates with hop-ping/jumping during the facilitated diffusion ofEcoRV and, furthermore, set up a framework forthe investigation of target site location by otherDNA-binding proteins.
INTRODUCTION
Accelerated target location by site-specific DNA-bindingproteins has motivated numerous experimental and theo-retical studies for over thirty years (1–7). It is now widelyaccepted that, in order to reach their target site, proteinsfirst translocate along nonspecific DNA, i.e. move alongDNA that does not contain any specific site. The mecha-nism underlying this so-called ‘facilitated diffusion’, how-ever, is still under debate. Sliding, a process that involvesa linear diffusion along nonspecific DNA, has long beenconsidered as the main mechanism of facilitated diffusion(8). Apart from allowing proteins to carefully scan theDNA, one-dimensional diffusion, by reducing the dimen-sionality of the space to be explored, can speed up targetsite location compared with 3D search in solution (9,10).Supporting the linear diffusion hypothesis, recent single-molecule experiments, performed both in vitro (11–16) andin vivo (17), have shown that various proteins can slidealong DNA. Alternatively, fast target location can beascribed to hopping/jumping (2,18). Hopping and jump-ing stem from the same mechanism, which involves disso-ciation, 3D diffusion and re-association of the protein tothe same DNA molecule. The distinction between the twoprocesses is based on the location of the re-associationsite, which is either close to the dissociation location(hopping), or far from it (jumping) (2,18). It was realizedearly that re-associations of a protein after dissocia-tion from the DNA are highly probable (2), and, recently,this hypothesis was supported by bulk experimentsdemonstrating a significant contribution of 3D
*To whom correspondence should be addressed. Tel: +33 144 323 380; Fax: +33 144 323 434; Email: [email protected] may also be addressed to Andreas Biebricher. Tel: +33 144 323 455; Fax: +33 144 323 434; Email: [email protected]
The authors wish it to be known that, in their opinion, the first two authors should be regarded as joint First Authors
� 2008 The Author(s)
This is an Open Access article distributed under the terms of the Creative Commons Attribution Non-Commercial License (http://creativecommons.org/licenses/
by-nc/2.0/uk/) which permits unrestricted non-commercial use, distribution, and reproduction in any medium, provided the original work is properly cited.
Dow
nloaded from https://academ
ic.oup.com/nar/article/36/12/4118/1143772 by guest on 05 D
ecember 2021
translocations to target site location (18). Besides, jumpingallows a protein to rapidly reach DNA sites which are farfrom the initial binding site, and thus can be consideredas complementary to sliding, an inefficient mode of search-ing over long distances (19). Hopping/jumping mayalso be more appropriate for an in vivo search, as thelarge number of proteins bound to the DNA makes asliding motion over large distances almost impossible(20). The most effective target search might actually con-sist of a balanced combination of both sliding and hop-ping/jumping, as suggested by recent theoretical studies(21–26). However, in contrast to sliding, 3D translocationshave so far not been observed in single-moleculeexperiments.
Among site-specific DNA-binding proteins, type IIrestriction enzymes are well-suited for the investigationof facilitated diffusion by in vitro kinetic studies (27,28).Specifically, EcoRV has been the subject of intensiveresearch. Translocation of the enzyme from nonspecificDNA to its recognition site was initially attributed to slid-ing (29). This hypothesis was corroborated by experimentsdemonstrating that target location is accelerated if thelength of nonspecific DNA flanking the EcoRV recogni-tion site is increased (30) and by the study of target searchby EcoRV in vivo (31). Sliding is also supported by thecrystal structure of EcoRV in complex with nonspecificDNA (32), in which the enzyme has an open conformationthat sustains the possibility of a linear diffusion along theDNA (33). In addition, facilitated diffusion of EcoRV hasbeen addressed in experiments involving DNA with tworecognition sites in close proximity, the interpretation ofwhich suggested that hopping/jumping plays a major rolein the process (34). However, alternative interpretation ofthe experimental data has been proposed which empha-sized the role of sliding (35). These conflicting conclusionsprobably stem from the use of different models thatinvolve successive stages to describe EcoRV-DNA inter-actions (interaction with nonspecific DNA, association tothe target, cleavage of the DNA and subsequent release
from the substrate), the features of which are not knownin all details. Besides, experimental evidence for hopping/jumping of EcoRV has been provided by recent experi-ments involving a DNA catenane substrate (36).A single-molecule approach is an appealing strategy for
tackling the question of how EcoRV finds its target site.Recently, the interaction of endonucleases with the DNAhas been studied using manipulations of individual DNAmolecules with tweezers (37–39). These experiments, how-ever, relied on measurements of forces and DNA lengthchanges, and therefore are not adapted to investigationsregarding facilitated diffusion. In contrast, fluorescencemicroscopy makes it possible to track a labelled enzymeand to observe its translocation path on a DNA molecule.Moreover, the study of facilitated diffusion by single-molecule fluorescence microscopy is not biased byenzyme cleavage kinetics, whereas biochemical experi-ments usually require DNA cleavage.We report in this article the direct observation of
single fluorescently labelled EcoRV interacting with elon-gated DNA molecules by Total Internal ReflectionFluorescence Microscopy (TIRFM, see Figure 1A). Inorder to investigate solely the facilitated diffusion of theenzyme, we used DNA that does not contain any EcoRVcleavage site. Recording the protein trajectories allowed usto establish the sliding of EcoRV along DNA and todetermine the linear diffusion coefficient of the enzyme.Concurrently, we observed large translocations of the pro-teins along the DNA which were orders of magnitudefaster than expected for sliding. Experiments performedunder flow strongly suggest that these large jumps aredue to free 3D excursions. Furthermore, we performednumerical simulations based on a 3D-diffusion modelwhich accounted for both the frequency and the lengthdistribution of the large jumps. We also performed experi-ments at different salt concentrations, the results of whichindicate that not only large jumps, but also smaller jumpsthat cannot be detected by optical means, may alternatewith sliding phases during DNA–EcoRV interaction.
Cy3B
A BC
D
1 µm
K58C
DNA
DNA
EcoRVevanescentwave
laser
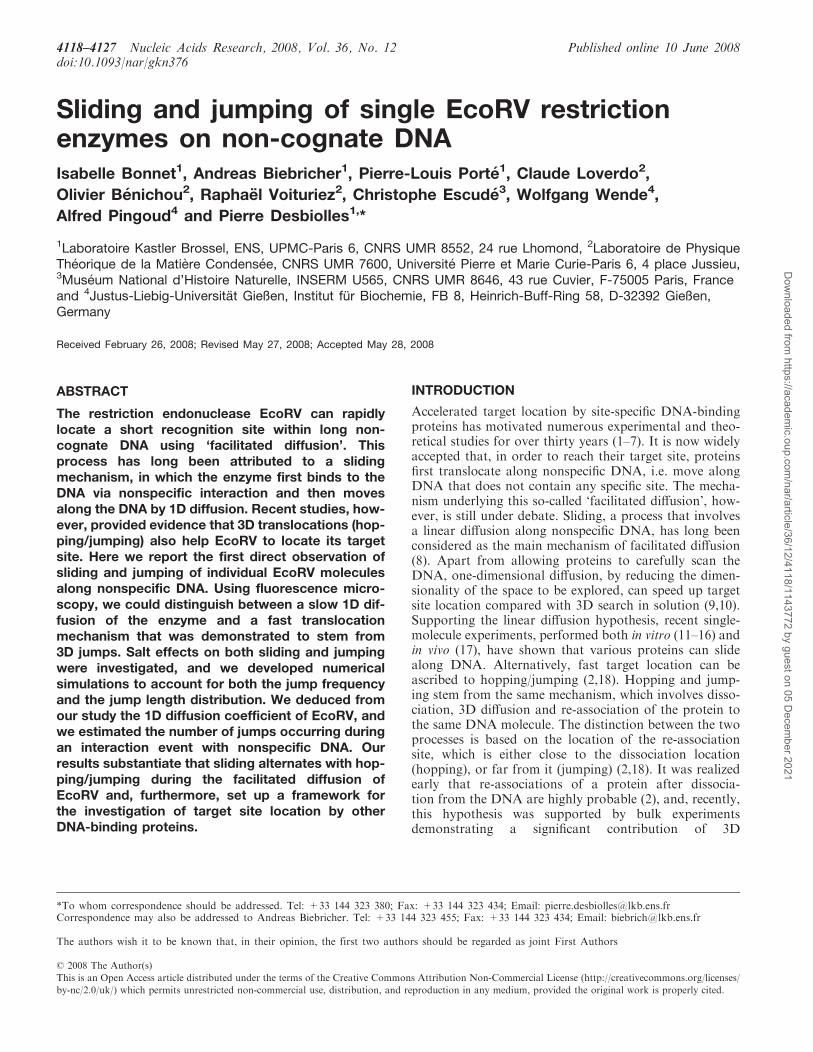
Figure 1. Single-molecule set-up for the study of the facilitated diffusion of EcoRV along nonspecific DNA. (A) Biotinylated DNA molecules areattached at both ends to a streptavidin-coated surface. The molecules are in an elongated conformation, but free to fluctuate. Proteins are visualizedusing Total Internal Reflection Fluorescence Microscopy. (B) EcoRV tertiary structure displaying the Cy3B-labelling performed at position 58,remote from the DNA-binding site. (C) The accumulation of the fluorescence signal of hundreds of enzymes is used to visualize the elongated DNA(movie of duration �150 s, pixel size 126 nm, exposure time 20ms). Note that, for better visualization, the video sequence was recorded at muchhigher enzyme concentration than used during single-molecule experiments. Due to the passivation of the surface, only a few proteins stuck to thesurface, even at high concentration of enzymes. (D) A single frame from the movie depicts four enzymes bound to the DNA. The bright spot in thelower left corner stems from enzyme interactions with a DNA bound by only one end to the surface.
Nucleic Acids Research, 2008, Vol. 36, No. 12 4119
Dow
nloaded from https://academ
ic.oup.com/nar/article/36/12/4118/1143772 by guest on 05 D
ecember 2021

MATERIALS AND METHODS
Enzyme preparation and labelling
Wild type EcoRV is a homodimeric protein that containsone cysteine residue per subunit located close to the coreof the protein. We prepared an EcoRV C21S/K58C var-iant in which the native cysteine residue (C21) was sub-stituted by a serine residue and a single cysteine wasinserted at position 58 (33), far from the active center(Figure 1B). Labelling was achieved using a Cy3B-maleimide Mono-Reactive pack (Amersham Bioscience).Unreacted Cy3B-maleimide was removed using a ZebaMicro desalt Spin column (Pierce). The labelling effici-ency was about 0.4, estimated using e559
Cy3B=1.3� 105M�1 cm�1, e280
Cy3B=1.5� 104M�1 cm�1 ande280
EcoRV=4.84� 104M�1 cm�1. The EcoRV variant aswell as the fluorescent-labelled protein displayed negligibleloss of cleavage activity compared to the wildtype enzyme(data not shown). Observation of labelled enzymesstuck to the surface revealed that photobleaching occurredin a maximal number of two steps, which is consistentwith the presence of one or two dyes on the protein com-plex. Single-molecule measurements were performedat pH 7.5 in 20mM buffer, 10mM MgCl2, 10–60mMNaCl, 1mM DTT and 0.02% v/v blocking reagent(Roche Diagnostics). Experiments were carried out infour different buffers: HEPES (4-(2-Hydroxyethyl)piperazine-1-ethanesulfonic acid), PIPES (1,4-Piperazine-diethanesulfonic acid), PB (sodium phosphate) or Tris(Tris(hydroxymethyl)aminomethane acetate salt), allpurchased from Sigma-Aldrich.
DNA preparation and stretching
T7 bacteriophage DNA (Biocentric), which does not con-tain any recognition site for EcoRV, was cleaved withBsmBI (New England Biolabs). The longest fragment(�8.2 kbp) was ligated to two 500 bp PCR fragments,each containing about 70 biotin-modified uracil bases(Roche Diagnostics), according to a previously publishedmethod (40). Glass coverslips were silanized with 0.1% v/vaminopropyl-triethoxysilane (Sigma Chemical) in acidicethanol. A flow cell was made by adhering, via a parafilmspacer, a silane-coated coverslip to a microscope slide intowhich two holes had been drilled as inlet and outlet.Biotinylated Blocking Reagent (1mg/ml, prepared byreaction of 2 ml of Sulfo-NHS-LC-LC-Biotin (Pierce) at100mg/ml in DMSO with 200 ml of 2mg/ml BlockingReagent (Roche Diagnostics) in PIPES 20mM, NaCl100m, pH 6.8), then streptavidin (0.1mg/ml in PIPES20mM, pH 6.8), were incubated in the cell for 10min.Subsequent incubation of the biotinylated DNA for afew seconds resulted in the attachment of DNA moleculesto the surface by one end. Application of a fast flow(�70 mm/s near the surface) induced the elongation ofthe DNA and the binding of the second biotinylatedDNA end to the surface. The elongated molecules werethen stained with a DNA groove-binding dye (SybrGold,Invitrogen) and observed by fluorescence microscopy. Wefound that the DNA molecules were elongated to about70% of the contour length. Observation of transverse
DNA fluctuations ensured that surface attachmentoccurred solely via the biotinylated ends (41), while themain part of the DNA was freely accessible in solution.Elongated DNA molecules were stable for hours, and wenever observed a detachment of the ends from the surface.In order to reduce nonspecific interactions between theproteins and the surface, residual streptavidin was passiv-ated with biotinylated Blocking Reagent (0.1mg/ml in20mM PIPES, pH 6.8, 50mM NaCl) for 10min.
Optical set-up
The flow cell was placed on an inverted microscope(Olympus IX70) equipped with a 60X oil-immersion objec-tive (NA=1.45, Olympus). After staining, the elongatedDNA molecule were located with the aid of a mercurylamp using appropriate excitation and emission filters(480DF40 and longpass 505 LP, respectively, OmegaOptical). After recording the positions of the elongatedDNAmolecules, the dye was removed for further measure-ments by flushing the flow cell with 2ml of buffer contain-ing 50mM MgCl2. We used TIRFM to detect the labelledenzymes, using for excitation a laser at 532 nm with a lightintensity of 100W/cm2. Fluorescent light was collected viaa dichroic mirror (560DRLP, Omega Optical) in combina-tion with a longpass filter (565ALP, Omega Optical) andimaged on an EMCCDCamera (Ixon, Andor Technology)with a 20ms exposure time. We used a home-made pro-gram written in MatLab to fit the point-spread function ofthe fluorescent spots with a two-dimensional Gaussianfunction, and to derive the Mean Square Displacement(MSD) from the enzyme trajectories.
RESULTS
Single-molecule assay
We attached biotinylated DNA molecules in an elongatedconformation to a streptavidin-coated surface (Figure 1A)using a technique similar to those described in previouspublications (41,42). We used a modified T7 DNA frag-ment (9.2 kbp) which was elongated to 70% of its contourlength. EcoRV was labelled with Cy3B at a specificcysteine residue remote from the active center of the pro-tein (Figure 1B). After injection of the fluorescentlylabeled enzymes in the flow cell, the flow was stopped.At a concentration of EcoRV in the nM range, wedetected several enzymes simultaneously interactingwith the DNA template, while rarely nonspecific interac-tions with the surface were observed (Figure 1C and D,and Supplementary Data 3). However, for single-moleculeanalysis, we reduced the enzyme concentration to 5–20 pMin order to observe, on average, less than one enzyme onthe DNA at a given time (Supplementary Data 4 and 5).The position of the enzyme could be determined in eachframe, thereby allowing us to reconstruct the enzymetrajectory. The localization accuracy, which was limitedby the number of photons accumulated during the expo-sure time (20ms), was about 30 nm (Supplementary Data).We checked that the fluorescence signal was due to asingle enzyme and that the dye used for labelling did notinfluence the enzyme dynamics (Supplementary Data).
4120 Nucleic Acids Research, 2008, Vol. 36, No. 12
Dow
nloaded from https://academ
ic.oup.com/nar/article/36/12/4118/1143772 by guest on 05 D
ecember 2021
At low NaCl concentration (10mM), single enzymes inter-acted with the DNA on a time-scale of seconds, yieldinglong enzyme trajectories (typically more than 50 frames).An interaction event ended when we could not detectthe enzyme for more than two consecutive frames, eitherbecause the enzyme dissociated from the DNA or becauseof the photobleaching of the dye. We considered forfurther analysis only interaction events longer than 30frames (600ms). The mean time between two consecutiveinteraction events was about 5–10 s. Since ensemble mea-surements had indicated an effect of the buffer on thecleavage kinetics (43), experiments were performed atpH 7.5 with four different buffers: HEPES, PIPES,sodium phosphate (PB) and Tris. For each buffer werecorded hundreds of DNA–EcoRV interaction events.
Sliding of EcoRV
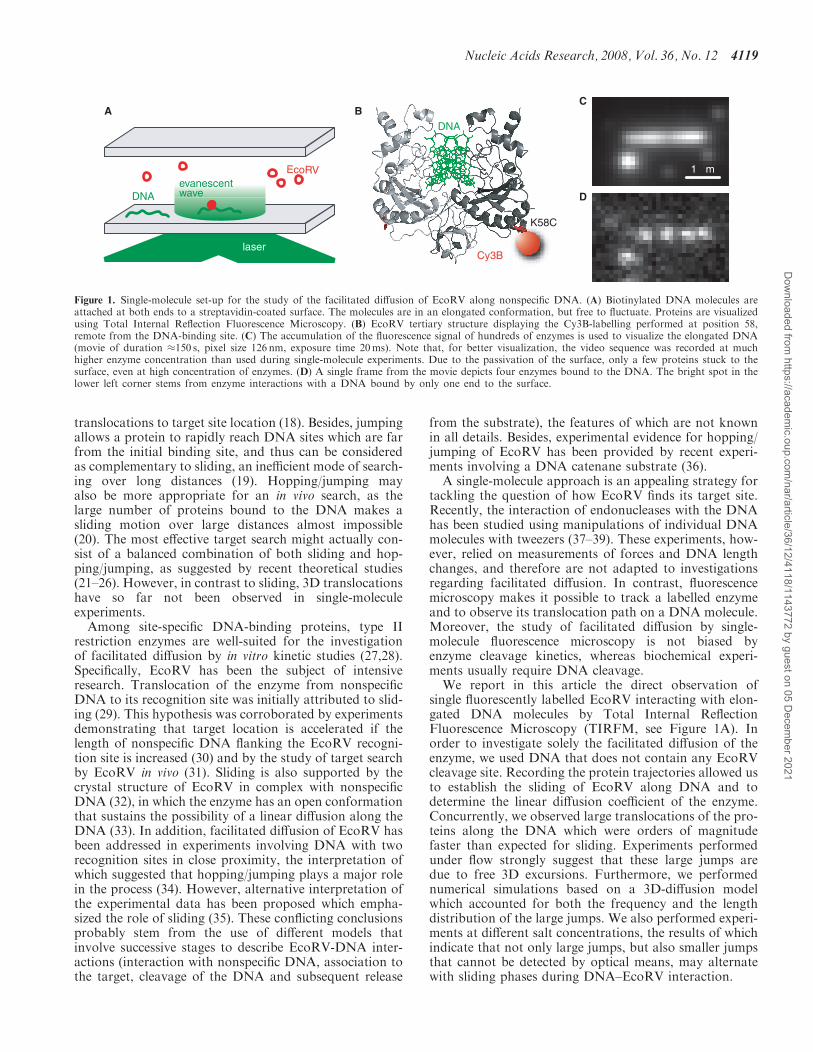
A typical single enzyme trajectory is shown in Figure 2A,which displays both the longitudinal (i.e. along the DNA)
and transverse (i.e. perpendicular to the DNA and withinthe focal plane) positions of the enzyme as a function oftime. Two processes contribute to the variations of thelongitudinal position of the enzymes: the motion alongthe DNA and the thermal fluctuations of the elongatedDNA template (Figure 2A). For each interaction event,we computed the MSD versus time of the enzyme to dis-criminate between sliding and DNA fluctuations (seeSupplementary Data for the calculation of the MSD).The longitudinal and the transverse MSD calculatedfrom a single enzyme trajectory are displayed inFigure 2B. While the transverse MSD is constant, thelongitudinal MSD depends linearly on time, as expectedfor an enzyme sliding along DNA (12–15). The thermalfluctuations of the DNA only contribute as additionaloffsets to the MSD curves, since the exposure time(20ms) is much larger than the correlation time of thetransverse and longitudinal fluctuations, in the ms range(Supplementary Data). We used the time dependence ofthe longitudinal MSD and the value of the transverse
Y (
mm)
X (
mm)
A
0 2 4 6
2.3
2.5
2.7
−0.1
0.1
Time (s) Time (s)
MS
D (
10−3
mm
2 )B
0 1 20
5
10
15
20
D
0.0 0.2 0.4 0.6 0.8 1.0
0
2
4
6
8
Time (s)
MS
D (
10−3
mm
2 )
0 2 4 6 80.00
0.04
0.08
0.12
0.16
0.20C
Fre
qu
ency
D1 (10−2 mm2.s−1)
Figure 2. 1D diffusion of EcoRV along elongated DNA. (A) Trajectory of a single enzyme interacting with an elongated DNA molecule, alignedalong the X direction. The largest variations of the enzyme position are seen along the DNA, for the linear diffusion in this direction superimposeswith the DNA thermal fluctuations. The trajectory was recorded in PIPES buffer. (B) Mean Square Displacement (MSD) derived from the previoustrajectory. The longitudinal MSD (red) depends linearly on time, displaying the sliding of the enzyme along the DNA. The linear diffusion constantD1 is deduced from the slope of the curve (2D1=10�2 mm2/s). In contrast, the transverse MSD (black) is constant, since the transverse motion of theenzyme is confined. (C) Distributions of linear diffusion coefficients in PIPES (green, 266 events) and Tris (black, 379 events). The values werededuced from the MSD of individual trajectories longer than 600ms (30 frames). (D) MSD averaged over individual trajectories in PIPES (green)and in Tris (black).
Nucleic Acids Research, 2008, Vol. 36, No. 12 4121
Dow
nloaded from https://academ
ic.oup.com/nar/article/36/12/4118/1143772 by guest on 05 D
ecember 2021

MSD (generally larger than 2� 10�3 mm2) to discriminateenzymes interacting with the DNA from the enzymessticking occasionally to the surface near the DNA,since in the last case both the longitudinal and transverseMSD are constant and below 10�3 mm2 (SupplementaryData). For each interaction event, the diffusion constantDl was derived from the slope of the linearly fittedlongitudinal MSD curve after correction for the DNAstretch rate (see Supplementary Data for the detail ofthe derivation of Dl). The histograms of D1 deducedfrom single-molecule trajectories in PIPES and Tris aredisplayed in Figure 2C. For each buffer, we calculatedthe MSD averaged over all the analysed events(Figure 2D and Supplementary Data for the detail of thecalculation). We obtained D1=1.1� 0.2� 10�2 mm2/s inPIPES (266 events) and 0.9� 0.2� 10�2 mm2/s in Tris(379 events). Similar diffusion constants were found inPB (0.9� 0.2� 10�2 mm2/s, 740 events) and HEPES(1.2� 0.3� 10�2 mm2/s, 162 events) (data not shown).These results show that the diffusion constant D1 dependsonly weakly on the buffer.
Jumps of EcoRV along DNA
Some enzyme trajectories along the DNA exhibited largesteps (up to 1.8 mm) within two consecutive frames (40ms)
(Figure 3A and B, and Supplementary Data 2, 6 and 7).Large steps were observed with equal probability in bothdirections. We focussed on steps larger than 200 nm,which are easy to detect since their lengths are largerthan both the optical resolution of the microscope andthe amplitude of longitudinal fluctuations in the enzymetrajectories before and after the step. The frequency ofsuch large steps, i.e. the number of large steps per inter-action event, ranged from 6% in HEPES to 16% in Tris.This frequency is difficult to explain considering a slidingmotion with D1� 10�2 mm2/s. Indeed, the mean length hlicovered within �T=40ms in a 1D Brownian motion ishli ¼
ffiffiffiffiffiffiffiffiffiffiffiffiffiffiffiffi
2D1�Tp
� 30 nm, and a statistical analysis of thedistribution of the lengths l reveals that, regarding thisvalue of hli, the probability of observing steps largerthan 200 nm is extremely small (Supplementary Data).Therefore, these steps, which from now on will be called‘large jumps’, were attributed to a translocation mecha-nism which differs from sliding. Large jumps cannot stemfrom a second enzyme associating immediately after dis-sociation of the first because, considering the associationfrequency of EcoRV with the DNA under our experimen-tal conditions (5–10 per min), we estimated the probabilityof such an event to be smaller than 1% (SupplementaryData). Likewise, large jumps are unlikely to be due totransfers from the DNA to the surface or vice versa,since we could discriminate, via the MSD curves, enzymesinteracting with the DNA from those stuck to the surface.
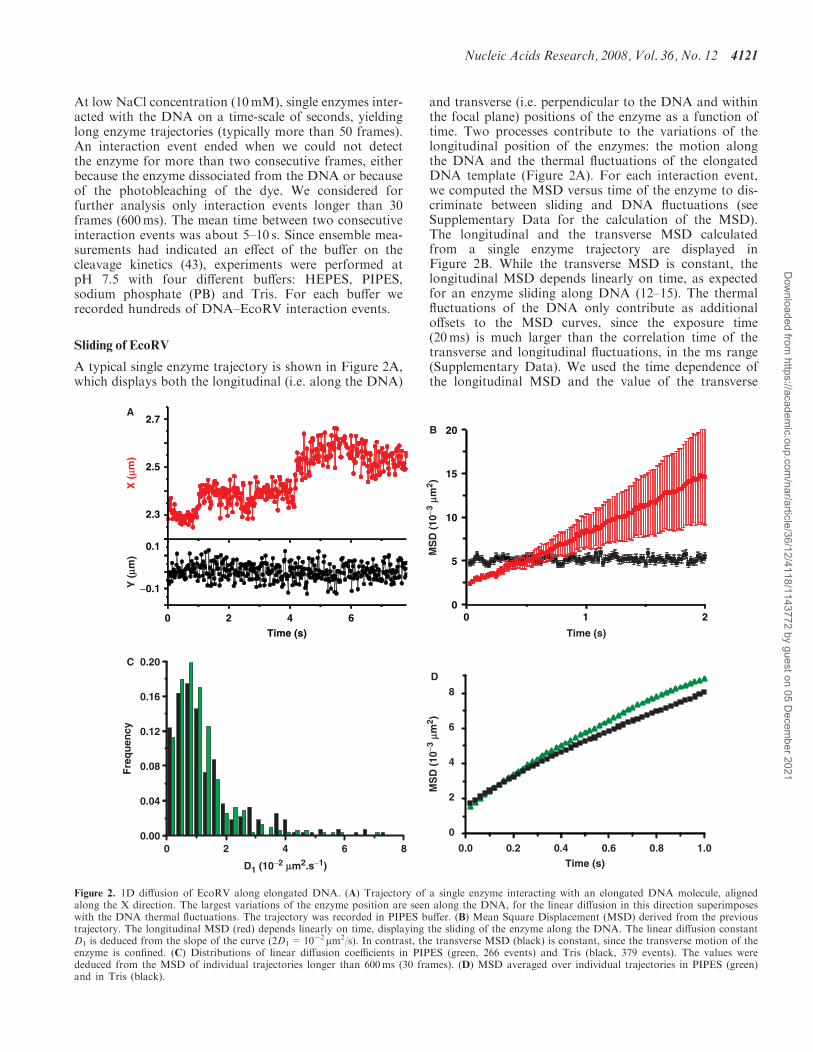
The lengths of the large jumps in different buffers aredisplayed in Figure 4A using normalized complementarycumulative distributions, which give the probability ofobserving jumps of length s or larger as a function of sduring an interaction event. We chose to use complemen-tary cumulative distributions because we focussed on largejumps and such distributions do not depend on the dis-tribution of possible smaller jumps. In contrast to ourresults regarding the diffusion constant D1, the occurrenceof large jumps as well as the jump length distributionsshow a noticeable dependence on the buffer (Figure 4A).For PIPES, we found 26 jumps in 266 events (10%) com-pared to 59 jumps in 379 events for Tris (16%). The jumplength distribution follows a similar trend with more than50% of the large jumps spanning more than 500 nm inTris, while only less than one third beyond this lengthare found in PIPES. The influence of the buffer on jumpoccurrence and distribution are further illustrated by theresults obtained in HEPES (10 jumps in 162 events, i.e.6%) and PB (109 in 740 events, i.e. 15%). Note that, inorder to prevent alteration of the estimation of D1 by thelarge jumps, the events that contained such a translocationwere split into two trajectories (before and after the largejump), which were treated as independent events for thedetermination of D1.
Experiments under flow
The observation of large jumps in our experiments denotesthe existence of a fast translocation mechanism of theenzyme which differs from sliding. A probable mechanisminvolves dissociation of the enzyme from the DNA fol-lowed by re-association after a 3D diffusion. Since the
0.0 0.6 1.2 1.8
0.6
1.2
1.8
−0.1
0.1
0.0 0.1 0.2 0.3 0.4
2
4
Time (s)
3
6
9before jumpafter jump
Time (s)
1
45
23
46
47
48
68
90
A B
C
X (
mm)
MS
Dx
(10−3
mm
2 )M
SD
yY
(mm
)
Figure 3. Jump of a single EcoRV along elongated DNA. (A) Duringthe interaction of EcoRV with elongated DNA, a large and fast trans-location occurs between frames 46 and 47 (numbers indicate thelocation of the frames in the video sequence, dotted circles indicatethe DNA ends). (B) A jump of about 1300 nm is detected in theX-trajectory of the enzyme. The length of the jump is much largerthan the mean translocation associated with sliding within oneframe (20 nm within 20ms). (C) The longitudinal MSD calculatedbefore (0–0.9 s) and after (0.9–1.8 s) the jump display 1D diffusionsimilar to that observed during events without large jumps. Values ofthe diffusion constant are 0.34� 10�2 and 0.54� 10�2 mm2/s, respec-tively. The large amplitude of the transverse MSD confirms that theenzyme was interacting with the DNA before and after the jump.
4122 Nucleic Acids Research, 2008, Vol. 36, No. 12
Dow
nloaded from https://academ
ic.oup.com/nar/article/36/12/4118/1143772 by guest on 05 D
ecember 2021
3D diffusion coefficient D3 for EcoRV is about 50 mm2/s(see below), the distance covered by 3D motion within40ms can be in the mm range, and thus 3D diffusionmay account for the values observed for the length ofthe large jumps. In principle, another mechanism couldinvolve a fast 1D diffusion in which the enzyme staysbound to the DNA during a fast translocation. Todiscriminate between 1D and 3D mechanism, we modifiedthe experimental set-up to apply a flow of enzyme solutionperpendicular to the elongated DNA. The 3D movementof the enzyme and thus the jump lengths are likely to beaffected by the drag of the flow, while it is not expected toinfluence a fast 1D diffusion during which EcoRV remainsfirmly bound to the DNA. Flow experiments were carriedout in Tris, in which we previously observed the mostfrequent and largest jumps. When a flow of velocityv=70 mm/s was applied (see Supplementary Data for anestimation of the flow velocity), the number of jumps perevent was reduced to about one half, i.e. jumps larger than200 nm were observed in only 8% of the interaction events(39 jumps per 470 events) compared to 16% without flow(59 jumps in 379 events). In addition, the jump distribu-tion was significantly shifted to smaller jump lengths, suchthat only 10% of the recorded jumps were longer than700 nm compared to 30% in the experiments withoutflow (Figure 4B). The shift towards smaller jump lengthscan be qualitatively accounted for by a simple 3D diffu-sion model that estimates the length of the jumps affectedby the flow. For this purpose, we calculated the distance lDcovered by 3D diffusion during a time t, lD�
ffiffiffiffiffiffiffiffiffi
D3 tp
, andthe drift lv due to the flow during the same time, lv= vt.The time after which the drift overcomes the diffusion(i.e, lv> lD) is approximately D3/v
2. Thus, the distributionof the jump lengths is significantly affected for lengthslarger than D3/v� 700 nm, as observed experimentally.These results provide strong evidence that the largejumps are due to a 3D translocation of the enzymes.
Effect of increasing salt concentration
Changes in ionic conditions are known to modify thekinetics of DNA–protein interactions. In particular, anincrease of the concentration of monovalent ions hasbeen shown to strongly decrease the DNA–protein inter-action time, while the rate of association to nonspecificDNA is only moderately affected (44). Salt changes arethus expected to affect the relative roles of slidingand hopping/jumping in facilitated diffusion (2,45)(Supplementary Data).In order to address the effect of ionic conditions on
EcoRV sliding and jumping, we performed experimentsat NaCl concentrations ranging from 10mM to 60mM,the latter [NaCl] providing an ionic strength (�110mM)comparable to physiological conditions. Salt-dependentexperiments were carried out in PIPES. For each [NaCl],we recorded hundreds of interaction events, from whichwe derived the mean DNA–EcoRV interaction time(see Supplementary Data for details). As expected, theinteraction time was strongly reduced with increasing[NaCl] (Figure 5C), ranging from 4.4� 1 s at 10mMNaCl to 0.3� 0.1 s at 60mM NaCl.
jumps length (µm)
cum
ula
tive
A
jumps length (µm)
cum
ula
tive
cum
ula
tive
B
C
jumps length (µm)
0.3 0.6 0.9 1.2 1.5 1.8
HEPES PIPES PB TRIS
0.02
0.04
0.06
0.08
0.10
0.12
0.14
0.16
0.00
0.3 0.6 0.9 1.2 1.5
0.02
0.04
0.06
0.08
0.10
0.12
0.14
0.16
0.00
0 0.3 0.6 0.9 1.2 1.5
0.01
0.1
1
0 0.3 0.6 0.9 1.2 1.5
0.01
0.1
1
10
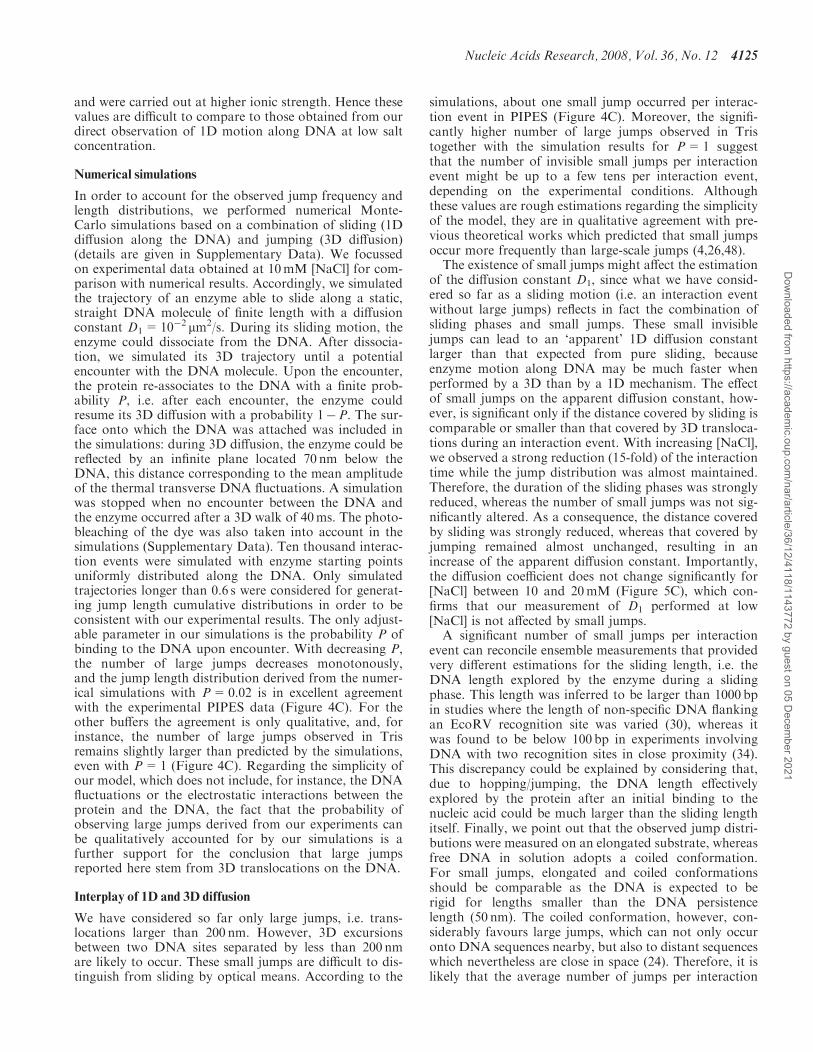
Figure 4. Complementary cumulative distributions of the jump lengths.(A) Cumulative jump length distributions in different buffers: Tris(black), PB (green), PIPES (blue) and HEPES (orange). From Tris toHEPES, the probability of observing a large jump (i.e. larger than200 nm) within an interaction event decreases significantly. The distri-butions were normalized by dividing the number of observed jumps ininteraction events longer than 600ms (30 frames) by the number ofthese events. (B) The jump distribution in Tris buffer (black) is stronglyaffected by a flow applied perpendicular to the elongated DNA. Therelative number of jumps drops from 0.16 to 0.08 and, under flow,the jump length distribution is shifted to smaller jumps (grey).(C) Cumulative jump length distribution provided by numerical simula-tions with P=0.02 (red) fit the experimental jump length distributionin PIPES (blue), and predict about 1 jump per interaction event. Insetshows the number of large jumps in Tris (black), which remains higherthan predicted by the simulations, even with P=1 (green).
Nucleic Acids Research, 2008, Vol. 36, No. 12 4123
Dow
nloaded from https://academ
ic.oup.com/nar/article/36/12/4118/1143772 by guest on 05 D
ecember 2021
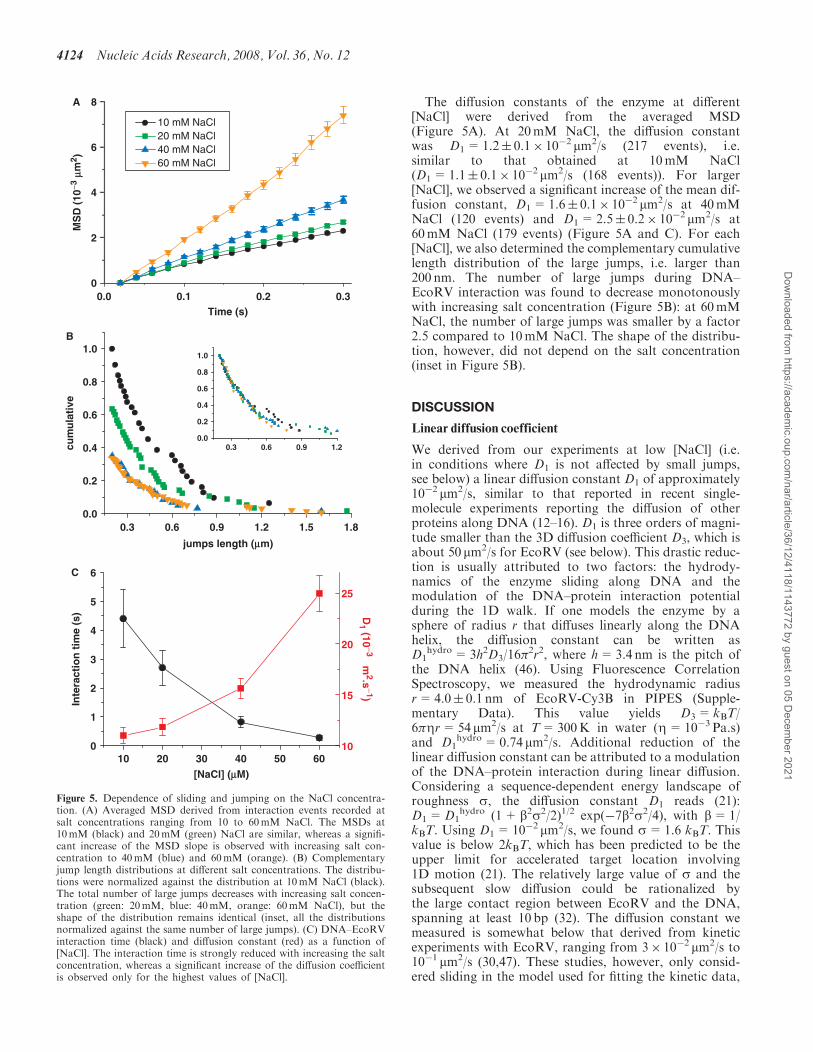
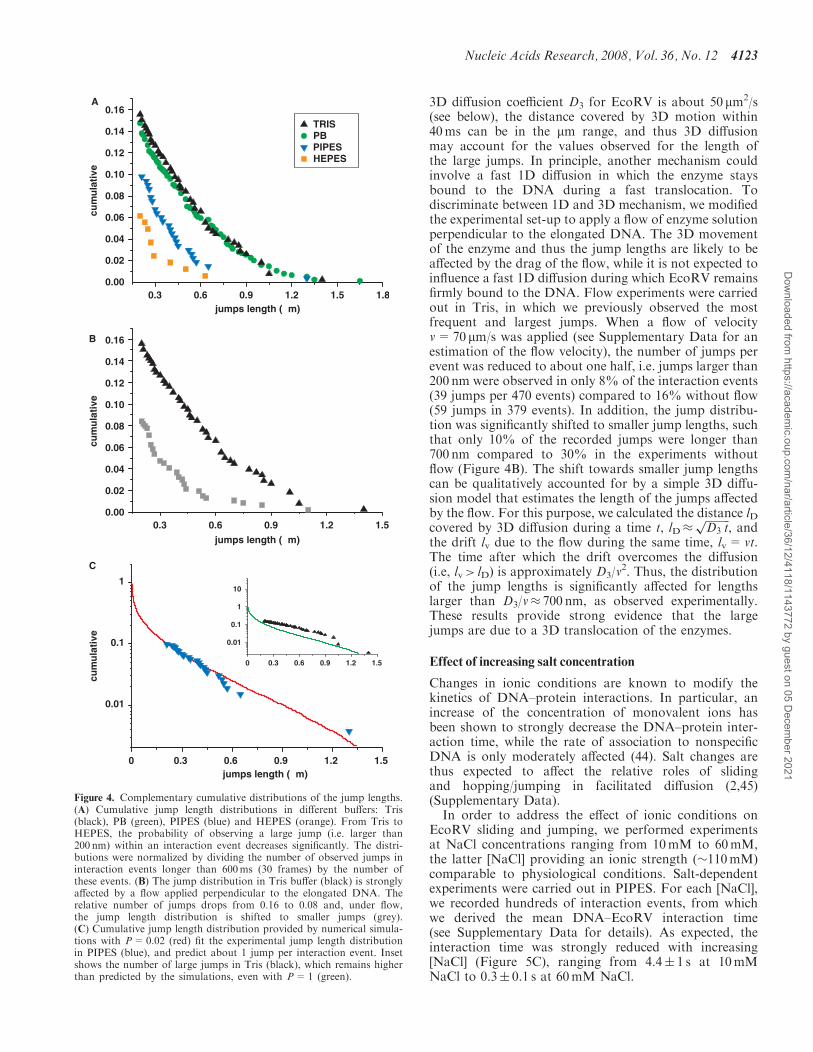
The diffusion constants of the enzyme at different[NaCl] were derived from the averaged MSD(Figure 5A). At 20mM NaCl, the diffusion constantwas D1=1.2� 0.1� 10�2 mm2/s (217 events), i.e.similar to that obtained at 10mM NaCl(D1=1.1� 0.1� 10�2 mm2/s (168 events)). For larger[NaCl], we observed a significant increase of the mean dif-fusion constant, D1=1.6� 0.1� 10�2 mm2/s at 40mMNaCl (120 events) and D1=2.5� 0.2� 10�2 mm2/s at60mM NaCl (179 events) (Figure 5A and C). For each[NaCl], we also determined the complementary cumulativelength distribution of the large jumps, i.e. larger than200 nm. The number of large jumps during DNA–EcoRV interaction was found to decrease monotonouslywith increasing salt concentration (Figure 5B): at 60mMNaCl, the number of large jumps was smaller by a factor2.5 compared to 10mM NaCl. The shape of the distribu-tion, however, did not depend on the salt concentration(inset in Figure 5B).
DISCUSSION
Linear diffusion coefficient
We derived from our experiments at low [NaCl] (i.e.in conditions where D1 is not affected by small jumps,see below) a linear diffusion constant D1 of approximately10�2 mm2/s, similar to that reported in recent single-molecule experiments reporting the diffusion of otherproteins along DNA (12–16). D1 is three orders of magni-tude smaller than the 3D diffusion coefficient D3, which isabout 50 mm2/s for EcoRV (see below). This drastic reduc-tion is usually attributed to two factors: the hydrody-namics of the enzyme sliding along DNA and themodulation of the DNA–protein interaction potentialduring the 1D walk. If one models the enzyme by asphere of radius r that diffuses linearly along the DNAhelix, the diffusion constant can be written asD1
hydro=3h2D3/16�2r2, where h=3.4 nm is the pitch of
the DNA helix (46). Using Fluorescence CorrelationSpectroscopy, we measured the hydrodynamic radiusr=4.0� 0.1 nm of EcoRV-Cy3B in PIPES (Supple-mentary Data). This value yields D3= kBT/6�Zr=54 mm2/s at T=300K in water (Z=10�3 Pa.s)and D1
hydro=0.74 mm2/s. Additional reduction of thelinear diffusion constant can be attributed to a modulationof the DNA–protein interaction during linear diffusion.Considering a sequence-dependent energy landscape ofroughness s, the diffusion constant D1 reads (21):D1=D1
hydro (1+ b2s2/2)1/2 exp(�7b2s2/4), with b=1/kBT. Using D1=10�2 mm2/s, we found s=1.6 kBT. Thisvalue is below 2kBT, which has been predicted to be theupper limit for accelerated target location involving1D motion (21). The relatively large value of s and thesubsequent slow diffusion could be rationalized bythe large contact region between EcoRV and the DNA,spanning at least 10 bp (32). The diffusion constant wemeasured is somewhat below that derived from kineticexperiments with EcoRV, ranging from 3� 10�2 mm2/s to10�1 mm2/s (30,47). These studies, however, only consid-ered sliding in the model used for fitting the kinetic data,
0.0 0.1 0.2 0.30
2
4
6
8
10 mM NaCl 20 mM NaCl 40 mM NaCl 60 mM NaCl
MS
D (
10−3
mm
2 )
Time (s)
0.3 0.6 0.9 1.2 1.5 1.80.0
0.2
0.4
0.6
0.8
1.0
cum
ula
tive
jumps length (mm)
[NaCl] (mM)
D1 (10
−3 µm2.s
−1)
Inte
ract
ion
tim
e (s
)
0.3 0.6 0.9 1.20.0
0.2
0.4
0.6
0.8
1.0
A
B
C
10 20 30 40 50 600
1
2
3
4
5
6
10
15
20
25
Figure 5. Dependence of sliding and jumping on the NaCl concentra-tion. (A) Averaged MSD derived from interaction events recorded atsalt concentrations ranging from 10 to 60mM NaCl. The MSDs at10mM (black) and 20mM (green) NaCl are similar, whereas a signifi-cant increase of the MSD slope is observed with increasing salt con-centration to 40mM (blue) and 60mM (orange). (B) Complementaryjump length distributions at different salt concentrations. The distribu-tions were normalized against the distribution at 10mM NaCl (black).The total number of large jumps decreases with increasing salt concen-tration (green: 20mM, blue: 40mM, orange: 60mM NaCl), but theshape of the distribution remains identical (inset, all the distributionsnormalized against the same number of large jumps). (C) DNA–EcoRVinteraction time (black) and diffusion constant (red) as a function of[NaCl]. The interaction time is strongly reduced with increasing the saltconcentration, whereas a significant increase of the diffusion coefficientis observed only for the highest values of [NaCl].
4124 Nucleic Acids Research, 2008, Vol. 36, No. 12
Dow
nloaded from https://academ
ic.oup.com/nar/article/36/12/4118/1143772 by guest on 05 D
ecember 2021
and were carried out at higher ionic strength. Hence thesevalues are difficult to compare to those obtained from ourdirect observation of 1D motion along DNA at low saltconcentration.
Numerical simulations
In order to account for the observed jump frequency andlength distributions, we performed numerical Monte-Carlo simulations based on a combination of sliding (1Ddiffusion along the DNA) and jumping (3D diffusion)(details are given in Supplementary Data). We focussedon experimental data obtained at 10mM [NaCl] for com-parison with numerical results. Accordingly, we simulatedthe trajectory of an enzyme able to slide along a static,straight DNA molecule of finite length with a diffusionconstant D1=10�2 mm2/s. During its sliding motion, theenzyme could dissociate from the DNA. After dissocia-tion, we simulated its 3D trajectory until a potentialencounter with the DNA molecule. Upon the encounter,the protein re-associates to the DNA with a finite prob-ability P, i.e. after each encounter, the enzyme couldresume its 3D diffusion with a probability 1�P. The sur-face onto which the DNA was attached was included inthe simulations: during 3D diffusion, the enzyme could bereflected by an infinite plane located 70 nm below theDNA, this distance corresponding to the mean amplitudeof the thermal transverse DNA fluctuations. A simulationwas stopped when no encounter between the DNA andthe enzyme occurred after a 3D walk of 40ms. The photo-bleaching of the dye was also taken into account in thesimulations (Supplementary Data). Ten thousand interac-tion events were simulated with enzyme starting pointsuniformly distributed along the DNA. Only simulatedtrajectories longer than 0.6 s were considered for generat-ing jump length cumulative distributions in order to beconsistent with our experimental results. The only adjust-able parameter in our simulations is the probability P ofbinding to the DNA upon encounter. With decreasing P,the number of large jumps decreases monotonously,and the jump length distribution derived from the numer-ical simulations with P=0.02 is in excellent agreementwith the experimental PIPES data (Figure 4C). For theother buffers the agreement is only qualitative, and, forinstance, the number of large jumps observed in Trisremains slightly larger than predicted by the simulations,even with P=1 (Figure 4C). Regarding the simplicity ofour model, which does not include, for instance, the DNAfluctuations or the electrostatic interactions between theprotein and the DNA, the fact that the probability ofobserving large jumps derived from our experiments canbe qualitatively accounted for by our simulations is afurther support for the conclusion that large jumpsreported here stem from 3D translocations on the DNA.
Interplay of 1D and 3D diffusion
We have considered so far only large jumps, i.e. trans-locations larger than 200 nm. However, 3D excursionsbetween two DNA sites separated by less than 200 nmare likely to occur. These small jumps are difficult to dis-tinguish from sliding by optical means. According to the
simulations, about one small jump occurred per interac-tion event in PIPES (Figure 4C). Moreover, the signifi-cantly higher number of large jumps observed in Tristogether with the simulation results for P=1 suggestthat the number of invisible small jumps per interactionevent might be up to a few tens per interaction event,depending on the experimental conditions. Althoughthese values are rough estimations regarding the simplicityof the model, they are in qualitative agreement with pre-vious theoretical works which predicted that small jumpsoccur more frequently than large-scale jumps (4,26,48).The existence of small jumps might affect the estimation
of the diffusion constant D1, since what we have consid-ered so far as a sliding motion (i.e. an interaction eventwithout large jumps) reflects in fact the combination ofsliding phases and small jumps. These small invisiblejumps can lead to an ‘apparent’ 1D diffusion constantlarger than that expected from pure sliding, becauseenzyme motion along DNA may be much faster whenperformed by a 3D than by a 1D mechanism. The effectof small jumps on the apparent diffusion constant, how-ever, is significant only if the distance covered by sliding iscomparable or smaller than that covered by 3D transloca-tions during an interaction event. With increasing [NaCl],we observed a strong reduction (15-fold) of the interactiontime while the jump distribution was almost maintained.Therefore, the duration of the sliding phases was stronglyreduced, whereas the number of small jumps was not sig-nificantly altered. As a consequence, the distance coveredby sliding was strongly reduced, whereas that covered byjumping remained almost unchanged, resulting in anincrease of the apparent diffusion constant. Importantly,the diffusion coefficient does not change significantly for[NaCl] between 10 and 20mM (Figure 5C), which con-firms that our measurement of D1 performed at low[NaCl] is not affected by small jumps.A significant number of small jumps per interaction
event can reconcile ensemble measurements that providedvery different estimations for the sliding length, i.e. theDNA length explored by the enzyme during a slidingphase. This length was inferred to be larger than 1000 bpin studies where the length of non-specific DNA flankingan EcoRV recognition site was varied (30), whereas itwas found to be below 100 bp in experiments involvingDNA with two recognition sites in close proximity (34).This discrepancy could be explained by considering that,due to hopping/jumping, the DNA length effectivelyexplored by the protein after an initial binding to thenucleic acid could be much larger than the sliding lengthitself. Finally, we point out that the observed jump distri-butions were measured on an elongated substrate, whereasfree DNA in solution adopts a coiled conformation.For small jumps, elongated and coiled conformationsshould be comparable as the DNA is expected to berigid for lengths smaller than the DNA persistencelength (50 nm). The coiled conformation, however, con-siderably favours large jumps, which can not only occuronto DNA sequences nearby, but also to distant sequenceswhich nevertheless are close in space (24). Therefore, it islikely that the average number of jumps per interaction
Nucleic Acids Research, 2008, Vol. 36, No. 12 4125
Dow
nloaded from https://academ
ic.oup.com/nar/article/36/12/4118/1143772 by guest on 05 D
ecember 2021
event is significantly larger for coiled DNA than forelongated DNA (38).In summary, we report here the first direct observation
of sliding and jumping for individual EcoRV enzymesinteracting with nonspecific DNA. Our investigationregarding both 1D Brownian motion (sliding) and3D translocations (jumping), combined with numericalsimulations and salt-dependent experiments, allowed usto quantitatively estimate the respective part of thesetwo processes in the facilitated diffusion of EcoRVunder our experimental conditions. As far as we know, ajumping process has never been directly observed earlierwith any DNA-binding protein, although it was postu-lated in many previously published experimental andtheoretical studies. The contribution of hopping/jumpingto facilitated diffusion, however, might differ from proteinto protein, depending on both the structure and thebiological function of the protein.The small jumps that are inferred from our study can
answer the problem of target search within a crowdedenvironment (20) as they enable the enzyme to bypassobstacles of typical protein size that could block sliding.On the other hand, large jumps favour the explorationof distant DNA sites, especially when the DNA is in acoiled conformation, thus accelerating target site locationcompared to sliding alone.
SUPPLEMENTARY DATA
Supplementary Data are available at NAR Online.
ACKNOWLEDGEMENTS
This work was supported by funds from Centre Nationalde la Recherche Scientifique, Institut National de laSante et de la Recherche Medicale, Egide, Ministerede la Recherche (ACI Nanosciences NR069), DeutscherAkademischer Austausch Dienst, DeutschenForschungsgemeinschaft and European Union. A.B. wassupported by the Fondation pour la Recherche Medicale(Accueil Chercheur Etranger 20051206325). We thankPierre Neveu and Jean-Francois Allemand for FCSmeasurements, and Maxime Dahan for discussions andsupport. Funding to pay the Open Access publicationcharges for this article was provided by Ministere de laRecherche (ACI Nanosciences NR069).
Conflict of interest statement. None declared.
REFERENCES
1. Riggs,A.D., Bourgeois,S. and Cohn,M. (1970) The lac repressor-operator interaction. 3. Kinetic studies. J. Mol. Biol., 53, 401–417.
2. Berg,O.G., Winter,R.B. and von Hippel,P.H. (1981) Diffusion-driven mechanisms of protein translocation on nucleic acids. 1.Models and theory. Biochemistry, 20, 6929–6948.
3. Winter,R.B., Berg,O.G. and von Hippel,P.H. (1981)Diffusion-driven mechanisms of protein translocation on nucleicacids. 3. The Escherichia coli lac repressor—operator interaction:kinetic measurements and conclusions. Biochemistry, 20, 6961–6977.
4. von Hippel,P. and Berg,O. (1989) Facilitated target location inbiological systems. J. Biol. Chem., 264, 675–678.
5. Halford,S.E. (2001) Hopping, jumping and looping by restrictionenzymes. Biochem. Soc. Trans., 29, 363–373.
6. Halford,S.E. and Marko,J.F. (2004) How do site-specificDNA-binding proteins find their targets? Nucleic Acids Res., 32,3040–3052.
7. Widom,J. (2005) Target site localization by site-specific,DNA-binding proteins. Proc. Natl Acad. Sci. USA, 102,16909–16910.
8. Shimamoto,N. (1999) One-dimensional diffusion of proteinsalong DNA. Its biological and chemical significance revealedby single-molecule measurements. J. Biol. Chem., 274,15293–15296.
9. Adam,G. and Delbruck,M. (1968) In Rich,A. and Davidson,N.(eds), Structural Chemistry and Molecular Biology. Freeman,San Francisco, pp. 198–215.
10. Richter,P.H. and Eigen,M. (1974) Diffusion controlled reactionrates in spheroidal geometry. Application to repressor—operatorassociation and membrane bound enzymes. Biophys. Chem., 2,255–263.
11. Kabata,H., Kurosawa,O., Arai,I., Washizu,M., Margarson,S.A.,Glass,R.E. and Shimamoto,N. (1993) Visualization of singlemolecules of RNA polymerase sliding along DNA. Science, 262,1561–1563.
12. Graneli,A., Yeykal,C.C., Robertson,R.B. and Greene,E.C. (2006)Long-distance lateral diffusion of human Rad51 on double-strandedDNA. Proc. Natl Acad. Sci. USA, 103, 1221–1226.
13. Blainey,P.C., van Oijen,A.M., Banerjee,A., Verdine,G.L. andXie,X.S. (2006) A base-excision DNA-repair protein findsintrahelical lesion bases by fast sliding in contact with DNA.Proc. Natl Acad. Sci. USA, 103, 5752–5757.
14. Wang,Y.M., Austin,R.H. and Cox,E.C. (2006) Single moleculemeasurements of repressor protein 1D diffusion on DNA.Phys. Rev. Lett., 97, 048302.
15. Kim,J.H. and Larson,R.G. (2007) Single-molecule analysis of 1Ddiffusion and transcription elongation of T7 RNA polymerase alongindividual stretched DNA molecules. Nucleic Acids Res., 35,3848–3858.
16. Gorman,J., Chowdhury,A., Surtees,J.A., Shimada,J.,Reichman,D.R., Alani,E. and Greene,E.C. (2007) Dynamic basisfor one-dimensional DNA scanning by the mismatch repaircomplex Msh2-Msh6. Mol. Cell, 28, 359–370.
17. Elf,J., Li,G.W. and Xie,X.S. (2007) Probing transcription factordynamics at the single-molecule level in a living cell. Science, 316,1191–1194.
18. Gowers,D.M., Wilson,G.G. and Halford,S.E. (2005) Measurementof the contributions of 1D and 3D pathways to the translocation ofa protein along DNA. Proc. Natl Acad. Sci. USA, 102,15883–15888.
19. Gerland,U., Moroz,J.D. and Hwa,T. (2002) Physical constraintsand functional characteristics of transcription factor-DNAinteraction. Proc. Natl Acad. Sci. USA, 99, 12015–12020.
20. Flyvbjerg,H., Keatch,S.A. and Dryden,D.T.F. (2006) Strongphysical constraints on sequence-specific target location by proteinson DNA molecules. Nucleic Acids Res., 34, 2550–2557.
21. Slutsky,M. and Mirny,L.A. (2004) Kinetics of protein-DNAinteraction: facilitated target location in sequence-dependentpotential. Biophys. J., 87, 4021–4035.
22. Coppey,M., Benichou,O., Voituriez,R. and Moreau,M. (2004)Kinetics of target site localization of a protein on DNA: Astochastic approach. Biophys. J., 87, 1640–1649.
23. Lomholt,M.A., Ambjornsson,T. and Metzler,R. (2005) Optimaltarget search on a fast-folding polymer chain with volume exchange.Phys. Rev. Lett., 95, 260603.
24. Hu,T., Grosberg,A.Y. and Shklovskii,B.I. (2006) How proteinssearch for their specific sites on DNA: The role of DNAconformation. Biophys. J., 90, 2731–2744.
25. Klenin,K.V., Merlitz,H., Langowski,J. and Wu,C.X. (2006)Facilitated diffusion of DNA-binding proteins. Phys. Rev. Lett., 96,018104.
26. Kolesov,G., Wunderlich,Z., Laikova,O.N., Gelfand,M.S. andMirny,L.A. (2007) How gene order is influenced by the biophysicsof transcription regulation. Proc. Natl Acad. Sci. USA, 104,13948–13953.
4126 Nucleic Acids Research, 2008, Vol. 36, No. 12
Dow
nloaded from https://academ
ic.oup.com/nar/article/36/12/4118/1143772 by guest on 05 D
ecember 2021
27. Ehbrecht,H.J., Pingoud,A., Urbanke,C., Maass,G. and Gualerzi,C.(1985) Linear diffusion of restriction endonucleases on DNA.J. Biol. Chem., 260, 6160–6166.
28. Pingoud,A. and Jeltsch,A. (2001) Structure and functionof type II restriction endonucleases. Nucleic Acids Res., 29,3705–3727.
29. Taylor,J.D., Badcoe,I.G., Clarke,A.R. and Halford,S.E. (1991)EcoRV restriction endonuclease binds all DNA sequences withequal affinity. Biochemistry, 30, 8743–8753.
30. Jeltsch,A. and Pingoud,A. (1998) Kinetic characterization of lineardiffusion of the restriction endonuclease EcoRV on DNA.Biochemistry, 37, 2160–2169.
31. Jeltsch,A., Wenz,C., Stahl,F. and Pingoud,A. (1996) Lineardiffusion of the restriction endonuclease EcoRV on DNA isessential for the in vivo function of the enzyme. EMBO J., 15,5104–5111.
32. Winkler,F.K., Banner,D.W., Oefner,C., Tsernoglou,D., Brown,R.S.,Heathman,S.P., Bryan,R.K., Martin,P.D., Petratos,K. andWilson,K.S. (1993) The crystal-structure of ecorv endonuclease andof its complexes with cognate and Non-cognate DNA fragments.EMBO J., 12, 1781–1795.
33. Schulze,C., Jeltsch,A., Franke,I., Urbanke,C. and Pingoud,A.(1998) Crosslinking the EcoRV restriction endonuclease acrossthe DNA-binding site reveals transient intermediates andconformational changes of the enzyme during DNA binding andcatalytic turnover. EMBO J., 17, 6757–6766.
34. Stanford,N.P., Szczelkun,M.D., Marko,J.F. and Halford,S.E.(2000) One- and three-dimensional pathways for proteins to reachspecific DNA sites. EMBO J., 19, 6546–6557.
35. Jeltsch,A. and Urbanke,C. (2004) In Pingoud,A. (ed.), Nucleic Acidsand Molecular Biology. Springer-Verlag, Berlin, Vol. 14, pp. 95–110.
36. Gowers,D.M. and Halford,S.E. (2003) Protein motion fromnon-specific to specific DNA by three-dimensional routes aided bysupercoiling. EMBO J., 22, 1410–1418.
37. Seidel,R., van Noort,J., van der Scheer,C., Bloom,J.G.,Dekker,N.H., Dutta,C.F., Blundell,A., Robinson,T., Firman,K. andDekker,C. (2004) Real-time observation of DNA translocation by
the type I restriction modification enzyme EcoR124I. Nat. Struct.Mol. Biol., 11, 838–843.
38. van den Broek,B., Noom,M.C. and Wuite,G.J. (2005) DNA-tensiondependence of restriction enzyme activity reveals mechanochemicalproperties of the reaction pathway. Nucleic Acids Res., 33,2676–2684.
39. Gemmen,G.J., Millin,R. and Smith,D.E. (2006) DNA looping bytwo-site restriction endonucleases: heterogeneous probabilitydistributions for loop size and unbinding force. Nucleic Acids Res.,34, 2864–2877.
40. Crut,A., Geron-Landre,B., Bonnet,I., Bonneau,S., Desbiolles,P. andEscude,C. (2005) Detection of single DNA molecules by multicolorquantum-dot end-labeling. Nucleic Acids Res., 33, e98.
41. Crut,A., Lasne,D., Allemand,J.F., Dahan,M. and Desbiolles,P.(2003) Transverse fluctuations of single DNA molecules attached atboth extremities to a surface. Phys. Rev. E, 67, 051910.
42. Graneli,A., Yeykal,C.C., Prasad,T.K. and Greene,E.C. (2006)Organized arrays of individual DNA molecules tethered tosupported lipid bilayers. Langmuir, 22, 292–299.
43. Wenner,J.R. and Bloomfield,V.A. (1999) Buffer effects on EcoRVkinetics as measured by fluorescent staining and digital imaging ofplasmid cleavage. Anal. Biochem., 268, 201–212.
44. Lohman,T.M. (1986) Kinetics of protein-nucleic acid interactions:use of salt effects to probe mechanisms of interaction. CRC Crit.Rev. Biochem., 19, 191–245.
45. Halford,S.E. and Szczelkun,M.D. (2002) How to get from A to B:strategies for analysing protein motion on DNA. Eur. Biophys. J.,31, 257–267.
46. Schurr,J.M. (1975) The one-dimensional diffusion coefficient ofproteins absorbed on DNA hydrodynamic considerations. Biophys.Chem., 9, 413–414.
47. Erskine,S.G., Baldwin,G.S. and Halford,S.E. (1997) Rapid-reactionanalysis of plasmid DNA cleavage by the EcoRV restriction endo-nuclease. Biochemistry, 36, 7567–7576.
48. Berg,O.G. (1978) On diffusion-controlled dissociation. Chem. Phys.,31, 47–57.
Nucleic Acids Research, 2008, Vol. 36, No. 12 4127
Dow
nloaded from https://academ
ic.oup.com/nar/article/36/12/4118/1143772 by guest on 05 D
ecember 2021