slm unit 01 mbf103
TRANSCRIPT
Statistics for Management Unit 1
Sikkim Manipal University Page No. 1
Unit 1 Introduction
Structure:
1.1 Introduction to Statistics
Learning objectives
Importance of Statistics in modern business environment
1.2 Definition of Statistics
1.3 Scope and Applications of Statistics
1.4 Characteristics of Statistics
1.5 Functions of Statistics
1.6 Limitations of Statistics
1.7 Statistical Softwares
1.8 Summary
1.9 Terminal Questions
1.10 Answers to SAQs and TQs
Answers to Self Assessment Questions
Answers to Terminal Questions
1.11 References
1.1 Introduction
Welcome to the unit on Statistics. In this unit, you will study about Statistics,
which deals with gathering, organising and analysing data.
Statistics plays an important role in almost every facet of human life. In the
business context, managers are required to justify decisions on the basis of
data. They need statistical models to support these decisions. Statistical skills
enable managers to collect, analyse and interpret data and make relevant
decisions. Statistical concepts and statistical thinking enable them to:
Solve problems in almost any domain
Support their decisions
Reduce guesswork
1.1.1 Learning objectives
By the end of this unit, you should be able to:
Describe the scope of Statistics
Distinguish between statistical data and non-statistical data
Statistics for Management Unit 1
Sikkim Manipal University Page No. 2
Recognise the functions of Statistics
Recognise the limitations of Statistics
Recall the computer programs used for analysing Statistics
1.1.2 Importance of Statistics in modern business environment
Due to advanced communication network, rapid changes in consumer
behaviour, varied expectations of variety of consumers and new market
openings, modern managers have a difficult task of making quick and
appropriate decisions. Therefore, there is a need for them to depend more
upon quantitative techniques like mathematical models, statistics,
operations research and econometrics.
As you can see, what the General Manager is doing here is using Statistics
to solve a problem and to increase profits.
Decision making is a key part of our day-to-day life. Even when we wish to
purchase a television, we like to know the price, quality, durability, and
maintainability of various brands and models before buying one. As you can
see, in this scenario we are collecting data and making an optimum
decision. In other words, we are using Statistics.
Again, suppose a company wishes to introduce a new product, it has to
collect data on market potential, consumer likings, availability of raw
materials, feasibility of producing the product. Hence, data collection is the
back-bone of any decision making process.
Caselet 1
The new General Manager Mr. Ravi of a manufacturing company is
concerned about the dwindling profits of the company. The Marketing
and Production Managers identifies the reason as guarantee period
given to customers, since the product has to be replaced if it fails within
guarantee period. This replacement lowers the company‟s profits and
also causes loss of reputation. The General Manager is now thinking in
terms of reducing the percentage of failure of units within a year. This
means that he should take action to improve the life of the unit. After
preliminary studies he decides to
I. Estimate the average life of the units and their variation.
II. Take action to improve the life.
III. Lower the replacement cost as much as possible.
Statistics for Management Unit 1
Sikkim Manipal University Page No. 3
Many organisations find themselves data-rich but poor in drawing
information from it. Therefore, it is important to develop the ability to extract
meaningful information from raw data to make better decisions. Statistics
play an important role in this aspect.
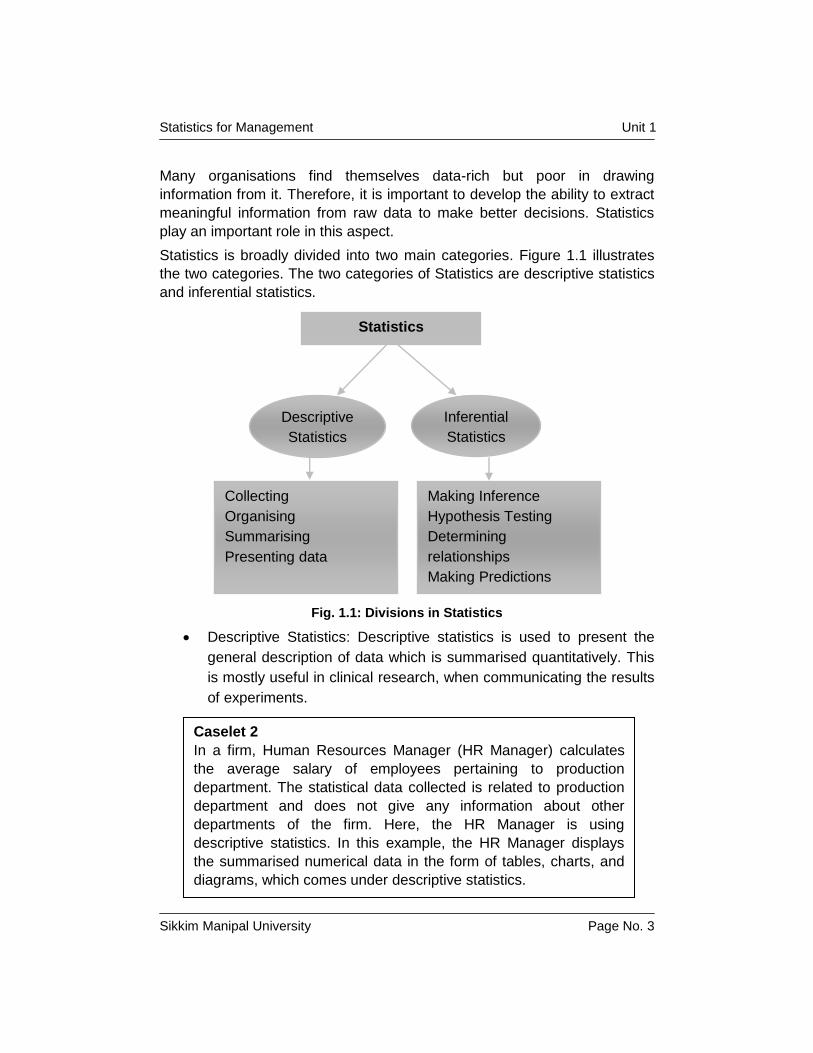
Statistics is broadly divided into two main categories. Figure 1.1 illustrates
the two categories. The two categories of Statistics are descriptive statistics
and inferential statistics.
Fig. 1.1: Divisions in Statistics
Descriptive Statistics: Descriptive statistics is used to present the
general description of data which is summarised quantitatively. This
is mostly useful in clinical research, when communicating the results
of experiments.
Statistics
Descriptive
Statistics
Inferential
Statistics
Collecting
Organising
Summarising
Presenting data
Making Inference
Hypothesis Testing
Determining
relationships
Making Predictions
Caselet 2
In a firm, Human Resources Manager (HR Manager) calculates
the average salary of employees pertaining to production
department. The statistical data collected is related to production
department and does not give any information about other
departments of the firm. Here, the HR Manager is using
descriptive statistics. In this example, the HR Manager displays
the summarised numerical data in the form of tables, charts, and
diagrams, which comes under descriptive statistics.
Statistics for Management Unit 1
Sikkim Manipal University Page No. 4
Inferential Statistics: Inferential statistics is used to make valid
inferences from the data which are helpful in effective decision making
for managers or professionals.
Statistical methods such as estimation, prediction and hypothesis testing
belong to inferential statistics. The researchers make deductions or
conclusions from the collected data samples regarding the
characteristics of large population from which the samples are taken.
Self Assessment Questions
1. In which of the following situations would you like to use Statistics?
a. Buying a house
b. Purchasing medicine prescribed by a doctor
c. Investing funds in several options.
d. Attending relatives marriages
1.2 Definition of Statistics
Statistics is usually and loosely defined as:
1. A collection of numerical data that measure something.
2. The science of recording, organising, analysing and reporting
quantitative information.
Professor A.L. Bowley gave several definitions of Statistics. He defined
Statistics as:
“i) The science of counting
ii) The science of averages
Caselet 3
In a firm, the Human Resources Manager (HR Manager) uses the
average salary of employees pertaining to production department to
calculate the average salary of employees of all other departments
of the firm. Here, the HR Manager is using inferential statistics as the
estimation of averages deals with inferential statistics.
Statistics for Management Unit 1
Sikkim Manipal University Page No. 5
iii) The science of measurement of social phenomena, regarded as a whole
in all its manifestations.
iv) A subject not confined to any one science”1
However, none of these definitions are complete.
According to Horace Secrist, “Statistics may be defined as the aggregate of
facts affected to a marked extent by multiplicity of causes, numerically
expressed, enumerated or estimated according to a reasonable standard of
accuracy, collected in a systematic manner, for a predetermined purpose
and placed in relation to each other”2. This definition is both comprehensive
and exhaustive.
Prof. Boddington, on the other hand, defined Statistics as „The science of
estimates and probabilities‟3. This definition is also not complete.
According to Croxton and Cowden, „Statistics is the science of collection,
presentation, analysis and interpretation of numerical data from logical
analysis‟4.
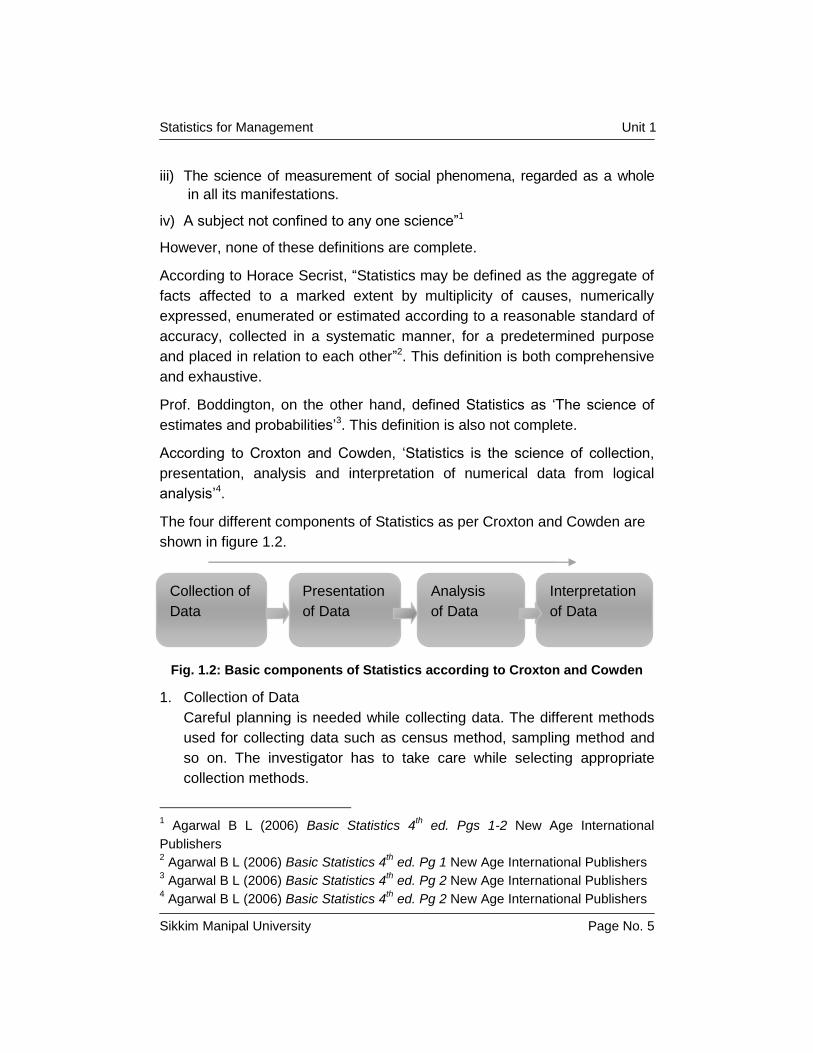
The four different components of Statistics as per Croxton and Cowden are
shown in figure 1.2.
Fig. 1.2: Basic components of Statistics according to Croxton and Cowden
1. Collection of Data
Careful planning is needed while collecting data. The different methods
used for collecting data such as census method, sampling method and
so on. The investigator has to take care while selecting appropriate
collection methods.
1 Agarwal B L (2006) Basic Statistics 4
th ed. Pgs 1-2 New Age International
Publishers 2 Agarwal B L (2006) Basic Statistics 4
th ed. Pg 1 New Age International Publishers
3 Agarwal B L (2006) Basic Statistics 4
th ed. Pg 2 New Age International Publishers
4 Agarwal B L (2006) Basic Statistics 4
th ed. Pg 2 New Age International Publishers
Collection of
Data
Presentation
of Data
Analysis
of Data
Interpretation
of Data
Statistics for Management Unit 1
Sikkim Manipal University Page No. 6
In the census method, every unit or object of the population is included
in the investigation. For example, if we want to study the average annual
income of all the families in a given area which has 500 families, we
must study the income of all 500 families. When the population is large,
census method would be difficult.
A sample of units or objects is taken from the population to describe the
overall characteristics of the population from which the sample was
drawn. This method of collecting data is called sampling. This method is
helpful when size of the population is large or when the results are
needed in short time.
2. Presentation of Data
The collected data is usually presented for further analysis in a tabular,
diagrammatic or graphic form. The collected data is condensed,
summarised and visually represented in a tabular or graphical form.
Tabulation is a systematic arrangement of classified data in rows and
columns. For the representation of data in diagrams, we use different
types of diagrams such as one-dimensional, two-dimensional and three-
dimensional diagrams.
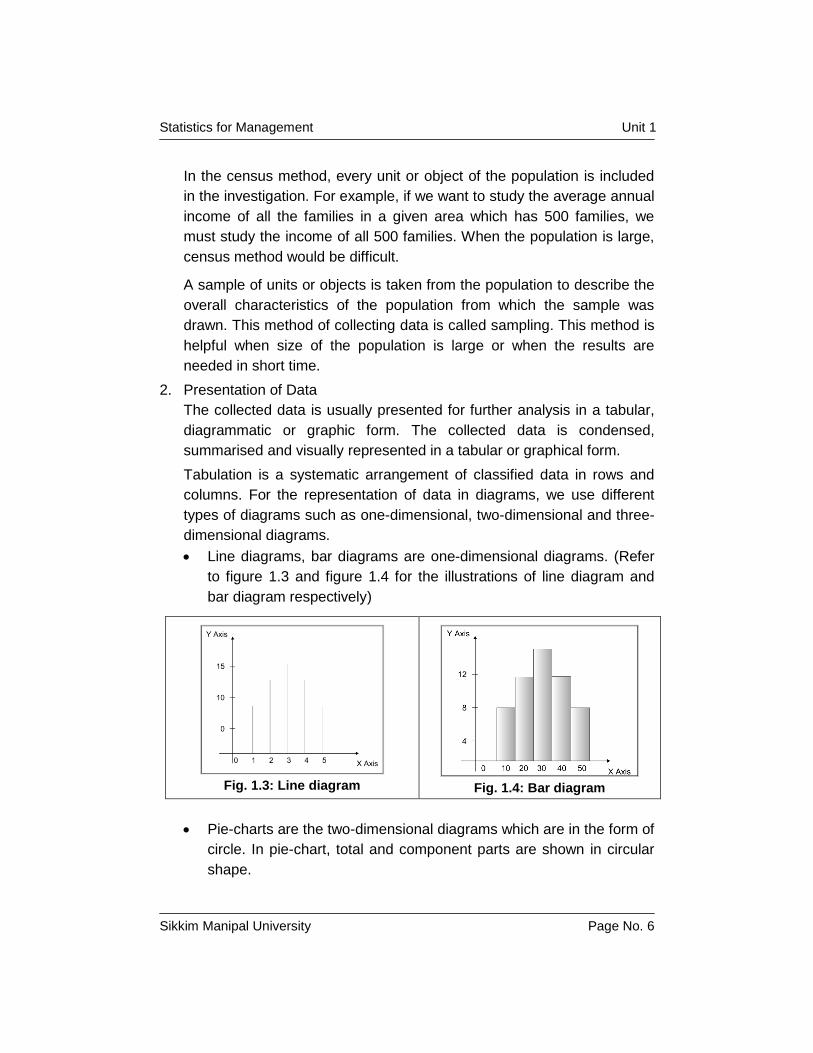
Line diagrams, bar diagrams are one-dimensional diagrams. (Refer
to figure 1.3 and figure 1.4 for the illustrations of line diagram and
bar diagram respectively)
Fig. 1.3: Line diagram
Fig. 1.4: Bar diagram
Pie-charts are the two-dimensional diagrams which are in the form of
circle. In pie-chart, total and component parts are shown in circular
shape.
Statistics for Management Unit 1
Sikkim Manipal University Page No. 7
3. Analysis of ata
The data presented has to be carefully analysed to make any inference
from it. The inferences can be of various types, for example, as
measures of central tendencies, dispersion, correlation, regression.
Measures of central tendency will quantify the middle of the distribution.
The measures in case of population are the parameters and in case of
sample, the measures are statistics that are estimates of population
parameters. The three most common ways of measuring the centre of
distribution is the mean, mode and median.
In case of population, the measures of dispersion are used to quantify
the spread of the distribution. Range, interquartile range, mean absolute
deviation and standard deviation are four measures to calculate the
dispersion.
4. Interpretation of Data
The final step is to draw conclusions from the analysed data.
Interpretation requires high degree of skill and experience. We can
interpret the data easily from pie-charts.
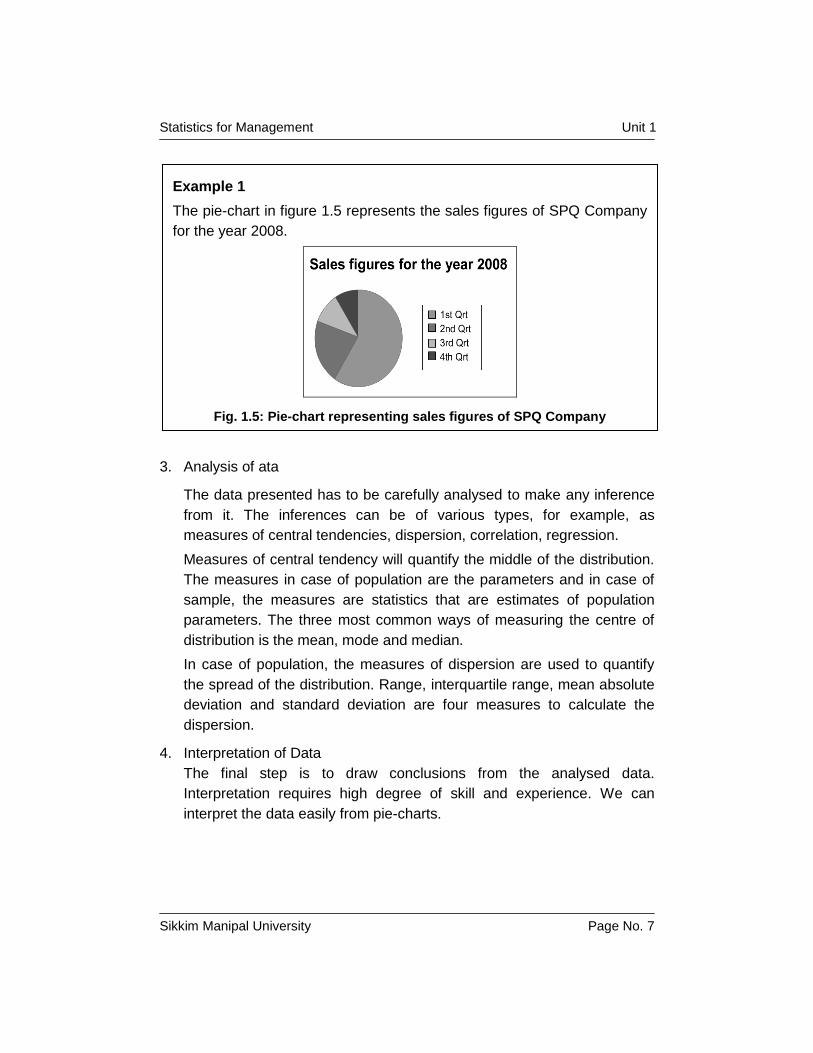
Example 1
The pie-chart in figure 1.5 represents the sales figures of SPQ Company
for the year 2008.
Fig. 1.5: Pie-chart representing sales figures of SPQ Company
Statistics for Management Unit 1
Sikkim Manipal University Page No. 8
Thus, Statistics contains the tools and techniques required for the collection,
presentation, analysis and interpretation of data. Thus, we see that this
definition is precise and comprehensive.
Self Assessment Questions
2. According to the definition of Statistics given by Croxton and Cowden,
what are the four components of Statistics?
1.3 Scope and Applications of Statistics
Statistical methods are applied to specific problems in various fields such as
Biology, Medicine, Agriculture, Commerce, Business, Economics, Industry,
Insurance, Sociology and Psychology.
In the field of medicine, statistical tools like t-tests are used to test the
efficiency of the new drug or medicine. In the field of economics, statistical
tools such as index numbers, estimation theory and time series analysis are
used in solving economic problems related to wages, price, production and
distribution of income. In the field of agriculture, an important concept of
statistics such as analysis of variance (ANOVA) is used in the experiments
related to agriculture, to test the significance between two sample means.
In Biology, Medicine and Agriculture, Statistical methods are applied in the
Study of growth of plant
Movement of fish population in the ocean
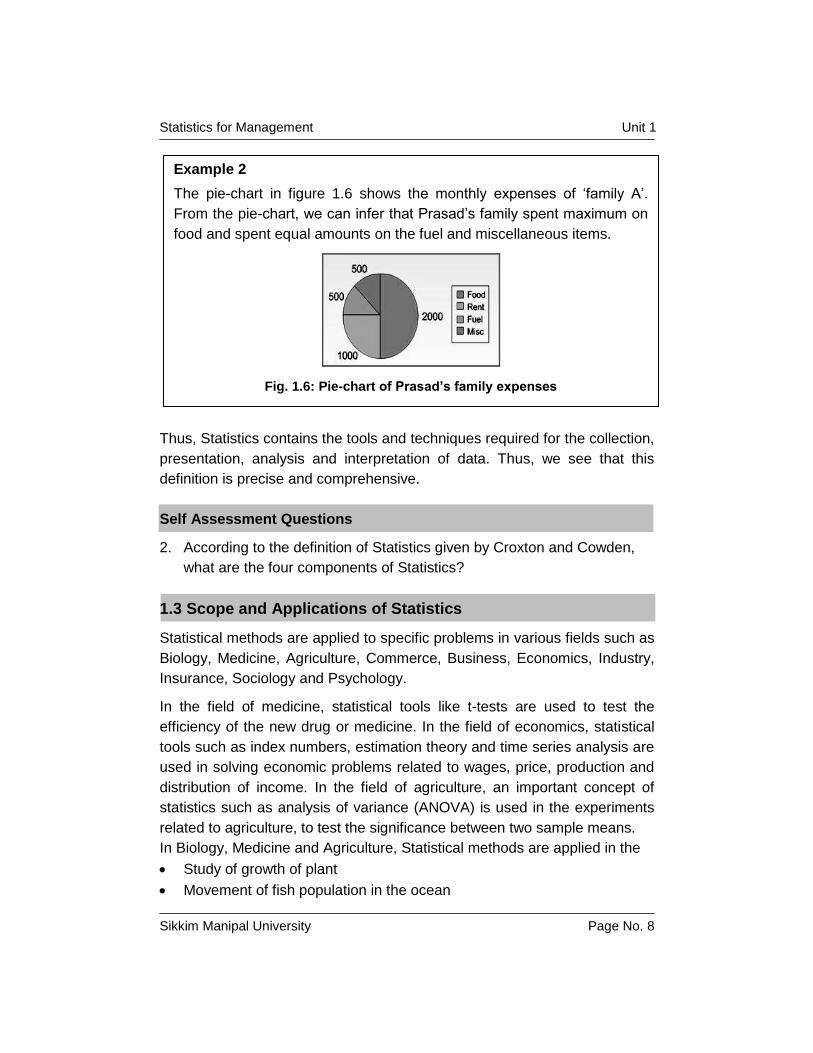
Example 2
The pie-chart in figure 1.6 shows the monthly expenses of „family A‟.
From the pie-chart, we can infer that Prasad‟s family spent maximum on
food and spent equal amounts on the fuel and miscellaneous items.
Fig. 1.6: Pie-chart of Prasad’s family expenses
Statistics for Management Unit 1
Sikkim Manipal University Page No. 9
Migration patterns of birds
Analysing the effect of newly invented medicines
Theories of heredity
Estimation of yield of crop
Study the effect of fertilizer on yield
Birth rate
Death rate
Population growth
Growth of bacteria
Insurance companies decide on the insurance premiums based on the age
composition of the population and the mortality rates. Actuarial science is
used for the calculation of insurance premiums and dividends.
Statistics is a part of Economics, Commerce and Business. Statistical
analysis of the variations in price, demand and production are helpful to both
businessmen and economists. Cost of living index numbers help the
governments in economic planning and fixation of wages. A government‟s
administrative system is fully dependent on production statistics, income
statistics, labour statistics, economic indices of cost, price. Economic
planning of any nation is entirely based on statistical facts. Cost of living
index numbers are also used to estimate the value of money. Analysis of
demand, price, production cost, and inventory costs help in decision making
in business activities.
Management of limited resources and labour needs statistical methods to
maximise profit. Planned recruitments and distribution of staff, proper quality
control methods, careful study of demand for goods in the market as well as
balanced investment help the producer to extract maximum profit out of
minimum capital. In manufacturing industries, statistical quality control
techniques help in increasing and controlling the quality of products at
minimum cost. Hence, statistics is applied in every sphere of human activity.
Self Assessment Questions
3. Mention some other areas where there is scope of applying statistics.
Statistics for Management Unit 1
Sikkim Manipal University Page No. 10
1.4 Characteristics of Statistics
There are several characteristics of Statistics. Not only does it deal with an
aggregate of facts, it also gets affected by multiple causes. Statistics are
numerically expressed and are estimated with varying degrees of accuracy.
Statistics are collected in a systematic manner and for pre-determined
purposes. To ensure comparative and analytical studies, statistical facts
need to be arranged in systematic, logical order. Let us look at each
characteristic in detail.
1. Statistics deals with aggregate of facts
Single figure cannot be analysed. Thus, the fact „Mr Kiran is 170 cms. tall‟
cannot be statistically analysed. On the other hand, if we know the heights
of 60 students of a class, we can comment upon the average height and
variation.
2. Statistics gets affected to a huge extent by multiplicity of causes
The Statistics of yield of a crop is the result of several factors such as fertility
of soil, amount of rainfall, quality of seed used, quality and quantity of
fertilizer used.
3. Statistics are numerically expressed
Only numerical facts can be statistically analysed. Therefore, facts as „price
decreases with increasing production‟ cannot be called statistics. The
qualitative data such as the categorical data cannot be called as statistics.
For example, the eye color of a person or the brand name of an automobile.
4. Statistics are enumerated or estimated with required degree of
accuracy
The facts should be collected from the field or estimated (computed) with
the required degree of accuracy. The degree of accuracy differs depending
on the purpose. For example, in measuring the length of screws, an
accuracy of up to a millimetre may be required, whereas while measuring
the heights of students in a class, an accuracy of up to a centimetre is
enough.
5. Statistics are collected in a systematic manner
The facts should be collected according to planned and scientific methods.
Otherwise, they are likely to be wrong and misleading.
Statistics for Management Unit 1
Sikkim Manipal University Page No. 11
6. Statistics are collected for a pre-determined purpose
There must be a definite purpose for collecting facts. Otherwise,
indiscriminate data collection might take place which would lead to wrong
diagnosis.
7. Statistics are placed in relation to each other
The facts must be placed in such a way that a comparative and analytical
study becomes possible. Thus, only related facts which are arranged in
logical order can be called Statistics. Statistical analysis cannot be used to
compare heterogeneous data.
Self Assessment Questions
4. a) Will the same degree of accuracy be needed when measuring the
height of a mountain and the height of a person?
b) Does Statistics deal with qualitative data?
5. Categorise the following data as qualitative or quantitative data.
a) The number of transactions occurring in an ATM per day
b) The popular brand name in cars is Maruthi.
1.5 Functions of Statistics
Statistics is used for various purposes. It is used to simplify mass data and
to make comparisons easier. It is also used to bring out trends and
tendencies in the data as well as the hidden relations between variables. All
this helps to make decision making much easier. Let us look at each
function of Statistics in detail.
1. Statistics simplifies mass data
The use of statistical concepts helps in simplification of complex data. Using
statistical concepts, the managers can make decisions more easily. The
statistical methods help in reducing the complexity of the data and
consequently in the understanding of any huge mass of data.
Solved Problem 1: Fifty people were interviewed to rate a regional movie
on the scale of 1 to 10, with number 1 being for the top movie and number
10 being for the worst movie. The table 1.1a shows the ratings given by 50
customers. Simplify the data?
Statistics for Management Unit 1
Sikkim Manipal University Page No. 12
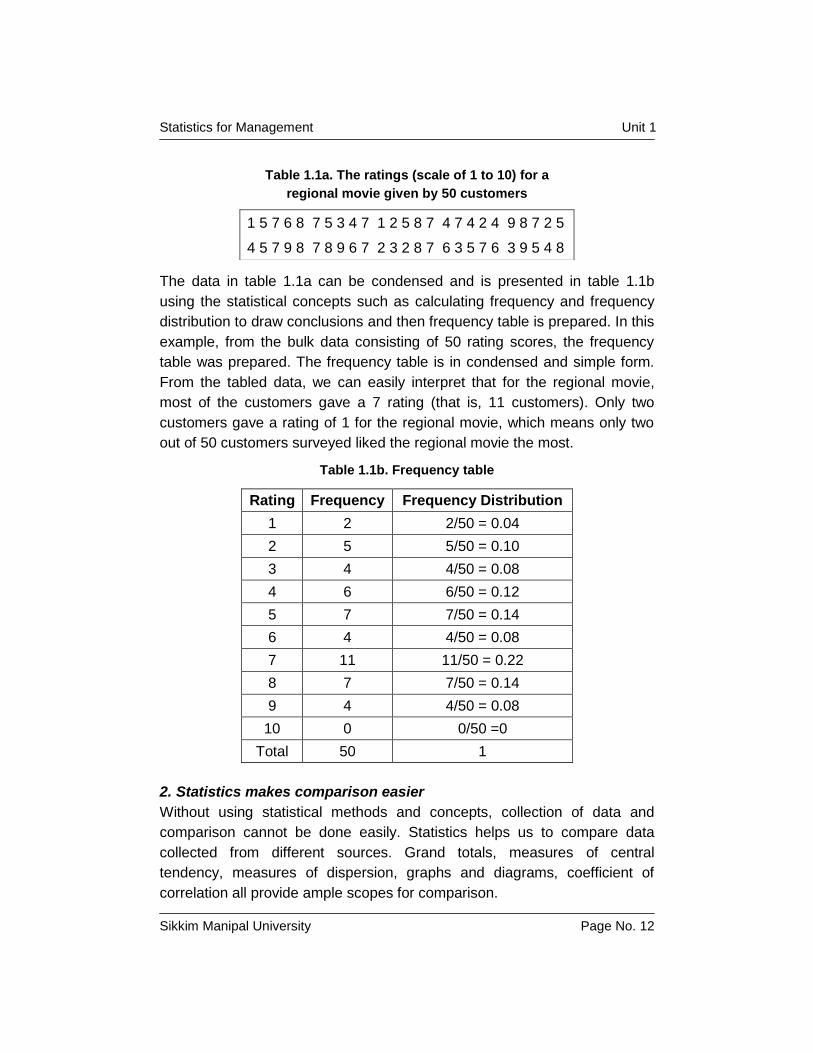
Table 1.1a. The ratings (scale of 1 to 10) for a
regional movie given by 50 customers
The data in table 1.1a can be condensed and is presented in table 1.1b
using the statistical concepts such as calculating frequency and frequency
distribution to draw conclusions and then frequency table is prepared. In this
example, from the bulk data consisting of 50 rating scores, the frequency
table was prepared. The frequency table is in condensed and simple form.
From the tabled data, we can easily interpret that for the regional movie,
most of the customers gave a 7 rating (that is, 11 customers). Only two
customers gave a rating of 1 for the regional movie, which means only two
out of 50 customers surveyed liked the regional movie the most.
Table 1.1b. Frequency table
Rating Frequency Frequency Distribution
1 2 2/50 = 0.04
2 5 5/50 = 0.10
3 4 4/50 = 0.08
4 6 6/50 = 0.12
5 7 7/50 = 0.14
6 4 4/50 = 0.08
7 11 11/50 = 0.22
8 7 7/50 = 0.14
9 4 4/50 = 0.08
10 0 0/50 =0
Total 50 1
2. Statistics makes comparison easier
Without using statistical methods and concepts, collection of data and
comparison cannot be done easily. Statistics helps us to compare data
collected from different sources. Grand totals, measures of central
tendency, measures of dispersion, graphs and diagrams, coefficient of
correlation all provide ample scopes for comparison.
1 5 7 6 8 7 5 3 4 7 1 2 5 8 7 4 7 4 2 4 9 8 7 2 5
4 5 7 9 8 7 8 9 6 7 2 3 2 8 7 6 3 5 7 6 3 9 5 4 8
Statistics for Management Unit 1
Sikkim Manipal University Page No. 13
Hence, visual representation of numerical data helps you to compare the
data with less effort and can make effective decisions.
3. Statistics brings out trends and tendencies in the data
After data is collected, it is easy to analyse the trend and tendencies in the
data by using the various concepts of Statistics.
4. Statistics brings out the hidden relations between variables
Statistical analysis helps in drawing inferences on data. Statistical analysis
brings out the hidden relations between variables.
5. Decision making power becomes easier
With the proper application of Statistics and statistical software packages on
the collected data, managers can take effective decisions, which can
increase the profits in a business.
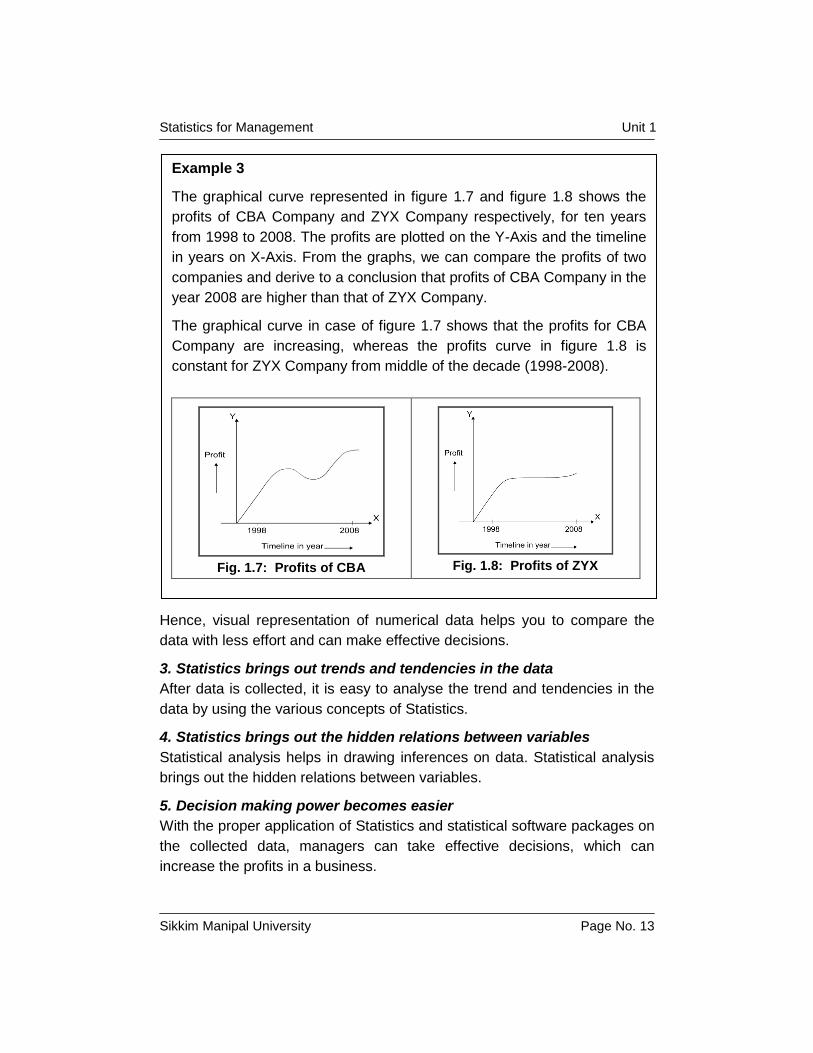
Example 3
The graphical curve represented in figure 1.7 and figure 1.8 shows the
profits of CBA Company and ZYX Company respectively, for ten years
from 1998 to 2008. The profits are plotted on the Y-Axis and the timeline
in years on X-Axis. From the graphs, we can compare the profits of two
companies and derive to a conclusion that profits of CBA Company in the
year 2008 are higher than that of ZYX Company.
The graphical curve in case of figure 1.7 shows that the profits for CBA
Company are increasing, whereas the profits curve in figure 1.8 is
constant for ZYX Company from middle of the decade (1998-2008).
Fig. 1.7: Profits of CBA
Fig. 1.8: Profits of ZYX
Fig. 1.7: Profits of CBA Fig. 1.8: Profits of ZYX
Statistics for Management Unit 1
Sikkim Manipal University Page No. 14
Self Assessment Questions
6. Total sales of a product in Area A is 840 for 30 working days. Total sales
of same product in Area B is 784 for 28 working days. Do you think that
Statistics needs to be applied to get an appropriate picture regarding
comparison of sales?
1.6 Limitations of Statistics
Despite all its characteristics and functions, Statistics also have certain
limitations.
1. Statistics does not deal with qualitative data
Qualitative data deals with meanings while quantitative data deals with
numbers. Qualitative data describes properties or characteristics that are
used to identify things. Quantitative data describes data in terms of quantity
using the numerical figure accompanied by measurement unit. Statistics
deals only with quantitative data.
Statistics deals with numerical data, which can be expressed in terms of
quantitative measurements. So, the qualitative phenomenon like beauty,
intelligence cannot be expressed numerically and any statistical analysis
cannot be directly applied on these qualitative phenomena. But Statistical
techniques may be applied indirectly by first reducing the qualitative data to
accurate quantitative terms. For example, the intelligence of a group of
students can be studied on the basis of their marks in a particular
examination.
2. Statistics does not deal with individual fact
Statistical methods can be applied only to aggregates of facts, because
analysis and interpretation of data is highly difficult in case of individual
facts.
3. Statistical inferences (conclusions) are not exact
Statistical inferences are true only on an average. They are probabilistic
statements. For example, in case of data, which consists of height of 200
male persons taken from a graduate school, the inferences so obtained may
not hold true for an individual male person in particular.
Statistics for Management Unit 1
Sikkim Manipal University Page No. 15
4. Statistics can be misused and misinterpreted
Lack of sufficient knowledge of statistical science often leads to incorrect
conclusions. Therefore, proper care must be taken while selecting collection
method and also in choosing appropriate statistical models. Increasing
misuse of Statistics has led to increasing distrust in Statistics.
5. Common men cannot handle Statistics properly
The field of Statistics is so vast that it needs experience as well as skill to
effectively understand and apply the statistical concepts and models.
Hence, only statisticians can handle statistics properly.
1.7 Statistical Softwares
When the collected data is small, the analysis and interpretation can be
done without much difficulty. But when a huge amount of data is huge, the
process of analysis and interpretation would be difficult. Therefore, there is a
need for tools to do the calculations in an easier way.
With the advent of computers, lots of statistical tools have been developed
which help the scientific and technical researchers or statisticians in getting
the most accurate and useful information from data. These statistical
packages help the statisticians in summarising, presenting and analysing
huge amounts of data in a short time. Some such statistical software
applications are Minitab, SPSS, and E-Views. Let us know about some of
the statistical tools in brief.
Minitab
Minitab is a statistical software package that was designed especially for
the teaching of introductory statistics courses. It is our view that an easy-
to-use statistical software package is a vital and significant component of
such a course. This permits the student to focus on statistical concepts
and thinking rather than computations or the learning of a statistical
package. The main aim of any introductory statistics course should
always be the why of statistics rather than technical details that do little to
stimulate the majority of students or, in our opinion, do little to reinforce
the key concepts.
Source: http://www.minitab.com
Statistics for Management Unit 1
Sikkim Manipal University Page No. 16
SPSS
SPSS Inc. technology encapsulates advanced mathematical and
statistical expertise to extract predictive knowledge that when deployed
into existing processes makes them adaptive to improve outcomes.
Our Predictive Analytics Software will help you:
Capture all the information you need about people's attitudes and
opinions
Predict the outcomes of interactions before they occur
Act on your insights by embedding analytic results into business
processes
Source: http://www.spss.com
Eviews
EViews is a statistical software tool, which offers academic researchers,
corporations, government agencies, and students access to powerful
statistical, forecasting, and modeling tools through an innovative, easy-to-
use object-oriented interface.
EViews is the ideal package for anyone who works with time series,
cross-section, or longitudinal data. EViews offers an extensive array of
powerful features for data handling, statistics and econometric analysis
forecasting and simulation, data presentation, and programming. EViews
generates forecasts or model simulations, and produce high quality
graphs and tables.
Source: http://www.eviews.com/
1.8 Summary
Decision making process becomes more efficient with the help of Statistics.
Statistics deals with aggregate of facts. Statistics is applied in all fields of
our activities. Statistical interpretation requires skilled and experienced
statisticians. Statistical data is numerical data or quantitative data but not
qualitative data.
Statistics for Management Unit 1
Sikkim Manipal University Page No. 17
Statistics is broadly divided into Descriptive and Inferential Statistics.
Descriptive Statistics gives the general description of quantitative data
whereas inferential statistics deals with reaching valid conclusions about the
data in order to make effective judgment. The statistical software packages
used by the interpreters or statisticians are Minitab, SPSS, Microsoft Excel,
EViews and others.
1.9 Terminal Questions
1. Mention the characteristics of Statistics?
2. Give plural meaning of the word Statistics?
3. What are the limitations of Statistics?
1.10 Answers to SAQs and TQs
Answers to Self Assessment Questions
1. a) Yes
b) No
c) Yes
d) No
2. Industrial Quality control, Investment policies, to find Market potential for
a product.
3. The four components of Statistics are collection, presentation, analysis
and interpretation of data.
4. a) No
b) No
5. a) Quantitative data
b) Qualitative data
6. Yes
Answers to Terminal Questions
1. Refer section 1.4
2. The science of estimates and probabilitie.
3. Refer section 1.6
Statistics for Management Unit 1
Sikkim Manipal University Page No. 18
1.11 References
B.L. Agarwal, (2006) Basic Statistics, Fourth Edition, New Age
International Publishers
Rand R. Wilcox , (2009) Basic Statistics – Understanding Conventional
Methods and Modern Insights, Oxford University Press
Richard I. Levin, David S. Rubin, (2008) Statistics for Management,
Seventh Edition, PHI Learning Private Limited
http://www.textbooksonline.tn.nic.in/Books/11/Stat-EM/Chapter-1.pdf