slow release fragrance and disinfectant for carpets · the case for a clean carpet dust mites mold...
TRANSCRIPT

Slow Release Fragrance and
Disinfectant for Carpets
ChE 4273 Capstone
Dr. Bagajewicz
Justin Woody
Carrie Street

Overview� Background
� Design
� Utilities
� Production Process
� Economics

The Case for a Clean Carpet
�Dust Mites
�Mold
�Mildew
�Bacteria

�Microscopic arachnids
�Dust mite’s dead remains and fecal matter are invisible cause respiratory problems
�Remains are suspended in the air for extended periods of time
Dust Mites

� Feed on dead human skin cells
�> 55% humidity
�72°-79° F
�< 50% humidity, most die within 7-10 days
Dust Mites: Ideal Environment

Mold & Mildew
•Moist, warm, poorly ventilated places
•Quickly mature
•Produce floating spores
•Cause discomfort and allergies

Bacteria
•Gram negative
•Anaerobic
•Require wet environment
•Live in latex backing of carpet
•Produce butyric acid – foul smell

Wet Cleaning Problems
•Cause mildew growth
•Up to 20% water absorption
•Analogous to shampooing hair without rinsing
•Soapy, sticky residue

Current Products
� Arm&Hammer
� Borid
� Capture Clean
www.churchdwight.com
www.pestproducts.com
www.captureclean.com

Challenge
Freshen and Disinfect
– With Powders
� Slow release fragrance
� Small particles (biodegradable)
� Disinfectant

Potential SolutionProblem
boric acid, baking soda
Mildew
neutralize butyric acid odor with baking soda
Bacteria
boric acid, sodium propinoate
Mold
boric acid, tannic acid
Dust Mites
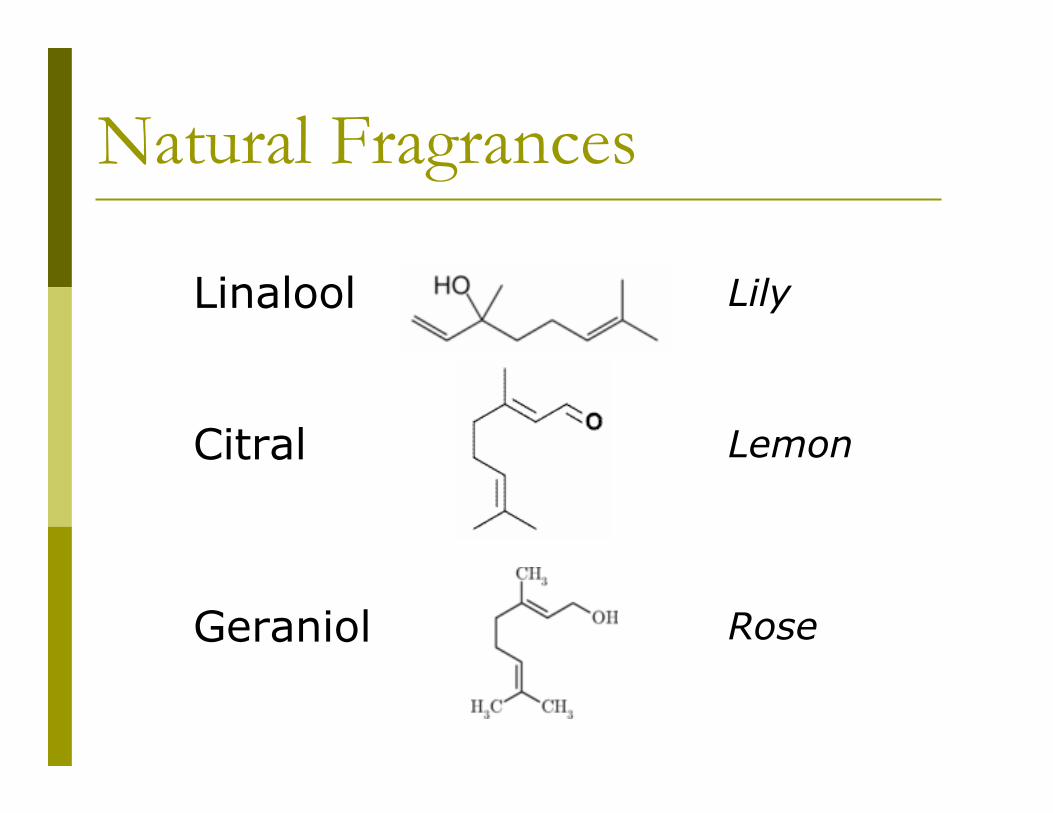
Natural Fragrances
RoseGeraniol
LemonCitral
LilyLinalool

Design
�Baking Soda
�Boric acid
� Linalool in PLGA for extended duration

Sodium bicarbonate
�Absorbs moisture
�Non-toxic

Boric Acid� Kill dust mites
� crystal coats food source
� Neutralize allergens
� Inhibit mold, mildew, bacteria, and fungi growth
� Kill cockroaches, beetles, and ants by chemical burns

•Poly(lactic-co-glycolic acid)
•Biodegradable
•Degrades by hydrolysis of ester linkages
PLGA

Utility Function Method
U= Uiwi
U = utility w = importance weight
i = characteristic
∑

Utility Function Method
weights = 1∑
Poll Consumers
WeightsCharacteristics

0.15Odor Elimination
0.09Toxicity
0.14Scent Type
WeightCharacteristic
0.19Fragrance Duration
0.22Scent Intensity
0.21Disinfectant Effectiveness

Utility Function Method
Consumer Tests
measure preference
Relate characteristics to physical property

Disinfectant Effectiveness relates
�% of mites killed
�Amount of boric acid per unit area

Disinfectant Effectiveness
0
20
40
60
80
100
0 20 40 60 80 100Effectiveness (% of mites killed)
Util
ity (%
)

Disinfectant EffectivenessRandom Walk

Disinfectant Effectiveness

Disinfectant Effectiveness

Scent Intensity relates
� Fragrance intensity
�Number of particles per unit area (n)

Scent Intensity

Quantifying Consumer Preference
� Journal of Food and Science
� various amounts of linalool
� human subjects determined scent intensity
� 1.5 feet away from the sample
� 25 minutes after the sample was prepared

Fragrance Duration relates
�Application frequency
�Amount of linalool in particles (L)

Fragrance Duration

Mass Transfer quantifies
�Scent Intensity
� Fragrance Duration

Fragrance Particle Schematic
R1 R2
DmDa
liquid
PLGAair

Design Parameters
�Number of particles (n)
�Amount of linalool in particles (L)

Expected Trends
time
Lin
alo
ol C
on
cen
trat
ionn = number of particles per unit areaL = amount of fragrance in each particle
L
n

Assumptions
�Radial symmetry
�Air is semi-infinite
�No degradation inside particle
�Polymer degradation slower than fragrance diffusion

Equation Development
Welty et al., “Fundamentals of Momentum, Heat, and Mass Transfer,” 2001.
02 =
dr
dCr
dr
d
r
abC −=

Boundary ConditionssatcC = at r = R1
22
*RraRrm dr
dCD
dr
dCD
===
−−+= ∞∞tD
Rrerfc
r
RCRCCC
a2)*)(*(** 22
2
r > R2

Linalool Concentration
)()()( 22
21
2 RCD
D
r
RRC
D
D
R
RcrC
m
a
m
asat +−=
m
a
m
a
sat
D
D
D
D
R
Rc
RC−+
=
1
22
1)(

Scent Intensity
�Relates
�Odor intensity
�Number of particles per unit area (n)
�Assuming
�10 micron particle diameter
�Fixed amount of linalool in particles (L) to 90% linalool

Scent Intensity: Concentration at 5 ft
0.0E+00
2.0E-09
4.0E-09
6.0E-09
8.0E-09
1.0E-08
1.2E-08
1.4E-08
1.6E-08
0 2 4 6 8 10time (weeks)
Lin
alo
ol C
on
cen
trat
ion
(M) 0.000055
0.000109
0.000219
0.000437
0.000907
0.001361Max utility (M)
Min (M)
g PLGA/ft2
L = 90%R1 = 4.5 µm1.57x109
particles/gn

Scent Intensity

Fragrance Duration
mdr
dCD
t
m =∫*
0
22
31*
)(3 RRCD
Rct
a
o=

Fragrance Duration
�Relates
�Application frequency
�Amount of linalool in particles (L)
�Assuming
�24 hours to concentration threshold
�Fixed number of particles (n)

Fragrance Duration:
Concentration at 5 ft
0.0E+00
5.0E-09
1.0E-08
1.5E-08
2.0E-08
2.5E-08
0 5 10 15 20time (weeks)
Lin
alo
ol C
on
cen
trat
ion
(M
)
3.04.04.54.9Max utility (M)Min (M)
R1 (µm)
n = 1 g particles
L

Fragrance Duration

Fragrance Duration

Toxicity relates
�Toxicity
�Amount of boric acid per unit area

Toxicity

Toxicity• Components are fixed
•Toxicity is the same as the competitor

Toxicity

Odor Elimination relates
�Odor Eliminated (Freshness)
�Amount of baking soda per unit area

Odor Elimination

Odor Elimination

Odor Elimination

Scent Type

Production Process
Double Emulsion
Mixing
Product
Fragrance Particles
Other Raw Materials

Water/Oil/Water Double Emulsion
Methylenechloride/PLGA solution
Aqueous linalool

Double Emulsion
�Mix by sonication
Sonicatorwww.2spi.com

Double Emulsion
Linalool
in methylene chloride/PLGA
H2O and PVA
(emulsifying agent)

Double Emulsion� PVA ensures small colloids stay small

Double Emulsion
�Remove organic solvent
Rotary Evaporatoraironline.com/equipment

Double Emulsion
�Collect microspheres
Centrifugeaironline.com/equipment/

Double Emulsion
Freeze Dryerwww.labx.com
�Prepare for mixing

Production Process: Mixing
Fragrance Particles
Baking Soda Boric Acid
Mixer
Packaging

Cost Analysis
� TCI and FCI
� Price and Demand Model
� Maximized Utility
� Maximized NPW
� Shipping Costs
� Advertising Costs
� Risk
� Strauss Plots
� Monte-Carlo Simulations

Price and Demand
= consumer awareness
= competitor utility/our utility
= diminishing marginal utility (concave <1)
= budget constraint
= price
= demand
1 = ours, 2 = competition
ρρρ
βα
1
1
2
112110 D
P
DPYPDP
−
−
−=
αβρY
DP
P2=10$
U2=62

Price and Demand
Budget Constraint = 54 million

Alpha� is a function of advertising and timeα
α� Preliminary estimates based on = 0.9

Advertising� Directly proportional to demand
� $5 million for 100% demand
$0
$1,000,000
$2,000,000
$3,000,000
$4,000,000
$5,000,000
0 0.2 0.4 0.6 0.8 1
Demand
Ad
vert
isin
g

Shipping
Choose Distribution
Centers
Assign Weights
population and humidity
throughout USA

Shipping
Possible Plant
Locations
Minimize Cost
high productivity

Shipping Assumptions
�Ship by truck
�Constant product composition
�Uniform price in all regions
�Uniform budget constraint in all regions

Distribution Centers
Albany, NY
Tallahassee, FL
Indianapolis, IN
Jefferson City, MO
Austin, TX
Denver, CO
Salt Lake City, UT
Olympia, WA Sacramento, CA
Phoenix, AZ
Harrisburg, PA
Columbia, SC
Nashville, TN
St Paul, MN
Baton Rouge, LA
Helena, MT

Distribution Centers
50states.com

Shipping Calculations

0.0576%750,000Baton Rouge, LA
0.0973%3 millionSt. Paul, MN
0.1178%3.9
million
Olympia, WA
Fraction of
Production
Avg.
Humidity
PopulationPlant
Location

$ 260Little Rock, AR
Cost per galPlant Location
$ 250Oklahoma City, OK
$ 304Atlanta, GA
$ 289Jackson, MS
$ 304Montgomery, AL

TCI Calculations

TCI Calculations
$525,000TCI
$175,000Working Capital
$350,000FCI

NPW Calculations

Maximum Utility
�Composition
� 0.1% Linalool
� 0.2% PLGA
� 20.6% Boric Acid
� 79.1% Baking Soda
�Cost per 16 oz container to have + NPW
� Unrealistic, you get a –NPW at any price

Maximum NPW Product� Varied Composition – which varied utility

Maximum NPW Product� Maximum NPW Utility =0.735 Price=$19.44
� Composition – 0.01% Linalool, 0.02% PLGA, 17.9% Boric Acid, 80% Baking Soda
β

Revised Budget Constraint• All calculations have been based on disinfectant market only
• Y=54 million
• Max NPW is $1,730,000 – lowest approximation
• If the air freshener market (98 million) is taken into account
• Max NPW is $13,300,000 – highest approximation
• Actual budget constraint most likely would fall in the middle
• A novel idea is to poll consumers
• How much would they pay extra than just disinfectant
• Shown below
New Y=97 million
Max NPW = $6,800,000

Risk
�Strauss Plots
� Varied all raw materials 20% of 2007 selling price
�Monte Carlo Simulations
� Varied all raw materials 20% of 2007 selling price

Strauss Plots

Strauss Plot SlopeCost
-1e6Baking Soda
-3e5Boric Acid
-400PLGA
-150Linalool

Strauss Plots• Sensitivity to Price
• Lower the price, higher the demand, and higher sensitivities

Strauss Plot Slopes
-1.3e5
-2.9e5
-3.6e5
Boric Acid
-1.0e6-123-280$21
-1.3e6-129-350$20
-1.6e6-162-440$19
Baking Soda
PLGALinaloolPrice per container
As price goes down, demand goes up the NPW is a stronger function of the raw materials

5% of losing money
95% of making money
Monte Carlo Simulations – Y=54mill

14% of losing money
86% of making money
Monte Carlo Simulations – Y=54mill

97% of losing money
3% of making money
Monte Carlo Simulations – Y=54mill

Monte Carlo Simulations – Y=97mill
1% of losing money
99% of making money

1% of losing money
99% of making money
Monte Carlo Simulations – Y=97mill

66% of losing money
34% of making money
Monte Carlo Simulations – Y=97mill

Questions

Utility Questions
This table breaks down our conservative approach for the utility. When polled consumers stated for our product their would be a 0 utility for a product that had no duration and no scent, yet we felt that to be conservative we should give our competitor 50% of the utility so that we would not be making unrealistic amounts of money. This table shows how much we make with the conservative approach and how much we would have made if the competitor would have had a 0 utility for both. Another implication of our model being conservative with the utility for the fragrance of the competitor is that is gave us the freedom to look into the fragrance market also, which is very important. It would be like comparing apples and oranges if we would have excluded that.

Equipment Costs

TCI, FCI, Working Capital

ROI and PBP questions