sludge handling and management
TRANSCRIPT
Disclaimer: The opinions, advice and information contained in this publication have not been provided at the request of any person but are offered by Australian Pork Limited (APL) solely for
informational purposes. While APL has no reason to believe that the information contained in this publication is inaccurate, APL is unable to guarantee the accuracy of the information and, subject to
any terms implied by law which cannot be excluded, accepts no responsibility for loss suffered as a result of any party’s reliance on the accuracy or currency of the content of this publication. The
information contained in this publication should not be relied upon for any purpose, including as a substitute for professional advice. Nothing within the publication constitutes an express or implied
warranty, or representation, with respect to the accuracy or currency of the publication, any future matter or as to the value of or demand for any good.
Sludge Handling and Management
Final Report
APL Project 2012/1029
January 2014
FSA Consulting
Eugene McGahan
PO Box 2175
Toowoomba Qld 4350

When referring to this document the following reference should be used:
O’Keefe, MF, McDonald, SA, Yan, MJ, Davis, RJ, Watts, PJ, McGahan, EJ and Tucker, RW, 2013,
‘Sludge Handling and Management’, Project No. 2012/1029, Australian Pork Limited, Canberra,
Australia, January 2014.
DOCUMENT STATUS RECORD
Client: Australian Pork Limited Document Title: Sludge Handling and Management Job No: 7887 Document File Name: 7887 APL Sludge Handling Report - Final Jan 2014.docx
Version No Date of Issue Description Signatures
Author Checked Approved
1 2 Sept 2013 Draft RJD/EJM RWT
2 11 October 2013 Draft RJD/EJM PJW
3 30 November
2013 FINAL RJD/EJM/PJW PJW
4 08 January 2014 FINAL RJD/EJM/PJW EJM
Notes: Version 1 This is a draft report for client comment. Version 2 This is a draft report for client comment. Version 3 This is a Final Report. Version 4 This is a Final Report with final comments from client (APL) included. Disclaimer:
1. Feedlot Services Australia Pty Ltd has taken all reasonable steps to ensure that the information contained in this publication is accurate at the time of production. In some cases, Feedlot Services Australia Pty Ltd has relied on information supplied by the client.
2. This report has been prepared in accordance with good professional practice. No other warranty, expressed or implied, is made as to the professional advice given in this report.
3. Feedlot Services Australia Pty Ltd maintains NO responsibility for the misrepresentation of results due to incorrect use of information contained within this report.
4. This report should remain together and be read as a whole. 5. This report has been prepared solely for the benefit of the client listed above. No liability is accepted by Feedlot
Services Australia Pty Ltd with respect to the use of this report by third parties without prior written approval. 6. Where soil testing has been undertaken, it should be noted that soil conditions can vary significantly even over
relatively short distances. Under no circumstances will any claim be considered because of lack of description of the strata and site conditions as shown in the report. In addition, the client or contractor shall be responsible for satisfying themself as to the nature and extent of any proposed works and the physical and legal conditions under which the work would be carried out, including means of access, type and size of mechanical plant required, location and suitability of water supply for construction and testing purposes and any other matters affecting the construction of the works.
This document should be cited as follows: O’Keefe, MF, McDonald, SA, Yan, MJ, Davis, RJ, Watts, PJ, McGahan, EJ and Tucker, RW,
2013, ‘Sludge Handling and Management’, Project No. 2012/1029, Australian Pork Limited, Canberra, Australia, January 2014.
Copyright:
Feedlot Services Australia Pty Ltd PO Box 2175 TOOWOOMBA QLD 4350
Acknowledgements
This project is supported by funding from Australian Pork Limited and the Department of
Agriculture.
Abstract
Sludge accumulates in various waste management ponds at piggeries and cattle feedlots. Eventually,
this sludge needs to be removed and handled. Many existing piggery ponds are reaching the point
where sludge removal is becoming a pressing issue. Another issue has arisen recently with the use of
covered treatment ponds to generate biogas. Sludge removal from covered ponds presents special
difficulties. This report reviews the physical and rheological properties of pond sludge and the
methods used to pump, remove, dewater and manage the wet sludge. The most important
parameter that influences the ability to pump sludge is the total solids content. Sludge samples were
collected at several Australian piggeries and feedlots. These samples were analysed for their physical
properties.
Executive Summary
FSA Consulting was engaged by Australian Pork Limited and Meat and Livestock Australia to
undertake project 2012/1029 – Sludge handling and management. This project covered a review of
existing literature and practices on the pumping of sludge in intensive agriculture industries and
other relevant areas.
Sludge accumulates in various waste management ponds at piggeries and cattle feedlots. Eventually,
this sludge needs to be removed and handled. Many existing piggery ponds are reaching the point
where sludge removal is becoming a pressing issue. Another issue has arisen recently with the use of
covered treatment ponds to generate biogas. Sludge removal from covered ponds presents special
difficulties.
Sludge is a mixture of water and solid materials (total solids (TS)). The TS component can be
inorganic material (any materials such as debris, sand or rocks plus the ash component of organic
wastes), slowly digestible organic material or dead microbial cell mass. The ratio of water to solids
(TS content) can vary considerably. As the TS content increases, the sludge’s characteristics and
handling requirements change. The particle size and particle size distribution (PSD) can vary from
very fine colloidal material to larger particles. Some particles can be cohesive (i.e. they tend to stick
together) while other particles such as sand are non-cohesive. Rheology is the study of the flow of
matter. This is an important feature in the design of sludge removal systems.
The term – sludge – is widely used for a range of materials. However, the handling and management
options for “sludge” is heavily dependent on the TS content of the material. In this report, the
following terms have been defined.
1. Effluent. This is material with a TS content of <5%. Effluent is a material that can be pumped
and behaves like other Newtonian fluids, e.g. water.
2. Slurry. This is material with a TS content of 5-15%. These materials are “thick” but can flow.
They behave in a non-Newtonian manner and require specialised pumping equipment.
3. Sludge. This is material with a TS content >15%. Essentially, this material is too thick to
pump and must be handled with bulk mechanical methods.
The actual properties of sludges derived from different sources vary, even at the same TS content.
Hence, the TS contents stated above are a general guideline for use in this report rather than a fixed
rule. Care needs to be taken when reviewing other work as the definition of sludge used in the
literature is highly variable.
The physical characteristics of the sludge or slurry is importantly in determining the appropriate
pumping and handling methods. Particle size distribution (PSD) and bulk density are important but
the rheological properties have the greatest influence. Several studies have been conducted into the
rheological properties of raw and digested manure in sludge or slurry forms. Most researchers find
that viscosity (i.e. resistance to pumping) increases with increasing TS content and decreases with
temperature. Effluent with a TS content <2% can be pumped with centrifugal pumps. Slurries with a
TS content of about 5-10% TS can be pumped with various types of positive displacement pumps.
Sludge with a TS content greater than 15% is virtually impossible to pump.
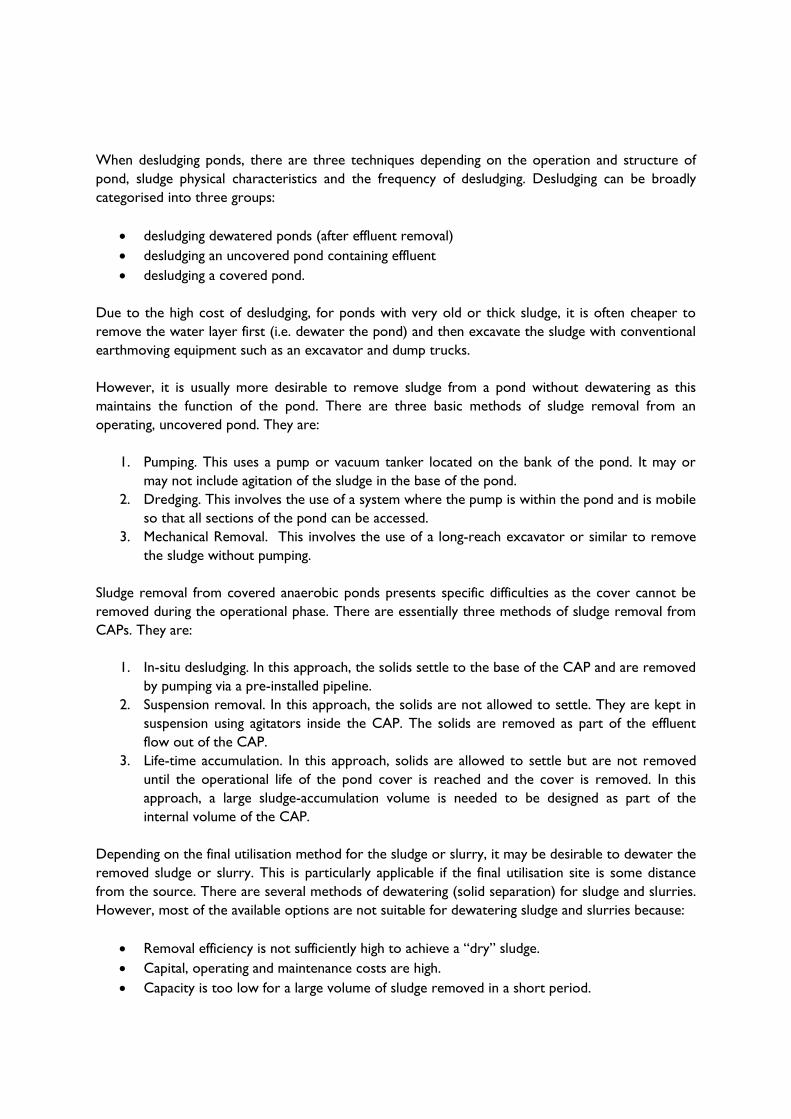
When desludging ponds, there are three techniques depending on the operation and structure of
pond, sludge physical characteristics and the frequency of desludging. Desludging can be broadly
categorised into three groups:
desludging dewatered ponds (after effluent removal)
desludging an uncovered pond containing effluent
desludging a covered pond.
Due to the high cost of desludging, for ponds with very old or thick sludge, it is often cheaper to
remove the water layer first (i.e. dewater the pond) and then excavate the sludge with conventional
earthmoving equipment such as an excavator and dump trucks.
However, it is usually more desirable to remove sludge from a pond without dewatering as this
maintains the function of the pond. There are three basic methods of sludge removal from an
operating, uncovered pond. They are:
1. Pumping. This uses a pump or vacuum tanker located on the bank of the pond. It may or
may not include agitation of the sludge in the base of the pond.
2. Dredging. This involves the use of a system where the pump is within the pond and is mobile
so that all sections of the pond can be accessed.
3. Mechanical Removal. This involves the use of a long-reach excavator or similar to remove
the sludge without pumping.
Sludge removal from covered anaerobic ponds presents specific difficulties as the cover cannot be
removed during the operational phase. There are essentially three methods of sludge removal from
CAPs. They are:
1. In-situ desludging. In this approach, the solids settle to the base of the CAP and are removed
by pumping via a pre-installed pipeline.
2. Suspension removal. In this approach, the solids are not allowed to settle. They are kept in
suspension using agitators inside the CAP. The solids are removed as part of the effluent
flow out of the CAP.
3. Life-time accumulation. In this approach, solids are allowed to settle but are not removed
until the operational life of the pond cover is reached and the cover is removed. In this
approach, a large sludge-accumulation volume is needed to be designed as part of the
internal volume of the CAP.
Depending on the final utilisation method for the sludge or slurry, it may be desirable to dewater the
removed sludge or slurry. This is particularly applicable if the final utilisation site is some distance
from the source. There are several methods of dewatering (solid separation) for sludge and slurries.
However, most of the available options are not suitable for dewatering sludge and slurries because:
Removal efficiency is not sufficiently high to achieve a “dry” sludge.
Capital, operating and maintenance costs are high.
Capacity is too low for a large volume of sludge removed in a short period.
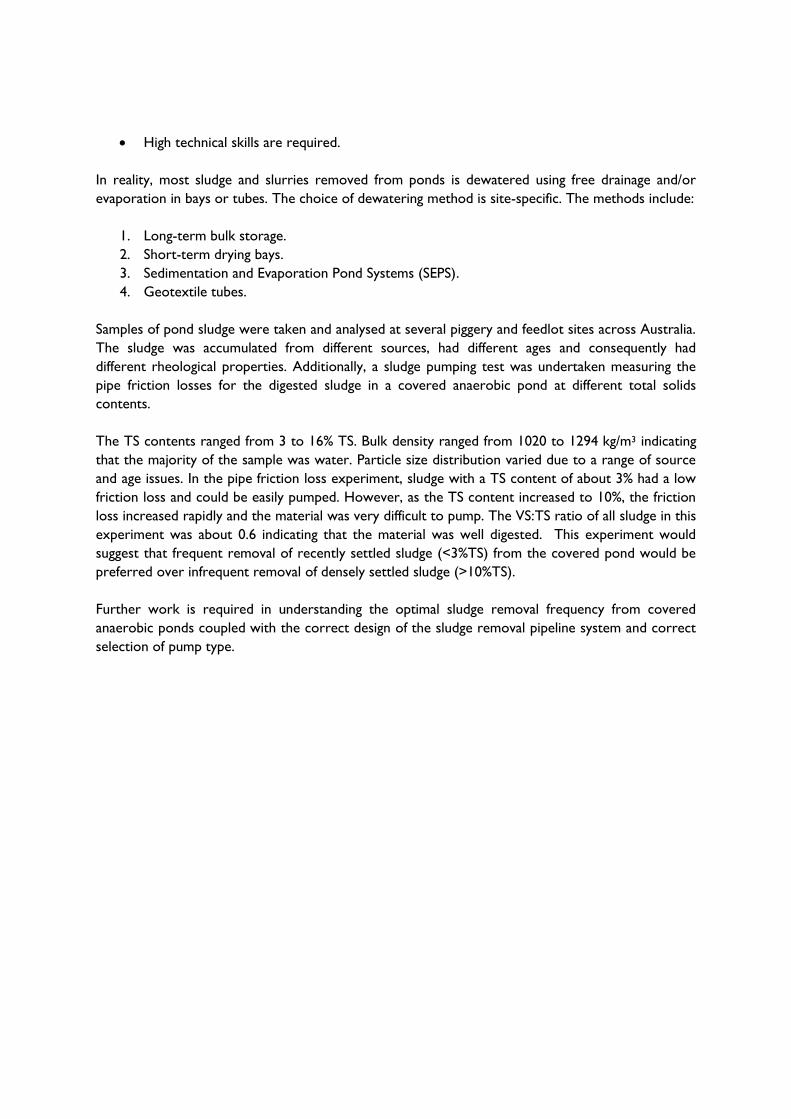
High technical skills are required.
In reality, most sludge and slurries removed from ponds is dewatered using free drainage and/or
evaporation in bays or tubes. The choice of dewatering method is site-specific. The methods include:
1. Long-term bulk storage.
2. Short-term drying bays.
3. Sedimentation and Evaporation Pond Systems (SEPS).
4. Geotextile tubes.
Samples of pond sludge were taken and analysed at several piggery and feedlot sites across Australia.
The sludge was accumulated from different sources, had different ages and consequently had
different rheological properties. Additionally, a sludge pumping test was undertaken measuring the
pipe friction losses for the digested sludge in a covered anaerobic pond at different total solids
contents.
The TS contents ranged from 3 to 16% TS. Bulk density ranged from 1020 to 1294 kg/m3 indicating
that the majority of the sample was water. Particle size distribution varied due to a range of source
and age issues. In the pipe friction loss experiment, sludge with a TS content of about 3% had a low
friction loss and could be easily pumped. However, as the TS content increased to 10%, the friction
loss increased rapidly and the material was very difficult to pump. The VS:TS ratio of all sludge in this
experiment was about 0.6 indicating that the material was well digested. This experiment would
suggest that frequent removal of recently settled sludge (<3%TS) from the covered pond would be
preferred over infrequent removal of densely settled sludge (>10%TS).
Further work is required in understanding the optimal sludge removal frequency from covered
anaerobic ponds coupled with the correct design of the sludge removal pipeline system and correct
selection of pump type.
TABLE OF CONTENTS
Document Status Record ............................................................................................... III
Abstract ......................................................................................................................... IV
Executive Summary ........................................................................................................ V
Table Of Contents .................................................. ERROR! BOOKMARK NOT DEFINED.
List Of Tables ................................................................................................................ XI
List Of Figures .............................................................................................................. XII
List Of Photographs .................................................................................................... XIII
Glossary ............................................................................................................................ 1
1 Introduction ................................................... ERROR! BOOKMARK NOT DEFINED.
1.1 Project Background ................................................. Error! Bookmark not defined.
1.2 Project Objectives ............................................................................................... 2
2 Sludge, Slurry and Effluent ...................................................................................... 3
2.1 Sources of Sludge ................................................................................................ 3
2.2 Rheology ............................................................................................................... 4
2.3 Definitions of Sludge, Slurry and Effluent ......................................................... 4
2.4 Components of Sludge, Slurry and Effluent ..................................................... 5
2.5 Physical Characteristics of Sludge, Slurry and Effluent ................................... 6
2.5.1 Particle Size Distribution in Wastewater Solids ....................................................................... 6
2.5.2 Rheological Properties of Sludge and Slurries ........................................................................... 9
2.5.3 Angle of Repose of Sludge ........................................................................................................... 12
3 Sources of Sludge and Slurries - Pond Systems ..................................................... 13
3.1 Background ........................................................................................................ 13
3.2 Pre-Treatment .................................................................................................. 13
3.3 Effluent Ponds .................................................................................................... 13
3.4 Pond Types ........................................................................................................ 14
3.4.1 Anaerobic Ponds ............................................................................................................................ 14
3.4.1.1 Uncovered Anaerobic Ponds ............................................................................................. 15
3.4.1.2 Anaerobic Pond Design – Rational Design Standard .................................................... 15
3.4.1.3 Covered Anaerobic Ponds (Cap) ...................................................................................... 17
3.4.2 Facultative Ponds ................................................................. Error! Bookmark not defined.
3.4.3 Aerobic Ponds ................................................................................................................................. 20
3.5 Sludge Accumulation and Distribution .................. Error! Bookmark not defined.
3.5.1 Sludge Accumulation .......................................................... Error! Bookmark not defined.
3.5.2 Sludge Distribution ............................................................. Error! Bookmark not defined.
4 Pumping Slurries and Effluent ............................................................................... 27
4.1 Centrifugal Pumps ............................................................................................ 27
4.2 Positive Displacement Pumps .......................................................................... 29
4.2.1 Diaphragm Pumps .......................................................................................................................... 29
4.2.2 Plunger and Piston Pumps ............................................................................................................ 30
4.2.3 Progressing-Cavity Pumps ............................................................................................................ 32
4.2.4 Rotary Vane Vacuum Pumps ....................................................................................................... 33
4.2.5 Pump Type Selection ..................................................................................................................... 34
5 Removal of Sludge and Slurries from Ponds .......................................................... 35
5.1 Desludging Dewatered Ponds .......................................................................... 35
5.1.1 Advantages and Disadvantages .................................................................................................... 38
5.2 Desludging Uncovered Ponds Containing Effluent ........................................ 38
5.2.1 Pumping (with or without Agitation) ........................................................................................ 38
5.2.2 Dredging ........................................................................................................................................... 41
5.2.3 Mechanical Removal ...................................................................................................................... 43
5.2.4 Advantages and Disadvantages .................................................................................................... 43
5.3 Desludging Covered Anaerobic Ponds (Cap) ................................................. 46
5.3.1 In-Situ Desludging ........................................................................................................................... 47
5.3.2 Suspension Removal ...................................................................................................................... 52
5.3.3 Life-Time Accumulation ................................................................................................................ 52
5.3.4 Advantages and Disadvantages .................................................................................................... 52
6 Dewatering of Sludge and Slurry ........................................................................... 53
6.1 Solid-Liquid Separation of Sludge and Slurry ................................................. 53
6.2 Long-Term Bulk Storage .................................................................................. 53
6.3 Short-Term Drying Bays .................................................................................. 54
6.4 Sedimentation and Evaporation Pond Systems (Seps) ................................. 56
6.5 Geotextile Tubes ............................................................................................... 60
7 Methodology .......................................................................................................... 62
7.1 Introduction ....................................................................................................... 62
7.2 Sample Sites and Sampling Methods .............................................................. 62
7.2.1 Piggery A .......................................................................................................................................... 62
7.2.2 Piggery B ........................................................................................................................................... 64
7.2.3 Piggery C .......................................................................................................................................... 64
7.2.4 Piggery D .......................................................................................................................................... 65
7.2.5 Piggery E ........................................................................................................................................... 65
7.2.6 Feedlot A .......................................................................................................................................... 66
7.2.7 Feedlot B .......................................................................................................................................... 67
7.2.8 Feedlot C .......................................................................................................................................... 68
7.2.9 Feedlot D ......................................................................................................................................... 68
7.2.10 Feedlot E........................................................................................................................................... 68
7.2.11 Feedlot F ........................................................................................................................................... 70
7.3 Pipe Friction Loss Experiment – Piggery A .................................................... 71
7.4 Sludge Characterisation Methodology ............................................................ 75
8 Results and Discussion ........................................................................................... 76
8.1 Sludge Characterisation ................................................................................... 76
8.1.1 Total Solids and Volatile Solids ................................................................................................... 76
8.1.2 Bulk Density .................................................................................................................................... 78
8.1.3 Particle Size Analysis ...................................................................................................................... 79
8.1.4 Rheological Analysis and Pipe Friction Loss............................................................................. 82
8.1.5 Viscosity and Shear Stress ............................................................................................................ 83
9 Conclusions and Recommendations ...................................................................... 87
10 References ............................................................................................................. 90
11 Appendix A – Definition and Determination of Sludge Physical Properties .......... 97
1. Total Solids (Dry Matter) ............................................................................................................. 99
3. Bulk Density .................................................................................................................................. 101
4. Particle Size Analysis .................................................................................................................... 102
5. Rheological Properties ................................................................................................................ 105
6. Shear Stress ................................................................................................................................... 107
7. Viscosity .......................................................................................................................................... 107
Appendix B –Tait et Al. 2013 Paper ............................................................................. 108
Appendix C – Z-Filter Westpork Trial ......................................................................... 110
LIST OF TABLES
Table 1: Particle size distribution in piggery wastewater (% less than) ......................................................... 7
Table 2: Sludge accumulation rate for anaerobic ponds .................................................................................. 24
Table 3: Example pumps from GEA ..................................................................................................................... 28
Table 4: General selection characteristics for positive displacement pumps ............................................. 34
Table 5: Comparison of three dredging services in Australia ........................................................................ 44
Table 6: Desludging cost comparison .................................................................................................................. 44
Table 7: Desludging SWOT analysis (GHD 2008) ............................................................................................ 46
Table 8: Estimated construction and operating cost of drying bays ............................................................. 54
Table 9: VS:TS data for sludge removed from different depths within a CAP .......................................... 72
Table 10: Sample identification for sludge pumping test ................................................................................. 73
Table 11: Piggery sludge analysis results (VS and TS) ...................................................................................... 76
Table 12: Feedlot sludge analysis results (VS and TS) ...................................................................................... 77
Table 13: Piggery sludge analysis: bulk density ................................................................................................... 78
Table 14: Feedlot sludge analysis: bulk density .................................................................................................. 79
Table 15: Comparison of TS and particle sizes in averaged samples from piggeries and feedlots ........ 82
Table 16: Flow rates, shear and flow regime during pumping of sludge from Piggery A ........................ 82
Table 17: Conversions of %TS to moisture content on a wet basis, dry basis and concentration ... 101
LIST OF FIGURES
Figure 1: General properties of sludge from different sources ....................................................................... 3
Figure 2: Handling characteristics of manure at different moisture contents .............................................. 5
Figure 3: Distribution of relative volumes of the various size classes of particles in raw and digested
pig slurry .............................................................................................................................................................. 8
Figure 4: Cumulative relative distribution of specific surface area in raw and digested pig slurry ......... 8
Figure 5: Effect of TS content and temperature on viscosity (Kumar et al. 1972) ................................... 10
Figure 6: Predicted flow curves for 100 mm pipe (Staley et al. 1973) ......................................................... 10
Figure 7: Rheogram of reactor sludge at two different TS contents ........................................................... 11
Figure 8: Schematic description of angle of repose .......................................................................................... 12
Figure 9: Sludge distribution in a primary pond (Keffala et al. 2013) ........................................................... 26
Figure 10: Sludge distribution in a facultative pond with incomplete aeration (adopted from Ramalho
1977) ................................................................................................................................................................... 26
Figure 11: Pump selection guide ............................................................................................................................ 28
Figure 12: Five versions of agi-pompe and super pump of GEA ................................................................... 29
Figure 13: Schematic of GEHO-ZPM diaphragm pump ................................................................................... 30
Figure 14: Schematic of Mud Sucker diaphragm pump .................................................................................... 30
Figure 15: Schematic of piston pump ................................................................................................................... 31
Figure 16: Schematics of plunger pumps ............................................................................................................. 31
Figure 17: Schematic of progressing-cavity pump ............................................................................................. 32
Figure 18: Schematic of rotary vane vacuum pump .......................................................................................... 33
Figure 19: Agitating the manure pond (adopted from PAMI, 1997) ............................................................. 39
Figure 20: Sludge dredging (VanDevender 2003) .............................................................................................. 41
Figure 21: Desirable layout of anaerobic pond to facilitate desludging (Watson 1999) .......................... 47
Figure 22: Airlift pump (Watson 1999) ............................................................................................................... 47
Figure 23: Schematic illustration of RCM’s covered lagoon digester ........................................................... 52
Figure 24: PSD for sludge samples taken from Piggery A covered anaerobic pond ................................. 79
Figure 25: PSD for samples taken from other piggeries compared with the average results from
Piggery A ............................................................................................................................................................ 80
Figure 26: PSD for samples taken from other feedlot sedimentation basins compared with the
average results from piggery site A ............................................................................................................. 81
Figure 27: Comparison of average samples taken from Piggery A (2), other piggeries (1) and feedlots
(1) ........................................................................................................................................................................ 81
Figure 28: Flow rate and number of minutes of flow during pumping and sampling at Piggery A ........ 83
Figure 29: Viscosity of three samples from Piggery A at two different temperatures ............................. 84
Figure 30: Rheogram of samples from Piggery A .............................................................................................. 84
Figure 31: Pipe flow wall shear stress (τw) vs. shear rate (8V/D) showing onsite measurements and
lab-based measurements for sludge ............................................................................................................ 85
Figure 32: Pipe flow pressure drop for trial at piggery site A ........................................................................ 86
Figure 33: Loss of VFAs during manure drying at 105°C (Vedrenne et al. 2008) ..................................... 98
Figure 34: VS underestimation due to drying (Vedrenne et al. 2008) ......................................................... 99
Figure 35: Rheogram of Newtonian fluid ......................................................................................................... 106
Figure 36: Qualitative rheogram of non-Newtonian fluids .......................................................................... 106
LIST OF PHOTOGRAPHS
Photograph 1: Covered anaerobic pond ............................................................................................................. 17
Photograph 2: Typical pink facultative pond at a piggery ................................................................................ 20
Photograph 3: Variable sludge distribution in ponds ........................................................................................ 20
Photograph 4: Mechanically-aerated aerobic pond ........................................................................................... 21
Photograph 5: Dewatering an anaerobic pond prior to desludging ............................................................. 36
Photograph 6: Dried sludge in a feedlot sedimentation basin ready for removal ..................................... 36
Photograph 7: Sludge removal from a dewatered pond with an excavator ............................................... 37
Photograph 8: Anaerobic pond after dewatering and desludging ................................................................. 37
Photograph 9: Sludge removal with a mono pump (no agitation) ................................................................ 40
Photograph 10: Sludge removal using a suction tanker and agitation (Source: Alan Skerman, DAFF) 40
Photograph 11: Pond agitator (Source: Alan Skerman, DAFF) ...................................................................... 41
Photograph 12: Pond dredge in operation (Dredging Solutions) .................................................................. 42
Photograph 13: Long-reach excavator................................................................................................................. 43
Photograph 14: Installation of sludge removal pipe system ............................................................................ 49
Photograph 15: Installation of sludge removal pipe system ............................................................................ 49
Photograph 16: Sludge extraction pipelines (deflated pond cover) .............................................................. 50
Photograph 17: Pump suction pipe inserted into in-situ desludging pipe.................................................... 50
Photograph 18: Sludge (black) and effluent (white) removal pipes ............................................................... 51
Photograph 19: Long-term sludge drying bay .................................................................................................... 55
Photograph 20: Surface crusting of long-term drying bay ............................................................................... 55
Photograph 21: Narrow drying bay ...................................................................................................................... 56
Photograph 22: SEPS bays ....................................................................................................................................... 58
Photograph 23: Dried SEPS bay ............................................................................................................................ 58
Photograph 24: Solids removal from dried SEPS bay ....................................................................................... 59
Photograph 25: Tyres used to break the surface crust to enhance solids drying in a SEPS ................... 59
Photograph 26: Dewatering sludge using geotextile tubes (Dredging Solutions) ..................................... 61
Photograph 27: Piggery A drying bay ................................................................................................................... 63
Photograph 28: Piggery A slurry pipeline riser adjacent to drying bays ...................................................... 63
Photograph 29: Piggery C sampling site .............................................................................................................. 64
Photograph 30: Piggery D sampling site .............................................................................................................. 65
Photograph 31: Piggery E sampling site ............................................................................................................... 66
Photograph 32: Feedlot A sampling site – sedimentation basin .................................................................... 66
Photograph 33: Feedlot A sampling site (sampling method at weir) ............................................................ 67
Photograph 34: Feedlot B sampling site .............................................................................................................. 67
Photograph 35: Feedlot D sampling site ............................................................................................................. 68
Photograph 36: Feedlot E sampling site, SB/1 .................................................................................................... 69
Photograph 37: Feedlot E sampling site, SB/2 .................................................................................................... 69
Photograph 38: Feedlot F sampling site, SP/1 .................................................................................................... 70
Photograph 39: Feedlot F sampling site, SB/2 .................................................................................................... 71
Photograph 40: Suction pipe inserted into CAP ............................................................................................... 72
Photograph 41: Analogue pressure gauges ......................................................................................................... 73
Photograph 42: Vacuum pump and pipework .................................................................................................... 74
Photograph 43: Magflo flow meter (left) and in-line pressure transducer and electronic readout
(right) .................................................................................................................................................................. 74

Photograph 44: Sludge removed from CAP during pump priming ............................................................... 75
Photograph 45: Crucibles, desiccator and balance ........................................................................................ 100
Photograph 46: Bulk density measurement apparatus .................................................................................. 102
Photograph 47: PSD analyser – Malvern Mastersizer/E .................................................................................. 104
Photograph 48: Retained sludge on 500 µm sieve ......................................................................................... 105
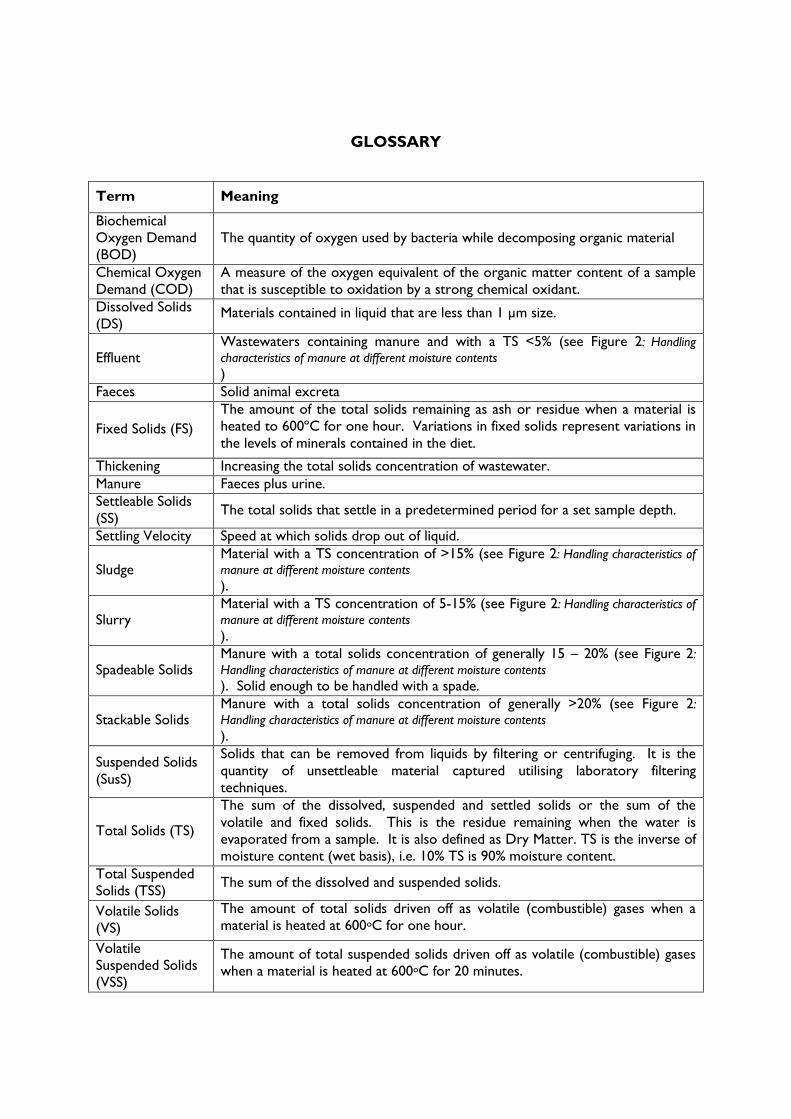
GLOSSARY
Term Meaning
Biochemical
Oxygen Demand
(BOD)
The quantity of oxygen used by bacteria while decomposing organic material
Chemical Oxygen
Demand (COD)
A measure of the oxygen equivalent of the organic matter content of a sample
that is susceptible to oxidation by a strong chemical oxidant.
Dissolved Solids
(DS) Materials contained in liquid that are less than 1 µm size.
Effluent Wastewaters containing manure and with a TS <5% (see Figure 2: Handling
characteristics of manure at different moisture contents
)
Faeces Solid animal excreta
Fixed Solids (FS)
The amount of the total solids remaining as ash or residue when a material is
heated to 600ºC for one hour. Variations in fixed solids represent variations in
the levels of minerals contained in the diet.
Thickening Increasing the total solids concentration of wastewater.
Manure Faeces plus urine.
Settleable Solids
(SS) The total solids that settle in a predetermined period for a set sample depth.
Settling Velocity Speed at which solids drop out of liquid.
Sludge Material with a TS concentration of >15% (see Figure 2: Handling characteristics of
manure at different moisture contents
).
Slurry Material with a TS concentration of 5-15% (see Figure 2: Handling characteristics of
manure at different moisture contents
).
Spadeable Solids Manure with a total solids concentration of generally 15 – 20% (see Figure 2:
Handling characteristics of manure at different moisture contents
). Solid enough to be handled with a spade.
Stackable Solids Manure with a total solids concentration of generally >20% (see Figure 2:
Handling characteristics of manure at different moisture contents
).
Suspended Solids
(SusS)
Solids that can be removed from liquids by filtering or centrifuging. It is the
quantity of unsettleable material captured utilising laboratory filtering
techniques.
Total Solids (TS)
The sum of the dissolved, suspended and settled solids or the sum of the
volatile and fixed solids. This is the residue remaining when the water is
evaporated from a sample. It is also defined as Dry Matter. TS is the inverse of
moisture content (wet basis), i.e. 10% TS is 90% moisture content.
Total Suspended
Solids (TSS) The sum of the dissolved and suspended solids.
Volatile Solids
(VS)
The amount of total solids driven off as volatile (combustible) gases when a
material is heated at 600oC for one hour.
Volatile
Suspended Solids
(VSS)
The amount of total suspended solids driven off as volatile (combustible) gases
when a material is heated at 600oC for 20 minutes.

Wastewater Any stream of water containing manure and or other waste products
(feedstuffs, etc)
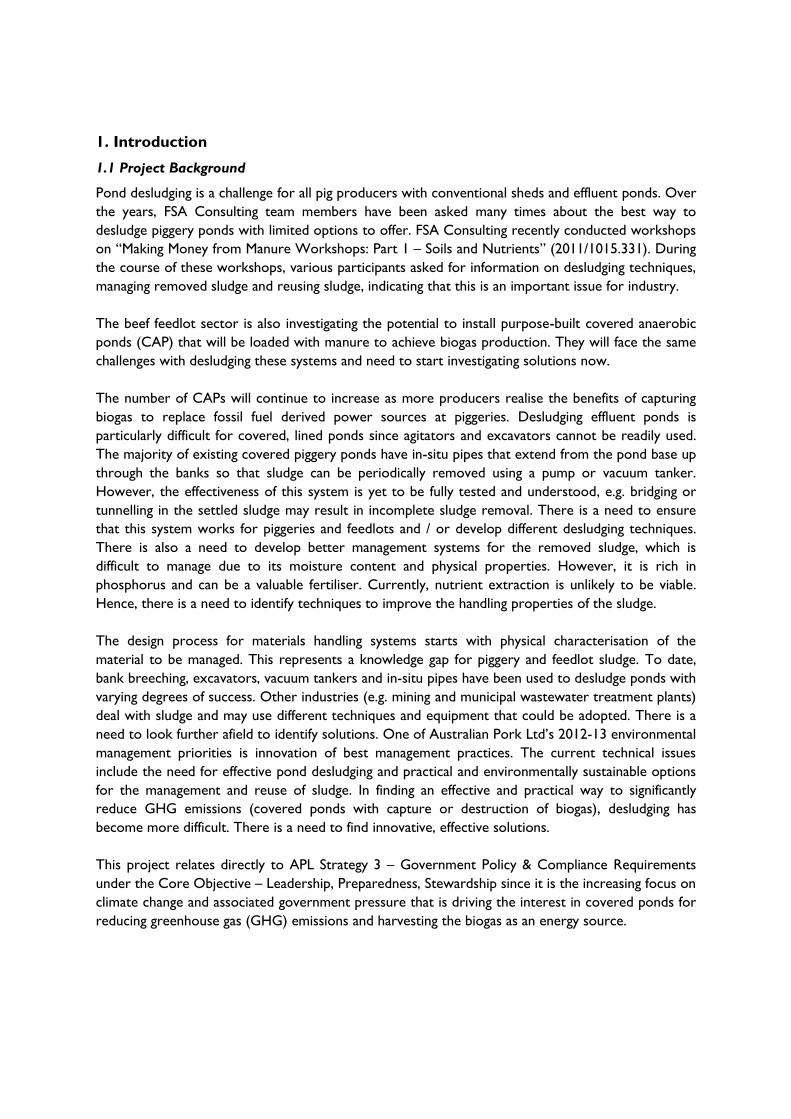
1. Introduction
1.1 Project Background
Pond desludging is a challenge for all pig producers with conventional sheds and effluent ponds. Over
the years, FSA Consulting team members have been asked many times about the best way to
desludge piggery ponds with limited options to offer. FSA Consulting recently conducted workshops
on “Making Money from Manure Workshops: Part 1 – Soils and Nutrients” (2011/1015.331). During
the course of these workshops, various participants asked for information on desludging techniques,
managing removed sludge and reusing sludge, indicating that this is an important issue for industry.
The beef feedlot sector is also investigating the potential to install purpose-built covered anaerobic
ponds (CAP) that will be loaded with manure to achieve biogas production. They will face the same
challenges with desludging these systems and need to start investigating solutions now.
The number of CAPs will continue to increase as more producers realise the benefits of capturing
biogas to replace fossil fuel derived power sources at piggeries. Desludging effluent ponds is
particularly difficult for covered, lined ponds since agitators and excavators cannot be readily used.
The majority of existing covered piggery ponds have in-situ pipes that extend from the pond base up
through the banks so that sludge can be periodically removed using a pump or vacuum tanker.
However, the effectiveness of this system is yet to be fully tested and understood, e.g. bridging or
tunnelling in the settled sludge may result in incomplete sludge removal. There is a need to ensure
that this system works for piggeries and feedlots and / or develop different desludging techniques.
There is also a need to develop better management systems for the removed sludge, which is
difficult to manage due to its moisture content and physical properties. However, it is rich in
phosphorus and can be a valuable fertiliser. Currently, nutrient extraction is unlikely to be viable.
Hence, there is a need to identify techniques to improve the handling properties of the sludge.
The design process for materials handling systems starts with physical characterisation of the
material to be managed. This represents a knowledge gap for piggery and feedlot sludge. To date,
bank breeching, excavators, vacuum tankers and in-situ pipes have been used to desludge ponds with
varying degrees of success. Other industries (e.g. mining and municipal wastewater treatment plants)
deal with sludge and may use different techniques and equipment that could be adopted. There is a
need to look further afield to identify solutions. One of Australian Pork Ltd’s 2012-13 environmental
management priorities is innovation of best management practices. The current technical issues
include the need for effective pond desludging and practical and environmentally sustainable options
for the management and reuse of sludge. In finding an effective and practical way to significantly
reduce GHG emissions (covered ponds with capture or destruction of biogas), desludging has
become more difficult. There is a need to find innovative, effective solutions.
This project relates directly to APL Strategy 3 – Government Policy & Compliance Requirements
under the Core Objective – Leadership, Preparedness, Stewardship since it is the increasing focus on
climate change and associated government pressure that is driving the interest in covered ponds for
reducing greenhouse gas (GHG) emissions and harvesting the biogas as an energy source.
1.2 Project Objectives
The project objectives, taken from the research contract, include:
To characterise the physical properties of piggery pond sludge and feedlot sedimentation
basin and pond solids.
To review current practice and research pertaining to the properties of piggery and feedlot
pond sludge, desludging and sludge management, including methods currently used by the pig
and feedlot industries and also by other relevant industries.
To provide a technical report and fact sheets containing recommendations for removing and
managing the sludge from piggery and feedlot effluent ponds.
One of the original project objectives was to assess the performance of in-situ pipes, a pump and a
Z-filter for desludging a covered, lined pond and dewatering the removed sludge. This objective was
removed from the project in March 2013.
2 Sludge, Slurry and Effluent
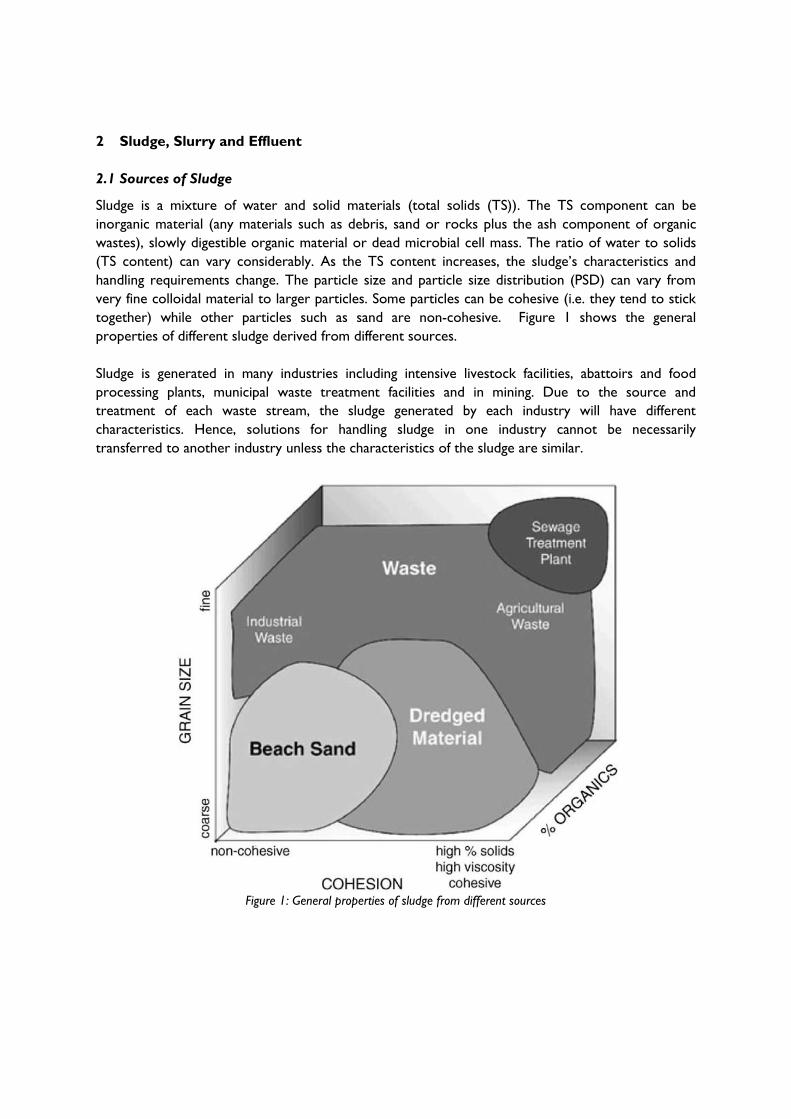
2.1 Sources of Sludge
Sludge is a mixture of water and solid materials (total solids (TS)). The TS component can be
inorganic material (any materials such as debris, sand or rocks plus the ash component of organic
wastes), slowly digestible organic material or dead microbial cell mass. The ratio of water to solids
(TS content) can vary considerably. As the TS content increases, the sludge’s characteristics and
handling requirements change. The particle size and particle size distribution (PSD) can vary from
very fine colloidal material to larger particles. Some particles can be cohesive (i.e. they tend to stick
together) while other particles such as sand are non-cohesive. Figure 1 shows the general
properties of different sludge derived from different sources.
Sludge is generated in many industries including intensive livestock facilities, abattoirs and food
processing plants, municipal waste treatment facilities and in mining. Due to the source and
treatment of each waste stream, the sludge generated by each industry will have different
characteristics. Hence, solutions for handling sludge in one industry cannot be necessarily
transferred to another industry unless the characteristics of the sludge are similar.
Figure 1: General properties of sludge from different sources
2.2 Rheology
Rheology is the study of the flow of matter, primarily in the liquid state, but also as 'soft solids' or
solids under conditions in which they respond with plastic flow rather than deforming elastically in
response to an applied force. It applies to substances which have a complex microstructure, such as
muds, sludge, suspensions, polymers and other glass formers (e.g. silicates), as well as many foods
and additives, bodily fluids (e.g. blood) and other biological materials or other materials which belong
to the class of soft matter.
Newtonian fluids can be characterized by a single coefficient of viscosity for a specific temperature.
Although this viscosity will change with temperature, it does not change with the strain rate (i.e.
flow velocity). Only a small group of fluids exhibit such constant viscosity, and they are known as
Newtonian fluids. This includes water. However, for a large class of fluids, the viscosity changes with
the strain rate (or relative velocity of flow). These are called non-Newtonian fluids.
Rheology generally accounts for the behaviour of non-Newtonian fluids, by characterizing the
minimum number of functions that are needed to relate stresses with rate of change of strains or
strain rates. For example, tomato sauce can have its viscosity reduced by shaking (or other forms of
mechanical agitation, where the relative movement of different layers in the material actually causes
the reduction in viscosity) but water cannot. Tomato sauce is a shear thinning material, as an
increase in relative velocity caused a reduction in viscosity, while some other non-Newtonian
materials show the opposite behaviour: viscosity going up with relative deformation, which are called
shear thickening or dilatants materials.
Since Sir Isaac Newton originated the concept of viscosity, the study of liquids with strain rate
dependent viscosity is also often called non-Newtonian fluid mechanics. Within non-Newton fluids,
there are two types. Homogenous fluids (e.g. hot chocolate or molasses) does not have solid
particles that settle out. They can be pumped at low velocities. However, many agricultural slurries
have settable particles which rapidly settle. These fluids must be pumped at a higher velocity or
solids may settle in the pipeline, pipe fittings or pump intakes. An understanding of the rheological
properties of a material is required for optimal sludge handling and management.
2.3 Definitions of Sludge, Slurry and Effluent
The term – sludge – is widely used for a range of materials. However, as will be shown in the report,
the handling and management options for “sludge” is heavily dependent on the TS content of the
material. Landry et al. (2002) simply distinguishes between solid and semi-solid manure (i.e. manure
having a TS content >10%) and liquid manure and slurry. A better definition is required for this
report.
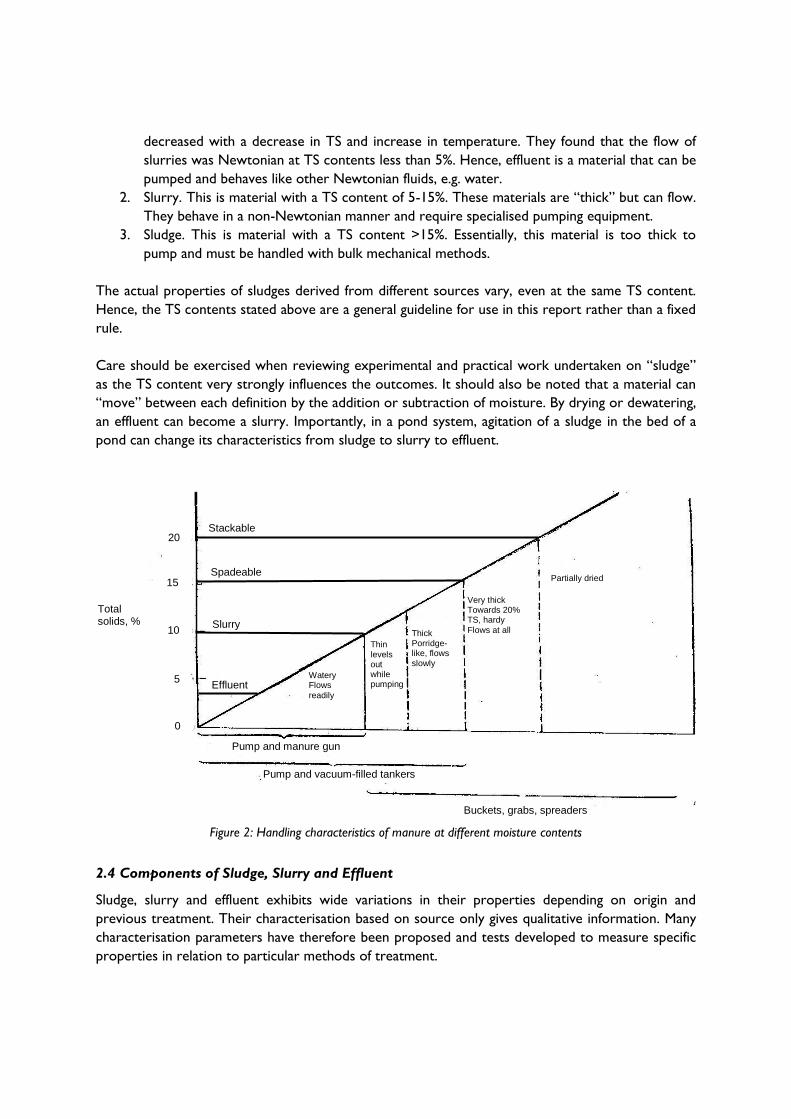
For piggery waste, Figure 2: Handling characteristics of manure at different moisture contents
shows the range of total solids in a solid/water mixture and the characteristics and handling options
of different ratios. Hence, some specific definitions are required. In this report, the following terms
have been defined.
1. Effluent. This is material with a TS content of <5%. Kumar et al. (1972) studied the
properties of animal waste slurries. They found that the viscosity of dairy cattle slurry
decreased with a decrease in TS and increase in temperature. They found that the flow of
slurries was Newtonian at TS contents less than 5%. Hence, effluent is a material that can be
pumped and behaves like other Newtonian fluids, e.g. water.
2. Slurry. This is material with a TS content of 5-15%. These materials are “thick” but can flow.
They behave in a non-Newtonian manner and require specialised pumping equipment.
3. Sludge. This is material with a TS content >15%. Essentially, this material is too thick to
pump and must be handled with bulk mechanical methods.
The actual properties of sludges derived from different sources vary, even at the same TS content.
Hence, the TS contents stated above are a general guideline for use in this report rather than a fixed
rule.
Care should be exercised when reviewing experimental and practical work undertaken on “sludge”
as the TS content very strongly influences the outcomes. It should also be noted that a material can
“move” between each definition by the addition or subtraction of moisture. By drying or dewatering,
an effluent can become a slurry. Importantly, in a pond system, agitation of a sludge in the bed of a
pond can change its characteristics from sludge to slurry to effluent.
Figure 2: Handling characteristics of manure at different moisture contents
2.4 Components of Sludge, Slurry and Effluent
Sludge, slurry and effluent exhibits wide variations in their properties depending on origin and
previous treatment. Their characterisation based on source only gives qualitative information. Many
characterisation parameters have therefore been proposed and tests developed to measure specific
properties in relation to particular methods of treatment.
20
15
10
5
0
Stackable
Partially dried Spadeable
Slurry
Very thick Towards 20% TS, hardy
Flows at all Thick Porridge-like, flows slowly
Thin levels out while pumping
Watery Flows
readily
Pump and manure gun
Pump and vacuum-filled tankers
Buckets, grabs, spreaders
Total solids, %
Effluent
Conventional characterisation parameters can be grouped into physical, chemical and biological
parameters:
physical parameters give general information on sludge and slurry processability and
handlability
chemical parameters are relevant to the presence of nutrients, salts and toxic/dangerous
compounds, so they become necessary in the case of utilisation in agriculture
biological parameters give information on microbial activity and organic matter/ pathogens
presence, thus allowing the safety of use to be evaluated.
The characteristics that are important depend on the handling and disposal methods adopted. The
most important parameters for handling and processing are the physical and rheological parameters.
The amount and type of solids present are important. Solid types can be divided into seven distinct
groups:
1. Total Solids (TS)
2. Settleable Solids (SS)
3. Dissolved Solids (DS)
4. Suspended Solids (SusS)
5. Volatile Solids (VS)
6. Volatile Suspended Solids (VSS)
7. Fixed Solids (FS)
The physical characteristics of the solid component, especially particle size distribution (PSD) and
bulk density, are important when designing handling equipment. Suspended solids are more likely to
settle out under gravity, whereas DS and SusS will not. Some odour generating compounds
(carbohydrate, proteins and fats) and organic nutrient elements are contained in the fine particles
that are typically not removed by mechanical separation systems. These finer particles are more
likely to be contained in the SusS, and contribute substantially to the VS fraction.
2.5 Physical Characteristics of Sludge, Slurry and Effluent
The physical characteristics depend on:
1. Original source material, particularly the ratio of organic to inorganic solid components (i.e.
VS: TS ratio).
2. Pre-treatment, i.e. the method of solids removal prior to pond entry.
3. Treatment, i.e. organic (anaerobic or aerobic) treatment or chemical (flocculation).
4. Age, i.e. the time period over which the sludge has accumulated.
Clearly, the characteristics of a mining sludge that primarily comprises of settled sand and clay will
be greatly different to a sludge formed at the base of a secondary, organic treatment pond.
2.5.1 Particle Size Distribution in Wastewater Solids
Research conducted by Payne (1984) concluded that piggery wastewater has a relatively uniform
distribution of particle size, with the greatest variation reported in the particle size range of 0.5 to
1.4 mm. Most variance from the mean at 0.75 mm resulted from differences in the diet fed. Pigs fed
whole grain masticate more, producing a greater proportion of small diameter particles in the faeces.
However, in most Australian piggeries only cracked, ground or pelleted grain is included in diets. In
one trial, particle size distributions in faeces were similar and smaller for diets incorporating whole
or ground grain, whilst cracked grain was associated with larger particle size fractions (Payne 1986).
The pig manure with the higher proportion of finer particles had a greater water retentivity (78%
versus 70% for the low fibre ration), and the time required for drying was twice as long. Handling
properties were different for the two manures, with slumping of solids occurring at 22% TS content
for the high fibre diet, compared with 35% TS for the low fibre ration. Changing the fibre content of
the feed ration also changes the particle size fractions in the wastewater. The concentration of, and
the size class of particles present in faeces, determine the ease of dewatering and other physical
handling characteristics. Objective comparisons of the performance of solids separation systems can
only be made if the influence of the feed diet on particle size (and therefore handling characteristics)
is considered.
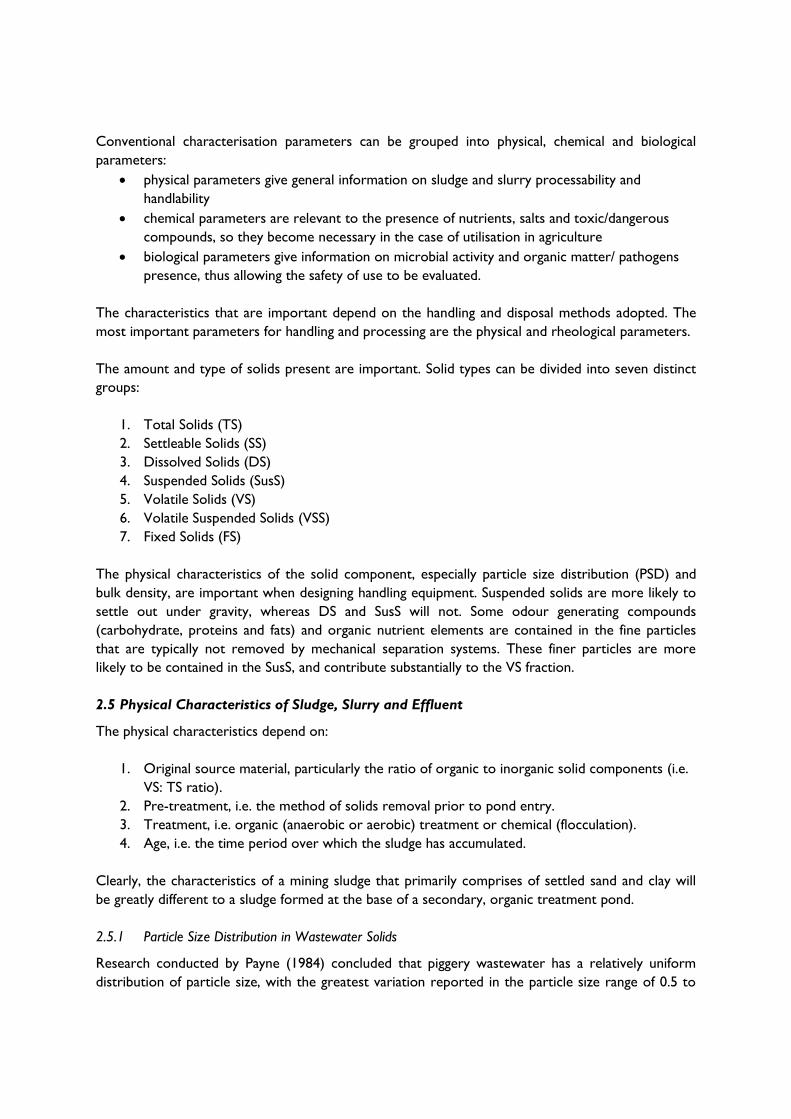
Variations in particle size from NSW piggeries (Payne 1984) piggery wastewater from the United
Kingdom (Pain et al. 1978) and flushing water (1% TS) from the “Berrybank Farm” piggery (Charles
2000) are shown in Table 1.
Table 1: Particle size distribution in piggery wastewater (% less than)
Size (m) Payne, 1984 Pain et al., 1978 Charles, 2000
<750 76 75 98
<500 - 70 94
<180 51 62 80
<45 45 58 62
<25 - 43 51
The efficacy of mechanical solid separation systems (e.g. screens) depends on manure particle size.
For a screen with a pore size of 1 mm, TS removal would vary from 8-22% (Payne 1984). Given the
variation of the existing particle size distribution (PSD) data (Table 1) and the lack of experimental
measurements of solids removal efficiencies in Australia, assumptions on solids removal from
Australian piggeries are at best crude. This underpins a need to obtain particle size distribution for
wastewater solids and solids removal efficiencies under Australian conditions.
Marcato et al. (2008) studied the PSD and trace element patterns in a full-scale anaerobic digestion
plant treating piggery slurry. Analysis of PSD in raw and digested slurries (about 2%TS) showed a
general shift in distribution towards larger sizes due to degradation of small and easily degradable
particles as well as formation of large microbial filaments. Figure 2 and Figure 3 shows the PSD
results of raw and digested piggery slurry taken from Marcato et al. (2008).
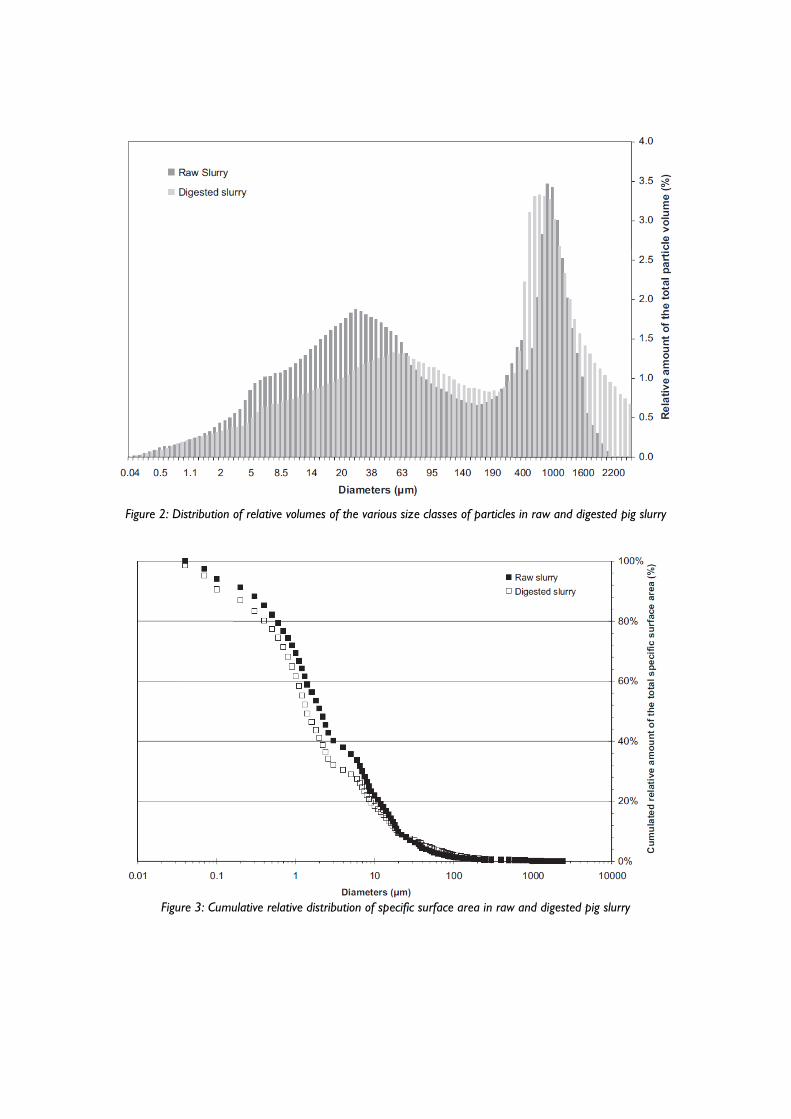
Figure 2: Distribution of relative volumes of the various size classes of particles in raw and digested pig slurry
Figure 3: Cumulative relative distribution of specific surface area in raw and digested pig slurry
2.5.2 Rheological Properties of Sludge and Slurries
Numerous studies have been conducted into the rheological properties of manure at different TS
contents. Density, rheological consistency index, flow behaviour index, specific heat and thermal
conductivity of beef cattle manure were determined by Chen (1982) Density was measured for TS
ranging from 1 to 99%. The results suggested that the density of manure increased as the total solids
concentration increased for manure having TS below 16%. For manure with TS above 50%, the bulk
density of the manure dropped much below the liquid manure density. Rheological properties where
measured for manure having TS between 1 and 14% and based on the results obtained, beef cattle
slurries were described as non-Newtonian pseudoplastic fluids, the deviation from Newtonian
behaviour increasing with TS. Brambilla et al. (2013) provides a review of the rheological behaviour
of slurries and provides rheological data on dairy manure, pig manure and wastewater slurries.
Chen and Shetler (1983) studied the effect of temperature on the rheological properties of cattle
manure slurry. They tested manure with TS ranging from 2.5 to 19.3% at temperatures between 14
and 64°C. The results of this study confirmed previous findings by Chen (1982) to the effect that
manure slurry is a non- Newtonian pseudoplastic fluid and that a power law could be used to
describe its behaviour in the tested shear rate range.
Achkari-Begdouri and Goodrich (1992) studied the rheological properties of Moroccan dairy cattle
manure with TS ranging from 2.5 to 12% at temperatures between 20 and 60°C. The rheological
properties studied included the consistency coefficient, the flow behaviour index and the apparent
viscosity. Their results showed that in the ranges of TS and temperature of the study, Moroccan
dairy cattle manure behaved as a pseudoplastic fluid. Two equations based on TS and temperature,
one yielding the consistency coefficient and the other predicting the flow behaviour index, were
proposed.
Landry et al. (2002) and Landry et al. (2004) studies the physical and rheological properties of
manure products including TS content, bulk density, PSD, friction characteristics, angle of repose and
shear-strain- shear stress relationships for a range of different animal types.
Several researchers have determined a similar general behavioural aspect of animal slurries. Most
researchers find that viscosity increases with increasing TS content and decreases with increasing
fluid temperature (Baudez et al. 2012, El-Mashad et al. 2004a, El-Mashad et al. 2004b, Hasar et al.
2004, Kumar et al. 1972, Staley et al. 1973), although Chen and Hashimoto (1976) found that
temperature had no effect. Figure 4 shows typical data showing the variation of shear stress
(viscosity) as TS and fluid temperature are changed on fresh dairy manure slurry. Staley et al. (1973)
used their viscosity measurements on fresh dairy slurry combined with conventional pipeline friction
equations to calculate pipe friction losses for slurries of different TS contents at different flow rates
(constant temperature of 20°C) (Figure 5). They confirmed this relationship in field measurements.
This data illustrates the effect that increasing TS content has on pumping head requirements.
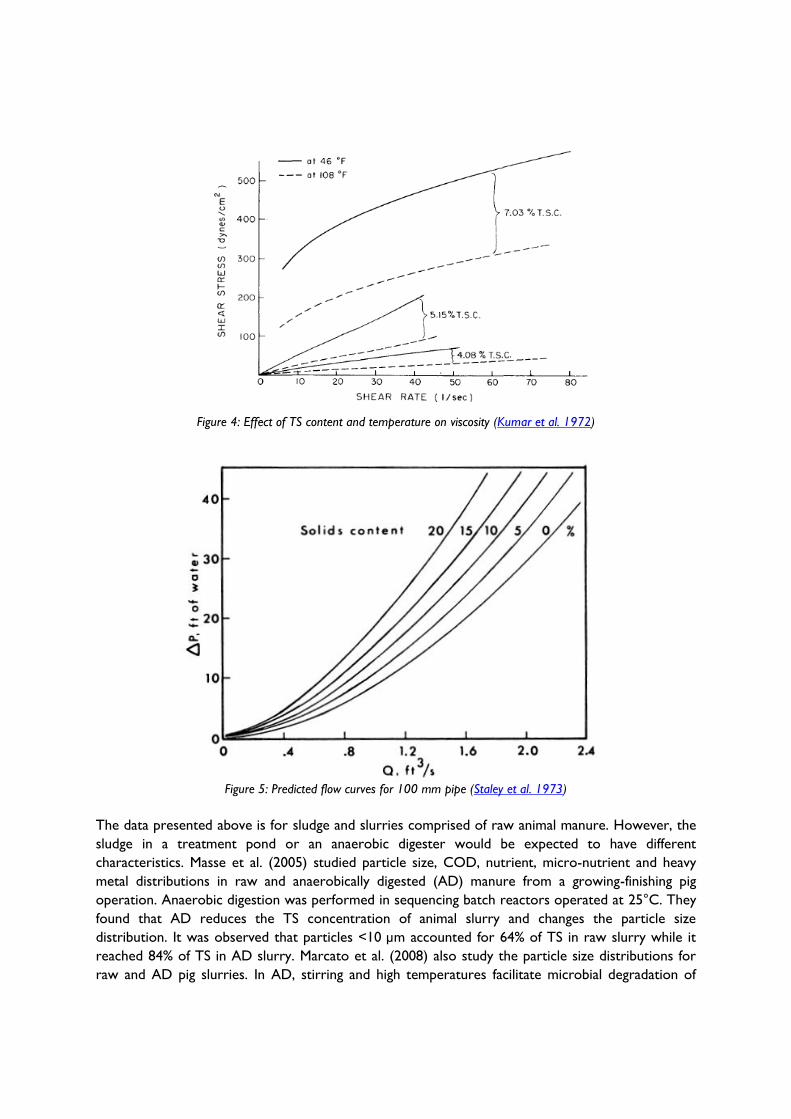
Figure 4: Effect of TS content and temperature on viscosity (Kumar et al. 1972)
Figure 5: Predicted flow curves for 100 mm pipe (Staley et al. 1973)
The data presented above is for sludge and slurries comprised of raw animal manure. However, the
sludge in a treatment pond or an anaerobic digester would be expected to have different
characteristics. Masse et al. (2005) studied particle size, COD, nutrient, micro-nutrient and heavy
metal distributions in raw and anaerobically digested (AD) manure from a growing-finishing pig
operation. Anaerobic digestion was performed in sequencing batch reactors operated at 25°C. They
found that AD reduces the TS concentration of animal slurry and changes the particle size
distribution. It was observed that particles <10 µm accounted for 64% of TS in raw slurry while it
reached 84% of TS in AD slurry. Marcato et al. (2008) also study the particle size distributions for
raw and AD pig slurries. In AD, stirring and high temperatures facilitate microbial degradation of
large particles, leaving relatively small particles made of slowly degradable material. Hence, it would
be expected that the rheological properties of an AD sludge would be different to the raw manure
from which it was derived.
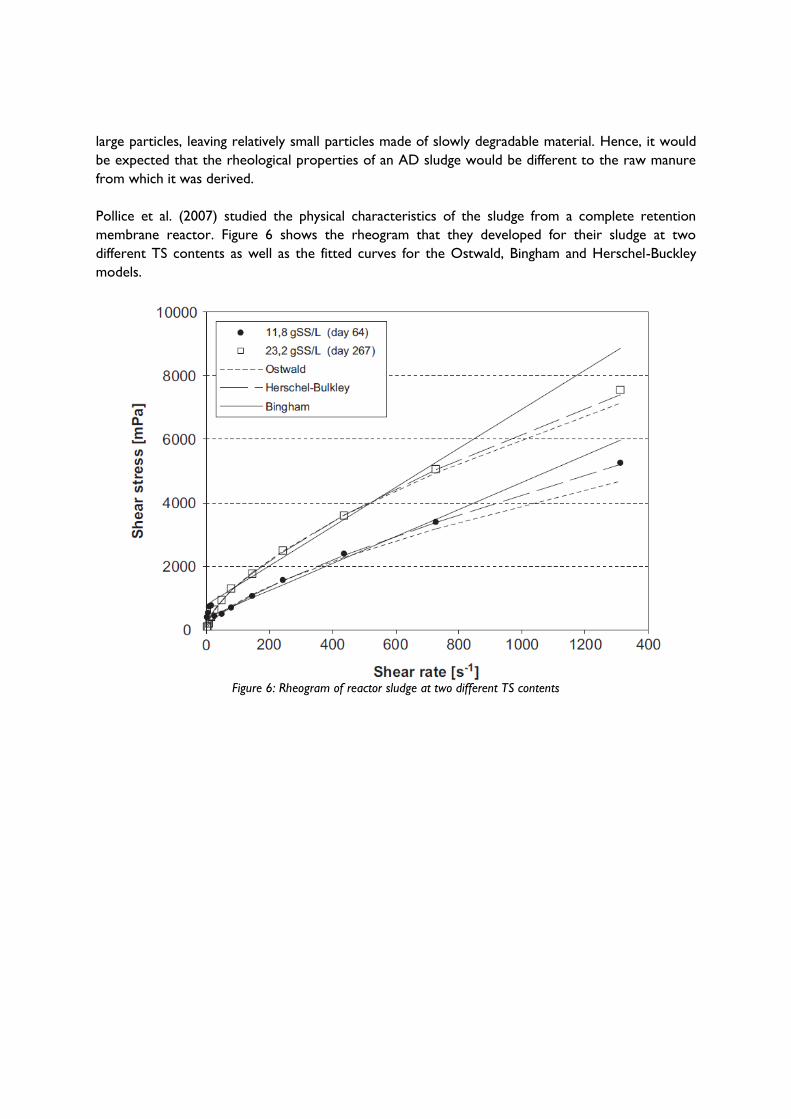
Pollice et al. (2007) studied the physical characteristics of the sludge from a complete retention
membrane reactor. Figure 6 shows the rheogram that they developed for their sludge at two
different TS contents as well as the fitted curves for the Ostwald, Bingham and Herschel-Buckley
models.
Figure 6: Rheogram of reactor sludge at two different TS contents
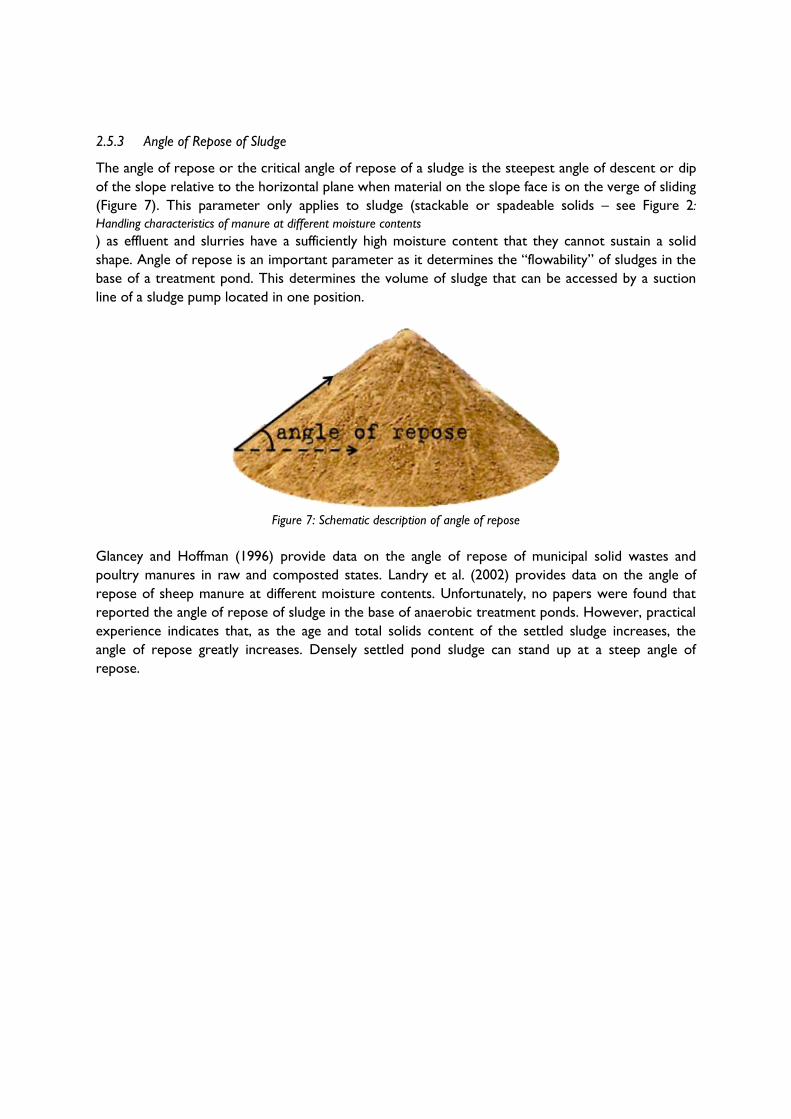
2.5.3 Angle of Repose of Sludge
The angle of repose or the critical angle of repose of a sludge is the steepest angle of descent or dip
of the slope relative to the horizontal plane when material on the slope face is on the verge of sliding
(Figure 7). This parameter only applies to sludge (stackable or spadeable solids – see Figure 2:
Handling characteristics of manure at different moisture contents
) as effluent and slurries have a sufficiently high moisture content that they cannot sustain a solid
shape. Angle of repose is an important parameter as it determines the “flowability” of sludges in the
base of a treatment pond. This determines the volume of sludge that can be accessed by a suction
line of a sludge pump located in one position.
Figure 7: Schematic description of angle of repose
Glancey and Hoffman (1996) provide data on the angle of repose of municipal solid wastes and
poultry manures in raw and composted states. Landry et al. (2002) provides data on the angle of
repose of sheep manure at different moisture contents. Unfortunately, no papers were found that
reported the angle of repose of sludge in the base of anaerobic treatment ponds. However, practical
experience indicates that, as the age and total solids content of the settled sludge increases, the
angle of repose greatly increases. Densely settled pond sludge can stand up at a steep angle of
repose.
3 Sources of Sludge and Slurries - Pond Systems
3.1 Background
Almost all conventional piggeries in Australia currently use pond-based systems to treat their
effluent. Overtime, settleable solids present in the influent, or formed during the treatment process,
will result in a steadily growing bottom sludge layer in the base of each pond that reduces the
effective treatment volume of that pond. The loss of treatment volume will, eventually, adversely
affect the overall treatment ability of the pond, causing the nutrient and solids content of the liquid
(supernatant) portion to increase, more sludge to be produced, and more odours to be released
from the pond’s surface as organic matter degradation slows. Eventually, this sludge must be
removed to ensure that the pond maintains the required hydraulic retention time (HRT) to keep
performing properly. Desludging also provides an opportunity to utilise the sludge, which can be
used in place of expensive inorganic phosphorus fertilisers. Desludging the ponds has always been
problematic. However, the challenge has increased with the recent moves towards synthetically-
lined and/or covered ponds for reducing GHG emissions and generating renewable energy for use
on-farm. The feedlot industry is also looking at developing similar systems, with purpose-built
covered ponds that will be loaded with manure to enhance biogas production. They will face the
same challenges with these systems. Great care is needed when desludging these ponds to prevent
damage to the synthetic liners and/or covers. Equipment such as excavators and agitators are
unsuitable in these systems. Dewatering the sludge removed from the ponds can also be difficult,
odorous and time consuming.
3.2 Pre-Treatment
In many feedlots and piggeries, a pre-treatment system (solid separator) is installed between the
waste source and the first treatment pond. The aim is to reduce the TS content of the waste stream.
The solid removal system can be based on settling, filtering, centrifuging or chemical flocculation.
Most feedlots have a sedimentation basin that removes solids entrained in runoff by a settling
process. In piggeries, there is a wider range of solid removal systems that are used. These can be
settling basins, static, rotating or vibrating screens or screw presses.
These various pre-treatment systems vary in their solids removal efficiency (i.e. the proportion of
incoming solids that are removed by the system) and the particle size distribution of the removed
solids. These performance parameters affect the quantity and quality of sludge that subsequently
forms in the treatment ponds.
3.3 Effluent Ponds
Effluent ponds are used for the effective treatment of piggery and feedlot effluent. The main
advantage is their simplicity to build and operate, with minimal maintenance requirements and
resilience to variable inflows. Despite their simple design, the systems contain complex ecosystems
which include viruses, algae, bacteria, protozoa, insects, parasites, and fungi (Kehl et al. 2009).
Through the action of microorganisms, complex organic cells are broken down into simple non-
organic substances. A major goal of an effluent pond system is to provide optimum growth
conditions for these organisms that promote complete decomposition of organic material and
inactivation of pathogens (Gloyna 1971). The treatment processes cannot be fully controlled and are
largely guided by physical and environmental constraints. These include solar radiation, temperature,
wind, pH, pond geometry, organic loading and pond hydraulics.
Different types of ponds serve different purposes. The range of operating parameters distinguishes
the type and performance. Ponds are distinguished largely by the dissolved oxygen (DO) of the
layers within the ponds, which in turn, is dependent on the organic matter loading of the pond
system.
3.4 Pond Types
The oxygen requirements of the bacteria and their relative numbers determine the classification of
the pond as either anaerobic (absence of oxygen) or aerobic (measurable dissolved oxygen present)
or facultative (containing a mix of anaerobic, aerobic and facultative bacteria, which can grow with or
without oxygen).
3.4.1 Anaerobic Ponds
Anaerobic ponds are populated mainly with microorganisms that do not need free oxygen from the
air to function (anaerobic microorganisms). Hence, they can have a role in treating effluent that has a
relatively high organic matter content. They provide a relatively cheap way to stabilise the effluent. If
the pond is covered, methane generated during the process can be captured and used for power
generation.
Anaerobic ponds are typically 4-6 m deep. Ideally, they should be relatively narrow, with steep side
batters to minimise surface area for odour release or covering, and to allow for easy desludging. As
anaerobic microorganisms grow slowly, the ponds work best if there is a regular inflow of effluent in
relation to pond active volume that does not have rapid and large variations in composition.
Anaerobic digestion of organic matter is a two-stage process. The first stage involves the breakdown
of complex organic matter like carbohydrates, fats and proteins to mainly yield organic acids. The
anaerobic and facultative microorganisms involved in this stage are known as the “acid forming
bacteria”. The effluent is stabilised during the second stage. In this stage, microorganism known as
“methane forming bacteria” convert these organic acids into methane and carbon dioxide gas. There
is a range of groups of methane formers and each group digests only a limited number of organic
acids. Consequently, complete digestion requires the presence and action of multiple different
groups of methane formers. The methane formers have a narrow pH range in which they survive
and function. When the system is balanced, the methane-formers break down the organic acids at
the rate that they are generated. If the organic acids are not broken down as they are generated, the
pond will become more acidic (and odorous). This adversely affects the second stage and can lead to
the release of the odorous acidic by-products of the first stage. It is for this reason that a regular
inflow of effluent helps to maintain good anaerobic pond function.
When sized appropriately, anaerobic ponds routinely remove 70% of BOD load (Metcalf & Eddy Inc.
2003). In Australian piggeries, primary anaerobic ponds are designed to reduce VS loading by around
70% (Tucker et al. 2010). Removal efficiencies of 80% to 90% have been recorded in anaerobic
lagoons designed to New Zealand dairy industry guidelines (Mason 1997). Chastain (2006) suggests
that anaerobic dairy lagoons remove around 56% of the VS load via settling. Pre-treatment by solid–
liquid separation would remove some of the readily settleable solids before the effluent enters the
anaerobic pond and therefore reduce the percentage solids reduction achieved in the pond. Hence,
the sludge characteristics of an anaerobic pond with solids removal is likely to be different from a
pond with no solids removal.
3.4.1.1 Uncovered Anaerobic Ponds
The IPCC 2006 guideline defines uncovered anaerobic ponds as:
“A type of liquid storage system designed and operated to combine waste stabilization and storage. Lagoon
supernatant is usually used to remove manure from the associated confinement facilities to the lagoon.
Anaerobic lagoons are designed with varying lengths of storage (up to a year or greater), depending on the
climate region, the volatile solids loading rate, and other operational factors. The water from the lagoon may
be recycled as flush water or used to irrigate and fertilise fields.” (Dong et al. 2006)
The majority of effluent treatment systems at Australian dairies and piggeries are uncovered
anaerobic ponds. They provide a long retention time and are perceived as a low capital cost option.
This system operates naturally from the microbial population that is already present in piggery
effluent. The activity of these ponds will vary depending on ambient temperature, and may be
affected by some feed additives. Uncovered anaerobic ponds can only achieve partial treatment and
so materials such as phosphorus, nitrogen and ash accumulate in the bottom of the pond as a sludge
layer. However, in general, anaerobic ponds are resilient, effective for reducing VS and require low
maintenance.
Uncovered anaerobic ponds are usually sized using a VS loading rate method. A minimum treatment
volume is determined plus an additional volume for sludge build up. The primary anaerobic pond
volume can be split into two or more ponds operating in parallel to allow the effluent treatment
operation to continue while one pond is being desludged.
3.4.1.2 Anaerobic Pond Design – Rational Design Standard
The most common methods for designing anaerobic treatment ponds are either the Rational Design
Standard (RDS) or variations of it. This method was developed by (Barth 1985) and was based on
three requirements:
Control of lagoon odour.
Allowance for sludge accumulation.
Maintain a minimum treatment volume.
Climate has a large effect on the biological activity of a pond. Anaerobic activity within piggery ponds
is reduced with lower average ambient temperatures. The volatile solids (VS) loading rate is adjusted
using a factor (k), which varies according to piggery location. Higher average ambient temperatures
in an area give a higher optimum pond loading rate. For instance, an area with a k factor of 1.0 has
twice the ability to degrade organic material as a lagoon with a k factor of 0.5.
The standard VS loading rate (100 g VS/m³/day) is multiplied by the temperature dependent k factor
to calculate the minimum required active volume of a pond (Equation 1).
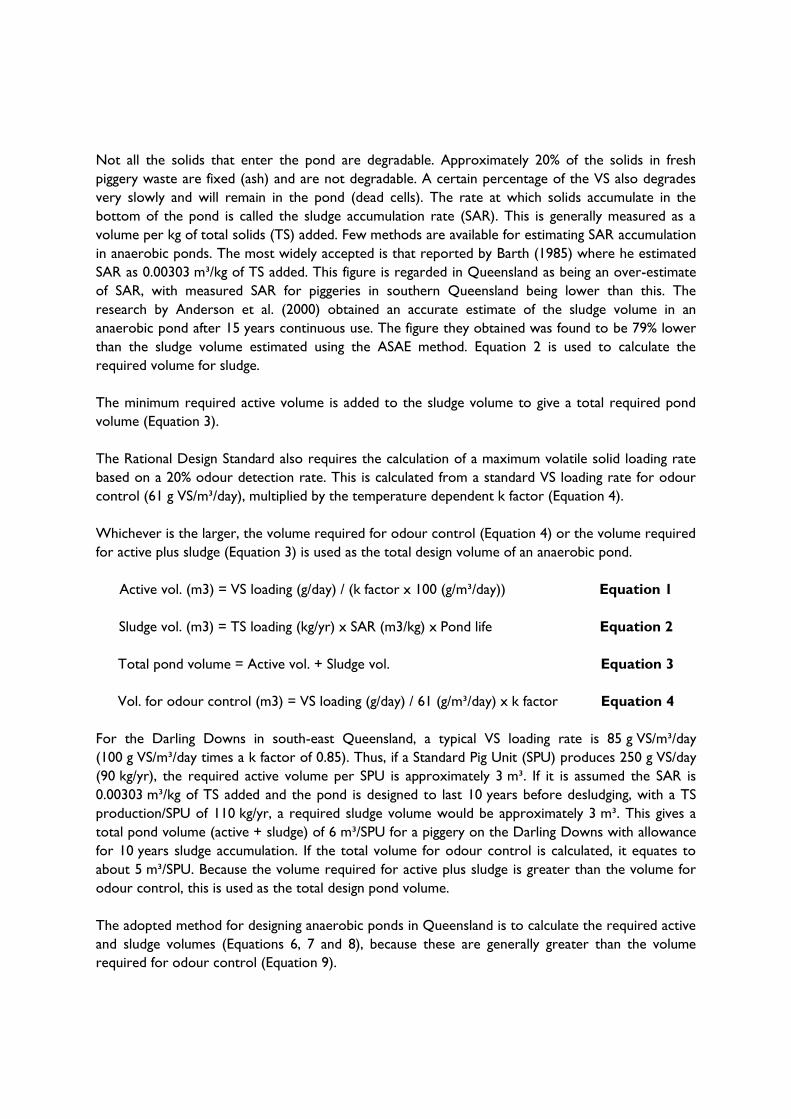
Not all the solids that enter the pond are degradable. Approximately 20% of the solids in fresh
piggery waste are fixed (ash) and are not degradable. A certain percentage of the VS also degrades
very slowly and will remain in the pond (dead cells). The rate at which solids accumulate in the
bottom of the pond is called the sludge accumulation rate (SAR). This is generally measured as a
volume per kg of total solids (TS) added. Few methods are available for estimating SAR accumulation
in anaerobic ponds. The most widely accepted is that reported by Barth (1985) where he estimated
SAR as 0.00303 m³/kg of TS added. This figure is regarded in Queensland as being an over-estimate
of SAR, with measured SAR for piggeries in southern Queensland being lower than this. The
research by Anderson et al. (2000) obtained an accurate estimate of the sludge volume in an
anaerobic pond after 15 years continuous use. The figure they obtained was found to be 79% lower
than the sludge volume estimated using the ASAE method. Equation 2 is used to calculate the
required volume for sludge.
The minimum required active volume is added to the sludge volume to give a total required pond
volume (Equation 3).
The Rational Design Standard also requires the calculation of a maximum volatile solid loading rate
based on a 20% odour detection rate. This is calculated from a standard VS loading rate for odour
control (61 g VS/m³/day), multiplied by the temperature dependent k factor (Equation 4).
Whichever is the larger, the volume required for odour control (Equation 4) or the volume required
for active plus sludge (Equation 3) is used as the total design volume of an anaerobic pond.
Active vol. (m3) = VS loading (g/day) / (k factor x 100 (g/m³/day)) Equation 1
Sludge vol. (m3) = TS loading (kg/yr) x SAR (m3/kg) x Pond life Equation 2
Total pond volume = Active vol. + Sludge vol. Equation 3
Vol. for odour control (m3) = VS loading (g/day) / 61 (g/m³/day) x k factor Equation 4
For the Darling Downs in south-east Queensland, a typical VS loading rate is 85 g VS/m³/day
(100 g VS/m³/day times a k factor of 0.85). Thus, if a Standard Pig Unit (SPU) produces 250 g VS/day
(90 kg/yr), the required active volume per SPU is approximately 3 m³. If it is assumed the SAR is
0.00303 m³/kg of TS added and the pond is designed to last 10 years before desludging, with a TS
production/SPU of 110 kg/yr, a required sludge volume would be approximately 3 m³. This gives a
total pond volume (active + sludge) of 6 m³/SPU for a piggery on the Darling Downs with allowance
for 10 years sludge accumulation. If the total volume for odour control is calculated, it equates to
about 5 m³/SPU. Because the volume required for active plus sludge is greater than the volume for
odour control, this is used as the total design pond volume.
The adopted method for designing anaerobic ponds in Queensland is to calculate the required active
and sludge volumes (Equations 6, 7 and 8), because these are generally greater than the volume
required for odour control (Equation 9).
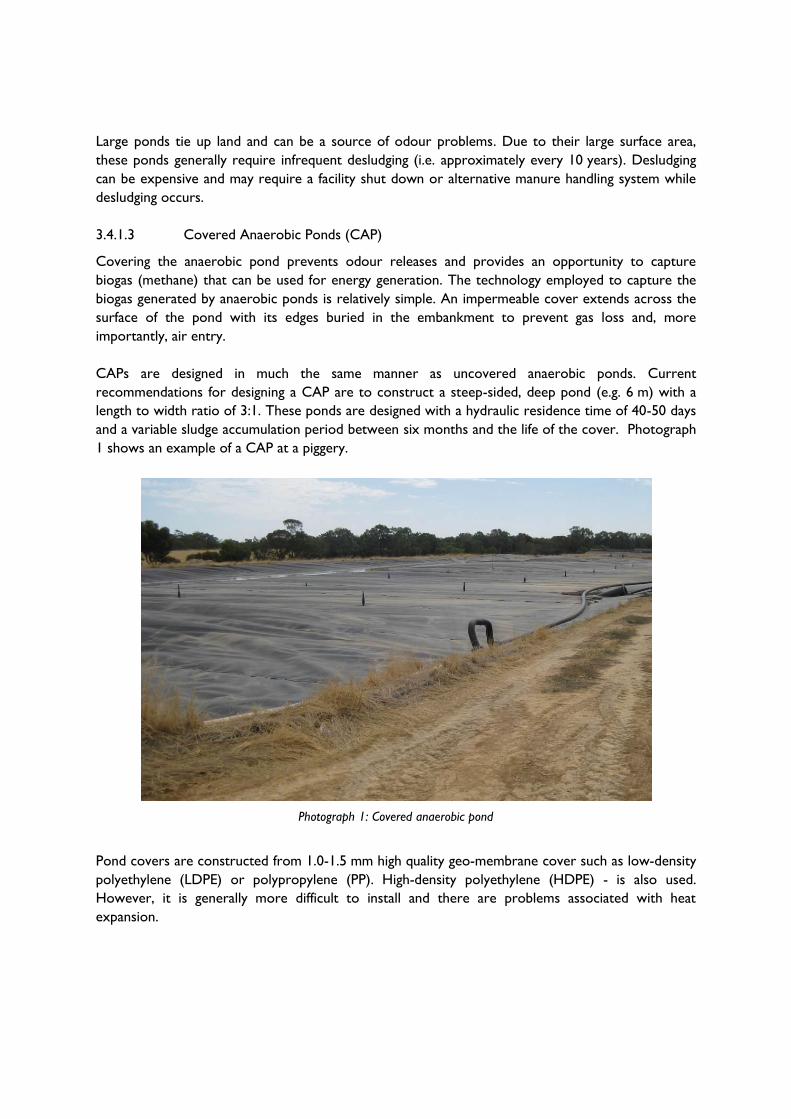
Large ponds tie up land and can be a source of odour problems. Due to their large surface area,
these ponds generally require infrequent desludging (i.e. approximately every 10 years). Desludging
can be expensive and may require a facility shut down or alternative manure handling system while
desludging occurs.
3.4.1.3 Covered Anaerobic Ponds (CAP)
Covering the anaerobic pond prevents odour releases and provides an opportunity to capture
biogas (methane) that can be used for energy generation. The technology employed to capture the
biogas generated by anaerobic ponds is relatively simple. An impermeable cover extends across the
surface of the pond with its edges buried in the embankment to prevent gas loss and, more
importantly, air entry.
CAPs are designed in much the same manner as uncovered anaerobic ponds. Current
recommendations for designing a CAP are to construct a steep-sided, deep pond (e.g. 6 m) with a
length to width ratio of 3:1. These ponds are designed with a hydraulic residence time of 40-50 days
and a variable sludge accumulation period between six months and the life of the cover. Photograph
1 shows an example of a CAP at a piggery.
Photograph 1: Covered anaerobic pond
Pond covers are constructed from 1.0-1.5 mm high quality geo-membrane cover such as low-density
polyethylene (LDPE) or polypropylene (PP). High-density polyethylene (HDPE) - is also used.
However, it is generally more difficult to install and there are problems associated with heat
expansion.
3.4.2 Facultative Ponds
A facultative pond provides a mixture of anaerobic (oxygen starved) treatment at lower levels and
aerobic (oxygen rich) treatment nearer to the surface of the pond. Facultative ponds are typically
designed with a depth of up to 2 m (Metcalf & Eddy Inc. 2003).
Facultative ponds contain a complex ecology and allow for the robust removal of contaminants
through settling, biodegradation and disinfection (Bryant 1995). These processes create a layer of
sludge at the base of the pond. The structure of a facultative pond is guided by the presence of
dissolved oxygen. Due to the turbidity of the pond, sunlight cannot penetrate through the entire
water column and a distinct temperature gradient can develop (Water Corporation 2010). Such
ponds can become stratified, influencing the flow conditions. The top layer of the pond is thus rich in
carbon dioxide, nutrients and sunlight, promoting the growth of algae and aerobic bacteria. This is a
highly aerobic environment. Levels of dissolved oxygen decrease throughout the water column,
forming an anaerobic layer at the base of the pond (Tadesse et al. 2004).
A range of microbial processes in the facultative pond further breakdown the remaining organic
material. The sludge layer is anaerobic and is responsible for a significant degree of decomposition
that takes place (Gloyna 1971, Water Corporation 2010).
Often, at feedlots and piggeries, facultative ponds develop a purple colour. Purple sulphur bacteria
(psb) have the potential to reduce pond odour by oxidising hydrogen sulphide into elemental sulphur
during photosynthesis. They occur in anaerobic environments that have reduced sulphur present.
They give the pond a brownish purple to pink colour, depending on the population. The conditions
required to maintain a healthy population of psb is not well known. Work by Gilley et al. (2000)
suggests that high levels of dietary copper fed in weaner diets may reduce the potential for psb to
proliferate, whereas dietary zinc may inversely promote its growth. Other conditions that may
reduce the potential for the presence of psb are high salinity level (>6 dS/m) and the presence of
antimicrobials in the ponds.
Schulte and Koelsch (1998) reported the results of a detailed study of eight anaerobic lagoons and
the survey of an additional 28 anaerobic lagoons in Nebraska. The results were collected in early
spring and again in mid-summer. As the reported temperature range for the summer sampling is
closest to Australian conditions, only the summer results will be discussed here.
Bacteriochlorophyll a (Bchl a) was used as a measure of the abundance of psb, with values between
0.043 and 1.018 mg/L obtained at the lagoon surface. Bchl a concentrations in purple lagoons were
significantly greater than in non-purple lagoons (P = 0.02). Average pH values for purple and non-
purple ponds were 7.4 and 7.8 respectively (statistically different at the P = 0.005 level). The
oxidation-reduction potential (redox) at the surface was found to vary from -266 mv to -321 mv,
and was less negative for purple lagoons than non-purple lagoons (P = 0.006).
No relationship was found between psb and volatile solids loading rate, but the purple lagoons were
found to have comparatively high volumes of flush and cleaning water per animal unit. Solids,
alkalinity, salinity and COD concentrations were lower in purple lagoons compared to non-purple
lagoons, but were not statistically different. Ammonium concentrations were statistically lower in
purple lagoons than in non-purple lagoons (P = 0.01). Salinity levels in excess of approximately 6
dS/m were associated with consistently low levels of Bchl a.
Hydrogen sulphide oxidised by psb is abundant in animal waste ponds because of sulphate-reducing
bacteria, which reduce sulphate to hydrogen sulphide. The elemental sulphur formed by psb
eventually returns to sulphate, completing the sulphur cycle. Anecdotal evidence suggests that the
presence of purple sulphur bacteria is an indication of good lagoon function and reduced odour
production. However, there are no odour emission studies to confirm this.
Unlike heavily-loaded ponds, pink ponds have the following characteristics:
Uniform bright pink to dark purple-brown colour
Little floating scum
Few large bubbles – fine uniform bubbles across the pond surface
“Musky” character to odour.
Photograph 2 shows a typical pink facultative pond.
Facultative ponds are simple and low maintenance but they can be easily overloaded and seasonality
will affect performance. For effluent streams with high organic loads, facultative ponds should be
used only after an anaerobic pond has provided substantial treatment and removal of settleable
solids. If land area permits, an anaerobic pond followed by a facultative pond can form a suitable
secondary treatment process.
Similar to anaerobic ponds, sludge distribution in facultative ponds has been found to be highly
uneven and is further illustrated in Photograph 3.
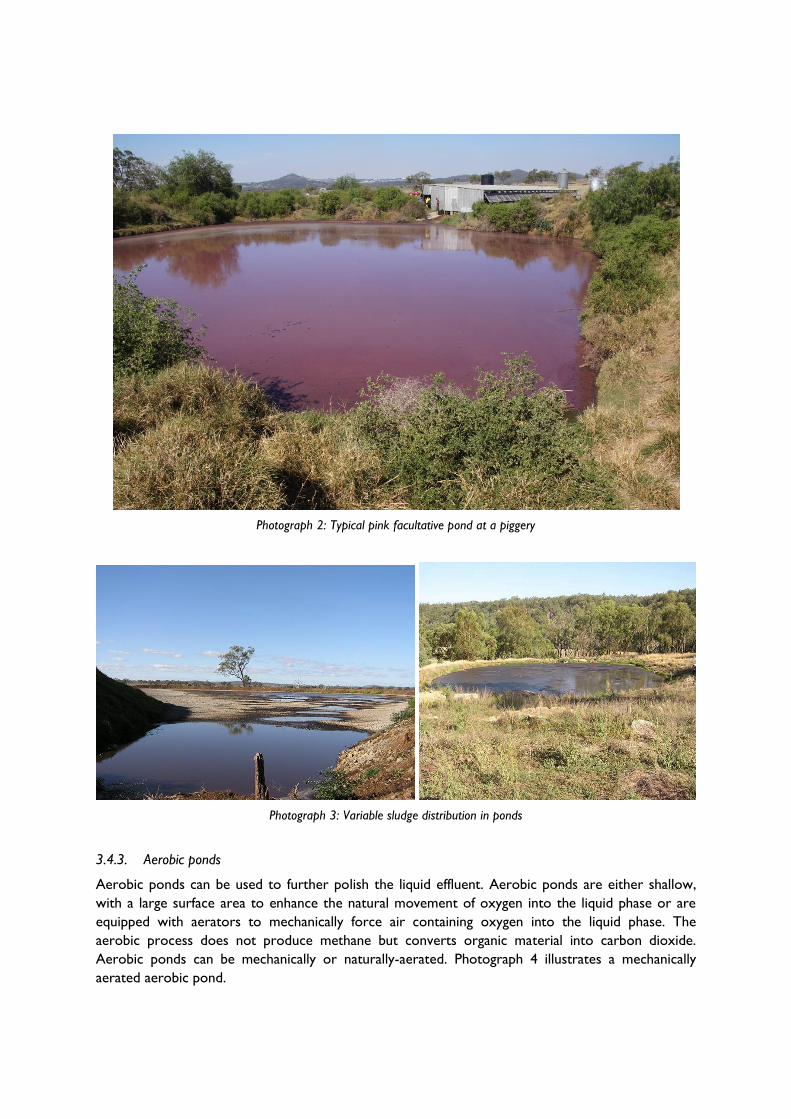
Photograph 2: Typical pink facultative pond at a piggery
Photograph 3: Variable sludge distribution in ponds
3.4.3. Aerobic ponds
Aerobic ponds can be used to further polish the liquid effluent. Aerobic ponds are either shallow,
with a large surface area to enhance the natural movement of oxygen into the liquid phase or are
equipped with aerators to mechanically force air containing oxygen into the liquid phase. The
aerobic process does not produce methane but converts organic material into carbon dioxide.
Aerobic ponds can be mechanically or naturally-aerated. Photograph 4 illustrates a mechanically
aerated aerobic pond.
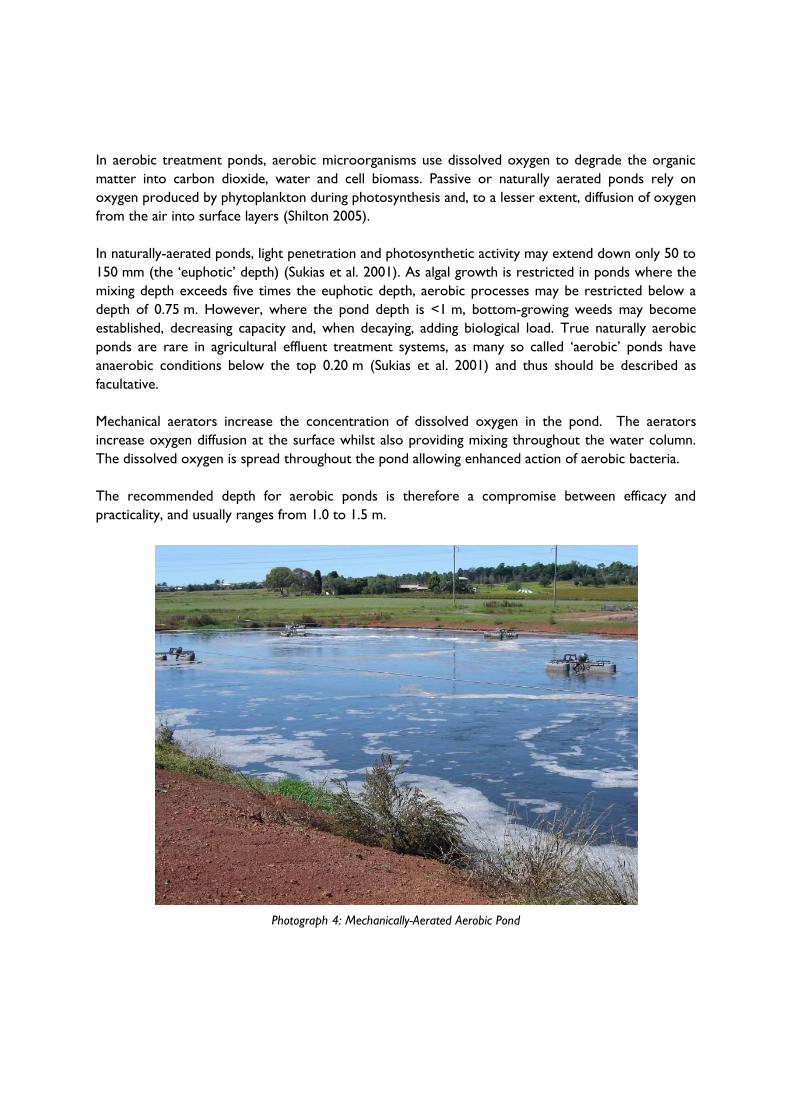
In aerobic treatment ponds, aerobic microorganisms use dissolved oxygen to degrade the organic
matter into carbon dioxide, water and cell biomass. Passive or naturally aerated ponds rely on
oxygen produced by phytoplankton during photosynthesis and, to a lesser extent, diffusion of oxygen
from the air into surface layers (Shilton 2005).
In naturally-aerated ponds, light penetration and photosynthetic activity may extend down only 50 to
150 mm (the ‘euphotic’ depth) (Sukias et al. 2001). As algal growth is restricted in ponds where the
mixing depth exceeds five times the euphotic depth, aerobic processes may be restricted below a
depth of 0.75 m. However, where the pond depth is <1 m, bottom-growing weeds may become
established, decreasing capacity and, when decaying, adding biological load. True naturally aerobic
ponds are rare in agricultural effluent treatment systems, as many so called ‘aerobic’ ponds have
anaerobic conditions below the top 0.20 m (Sukias et al. 2001) and thus should be described as
facultative.
Mechanical aerators increase the concentration of dissolved oxygen in the pond. The aerators
increase oxygen diffusion at the surface whilst also providing mixing throughout the water column.
The dissolved oxygen is spread throughout the pond allowing enhanced action of aerobic bacteria.
The recommended depth for aerobic ponds is therefore a compromise between efficacy and
practicality, and usually ranges from 1.0 to 1.5 m.
Photograph 4: Mechanically-Aerated Aerobic Pond
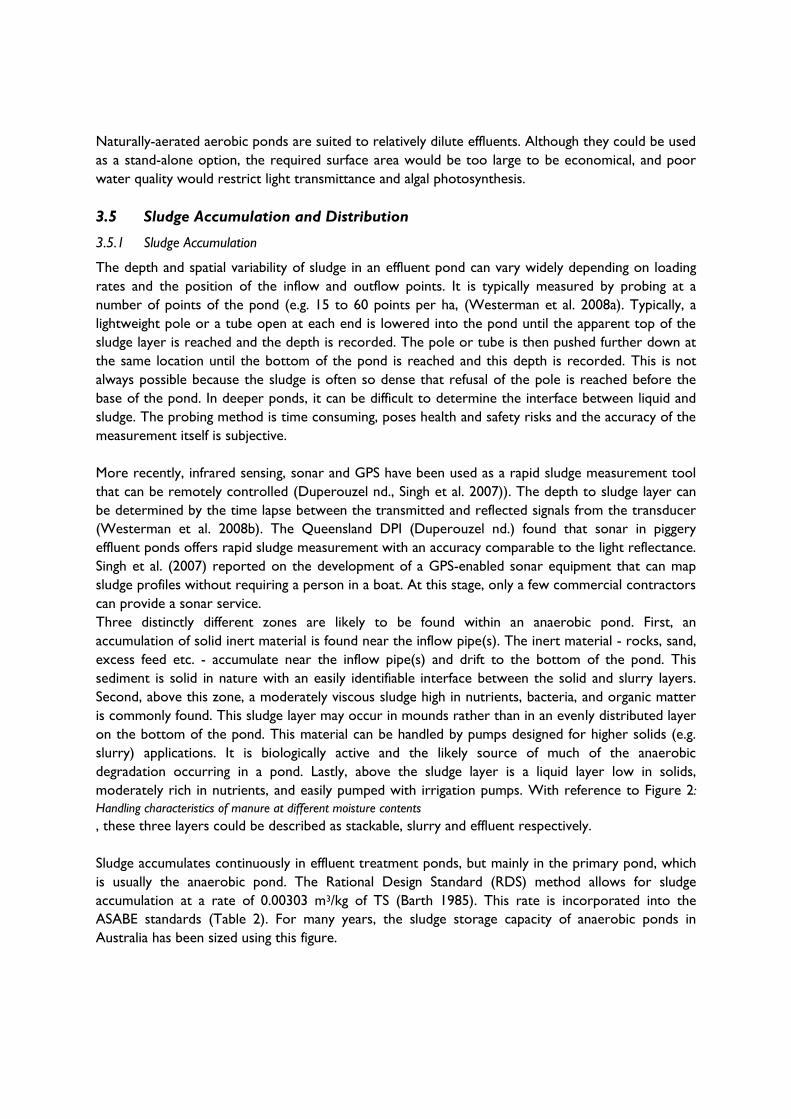
Naturally-aerated aerobic ponds are suited to relatively dilute effluents. Although they could be used
as a stand-alone option, the required surface area would be too large to be economical, and poor
water quality would restrict light transmittance and algal photosynthesis.
3.5 Sludge Accumulation and Distribution
3.5.1 Sludge Accumulation
The depth and spatial variability of sludge in an effluent pond can vary widely depending on loading
rates and the position of the inflow and outflow points. It is typically measured by probing at a
number of points of the pond (e.g. 15 to 60 points per ha, (Westerman et al. 2008a). Typically, a
lightweight pole or a tube open at each end is lowered into the pond until the apparent top of the
sludge layer is reached and the depth is recorded. The pole or tube is then pushed further down at
the same location until the bottom of the pond is reached and this depth is recorded. This is not
always possible because the sludge is often so dense that refusal of the pole is reached before the
base of the pond. In deeper ponds, it can be difficult to determine the interface between liquid and
sludge. The probing method is time consuming, poses health and safety risks and the accuracy of the
measurement itself is subjective.
More recently, infrared sensing, sonar and GPS have been used as a rapid sludge measurement tool
that can be remotely controlled (Duperouzel nd., Singh et al. 2007)). The depth to sludge layer can
be determined by the time lapse between the transmitted and reflected signals from the transducer
(Westerman et al. 2008b). The Queensland DPI (Duperouzel nd.) found that sonar in piggery
effluent ponds offers rapid sludge measurement with an accuracy comparable to the light reflectance.
Singh et al. (2007) reported on the development of a GPS-enabled sonar equipment that can map
sludge profiles without requiring a person in a boat. At this stage, only a few commercial contractors
can provide a sonar service.
Three distinctly different zones are likely to be found within an anaerobic pond. First, an
accumulation of solid inert material is found near the inflow pipe(s). The inert material - rocks, sand,
excess feed etc. - accumulate near the inflow pipe(s) and drift to the bottom of the pond. This
sediment is solid in nature with an easily identifiable interface between the solid and slurry layers.
Second, above this zone, a moderately viscous sludge high in nutrients, bacteria, and organic matter
is commonly found. This sludge layer may occur in mounds rather than in an evenly distributed layer
on the bottom of the pond. This material can be handled by pumps designed for higher solids (e.g.
slurry) applications. It is biologically active and the likely source of much of the anaerobic
degradation occurring in a pond. Lastly, above the sludge layer is a liquid layer low in solids,
moderately rich in nutrients, and easily pumped with irrigation pumps. With reference to Figure 2:
Handling characteristics of manure at different moisture contents
, these three layers could be described as stackable, slurry and effluent respectively.
Sludge accumulates continuously in effluent treatment ponds, but mainly in the primary pond, which
is usually the anaerobic pond. The Rational Design Standard (RDS) method allows for sludge
accumulation at a rate of 0.00303 m3/kg of TS (Barth 1985). This rate is incorporated into the
ASABE standards (Table 2). For many years, the sludge storage capacity of anaerobic ponds in
Australia has been sized using this figure.
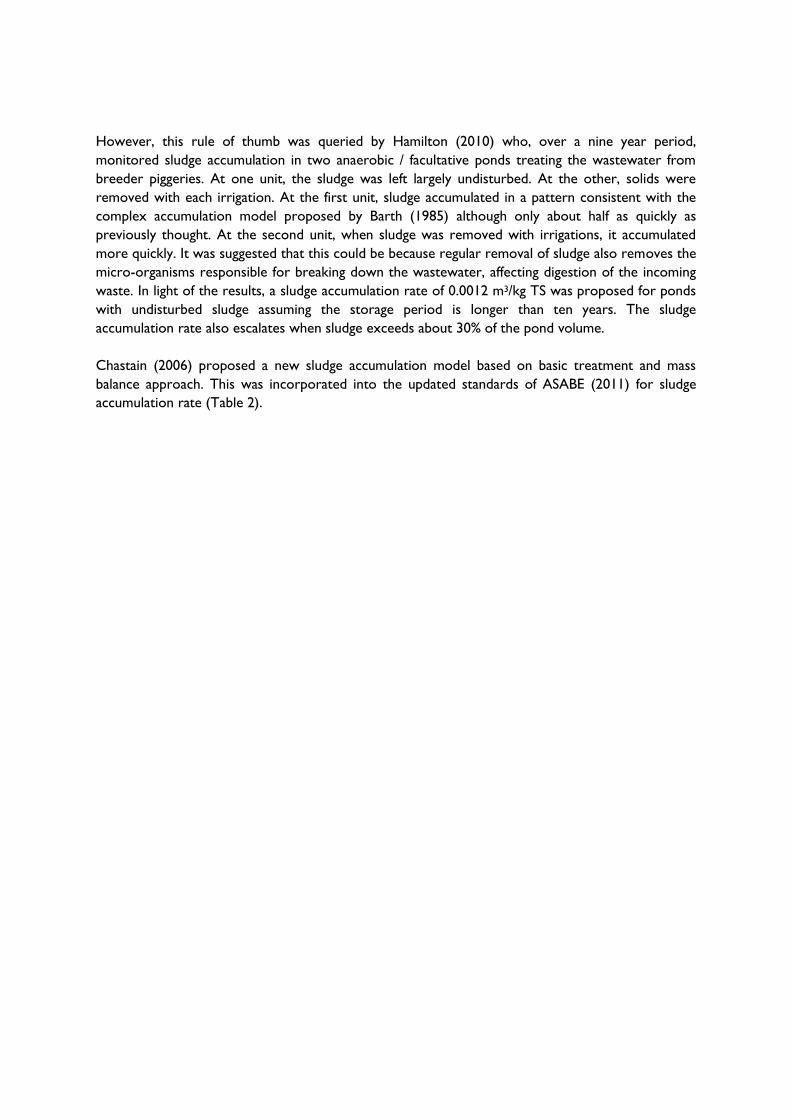
However, this rule of thumb was queried by Hamilton (2010) who, over a nine year period,
monitored sludge accumulation in two anaerobic / facultative ponds treating the wastewater from
breeder piggeries. At one unit, the sludge was left largely undisturbed. At the other, solids were
removed with each irrigation. At the first unit, sludge accumulated in a pattern consistent with the
complex accumulation model proposed by Barth (1985) although only about half as quickly as
previously thought. At the second unit, when sludge was removed with irrigations, it accumulated
more quickly. It was suggested that this could be because regular removal of sludge also removes the
micro-organisms responsible for breaking down the wastewater, affecting digestion of the incoming
waste. In light of the results, a sludge accumulation rate of 0.0012 m3/kg TS was proposed for ponds
with undisturbed sludge assuming the storage period is longer than ten years. The sludge
accumulation rate also escalates when sludge exceeds about 30% of the pond volume.
Chastain (2006) proposed a new sludge accumulation model based on basic treatment and mass
balance approach. This was incorporated into the updated standards of ASABE (2011) for sludge
accumulation rate (Table 2).
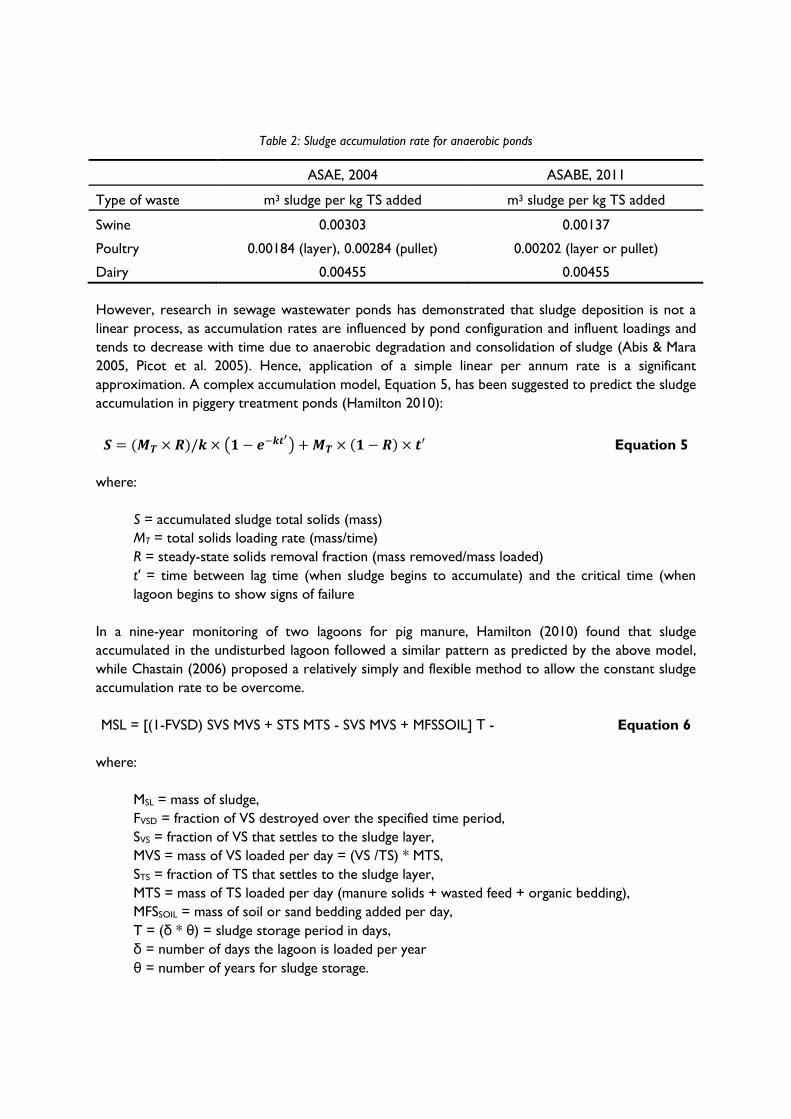
Table 2: Sludge accumulation rate for anaerobic ponds
ASAE, 2004 ASABE, 2011
Type of waste m3 sludge per kg TS added m3 sludge per kg TS added
Swine 0.00303 0.00137
Poultry 0.00184 (layer), 0.00284 (pullet) 0.00202 (layer or pullet)
Dairy 0.00455 0.00455
However, research in sewage wastewater ponds has demonstrated that sludge deposition is not a
linear process, as accumulation rates are influenced by pond configuration and influent loadings and
tends to decrease with time due to anaerobic degradation and consolidation of sludge (Abis & Mara
2005, Picot et al. 2005). Hence, application of a simple linear per annum rate is a significant
approximation. A complex accumulation model, Equation 5, has been suggested to predict the sludge
accumulation in piggery treatment ponds (Hamilton 2010):
Equation 5
where:
S = accumulated sludge total solids (mass)
MT = total solids loading rate (mass/time)
R = steady-state solids removal fraction (mass removed/mass loaded)
t′ = time between lag time (when sludge begins to accumulate) and the critical time (when
lagoon begins to show signs of failure
In a nine-year monitoring of two lagoons for pig manure, Hamilton (2010) found that sludge
accumulated in the undisturbed lagoon followed a similar pattern as predicted by the above model,
while Chastain (2006) proposed a relatively simply and flexible method to allow the constant sludge
accumulation rate to be overcome.
MSL = [(1-FVSD) SVS MVS + STS MTS - SVS MVS + MFSSOIL] Τ - Equation 6
where:
MSL = mass of sludge,
FVSD = fraction of VS destroyed over the specified time period,
SVS = fraction of VS that settles to the sludge layer,
MVS = mass of VS loaded per day = (VS /TS) * MTS,
STS = fraction of TS that settles to the sludge layer,
MTS = mass of TS loaded per day (manure solids + wasted feed + organic bedding),
MFSSOIL = mass of soil or sand bedding added per day,
T = (δ * θ) = sludge storage period in days,
δ = number of days the lagoon is loaded per year
θ = number of years for sludge storage.
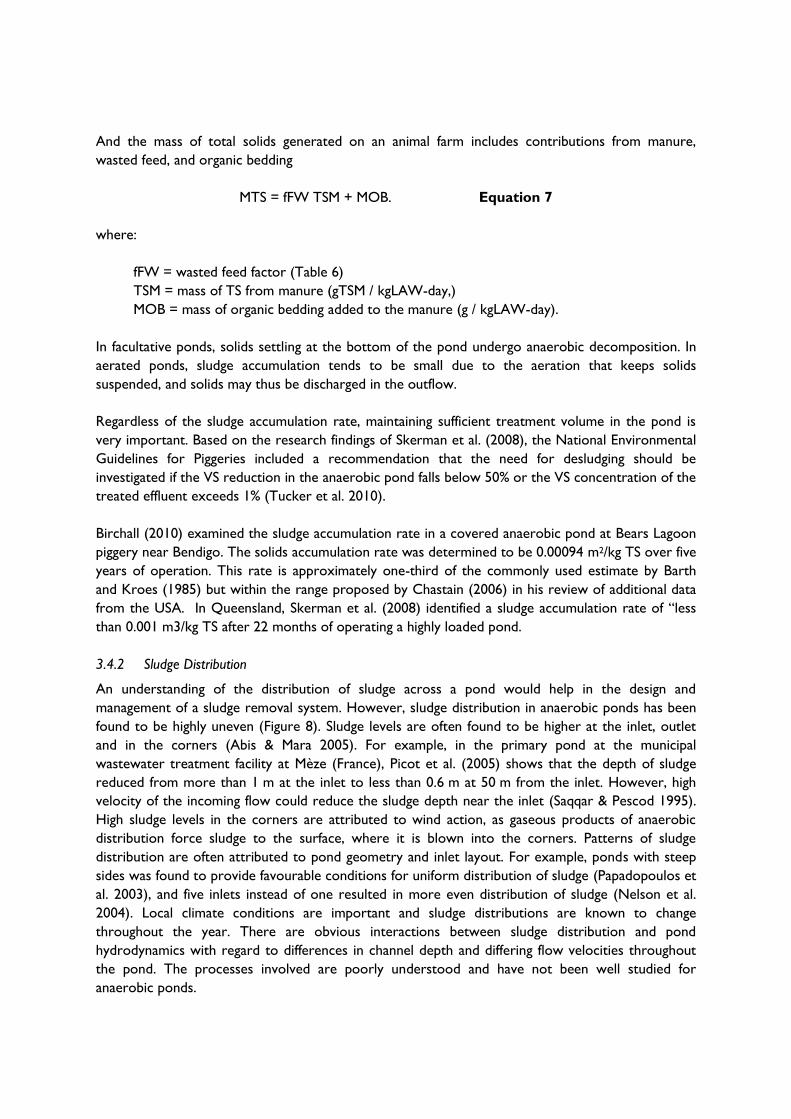
And the mass of total solids generated on an animal farm includes contributions from manure,
wasted feed, and organic bedding
MTS = fFW TSM + MOB. Equation 7
where:
fFW = wasted feed factor (Table 6)
TSM = mass of TS from manure (gTSM / kgLAW-day,)
MOB = mass of organic bedding added to the manure (g / kgLAW-day).
In facultative ponds, solids settling at the bottom of the pond undergo anaerobic decomposition. In
aerated ponds, sludge accumulation tends to be small due to the aeration that keeps solids
suspended, and solids may thus be discharged in the outflow.
Regardless of the sludge accumulation rate, maintaining sufficient treatment volume in the pond is
very important. Based on the research findings of Skerman et al. (2008), the National Environmental
Guidelines for Piggeries included a recommendation that the need for desludging should be
investigated if the VS reduction in the anaerobic pond falls below 50% or the VS concentration of the
treated effluent exceeds 1% (Tucker et al. 2010).
Birchall (2010) examined the sludge accumulation rate in a covered anaerobic pond at Bears Lagoon
piggery near Bendigo. The solids accumulation rate was determined to be 0.00094 m2/kg TS over five
years of operation. This rate is approximately one-third of the commonly used estimate by Barth
and Kroes (1985) but within the range proposed by Chastain (2006) in his review of additional data
from the USA. In Queensland, Skerman et al. (2008) identified a sludge accumulation rate of “less
than 0.001 m3/kg TS after 22 months of operating a highly loaded pond.
3.4.2 Sludge Distribution
An understanding of the distribution of sludge across a pond would help in the design and
management of a sludge removal system. However, sludge distribution in anaerobic ponds has been
found to be highly uneven (Figure 8). Sludge levels are often found to be higher at the inlet, outlet
and in the corners (Abis & Mara 2005). For example, in the primary pond at the municipal
wastewater treatment facility at Mèze (France), Picot et al. (2005) shows that the depth of sludge
reduced from more than 1 m at the inlet to less than 0.6 m at 50 m from the inlet. However, high
velocity of the incoming flow could reduce the sludge depth near the inlet (Saqqar & Pescod 1995).
High sludge levels in the corners are attributed to wind action, as gaseous products of anaerobic
distribution force sludge to the surface, where it is blown into the corners. Patterns of sludge
distribution are often attributed to pond geometry and inlet layout. For example, ponds with steep
sides was found to provide favourable conditions for uniform distribution of sludge (Papadopoulos et
al. 2003), and five inlets instead of one resulted in more even distribution of sludge (Nelson et al.
2004). Local climate conditions are important and sludge distributions are known to change
throughout the year. There are obvious interactions between sludge distribution and pond
hydrodynamics with regard to differences in channel depth and differing flow velocities throughout
the pond. The processes involved are poorly understood and have not been well studied for
anaerobic ponds.
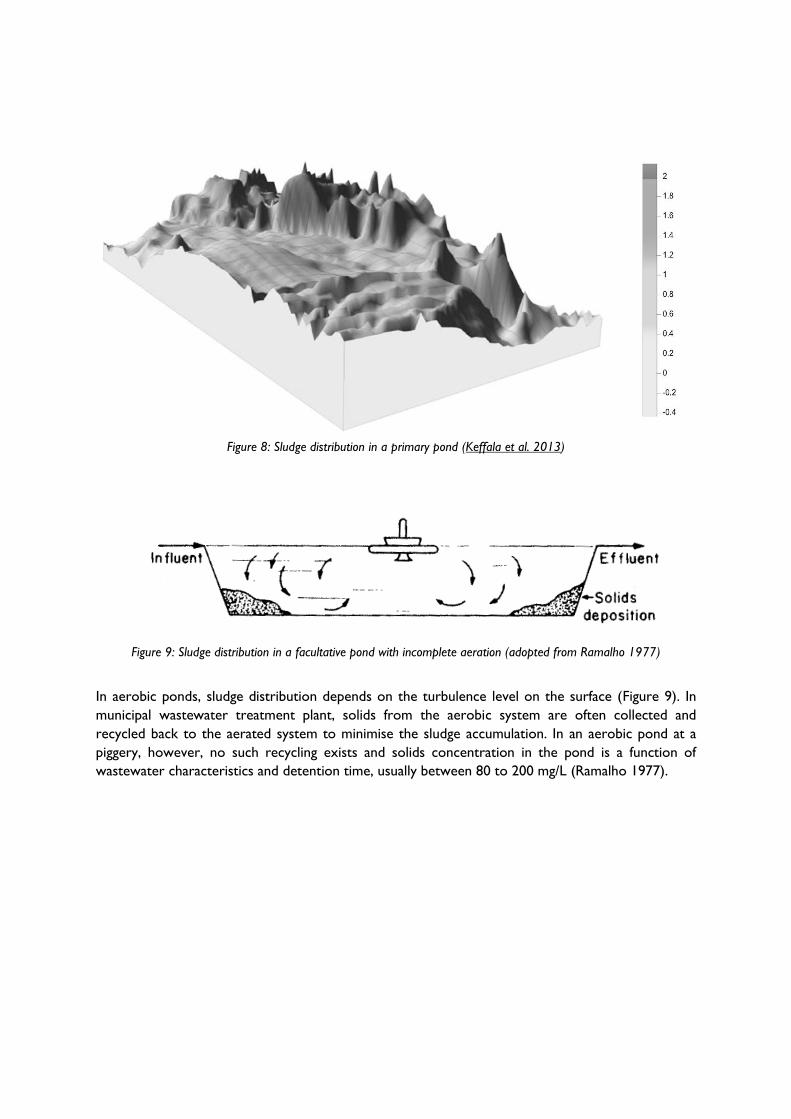
Figure 8: Sludge distribution in a primary pond (Keffala et al. 2013)
Figure 9: Sludge distribution in a facultative pond with incomplete aeration (adopted from Ramalho 1977)
In aerobic ponds, sludge distribution depends on the turbulence level on the surface (Figure 9). In
municipal wastewater treatment plant, solids from the aerobic system are often collected and
recycled back to the aerated system to minimise the sludge accumulation. In an aerobic pond at a
piggery, however, no such recycling exists and solids concentration in the pond is a function of
wastewater characteristics and detention time, usually between 80 to 200 mg/L (Ramalho 1977).
4. Pumping slurries and effluent
The design choices for the pumping of slurries and effluent is primarily dependent on the TS content
of the material. Generally, effluent was a TS <2% can be pumped with conventional centrifugal
pumps as it has hydraulic characteristics similar to water. For fluids with 2% to 10% TS content,
pumping is still possible but special pumps (e.g. positive displacement or vacuum) are required. It is
virtually impossible to pump fluids with a TS content >15%. Brambilla et al. (2013) provides a good
review of the different pumps used in pumping anaerobic digester slurries.
Correct pump selection is very important because pumps are designed to suit specific pumping
conditions. The following steps should be used to select the appropriate pumps (Warman
International Ltd. 2000).
1. Determine the flow rate, usually established by the volume of solids to be pumped and the
proposed concentration of solids. The flow rate through the pump is directly proportional
to pump speed, head to speed squared and power to speed cubed (Grzina 2002). It means
that if the pump speed is doubled, then the generated head would generally need to be four
times higher and the power consumption eight times higher.
2. Determine the static head, the vertical height on both the intake and discharge side of the
pump.
3. Determine the pump head and efficiency corrections, which is determined by the average
particle size of the solids (d50 mm, Figure 10, Grzina (2002), the concentration of solids (%
by weight) and the dry specific gravity of the solids.
4. Determine the pipe diameter, which will provide the optimum velocity to minimise friction.
5. Determine the friction head loss. For TS contents greater than 2%, friction losses are from
1½ to 4 times the friction losses for water (Guyer 2011).
6. Calculate the total dynamic head.
Pump type can then be selected from the supplier product catalogue. Brambilla et al. (2013) note
that there are essentially two types of pumps sued for slurries – open-volute centrifugal pumps and
positive-displacement pumps.
4.1 Centrifugal pumps
Centrifugal pumps can provide flow rates from a few litres to thousands of litres per second and can
handle solid particle sizes from microscopic to sand. Their main limitation is that they cannot
develop pressures higher than 7 MPa even when they are arranged in series.
Centrifugal pumps with semi-open or vortex impellers are considered more suitable for pumping
slurries with a high solids content (Brambilla et al. 2013). It may be either self-contained motorized
or PTO driven, although the latter is more commonly found. A minimum positive head of 610 mm
shall be provided at the suction side of centrifugal type pumps and thus is desirable for all types of
sludge pumps.
Some pumps are specially designed for pumping sludge from ponds, for example with an adjustable
pump length (Table 3) supplied by GEA Technologies and different versions driven by a tractor
(Figure 11). The major factors to consider when sizing pumping equipment include the distance from
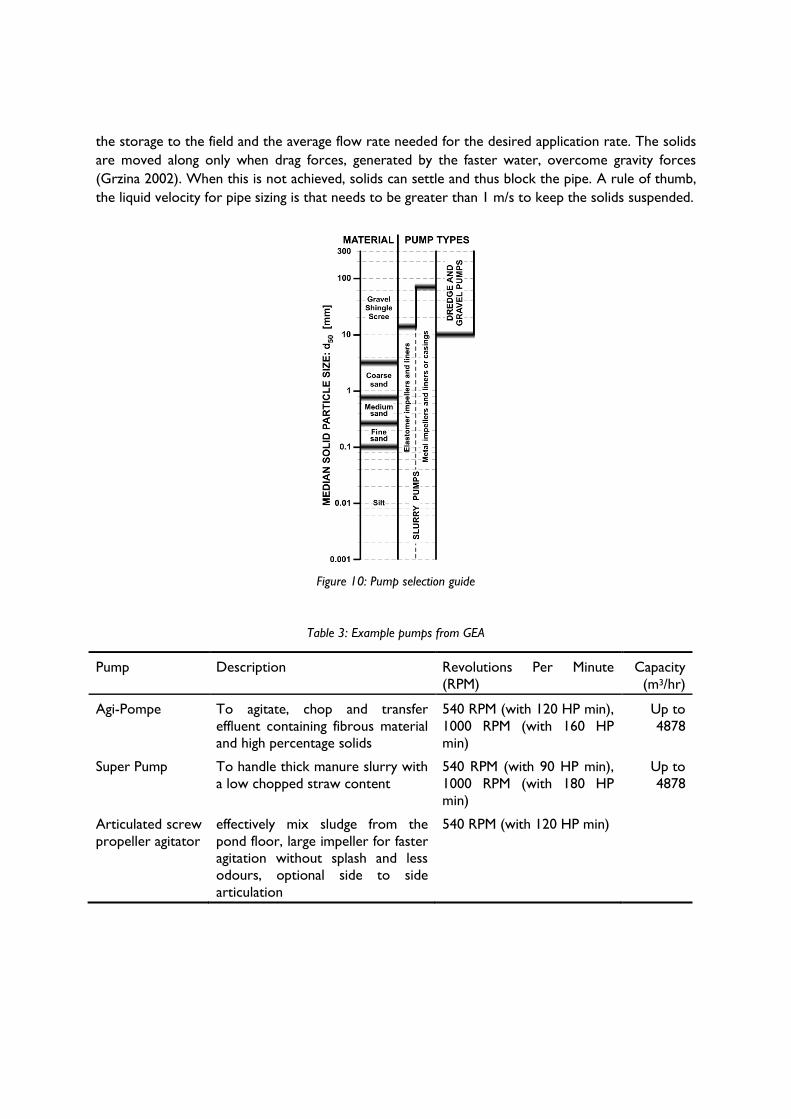
the storage to the field and the average flow rate needed for the desired application rate. The solids
are moved along only when drag forces, generated by the faster water, overcome gravity forces
(Grzina 2002). When this is not achieved, solids can settle and thus block the pipe. A rule of thumb,
the liquid velocity for pipe sizing is that needs to be greater than 1 m/s to keep the solids suspended.
Figure 10: Pump selection guide
Table 3: Example pumps from GEA
Pump Description Revolutions Per Minute
(RPM)
Capacity
(m3/hr)
Agi-Pompe To agitate, chop and transfer
effluent containing fibrous material
and high percentage solids
540 RPM (with 120 HP min),
1000 RPM (with 160 HP
min)
Up to
4878
Super Pump To handle thick manure slurry with
a low chopped straw content
540 RPM (with 90 HP min),
1000 RPM (with 180 HP
min)
Up to
4878
Articulated screw
propeller agitator
effectively mix sludge from the
pond floor, large impeller for faster
agitation without splash and less
odours, optional side to side
articulation
540 RPM (with 120 HP min)
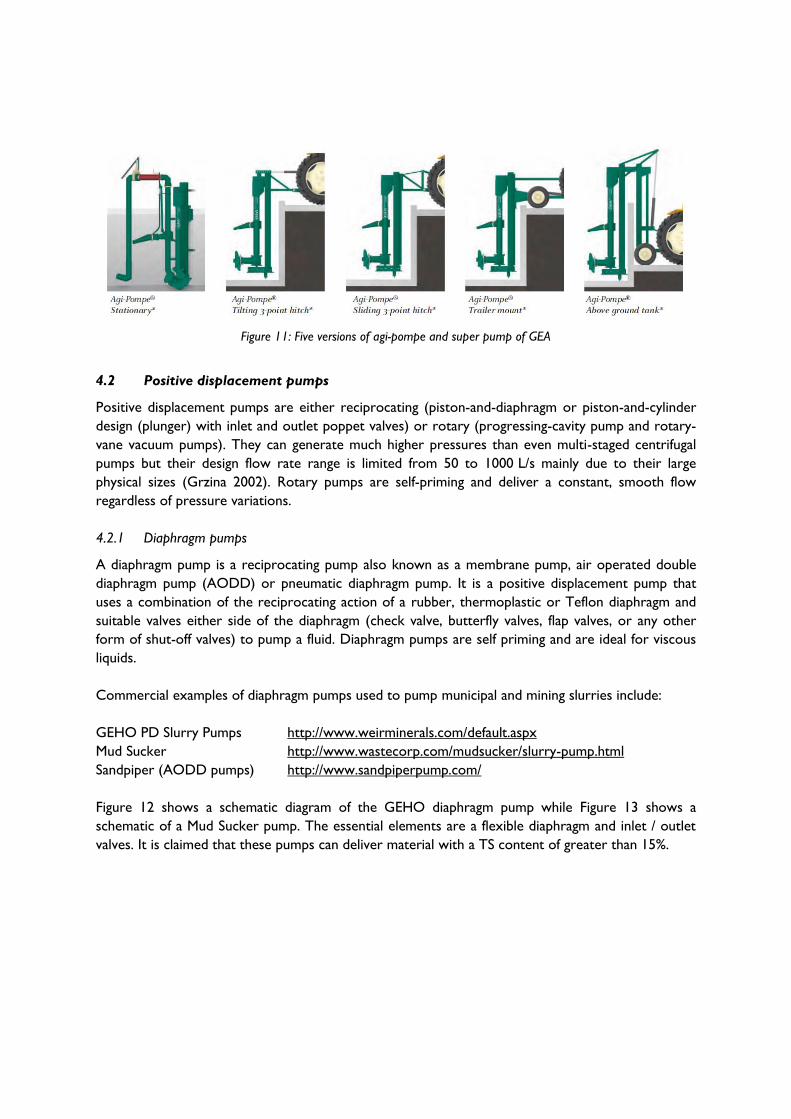
Figure 11: Five versions of agi-pompe and super pump of GEA
4.2 Positive displacement pumps
Positive displacement pumps are either reciprocating (piston-and-diaphragm or piston-and-cylinder
design (plunger) with inlet and outlet poppet valves) or rotary (progressing-cavity pump and rotary-
vane vacuum pumps). They can generate much higher pressures than even multi-staged centrifugal
pumps but their design flow rate range is limited from 50 to 1000 L/s mainly due to their large
physical sizes (Grzina 2002). Rotary pumps are self-priming and deliver a constant, smooth flow
regardless of pressure variations.
4.2.1 Diaphragm pumps
A diaphragm pump is a reciprocating pump also known as a membrane pump, air operated double
diaphragm pump (AODD) or pneumatic diaphragm pump. It is a positive displacement pump that
uses a combination of the reciprocating action of a rubber, thermoplastic or Teflon diaphragm and
suitable valves either side of the diaphragm (check valve, butterfly valves, flap valves, or any other
form of shut-off valves) to pump a fluid. Diaphragm pumps are self priming and are ideal for viscous
liquids.
Commercial examples of diaphragm pumps used to pump municipal and mining slurries include:
GEHO PD Slurry Pumps http://www.weirminerals.com/default.aspx
Mud Sucker http://www.wastecorp.com/mudsucker/slurry-pump.html
Sandpiper (AODD pumps) http://www.sandpiperpump.com/
Figure 12 shows a schematic diagram of the GEHO diaphragm pump while Figure 13 shows a
schematic of a Mud Sucker pump. The essential elements are a flexible diaphragm and inlet / outlet
valves. It is claimed that these pumps can deliver material with a TS content of greater than 15%.
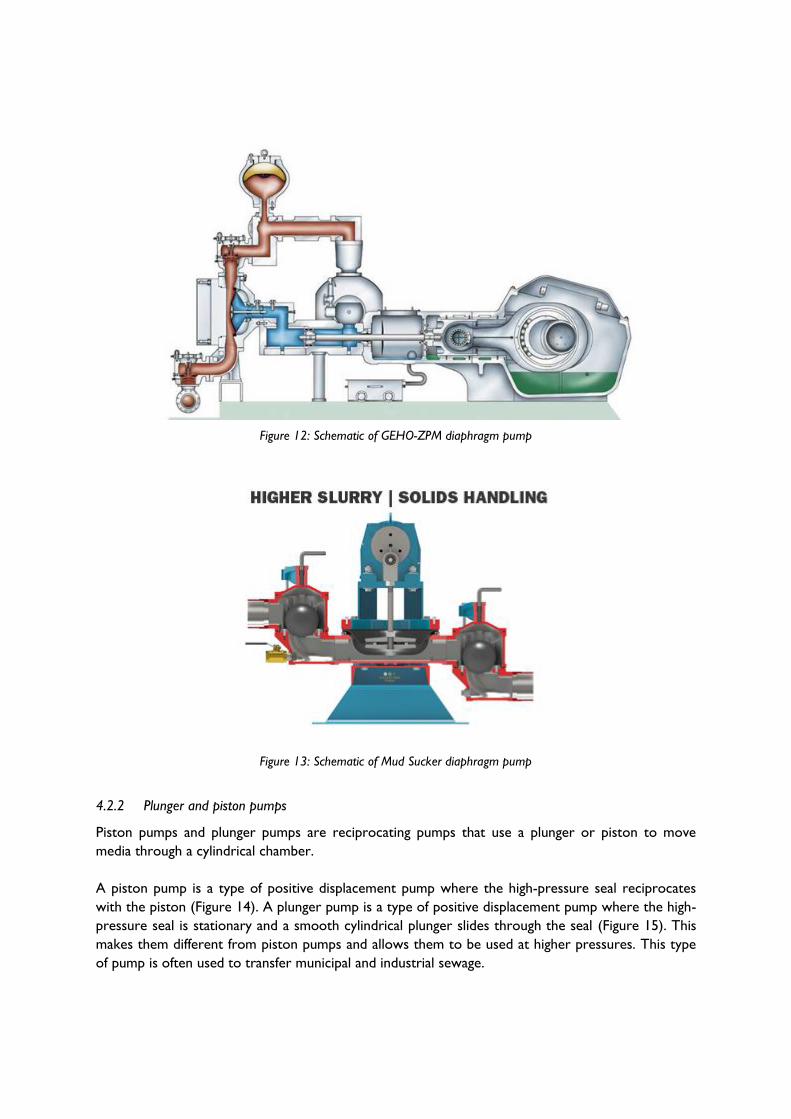
Figure 12: Schematic of GEHO-ZPM diaphragm pump
Figure 13: Schematic of Mud Sucker diaphragm pump
4.2.2 Plunger and piston pumps
Piston pumps and plunger pumps are reciprocating pumps that use a plunger or piston to move
media through a cylindrical chamber.
A piston pump is a type of positive displacement pump where the high-pressure seal reciprocates
with the piston (Figure 14). A plunger pump is a type of positive displacement pump where the high-
pressure seal is stationary and a smooth cylindrical plunger slides through the seal (Figure 15). This
makes them different from piston pumps and allows them to be used at higher pressures. This type
of pump is often used to transfer municipal and industrial sewage.
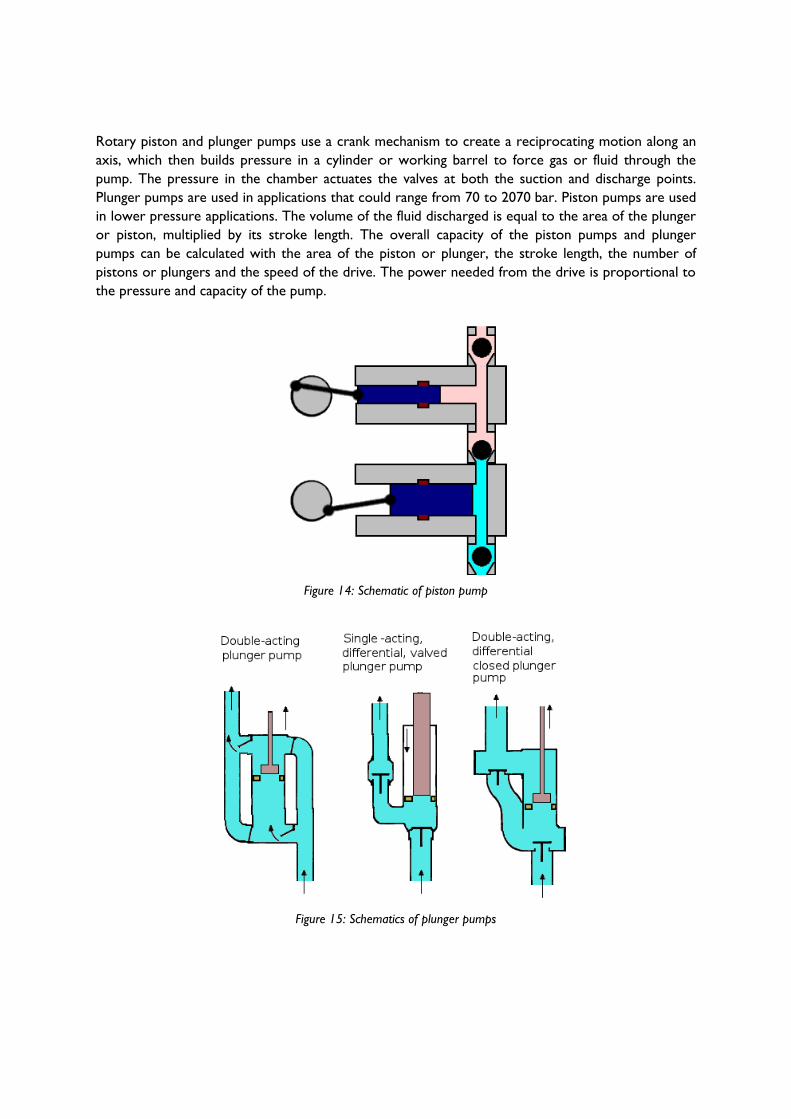
Rotary piston and plunger pumps use a crank mechanism to create a reciprocating motion along an
axis, which then builds pressure in a cylinder or working barrel to force gas or fluid through the
pump. The pressure in the chamber actuates the valves at both the suction and discharge points.
Plunger pumps are used in applications that could range from 70 to 2070 bar. Piston pumps are used
in lower pressure applications. The volume of the fluid discharged is equal to the area of the plunger
or piston, multiplied by its stroke length. The overall capacity of the piston pumps and plunger
pumps can be calculated with the area of the piston or plunger, the stroke length, the number of
pistons or plungers and the speed of the drive. The power needed from the drive is proportional to
the pressure and capacity of the pump.
Figure 14: Schematic of piston pump
Figure 15: Schematics of plunger pumps
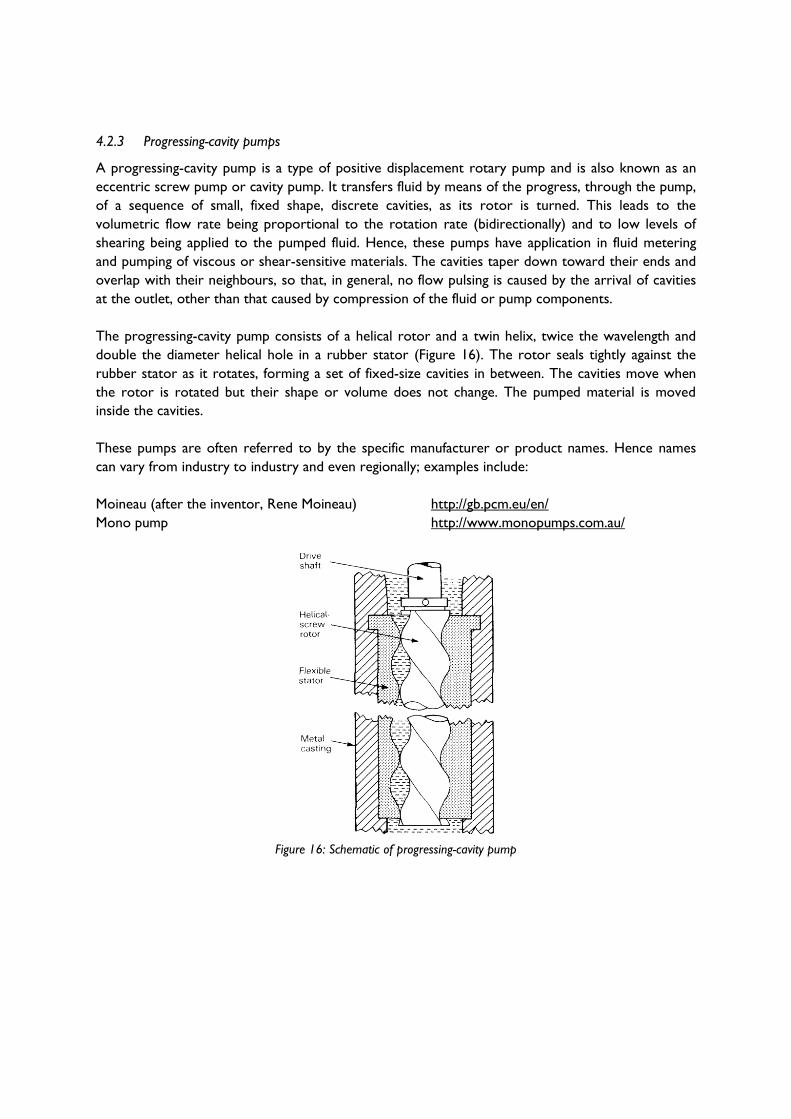
4.2.3 Progressing-cavity pumps
A progressing-cavity pump is a type of positive displacement rotary pump and is also known as an
eccentric screw pump or cavity pump. It transfers fluid by means of the progress, through the pump,
of a sequence of small, fixed shape, discrete cavities, as its rotor is turned. This leads to the
volumetric flow rate being proportional to the rotation rate (bidirectionally) and to low levels of
shearing being applied to the pumped fluid. Hence, these pumps have application in fluid metering
and pumping of viscous or shear-sensitive materials. The cavities taper down toward their ends and
overlap with their neighbours, so that, in general, no flow pulsing is caused by the arrival of cavities
at the outlet, other than that caused by compression of the fluid or pump components.
The progressing-cavity pump consists of a helical rotor and a twin helix, twice the wavelength and
double the diameter helical hole in a rubber stator (Figure 16). The rotor seals tightly against the
rubber stator as it rotates, forming a set of fixed-size cavities in between. The cavities move when
the rotor is rotated but their shape or volume does not change. The pumped material is moved
inside the cavities.
These pumps are often referred to by the specific manufacturer or product names. Hence names
can vary from industry to industry and even regionally; examples include:
Moineau (after the inventor, Rene Moineau) http://gb.pcm.eu/en/
Mono pump http://www.monopumps.com.au/
Figure 16: Schematic of progressing-cavity pump
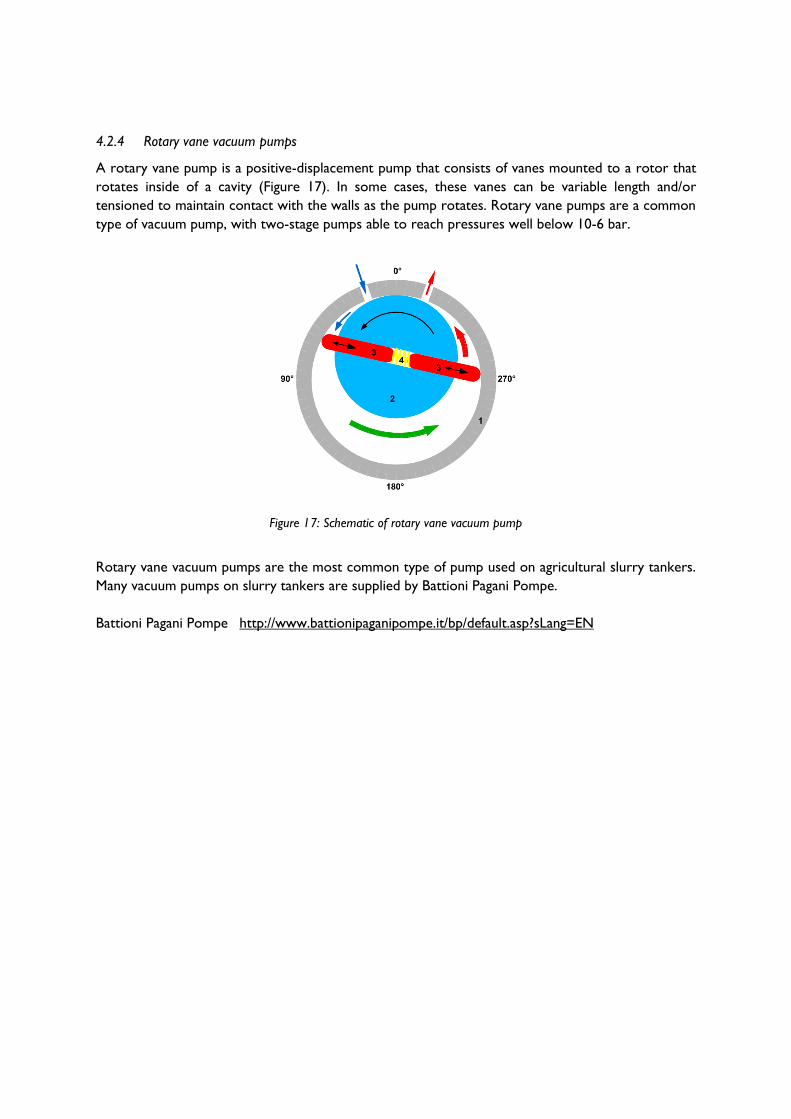
4.2.4 Rotary vane vacuum pumps
A rotary vane pump is a positive-displacement pump that consists of vanes mounted to a rotor that
rotates inside of a cavity (Figure 17). In some cases, these vanes can be variable length and/or
tensioned to maintain contact with the walls as the pump rotates. Rotary vane pumps are a common
type of vacuum pump, with two-stage pumps able to reach pressures well below 10-6 bar.
Figure 17: Schematic of rotary vane vacuum pump
Rotary vane vacuum pumps are the most common type of pump used on agricultural slurry tankers.
Many vacuum pumps on slurry tankers are supplied by Battioni Pagani Pompe.
Battioni Pagani Pompe http://www.battionipaganipompe.it/bp/default.asp?sLang=EN
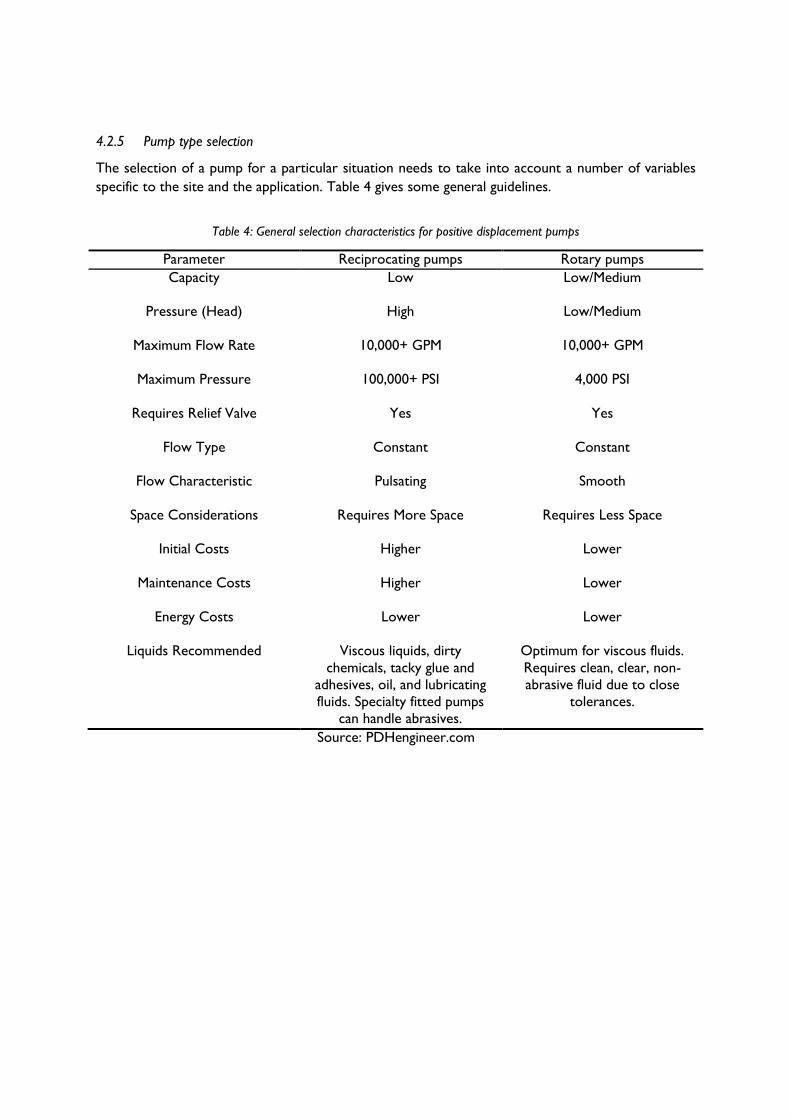
4.2.5 Pump type selection
The selection of a pump for a particular situation needs to take into account a number of variables
specific to the site and the application. Table 4 gives some general guidelines.
Table 4: General selection characteristics for positive displacement pumps
Parameter Reciprocating pumps Rotary pumps
Capacity
Low Low/Medium
Pressure (Head)
High Low/Medium
Maximum Flow Rate
10,000+ GPM 10,000+ GPM
Maximum Pressure
100,000+ PSI 4,000 PSI
Requires Relief Valve
Yes Yes
Flow Type
Constant Constant
Flow Characteristic
Pulsating Smooth
Space Considerations
Requires More Space Requires Less Space
Initial Costs
Higher Lower
Maintenance Costs
Higher Lower
Energy Costs
Lower Lower
Liquids Recommended Viscous liquids, dirty
chemicals, tacky glue and
adhesives, oil, and lubricating
fluids. Specialty fitted pumps
can handle abrasives.
Optimum for viscous fluids.
Requires clean, clear, non-
abrasive fluid due to close
tolerances.
Source: PDHengineer.com
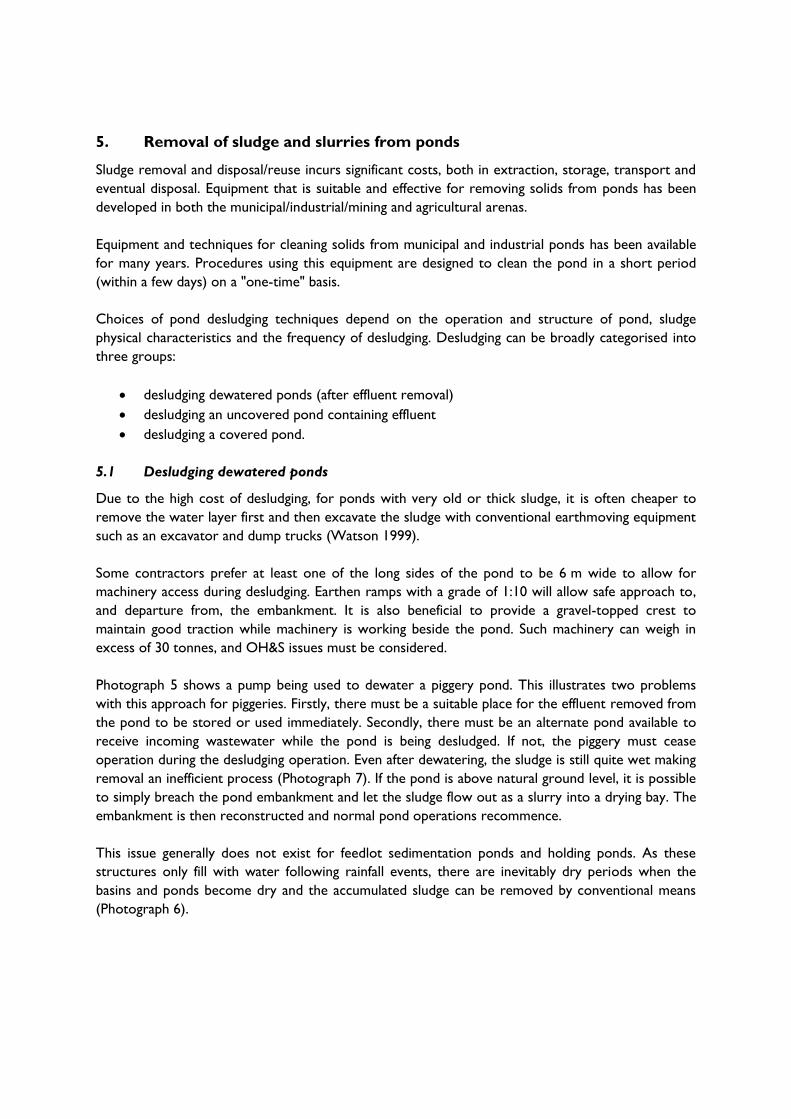
5. Removal of sludge and slurries from ponds
Sludge removal and disposal/reuse incurs significant costs, both in extraction, storage, transport and
eventual disposal. Equipment that is suitable and effective for removing solids from ponds has been
developed in both the municipal/industrial/mining and agricultural arenas.
Equipment and techniques for cleaning solids from municipal and industrial ponds has been available
for many years. Procedures using this equipment are designed to clean the pond in a short period
(within a few days) on a "one-time" basis.
Choices of pond desludging techniques depend on the operation and structure of pond, sludge
physical characteristics and the frequency of desludging. Desludging can be broadly categorised into
three groups:
desludging dewatered ponds (after effluent removal)
desludging an uncovered pond containing effluent
desludging a covered pond.
5.1 Desludging dewatered ponds
Due to the high cost of desludging, for ponds with very old or thick sludge, it is often cheaper to
remove the water layer first and then excavate the sludge with conventional earthmoving equipment
such as an excavator and dump trucks (Watson 1999).
Some contractors prefer at least one of the long sides of the pond to be 6 m wide to allow for
machinery access during desludging. Earthen ramps with a grade of 1:10 will allow safe approach to,
and departure from, the embankment. It is also beneficial to provide a gravel-topped crest to
maintain good traction while machinery is working beside the pond. Such machinery can weigh in
excess of 30 tonnes, and OH&S issues must be considered.
Photograph 5 shows a pump being used to dewater a piggery pond. This illustrates two problems
with this approach for piggeries. Firstly, there must be a suitable place for the effluent removed from
the pond to be stored or used immediately. Secondly, there must be an alternate pond available to
receive incoming wastewater while the pond is being desludged. If not, the piggery must cease
operation during the desludging operation. Even after dewatering, the sludge is still quite wet making
removal an inefficient process (Photograph 7). If the pond is above natural ground level, it is possible
to simply breach the pond embankment and let the sludge flow out as a slurry into a drying bay. The
embankment is then reconstructed and normal pond operations recommence.
This issue generally does not exist for feedlot sedimentation ponds and holding ponds. As these
structures only fill with water following rainfall events, there are inevitably dry periods when the
basins and ponds become dry and the accumulated sludge can be removed by conventional means
(Photograph 6).
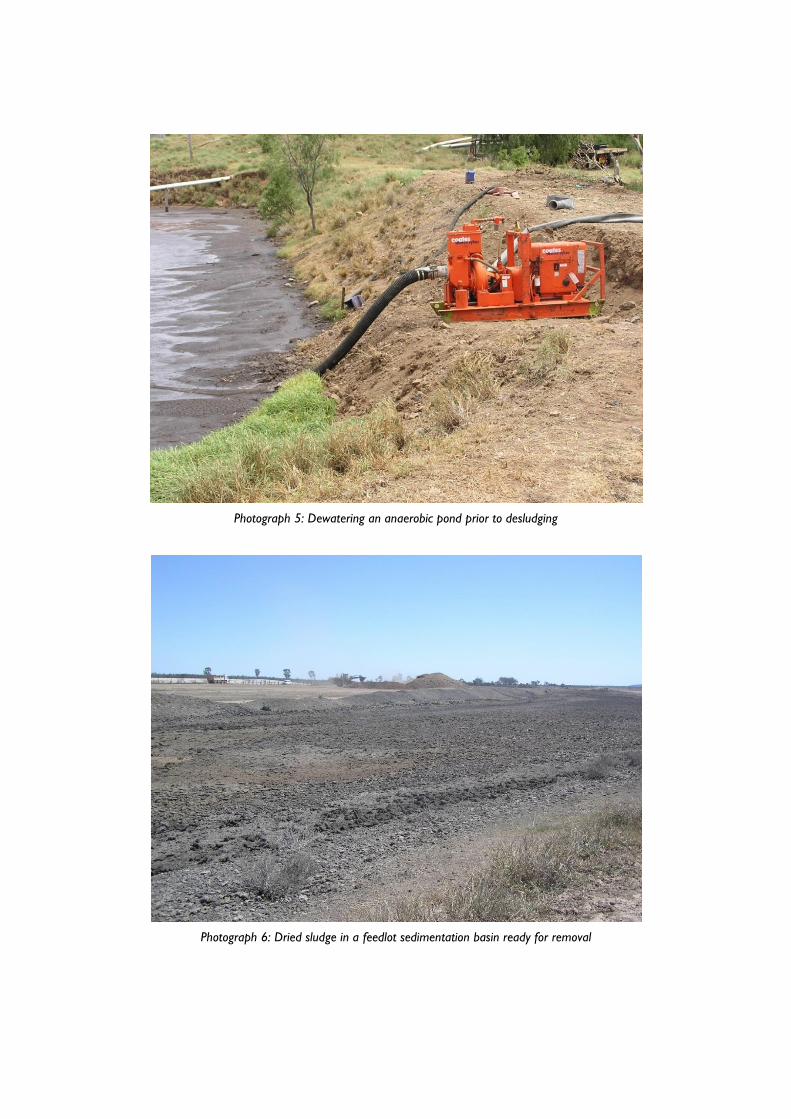
Photograph 5: Dewatering an anaerobic pond prior to desludging
Photograph 6: Dried sludge in a feedlot sedimentation basin ready for removal
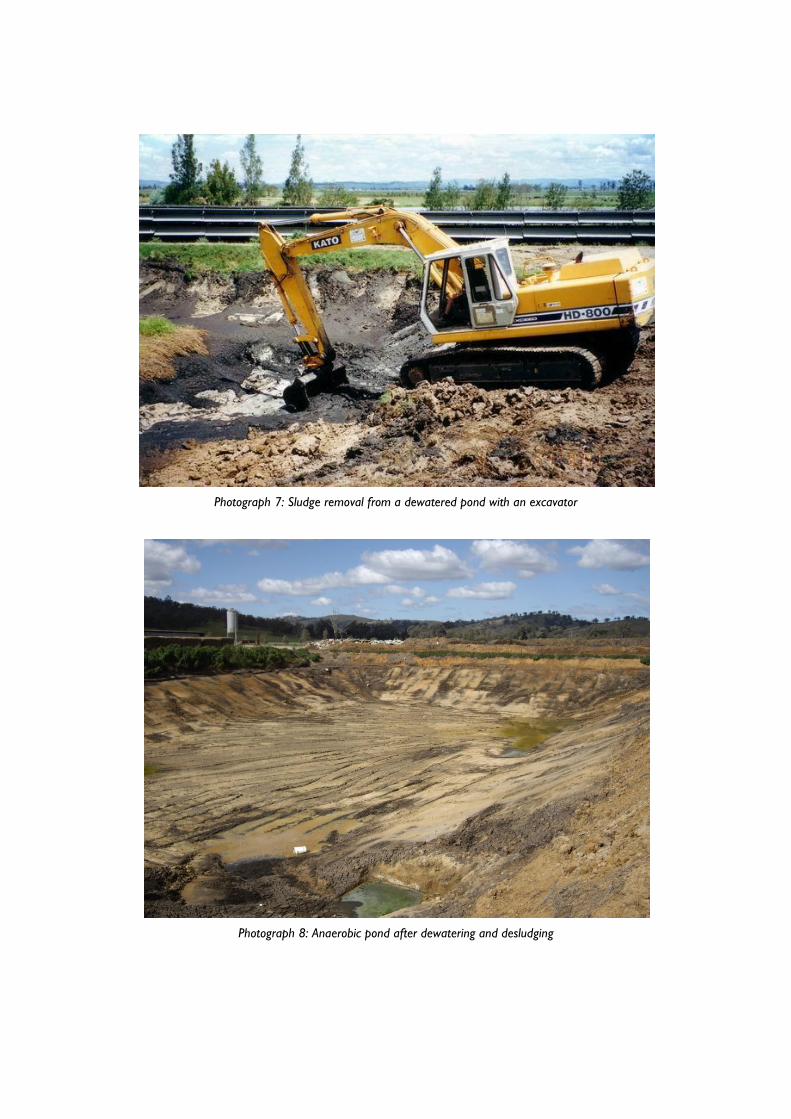
Photograph 7: Sludge removal from a dewatered pond with an excavator
Photograph 8: Anaerobic pond after dewatering and desludging
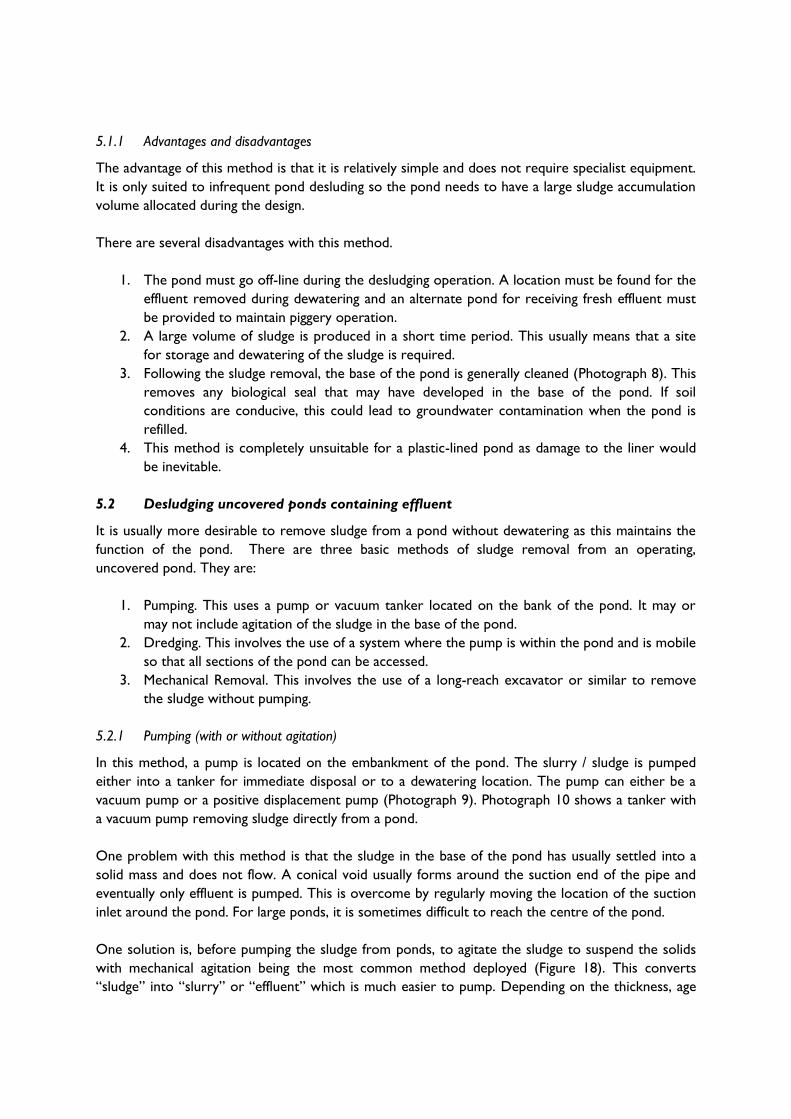
5.1.1 Advantages and disadvantages
The advantage of this method is that it is relatively simple and does not require specialist equipment.
It is only suited to infrequent pond desluding so the pond needs to have a large sludge accumulation
volume allocated during the design.
There are several disadvantages with this method.
1. The pond must go off-line during the desludging operation. A location must be found for the
effluent removed during dewatering and an alternate pond for receiving fresh effluent must
be provided to maintain piggery operation.
2. A large volume of sludge is produced in a short time period. This usually means that a site
for storage and dewatering of the sludge is required.
3. Following the sludge removal, the base of the pond is generally cleaned (Photograph 8). This
removes any biological seal that may have developed in the base of the pond. If soil
conditions are conducive, this could lead to groundwater contamination when the pond is
refilled.
4. This method is completely unsuitable for a plastic-lined pond as damage to the liner would
be inevitable.
5.2 Desludging uncovered ponds containing effluent
It is usually more desirable to remove sludge from a pond without dewatering as this maintains the
function of the pond. There are three basic methods of sludge removal from an operating,
uncovered pond. They are:
1. Pumping. This uses a pump or vacuum tanker located on the bank of the pond. It may or
may not include agitation of the sludge in the base of the pond.
2. Dredging. This involves the use of a system where the pump is within the pond and is mobile
so that all sections of the pond can be accessed.
3. Mechanical Removal. This involves the use of a long-reach excavator or similar to remove
the sludge without pumping.
5.2.1 Pumping (with or without agitation)
In this method, a pump is located on the embankment of the pond. The slurry / sludge is pumped
either into a tanker for immediate disposal or to a dewatering location. The pump can either be a
vacuum pump or a positive displacement pump (Photograph 9). Photograph 10 shows a tanker with
a vacuum pump removing sludge directly from a pond.
One problem with this method is that the sludge in the base of the pond has usually settled into a
solid mass and does not flow. A conical void usually forms around the suction end of the pipe and
eventually only effluent is pumped. This is overcome by regularly moving the location of the suction
inlet around the pond. For large ponds, it is sometimes difficult to reach the centre of the pond.
One solution is, before pumping the sludge from ponds, to agitate the sludge to suspend the solids
with mechanical agitation being the most common method deployed (Figure 18). This converts
“sludge” into “slurry” or “effluent” which is much easier to pump. Depending on the thickness, age
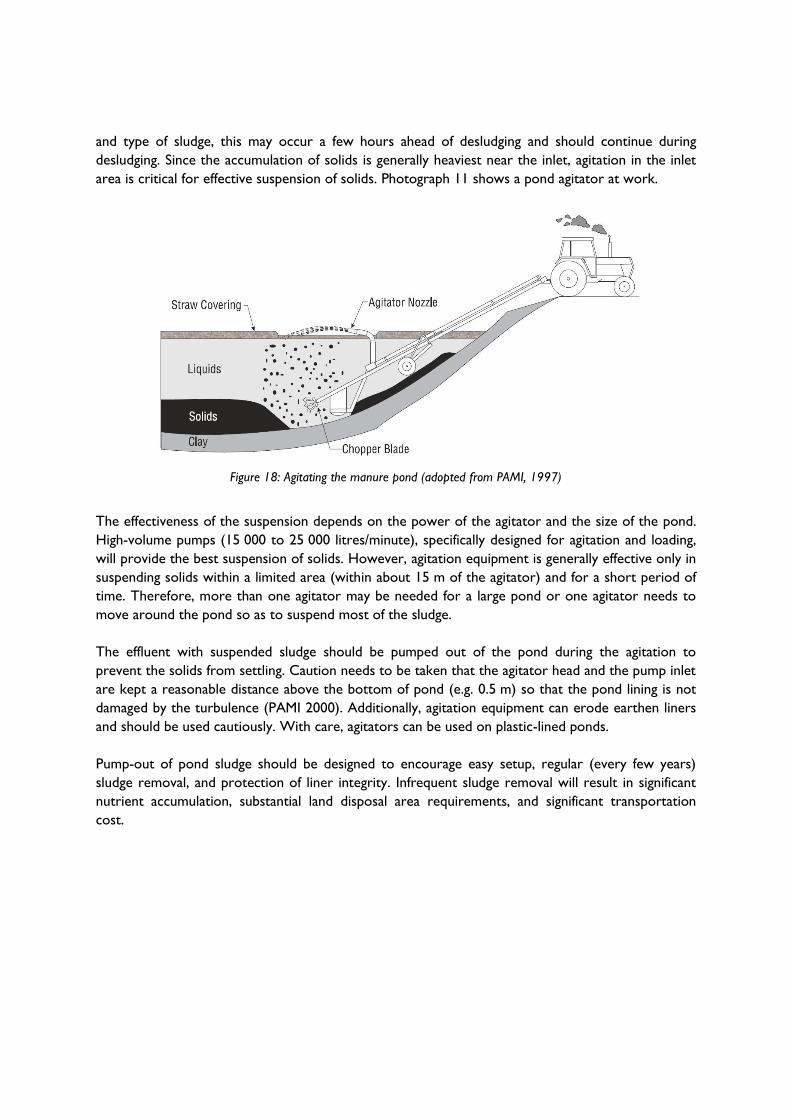
and type of sludge, this may occur a few hours ahead of desludging and should continue during
desludging. Since the accumulation of solids is generally heaviest near the inlet, agitation in the inlet
area is critical for effective suspension of solids. Photograph 11 shows a pond agitator at work.
Figure 18: Agitating the manure pond (adopted from PAMI, 1997)
The effectiveness of the suspension depends on the power of the agitator and the size of the pond.
High-volume pumps (15 000 to 25 000 litres/minute), specifically designed for agitation and loading,
will provide the best suspension of solids. However, agitation equipment is generally effective only in
suspending solids within a limited area (within about 15 m of the agitator) and for a short period of
time. Therefore, more than one agitator may be needed for a large pond or one agitator needs to
move around the pond so as to suspend most of the sludge.
The effluent with suspended sludge should be pumped out of the pond during the agitation to
prevent the solids from settling. Caution needs to be taken that the agitator head and the pump inlet
are kept a reasonable distance above the bottom of pond (e.g. 0.5 m) so that the pond lining is not
damaged by the turbulence (PAMI 2000). Additionally, agitation equipment can erode earthen liners
and should be used cautiously. With care, agitators can be used on plastic-lined ponds.
Pump-out of pond sludge should be designed to encourage easy setup, regular (every few years)
sludge removal, and protection of liner integrity. Infrequent sludge removal will result in significant
nutrient accumulation, substantial land disposal area requirements, and significant transportation
cost.
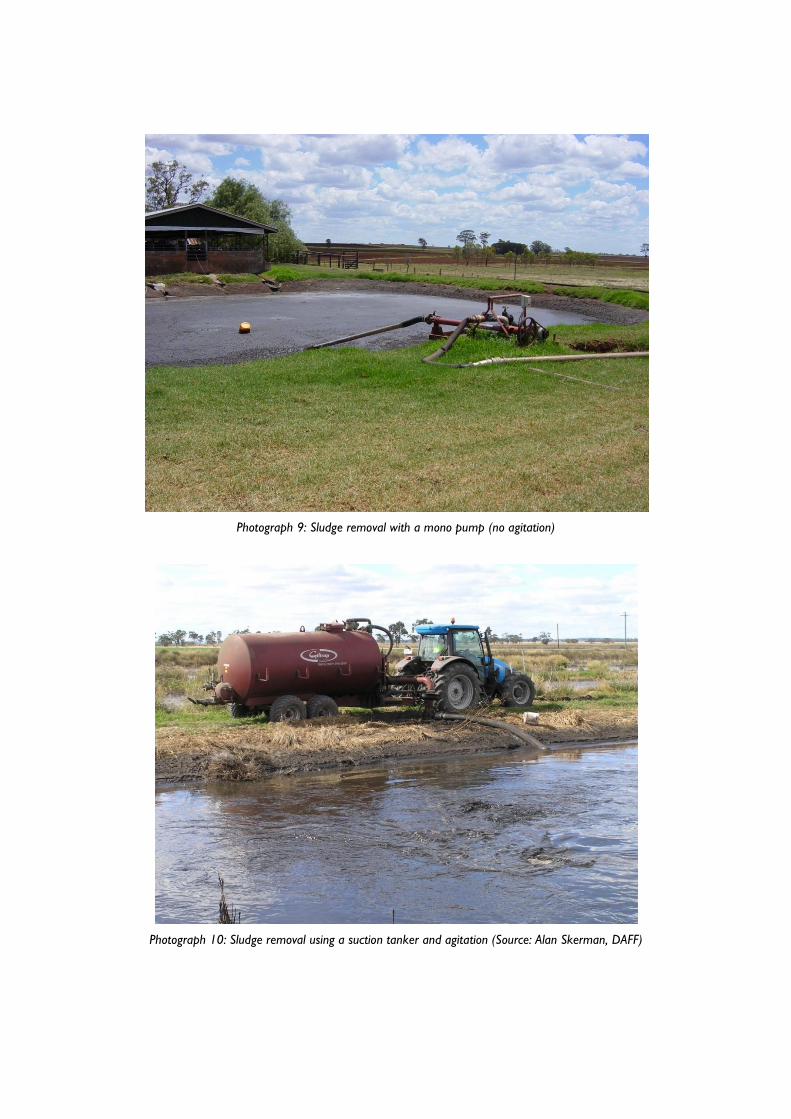
Photograph 9: Sludge removal with a mono pump (no agitation)
Photograph 10: Sludge removal using a suction tanker and agitation (Source: Alan Skerman, DAFF)
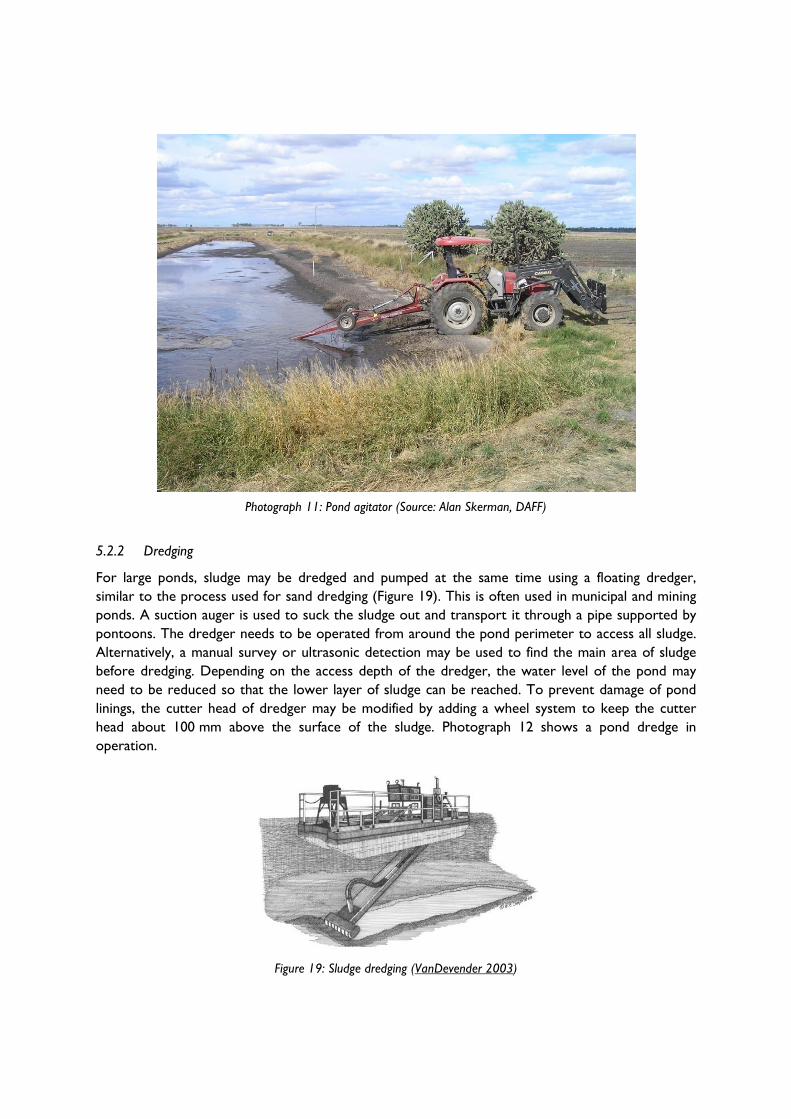
Photograph 11: Pond agitator (Source: Alan Skerman, DAFF)
5.2.2 Dredging
For large ponds, sludge may be dredged and pumped at the same time using a floating dredger,
similar to the process used for sand dredging (Figure 19). This is often used in municipal and mining
ponds. A suction auger is used to suck the sludge out and transport it through a pipe supported by
pontoons. The dredger needs to be operated from around the pond perimeter to access all sludge.
Alternatively, a manual survey or ultrasonic detection may be used to find the main area of sludge
before dredging. Depending on the access depth of the dredger, the water level of the pond may
need to be reduced so that the lower layer of sludge can be reached. To prevent damage of pond
linings, the cutter head of dredger may be modified by adding a wheel system to keep the cutter
head about 100 mm above the surface of the sludge. Photograph 12 shows a pond dredge in
operation.
Figure 19: Sludge dredging (VanDevender 2003)
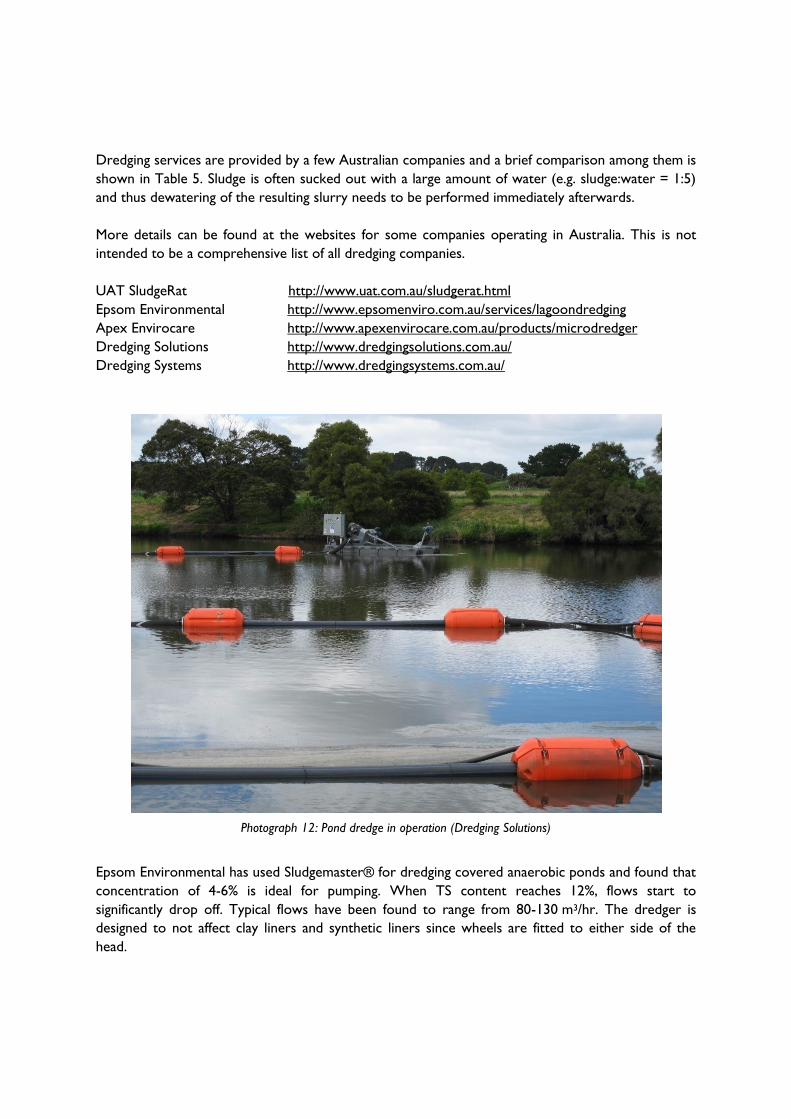
Dredging services are provided by a few Australian companies and a brief comparison among them is
shown in Table 5. Sludge is often sucked out with a large amount of water (e.g. sludge:water = 1:5)
and thus dewatering of the resulting slurry needs to be performed immediately afterwards.
More details can be found at the websites for some companies operating in Australia. This is not
intended to be a comprehensive list of all dredging companies.
UAT SludgeRat http://www.uat.com.au/sludgerat.html
Epsom Environmental http://www.epsomenviro.com.au/services/lagoondredging
Apex Envirocare http://www.apexenvirocare.com.au/products/microdredger
Dredging Solutions http://www.dredgingsolutions.com.au/
Dredging Systems http://www.dredgingsystems.com.au/
Photograph 12: Pond dredge in operation (Dredging Solutions)
Epsom Environmental has used Sludgemaster® for dredging covered anaerobic ponds and found that
concentration of 4-6% is ideal for pumping. When TS content reaches 12%, flows start to
significantly drop off. Typical flows have been found to range from 80-130 m3/hr. The dredger is
designed to not affect clay liners and synthetic liners since wheels are fitted to either side of the
head.
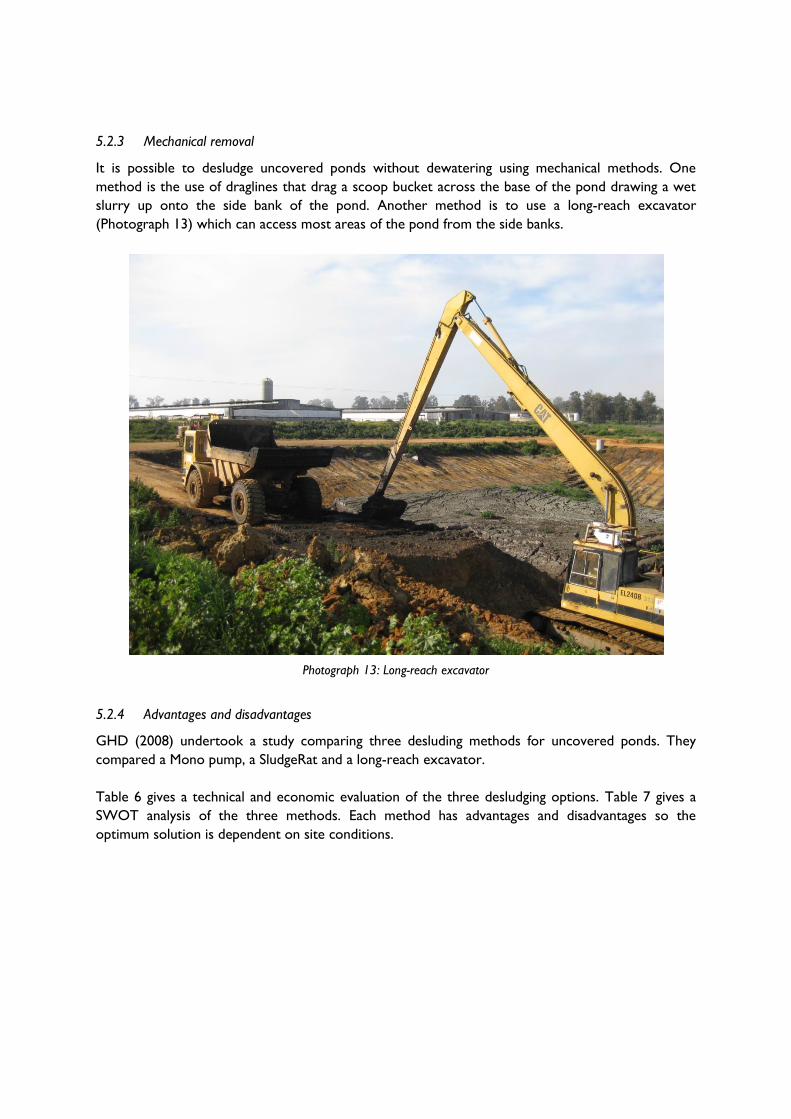
5.2.3 Mechanical removal
It is possible to desludge uncovered ponds without dewatering using mechanical methods. One
method is the use of draglines that drag a scoop bucket across the base of the pond drawing a wet
slurry up onto the side bank of the pond. Another method is to use a long-reach excavator
(Photograph 13) which can access most areas of the pond from the side banks.
Photograph 13: Long-reach excavator
5.2.4 Advantages and disadvantages
GHD (2008) undertook a study comparing three desluding methods for uncovered ponds. They
compared a Mono pump, a SludgeRat and a long-reach excavator.
Table 6 gives a technical and economic evaluation of the three desludging options. Table 7 gives a
SWOT analysis of the three methods. Each method has advantages and disadvantages so the
optimum solution is dependent on site conditions.
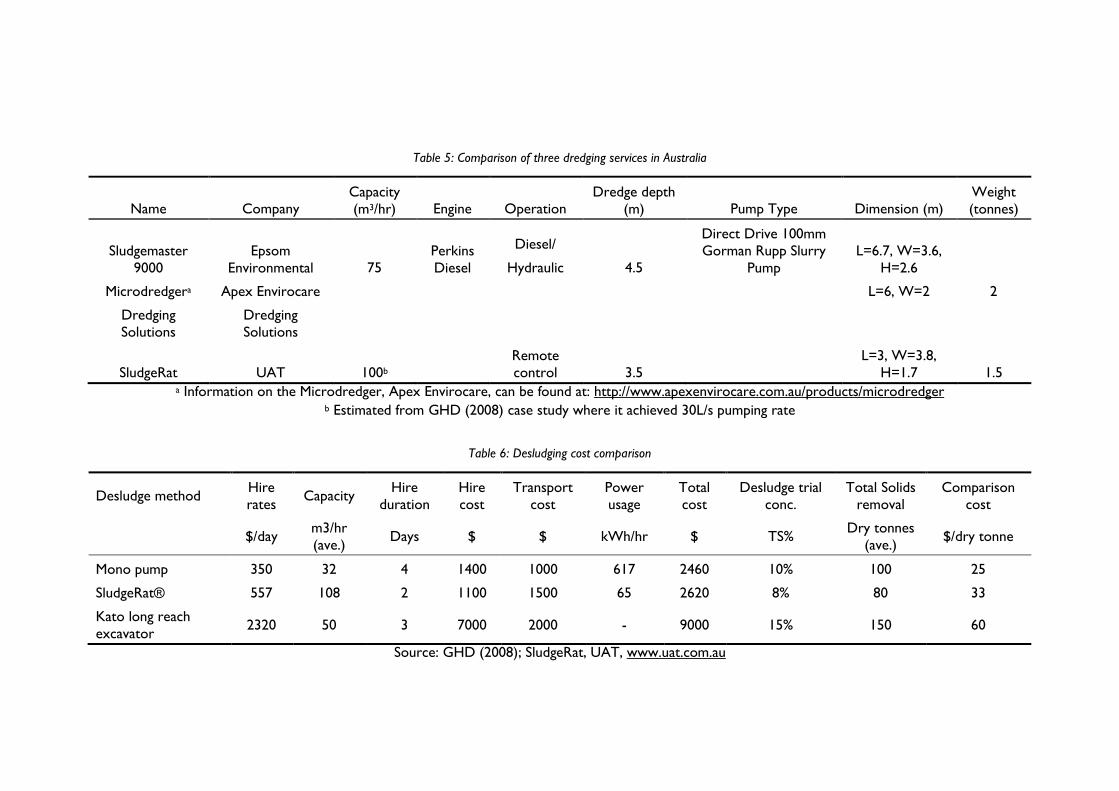
Table 5: Comparison of three dredging services in Australia
Name Company
Capacity
(m3/hr) Engine Operation
Dredge depth
(m) Pump Type Dimension (m)
Weight
(tonnes)
Sludgemaster
9000
Epsom
Environmental 75
Perkins
Diesel
Diesel/
Hydraulic 4.5
Direct Drive 100mm
Gorman Rupp Slurry
Pump
L=6.7, W=3.6,
H=2.6
Microdredgera Apex Envirocare L=6, W=2 2
Dredging
Solutions
Dredging
Solutions
SludgeRat UAT 100b
Remote
control 3.5
L=3, W=3.8,
H=1.7 1.5 a Information on the Microdredger, Apex Envirocare, can be found at: http://www.apexenvirocare.com.au/products/microdredger
b Estimated from GHD (2008) case study where it achieved 30L/s pumping rate
Table 6: Desludging cost comparison
Desludge method Hire
rates Capacity
Hire
duration
Hire
cost
Transport
cost
Power
usage
Total
cost
Desludge trial
conc.
Total Solids
removal
Comparison
cost
$/day m3/hr
(ave.) Days $ $ kWh/hr $ TS%
Dry tonnes
(ave.) $/dry tonne
Mono pump 350 32 4 1400 1000 617 2460 10% 100 25
SludgeRat® 557 108 2 1100 1500 65 2620 8% 80 33
Kato long reach
excavator 2320 50 3 7000 2000 - 9000 15% 150 60
Source: GHD (2008); SludgeRat, UAT, www.uat.com.au

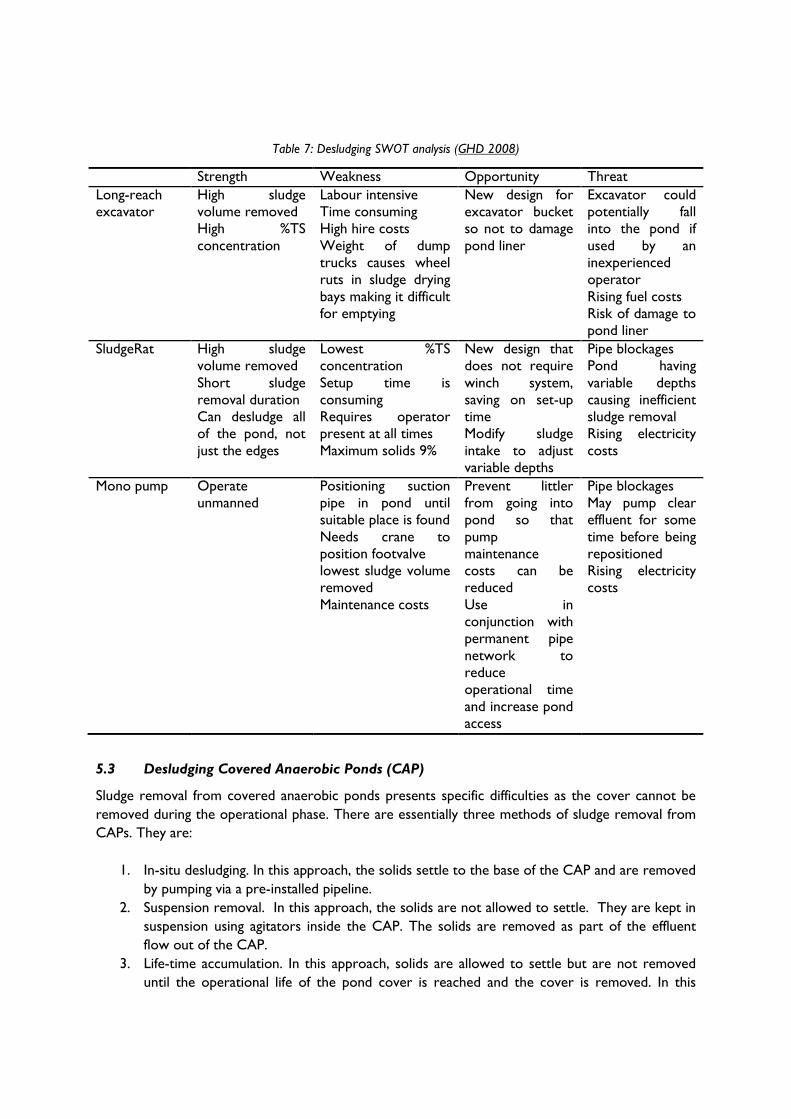
Table 7: Desludging SWOT analysis (GHD 2008)
Strength Weakness Opportunity Threat
Long-reach
excavator
High sludge
volume removed
High %TS
concentration
Labour intensive
Time consuming
High hire costs
Weight of dump
trucks causes wheel
ruts in sludge drying
bays making it difficult
for emptying
New design for
excavator bucket
so not to damage
pond liner
Excavator could
potentially fall
into the pond if
used by an
inexperienced
operator
Rising fuel costs
Risk of damage to
pond liner
SludgeRat High sludge
volume removed
Short sludge
removal duration
Can desludge all
of the pond, not
just the edges
Lowest %TS
concentration
Setup time is
consuming
Requires operator
present at all times
Maximum solids 9%
New design that
does not require
winch system,
saving on set-up
time
Modify sludge
intake to adjust
variable depths
Pipe blockages
Pond having
variable depths
causing inefficient
sludge removal
Rising electricity
costs
Mono pump Operate
unmanned
Positioning suction
pipe in pond until
suitable place is found
Needs crane to
position footvalve
lowest sludge volume
removed
Maintenance costs
Prevent littler
from going into
pond so that
pump
maintenance
costs can be
reduced
Use in
conjunction with
permanent pipe
network to
reduce
operational time
and increase pond
access
Pipe blockages
May pump clear
effluent for some
time before being
repositioned
Rising electricity
costs
5.3 Desludging Covered Anaerobic Ponds (CAP)
Sludge removal from covered anaerobic ponds presents specific difficulties as the cover cannot be
removed during the operational phase. There are essentially three methods of sludge removal from
CAPs. They are:
1. In-situ desludging. In this approach, the solids settle to the base of the CAP and are removed
by pumping via a pre-installed pipeline.
2. Suspension removal. In this approach, the solids are not allowed to settle. They are kept in
suspension using agitators inside the CAP. The solids are removed as part of the effluent
flow out of the CAP.
3. Life-time accumulation. In this approach, solids are allowed to settle but are not removed
until the operational life of the pond cover is reached and the cover is removed. In this
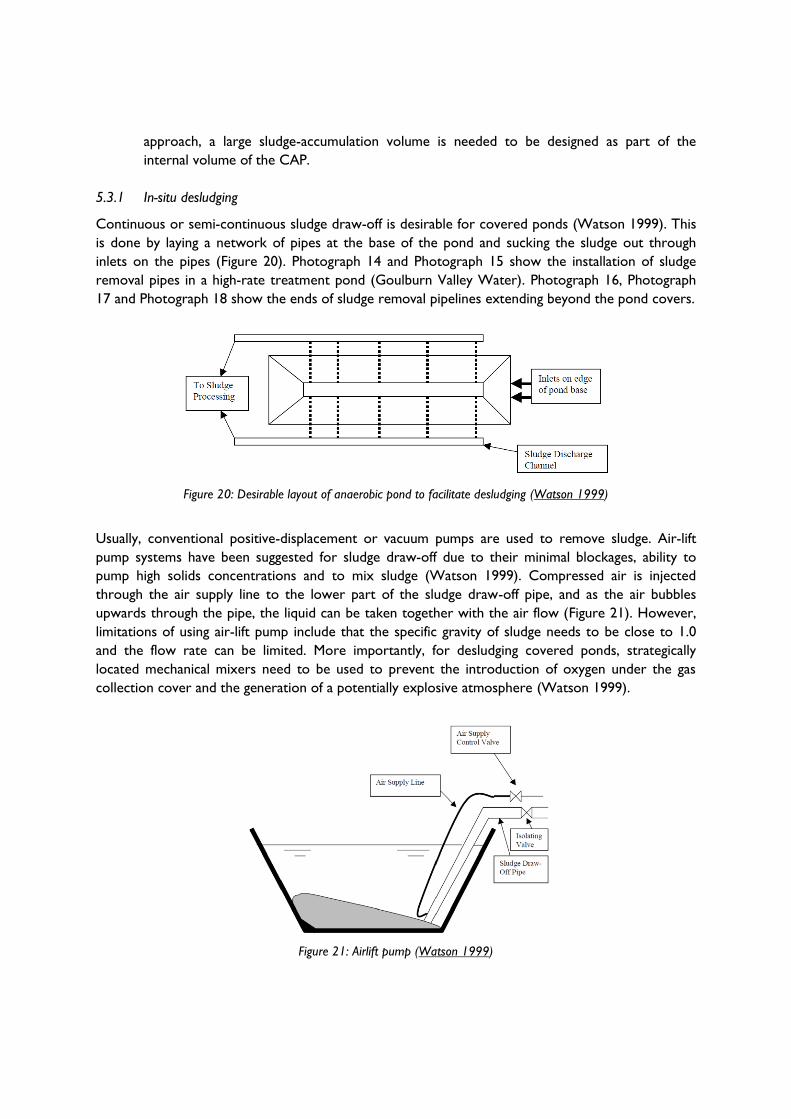
approach, a large sludge-accumulation volume is needed to be designed as part of the
internal volume of the CAP.
5.3.1 In-situ desludging
Continuous or semi-continuous sludge draw-off is desirable for covered ponds (Watson 1999). This
is done by laying a network of pipes at the base of the pond and sucking the sludge out through
inlets on the pipes (Figure 20). Photograph 14 and Photograph 15 show the installation of sludge
removal pipes in a high-rate treatment pond (Goulburn Valley Water). Photograph 16, Photograph
17 and Photograph 18 show the ends of sludge removal pipelines extending beyond the pond covers.
Figure 20: Desirable layout of anaerobic pond to facilitate desludging (Watson 1999)
Usually, conventional positive-displacement or vacuum pumps are used to remove sludge. Air-lift
pump systems have been suggested for sludge draw-off due to their minimal blockages, ability to
pump high solids concentrations and to mix sludge (Watson 1999). Compressed air is injected
through the air supply line to the lower part of the sludge draw-off pipe, and as the air bubbles
upwards through the pipe, the liquid can be taken together with the air flow (Figure 21). However,
limitations of using air-lift pump include that the specific gravity of sludge needs to be close to 1.0
and the flow rate can be limited. More importantly, for desludging covered ponds, strategically
located mechanical mixers need to be used to prevent the introduction of oxygen under the gas
collection cover and the generation of a potentially explosive atmosphere (Watson 1999).
Figure 21: Airlift pump (Watson 1999)
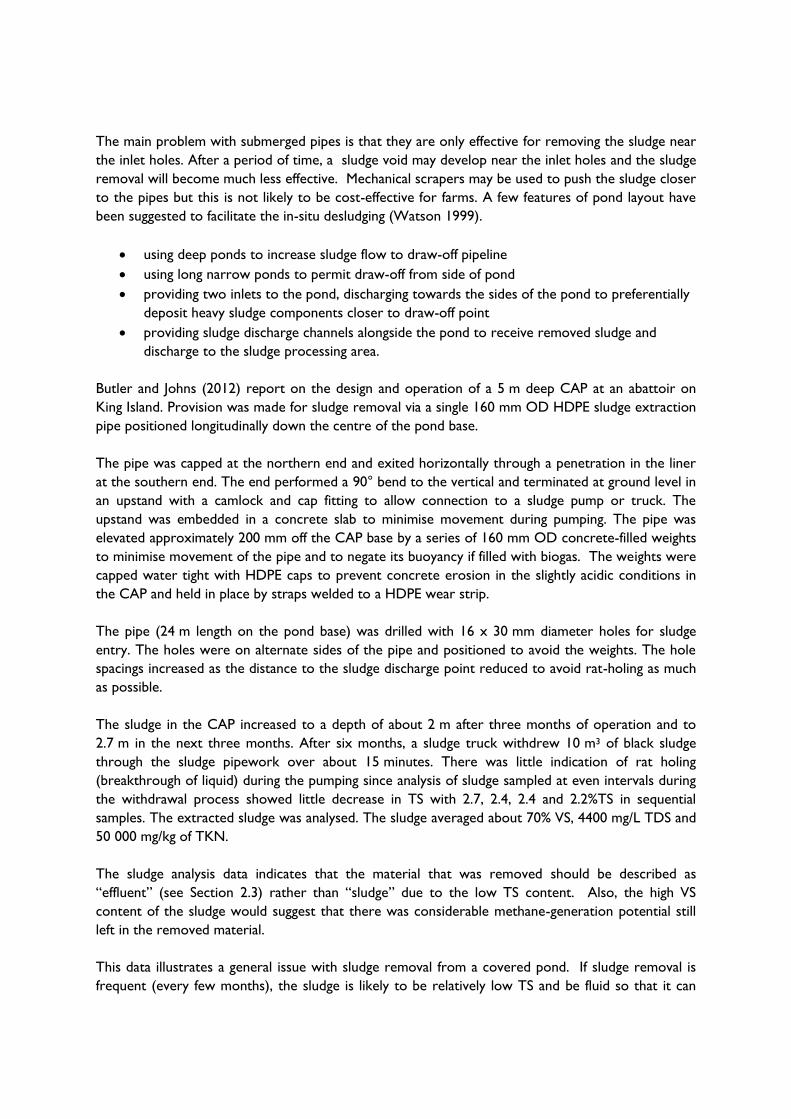
The main problem with submerged pipes is that they are only effective for removing the sludge near
the inlet holes. After a period of time, a sludge void may develop near the inlet holes and the sludge
removal will become much less effective. Mechanical scrapers may be used to push the sludge closer
to the pipes but this is not likely to be cost-effective for farms. A few features of pond layout have
been suggested to facilitate the in-situ desludging (Watson 1999).
using deep ponds to increase sludge flow to draw-off pipeline
using long narrow ponds to permit draw-off from side of pond
providing two inlets to the pond, discharging towards the sides of the pond to preferentially
deposit heavy sludge components closer to draw-off point
providing sludge discharge channels alongside the pond to receive removed sludge and
discharge to the sludge processing area.
Butler and Johns (2012) report on the design and operation of a 5 m deep CAP at an abattoir on
King Island. Provision was made for sludge removal via a single 160 mm OD HDPE sludge extraction
pipe positioned longitudinally down the centre of the pond base.
The pipe was capped at the northern end and exited horizontally through a penetration in the liner
at the southern end. The end performed a 90° bend to the vertical and terminated at ground level in
an upstand with a camlock and cap fitting to allow connection to a sludge pump or truck. The
upstand was embedded in a concrete slab to minimise movement during pumping. The pipe was
elevated approximately 200 mm off the CAP base by a series of 160 mm OD concrete-filled weights
to minimise movement of the pipe and to negate its buoyancy if filled with biogas. The weights were
capped water tight with HDPE caps to prevent concrete erosion in the slightly acidic conditions in
the CAP and held in place by straps welded to a HDPE wear strip.
The pipe (24 m length on the pond base) was drilled with 16 x 30 mm diameter holes for sludge
entry. The holes were on alternate sides of the pipe and positioned to avoid the weights. The hole
spacings increased as the distance to the sludge discharge point reduced to avoid rat-holing as much
as possible.
The sludge in the CAP increased to a depth of about 2 m after three months of operation and to
2.7 m in the next three months. After six months, a sludge truck withdrew 10 m3 of black sludge
through the sludge pipework over about 15 minutes. There was little indication of rat holing
(breakthrough of liquid) during the pumping since analysis of sludge sampled at even intervals during
the withdrawal process showed little decrease in TS with 2.7, 2.4, 2.4 and 2.2%TS in sequential
samples. The extracted sludge was analysed. The sludge averaged about 70% VS, 4400 mg/L TDS and
50 000 mg/kg of TKN.
The sludge analysis data indicates that the material that was removed should be described as
“effluent” (see Section 2.3) rather than “sludge” due to the low TS content. Also, the high VS
content of the sludge would suggest that there was considerable methane-generation potential still
left in the removed material.
This data illustrates a general issue with sludge removal from a covered pond. If sludge removal is
frequent (every few months), the sludge is likely to be relatively low TS and be fluid so that it can
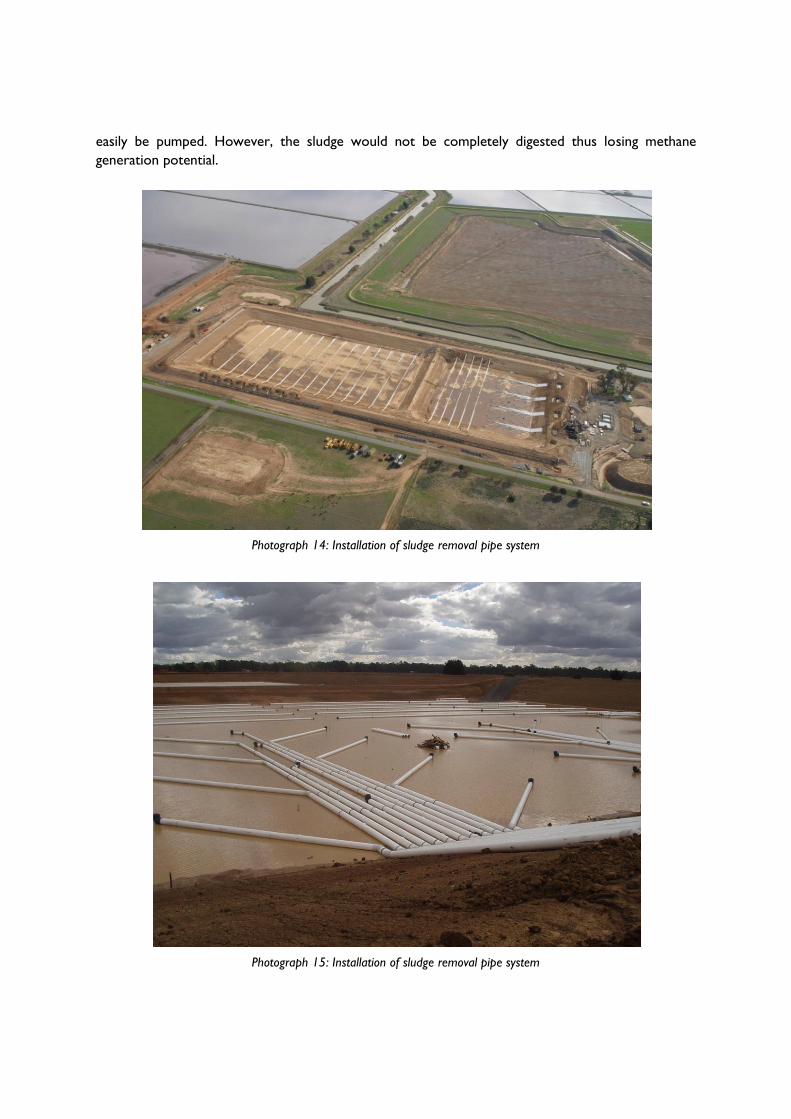
easily be pumped. However, the sludge would not be completely digested thus losing methane
generation potential.
Photograph 14: Installation of sludge removal pipe system
Photograph 15: Installation of sludge removal pipe system
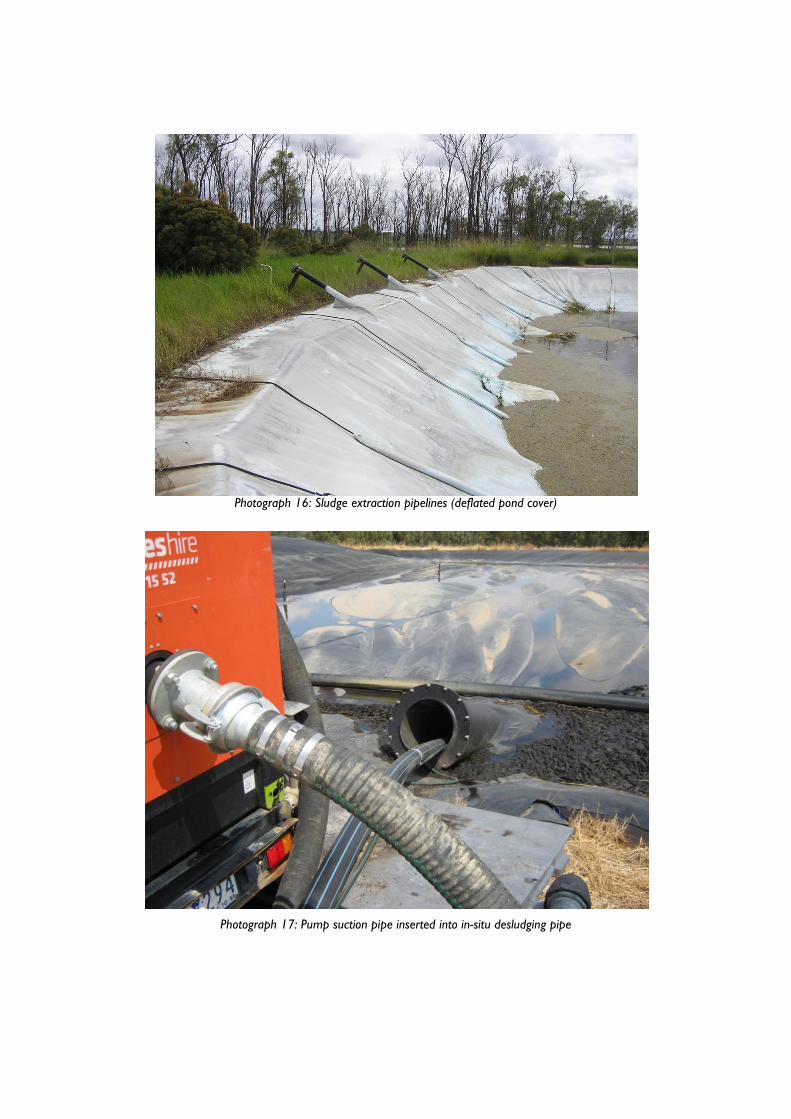
Photograph 16: Sludge extraction pipelines (deflated pond cover)
Photograph 17: Pump suction pipe inserted into in-situ desludging pipe
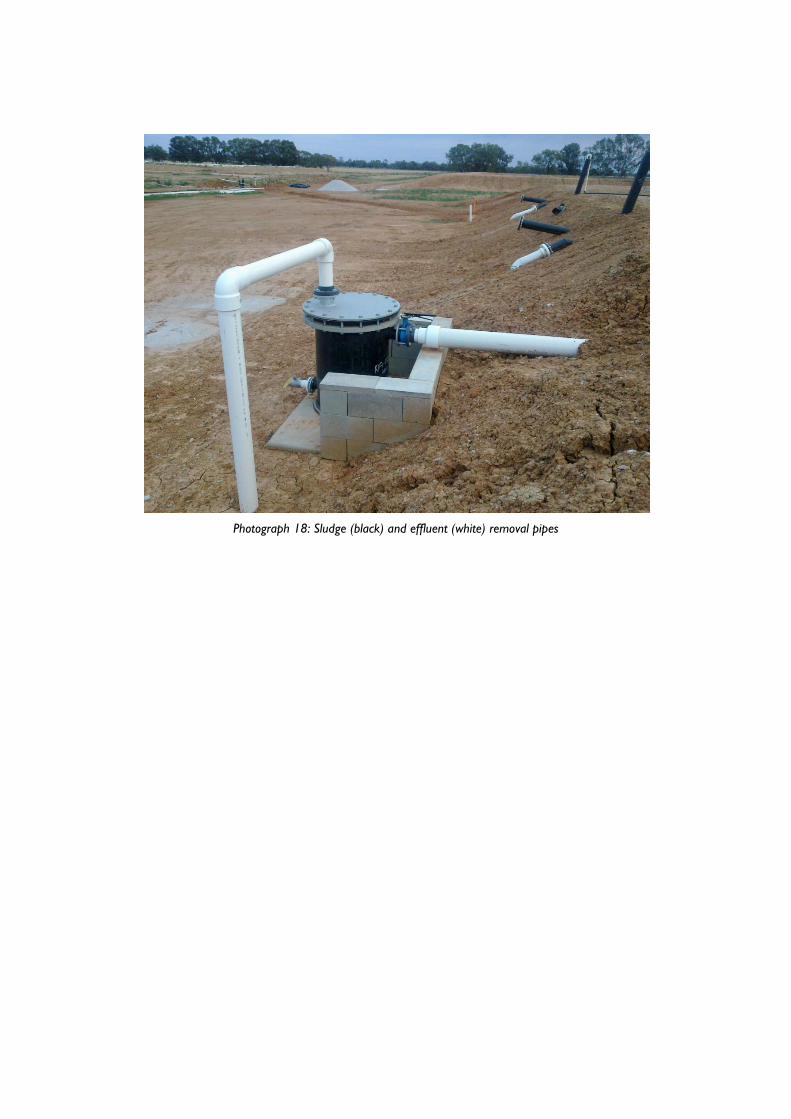
Photograph 18: Sludge (black) and effluent (white) removal pipes
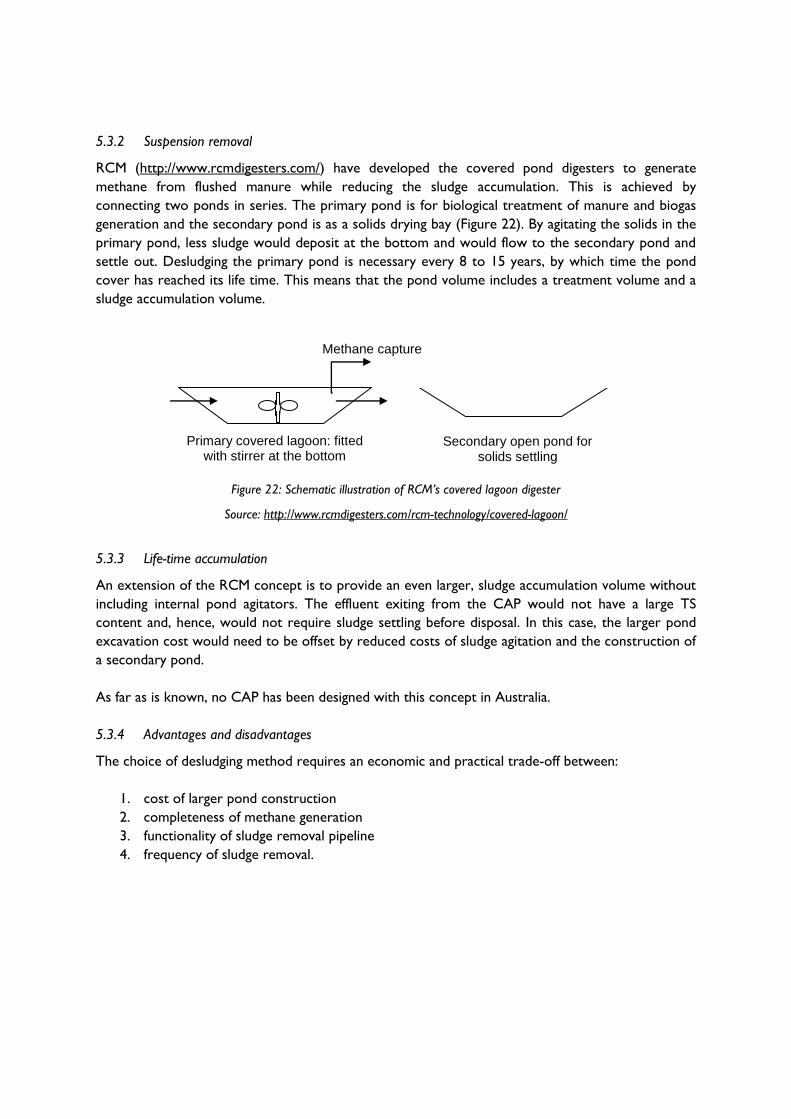
5.3.2 Suspension removal
RCM (http://www.rcmdigesters.com/) have developed the covered pond digesters to generate
methane from flushed manure while reducing the sludge accumulation. This is achieved by
connecting two ponds in series. The primary pond is for biological treatment of manure and biogas
generation and the secondary pond is as a solids drying bay (Figure 22). By agitating the solids in the
primary pond, less sludge would deposit at the bottom and would flow to the secondary pond and
settle out. Desludging the primary pond is necessary every 8 to 15 years, by which time the pond
cover has reached its life time. This means that the pond volume includes a treatment volume and a
sludge accumulation volume.
Figure 22: Schematic illustration of RCM’s covered lagoon digester
Source: http://www.rcmdigesters.com/rcm-technology/covered-lagoon/
5.3.3 Life-time accumulation
An extension of the RCM concept is to provide an even larger, sludge accumulation volume without
including internal pond agitators. The effluent exiting from the CAP would not have a large TS
content and, hence, would not require sludge settling before disposal. In this case, the larger pond
excavation cost would need to be offset by reduced costs of sludge agitation and the construction of
a secondary pond.
As far as is known, no CAP has been designed with this concept in Australia.
5.3.4 Advantages and disadvantages
The choice of desludging method requires an economic and practical trade-off between:
1. cost of larger pond construction
2. completeness of methane generation
3. functionality of sludge removal pipeline
4. frequency of sludge removal.
Primary covered lagoon: fitted with stirrer at the bottom
Secondary open pond for solids settling
Methane capture
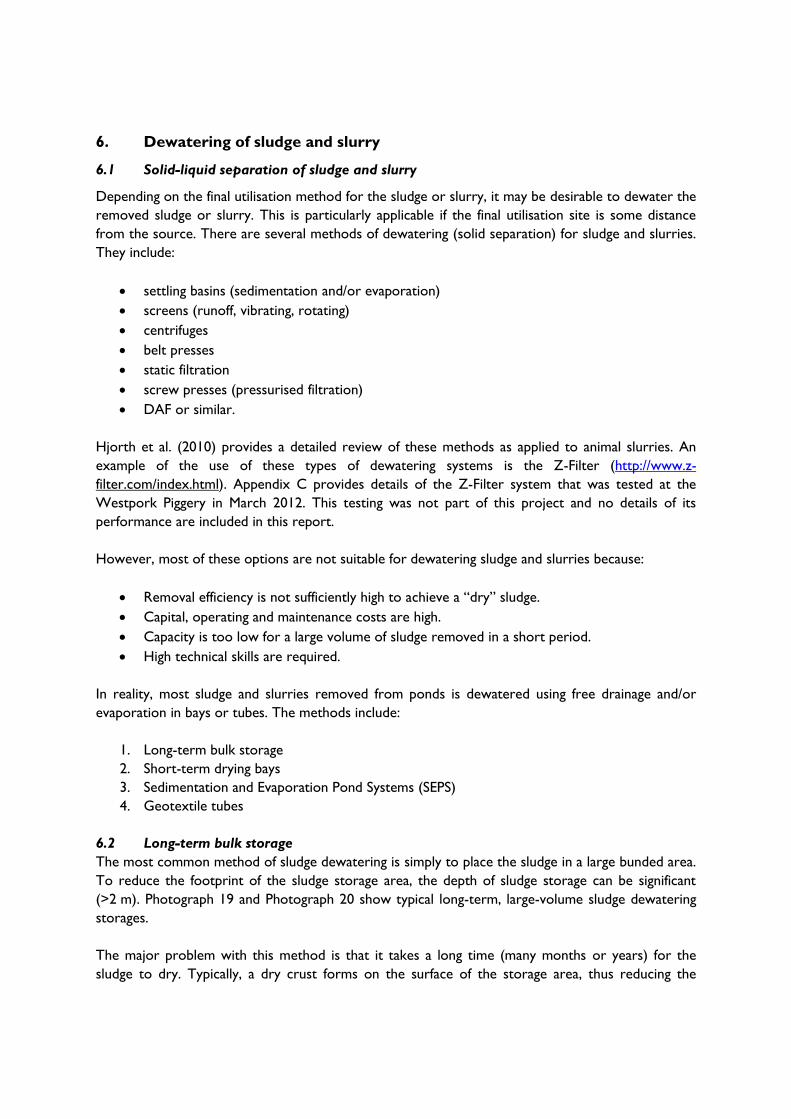
6. Dewatering of sludge and slurry
6.1 Solid-liquid separation of sludge and slurry
Depending on the final utilisation method for the sludge or slurry, it may be desirable to dewater the
removed sludge or slurry. This is particularly applicable if the final utilisation site is some distance
from the source. There are several methods of dewatering (solid separation) for sludge and slurries.
They include:
settling basins (sedimentation and/or evaporation)
screens (runoff, vibrating, rotating)
centrifuges
belt presses
static filtration
screw presses (pressurised filtration)
DAF or similar.
Hjorth et al. (2010) provides a detailed review of these methods as applied to animal slurries. An
example of the use of these types of dewatering systems is the Z-Filter (http://www.z-
filter.com/index.html). Appendix C provides details of the Z-Filter system that was tested at the
Westpork Piggery in March 2012. This testing was not part of this project and no details of its
performance are included in this report.
However, most of these options are not suitable for dewatering sludge and slurries because:
Removal efficiency is not sufficiently high to achieve a “dry” sludge.
Capital, operating and maintenance costs are high.
Capacity is too low for a large volume of sludge removed in a short period.
High technical skills are required.
In reality, most sludge and slurries removed from ponds is dewatered using free drainage and/or
evaporation in bays or tubes. The methods include:
1. Long-term bulk storage
2. Short-term drying bays
3. Sedimentation and Evaporation Pond Systems (SEPS)
4. Geotextile tubes
6.2 Long-term bulk storage
The most common method of sludge dewatering is simply to place the sludge in a large bunded area.
To reduce the footprint of the sludge storage area, the depth of sludge storage can be significant
(>2 m). Photograph 19 and Photograph 20 show typical long-term, large-volume sludge dewatering
storages.
The major problem with this method is that it takes a long time (many months or years) for the
sludge to dry. Typically, a dry crust forms on the surface of the storage area, thus reducing the
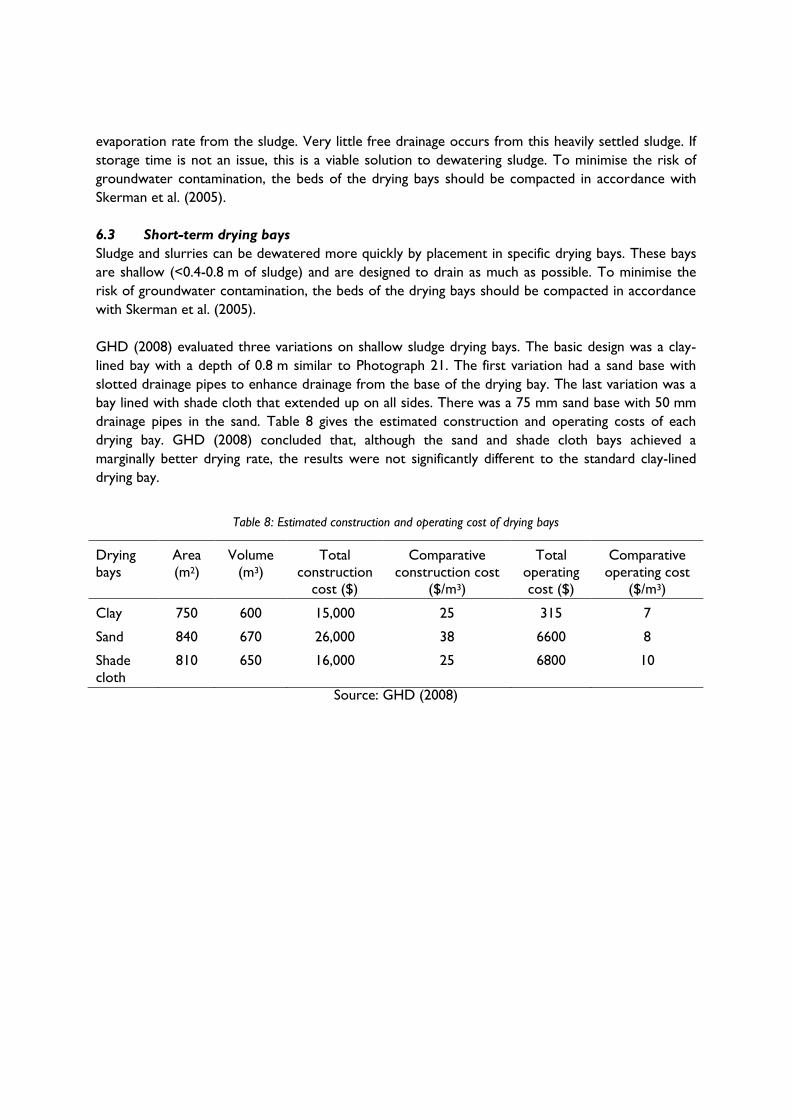
evaporation rate from the sludge. Very little free drainage occurs from this heavily settled sludge. If
storage time is not an issue, this is a viable solution to dewatering sludge. To minimise the risk of
groundwater contamination, the beds of the drying bays should be compacted in accordance with
Skerman et al. (2005).
6.3 Short-term drying bays
Sludge and slurries can be dewatered more quickly by placement in specific drying bays. These bays
are shallow (<0.4-0.8 m of sludge) and are designed to drain as much as possible. To minimise the
risk of groundwater contamination, the beds of the drying bays should be compacted in accordance
with Skerman et al. (2005).
GHD (2008) evaluated three variations on shallow sludge drying bays. The basic design was a clay-
lined bay with a depth of 0.8 m similar to Photograph 21. The first variation had a sand base with
slotted drainage pipes to enhance drainage from the base of the drying bay. The last variation was a
bay lined with shade cloth that extended up on all sides. There was a 75 mm sand base with 50 mm
drainage pipes in the sand. Table 8 gives the estimated construction and operating costs of each
drying bay. GHD (2008) concluded that, although the sand and shade cloth bays achieved a
marginally better drying rate, the results were not significantly different to the standard clay-lined
drying bay.
Table 8: Estimated construction and operating cost of drying bays
Drying
bays
Area
(m2)
Volume
(m3)
Total
construction
cost ($)
Comparative
construction cost
($/m3)
Total
operating
cost ($)
Comparative
operating cost
($/m3)
Clay 750 600 15,000 25 315 7
Sand 840 670 26,000 38 6600 8
Shade
cloth
810 650 16,000 25 6800 10
Source: GHD (2008)

Photograph 19: Long-term sludge drying bay
Photograph 20: Surface crusting of long-term drying bay
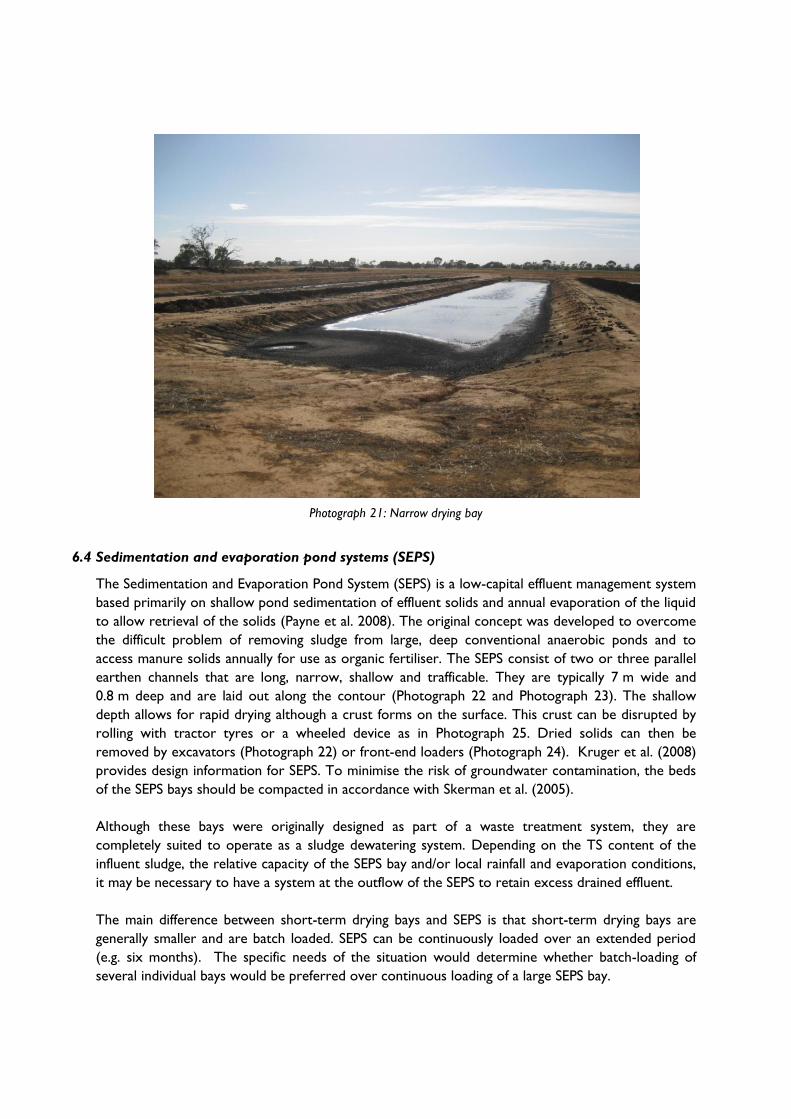
Photograph 21: Narrow drying bay
6.4 Sedimentation and evaporation pond systems (SEPS)
The Sedimentation and Evaporation Pond System (SEPS) is a low-capital effluent management system
based primarily on shallow pond sedimentation of effluent solids and annual evaporation of the liquid
to allow retrieval of the solids (Payne et al. 2008). The original concept was developed to overcome
the difficult problem of removing sludge from large, deep conventional anaerobic ponds and to
access manure solids annually for use as organic fertiliser. The SEPS consist of two or three parallel
earthen channels that are long, narrow, shallow and trafficable. They are typically 7 m wide and
0.8 m deep and are laid out along the contour (Photograph 22 and Photograph 23). The shallow
depth allows for rapid drying although a crust forms on the surface. This crust can be disrupted by
rolling with tractor tyres or a wheeled device as in Photograph 25. Dried solids can then be
removed by excavators (Photograph 22) or front-end loaders (Photograph 24). Kruger et al. (2008)
provides design information for SEPS. To minimise the risk of groundwater contamination, the beds
of the SEPS bays should be compacted in accordance with Skerman et al. (2005).
Although these bays were originally designed as part of a waste treatment system, they are
completely suited to operate as a sludge dewatering system. Depending on the TS content of the
influent sludge, the relative capacity of the SEPS bay and/or local rainfall and evaporation conditions,
it may be necessary to have a system at the outflow of the SEPS to retain excess drained effluent.
The main difference between short-term drying bays and SEPS is that short-term drying bays are
generally smaller and are batch loaded. SEPS can be continuously loaded over an extended period
(e.g. six months). The specific needs of the situation would determine whether batch-loading of
several individual bays would be preferred over continuous loading of a large SEPS bay.

Research has been done on odour emissions from SEPS (Hayes et al. 2007, Payne et al. 2008) and by
Skerman et al. (2013). Skerman et al. (2013) noted that the maximum odour emissions from the
Queensland SEPS were in the range recorded for conventional anaerobic ponds. These results
suggest that the overall odour emissions from SEPS are likely to be lower than for conventional
ponds due to the significantly smaller surface area of the active and drying SEPS channels and similar
or lower odour emission rates per unit area.
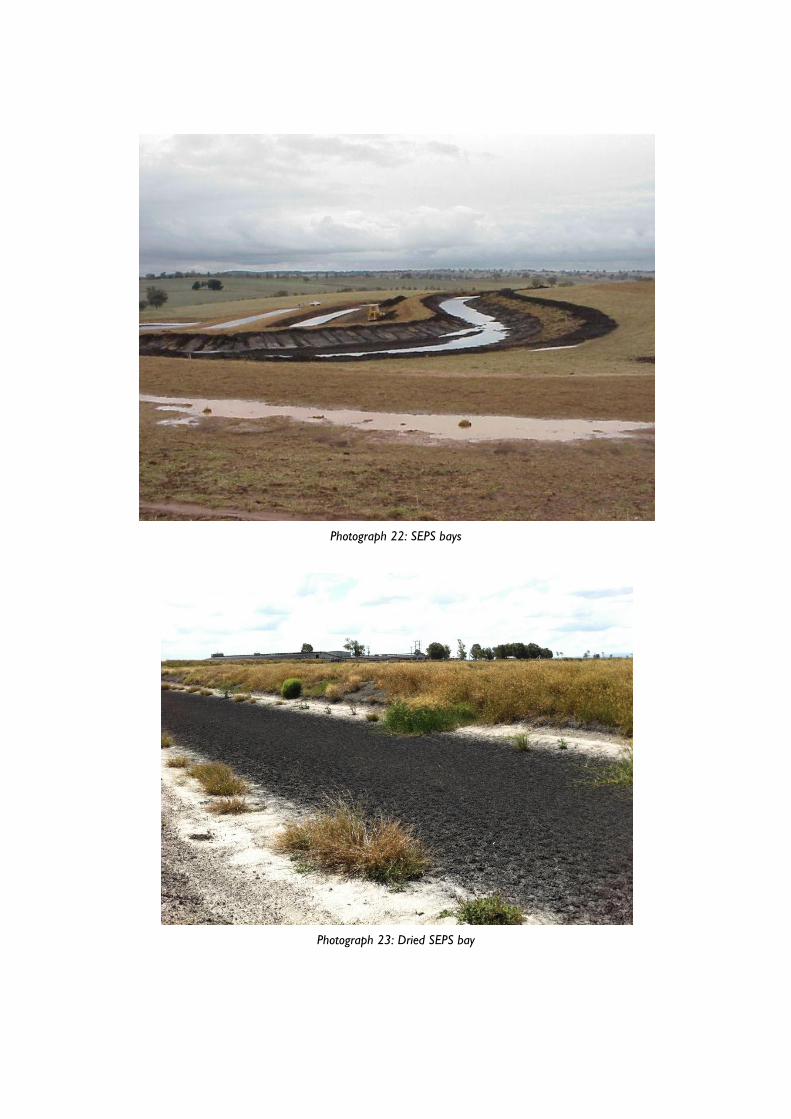
Photograph 22: SEPS bays
Photograph 23: Dried SEPS bay
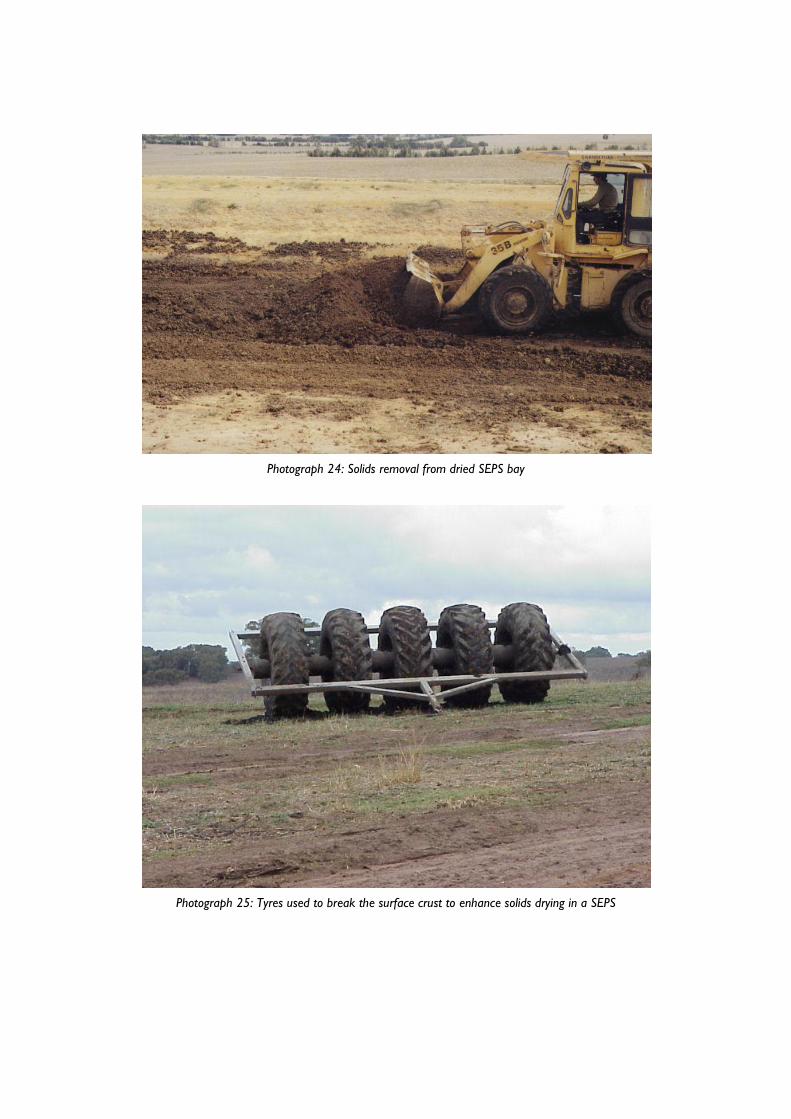
Photograph 24: Solids removal from dried SEPS bay
Photograph 25: Tyres used to break the surface crust to enhance solids drying in a SEPS
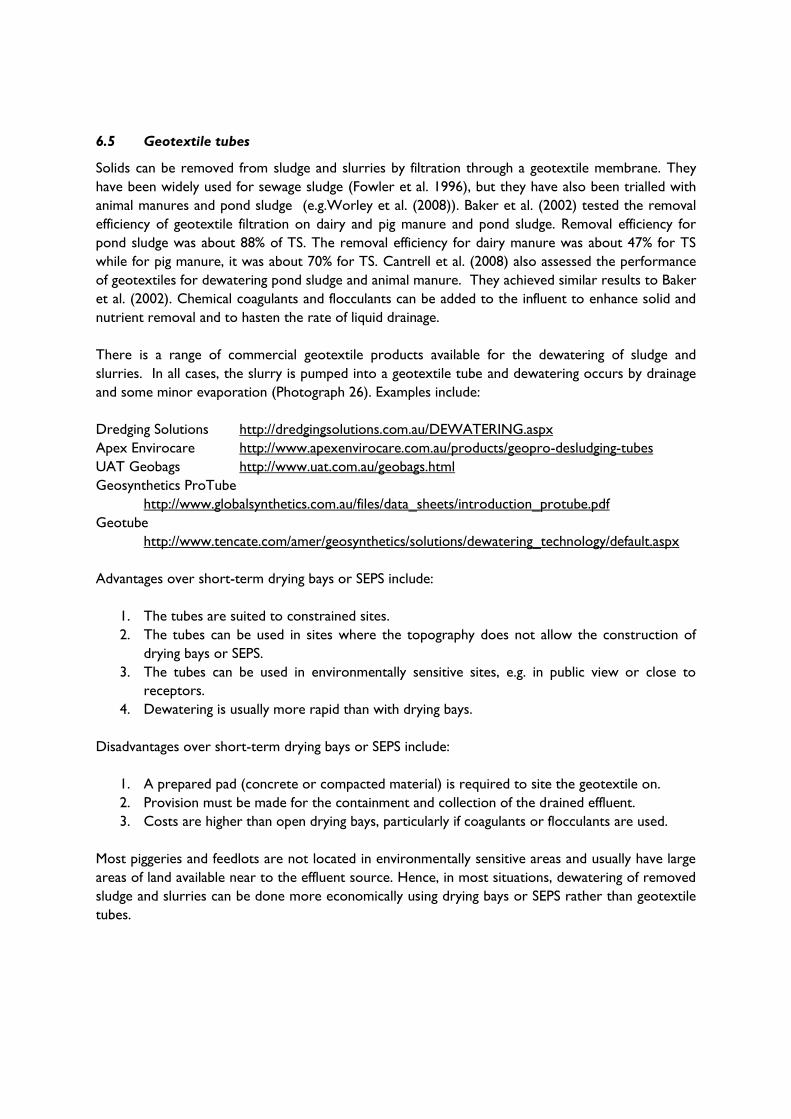
6.5 Geotextile tubes
Solids can be removed from sludge and slurries by filtration through a geotextile membrane. They
have been widely used for sewage sludge (Fowler et al. 1996), but they have also been trialled with
animal manures and pond sludge (e.g.Worley et al. (2008)). Baker et al. (2002) tested the removal
efficiency of geotextile filtration on dairy and pig manure and pond sludge. Removal efficiency for
pond sludge was about 88% of TS. The removal efficiency for dairy manure was about 47% for TS
while for pig manure, it was about 70% for TS. Cantrell et al. (2008) also assessed the performance
of geotextiles for dewatering pond sludge and animal manure. They achieved similar results to Baker
et al. (2002). Chemical coagulants and flocculants can be added to the influent to enhance solid and
nutrient removal and to hasten the rate of liquid drainage.
There is a range of commercial geotextile products available for the dewatering of sludge and
slurries. In all cases, the slurry is pumped into a geotextile tube and dewatering occurs by drainage
and some minor evaporation (Photograph 26). Examples include:
Dredging Solutions http://dredgingsolutions.com.au/DEWATERING.aspx
Apex Envirocare http://www.apexenvirocare.com.au/products/geopro-desludging-tubes
UAT Geobags http://www.uat.com.au/geobags.html
Geosynthetics ProTube
http://www.globalsynthetics.com.au/files/data_sheets/introduction_protube.pdf
Geotube
http://www.tencate.com/amer/geosynthetics/solutions/dewatering_technology/default.aspx
Advantages over short-term drying bays or SEPS include:
1. The tubes are suited to constrained sites.
2. The tubes can be used in sites where the topography does not allow the construction of
drying bays or SEPS.
3. The tubes can be used in environmentally sensitive sites, e.g. in public view or close to
receptors.
4. Dewatering is usually more rapid than with drying bays.
Disadvantages over short-term drying bays or SEPS include:
1. A prepared pad (concrete or compacted material) is required to site the geotextile on.
2. Provision must be made for the containment and collection of the drained effluent.
3. Costs are higher than open drying bays, particularly if coagulants or flocculants are used.
Most piggeries and feedlots are not located in environmentally sensitive areas and usually have large
areas of land available near to the effluent source. Hence, in most situations, dewatering of removed
sludge and slurries can be done more economically using drying bays or SEPS rather than geotextile
tubes.
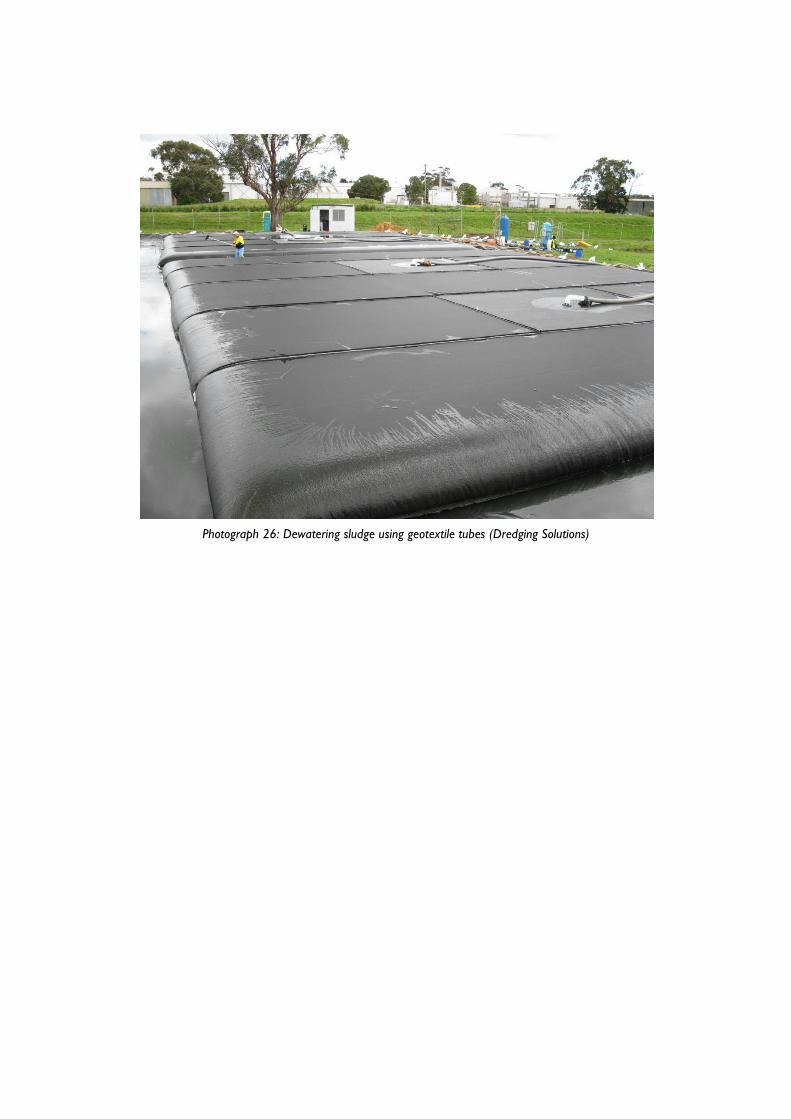
Photograph 26: Dewatering sludge using geotextile tubes (Dredging Solutions)
7. Methodology
7.1 Introduction
Samples were taken and analysed at piggeries and feedlots across Australia to determine some
baseline data on sludge and slurry characteristics.
Sludge samples were collected from five piggery sites (Piggery A – Piggery E) and six feedlot sites
(Feedlot A – Feedlot F). At Piggery A, a field experiment was conducted to determine the pipe
pressure loss from different lengths of suction pipe accessing sludge removal pipes in the bed of a
covered anaerobic pond. Sludge samples were taken during this pump test and were analysed for
particle sizes and rheology characteristics.
7.2 Sample sites and sampling methods
At all sites, disturbed samples were taken rather than trying to take undisturbed samples in the bed
of a pond. Disturbed samples do not represent the sludge was in its natural state before sampling.
However, in this case, in-situ conditions are less relevant as all sludge would be agitated during
removal and handling.
At the piggery sites, the pump was started and run for 5 minutes to clear the pipe. After 5 minutes, a
sample was taken every 60 second over about an 8 minute period. The sub-samples were combined
to form a composite 2 L sample for analysis. At all piggery sites (except Piggery C), the composite
sample was placed in a snap-lock plastic bag, labelled according to the location and type of sample,
sealed and placed in a second snap-lock bag for safety. The sample was placed sealed in an insulated
cooler box and immediately covered with ice. Samples were delivered to the laboratory within two
days of sampling.
At Piggery C, samples of sludge were collected with a sample bottle attached to the bottom of an
aluminium pole. The sampling bottle was lowered about 0.5 m below the surface of the drying bay
where the sludge layer was encountered.
At feedlot sites, sludge samples were collected in the same method as Piggery C. The samples were
transported from the site in strong waterproof sample bags and stored at 4C in a foam esky with
freezer packs. The sludge was transferred to stronger containers and posted to the laboratory the
next day. Three replicates were collected and analysed for each feedlot site.
7.2.1 Piggery A
Piggery A is a finisher (grow-out) enterprise located in southern Australia with a capacity of about
22 000 pigs. The area has a dry, winter-dominant rainfall pattern with an average 395 mm per year.
The piggery has conventional sheds with slatted floors. The raw wastewater is screened over a run-
down screen prior to entry into a CAP.
The sludge is pumped with a Mono pump from the bottom of the CAP to clay-lined drying bays
(Photograph 27). The riser main from the CAP is shown Photograph 28. All samples at this site were
collected during the pipe friction loss experiment (see Section 7.3).
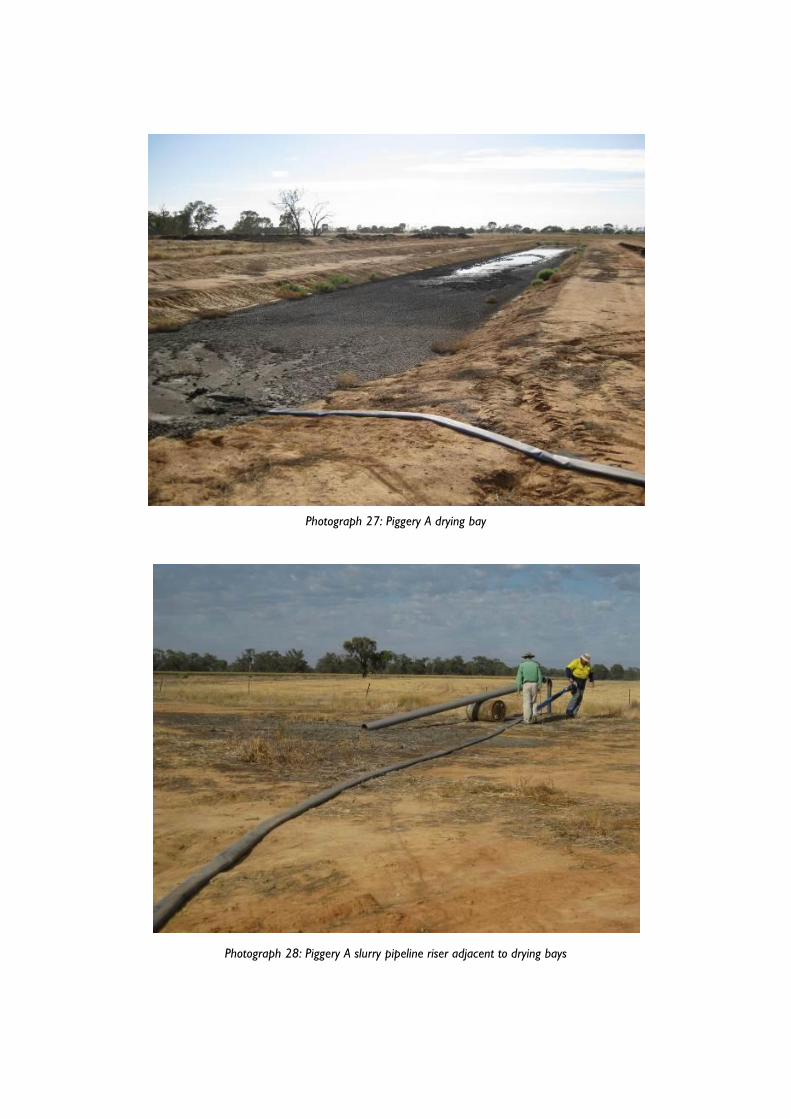
Photograph 27: Piggery A drying bay
Photograph 28: Piggery A slurry pipeline riser adjacent to drying bays
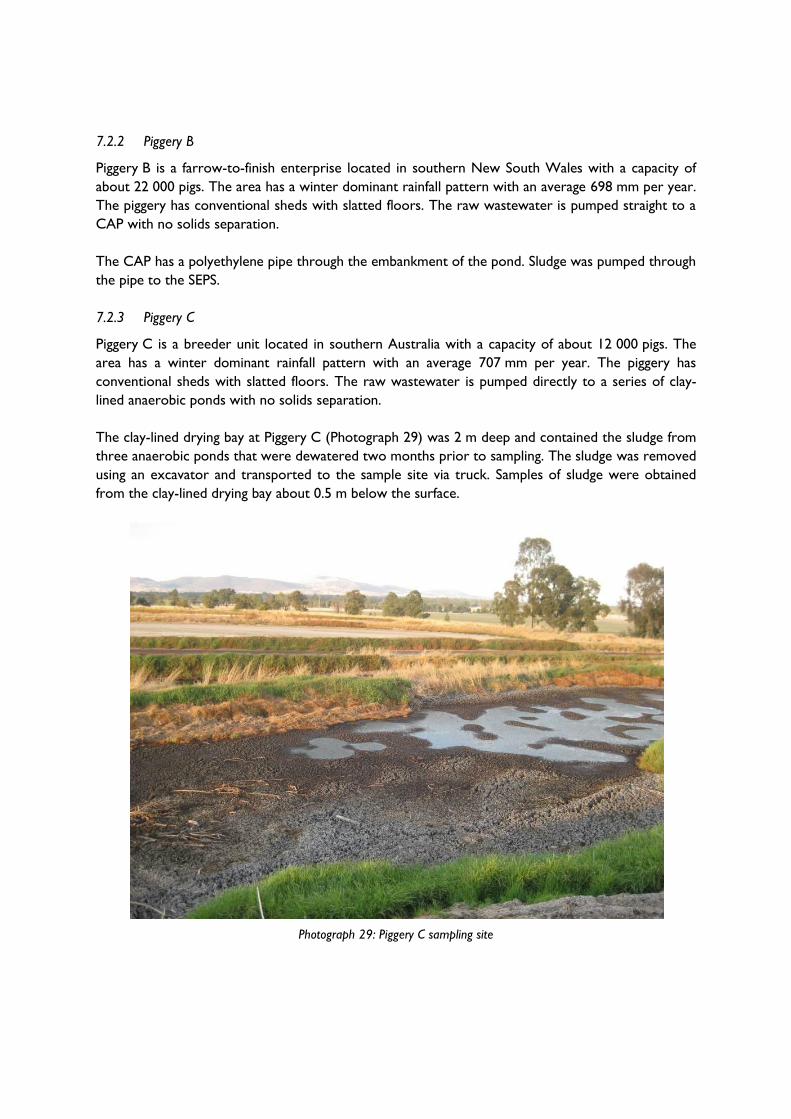
7.2.2 Piggery B
Piggery B is a farrow-to-finish enterprise located in southern New South Wales with a capacity of
about 22 000 pigs. The area has a winter dominant rainfall pattern with an average 698 mm per year.
The piggery has conventional sheds with slatted floors. The raw wastewater is pumped straight to a
CAP with no solids separation.
The CAP has a polyethylene pipe through the embankment of the pond. Sludge was pumped through
the pipe to the SEPS.
7.2.3 Piggery C
Piggery C is a breeder unit located in southern Australia with a capacity of about 12 000 pigs. The
area has a winter dominant rainfall pattern with an average 707 mm per year. The piggery has
conventional sheds with slatted floors. The raw wastewater is pumped directly to a series of clay-
lined anaerobic ponds with no solids separation.
The clay-lined drying bay at Piggery C (Photograph 29) was 2 m deep and contained the sludge from
three anaerobic ponds that were dewatered two months prior to sampling. The sludge was removed
using an excavator and transported to the sample site via truck. Samples of sludge were obtained
from the clay-lined drying bay about 0.5 m below the surface.
Photograph 29: Piggery C sampling site
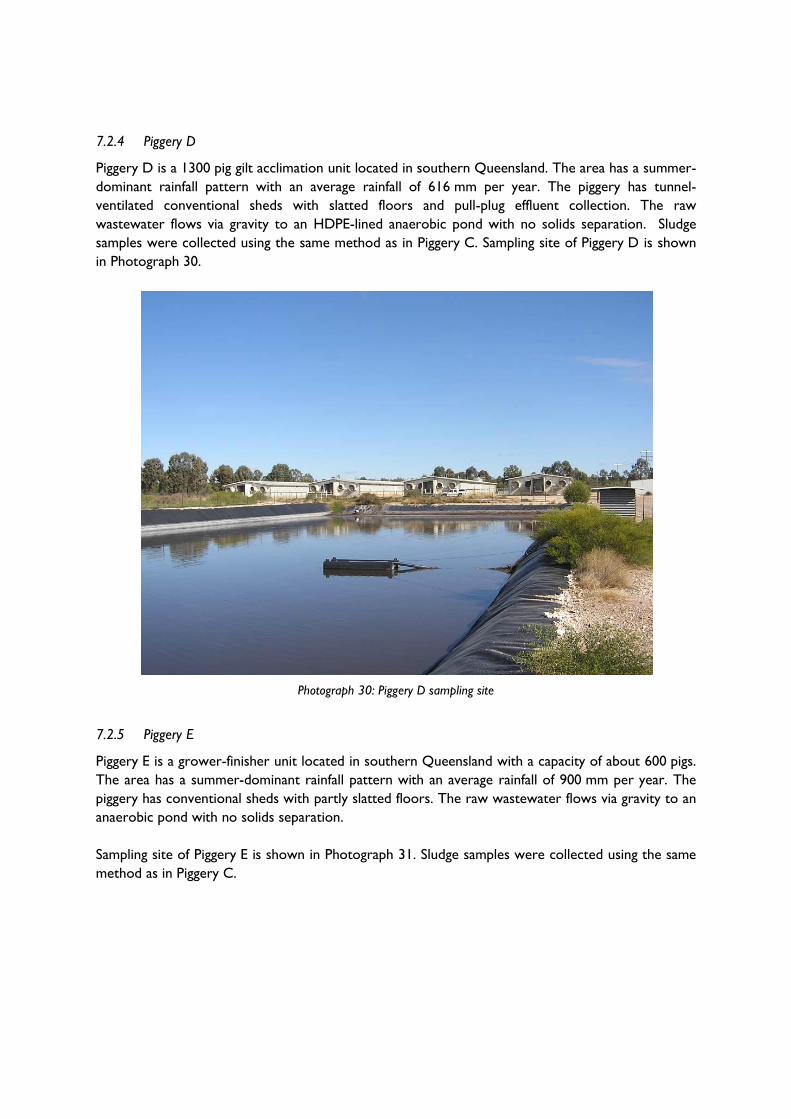
7.2.4 Piggery D
Piggery D is a 1300 pig gilt acclimation unit located in southern Queensland. The area has a summer-
dominant rainfall pattern with an average rainfall of 616 mm per year. The piggery has tunnel-
ventilated conventional sheds with slatted floors and pull-plug effluent collection. The raw
wastewater flows via gravity to an HDPE-lined anaerobic pond with no solids separation. Sludge
samples were collected using the same method as in Piggery C. Sampling site of Piggery D is shown
in Photograph 30.
Photograph 30: Piggery D sampling site
7.2.5 Piggery E
Piggery E is a grower-finisher unit located in southern Queensland with a capacity of about 600 pigs.
The area has a summer-dominant rainfall pattern with an average rainfall of 900 mm per year. The
piggery has conventional sheds with partly slatted floors. The raw wastewater flows via gravity to an
anaerobic pond with no solids separation.
Sampling site of Piggery E is shown in Photograph 31. Sludge samples were collected using the same
method as in Piggery C.
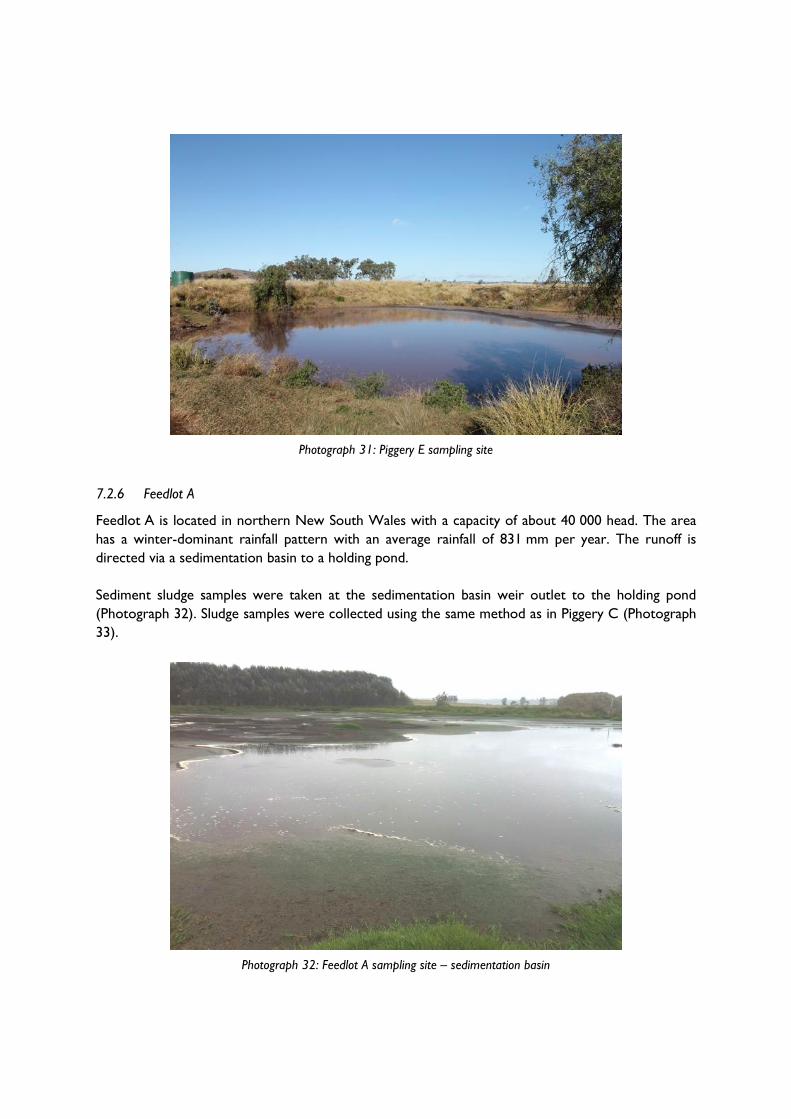
Photograph 31: Piggery E sampling site
7.2.6 Feedlot A
Feedlot A is located in northern New South Wales with a capacity of about 40 000 head. The area
has a winter-dominant rainfall pattern with an average rainfall of 831 mm per year. The runoff is
directed via a sedimentation basin to a holding pond.
Sediment sludge samples were taken at the sedimentation basin weir outlet to the holding pond
(Photograph 32). Sludge samples were collected using the same method as in Piggery C (Photograph
33).
Photograph 32: Feedlot A sampling site – sedimentation basin
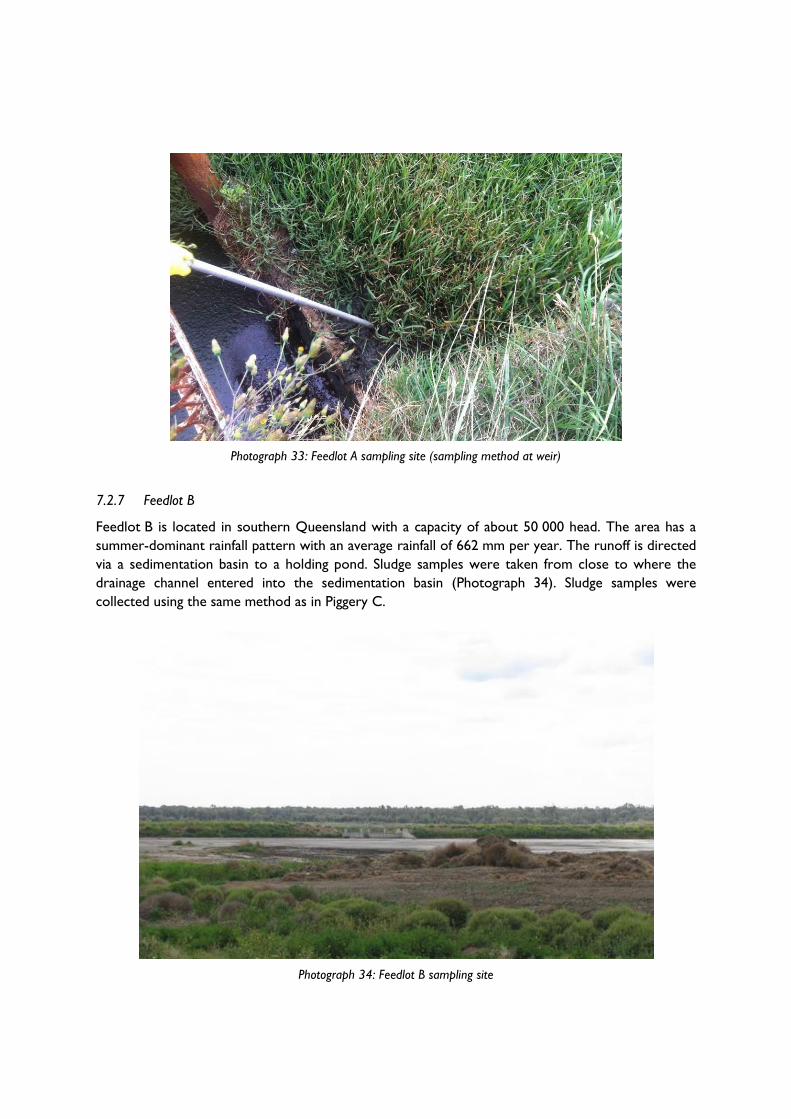
Photograph 33: Feedlot A sampling site (sampling method at weir)
7.2.7 Feedlot B
Feedlot B is located in southern Queensland with a capacity of about 50 000 head. The area has a
summer-dominant rainfall pattern with an average rainfall of 662 mm per year. The runoff is directed
via a sedimentation basin to a holding pond. Sludge samples were taken from close to where the
drainage channel entered into the sedimentation basin (Photograph 34). Sludge samples were
collected using the same method as in Piggery C.
Photograph 34: Feedlot B sampling site
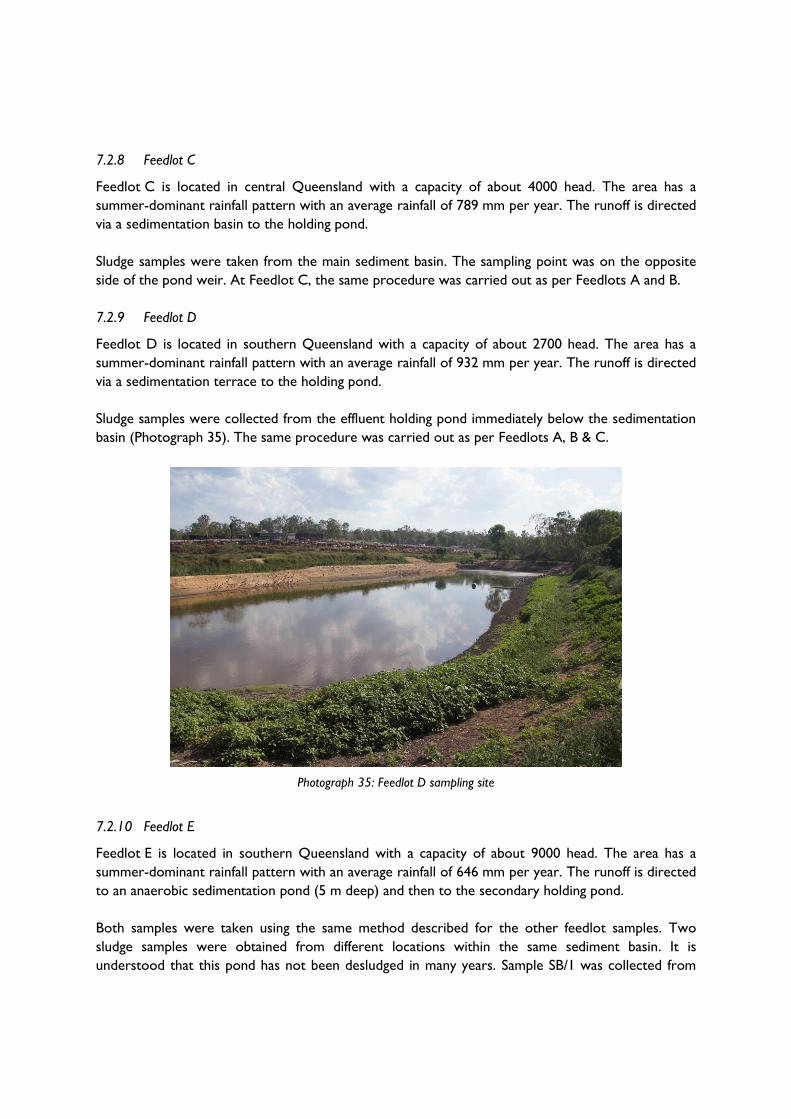
7.2.8 Feedlot C
Feedlot C is located in central Queensland with a capacity of about 4000 head. The area has a
summer-dominant rainfall pattern with an average rainfall of 789 mm per year. The runoff is directed
via a sedimentation basin to the holding pond.
Sludge samples were taken from the main sediment basin. The sampling point was on the opposite
side of the pond weir. At Feedlot C, the same procedure was carried out as per Feedlots A and B.
7.2.9 Feedlot D
Feedlot D is located in southern Queensland with a capacity of about 2700 head. The area has a
summer-dominant rainfall pattern with an average rainfall of 932 mm per year. The runoff is directed
via a sedimentation terrace to the holding pond.
Sludge samples were collected from the effluent holding pond immediately below the sedimentation
basin (Photograph 35). The same procedure was carried out as per Feedlots A, B & C.
Photograph 35: Feedlot D sampling site
7.2.10 Feedlot E
Feedlot E is located in southern Queensland with a capacity of about 9000 head. The area has a
summer-dominant rainfall pattern with an average rainfall of 646 mm per year. The runoff is directed
to an anaerobic sedimentation pond (5 m deep) and then to the secondary holding pond.
Both samples were taken using the same method described for the other feedlot samples. Two
sludge samples were obtained from different locations within the same sediment basin. It is
understood that this pond has not been desludged in many years. Sample SB/1 was collected from
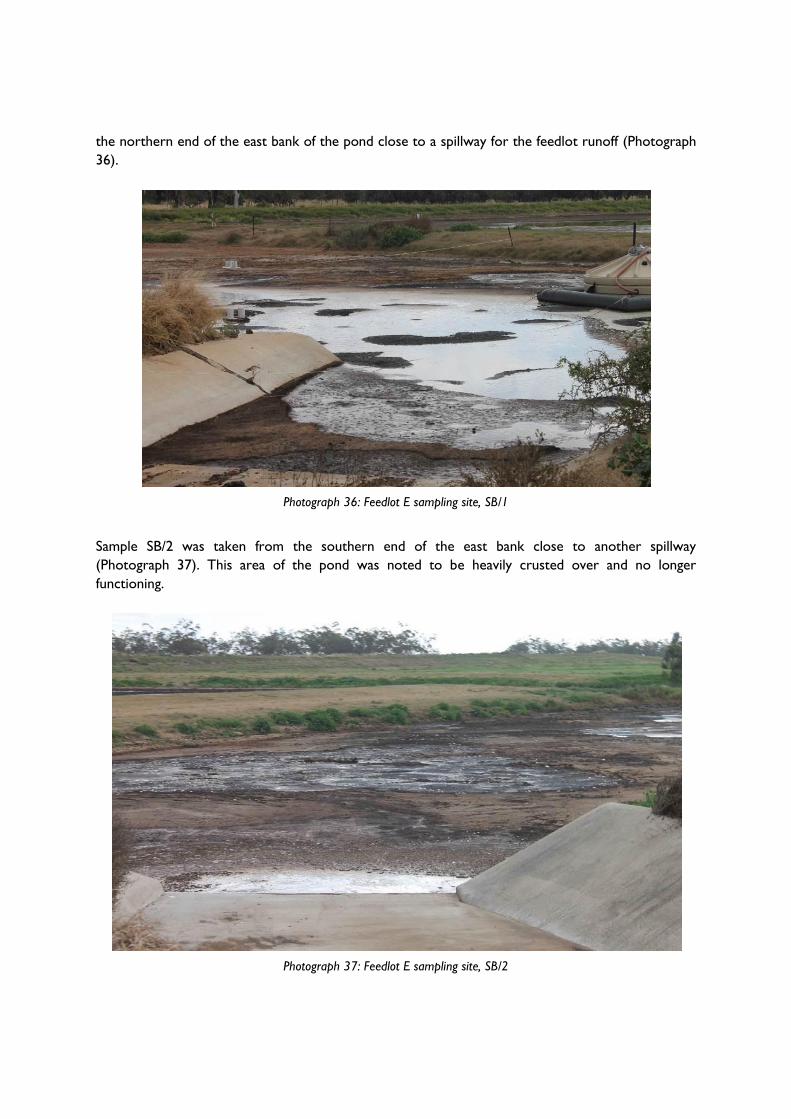
the northern end of the east bank of the pond close to a spillway for the feedlot runoff (Photograph
36).
Photograph 36: Feedlot E sampling site, SB/1
Sample SB/2 was taken from the southern end of the east bank close to another spillway
(Photograph 37). This area of the pond was noted to be heavily crusted over and no longer
functioning.
Photograph 37: Feedlot E sampling site, SB/2
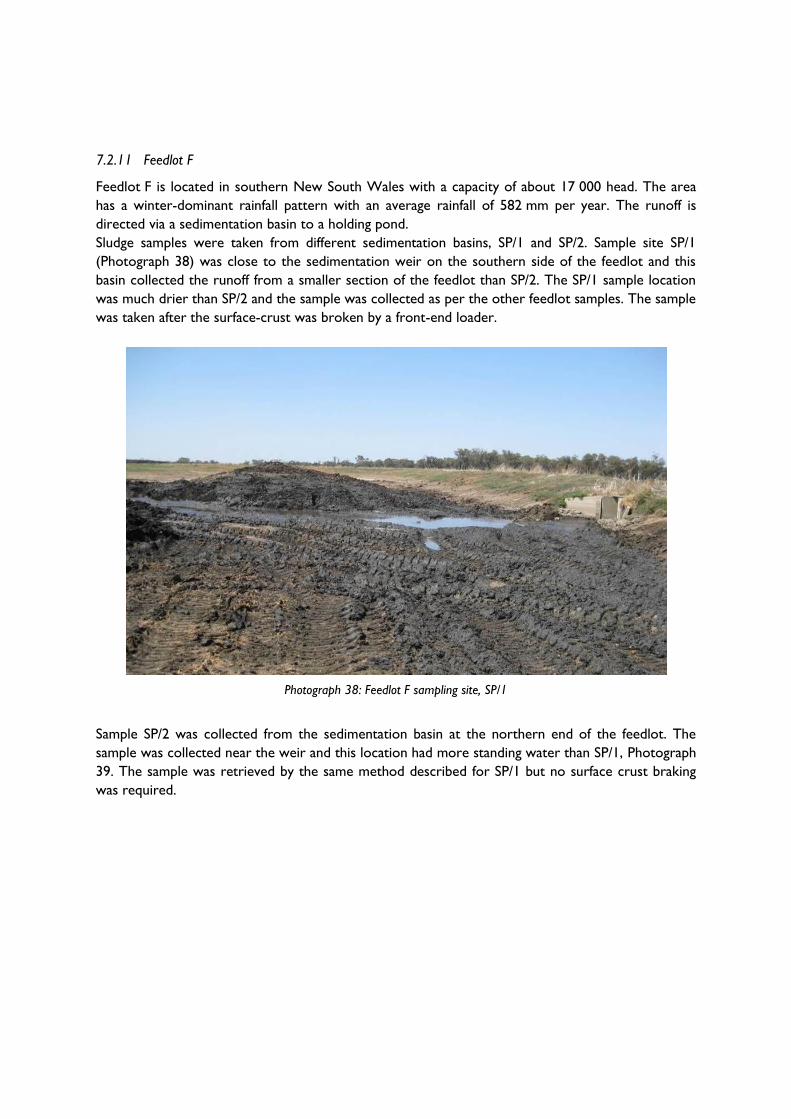
7.2.11 Feedlot F
Feedlot F is located in southern New South Wales with a capacity of about 17 000 head. The area
has a winter-dominant rainfall pattern with an average rainfall of 582 mm per year. The runoff is
directed via a sedimentation basin to a holding pond.
Sludge samples were taken from different sedimentation basins, SP/1 and SP/2. Sample site SP/1
(Photograph 38) was close to the sedimentation weir on the southern side of the feedlot and this
basin collected the runoff from a smaller section of the feedlot than SP/2. The SP/1 sample location
was much drier than SP/2 and the sample was collected as per the other feedlot samples. The sample
was taken after the surface-crust was broken by a front-end loader.
Photograph 38: Feedlot F sampling site, SP/1
Sample SP/2 was collected from the sedimentation basin at the northern end of the feedlot. The
sample was collected near the weir and this location had more standing water than SP/1, Photograph
39. The sample was retrieved by the same method described for SP/1 but no surface crust braking
was required.

Photograph 39: Feedlot F sampling site, SB/2
7.3 Pipe friction loss experiment – Piggery A
The high solids content of sludge is expected to make pumping difficult because pipe friction losses
are greatly increased (see Section 2.5). The sludge settling process is time-dependant, producing a
thicker sludge after longer settling periods before extraction. Consequently, if sludge is extracted
too infrequently, the high solids content may make it very difficult to pump. This effect also has great
practical significance for pump selection and/or pond management, but has not been previously
quantified for piggery sludge.
Hence, an experiment was conducted at Piggery A to determine the friction loss in the suction pipe
that removes sludge from the CAP under different TS contents in the sludge. The experiment
included in-field assessment and laboratory experiments. The laboratory experiments were
conducted to validate the field results, with the aim of assessing the practicality of pumping sludge at
a particular solids concentration.
The design and operation of the CAP is described by Birchall (2010). The CAP was installed in 2004
and was not desludged at all until some efforts in 2010. The liquid depth of the pond is 7.48 m but by
2010, sludge had accumulated to within 2 m of the surface. A perforated sludge removal pipeline
does not appear to have been installed in the base of the pond. Access to the sludge is achieved via
“emergency gas vents”. In 2010, Birchall (2010) extracted sludge at increasing depths in the CAP.
Table 9 shows the VS:TS ratio for the sludge removed at different depths. Except for the deepest
layers, the VS:TS ratio is about 0.60 indicating that the sludge is well degraded. The TS content of
the sludge at 2 m was about 2%. This increased to about 4% at 3 m and over 10% at 5 m.
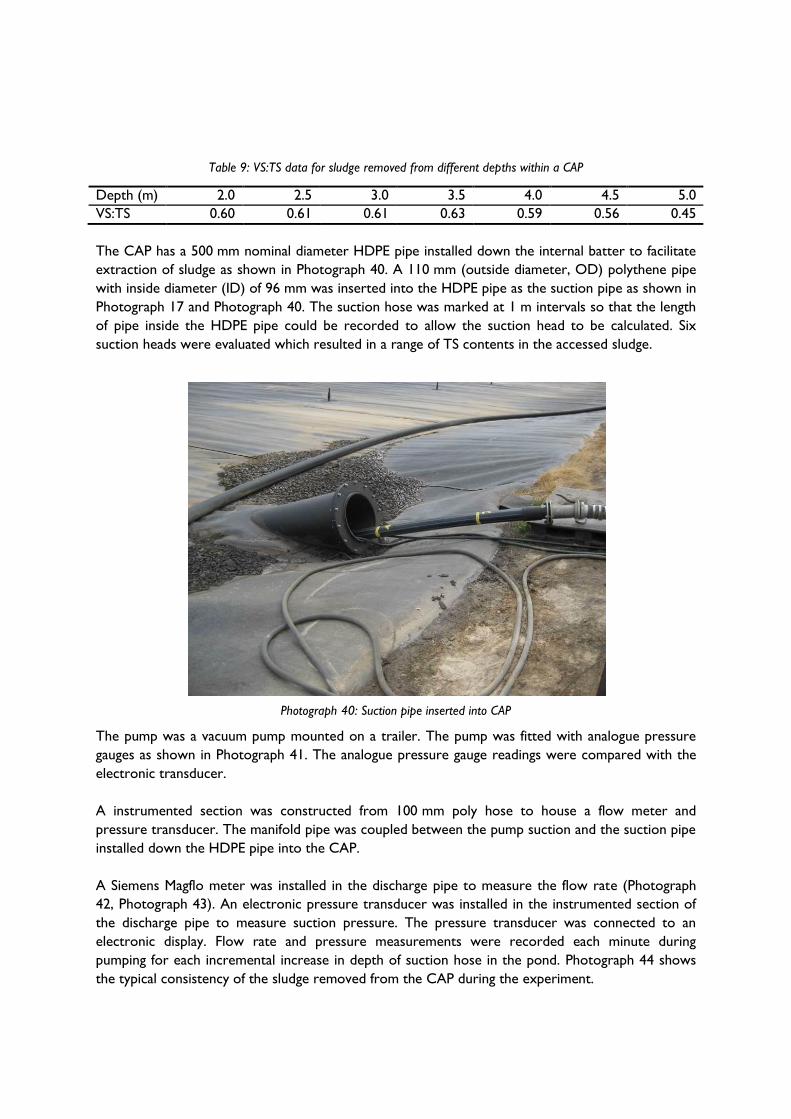
Table 9: VS:TS data for sludge removed from different depths within a CAP
Depth (m) 2.0 2.5 3.0 3.5 4.0 4.5 5.0
VS:TS 0.60 0.61 0.61 0.63 0.59 0.56 0.45
The CAP has a 500 mm nominal diameter HDPE pipe installed down the internal batter to facilitate
extraction of sludge as shown in Photograph 40. A 110 mm (outside diameter, OD) polythene pipe
with inside diameter (ID) of 96 mm was inserted into the HDPE pipe as the suction pipe as shown in
Photograph 17 and Photograph 40. The suction hose was marked at 1 m intervals so that the length
of pipe inside the HDPE pipe could be recorded to allow the suction head to be calculated. Six
suction heads were evaluated which resulted in a range of TS contents in the accessed sludge.
Photograph 40: Suction pipe inserted into CAP
The pump was a vacuum pump mounted on a trailer. The pump was fitted with analogue pressure
gauges as shown in Photograph 41. The analogue pressure gauge readings were compared with the
electronic transducer.
A instrumented section was constructed from 100 mm poly hose to house a flow meter and
pressure transducer. The manifold pipe was coupled between the pump suction and the suction pipe
installed down the HDPE pipe into the CAP.
A Siemens Magflo meter was installed in the discharge pipe to measure the flow rate (Photograph
42, Photograph 43). An electronic pressure transducer was installed in the instrumented section of
the discharge pipe to measure suction pressure. The pressure transducer was connected to an
electronic display. Flow rate and pressure measurements were recorded each minute during
pumping for each incremental increase in depth of suction hose in the pond. Photograph 44 shows
the typical consistency of the sludge removed from the CAP during the experiment.
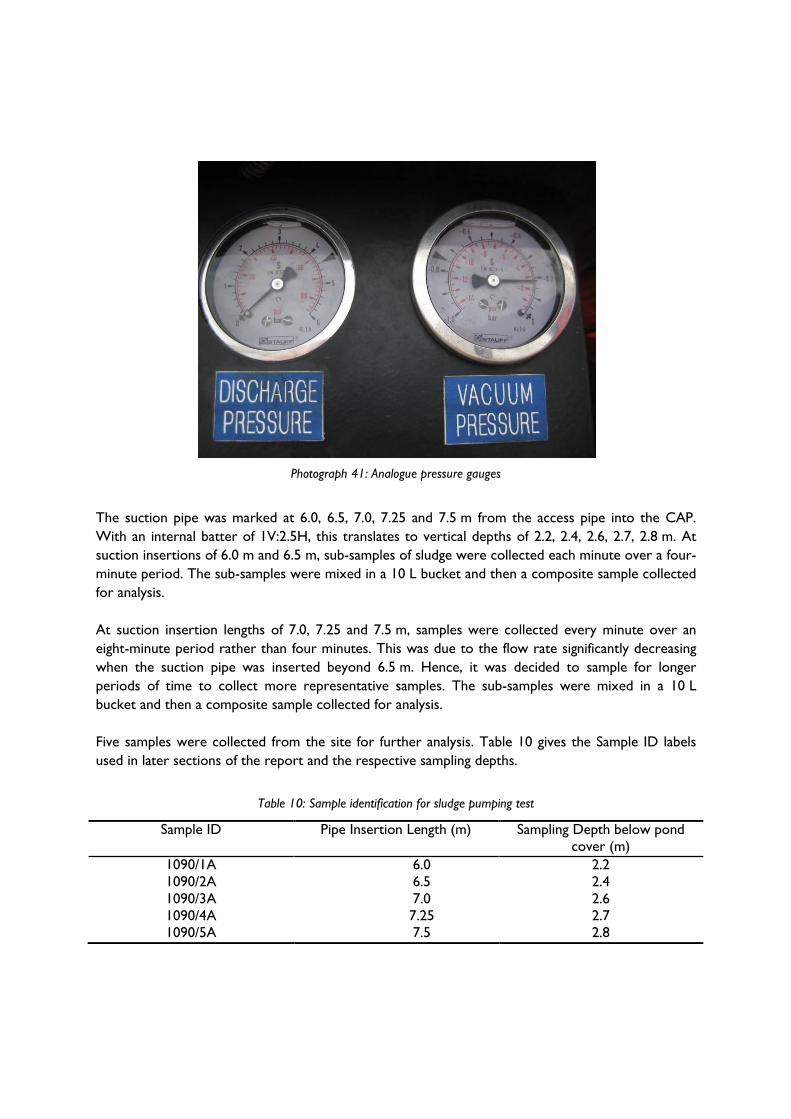
Photograph 41: Analogue pressure gauges
The suction pipe was marked at 6.0, 6.5, 7.0, 7.25 and 7.5 m from the access pipe into the CAP.
With an internal batter of 1V:2.5H, this translates to vertical depths of 2.2, 2.4, 2.6, 2.7, 2.8 m. At
suction insertions of 6.0 m and 6.5 m, sub-samples of sludge were collected each minute over a four-
minute period. The sub-samples were mixed in a 10 L bucket and then a composite sample collected
for analysis.
At suction insertion lengths of 7.0, 7.25 and 7.5 m, samples were collected every minute over an
eight-minute period rather than four minutes. This was due to the flow rate significantly decreasing
when the suction pipe was inserted beyond 6.5 m. Hence, it was decided to sample for longer
periods of time to collect more representative samples. The sub-samples were mixed in a 10 L
bucket and then a composite sample collected for analysis.
Five samples were collected from the site for further analysis. Table 10 gives the Sample ID labels
used in later sections of the report and the respective sampling depths.
Table 10: Sample identification for sludge pumping test
Sample ID Pipe Insertion Length (m) Sampling Depth below pond
cover (m)
1090/1A 6.0 2.2
1090/2A 6.5 2.4
1090/3A 7.0 2.6
1090/4A 7.25 2.7
1090/5A 7.5 2.8
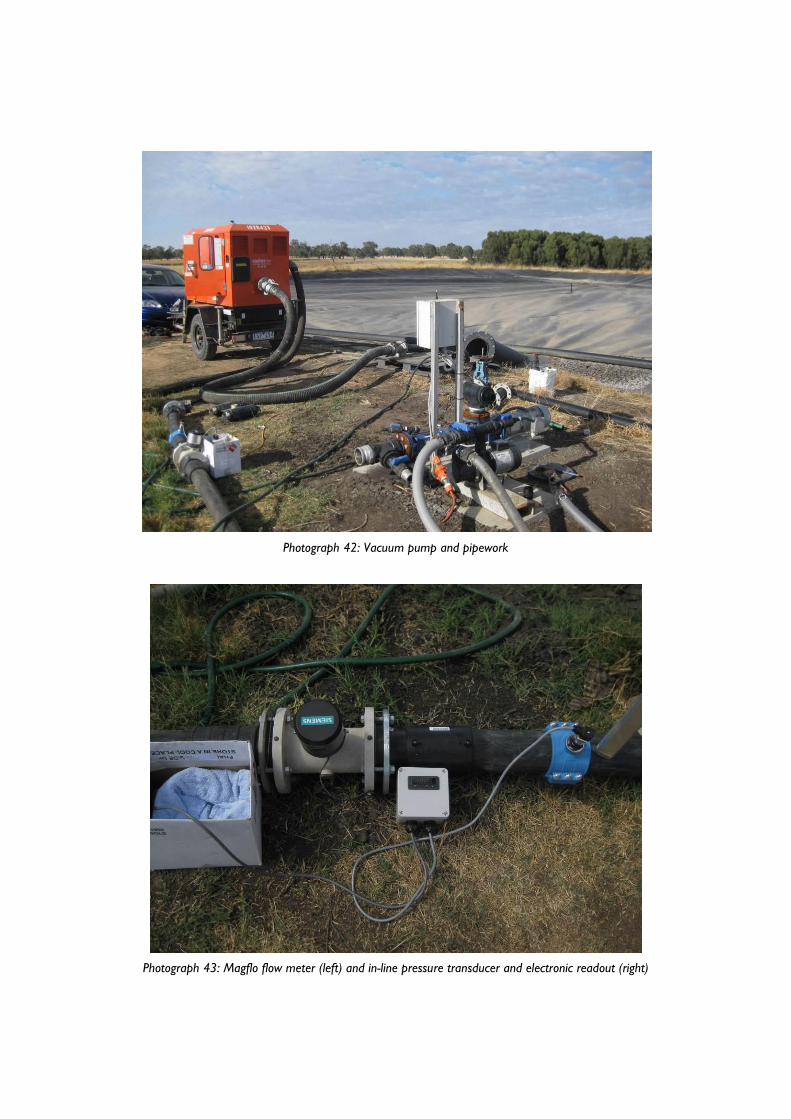
Photograph 42: Vacuum pump and pipework
Photograph 43: Magflo flow meter (left) and in-line pressure transducer and electronic readout (right)
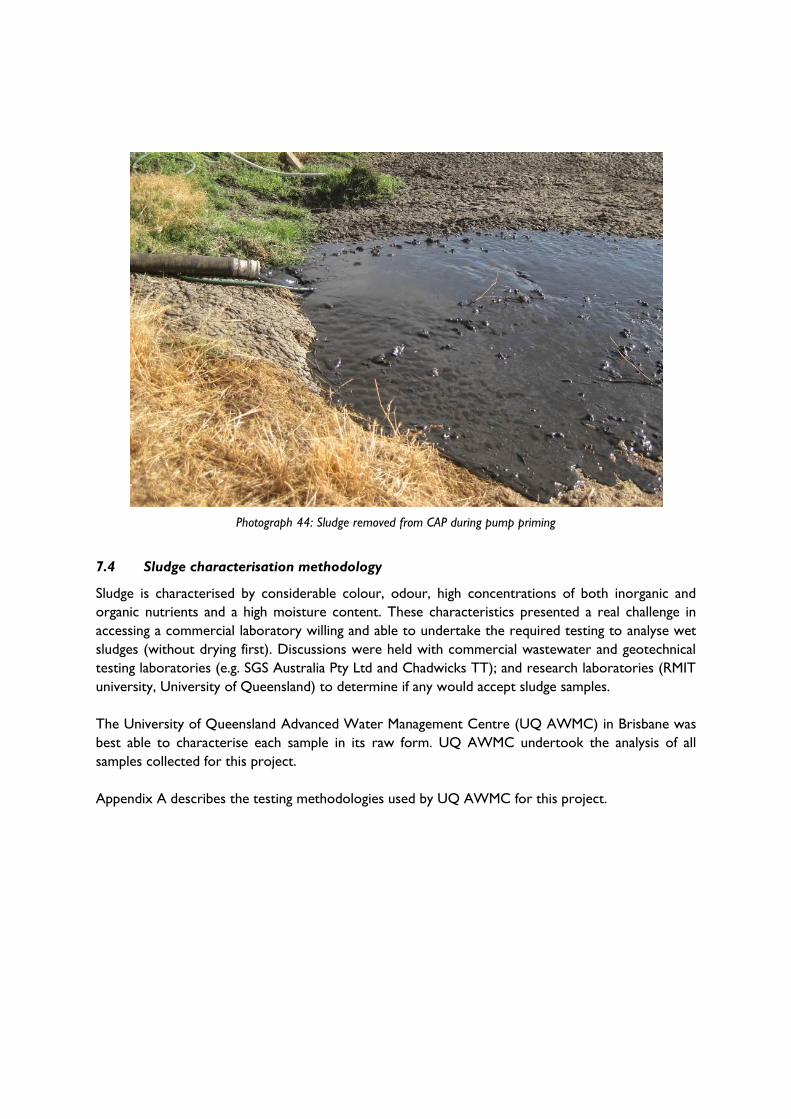
Photograph 44: Sludge removed from CAP during pump priming
7.4 Sludge characterisation methodology
Sludge is characterised by considerable colour, odour, high concentrations of both inorganic and
organic nutrients and a high moisture content. These characteristics presented a real challenge in
accessing a commercial laboratory willing and able to undertake the required testing to analyse wet
sludges (without drying first). Discussions were held with commercial wastewater and geotechnical
testing laboratories (e.g. SGS Australia Pty Ltd and Chadwicks TT); and research laboratories (RMIT
university, University of Queensland) to determine if any would accept sludge samples.
The University of Queensland Advanced Water Management Centre (UQ AWMC) in Brisbane was
best able to characterise each sample in its raw form. UQ AWMC undertook the analysis of all
samples collected for this project.
Appendix A describes the testing methodologies used by UQ AWMC for this project.
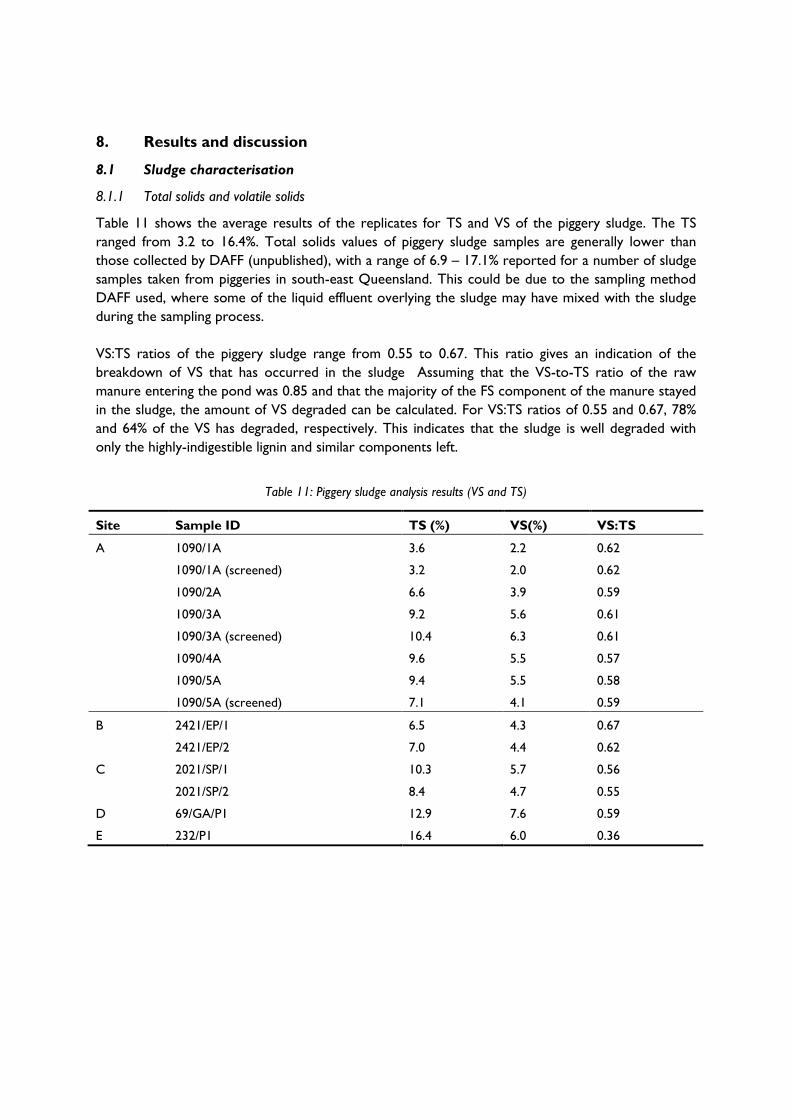
8. Results and discussion
8.1 Sludge characterisation
8.1.1 Total solids and volatile solids
Table 11 shows the average results of the replicates for TS and VS of the piggery sludge. The TS
ranged from 3.2 to 16.4%. Total solids values of piggery sludge samples are generally lower than
those collected by DAFF (unpublished), with a range of 6.9 – 17.1% reported for a number of sludge
samples taken from piggeries in south-east Queensland. This could be due to the sampling method
DAFF used, where some of the liquid effluent overlying the sludge may have mixed with the sludge
during the sampling process.
VS:TS ratios of the piggery sludge range from 0.55 to 0.67. This ratio gives an indication of the
breakdown of VS that has occurred in the sludge Assuming that the VS-to-TS ratio of the raw
manure entering the pond was 0.85 and that the majority of the FS component of the manure stayed
in the sludge, the amount of VS degraded can be calculated. For VS:TS ratios of 0.55 and 0.67, 78%
and 64% of the VS has degraded, respectively. This indicates that the sludge is well degraded with
only the highly-indigestible lignin and similar components left.
Table 11: Piggery sludge analysis results (VS and TS)
Site Sample ID TS (%) VS(%) VS:TS
A 1090/1A 3.6 2.2 0.62
1090/1A (screened) 3.2 2.0 0.62
1090/2A 6.6 3.9 0.59
1090/3A 9.2 5.6 0.61
1090/3A (screened) 10.4 6.3 0.61
1090/4A 9.6 5.5 0.57
1090/5A 9.4 5.5 0.58
1090/5A (screened) 7.1 4.1 0.59
B 2421/EP/1 6.5 4.3 0.67
2421/EP/2 7.0 4.4 0.62
C 2021/SP/1 10.3 5.7 0.56
2021/SP/2 8.4 4.7 0.55
D 69/GA/P1 12.9 7.6 0.59
E 232/P1 16.4 6.0 0.36
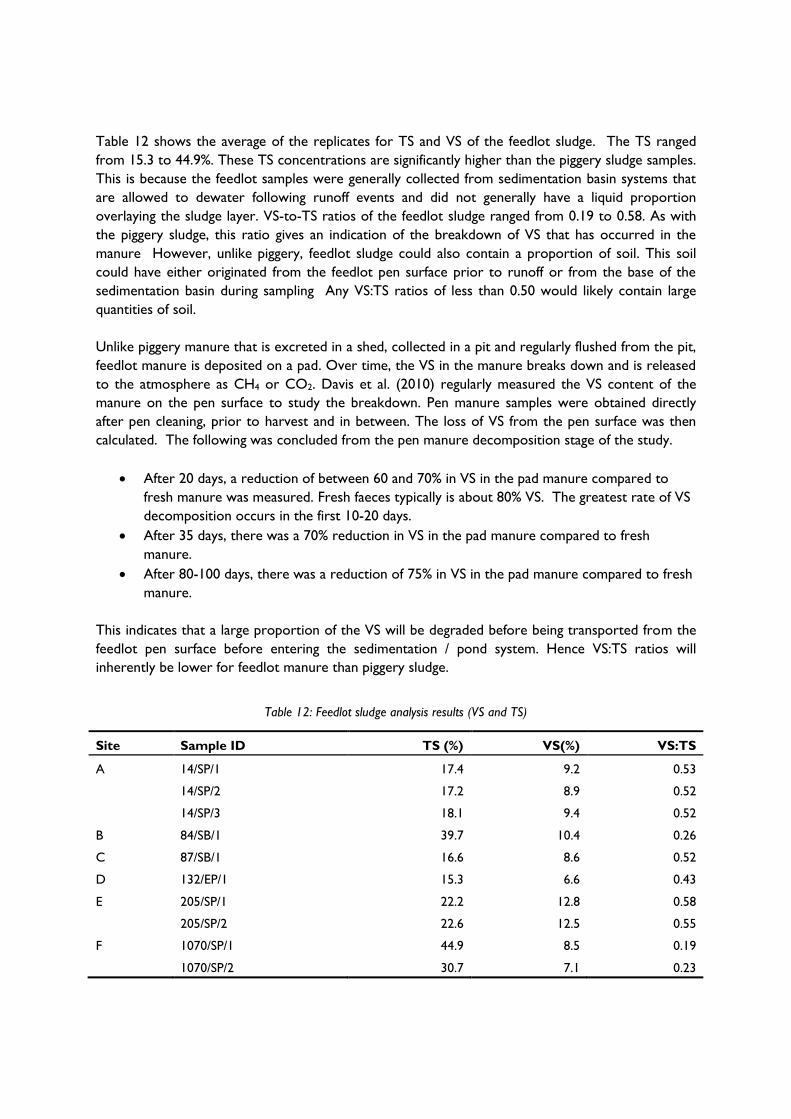
Table 12 shows the average of the replicates for TS and VS of the feedlot sludge. The TS ranged
from 15.3 to 44.9%. These TS concentrations are significantly higher than the piggery sludge samples.
This is because the feedlot samples were generally collected from sedimentation basin systems that
are allowed to dewater following runoff events and did not generally have a liquid proportion
overlaying the sludge layer. VS-to-TS ratios of the feedlot sludge ranged from 0.19 to 0.58. As with
the piggery sludge, this ratio gives an indication of the breakdown of VS that has occurred in the
manure However, unlike piggery, feedlot sludge could also contain a proportion of soil. This soil
could have either originated from the feedlot pen surface prior to runoff or from the base of the
sedimentation basin during sampling Any VS:TS ratios of less than 0.50 would likely contain large
quantities of soil.
Unlike piggery manure that is excreted in a shed, collected in a pit and regularly flushed from the pit,
feedlot manure is deposited on a pad. Over time, the VS in the manure breaks down and is released
to the atmosphere as CH4 or CO2. Davis et al. (2010) regularly measured the VS content of the
manure on the pen surface to study the breakdown. Pen manure samples were obtained directly
after pen cleaning, prior to harvest and in between. The loss of VS from the pen surface was then
calculated. The following was concluded from the pen manure decomposition stage of the study.
After 20 days, a reduction of between 60 and 70% in VS in the pad manure compared to
fresh manure was measured. Fresh faeces typically is about 80% VS. The greatest rate of VS
decomposition occurs in the first 10-20 days.
After 35 days, there was a 70% reduction in VS in the pad manure compared to fresh
manure.
After 80-100 days, there was a reduction of 75% in VS in the pad manure compared to fresh
manure.
This indicates that a large proportion of the VS will be degraded before being transported from the
feedlot pen surface before entering the sedimentation / pond system. Hence VS:TS ratios will
inherently be lower for feedlot manure than piggery sludge.
Table 12: Feedlot sludge analysis results (VS and TS)
Site Sample ID TS (%) VS(%) VS:TS
A 14/SP/1 17.4 9.2 0.53
14/SP/2 17.2 8.9 0.52
14/SP/3 18.1 9.4 0.52
B 84/SB/1 39.7 10.4 0.26
C 87/SB/1 16.6 8.6 0.52
D 132/EP/1 15.3 6.6 0.43
E 205/SP/1 22.2 12.8 0.58
205/SP/2 22.6 12.5 0.55
F 1070/SP/1 44.9 8.5 0.19
1070/SP/2 30.7 7.1 0.23
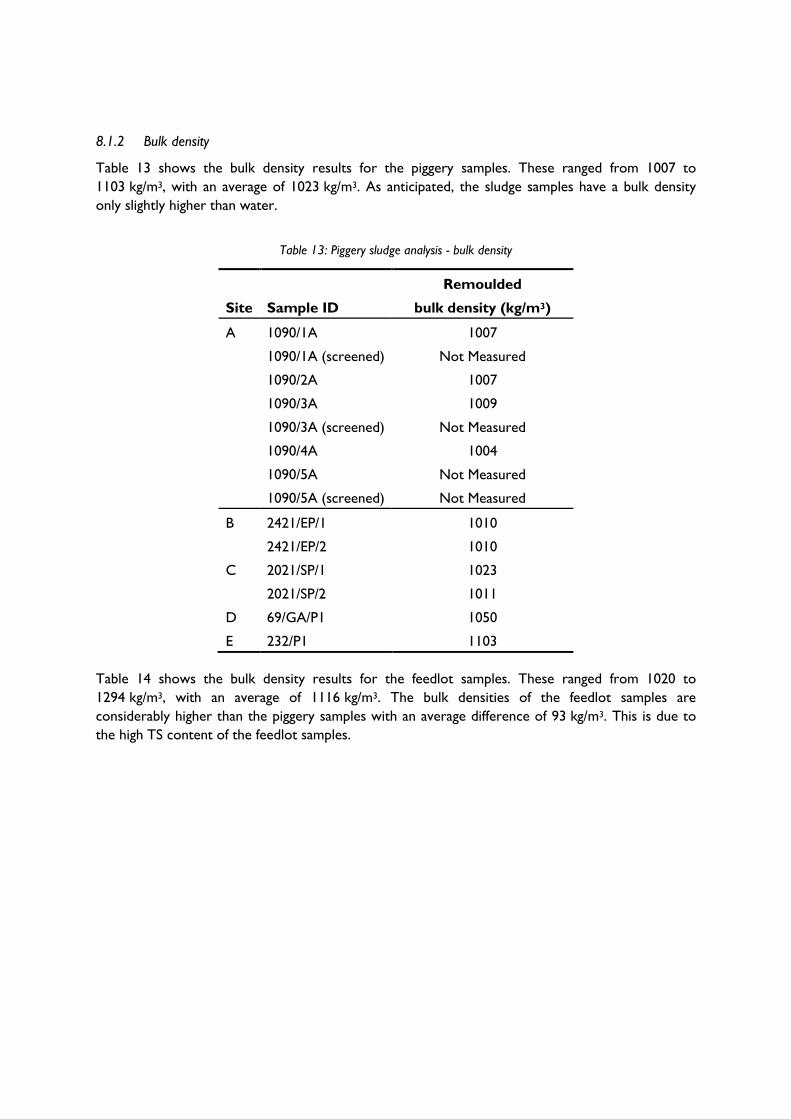
8.1.2 Bulk density
Table 13 shows the bulk density results for the piggery samples. These ranged from 1007 to
1103 kg/m3, with an average of 1023 kg/m3. As anticipated, the sludge samples have a bulk density
only slightly higher than water.
Table 13: Piggery sludge analysis - bulk density
Site Sample ID
Remoulded
bulk density (kg/m3)
A 1090/1A 1007
1090/1A (screened) Not Measured
1090/2A 1007
1090/3A 1009
1090/3A (screened) Not Measured
1090/4A 1004
1090/5A Not Measured
1090/5A (screened) Not Measured
B 2421/EP/1 1010
2421/EP/2 1010
C 2021/SP/1 1023
2021/SP/2 1011
D 69/GA/P1 1050
E 232/P1 1103
Table 14 shows the bulk density results for the feedlot samples. These ranged from 1020 to
1294 kg/m3, with an average of 1116 kg/m3. The bulk densities of the feedlot samples are
considerably higher than the piggery samples with an average difference of 93 kg/m3. This is due to
the high TS content of the feedlot samples.
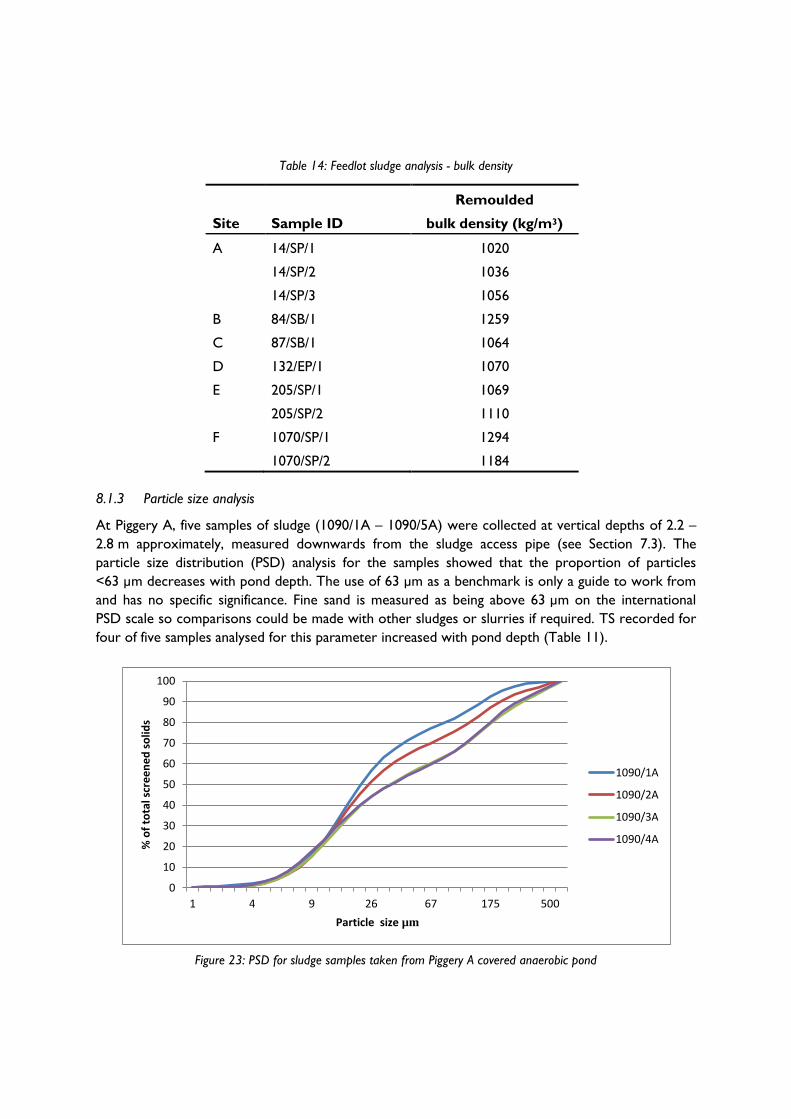
Table 14: Feedlot sludge analysis - bulk density
Site Sample ID
Remoulded
bulk density (kg/m3)
A 14/SP/1 1020
14/SP/2 1036
14/SP/3 1056
B 84/SB/1 1259
C 87/SB/1 1064
D 132/EP/1 1070
E 205/SP/1 1069
205/SP/2 1110
F 1070/SP/1 1294
1070/SP/2 1184
8.1.3 Particle size analysis
At Piggery A, five samples of sludge (1090/1A – 1090/5A) were collected at vertical depths of 2.2 –
2.8 m approximately, measured downwards from the sludge access pipe (see Section 7.3). The
particle size distribution (PSD) analysis for the samples showed that the proportion of particles
<63 µm decreases with pond depth. The use of 63 µm as a benchmark is only a guide to work from
and has no specific significance. Fine sand is measured as being above 63 µm on the international
PSD scale so comparisons could be made with other sludges or slurries if required. TS recorded for
four of five samples analysed for this parameter increased with pond depth (Table 11).
Figure 23: PSD for sludge samples taken from Piggery A covered anaerobic pond
0
10
20
30
40
50
60
70
80
90
100
1 4 9 26 67 175 500
% o
f to
tal s
cre
en
ed
so
lids
Particle size µm
1090/1A
1090/2A
1090/3A
1090/4A
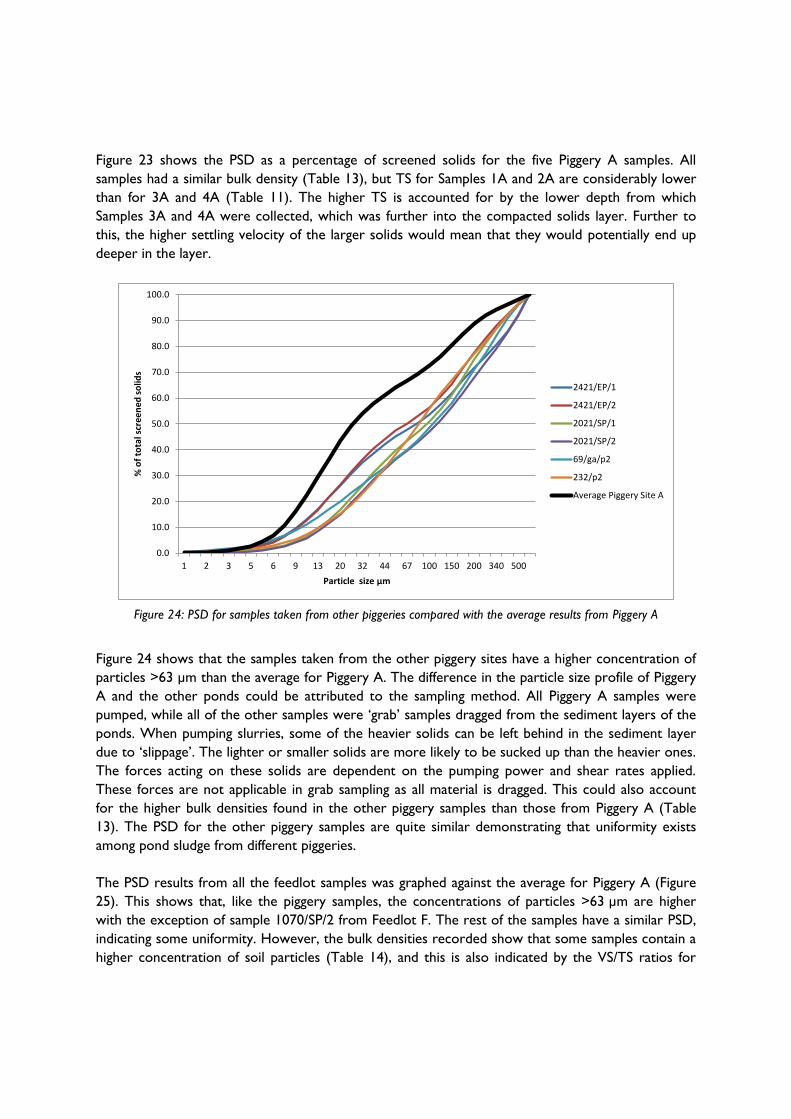
Figure 23 shows the PSD as a percentage of screened solids for the five Piggery A samples. All
samples had a similar bulk density (Table 13), but TS for Samples 1A and 2A are considerably lower
than for 3A and 4A (Table 11). The higher TS is accounted for by the lower depth from which
Samples 3A and 4A were collected, which was further into the compacted solids layer. Further to
this, the higher settling velocity of the larger solids would mean that they would potentially end up
deeper in the layer.
Figure 24: PSD for samples taken from other piggeries compared with the average results from Piggery A
Figure 24 shows that the samples taken from the other piggery sites have a higher concentration of
particles >63 µm than the average for Piggery A. The difference in the particle size profile of Piggery
A and the other ponds could be attributed to the sampling method. All Piggery A samples were
pumped, while all of the other samples were ‘grab’ samples dragged from the sediment layers of the
ponds. When pumping slurries, some of the heavier solids can be left behind in the sediment layer
due to ‘slippage’. The lighter or smaller solids are more likely to be sucked up than the heavier ones.
The forces acting on these solids are dependent on the pumping power and shear rates applied.
These forces are not applicable in grab sampling as all material is dragged. This could also account
for the higher bulk densities found in the other piggery samples than those from Piggery A (Table
13). The PSD for the other piggery samples are quite similar demonstrating that uniformity exists
among pond sludge from different piggeries.
The PSD results from all the feedlot samples was graphed against the average for Piggery A (Figure
25). This shows that, like the piggery samples, the concentrations of particles >63 µm are higher
with the exception of sample 1070/SP/2 from Feedlot F. The rest of the samples have a similar PSD,
indicating some uniformity. However, the bulk densities recorded show that some samples contain a
higher concentration of soil particles (Table 14), and this is also indicated by the VS/TS ratios for
0.0
10.0
20.0
30.0
40.0
50.0
60.0
70.0
80.0
90.0
100.0
1 2 3 5 6 9 13 20 32 44 67 100 150 200 340 500
% o
f to
tal s
cre
en
ed
so
lids
Particle size µm
2421/EP/1
2421/EP/2
2021/SP/1
2021/SP/2
69/ga/p2
232/p2
Average Piggery Site A
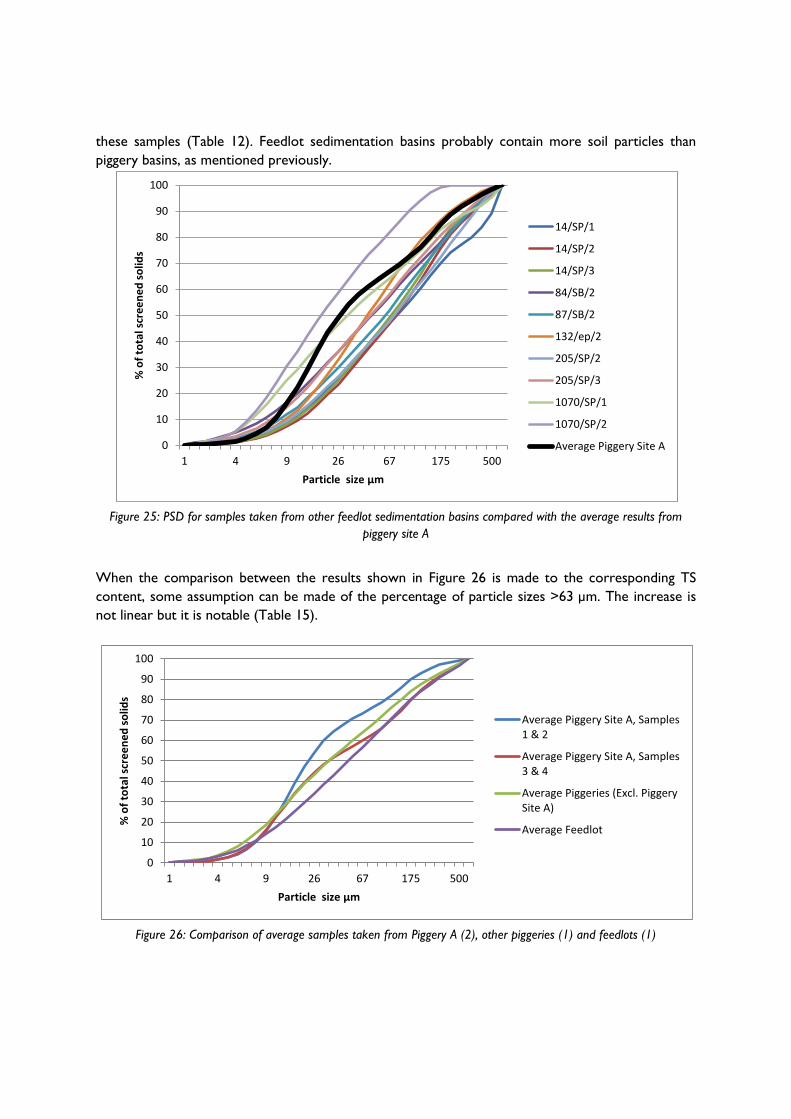
these samples (Table 12). Feedlot sedimentation basins probably contain more soil particles than
piggery basins, as mentioned previously.
Figure 25: PSD for samples taken from other feedlot sedimentation basins compared with the average results from
piggery site A
When the comparison between the results shown in Figure 26 is made to the corresponding TS
content, some assumption can be made of the percentage of particle sizes >63 µm. The increase is
not linear but it is notable (Table 15).
Figure 26: Comparison of average samples taken from Piggery A (2), other piggeries (1) and feedlots (1)
0
10
20
30
40
50
60
70
80
90
100
1 4 9 26 67 175 500
% o
f to
tal s
cre
en
ed
so
lids
Particle size µm
14/SP/1
14/SP/2
14/SP/3
84/SB/2
87/SB/2
132/ep/2
205/SP/2
205/SP/3
1070/SP/1
1070/SP/2
Average Piggery Site A
0
10
20
30
40
50
60
70
80
90
100
1 4 9 26 67 175 500
% o
f to
tal s
cre
en
ed
so
lids
Particle size µm
Average Piggery Site A, Samples1 & 2
Average Piggery Site A, Samples3 & 4
Average Piggeries (Excl. PiggerySite A)
Average Feedlot
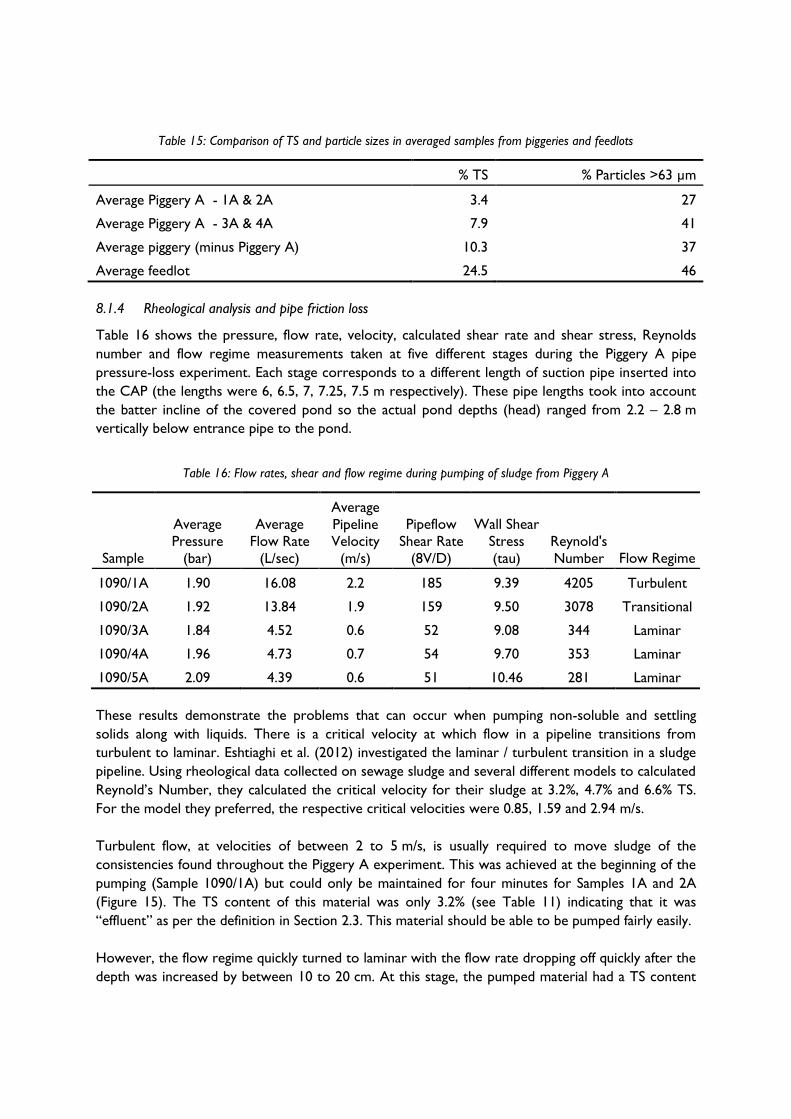
Table 15: Comparison of TS and particle sizes in averaged samples from piggeries and feedlots
% TS % Particles >63 µm
Average Piggery A - 1A & 2A 3.4 27
Average Piggery A - 3A & 4A 7.9 41
Average piggery (minus Piggery A) 10.3 37
Average feedlot 24.5 46
8.1.4 Rheological analysis and pipe friction loss
Table 16 shows the pressure, flow rate, velocity, calculated shear rate and shear stress, Reynolds
number and flow regime measurements taken at five different stages during the Piggery A pipe
pressure-loss experiment. Each stage corresponds to a different length of suction pipe inserted into
the CAP (the lengths were 6, 6.5, 7, 7.25, 7.5 m respectively). These pipe lengths took into account
the batter incline of the covered pond so the actual pond depths (head) ranged from 2.2 – 2.8 m
vertically below entrance pipe to the pond.
Table 16: Flow rates, shear and flow regime during pumping of sludge from Piggery A
Sample
Average
Pressure
(bar)
Average
Flow Rate
(L/sec)
Average
Pipeline
Velocity
(m/s)
Pipeflow
Shear Rate
(8V/D)
Wall Shear
Stress
(tau)
Reynold's
Number Flow Regime
1090/1A 1.90 16.08 2.2 185 9.39 4205 Turbulent
1090/2A 1.92 13.84 1.9 159 9.50 3078 Transitional
1090/3A 1.84 4.52 0.6 52 9.08 344 Laminar
1090/4A 1.96 4.73 0.7 54 9.70 353 Laminar
1090/5A 2.09 4.39 0.6 51 10.46 281 Laminar
These results demonstrate the problems that can occur when pumping non-soluble and settling
solids along with liquids. There is a critical velocity at which flow in a pipeline transitions from
turbulent to laminar. Eshtiaghi et al. (2012) investigated the laminar / turbulent transition in a sludge
pipeline. Using rheological data collected on sewage sludge and several different models to calculated
Reynold’s Number, they calculated the critical velocity for their sludge at 3.2%, 4.7% and 6.6% TS.
For the model they preferred, the respective critical velocities were 0.85, 1.59 and 2.94 m/s.
Turbulent flow, at velocities of between 2 to 5 m/s, is usually required to move sludge of the
consistencies found throughout the Piggery A experiment. This was achieved at the beginning of the
pumping (Sample 1090/1A) but could only be maintained for four minutes for Samples 1A and 2A
(Figure 15). The TS content of this material was only 3.2% (see Table 11) indicating that it was
“effluent” as per the definition in Section 2.3. This material should be able to be pumped fairly easily.
However, the flow regime quickly turned to laminar with the flow rate dropping off quickly after the
depth was increased by between 10 to 20 cm. At this stage, the pumped material had a TS content
of about 7-10% (see Table 11) indicating that it would be difficult to pump. Figure 15 shows that the
flow of sludge continued for eight minutes but at a risk of solids settling in the pipe due to the very
low velocities achieved. Interestingly, the VS:TS ratio for the first samples was 0.62 (see Table 11)
while the average VS:TS ratio of the deeper sludge was 0.59, which is only marginally more
degraded. This would suggest that the sludge was reasonably well digested for all sludge that was
pumped. However, the deeper material had settled more resulting in a higher TS content. These
data are consistent with the findings of Birchall (2010) at the same site.
Figure 27: Flow rate and number of minutes of flow during pumping and sampling at Piggery A
The experiment concluded at an insertion length of 7.25 m because the pump was reaching its
potential (the flow rates started to plateau) and the consistency of the samples started to look very
similar. It appeared that more supernatant was being drawn from above the sludge profile (rabbit-
holing), thus reducing the TS content. It is possible that there was settling of solids within the pipe,
causing a blockage, and this reduced the concentration of solids in the final sample.
8.1.5 Viscosity and shear stress
Figure 28 shows the viscosity of three of the five samples taken from Piggery A, calculated using
Stokes’ Law of frictional drag of particles in water. The sample with the lowest TS, 1090/1A, also had
the lowest viscosity while the sample with the highest TS, 1090/3AT, had the greatest viscosity.
Figure 28 also demonstrates, as expected, that viscosity is lower at 25C than at 15C. A higher
sludge viscosity would require more pumping power so the timing and TS content are important.
The viscosity of all three samples declined when the shear rate increased. Pumps operate with a
constant shear rate but in non-Newtonian fluids, the shear rate is variable and this creates problems
when the rate fluctuates. Variable viscosities caused by temperature and TS content can cause the
pumped material to move from one flow regime to another. This was demonstrated during the trial
when the flow regime moved from turbulent to laminar with a very small change in depth but a big
increase in TS.
0
2
4
6
8
10
12
14
16
18
0 1 2 3 4 5 6 7 8
Flo
w R
ate
L/s
ec
No. of Minutes
1090/1A
1090/2A
1090/3A
1090/4A
1090/5A
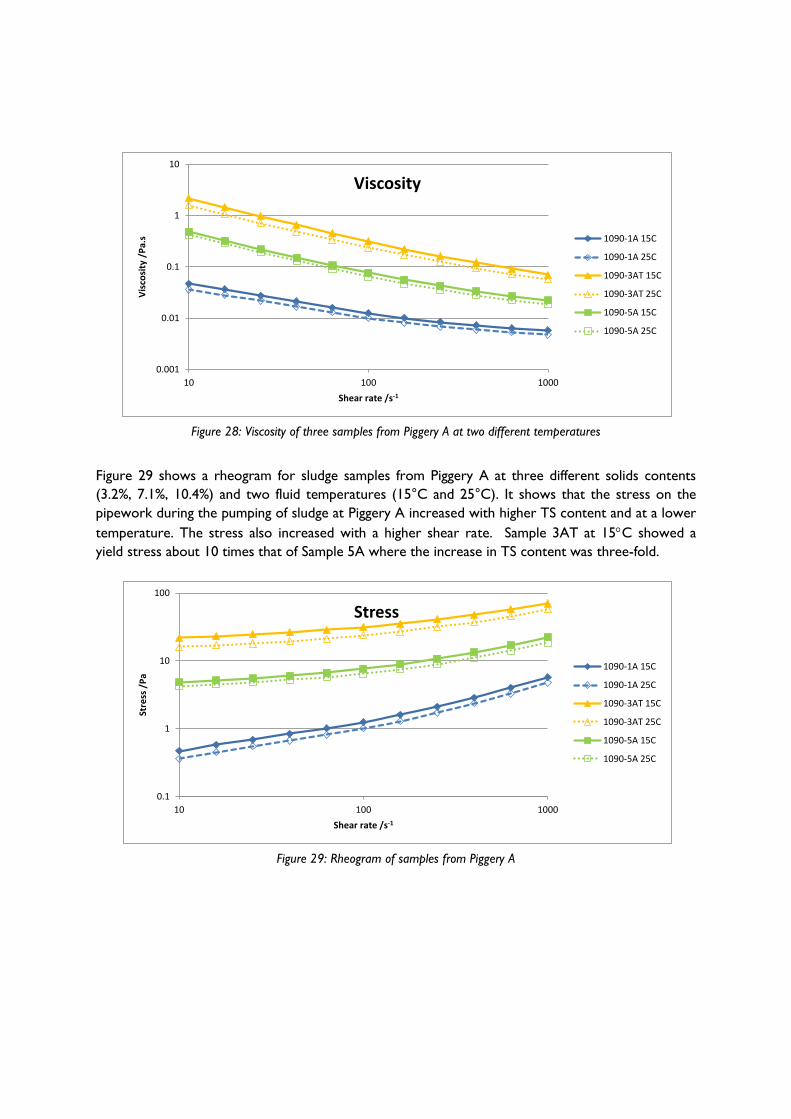
Figure 28: Viscosity of three samples from Piggery A at two different temperatures
Figure 29 shows a rheogram for sludge samples from Piggery A at three different solids contents
(3.2%, 7.1%, 10.4%) and two fluid temperatures (15°C and 25°C). It shows that the stress on the
pipework during the pumping of sludge at Piggery A increased with higher TS content and at a lower
temperature. The stress also increased with a higher shear rate. Sample 3AT at 15C showed a
yield stress about 10 times that of Sample 5A where the increase in TS content was three-fold.
Figure 29: Rheogram of samples from Piggery A
0.001
0.01
0.1
1
10
10 100 1000
Vis
cosi
ty /
Pa.
s
Shear rate /s-1
Viscosity
1090-1A 15C
1090-1A 25C
1090-3AT 15C
1090-3AT 25C
1090-5A 15C
1090-5A 25C
0.1
1
10
100
10 100 1000
Stre
ss /
Pa
Shear rate /s-1
Stress
1090-1A 15C
1090-1A 25C
1090-3AT 15C
1090-3AT 25C
1090-5A 15C
1090-5A 25C
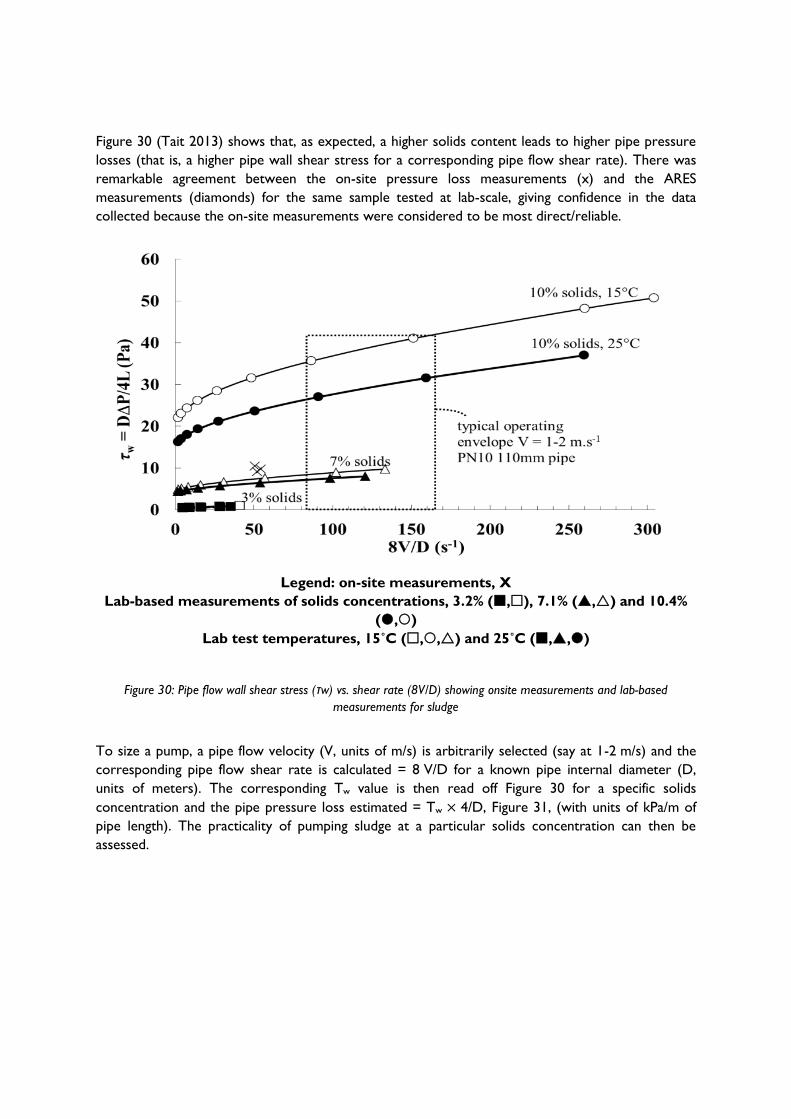
Figure 30 (Tait 2013) shows that, as expected, a higher solids content leads to higher pipe pressure
losses (that is, a higher pipe wall shear stress for a corresponding pipe flow shear rate). There was
remarkable agreement between the on-site pressure loss measurements (x) and the ARES
measurements (diamonds) for the same sample tested at lab-scale, giving confidence in the data
collected because the on-site measurements were considered to be most direct/reliable.
Legend: on-site measurements, X
Lab-based measurements of solids concentrations, 3.2% (,), 7.1% (,) and 10.4%
(,)
Lab test temperatures, 15˚C (,,) and 25˚C (,,)
Figure 30: Pipe flow wall shear stress (τw) vs. shear rate (8V/D) showing onsite measurements and lab-based
measurements for sludge
To size a pump, a pipe flow velocity (V, units of m/s) is arbitrarily selected (say at 1-2 m/s) and the
corresponding pipe flow shear rate is calculated = 8 V/D for a known pipe internal diameter (D,
units of meters). The corresponding Tw value is then read off Figure 30 for a specific solids
concentration and the pipe pressure loss estimated = Tw 4/D, Figure 31, (with units of kPa/m of
pipe length). The practicality of pumping sludge at a particular solids concentration can then be
assessed.
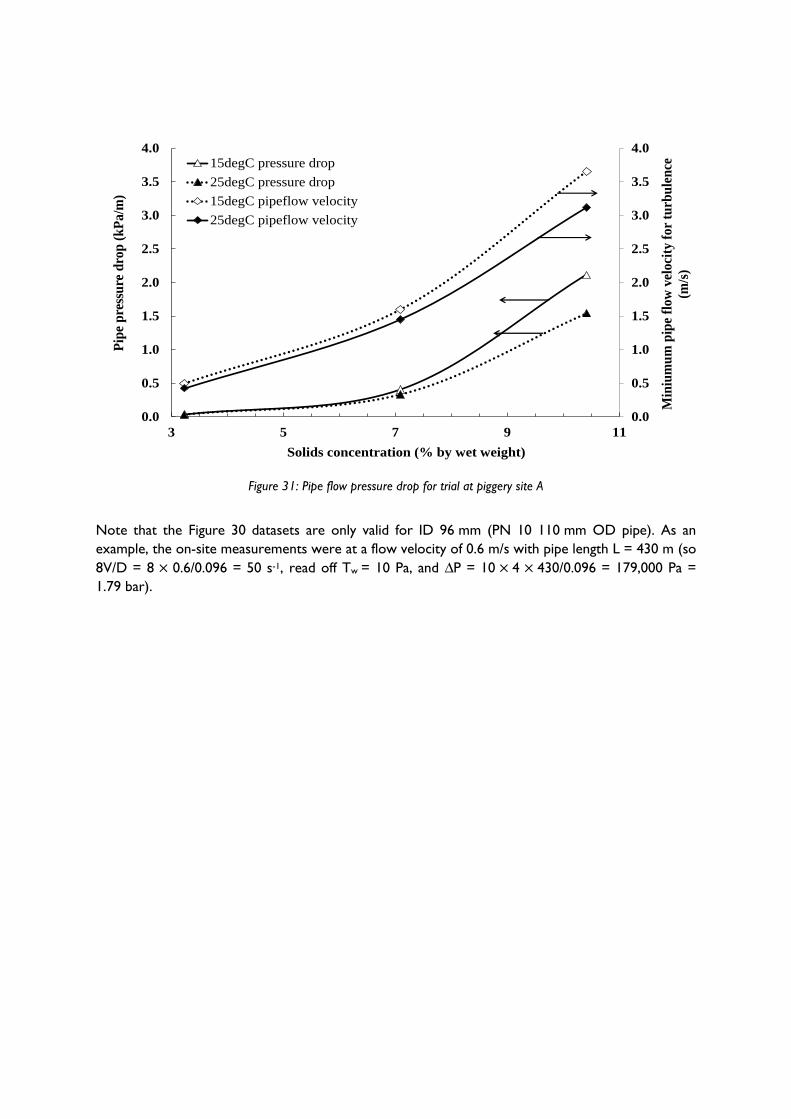
Figure 31: Pipe flow pressure drop for trial at piggery site A
Note that the Figure 30 datasets are only valid for ID 96 mm (PN 10 110 mm OD pipe). As an
example, the on-site measurements were at a flow velocity of 0.6 m/s with pipe length L = 430 m (so
8V/D = 8 0.6/0.096 = 50 s-1, read off Tw = 10 Pa, and ∆P = 10 4 430/0.096 = 179,000 Pa =
1.79 bar).
0.0
0.5
1.0
1.5
2.0
2.5
3.0
3.5
4.0
0.0
0.5
1.0
1.5
2.0
2.5
3.0
3.5
4.0
3 5 7 9 11
Min
ium
um
pip
e fl
ow
vel
oci
ty f
or
turb
ule
nce
(m/s
)
Pip
e p
ress
ure
dro
p (
kP
a/m
)
Solids concentration (% by wet weight)
15degC pressure drop
25degC pressure drop
15degC pipeflow velocity
25degC pipeflow velocity
9. Conclusions and recommendations
Sludge accumulates in various waste management ponds at piggeries and cattle feedlots. Eventually,
this sludge needs to be removed and handled. Many existing piggery ponds are reaching the point
where sludge removal is becoming a pressing issue. Another issue has arisen recently with the use of
covered treatment ponds to generate biogas. Sludge removal from covered ponds presents special
difficulties.
Sludge is a mixture of water and solid materials (total solids (TS)). The TS component can be
inorganic material (any materials such as debris, sand or rocks plus the ash component of organic
wastes), slowly digestible organic material or dead microbial cell mass. The ratio of water to solids
(TS content) can vary considerably. As the TS content increases, the sludge’s characteristics and
handling requirements change. The particle size and particle size distribution (PSD) can vary from
very fine colloidal material to larger particles. Some particles can be cohesive (i.e. they tend to stick
together) while other particles such as sand are non-cohesive. Rheology is the study of the flow of
matter. This is an important feature in the design of sludge removal systems.
The term – sludge – is widely used for a range of materials. However, the handling and management
options for “sludge” is heavily dependent on the TS content of the material. In this report, the
following terms have been defined.
1. Effluent. This is material with a TS content of <5%.Effluent is a material that can be pumped
and behaves like other Newtonian fluids, e.g. water.
2. Slurry. This is material with a TS content of 5-15%. These materials are “thick” but can flow.
They behave in a non-Newtonian manner and require specialised pumping equipment.
3. Sludge. This is material with a TS content >15%. Essentially, this material is too thick to
pump and must be handled with bulk mechanical methods.
The actual properties of sludges derived from different sources vary, even at the same TS content.
Hence, the TS contents stated above are a general guideline for use in this report rather than a fixed
rule. Care needs to be taken when reviewing other work as the definition of sludge used in the
literature is highly variable.
The physical characteristics of the sludge or slurry is importantly in determining the appropriate
pumping and handling methods. Particle size distribution (PSD) and bulk density are important but
the rheological properties have the greatest influence. Several studies have been conducted into the
rheological properties of raw and digested manure in sludge or slurry forms. Most researchers find
that viscosity (i.e. resistance to pumping) increases with increasing total solids content and decreases
with temperature. Effluent with a TS content <2% can be pumped with centrifugal pumps. Slurries
with a TS content of about 5-10% TS can be pumped with various types of positive displacement
pumps. Sludge with a TS content greater than 15% is virtually impossible to pump.
When desludging ponds, there are three techniques depending on the operation and structure of
pond, sludge physical characteristics and the frequency of desludging. Desludging can be broadly
categorised into three groups:
desludging dewatered ponds (after effluent removal)
desludging an uncovered pond containing effluent
desludging a covered pond.
Due to the high cost of desludging, for ponds with very old or thick sludge, it is often cheaper to
remove the water layer first (i.e. dewater the pond) and then excavate the sludge with conventional
earthmoving equipment such as an excavator and dump trucks.
However, it is usually more desirable to remove sludge from a pond without dewatering as this
maintains the function of the pond. There are three basic methods of sludge removal from an
operating, uncovered pond. They are:
1. Pumping. This uses a pump or vacuum tanker located on the bank of the pond. It may or
may not include agitation of the sludge in the base of the pond.
2. Dredging. This involves the use of a system where the pump is within the pond and is mobile
so that all sections of the pond can be accessed.
3. Mechanical Removal. This involves the use of a long-reach excavator or similar to remove
the sludge without pumping.
Sludge removal from covered anaerobic ponds presents specific difficulties as the cover cannot be
removed during the operational phase. There are essentially three methods of sludge removal from
CAPs. They are:
1. In-situ desludging. In this approach, the solids settle to the base of the CAP and are removed
by pumping via a pre-installed pipeline.
2. Suspension removal. In this approach, the solids are not allowed to settle. They are kept in
suspension using agitators inside the CAP. The solids are removed as part of the effluent
flow out of the CAP.
3. Life-time accumulation. In this approach, solids are allowed to settle but are not removed
until the operational life of the pond cover is reached and the cover is removed. In this
approach, a large sludge-accumulation volume is needed to be designed as part of the
internal volume of the CAP.
Depending on the final utilisation method for the sludge or slurry, it may be desirable to dewater the
removed sludge or slurry. This is particularly applicable if the final utilisation site is some distance
from the source. There are several methods of dewatering (solid separation) for sludge and slurries.
However, most of the available options are not suitable for dewatering sludge and slurries because:
Removal efficiency is not sufficiently high to achieve a “dry” sludge.
Capital, operating and maintenance costs are high.
Capacity is too low for a large volume of sludge removed in a short period.
High technical skills are required.
In reality, most sludge and slurries removed from ponds is dewatered using free drainage and/or
evaporation in bays or tubes. The choice of dewatering method is site-specific. The methods include:
1. Long-term bulk storage.
2. Short-term drying bays.
3. Sedimentation and Evaporation Pond Systems (SEPS).
4. Geotextile tubes.
Samples of pond sludge were taken and analysed at several piggery and feedlot sites across Australia.
The sludge was accumulated from different sources, had different ages and consequently had
different rheological properties. Additionally, a sludge pumping test was undertaken measuring the
pipe friction losses for the digested sludge in a covered anaerobic pond at different total solids
contents.
The TS contents ranged from 3 to 16% TS. Bulk density ranged from 1020 to 1294 kg/m3 indicating
that the majority of the sample was water. Particle size distribution varied due to a range of source
and age issues. In the pipe friction loss experiment, sludge with a TS content of about 3% had a low
friction loss and could be easily pumped. However, as the TS content increased to 10%, the friction
loss increased rapidly and the material was very difficult to pump. The VS:TS ratio of all sludge in this
experiment was about 0.6 indicating that the material was well digested. This experiment would
suggest that frequent removal of recently settled sludge (<3%TS) from the covered pond would be
preferred over infrequent removal of densely settled sludge (>10%TS).
Further work is required in understanding the optimal sludge removal frequency from covered
anaerobic ponds coupled with the correct design of the sludge removal pipeline system and correct
selection of pump type.
10. References
Abis, K & Mara, D 2005, 'Research on waste stabilization ponds in the United Kingdom: Sludge
accumulation in pilot-scale primary facultative ponds', Environmental technology, vol. 26, no. 4, pp. 449-
458.
Achkari-Begdouri, A & Goodrich, PR 1992, 'Rheological properties of Moroccan dairy cattle
manure', Bioresource technology, vol. 40, no. 2, pp. 149-156.
Anderson, J et al. 2000, 'Physical and chemical properties of undisturbed stratified sludge in swine
waste anaerobic lagoons', in Proceedings of the 8th International Symposium on Animal, Agricultural and
Food Processing Wastes, Des Moines, Iowa, pp. 171-178.
APHA 1989, Fixed and volatile solids ignited at 550°C, 17th Edn, vol APHA 2540E, Standard Methods
for the Examination of Water and Waste water, American Public Health Association New York,
USA.
ASTM 2008, D 2974-07a - Standard test method for moisture, ash, and organic matter of peat and other
organic soils, PA 19428-2959, ASTM International, West Conshohocken.
Baker, KB et al. 2002, 'Treatment of lagoon sludge and liquid animal manure utilizing geotextile
filtration', Clemson University.
Barth, CL 1985, 'The rational design standard for anaerobic livestock waste lagoons', in Proceedings of
the 5th International Symposium on Agricultural Wastes, St Joseph, MI, USA, American Society of
Agricultural Engineers, pp. 638-647.
Barth, CL & Kroes, J 1985, 'Livestock waste lagoon sludge characterisation', in Agricultural Waste
Utilization and Management. Proceedings of the 5th International Symposium on Agricultural Waste, 16-17
December, Chicago, IL, ASABE.
Baudez, J et al. 2012, 'The impact of temperature on the rheological behaviour of anaerobic digested
sludge', Chemical Engineering Journal.
Biggs, C & Lant, P 2000, 'Activated sludge flocculation: on-line determination of floc size and the
effect of shear', Water Research, vol. 34, no. 9, pp. 2542-2550.
Birchall, S 2010, Biogas production by covered lagoons - Performance data from Bears Lagoon Piggery,
RIRDC Publication No. 10/023, Rural Industries Research and Development Corporation, Canberra,
< https://rirdc.infoservices.com.au/items/10-023 >.
Brambilla, M et al. 2013, 'Rheological properties of manure/biomass mixtures and pumping strategies
to improve ingestate formulation: A review', Transations of the ASABE vol. 56, no. 5, pp. 1905-1920.
Bryant, CW 1995, 'A simple method for analysis of the performance of aerated wastewater lagoons',
Water Science and Technology, vol. 31, no. 12, pp. 211-218.
Butler, B & Johns, M 2012, Demonstration of covered anaerobic pond technology, Final Report Project
P.PIP.0290 2011, Meat & Livestock Australia Ltd, North Sydney.
Campbell, G & Shiozawa, S 1992, 'Prediction of hydraulic properties of soils using particle-size
distribution and bulk density data', in Proc. Int. Workshop on Indirect Methods for Estimating the
Hydraulic Properties of Unsaturated Soils. University of California, Riverside, pp. 317-328.
Cantrell, K et al. 2008, 'Geotextile filtration performance for lagoon sludges and liquid animal
manures dewatering', Transactions of the ASABE, vol. 51, no. 3, pp. 1067-1076.
Charles, J 2000, Solid separation using a vibrating sieve, Pig Research and Development Corporation
Group Demonstration Project, Report No. 1667, Charles IFE Pty Ltd.
Chastain, JP 2006, 'Estimation of sludge accumulation in lagoons. Paper no. 064114', in ASABE Annual
International Meeting, 9-12 July Portland, Oregon, ASABE.
Chen, Y 1982, Engineering properties of beef cattle manure, ASAE, Paper No. 824085, American
Society of Agricultural Engineers, St. Joseph, MI.
Chen, Y 1986, 'Rheological properties of sieved beef-cattle manure slurry: rheological model and
effects of temperature and solids concentration', Agricultural Wastes, vol. 15, no. 1, pp. 17-33.
Chen, Y & Hashimoto, A 1976, 'Pipeline transport of livestock waste slurries', Transactions of the
ASAE, vol. 19.
Chen, Y & Shetler, E 1983, 'Temperature effect on rheological properties of cattle manure slurry',
Journal of Testing and Evaluation, vol. 11, no. 6, pp. 5.
Davis, RJ et al. 2010, Quantification of feedlot manure output for BEEF-BAL model upgrade, RIRDC
Project No. PRJ-004377, Rural Industries Research and Development Corporation, Canberra.
Dong, H et al. 2006, Chapter 10: Emissions from Livestock and Manure Management, vol 4: Agriculture,
Forestry and Other Land Use, IPCC Guidelines for National Greenhouse Gas Inventories, IGES,
Japan.
Duperouzel, D nd., 'Making waves in anaerobic pond treatment systems - Wasteline #13', viewed
21/3/2007, < www.dpi.qld.gov.au/cps/rde/xchg/dpi/hs.xsl/30_1809_ENA_HTML.htm, >.
El-Mashad, HM et al. 2004a, 'Effect of temperature and temperature fluctuation on thermophilic
anaerobic digestion of cattle manure', Bioresource Technology, vol. 95, no. 2, pp. 191-201.
El-Mashad, HM et al. 2004b, 'Effect of temperature and temperature fluctuation on thermophilic
anaerobic digestion of cattle manure', Bioresource technology, vol. 95, no. 2, pp. 191-201.
Eshtiaghi, N et al. 2012, 'The laminar/turbulent transition in a sludge pipeline', Water Science and
Technology, vol. 65, no. 4, pp. 697-702.
Fowler, J et al. 1996, 'Dewatering sewage sludge with geotextile tubes', in Proceedings of the 49th
Canadian Geotechnical Conference, pp. 23-25.
GHD 2008, In-situ desludging of anaerobic lagoons and sludge drying, APL Project Final Report,
Australian Pork Ltd, Canberra, ACT.
Gilley, J et al. 2000, 'Copper and zinc in swine diets affect phototrophic anaerobic lagoons', in Animal,
agricultural and food processing wastes. Proceedings of the Eighth International Symposium, Des Moines,
Iowa, USA, 9-11 October, 2000., American Society of Agricultural Engineers, pp. 656-663.
Glancey, J & Hoffman, S 1996, 'Physical properties of solid waste materials', Applied engineering in
agriculture, vol. 12, no. 4, pp. 441-446.
Gloyna, EF 1971, Waste stabilization ponds, World Health Organization Geneva.
Grzina, A, Roudnev, A, Burgess, K, 2002, Slurry pumping manual, Warman International Ltd.
Guyer, J 2011, Introduction to Sludge Handling, Treatment and Disposal, Continuing Education and
Development, Inc.
Hamilton, D 2010, 'Sludge accumulation in two anaerobic/facultative lagoons treating swine manure
from breeding farms in Oklahoma', Transactions of ASABE, vol. 53, no. 2, pp. 529-536.
Hao, X et al. 2005, 'Influence of Canola and Sunflower Diet Amendments on Cattle Feedlot Manure',
Journal of Environmental Quality, vol. 34, no. 4, pp. 1439-1445.
Hasar, H et al. 2004, 'Rheological properties of activated sludge in a sMBR', Biochemical Engineering
Journal, vol. 20, no. 1, pp. 1-6.
Hayes, S et al. 2007, Odour emissions from sedimentation and evaporative ponds, APL Final Report
Project No. 2139, December 2007, Australian Pork Ltd, Canberra, ACT.
Hjorth, M et al. 2010, 'Solid–liquid separation of animal slurry in theory and practice. A review',
Agronomy for sustainable development, vol. 30, no. 1, pp. 153-180.
Hollmann, M et al. 2008, 'Evaluation of solids, nitrogen, and phosphorus excretion models for
lactating dairy cows', Journal of Dairy Science, vol. 91, no. 3, pp. 1245-1257.
Keffala, C et al. 2013, 'A review of the sustainable value and disposal techniques, wastewater
stabilisation ponds sludge characteristics and accumulation', Environmental monitoring and assessment,
vol. 185, no. 1, pp. 45-58.
Kehl, O et al. 2009, 'Analysis of design approaches for stabilization ponds under different boundary
conditions—A comparison', Ecological Engineering, vol. 35, no. 8, pp. 1117-1128.
Kruger, I et al. 2008, Sedimentation and evaporation pond systems, National Environmental Guidelines
Workshop May 2008, Australian Pork Limited,.
Kumar, M et al. 1972, 'Flow properties of animal slurries', Transactions of the ASAE, vol. 15, no. 4, pp.
718-722.
Landry, H et al. 2004, 'Physical and rheological properties of manure products', Applied Engineering in
Agriculture, vol. 20, no. 3, pp. 277-288.
Landry, H et al. 2002, 'Physical and flow properties of solid and semi-solid manure as related to the
design of handling and land application equipment', in Poster presented at the 2002 Banff Pork Seminar–
Leading the Way. Banff, AB. Advances in Pork Production (2002), vol. 13.
Lawler, DF et al. 1986, 'Anaerobic digestion: effects on particle size and dewaterability', Journal
(Water Pollution Control Federation), pp. 1107-1117.
Marcato, CE et al. 2008, 'Particle size and metal distributions in anaerobically digested pig slurry',
Bioresource Technology, vol. 99, no. 7, pp. 2340-2348.
Mason, IG 1997, 'Performance of a facultative waste stabilization pond treating dairy shed
wastewater', Transactions of the ASAE vol. 40, no. 1, pp. 211-218.
Masse, L et al. 2005, 'Size distribution and composition of particles in raw and anaerobically digested
swine manure', Transations of the ASAE, vol. 48, no. 5, pp. 1943.
McCave, I & Syvitski, J 1991, 'Principles and methods of geological particle size analysis', Principles,
methods, and application of particle size analysis, pp. 3-21.
McGinn, SM et al. 2002, 'Effect of diet on odorant emissions from cattle manure', Canadian Journal of
Animal Science, vol. 82, no. 3, pp. 435-444.
Metcalf & Eddy Inc. 2003, Wastewater engineering: Treatment & reuse, McGraw-Hill, New York.
Neis, U & Tiehm, A 1997, 'Particle size analysis in primary and secondary waste water effluents',
Water science and technology, vol. 36, no. 4, pp. 151-158.
Nelson, KL et al. 2004, 'Sludge accumulation, characteristics, and pathogen inactivation in four
primary waste stabilization ponds in central Mexico', Water Research, vol. 38, no. 1, pp. 111-127.
Pain, B et al. 1978, 'Factors affecting the performances of four slurry separating machines', Journal of
Agricultural Engineering Research, vol. 23, no. 3, pp. 231-242.
PAMI 1997, A Guide to Pipeline Manure Injection Systems, Research Update No. 729, Prairie
Agricultural Machinery Institute, Humboldt, SK.
PAMI 2000, The Pork Producer's Guide to Managing Swine Manure in Saskatchewan - A Practical Guide for
Farmers and Applicators, Prairie Agricultural Machinery Institute, Humboldt, SK.
Papadopoulos, A et al. 2003, 'Sludge accumulation pattern in an anaerobic pond under
Mediterranean climatic conditions', Water research, vol. 37, no. 3, pp. 634-644.
Payne, H et al. 2008, Solids separation in sedimentation and evaporation pond systems (SEPS). Final report
to Australian Pork Ltd - APL Project 2130, Dept. of Agriculture and Food Western Australia, Perth.
Payne, R 1984, Physical, chemical and microbiological characteristics of pig excreta, Western Australian
Department of Agriculture, South Perth.
Payne, RW 1986, 'Characteristics of faeces from institutional and comemrical piggeries', Agricultural
Wastes, vol. 16, pp. 1-11.
Peters, J et al. 2003, Recommended Methods of Manure Analysis (A3769), UW Extension, University of
Wisconsin.
Picot, B et al. 2005, 'Wastewater stabilisation ponds: sludge accumulation, technical and financial
study on desludging and sludge disposal case studies in France', Water Science & Technology, vol. 51,
no. 12, pp. 227-234.
Pind, PF et al. 2003, 'Dynamics of the anaerobic process: Effects of volatile fatty acids', Biotechnology
and Bioengineering, vol. 82, no. 7, pp. 791-801.
Pollice, A et al. 2007, 'Physical characteristics of the sludge in a complete retention membrane
bioreactor', Water research, vol. 41, no. 8, pp. 1832-1840.
Ramalho, R 1977, Introduction to wastewater treatment processes, Academic Press.
Rickert, DA & Hunter, JV 1967, 'Rapid fractionation and materials balance of solids fractions in
wastewater and wastewater effluent', Journal (Water Pollution Control Federation), vol. 39, no. 9, pp.
1475-1486.
Saqqar, MM & Pescod, M 1995, 'Modelling sludge accumulation in anaerobic wastewater stabilization
ponds', Water Science and Technology, vol. 31, no. 12, pp. 185-190.
Schulte, D & Koelsch, R 1998, 'Improving Odor Control in Swine Lagoons by Better Understanding
and Management of Purple Sulfur Bacteria', University of Nebraska, Lincoln, Nebraska, USA.
Seyssiecq, I et al. 2003, 'State-of-the-art: rheological characterisation of wastewater treatment
sludge', Biochemical Engineering Journal, vol. 16, no. 1, pp. 41-56.
Shilton, A (ed.) 2005, Pond treatment technology, Integrated environmental technology series, IWA
Publishing, London, UK.
Singh, K et al. 2007, 'Sludge measurement using global positioning system (GPS) enabled sonar', in
Proceedings of the International Symposium on Air Quality and Waste Management for Agriculture, ASABE.
Skerman, A et al. 2013, Queensland sedimentation and evaporation pond system (SEPS) trial, Final Report
prepared for Australian Pork Ltd, APL Project No. 2009/2248.
Skerman, A et al. 2008, Improved piggery effluent management systems incorporating highly loaded
primary ponds, Final report to Australian Pork Limited (APL), Project 2108, Department of Primary
Industries and Fisheries (DPI&F), Toowoomba, Qld.
Skerman, A et al. 2005, Clay lining and compaction of effluent ponds, DPI&F Note, Note No: 8841,
February 2005, Department of Primary Industries and Fisheries.
Staley, L et al. 1973, 'Flow properties of dairy waste slurries', Canadian Agricultural Engineering, vol. 15,
no. 2, pp. 4.
Standards Australia 1992, Methods of testing soils for engineering purposes: Soil moisture content tests -
Determination of the moisture content of a soil - Oven drying method (standard method), (AS 1289.2.1.1),
Standards Australia, Sydney, NSW.
Sukias, JPS et al. 2001, 'Algal abundance, organic matter, and physico-chemical characteristics of dairy
farm facultative ponds: implications for treatment performance', New Zealand journal of agricultural
research, vol. 44, pp. 279-296.
Tadesse, I et al. 2004, 'Seasonal and diurnal variations of temperature, pH and dissolved oxygen in
advanced integrated wastewater pond system< sup>®</sup> treating tannery effluent', Water
Research, vol. 38, no. 3, pp. 645-654.
Tait, S, Birchall, S, O'Keefe, M, 2013, 'Sizing Pumps for Desludging of Covered Piggery Ponds', Paper
submitted to the Australasian Pig Science Association (ASPA) Melbourne.
Tucker, RW et al. 2010, National environmental guidelines for piggeries - Second Edition, APL Project
1832, Australian Pork Ltd, Deakin.
VanDevender, K 2003, Liquid Manure Solids Management. Division of agriculture research and extension,
FSA1041, University of Arkansas, Arkansas, viewed 23 September
<http://www.uaex.edu/Other_Areas/publications/PDF/FSA-1041.pdf >.
Vedrenne, F et al. 2008, 'The effect of incubation conditions on the laboratory measurement of the
methane producing capacity of livestock measurement wastes', Bioresource Technology, vol. 99, pp.
146-155.
Warman International Ltd. 2000, Warman Slurry pumping handbook (Australasian Version), February
2000, Warman International Ltd, viewed 23 September 2009, <
www.pumpfundamentals.com/slurry/Warman_slurry_pumping.pdf >.
Water Corporation 2010, Waste Stabilisation Pond Science: Implications for Design and Management,
Water Corporation, Leediville, Perth, viewed.
Watson, M 1999, Continuous anaerobic pond desludging, PRENV.003, Meat & Livestock Australia Ltd.
Westerman, P et al. 2008a, Sludge survey methods of anaerobic lagoons, Northern Carolina State
University, Published by North Carolina Cooperative Extension, Raleigh, NC.
Westerman, P et al. 2008b, Carbon credits for methane collection and combustion, North Carolina State
University and North Carolina A&T State University, Published by North Carolina Cooperative
Extension.
Worley, J et al. 2008, 'Use of geotextile tubes with chemical amendments to dewater dairy lagoon
solids', Bioresource technology, vol. 99, no. 10, pp. 4451-4459.
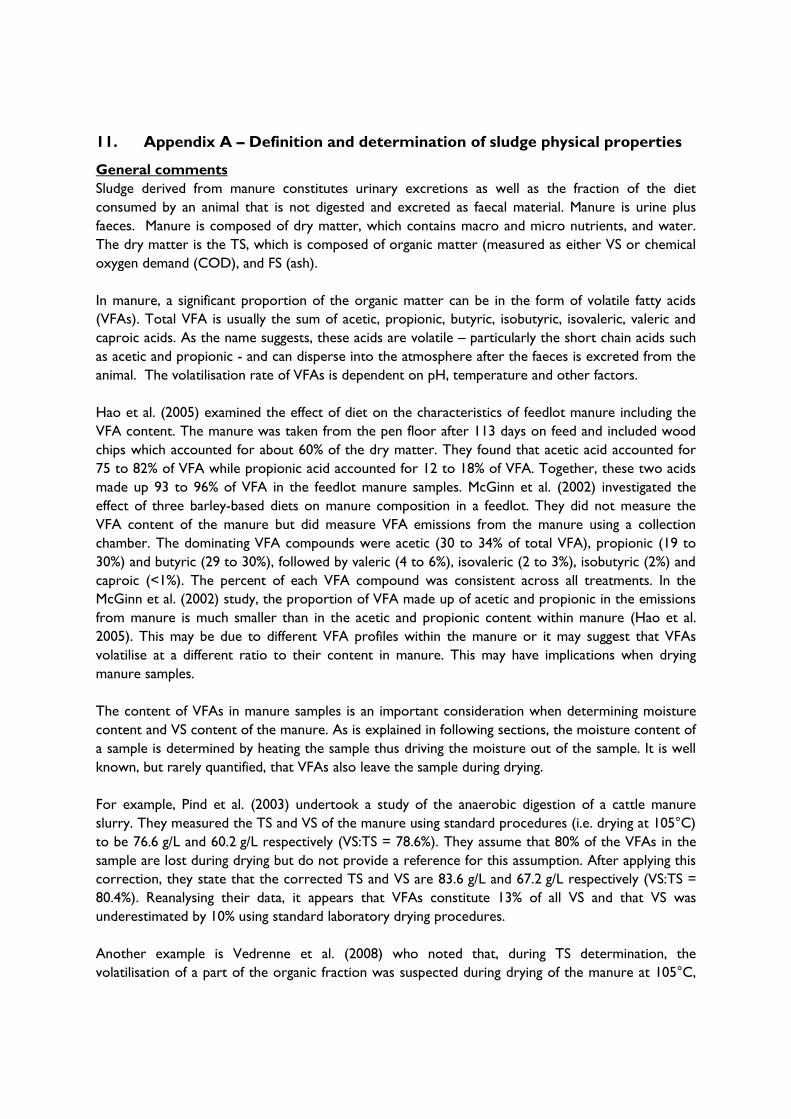
11. Appendix A – Definition and determination of sludge physical properties
General comments
Sludge derived from manure constitutes urinary excretions as well as the fraction of the diet
consumed by an animal that is not digested and excreted as faecal material. Manure is urine plus
faeces. Manure is composed of dry matter, which contains macro and micro nutrients, and water.
The dry matter is the TS, which is composed of organic matter (measured as either VS or chemical
oxygen demand (COD), and FS (ash).
In manure, a significant proportion of the organic matter can be in the form of volatile fatty acids
(VFAs). Total VFA is usually the sum of acetic, propionic, butyric, isobutyric, isovaleric, valeric and
caproic acids. As the name suggests, these acids are volatile – particularly the short chain acids such
as acetic and propionic - and can disperse into the atmosphere after the faeces is excreted from the
animal. The volatilisation rate of VFAs is dependent on pH, temperature and other factors.
Hao et al. (2005) examined the effect of diet on the characteristics of feedlot manure including the
VFA content. The manure was taken from the pen floor after 113 days on feed and included wood
chips which accounted for about 60% of the dry matter. They found that acetic acid accounted for
75 to 82% of VFA while propionic acid accounted for 12 to 18% of VFA. Together, these two acids
made up 93 to 96% of VFA in the feedlot manure samples. McGinn et al. (2002) investigated the
effect of three barley-based diets on manure composition in a feedlot. They did not measure the
VFA content of the manure but did measure VFA emissions from the manure using a collection
chamber. The dominating VFA compounds were acetic (30 to 34% of total VFA), propionic (19 to
30%) and butyric (29 to 30%), followed by valeric (4 to 6%), isovaleric (2 to 3%), isobutyric (2%) and
caproic (<1%). The percent of each VFA compound was consistent across all treatments. In the
McGinn et al. (2002) study, the proportion of VFA made up of acetic and propionic in the emissions
from manure is much smaller than in the acetic and propionic content within manure (Hao et al.
2005). This may be due to different VFA profiles within the manure or it may suggest that VFAs
volatilise at a different ratio to their content in manure. This may have implications when drying
manure samples.
The content of VFAs in manure samples is an important consideration when determining moisture
content and VS content of the manure. As is explained in following sections, the moisture content of
a sample is determined by heating the sample thus driving the moisture out of the sample. It is well
known, but rarely quantified, that VFAs also leave the sample during drying.
For example, Pind et al. (2003) undertook a study of the anaerobic digestion of a cattle manure
slurry. They measured the TS and VS of the manure using standard procedures (i.e. drying at 105°C)
to be 76.6 g/L and 60.2 g/L respectively (VS:TS = 78.6%). They assume that 80% of the VFAs in the
sample are lost during drying but do not provide a reference for this assumption. After applying this
correction, they state that the corrected TS and VS are 83.6 g/L and 67.2 g/L respectively (VS:TS =
80.4%). Reanalysing their data, it appears that VFAs constitute 13% of all VS and that VS was
underestimated by 10% using standard laboratory drying procedures.
Another example is Vedrenne et al. (2008) who noted that, during TS determination, the
volatilisation of a part of the organic fraction was suspected during drying of the manure at 105°C,
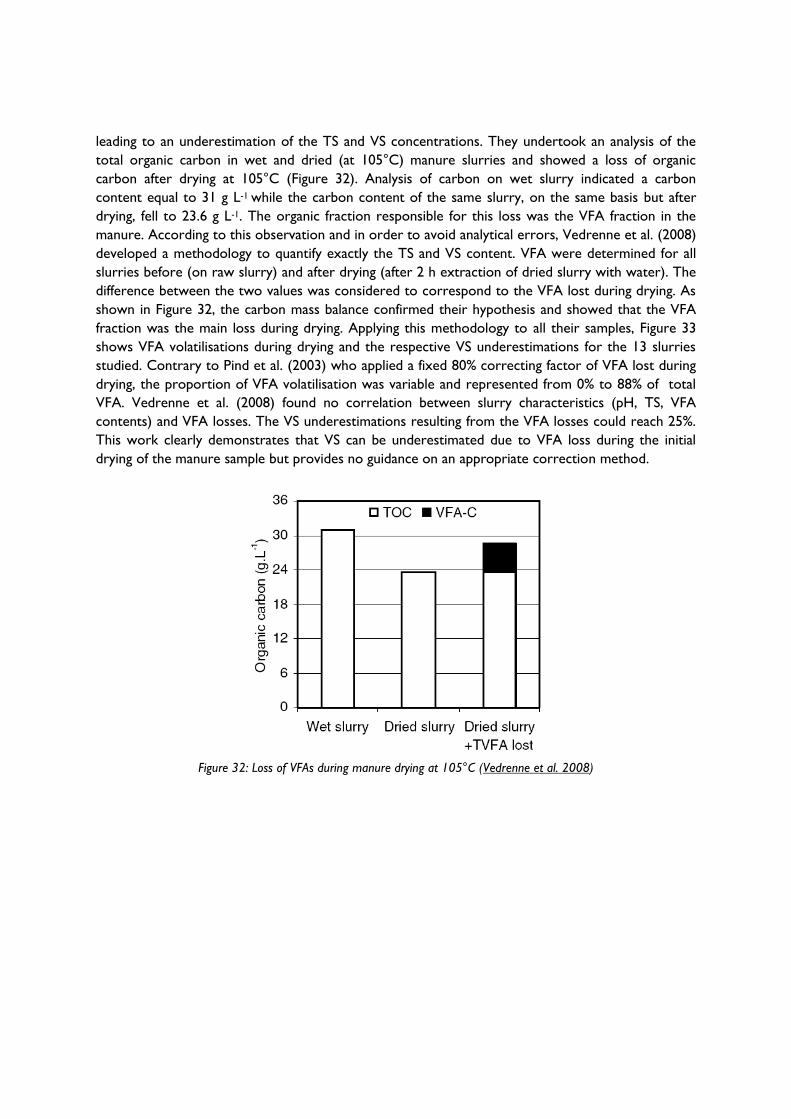
leading to an underestimation of the TS and VS concentrations. They undertook an analysis of the
total organic carbon in wet and dried (at 105°C) manure slurries and showed a loss of organic
carbon after drying at 105°C (Figure 32). Analysis of carbon on wet slurry indicated a carbon
content equal to 31 g L-1 while the carbon content of the same slurry, on the same basis but after
drying, fell to 23.6 g L-1. The organic fraction responsible for this loss was the VFA fraction in the
manure. According to this observation and in order to avoid analytical errors, Vedrenne et al. (2008)
developed a methodology to quantify exactly the TS and VS content. VFA were determined for all
slurries before (on raw slurry) and after drying (after 2 h extraction of dried slurry with water). The
difference between the two values was considered to correspond to the VFA lost during drying. As
shown in Figure 32, the carbon mass balance confirmed their hypothesis and showed that the VFA
fraction was the main loss during drying. Applying this methodology to all their samples, Figure 33
shows VFA volatilisations during drying and the respective VS underestimations for the 13 slurries
studied. Contrary to Pind et al. (2003) who applied a fixed 80% correcting factor of VFA lost during
drying, the proportion of VFA volatilisation was variable and represented from 0% to 88% of total
VFA. Vedrenne et al. (2008) found no correlation between slurry characteristics (pH, TS, VFA
contents) and VFA losses. The VS underestimations resulting from the VFA losses could reach 25%.
This work clearly demonstrates that VS can be underestimated due to VFA loss during the initial
drying of the manure sample but provides no guidance on an appropriate correction method.
Figure 32: Loss of VFAs during manure drying at 105°C (Vedrenne et al. 2008)
Figure 33: VS underestimation due to drying (Vedrenne et al. 2008)
11.1.1 Total solids (dry matter)
Dry Matter (DM) or TS is that matter remaining after water is completely evaporated from the
sample (Peters et al. 2003). For soils, this is a relatively straightforward process. Most standards
specify drying at 105°C for either 24 hours or until the weight of the dried sample is constant, e.g.
Standards Australia (1992).
However, for samples containing a large percentage of organic or volatile material, it is likely that
some of the volatile organics will be lost during the drying process. Certainly, anyone who has
actually dried manure samples would know that more compounds than just water are driven from
the samples. Peters et al. (2003) reports the outcome of a program that conducted a manure sample
exchange between 14 state university laboratories in the USA. They found that drying temperatures
ranged from 50°C to 110°C and documented drying times ranged from 16 to 24 hours. Clearly,
there is a lack of standard methodology used for manure samples. It is probably that the lower
drying temperatures used by some laboratories is an attempt to minimise the loss of volatile
organics during the drying process.
The whole issue of the effect of drying temperature on TS and VS determination is exemplified when
Hollman et al (2008) stated that “to our knowledge, no data exist in the scientific literature comparing DM
excretion estimates to total solids estimates”. On the face of it, this statement seems nonsensical as
most authors assume (as is done in this report) that DM (dry matter) is equivalent to TS. However,
Hollman et al (2008) goes on to say that DM is typically determined by agricultural scientists by
drying at 60°C while TS are determined by engineers by drying at 105°C and that these two
methods do not necessarily produce the same result with more variability in results dried at 60°C.
UQ AWMC TS Method
TS was determined by the Standard Methods for the Examination of Water and Wastewater.
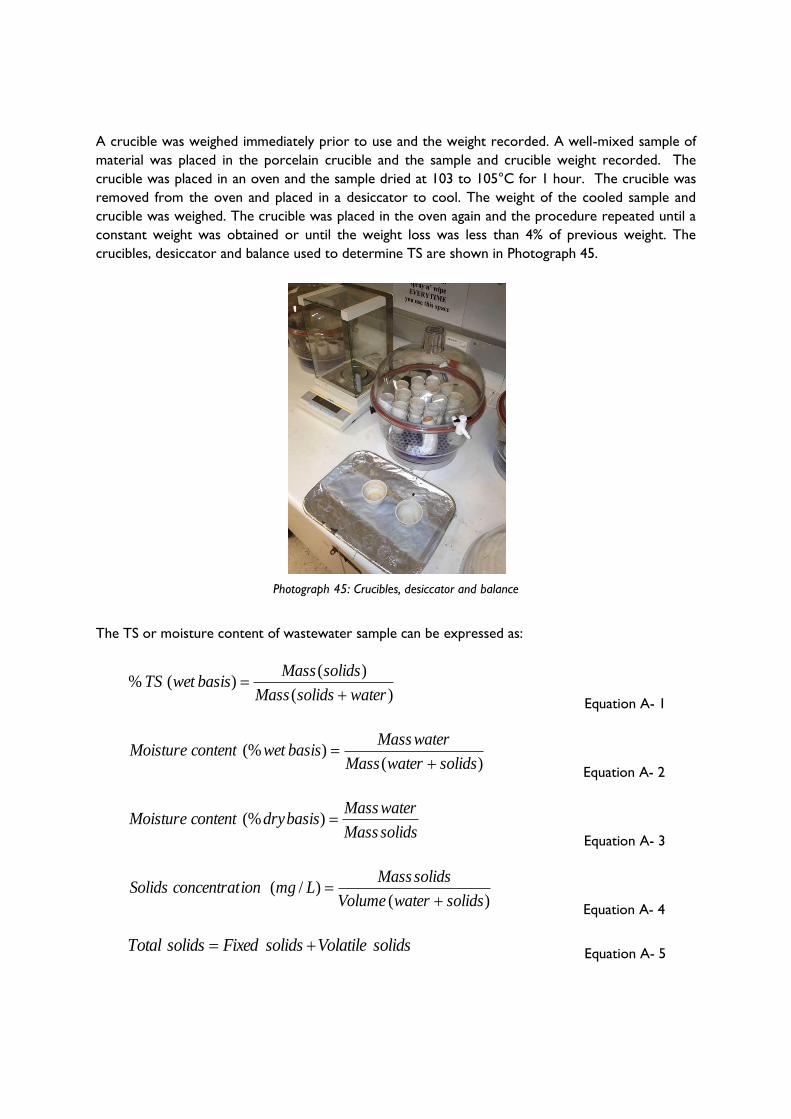
A crucible was weighed immediately prior to use and the weight recorded. A well-mixed sample of
material was placed in the porcelain crucible and the sample and crucible weight recorded. The
crucible was placed in an oven and the sample dried at 103 to 105°C for 1 hour. The crucible was
removed from the oven and placed in a desiccator to cool. The weight of the cooled sample and
crucible was weighed. The crucible was placed in the oven again and the procedure repeated until a
constant weight was obtained or until the weight loss was less than 4% of previous weight. The
crucibles, desiccator and balance used to determine TS are shown in Photograph 45.
Photograph 45: Crucibles, desiccator and balance
The TS or moisture content of wastewater sample can be expressed as:
)(
)()(%
watersolidsMass
solidsMassbasiswetTS
Equation A- 1
)()(%
solidswaterMass
waterMassbasiswetcontentMoisture
Equation A- 2
solidsMass
waterMassbasisdrycontentMoisture )(%
Equation A- 3
)()/(
solidswaterVolume
solidsMassLmgionconcentratSolids
Equation A- 4
solidsVolatilesolidsFixedsolidsTotal Equation A- 5
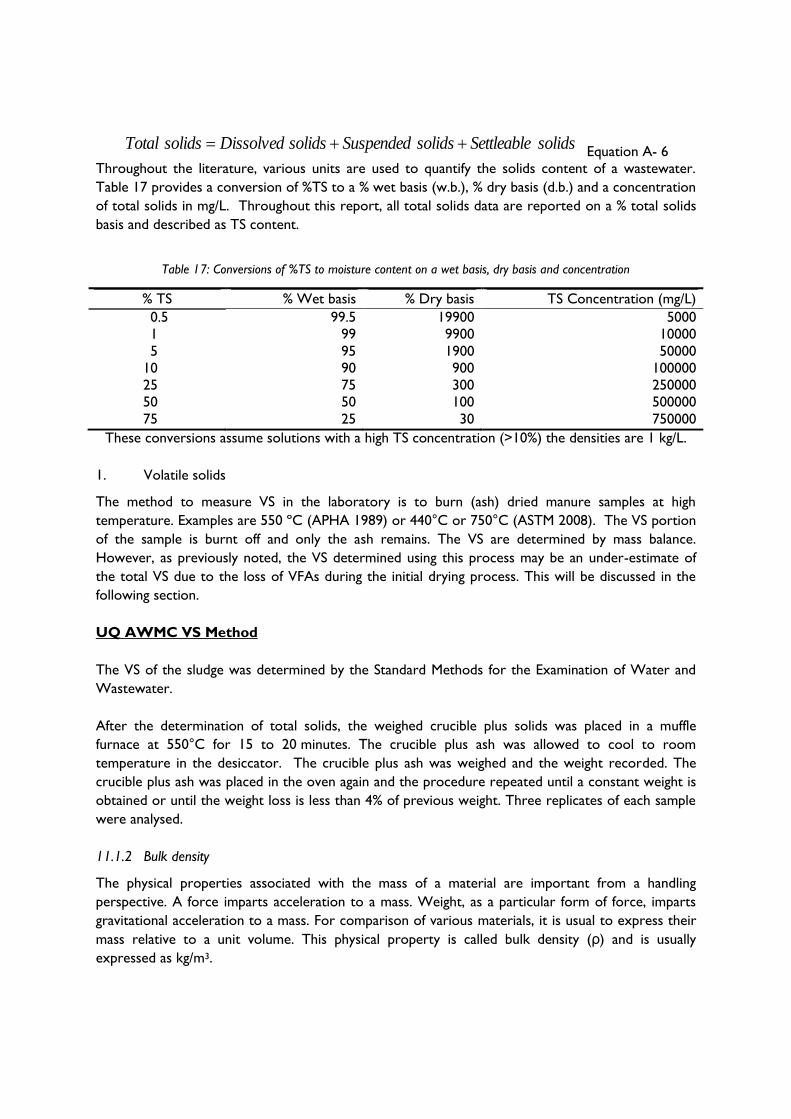
solidsSettleablesolidsSuspendedsolidsDissolvedsolidsTotal Equation A- 6
Throughout the literature, various units are used to quantify the solids content of a wastewater.
Table 17 provides a conversion of %TS to a % wet basis (w.b.), % dry basis (d.b.) and a concentration
of total solids in mg/L. Throughout this report, all total solids data are reported on a % total solids
basis and described as TS content.
Table 17: Conversions of %TS to moisture content on a wet basis, dry basis and concentration
% TS % Wet basis % Dry basis TS Concentration (mg/L)
0.5 99.5 19900 5000
1 99 9900 10000
5 95 1900 50000
10 90 900 100000
25 75 300 250000
50 50 100 500000
75 25 30 750000
These conversions assume solutions with a high TS concentration (>10%) the densities are 1 kg/L.
1. Volatile solids
The method to measure VS in the laboratory is to burn (ash) dried manure samples at high
temperature. Examples are 550 ºC (APHA 1989) or 440°C or 750°C (ASTM 2008). The VS portion
of the sample is burnt off and only the ash remains. The VS are determined by mass balance.
However, as previously noted, the VS determined using this process may be an under-estimate of
the total VS due to the loss of VFAs during the initial drying process. This will be discussed in the
following section.
UQ AWMC VS Method
The VS of the sludge was determined by the Standard Methods for the Examination of Water and
Wastewater.
After the determination of total solids, the weighed crucible plus solids was placed in a muffle
furnace at 550°C for 15 to 20 minutes. The crucible plus ash was allowed to cool to room
temperature in the desiccator. The crucible plus ash was weighed and the weight recorded. The
crucible plus ash was placed in the oven again and the procedure repeated until a constant weight is
obtained or until the weight loss is less than 4% of previous weight. Three replicates of each sample
were analysed.
11.1.2 Bulk density
The physical properties associated with the mass of a material are important from a handling
perspective. A force imparts acceleration to a mass. Weight, as a particular form of force, imparts
gravitational acceleration to a mass. For comparison of various materials, it is usual to express their
mass relative to a unit volume. This physical property is called bulk density (ρ) and is usually
expressed as kg/m3.
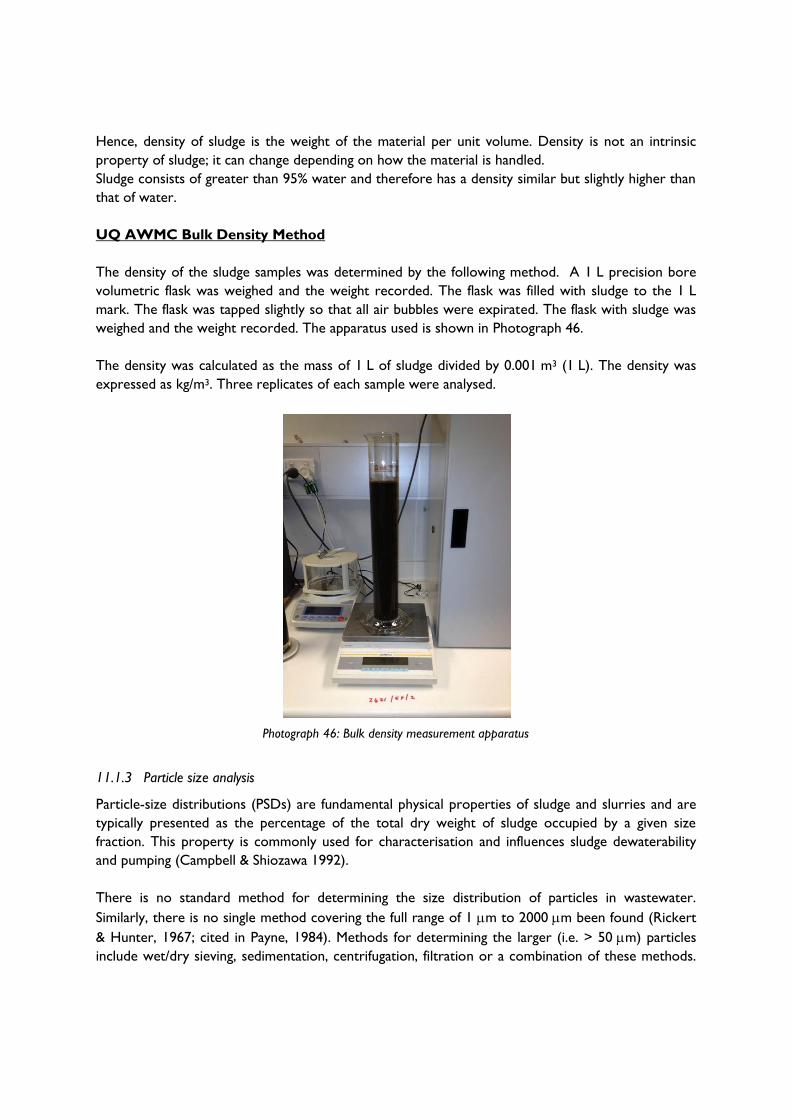
Hence, density of sludge is the weight of the material per unit volume. Density is not an intrinsic
property of sludge; it can change depending on how the material is handled.
Sludge consists of greater than 95% water and therefore has a density similar but slightly higher than
that of water.
UQ AWMC Bulk Density Method
The density of the sludge samples was determined by the following method. A 1 L precision bore
volumetric flask was weighed and the weight recorded. The flask was filled with sludge to the 1 L
mark. The flask was tapped slightly so that all air bubbles were expirated. The flask with sludge was
weighed and the weight recorded. The apparatus used is shown in Photograph 46.
The density was calculated as the mass of 1 L of sludge divided by 0.001 m3 (1 L). The density was
expressed as kg/m3. Three replicates of each sample were analysed.
Photograph 46: Bulk density measurement apparatus
11.1.3 Particle size analysis
Particle-size distributions (PSDs) are fundamental physical properties of sludge and slurries and are
typically presented as the percentage of the total dry weight of sludge occupied by a given size
fraction. This property is commonly used for characterisation and influences sludge dewaterability
and pumping (Campbell & Shiozawa 1992).
There is no standard method for determining the size distribution of particles in wastewater.
Similarly, there is no single method covering the full range of 1 m to 2000 m been found (Rickert
& Hunter, 1967; cited in Payne, 1984). Methods for determining the larger (i.e. > 50 m) particles
include wet/dry sieving, sedimentation, centrifugation, filtration or a combination of these methods.
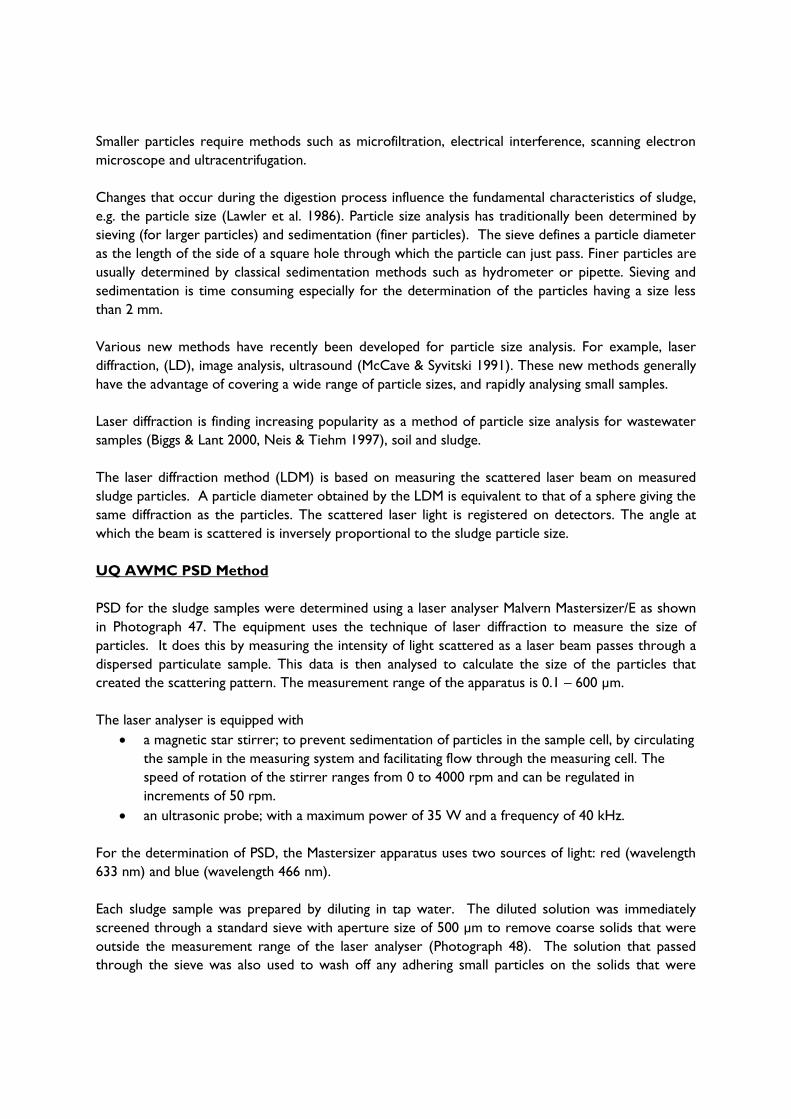
Smaller particles require methods such as microfiltration, electrical interference, scanning electron
microscope and ultracentrifugation.
Changes that occur during the digestion process influence the fundamental characteristics of sludge,
e.g. the particle size (Lawler et al. 1986). Particle size analysis has traditionally been determined by
sieving (for larger particles) and sedimentation (finer particles). The sieve defines a particle diameter
as the length of the side of a square hole through which the particle can just pass. Finer particles are
usually determined by classical sedimentation methods such as hydrometer or pipette. Sieving and
sedimentation is time consuming especially for the determination of the particles having a size less
than 2 mm.
Various new methods have recently been developed for particle size analysis. For example, laser
diffraction, (LD), image analysis, ultrasound (McCave & Syvitski 1991). These new methods generally
have the advantage of covering a wide range of particle sizes, and rapidly analysing small samples.
Laser diffraction is finding increasing popularity as a method of particle size analysis for wastewater
samples (Biggs & Lant 2000, Neis & Tiehm 1997), soil and sludge.
The laser diffraction method (LDM) is based on measuring the scattered laser beam on measured
sludge particles. A particle diameter obtained by the LDM is equivalent to that of a sphere giving the
same diffraction as the particles. The scattered laser light is registered on detectors. The angle at
which the beam is scattered is inversely proportional to the sludge particle size.
UQ AWMC PSD Method
PSD for the sludge samples were determined using a laser analyser Malvern Mastersizer/E as shown
in Photograph 47. The equipment uses the technique of laser diffraction to measure the size of
particles. It does this by measuring the intensity of light scattered as a laser beam passes through a
dispersed particulate sample. This data is then analysed to calculate the size of the particles that
created the scattering pattern. The measurement range of the apparatus is 0.1 – 600 µm.
The laser analyser is equipped with
a magnetic star stirrer; to prevent sedimentation of particles in the sample cell, by circulating
the sample in the measuring system and facilitating flow through the measuring cell. The
speed of rotation of the stirrer ranges from 0 to 4000 rpm and can be regulated in
increments of 50 rpm.
an ultrasonic probe; with a maximum power of 35 W and a frequency of 40 kHz.
For the determination of PSD, the Mastersizer apparatus uses two sources of light: red (wavelength
633 nm) and blue (wavelength 466 nm).
Each sludge sample was prepared by diluting in tap water. The diluted solution was immediately
screened through a standard sieve with aperture size of 500 µm to remove coarse solids that were
outside the measurement range of the laser analyser (Photograph 48). The solution that passed
through the sieve was also used to wash off any adhering small particles on the solids that were
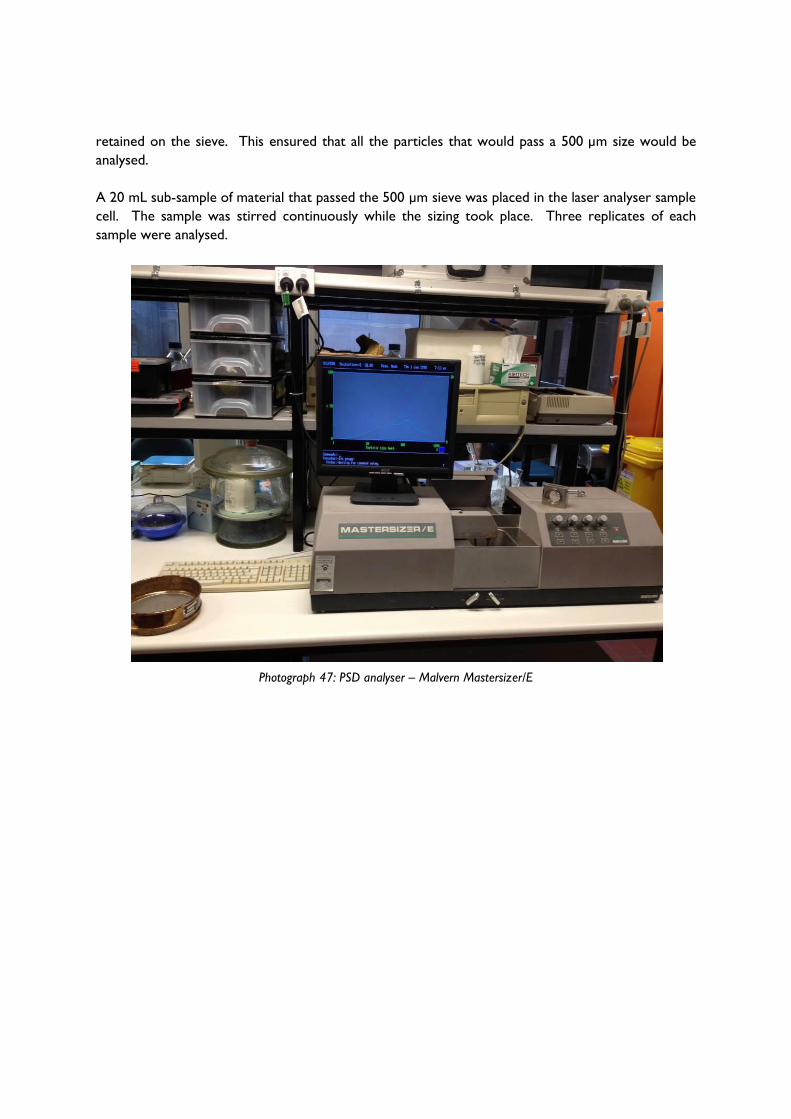
retained on the sieve. This ensured that all the particles that would pass a 500 µm size would be
analysed.
A 20 mL sub-sample of material that passed the 500 µm sieve was placed in the laser analyser sample
cell. The sample was stirred continuously while the sizing took place. Three replicates of each
sample were analysed.
Photograph 47: PSD analyser – Malvern Mastersizer/E
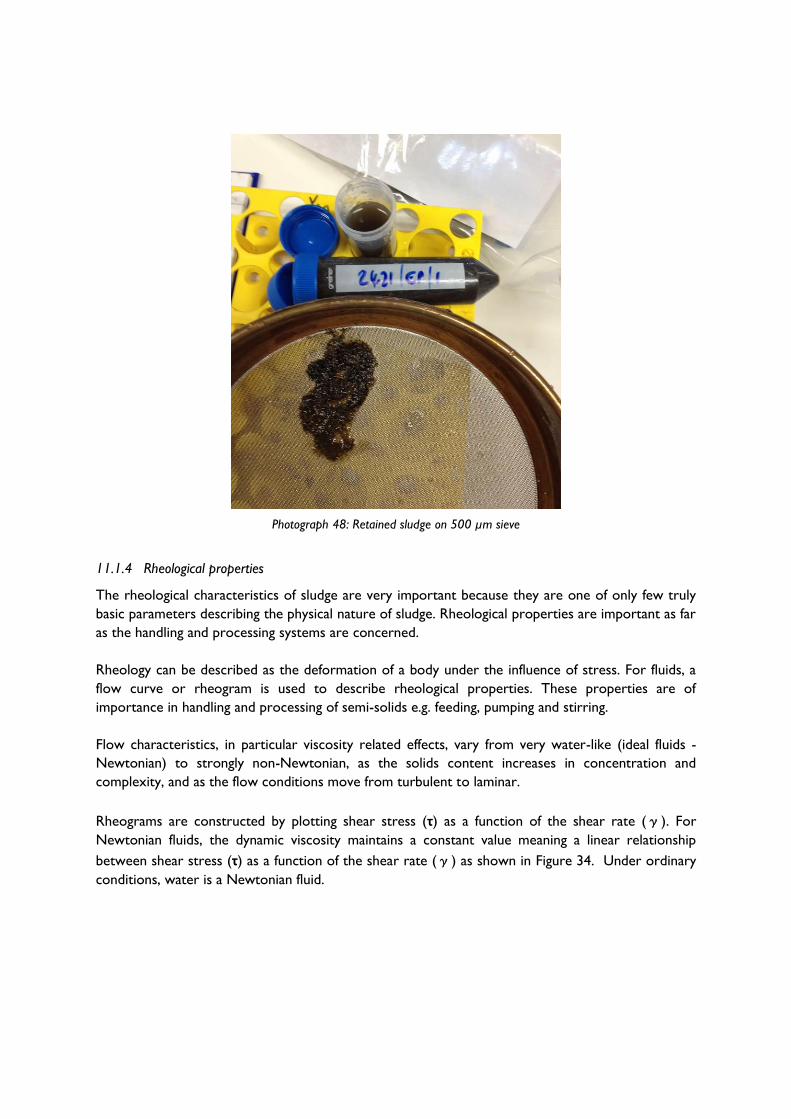
Photograph 48: Retained sludge on 500 µm sieve
11.1.4 Rheological properties
The rheological characteristics of sludge are very important because they are one of only few truly
basic parameters describing the physical nature of sludge. Rheological properties are important as far
as the handling and processing systems are concerned.
Rheology can be described as the deformation of a body under the influence of stress. For fluids, a
flow curve or rheogram is used to describe rheological properties. These properties are of
importance in handling and processing of semi-solids e.g. feeding, pumping and stirring.
Flow characteristics, in particular viscosity related effects, vary from very water-like (ideal fluids -
Newtonian) to strongly non-Newtonian, as the solids content increases in concentration and
complexity, and as the flow conditions move from turbulent to laminar.
Rheograms are constructed by plotting shear stress (τ) as a function of the shear rate (γ). For
Newtonian fluids, the dynamic viscosity maintains a constant value meaning a linear relationship
between shear stress (τ) as a function of the shear rate (γ) as shown in Figure 34. Under ordinary
conditions, water is a Newtonian fluid.
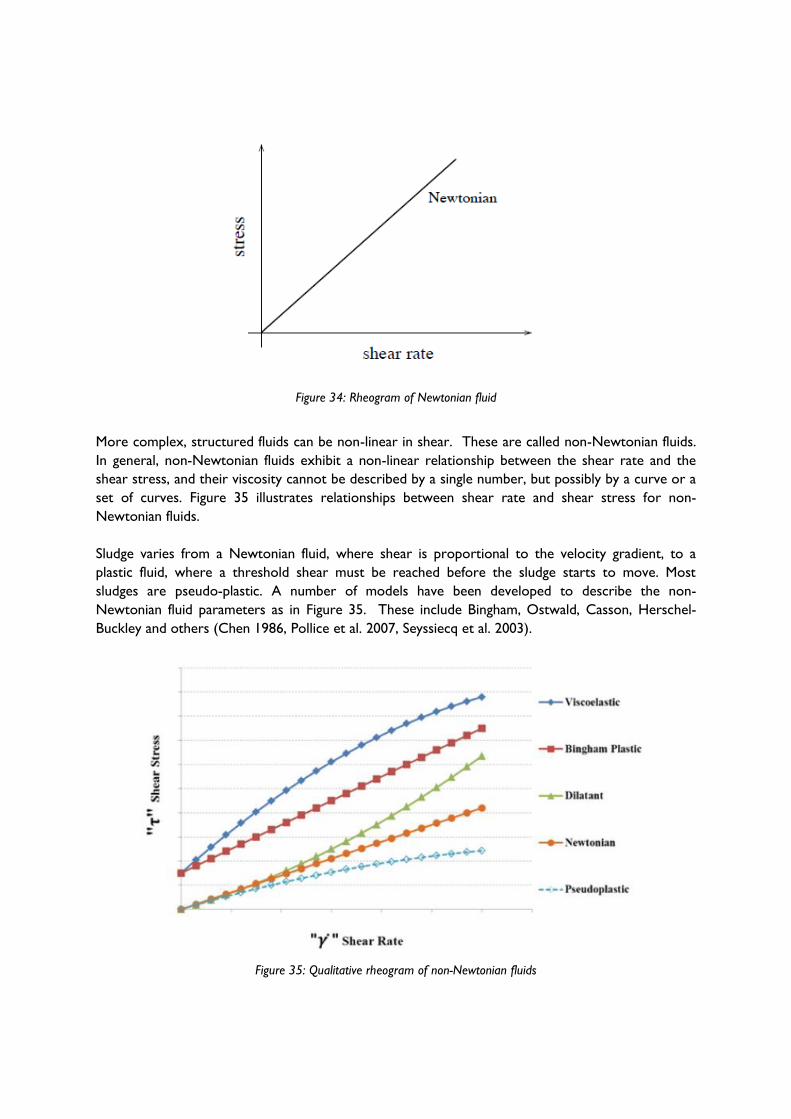
Figure 34: Rheogram of Newtonian fluid
More complex, structured fluids can be non-linear in shear. These are called non-Newtonian fluids.
In general, non-Newtonian fluids exhibit a non-linear relationship between the shear rate and the
shear stress, and their viscosity cannot be described by a single number, but possibly by a curve or a
set of curves. Figure 35 illustrates relationships between shear rate and shear stress for non-
Newtonian fluids.
Sludge varies from a Newtonian fluid, where shear is proportional to the velocity gradient, to a
plastic fluid, where a threshold shear must be reached before the sludge starts to move. Most
sludges are pseudo-plastic. A number of models have been developed to describe the non-
Newtonian fluid parameters as in Figure 35. These include Bingham, Ostwald, Casson, Herschel-
Buckley and others (Chen 1986, Pollice et al. 2007, Seyssiecq et al. 2003).
Figure 35: Qualitative rheogram of non-Newtonian fluids
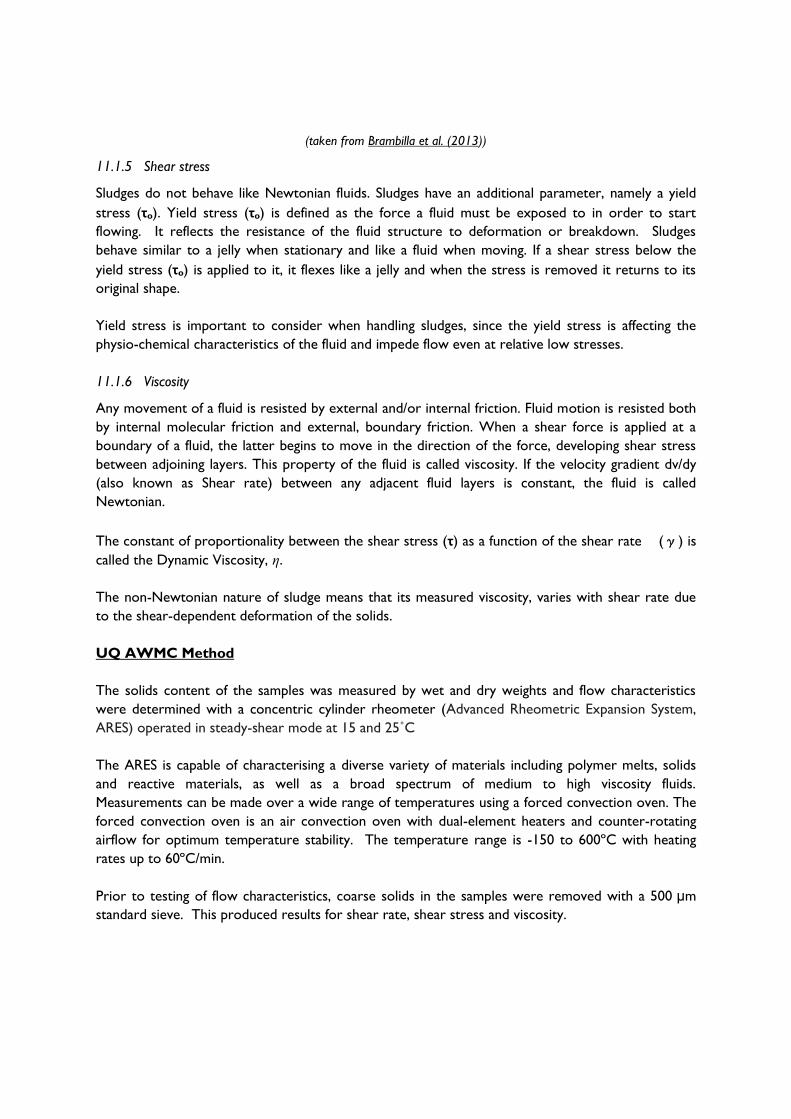
(taken from Brambilla et al. (2013))
11.1.5 Shear stress
Sludges do not behave like Newtonian fluids. Sludges have an additional parameter, namely a yield
stress (τo). Yield stress (τo) is defined as the force a fluid must be exposed to in order to start
flowing. It reflects the resistance of the fluid structure to deformation or breakdown. Sludges
behave similar to a jelly when stationary and like a fluid when moving. If a shear stress below the
yield stress (τo) is applied to it, it flexes like a jelly and when the stress is removed it returns to its
original shape.
Yield stress is important to consider when handling sludges, since the yield stress is affecting the
physio-chemical characteristics of the fluid and impede flow even at relative low stresses.
11.1.6 Viscosity
Any movement of a fluid is resisted by external and/or internal friction. Fluid motion is resisted both
by internal molecular friction and external, boundary friction. When a shear force is applied at a
boundary of a fluid, the latter begins to move in the direction of the force, developing shear stress
between adjoining layers. This property of the fluid is called viscosity. If the velocity gradient dv/dy
(also known as Shear rate) between any adjacent fluid layers is constant, the fluid is called
Newtonian.
The constant of proportionality between the shear stress (τ) as a function of the shear rate (γ) is
called the Dynamic Viscosity, η.
The non-Newtonian nature of sludge means that its measured viscosity, varies with shear rate due
to the shear-dependent deformation of the solids.
UQ AWMC Method
The solids content of the samples was measured by wet and dry weights and flow characteristics
were determined with a concentric cylinder rheometer (Advanced Rheometric Expansion System,
ARES) operated in steady-shear mode at 15 and 25˚C
The ARES is capable of characterising a diverse variety of materials including polymer melts, solids
and reactive materials, as well as a broad spectrum of medium to high viscosity fluids.
Measurements can be made over a wide range of temperatures using a forced convection oven. The
forced convection oven is an air convection oven with dual-element heaters and counter-rotating
airflow for optimum temperature stability. The temperature range is -150 to 600ºC with heating
rates up to 60ºC/min.
Prior to testing of flow characteristics, coarse solids in the samples were removed with a 500 μm
standard sieve. This produced results for shear rate, shear stress and viscosity.
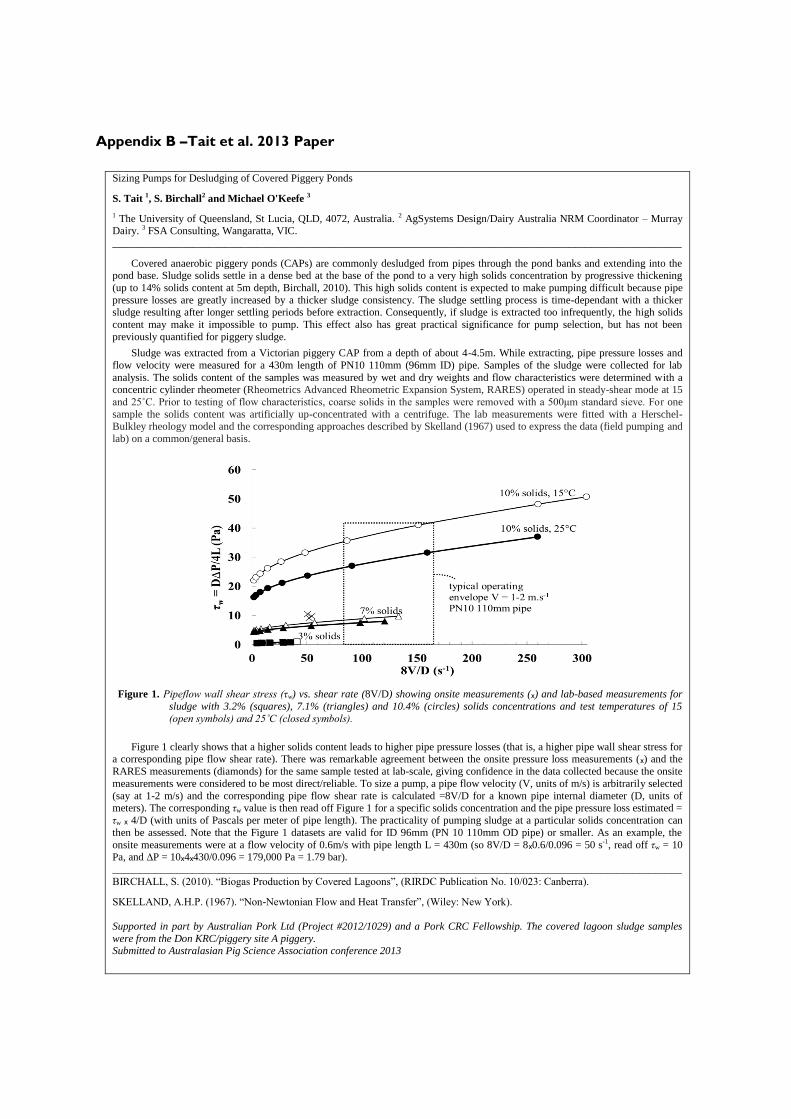
Appendix B –Tait et al. 2013 Paper
Sizing Pumps for Desludging of Covered Piggery Ponds
S. Tait 1, S. Birchall2 and Michael O'Keefe 3
1 The University of Queensland, St Lucia, QLD, 4072, Australia. 2 AgSystems Design/Dairy Australia NRM Coordinator – Murray Dairy. 3 FSA Consulting, Wangaratta, VIC.
___________________________________________________________________________________________________________
Covered anaerobic piggery ponds (CAPs) are commonly desludged from pipes through the pond banks and extending into the pond base. Sludge solids settle in a dense bed at the base of the pond to a very high solids concentration by progressive thickening
(up to 14% solids content at 5m depth, Birchall, 2010). This high solids content is expected to make pumping difficult because pipe
pressure losses are greatly increased by a thicker sludge consistency. The sludge settling process is time-dependant with a thicker sludge resulting after longer settling periods before extraction. Consequently, if sludge is extracted too infrequently, the high solids
content may make it impossible to pump. This effect also has great practical significance for pump selection, but has not been
previously quantified for piggery sludge.
Sludge was extracted from a Victorian piggery CAP from a depth of about 4-4.5m. While extracting, pipe pressure losses and
flow velocity were measured for a 430m length of PN10 110mm (96mm ID) pipe. Samples of the sludge were collected for lab
analysis. The solids content of the samples was measured by wet and dry weights and flow characteristics were determined with a concentric cylinder rheometer (Rheometrics Advanced Rheometric Expansion System, RARES) operated in steady-shear mode at 15
and 25˚C. Prior to testing of flow characteristics, coarse solids in the samples were removed with a 500μm standard sieve. For one
sample the solids content was artificially up-concentrated with a centrifuge. The lab measurements were fitted with a Herschel-Bulkley rheology model and the corresponding approaches described by Skelland (1967) used to express the data (field pumping and
lab) on a common/general basis.
Figure 1. Pipeflow wall shear stress (τw) vs. shear rate (8V/D) showing onsite measurements (ₓ) and lab-based measurements for
sludge with 3.2% (squares), 7.1% (triangles) and 10.4% (circles) solids concentrations and test temperatures of 15
(open symbols) and 25˚C (closed symbols).
Figure 1 clearly shows that a higher solids content leads to higher pipe pressure losses (that is, a higher pipe wall shear stress for a corresponding pipe flow shear rate). There was remarkable agreement between the onsite pressure loss measurements (ₓ) and the
RARES measurements (diamonds) for the same sample tested at lab-scale, giving confidence in the data collected because the onsite
measurements were considered to be most direct/reliable. To size a pump, a pipe flow velocity (V, units of m/s) is arbitrarily selected
(say at 1-2 m/s) and the corresponding pipe flow shear rate is calculated =8V/D for a known pipe internal diameter (D, units of meters). The corresponding τw value is then read off Figure 1 for a specific solids concentration and the pipe pressure loss estimated =
τw ₓ 4/D (with units of Pascals per meter of pipe length). The practicality of pumping sludge at a particular solids concentration can
then be assessed. Note that the Figure 1 datasets are valid for ID 96mm (PN 10 110mm OD pipe) or smaller. As an example, the
onsite measurements were at a flow velocity of 0.6m/s with pipe length L = 430m (so 8V/D = 8ₓ0.6/0.096 = 50 s-1, read off τw = 10 Pa, and ∆P = 10ₓ4ₓ430/0.096 = 179,000 Pa = 1.79 bar).
___________________________________________________________________________________________________________
BIRCHALL, S. (2010). “Biogas Production by Covered Lagoons”, (RIRDC Publication No. 10/023: Canberra).
SKELLAND, A.H.P. (1967). “Non-Newtonian Flow and Heat Transfer”, (Wiley: New York).
Supported in part by Australian Pork Ltd (Project #2012/1029) and a Pork CRC Fellowship. The covered lagoon sludge samples
were from the Don KRC/piggery site A piggery. Submitted to Australasian Pig Science Association conference 2013


Appendix C – Z-Filter Westpork Trial