slurry bubble column hydrodynamics - progress report - novica s. rados department of chemical...
TRANSCRIPT
SLURRY BUBBLE COLUMNSLURRY BUBBLE COLUMNHYDRODYNAMICSHYDRODYNAMICS
- Progress Report -
Novica S. RadosNovica S. Rados
Department of Chemical Engineering, CRELWashington University, St. Louis
April 12, 2001
CHEMICAL REACTION ENGINEERING LABORATORY
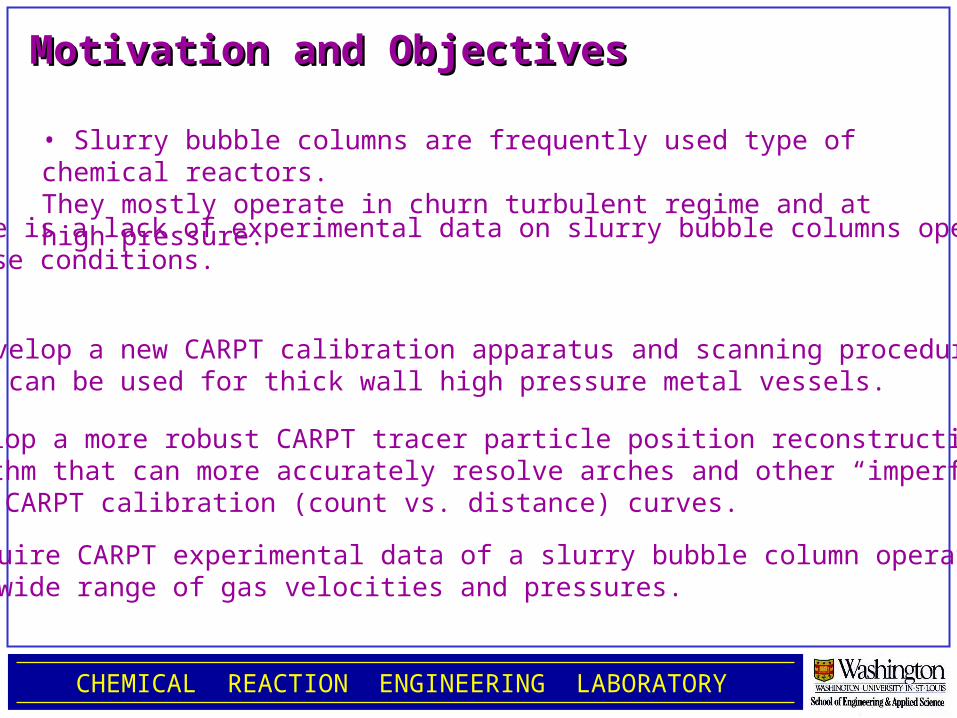
Motivation and ObjectivesMotivation and Objectives
• There is a lack of experimental data on slurry bubble columns operatedat these conditions.
• Develop a new CARPT calibration apparatus and scanning procedurethat can be used for thick wall high pressure metal vessels.
• Slurry bubble columns are frequently used type of chemical reactors.They mostly operate in churn turbulent regime and at high pressure.
• Develop a more robust CARPT tracer particle position reconstructionalgorithm that can more accurately resolve arches and other “imperfections”of the CARPT calibration (count vs. distance) curves.
• Acquire CARPT experimental data of a slurry bubble column operatedat a wide range of gas velocities and pressures.
CHEMICAL REACTION ENGINEERING LABORATORY
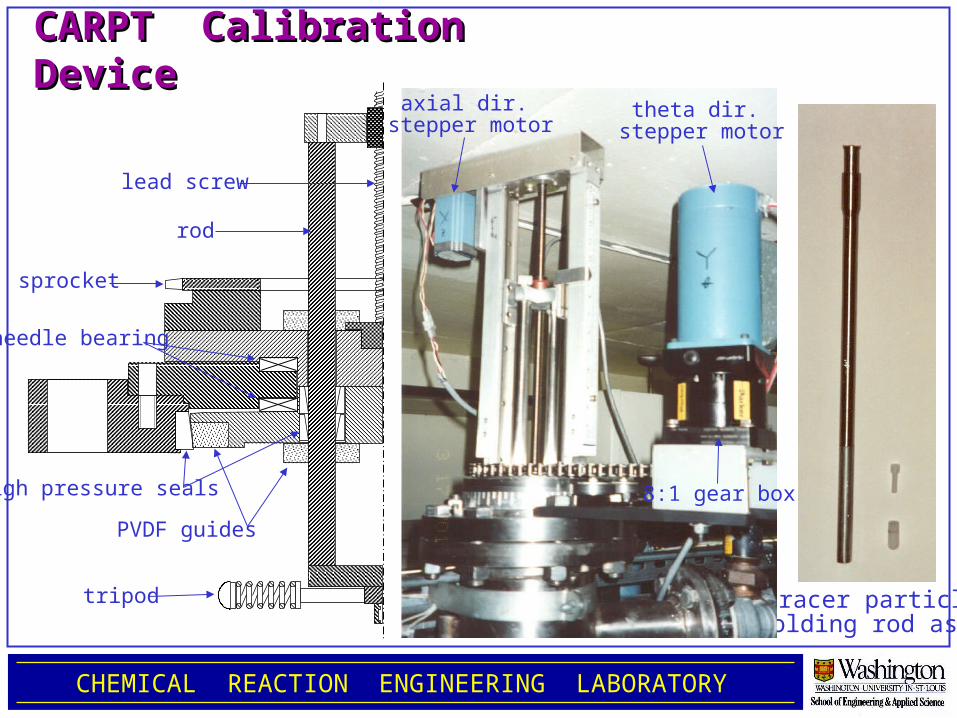
CARPT Calibration DeviceCARPT Calibration Device
tracer particleholding rod ass.
needle bearing
high pressure seals
PVDF guides
sprocket
tripod
rod
lead screw
theta dir. stepper motor
axial dir. stepper motor
8:1 gear box
CHEMICAL REACTION ENGINEERING LABORATORY
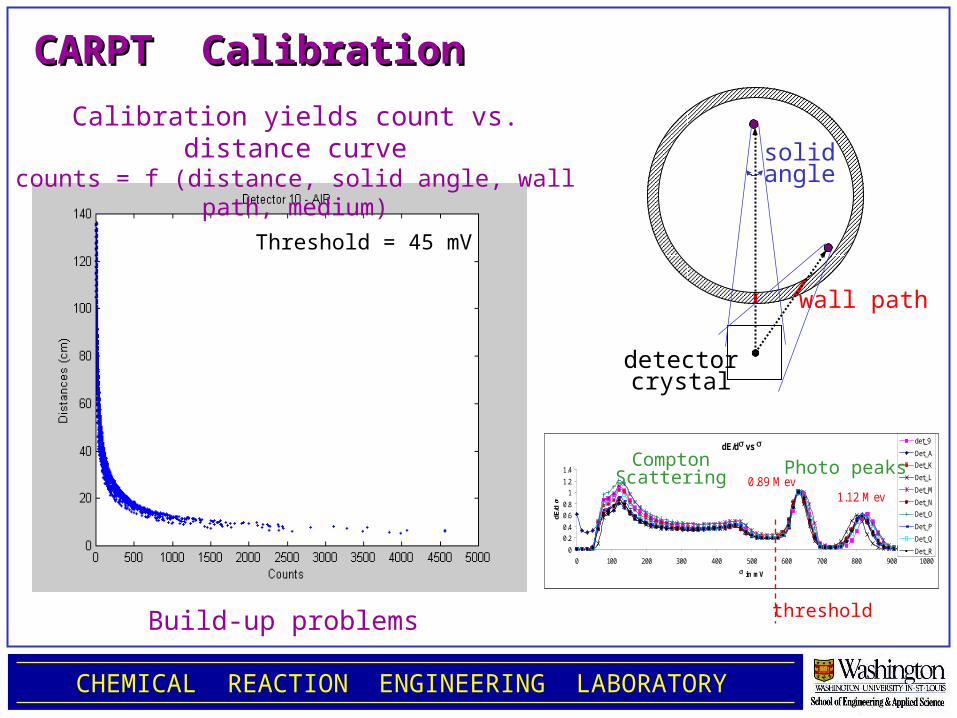
CARPT CalibrationCARPT Calibration
Calibration yields count vs. distance curvecounts = f (distance, solid angle, wall path,
medium)
dE/d vs
0
0.2
0.4
0.6
0.8
1
1.2
1.4
0 100 200 300 400 500 600 700 800 900 1000
in mV
dE/d
det_9
Det_A
Det_K
Det_L
Det_M
Det_N
Det_O
Det_P
Det_Q
Det_R
0.89 M ev1.12 M ev
dE/d vs
0
0.2
0.4
0.6
0.8
1
1.2
1.4
0 100 200 300 400 500 600 700 800 900 1000
in mV
dE/d
det_9
Det_A
Det_K
Det_L
Det_M
Det_N
Det_O
Det_P
Det_Q
Det_R
0.89 M ev1.12 M ev
thresholdBuild-up problems
wall path
detectorcrystal
solidangle
ComptonScattering Photo peaks
Threshold = 45 mV

CHEMICAL REACTION ENGINEERING LABORATORY
Spectrum StabilitySpectrum Stability
Acquisition of the photo peak fraction of the spectrum using a
high threshold
Stability of the Spectrum ?Spectrum f (source
strength)
Gupta:Spectrum = f (distance)
Rammohan:Spectrum = f (time)
0
0.1
0.2
0.3
0.4
0.5
550 600 650 700 750Energy, mV
Inte
nsi
ty
Det. 1 - airDet. 16 - airDet. 1 - waterDet. 16 - water
&Spectrum shifted slightly only when:
- distance was changed for more than 2 ft.- order of magnitude weaker particle was used
- gain wasn’t tuned over several daysrequired nearly ideal conditions
CHEMICAL REACTION ENGINEERING LABORATORY
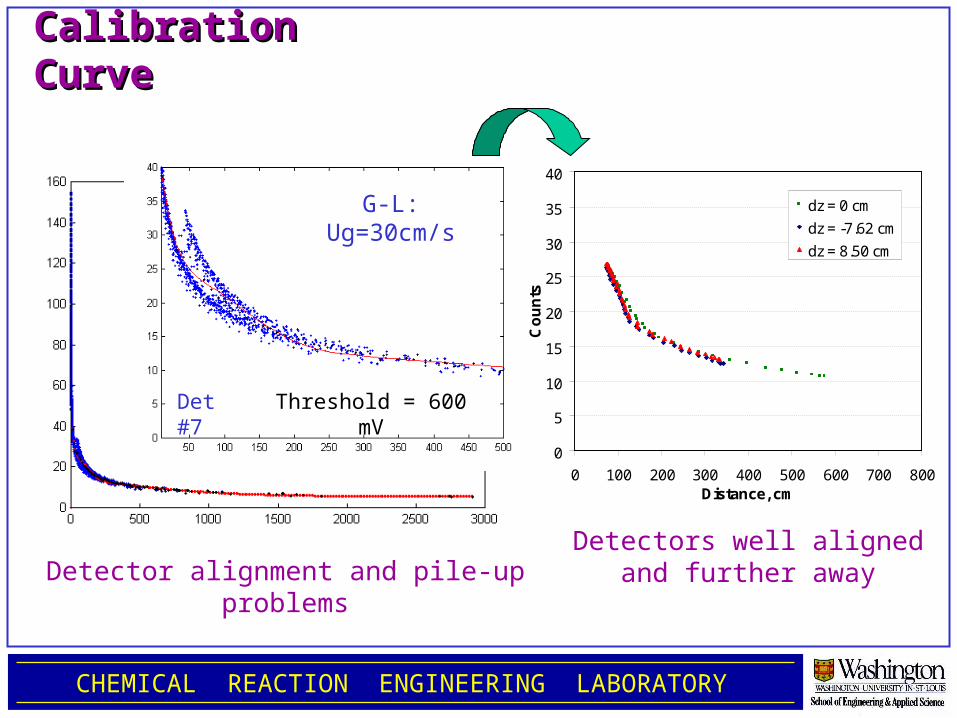
Calibration Calibration CurveCurve
Detector alignment and pile-up problems
Detectors well alignedand further away
0
5
10
15
20
25
30
35
40
0 100 200 300 400 500 600 700 800Distance, cm
Co
un
ts
dz = 0 cm
dz = -7.62 cm
dz = 8.50 cm
Threshold = 600 mV
G-L: Ug=30cm/s
Det #7
CHEMICAL REACTION ENGINEERING LABORATORY
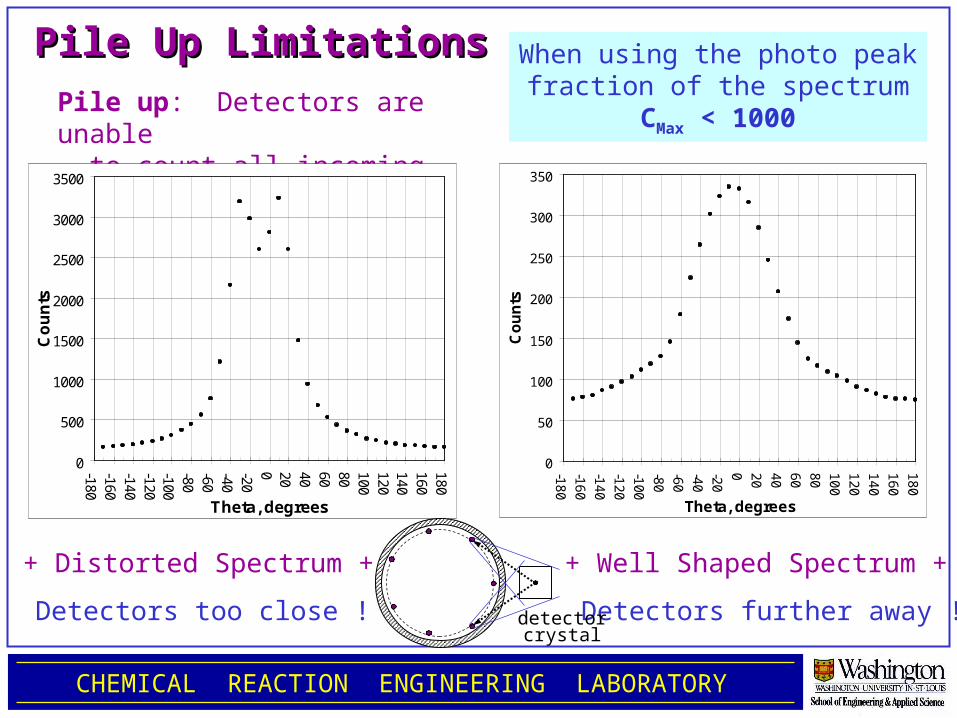
Pile Up LimitationsPile Up LimitationsPile up: Detectors are unable to count all incoming photons
0
500
1000
1500
2000
2500
3000
3500
-180-160-140-120-100-80-60-40-200 20 40 60 80 100120140160180
Theta, degrees
Co
un
ts
0
50
100
150
200
250
300
350
-18
0
-16
0
-14
0
-12
0
-10
0
-80
-60
-40
-20
0 20
40
60
80
10
0
12
0
14
0
16
0
18
0
Theta, degreesC
ou
nts
Detectors too close !
+ Distorted Spectrum +
Detectors further away !
+ Well Shaped Spectrum +
When using the photo peakfraction of the spectrum
CMax < 1000
detectorcrystal
8
12
16
20
24
28
0 100 200 300 400 500 600 700Counts
Dis
tan
ce
, cm
272 deg.
267 deg.
CHEMICAL REACTION ENGINEERING LABORATORY
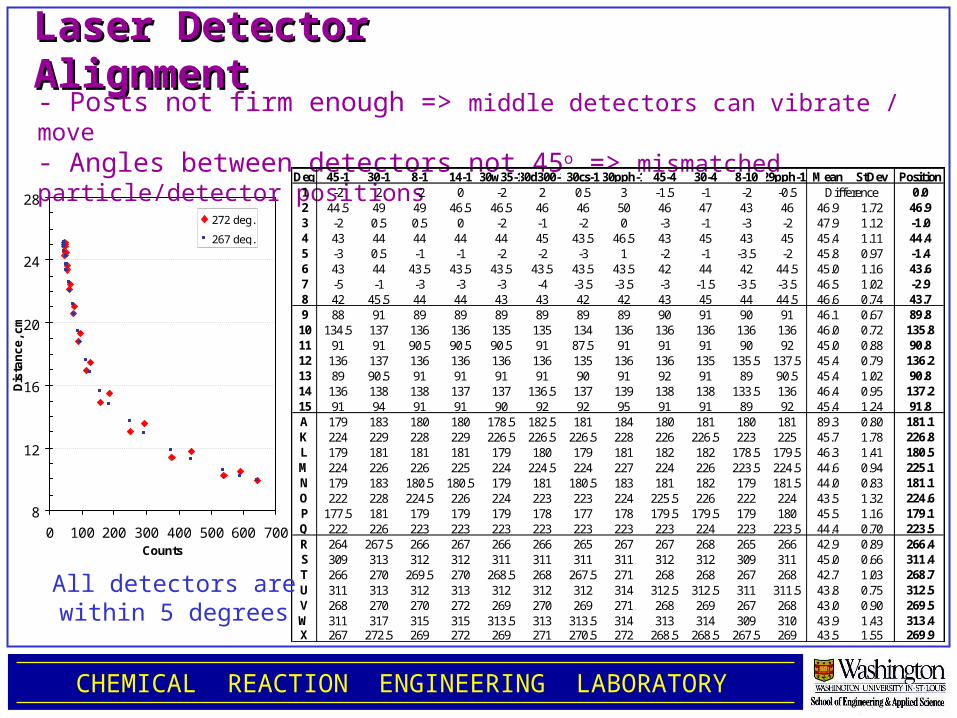
Laser Detector Laser Detector AlignmentAlignment- Posts not firm enough => middle detectors can vibrate / move- Angles between detectors not 45o => mismatched particle/detector positionsDeg. 45-1 30-1 8-1 14-1 30w35-130d300-130cs-1 30pph-1 45-4 30-4 8-10 29pph-10Mean StDev Position
1 -2 2 -2 0 -2 2 0.5 3 -1.5 -1 -2 -0.5 0.02 44.5 49 49 46.5 46.5 46 46 50 46 47 43 46 46.9 1.72 46.93 -2 0.5 0.5 0 -2 -1 -2 0 -3 -1 -3 -2 47.9 1.12 -1.04 43 44 44 44 44 45 43.5 46.5 43 45 43 45 45.4 1.11 44.45 -3 0.5 -1 -1 -2 -2 -3 1 -2 -1 -3.5 -2 45.8 0.97 -1.46 43 44 43.5 43.5 43.5 43.5 43.5 43.5 42 44 42 44.5 45.0 1.16 43.67 -5 -1 -3 -3 -3 -4 -3.5 -3.5 -3 -1.5 -3.5 -3.5 46.5 1.02 -2.98 42 45.5 44 44 43 43 42 42 43 45 44 44.5 46.6 0.74 43.79 88 91 89 89 89 89 89 89 90 91 90 91 46.1 0.67 89.810 134.5 137 136 136 135 135 134 136 136 136 136 136 46.0 0.72 135.811 91 91 90.5 90.5 90.5 91 87.5 91 91 91 90 92 45.0 0.88 90.812 136 137 136 136 136 136 135 136 136 135 135.5 137.5 45.4 0.79 136.213 89 90.5 91 91 91 91 90 91 92 91 89 90.5 45.4 1.02 90.814 136 138 138 137 137 136.5 137 139 138 138 133.5 136 46.4 0.95 137.215 91 94 91 91 90 92 92 95 91 91 89 92 45.4 1.24 91.8A 179 183 180 180 178.5 182.5 181 184 180 181 180 181 89.3 0.80 181.1K 224 229 228 229 226.5 226.5 226.5 228 226 226.5 223 225 45.7 1.78 226.8L 179 181 181 181 179 180 179 181 182 182 178.5 179.5 46.3 1.41 180.5M 224 226 226 225 224 224.5 224 227 224 226 223.5 224.5 44.6 0.94 225.1N 179 183 180.5 180.5 179 181 180.5 183 181 182 179 181.5 44.0 0.83 181.1O 222 228 224.5 226 224 223 223 224 225.5 226 222 224 43.5 1.32 224.6P 177.5 181 179 179 179 178 177 178 179.5 179.5 179 180 45.5 1.16 179.1Q 222 226 223 223 223 223 223 223 223 224 223 223.5 44.4 0.70 223.5R 264 267.5 266 267 266 266 265 267 267 268 265 266 42.9 0.89 266.4S 309 313 312 312 311 311 311 311 312 312 309 311 45.0 0.66 311.4T 266 270 269.5 270 268.5 268 267.5 271 268 268 267 268 42.7 1.03 268.7U 311 313 312 313 312 312 312 314 312.5 312.5 311 311.5 43.8 0.75 312.5V 268 270 270 272 269 270 269 271 268 269 267 268 43.0 0.90 269.5W 311 317 315 315 313.5 313 313.5 314 313 314 309 310 43.9 1.43 313.4X 267 272.5 269 272 269 271 270.5 272 268.5 268.5 267.5 269 43.5 1.55 269.9
Difference
All detectors arewithin 5 degrees
CHEMICAL REACTION ENGINEERING LABORATORY
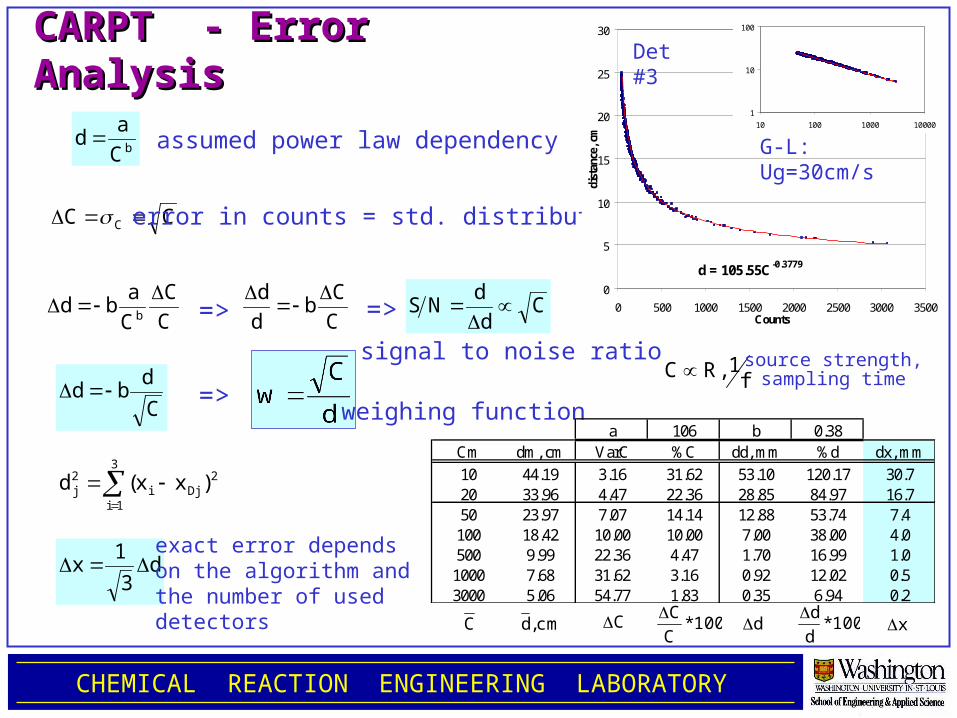
CARPT - Error AnalysisCARPT - Error Analysis
bC
ad
CC C
C
C
C
abd
b
C
Cb
d
d
C
d
dNS
C
dbd
=> =>
=>
3
1i
2Dji
2j )xx(d
d3
1x
assumed power law dependency
error in counts = std. distribution
weighing function
signal to noise ratio
exact error dependson the algorithm andthe number of useddetectors
a 106 b 0.38Cm dm, cm VarC %C dd, mm %d dx, mm
10 44.19 3.16 31.62 53.10 120.17 30.720 33.96 4.47 22.36 28.85 84.97 16.750 23.97 7.07 14.14 12.88 53.74 7.4
100 18.42 10.00 10.00 7.00 38.00 4.0500 9.99 22.36 4.47 1.70 16.99 1.0
1000 7.68 31.62 3.16 0.92 12.02 0.53000 5.06 54.77 1.83 0.35 6.94 0.2
C cm,d C 100*C
Cd 100*
d
dx
d = 105.55C-0.3779
0
5
10
15
20
25
30
0 500 1000 1500 2000 2500 3000 3500Counts
dist
ance
, cm
G-L: Ug=30cm/s
Det #3
1
10
100
10 100 1000 10000
f1,RC source strength,
sampling time
CHEMICAL REACTION ENGINEERING LABORATORY
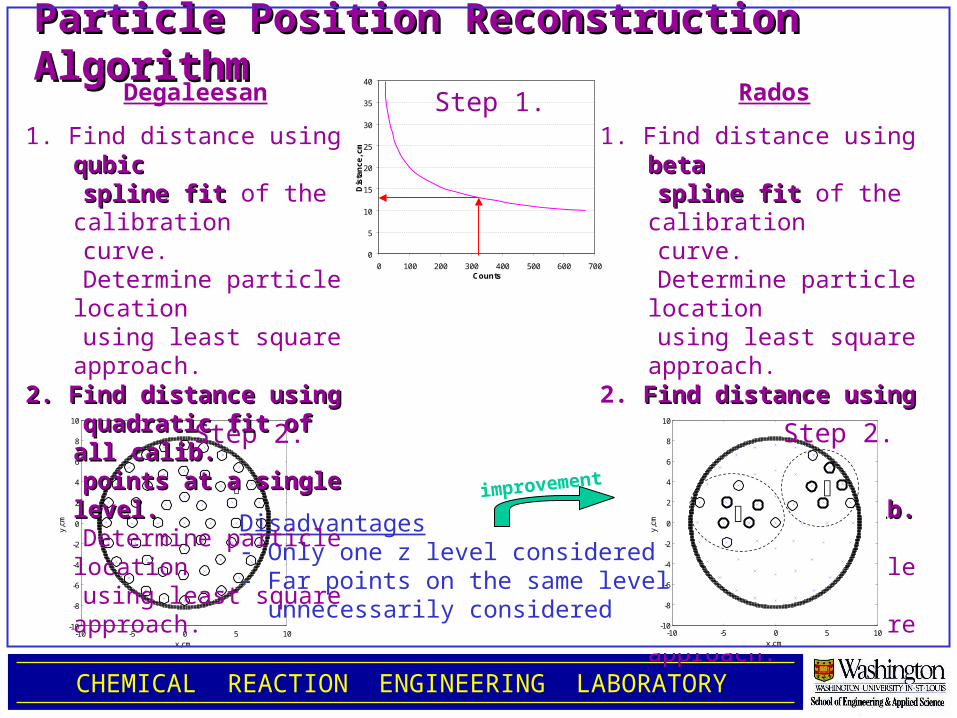
Particle Position Reconstruction Particle Position Reconstruction AlgorithmAlgorithm
0
5
10
15
20
25
30
35
40
0 100 200 300 400 500 600 700Counts
Dis
tan
ce
, cm
Rados
1. Find distance using beta beta spline fitspline fit of the
calibration curve. Determine particle
location using least square
approach.2. Find distance using Find distance using
powerpower law fit of the several law fit of the several surrounding calib. surrounding calib.
points.points. Determine particle
location using least square
approach.
Step 1.
-10 -5 0 5 10-10
-8
-6
-4
-2
0
2
4
6
8
10
x,cm
y,cm
-10 -5 0 5 10-10
-8
-6
-4
-2
0
2
4
6
8
10
x,cmy,
cm
Disadvantages
- Only one z level considered- Far points on the same level unnecessarily considered
Step 2. Step 2.
improvement
Degaleesan
1. Find distance using qubicqubic
spline fitspline fit of the calibration
curve. Determine particle
location using least square
approach.2. Find distance using2. Find distance using quadratic fit of all quadratic fit of all
calib.calib. points at a single points at a single
level.level. Determine particle
location using least square
approach.
CHEMICAL REACTION ENGINEERING LABORATORY
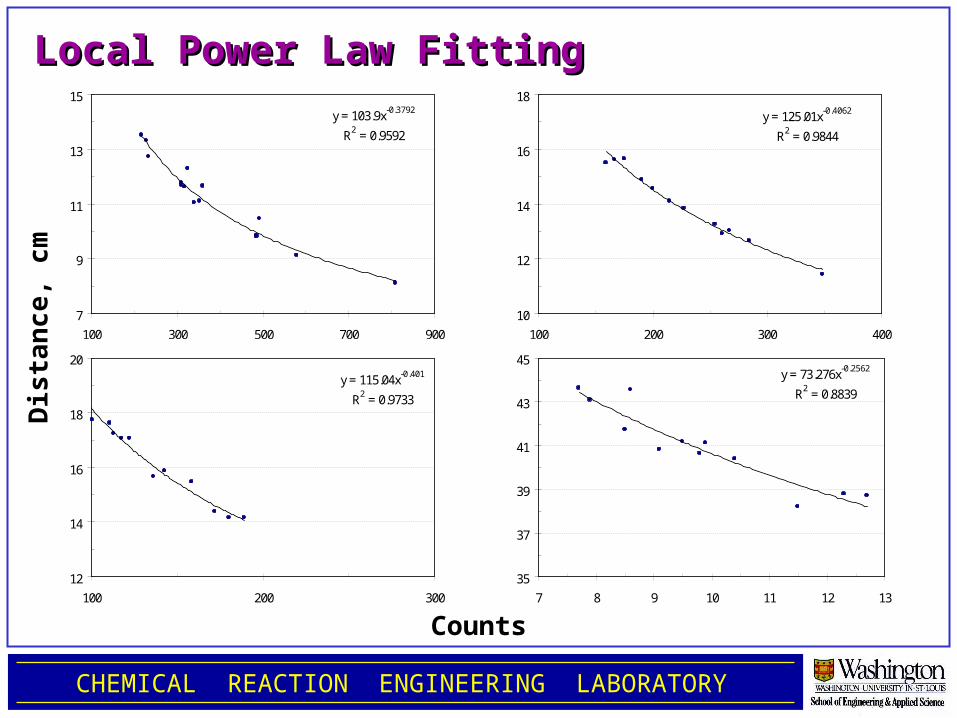
Local Power Law FittingLocal Power Law Fittingy = 103.9x-0.3792
R2 = 0.9592
7
9
11
13
15
100 300 500 700 900
y = 125.01x-0.4062
R2 = 0.9844
10
12
14
16
18
100 200 300 400
y = 115.04x-0.401
R2 = 0.9733
12
14
16
18
20
100 200 300
y = 73.276x-0.2562
R2 = 0.8839
35
37
39
41
43
45
7 8 9 10 11 12 13
Counts
Dis
tan
ce, c
m
CHEMICAL REACTION ENGINEERING LABORATORY
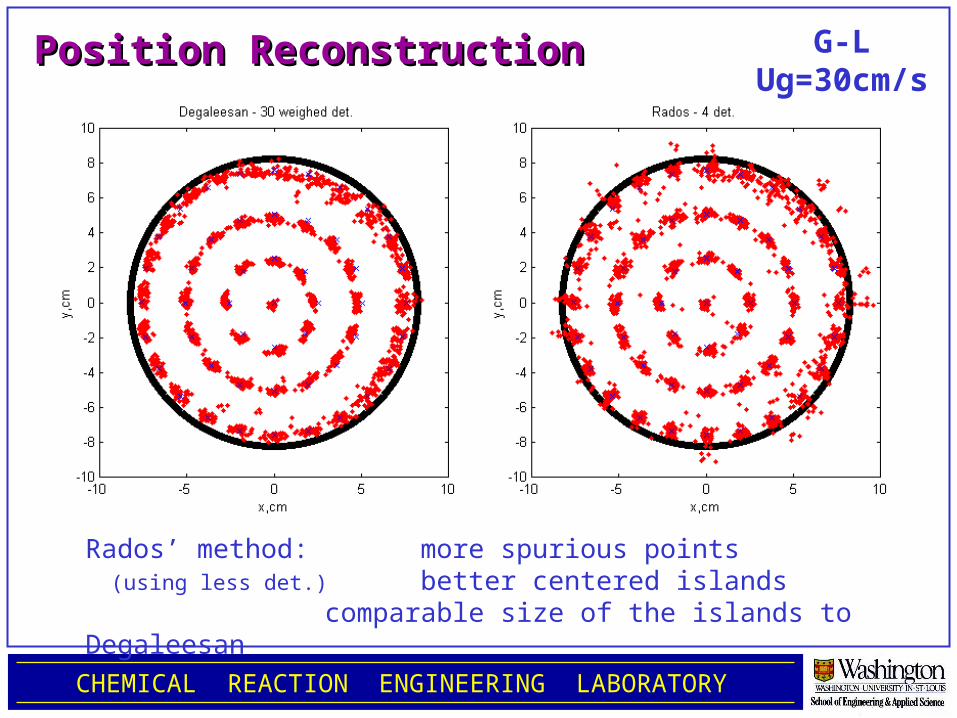
Position ReconstructionPosition Reconstruction
Rados’ method: more spurious points (using less det.) better centered islands
comparable size of the islands to Degaleesan
G-LUg=30cm/s
CHEMICAL REACTION ENGINEERING LABORATORY
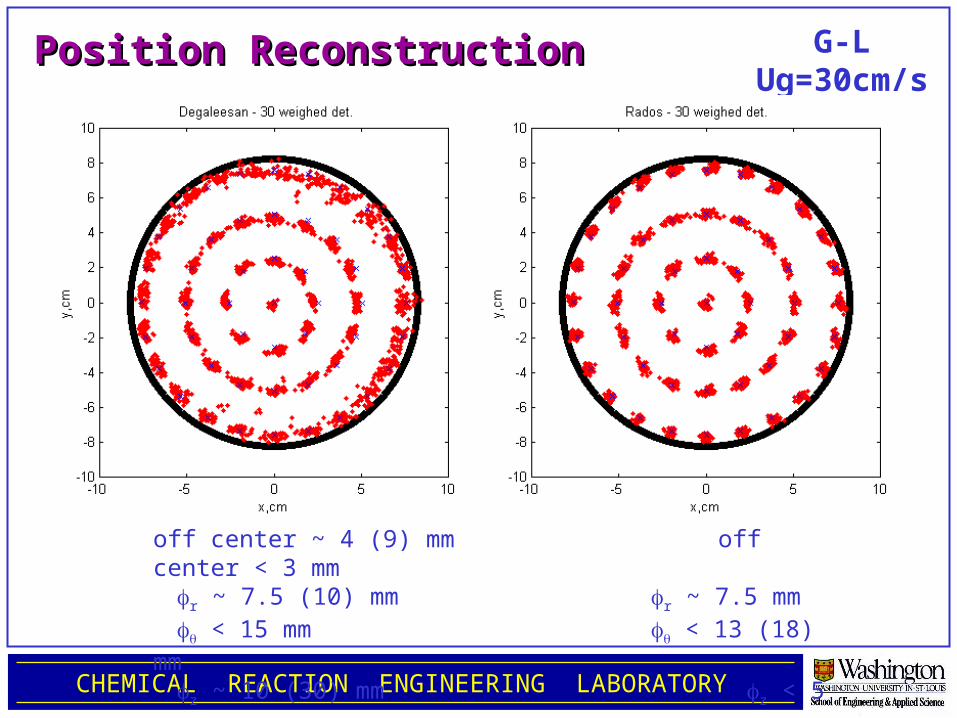
Position ReconstructionPosition Reconstruction
off center ~ 4 (9) mm off center < 3 mmr ~ 7.5 (10) mm r ~ 7.5 mm < 15 mm < 13 (18) mmz ~ 10 (30) mm z < 5 mm
G-LUg=30cm/s
CHEMICAL REACTION ENGINEERING LABORATORY
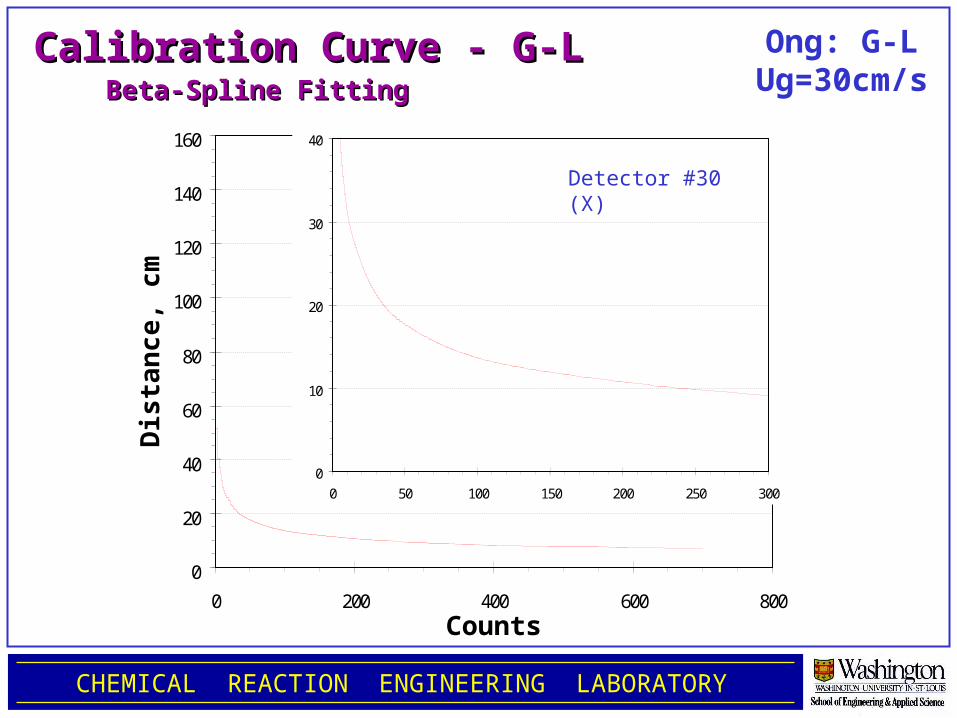
Calibration Curve - G-L Calibration Curve - G-L Beta-Spline FittingBeta-Spline Fitting
Ong: G-LUg=30cm/s
0
20
40
60
80
100
120
140
160
0 200 400 600 800
0
10
20
30
40
0 50 100 150 200 250 300
Detector #30 (X)
Dis
tan
ce, c
m
Counts
CHEMICAL REACTION ENGINEERING LABORATORY
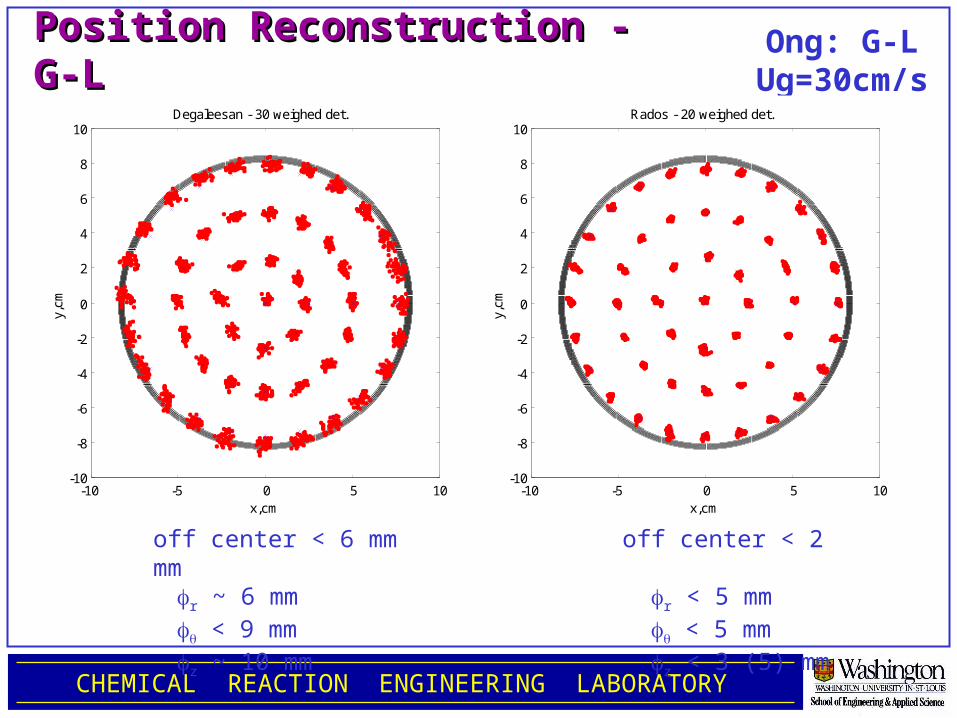
Position Reconstruction - Position Reconstruction - G-LG-L
off center < 6 mm off center < 2 mmr ~ 6 mm r < 5 mm < 9 mm < 5 mmz ~ 10 mm z < 3 (5) mm
Ong: G-LUg=30cm/s
-10 -5 0 5 10-10
-8
-6
-4
-2
0
2
4
6
8
10
x,cmy,
cm
Rados - 20 weighed det.
-10 -5 0 5 10-10
-8
-6
-4
-2
0
2
4
6
8
10
x,cm
y,cm
Degaleesan - 30 weighed det.
CHEMICAL REACTION ENGINEERING LABORATORY
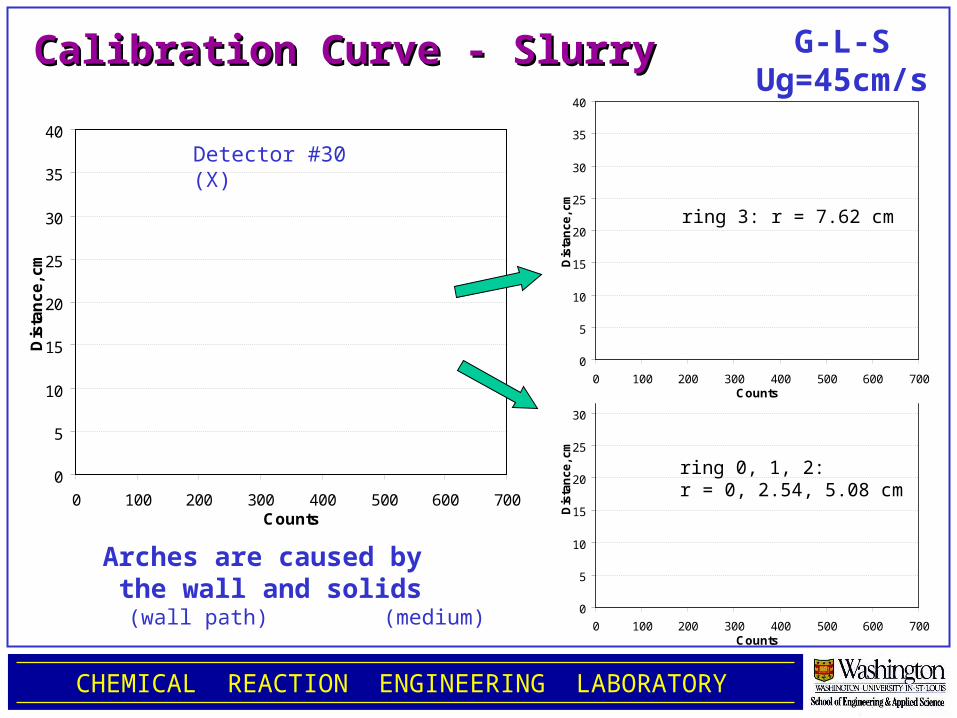
Calibration Curve - SlurryCalibration Curve - Slurry
0
5
10
15
20
25
30
35
40
0 100 200 300 400 500 600 700Counts
Dis
tan
ce
, cm
0
5
10
15
20
25
30
35
40
0 100 200 300 400 500 600 700Counts
Dis
tan
ce
, cm
ring 3: r = 7.62 cm
ring 0, 1, 2:r = 0, 2.54, 5.08 cm
0
5
10
15
20
25
30
35
40
0 100 200 300 400 500 600 700Counts
Dis
tan
ce
, cm
Arches are caused by the wall and solids (wall path) (medium)
G-L-SUg=45cm/s
Detector #30 (X)
CHEMICAL REACTION ENGINEERING LABORATORY
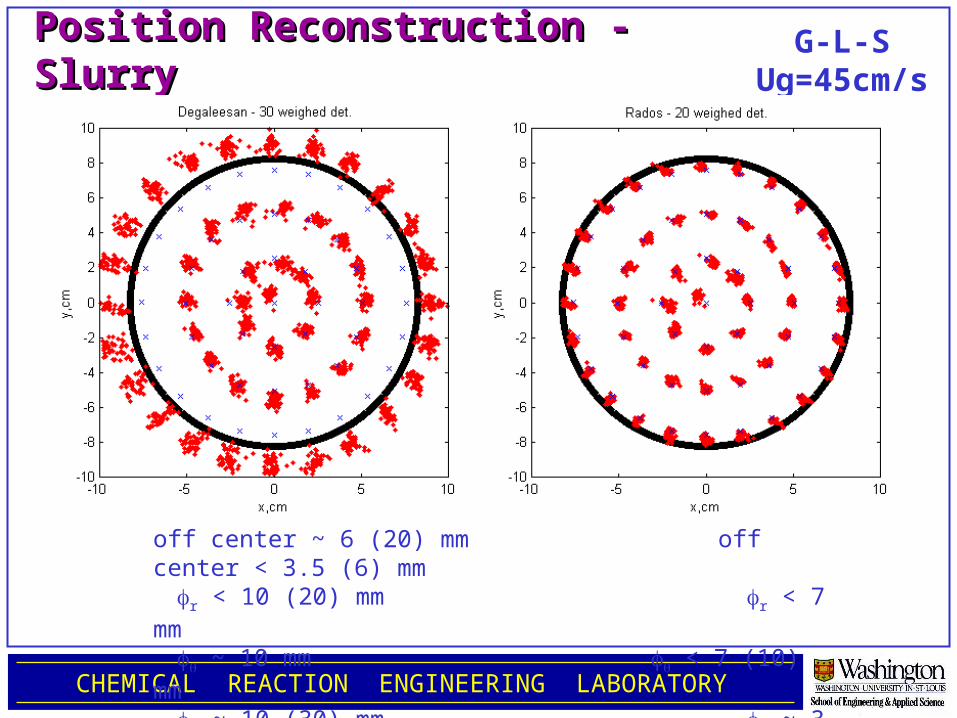
Position Reconstruction - SlurryPosition Reconstruction - Slurry
off center ~ 6 (20) mm off center < 3.5 (6) mmr < 10 (20) mm r < 7 mm ~ 10 mm < 7 (10) mmz ~ 10 (30) mm z ~ 3 (10) mm
G-L-SUg=45cm/s
CHEMICAL REACTION ENGINEERING LABORATORY
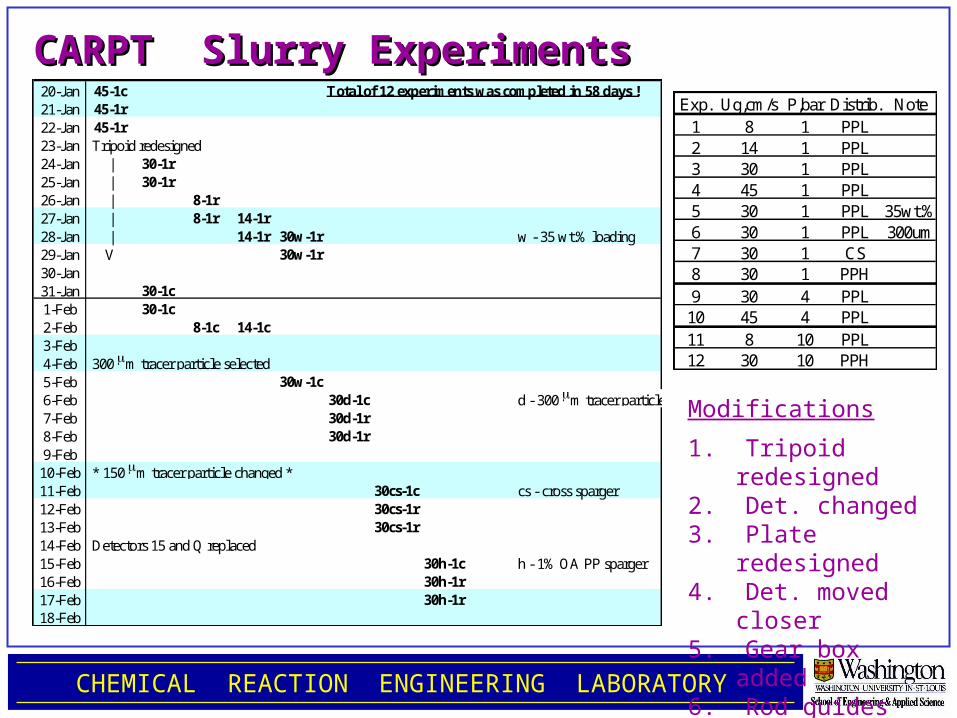
CARPT Slurry ExperimentsCARPT Slurry Experiments20-Jan 45-1c Total of 12 experiments was completed in 58 days !21-Jan 45-1r22-Jan 45-1r23-Jan Tripoid redesigned24-Jan | 30-1r25-Jan | 30-1r26-Jan | 8-1r27-Jan | 8-1r 14-1r28-Jan | 14-1r 30w-1r w - 35 wt.% loading29-Jan V 30w-1r30-Jan31-Jan 30-1c1-Feb 30-1c2-Feb 8-1c 14-1c3-Feb4-Feb 300 m tracer particle selected5-Feb 30w-1c6-Feb 30d-1c d - 300 m tracer particle7-Feb 30d-1r8-Feb 30d-1r9-Feb
10-Feb * 150 m tracer particle changed *11-Feb 30cs-1c cs - cross sparger12-Feb 30cs-1r13-Feb 30cs-1r14-Feb Detectors 15 and Q replaced15-Feb 30h-1c h - 1% OA PP sparger16-Feb 30h-1r17-Feb 30h-1r18-Feb
Modifications
1. Tripoid redesigned
2. Det. changed3. Plate
redesigned4. Det. moved
closer5. Gear box added6. Rod guides
added
Exp. Ug,cm/s P,bar Distrib. Note1 8 1 PPL2 14 1 PPL3 30 1 PPL4 45 1 PPL5 30 1 PPL 35wt.%6 30 1 PPL 300um7 30 1 CS8 30 1 PPH9 30 4 PPL10 45 4 PPL11 8 10 PPL12 30 10 PPH
CHEMICAL REACTION ENGINEERING LABORATORY
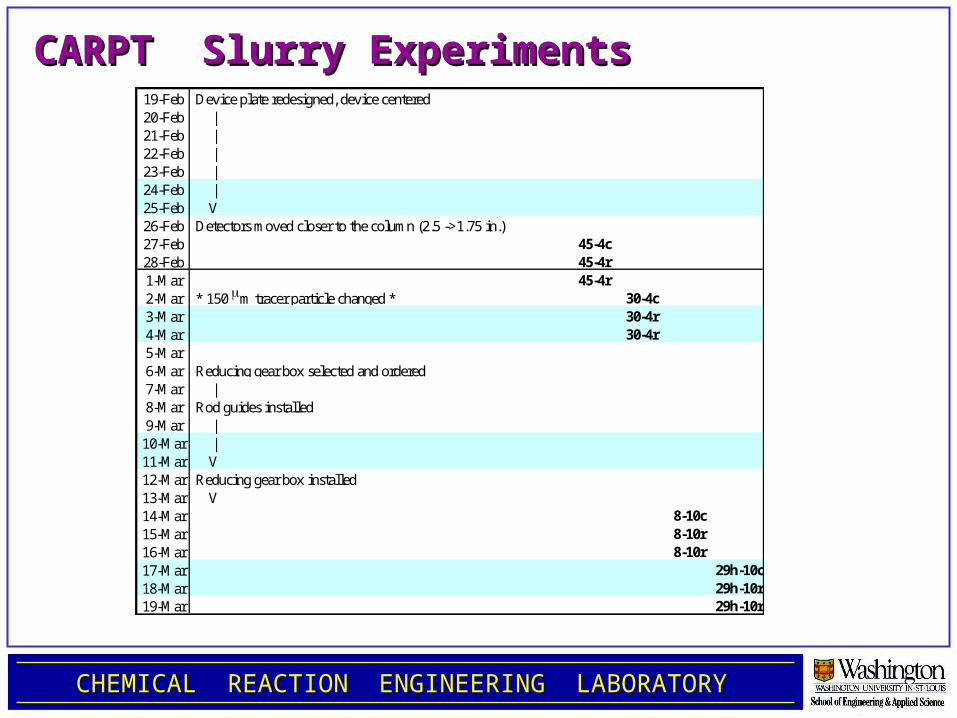
CARPT Slurry ExperimentsCARPT Slurry Experiments19-Feb Device plate redesigned, device centered20-Feb |21-Feb |22-Feb |23-Feb |24-Feb |25-Feb V26-Feb Detectors moved closer to the column (2.5 ->1.75 in.)27-Feb 45-4c28-Feb 45-4r1-Mar 45-4r2-Mar * 150 m tracer particle changed * 30-4c3-Mar 30-4r4-Mar 30-4r5-Mar6-Mar Reducing gear box selected and ordered7-Mar |8-Mar Rod guides installed9-Mar |10-Mar |11-Mar V12-Mar Reducing gear box installed13-Mar V14-Mar 8-10c15-Mar 8-10r16-Mar 8-10r17-Mar 29h-10c18-Mar 29h-10r19-Mar 29h-10r
CHEMICAL REACTION ENGINEERING LABORATORY
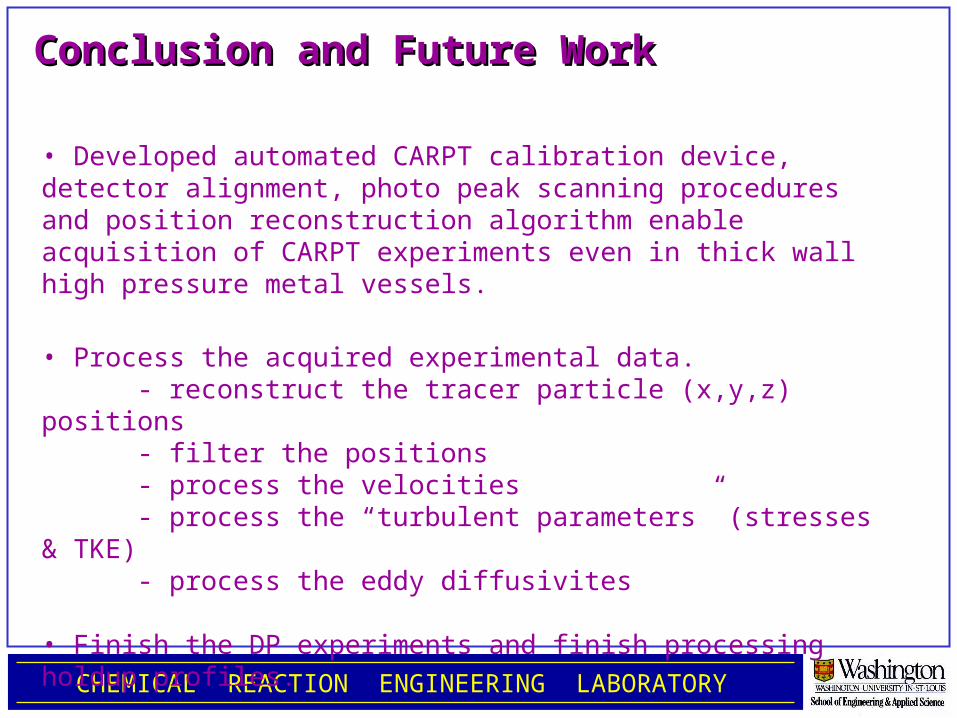
Conclusion and Future Conclusion and Future WorkWork
• Developed automated CARPT calibration device, detector alignment, photo peak scanning procedures and position reconstruction algorithm enable acquisition of CARPT experiments even in thick wall high pressure metal vessels.
• Process the acquired experimental data.- reconstruct the tracer particle (x,y,z) positions- filter the positions- process the velocities- process the “turbulent parameters” (stresses & TKE)- process the eddy diffusivites
• Finish the DP experiments and finish processing holdup profiles.