slurry rheology of industrial minerals and its effects on...
TRANSCRIPT
DOCTORA L T H E S I S
Luleå University of TechnologyDepartment of Chemical Engineering and Geosciences
Division of Mineral Processing
2007:44|: 402-544|: - -- 07⁄44 --
2007:44
Slurry Rheology of Industrial Minerals and Its Effects
on Wet Ultra-fine Grinding
Mingzhao He

DOCTORAL THESIS
Slurry Rheology of Industrial Minerals and Its
Effects on Wet Ultra-fine Grinding
Mingzhao He
Division of Mineral Processing
Department of Chemical Engineering and Geosciences
Luleå University of Technology, SE-971 87, Luleå, Sweden
December, 2007

To my wife and families
for their love and support


iii
Preface
The experimental work in this thesis was carried out during September, 2002 -
Febuary, 2005 and June, 2005 - March, 2006 at the Division of Mineral Processing,
Luleå University of Technology (LTU), Sweden. This thesis and parts of papers 4 and
5 were written from May, 2006 to June, 2007 in Adelaide, Australia. The financial
support is acknowledged from the Swedish National Energy Administration and
Hesselmanska Stiftelsen in Sweden (MinFo’s Process Technology Program) for my
licentiate studies (September, 2002 - Febuary, 2005) and from LKAB and Agricola
Research Center (ARC), Luleå University of Technology, Sweden for my Ph.D
studies (June, 2005 - March, 2006).
I would like to express my sincere gratitude to my supervisor, Professor Eric
Forssberg, for giving me the opportunity to pursue my studies here and for his
encouragement and guidance. I cordially appreciate my co-supervisor, Dr. Yanmin
Wang, for his encouragement, guidance and valuable suggestions on my work during
my licentiate studies, and for his continuous attention during my Ph.D studies, and for
his precious time to go through this thesis and give me valuable comments. I would
also like to take this opportunity to thank my former supervisor, Professor Yuexin
Han, for his continuous care and encouragement during my studies both in Sweden
and in China.
I also acknowledge Professor Anders Sellgren at Division of Water Technology,
Luleå University of Technology for his fruitful discussion, valuable suggestions and
kind help. I am grateful to Dr. Britt-Marie Antti, Ms. Christina Lindgren and Ms.
Susanne Lundberg at Kappa Kraftliner, Piteå, Sweden for their cordial help in the
measurements of slurry rheology. Mr Anders Hägglund at LKAB is thanked for
providing quartzite sample and fruitful discussion.
I would like to give my thanks to Mr Ulf Nordström for his help in some
experimental work, to Dr. Bertil Pålsson and Mrs Siv Tewolde Berhan for their help.
My sincere gratitude also goes to Dr. Qixing Yang for his kind help in my daily life
and to Tekn. Lic. Jirang Cui for his chatting and help as well.
I wish to convey my thanks to all my friends and colleagues at Department of
Chemical Engineering and Geosciences for their attentions, smiles and help.
I am deeply indebted to my parents and my two young sisters for their selfless love,
unconditional support and everything else they have been bestowing upon me.

iv
Last but not least, I would like to express my deepest gratitude to my beloved wife,
Mrs Yongchao Hu, for her continuous tolerance, unconditional support,
encouragement and burden of housework and looking after our lovely son, Peiheng
solely. The thesis is the cost of sacrificing my lovely son’s interests. I honestly say
“Sorry” to you both. Without you, I would not have been able to complete this work.
Mingzhao He
June, 2007 in Adelaide, Australia
v
Abstract
This thesis investigates slurry rheology of industrial minerals (limestone and
quartzite) and its effects on wet ultra-fine grinding in order to reduce energy cost,
increase the throughput as well as the product fineness.
The influences of solid concentration, molecular weight of a dispersant, and
particle size and distribution on the rheological behaviour of original limestone
slurries have been investigated. The results reveal that when the solid concentration of
a limestone slurry (< 100 m) is increased from 60 wt.% (35.71 vol.%) to 78.5 wt.%
(57.49 vol.%), the rheological behaviour of the slurry is transformed from a weakly
dilatant or Newtonian characteristic to a pseudoplastic one with a yield stress, which
is in combination with a thixotropic property at a higher solid concentration (i.e., 75
wt.% or 52.63 vol.%). At a certain shear rate, the apparent viscosity and the relative
viscosity of the slurry both increase exponentially with solid concentration. The
extrapolated Casson yield stress increases in a power-law form with increasing solid
concentration when the solid concentration is larger than 70 wt.% (i.e., 46.36 vol.%).
The maximum attainable packing solid fraction ( m) is predicted as 64.6 vol.% at the
limestone-water suspension.
A polymeric dispersant named Dispersant S40 with a molecular weight of 5,500 Da
appears most efficient for the reduction of the apparent viscosity of limestone slurry.
The smaller the particle size and the narrower the size distribution, the more evident
the pseudoplastic behaviour of limestone slurry is with a higher yield stress and a
larger apparent viscosity at a given shear rate in the range 12 - 1200 s-1. However, a
sufficient addition dosage of Dispersant S40 significantly decreases or even
eliminates the rheological differences of limestone slurries (apparent viscosity and
extrapolated yield stress) resulting from differences in particle size and distribution.
Wet ultra-fine grinding of a limestone material (< 100 m) has been investigated in
a stirred media mill with respect to the effect of slurry rheology. The results obtained
by varying operation parameters (i.e., molecular weight of a dispersant, solid
concentration, addition dosage, addition method and bead load) are evaluated in terms
of energy efficiency and the fineness. Dispersant S40 gives the superior results
compared to the other dispersants (i.e., BCX-476 and BCX-552). For a certain level
of bead load, an optimal solid concentration exists for more effective grinding. At 0.1
vi
wt. % of addition dosage of Dispersant S40 or more ( 0.6 wt.%), a smaller addition
amount of Dispersant S40 leads to a higher energy efficiency and a smaller median
size at a lower level of specific energy input. However, the excessive amount of the
dispersant causes the grinding less efficient. This can be avoided by either the multi-
point addition of the dispersant or a higher bead load ( 83 vol. %).
The role of slurry rheology in stirred media milling of quartzite has also been
performed by varying important grinding parameters such as media bead density,
addition of chemicals, solid concentration, stirrer rotational speed as well as the
combined effect of these factors. Media bead density has an evident but complex
effect on stirred milling performance, depending on stirrer rotational speed and solid
concentration. Addition of Dispersant S40 or a lower solid concentration results in
better grinding performance (i.e., a higher energy efficiency and a smaller median size)
due to maintenance of lower viscosities at shear rates investigated during grinding.
Stirrer rotational speed interacts with solid concentration. For a given solid
concentration, an optimal stirrer speed exists. The observed phenomena can be
explained by the effect of slurry rheology on the stress intensity of individual grinding
bead.
The flowability of ground limestone slurries during grinding has been monitored
and characterized. The rheological behaviour of ground limestone slurries varies with
grinding from a starting dilatant flowability to a resultant pseudoplastic one with an
evident Casson yield stress in combination with a thixotropic character. The
appearance of pseudoplastic flowability with a thixotropy is related to the fineness of
a ground product and its specific surface area, which are both correlated to solid
concentration and the addition amount of Dispersant S40. However, the rheological
characterization of time-dependent fluids is dependent upon the instruments used and
operating conditions.
In addition, an empirical particle size-energy model provides a good fit to the wet
ultra-fine grinding results for both limestone and quartzite under the experimental
conditions investigated.
Keywords: Slurry rheology; Non-Newtonian flowability; Limestone; Quartzite,
Stirred media mill; Wet ultra-fine grinding; Ultra-fine particles; Solid concentration;
Dispersant; Molecular weight; Particle size and distribution; Milling media bead.
vii
List of publications
This thesis is based on the work contained in the following five articles:
1. Slurry rheology in wet ultra-fine grinding of industrial minerals: A review Mingzhao He, Yanmin Wang and Eric Forssberg Powder Technology 147 (2004) 94-112.
2. Parameter studies on the rheology of limestone slurries Mingzhao He, Yanmin Wang and Eric Forssberg International Journal of Mineral Processing 78 (2006) 63-77.
3. Parameter effects on wet ultrafine grinding of limestone through slurry rheology in a stirred media mill Mingzhao He, Yanmin Wang and Eric Forssberg Powder Technology 161 (2006) 10-21.
4. Influence of slurry rheology on stirred media milling of quartziteMingzhao He and Eric Forssberg, International Journal of Mineral Processing (2007), in press.
5. Rheological behaviors in wet ultrafine grinding of limestoneM. He and E. Forssberg Minerals and Metallurgical Processing 2007 (24) 19-29.
(Contribution to the included paper 1-5: Most of the work was done by the author with supervision and comments by the co-authors of the papers.)
During my postgraduate studies, the following articles were authored or co-authored but not included in this thesis
1. Mingzhao He and Eric Forssberg; Rheological behaviours in stirred media milling of limestone, International Mineral Processing Congress, Vol. 1, Istanbul, September, Turkey, 2006, pp 75-80.
2. Mingzhao He and Eric Forssberg; Influence of slurry rheology on stirred media milling of limestone, 2006 SME Annual conference-Advances in Comminution, v2006, St. Louis, Missouri, USA, 2006, pp. 243-260.
3. Mingzhao He, Eric Forssberg, Yanmin Wang and Yuexin Han; Ultrasonication-assisted synthesis of calcium carbonate nano-particles, Chemical Engineering Communications, 192 (2005) 1468-1481.
4. Qixing Yang, Nedar Lotta, Engstrom Fredrik, and Mingzhao He, Treatments of AOD slag to produce aggregates for road construction, AISTech 2006-Proceedings of the Iron and Steel Technology Conference, Vol. 1, May 2006, Clevekand, Ohio, 2006, pp. 573-583.

viii
5. Qixing Yang, Fredrik Engström, Mia Tossavainen, Mingzhao He and Zheng Wang; AOD slag treatments to recover metal and prevent slag dusting, 7th Nordic-Japan Symposium Science and Technology of Process Metallurgy, Stockholm, Sweden, Spetember, 2005, pp. 23:1-23:14
ix
Contents
1 Introduction………………………………………………………………....1
1.1 Slurry rheology and its characterization……………………………….....1
1.2 Grinding mechanisms in stirred media mills…………………………......2
1.3 Role of slurry rheology in wet ultra-fine grinding……………………......5
1.4 Aims and objectives…………...……………………………………….....6
2 Materials……………………………………………………………………..7
3 Experimental methods and data analysis…………………….……...9
3.1 Experimental methods……………………………………………………9
3.1.1 Mixing……………………………………………………………...9
3.1.2 Grinding experiments in a stirred media mill…………………….10
3.1.3 Measurements…………………………………………………….10
3.2 Calculations of specific energy consumption and energy efficiency …..14
3.2.1 Specific energy consumption………….………………………….14
3.2.2 Energy efficiency………………………………………………....15
3.3 Reproducibility of experimental data……………………………….......16
3.3.1 Rheological measurements………………………………..............16
3.3.2 Grinding results……………………………………………….......16
4 Results and discussion………………………………………………..…..18
4.1 Slurry rheology …………….…………………………………………....18
4.1.1 Effect of solid concentration…………….………………………...18
4.1.2 Effect of molecular weight of a dispersant………………………..24
4.1.3 Effect of particle size and distribution…………………………….28
4.2 Effect of slurry rheology on wet ultra-fine grinding…………………......31
4.2.1 Limestone…………….……………………………………………31
4.2.1.1 Effect of molecular weight of a dispersant……….………..31
4.2.1.2 Effect of solid concentration………..………….………….34
4.2.1.3 Effect of addition dosage of Dispersant S40……………....37
4.2.1.4 Effect of addition method of Dispersant S40…………..….40
x
4.2.1.5 Effect of bead load………………………………………..41
4.2.2 Quartzite…………….………………………………………….…43
4.2.2.1 Effect of media bead density…………………………...…43
4.2.2.2 Effect of chemical..…………………………………….….47
4.2.2.3 Effect of solid concentration…………..…………………..48
4.2.2.4 Effect of stirrer rotational speed…………………………..50
4.3 Rheological behaviour in wet ultra-fine grinding………………………..52
4.3.1 Effect of solid concentration……………………………………….53
4.3.2 Effect of addition amount of Dispersant S40………………………56
4.4 Comparison of rheological results obtained by different viscometers…...59
4.5 Empirical prediction……………………………………………………...60
5 Conclusions………………………………………………………………….61
Recommendations for future work……………………………………...63
References……………………………………………………………………...64
AppendixPaper 1
Paper 2
Paper 3
Paper 4
Paper 5
1
Dilatant
Pseudoplastic
Shea
r st
ress
Rate of Shear
Bingham plastic
Pseudoplasticwith yield
Newtonian
1 Introduction
1.1 Slurry rheology and its characterization
Rheology is a science of deformation and flow of materials (Tanner, 2000;
Whorlow, 1992). The principal theoretical concepts are kinematics, dealing with
geometrical aspects of deformation and flow; conservation laws, forces, stress and
energy interchanges; constitutive relations special to classes of bodies. The
constitutive relations, namely, the relationships between stress, strain and time for a
given test sample, serve to link motion and forces to complete the description of the
flow process, which may then be applied to solve engineering problems. There are the
Newtonian and non-Newtonian fluids based on the constitutive relations. For the
fluids, the apparent viscosity, , is defined by (Whorlow, 1992)
where is the shear stress and is the shear rate. The apparent viscosity, is a useful
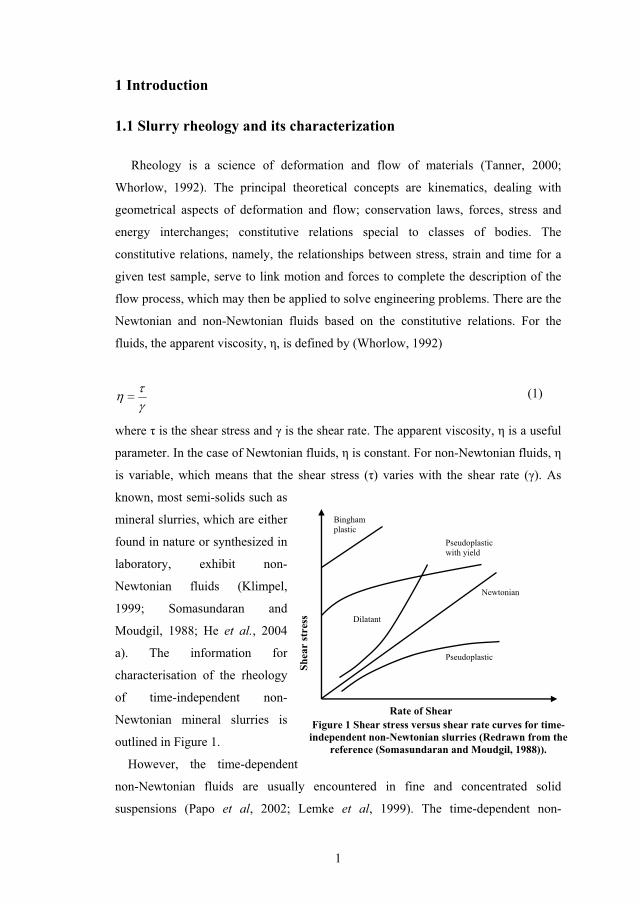
parameter. In the case of Newtonian fluids, is constant. For non-Newtonian fluids,
is variable, which means that the shear stress ( ) varies with the shear rate ( ). As
known, most semi-solids such as
mineral slurries, which are either
found in nature or synthesized in
laboratory, exhibit non-
Newtonian fluids (Klimpel,
1999; Somasundaran and
Moudgil, 1988; He et al., 2004
a). The information for
characterisation of the rheology
of time-independent non-
Newtonian mineral slurries is
outlined in Figure 1.
However, the time-dependent
non-Newtonian fluids are usually encountered in fine and concentrated solid
suspensions (Papo et al, 2002; Lemke et al, 1999). The time-dependent non-
(1)
Figure 1 Shear stress versus shear rate curves for time-independent non-Newtonian slurries (Redrawn from the
reference (Somasundaran and Moudgil, 1988)).
2
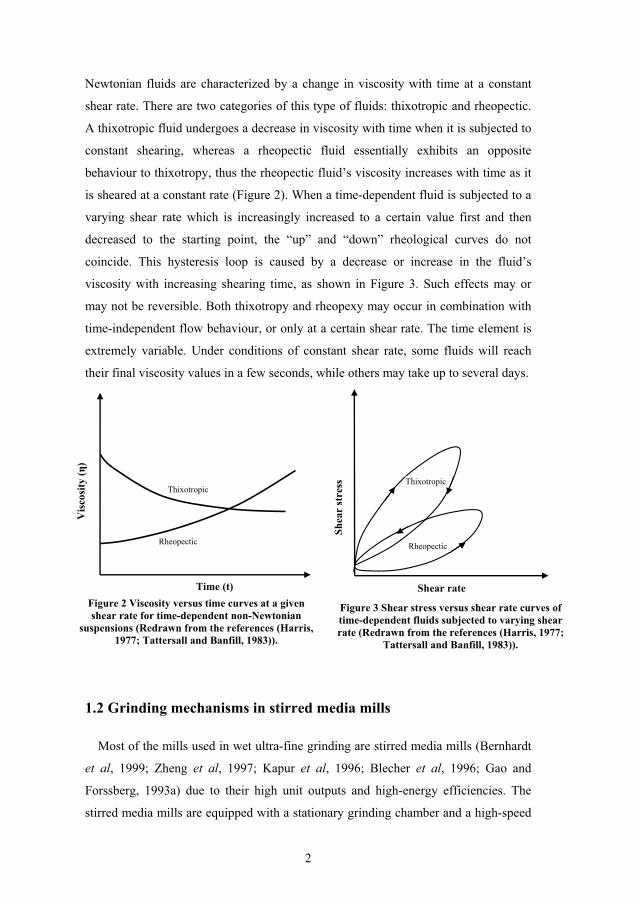
Newtonian fluids are characterized by a change in viscosity with time at a constant
shear rate. There are two categories of this type of fluids: thixotropic and rheopectic.
A thixotropic fluid undergoes a decrease in viscosity with time when it is subjected to
constant shearing, whereas a rheopectic fluid essentially exhibits an opposite
behaviour to thixotropy, thus the rheopectic fluid’s viscosity increases with time as it
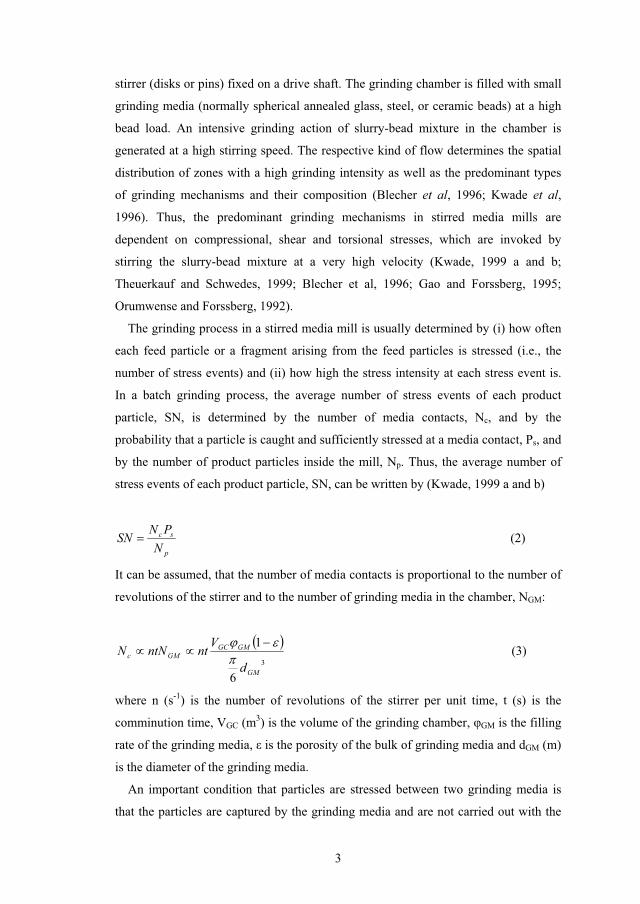
is sheared at a constant rate (Figure 2). When a time-dependent fluid is subjected to a
varying shear rate which is increasingly increased to a certain value first and then
decreased to the starting point, the “up” and “down” rheological curves do not
coincide. This hysteresis loop is caused by a decrease or increase in the fluid’s
viscosity with increasing shearing time, as shown in Figure 3. Such effects may or
may not be reversible. Both thixotropy and rheopexy may occur in combination with
time-independent flow behaviour, or only at a certain shear rate. The time element is
extremely variable. Under conditions of constant shear rate, some fluids will reach
their final viscosity values in a few seconds, while others may take up to several days.
1.2 Grinding mechanisms in stirred media mills
Most of the mills used in wet ultra-fine grinding are stirred media mills (Bernhardt
et al, 1999; Zheng et al, 1997; Kapur et al, 1996; Blecher et al, 1996; Gao and
Forssberg, 1993a) due to their high unit outputs and high-energy efficiencies. The
stirred media mills are equipped with a stationary grinding chamber and a high-speed
Thixotropic
Rheopectic
Time (t)
Vis
cosit
y (
)
Figure 2 Viscosity versus time curves at a given shear rate for time-dependent non-Newtonian
suspensions (Redrawn from the references (Harris, 1977; Tattersall and Banfill, 1983)).
Shear rate
Rheopectic
Thixotropic
Shea
r st
ress
Figure 3 Shear stress versus shear rate curves of time-dependent fluids subjected to varying shear rate (Redrawn from the references (Harris, 1977;
Tattersall and Banfill, 1983)).
3
stirrer (disks or pins) fixed on a drive shaft. The grinding chamber is filled with small
grinding media (normally spherical annealed glass, steel, or ceramic beads) at a high
bead load. An intensive grinding action of slurry-bead mixture in the chamber is
generated at a high stirring speed. The respective kind of flow determines the spatial
distribution of zones with a high grinding intensity as well as the predominant types
of grinding mechanisms and their composition (Blecher et al, 1996; Kwade et al,
1996). Thus, the predominant grinding mechanisms in stirred media mills are
dependent on compressional, shear and torsional stresses, which are invoked by
stirring the slurry-bead mixture at a very high velocity (Kwade, 1999 a and b;
Theuerkauf and Schwedes, 1999; Blecher et al, 1996; Gao and Forssberg, 1995;
Orumwense and Forssberg, 1992).
The grinding process in a stirred media mill is usually determined by (i) how often
each feed particle or a fragment arising from the feed particles is stressed (i.e., the
number of stress events) and (ii) how high the stress intensity at each stress event is.
In a batch grinding process, the average number of stress events of each product
particle, SN, is determined by the number of media contacts, Nc, and by the
probability that a particle is caught and sufficiently stressed at a media contact, Ps, and
by the number of product particles inside the mill, Np. Thus, the average number of
stress events of each product particle, SN, can be written by (Kwade, 1999 a and b)
p
sc
NPNSN (2)
It can be assumed, that the number of media contacts is proportional to the number of
revolutions of the stirrer and to the number of grinding media in the chamber, NGM:
3
6
1
GM
GMGCGMc
d
VntntNN (3)
where n (s-1) is the number of revolutions of the stirrer per unit time, t (s) is the
comminution time, VGC (m3) is the volume of the grinding chamber, GM is the filling
rate of the grinding media, is the porosity of the bulk of grinding media and dGM (m)
is the diameter of the grinding media.
An important condition that particles are stressed between two grinding media is
that the particles are captured by the grinding media and are not carried out with the
4
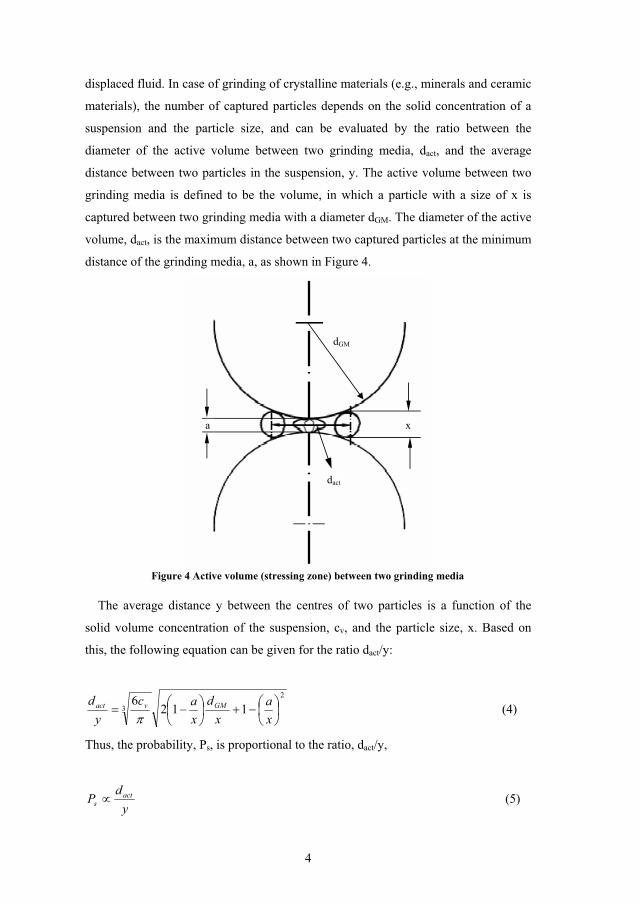
displaced fluid. In case of grinding of crystalline materials (e.g., minerals and ceramic
materials), the number of captured particles depends on the solid concentration of a
suspension and the particle size, and can be evaluated by the ratio between the
diameter of the active volume between two grinding media, dact, and the average
distance between two particles in the suspension, y. The active volume between two
grinding media is defined to be the volume, in which a particle with a size of x is
captured between two grinding media with a diameter dGM. The diameter of the active
volume, dact, is the maximum distance between two captured particles at the minimum
distance of the grinding media, a, as shown in Figure 4.
The average distance y between the centres of two particles is a function of the
solid volume concentration of the suspension, cv, and the particle size, x. Based on
this, the following equation can be given for the ratio dact/y:
2
3 1126
xa
xd
xac
yd GMvact (4)
Thus, the probability, Ps, is proportional to the ratio, dact/y,
yd
P acts (5)
Figure 4 Active volume (stressing zone) between two grinding media
a
dact
dGM
x

5
The number of product particles is proportional to the overall volume of the product
particles and can be given as follows:
vGMGCpp cVVN ))1(1( (6)
Combination of Equations (2)-(6), the average number of stress events of each
product particle for the grinding of crystalline materials is given by
yd
dnt
cSN act
GMvGM
GM3))1(1(
)1( (7)
For the elasticity of a feed material, such as limestone, is much smaller than that of
the grinding media, the stress intensity (SI) in stirred media mills is proportional to
the third power of the media diameter, dGM, and the square of the circumferential
velocity of the stirring discs, vt, and the media density, GM. The detailed deduction
has been discussed in the literature (Kwade, 1999 b). Therefore, the stress intensity,
SI, is given by
23tGMGM vdSI (8)
1.3 Role of slurry rheology in wet ultra-fine grinding
The effective motions of slurry-bead mixture are much related to its flow behaviour
in the grinding chamber. The optimisation of the rheological behaviour of a ground
slurry can enhance energy efficiency and throughput in wet ultra-fine grinding
operation. From a diagnostic point of view, the rheological behaviour of a mineral
slurry is indicative of the level of interparticle interaction or aggregation in the slurry
(Muster and Prestidge, 1995). Therefore, slurry rheology is a useful variable to be
controlled in industrial processes such as transportation of slurries, dewatering and
wet grinding.
Since the product fineness significantly increases with grinding time in wet ultra-
fine grinding operation characterized by a very fine product size and a high solid
concentration, the surface properties tend to predominate in the system (Bernhardt et
al., 1999; Zheng et al., 1997; Klimpel, 1999). Inter-particle forces, such as van der
Waals forces (Greenwood et al., 2002; Reinisch et al., 2001a) and electrostatic forces
6
(Bernhardt et al., 1999; Muster and Prestidge, 1995), lead to the formation of
agglomeration and aggregation. This results in changes in rheological property of the
ground slurry in wet ultra-fine grinding. The role of slurry flowability in wet ultra-fine
grinding becomes particularly important. The optimization of the rheological
behaviour of a ground slurry can enhance the energy efficiency and throughput in wet
ultra-fine grinding operations. For instance, addition of an optimum dispersant to a
given feed slurry can result in a drastic reduction or even elimination of yield stress
and permits a higher solid concentration of the ground slurry (He et al., 2006b;
Klimpel, 1999; Greenwood et al., 2002; Reinisch et al., 2001b). In the absence of any
dispersant, the typical maximum percentage solid in a slurry is approximately 27.4
vol. % for the feed of ultra-fine grinding in stirred media mills, whereas an upper
limitation of solid concentration is up to 60.15 vol. % in the presence of an optimal
dispersant (Greenwood et al., 2002). Therefore, the improvement of rheological
behaviour of a feed slurry with addition of a suitable dispersant can enhance the
productivity and throughput for wet ultra-fine grinding.
1.4 Aims and objectives
Although many studies related to the slurry rheology in conventional tumbling ball
mills have been done, there is still little understanding on the role of slurry rheology
in ultra-fine grinding process characterized by a very fine product size and a high
slurry concentration due to complex slurry rheological behaviour in stirred media
mills (Blecher and Schwedes, 1996; Gao and Forssberg, 1993 a). Besides, findings
from tumbling ball mills involving the effect of slurry rheology on the grinding results
can not completely apply for the stirred media milling case due to their different
breakage mechanisms (Kwade, 1999 a, b; Gao and Weller, 1993; Austin et al, 1984).
Therefore, it is necessary for wet ultra-fine grinding process to systematically
investigate parameter effects on slurry rheology, which is how to influence the ultra-
fine grinding performance, for scientific understanding and industrial application.
The major aim of this study is to investigate slurry rheology of industrial minerals
(limestone and quartzite) and its effects on wet ultra-fine grinding performance. The
rheological behaviour of the mineral slurries will be studied through parameter
modifications (i.e., solid concentration, addition of dispersant, particle size and
distribution) to improve the understanding of the overall view of the flowability of the

7
mineral slurries. The effect of slurry rheology on wet ultrafine grinding of limestone
(<100 m) will be performed through parameter variations (i.e., molecular weight of a
dispersant, solid concentration, addition dosage, addition method, and bead load) in a
stirred media mill. The role of slurry rheology in stirred media milling of quartzite
will be investigated as well by varying important grinding parameters such as media
bead density, addition of chemical, solid concentration, stirrer rotational speed as well
as the combined effect of some factors. The grinding results are evaluated by energy
efficiency and the median size of a ground product with respect to specific energy
consumption. The objective is to enhance the grinding efficiency, the product fineness
and the throughput. In addition, the rheological behaviour of a ground limestone
slurry (<100 m) will also be explored in a stirred media mill. The dependence of
slurry rheology of the ground limestone slurry (<100 m) on solid concentration,
addition of a dispersant, particle size and specific surface area of a product is to be
built up.
2. Materials
A limestone powder sample (93.7 wt.% CaCO3, 2700 kg/m3, Mohs hardness: 3)
provided by SMA Karbonater AB, Sweden and a quartzite material (94.52 wt.% SiO2,
2710 kg/m3, Mohs hardness: 7) provided by LKAB, Sweden were used for
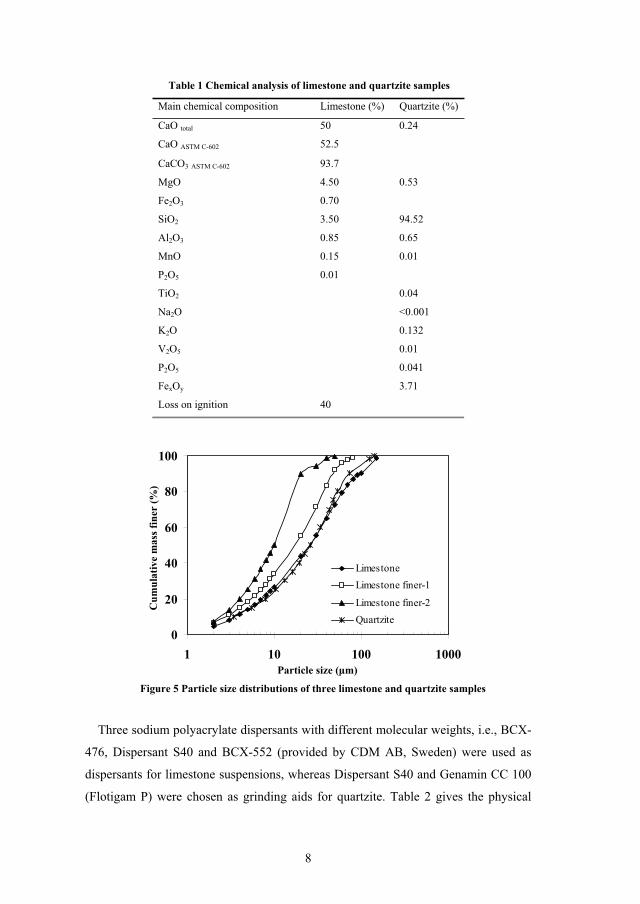
experiments. Table 1 shows the chemical analysis of the limestone and quartzite
samples. To study the effect of particle size and distribution on slurry rheology,
another two finer limestone samples were prepared from the received limestone
powder. One is a sieved sample with a size < 74 m, as designated as limestone finer-
1; the other has a size < 40 m through a sieve, as designated as limestone finer-2.
Figure 5 shows the particle size distributions of three limestone powders and quartzite
sample, which were determined by an X-ray Sedimentometer Sedigraph 5100D
(Micromeritics Co., Ltd., USA).
8
Main chemical composition Limestone (%) Quartzite (%)
CaO total 50 0.24
CaO ASTM C-602 52.5
CaCO3 ASTM C-602 93.7
MgO 4.50 0.53
Fe2O3 0.70
SiO2 3.50 94.52
Al2O3 0.85 0.65
MnO 0.15 0.01
P2O5 0.01
TiO2 0.04
Na2O <0.001
K2O 0.132
V2O5 0.01
P2O5 0.041
FexOy 3.71
Loss on ignition 40
0
20
40
60
80
100
1 10 100 1000
LimestoneLimestone finer-1
Limestone finer-2Quartzite
Three sodium polyacrylate dispersants with different molecular weights, i.e., BCX-
476, Dispersant S40 and BCX-552 (provided by CDM AB, Sweden) were used as
dispersants for limestone suspensions, whereas Dispersant S40 and Genamin CC 100
(Flotigam P) were chosen as grinding aids for quartzite. Table 2 gives the physical
Particle size ( m)
Cum
ulat
ive
mas
s fin
er (%
)
Figure 5 Particle size distributions of three limestone and quartzite samples
Table 1 Chemical analysis of limestone and quartzite samples

9
and chemical properties of these chemicals. In this investigation, the addition amount
of a dispersant is the percent of the pure dispersant (i.e., active content) by weight
relative to the weight of solids in a slurry.
Physical and chemical properties BCX-476 Dispersant
S40
BCX-552 Genamin CC
100
Active content (wt. %) 40 % Sodium
polyacrylate
40 % Sodium
polyacrylate
26 % Sodium
polyacrylate
100 % C8-C18
amine
pH 7.5 7.5 7.5 N/A
Density at 20 ºC (g/cm3) 1.30 1.30 1.315 0.78
Molecular weight (g/mol) 2,000 5,500 85,000 198
Water content and other (wt. %) 55 % 55 % 70 % N
Other content (wt. %) 5 % 5 % 4 % N
Solubility (in water) Very soluble Very soluble Very soluble Insoluble
3 Experimental methods and data analysis
3.1 Experimental methods
3.1.1 Mixing
A limestone- or quartzite-water slurry was prepared for rheological measurements
by addition of 40 to 50 kg of limestone or quartzite powder into a certain amount of
water determined by a pre-determined solid concentration for each slurry sample. The
slurry was stirred as the limestone or quartzite powder was added into water, and the
stirring was continued for 15 min to make the slurry uniform after the completion of
adding limestone or quartzite powder. If a given amount of a chemical was added, the
slurry was stirred for 15 min again after addition of the chemical to disperse the
chemical uniformly in the slurry. About 200 ml slurry was taken for each sample, and
was used to analyse the particle size distribution and to measure the rheological
behaviour of the slurry.
Table 2 Physical and chemical properties of chemicals
10
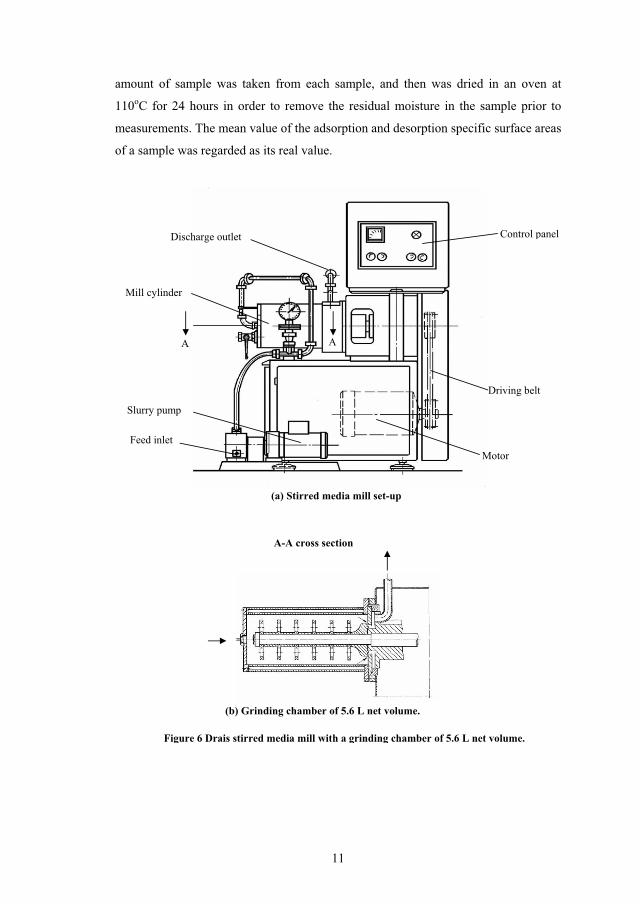
3.1.2 Grinding experiments in a stirred media mill
A stirred media mill utilized for grinding experiments is PMH 5 TEX Drais mill
(Draiswerke GmbH, Mannheim, Germany). Figure 6 (a and b) schematically shows
the mill set-up and the grinding chamber, respectively. It consists of a 150×420 mm
stainless steel cylinder chamber (5.6 L of net grinding chamber volume) and a stirrer
with six 120×10 mm perforated discs installed on a horizontal driven shaft. For
cooling purpose, the grinding chamber is equipped with a water jacket. The flowrate
of the feed slurry is controlled by a feeding pump. Discharge of the product is
facilitated by means of two specially designed screen cartridges inserted at the end of
the cylinder. The grinding operation in the PMH 5 TEX is the mode of circulation
pass by pass, as shown in Figure 6.
A limestone- or quartzite-water slurry was prepared at a pre-determined solid
concentration by mixing 40 to 50 kg of limestone or quartzite powder with a given
amount of water to make up about 35 L of slurry. 15 L of 35 L of the slurry were fed
through the mill first and then discarded in order to attain a steady milling state with
regard to solid concentration. About 20 L of the remaining slurry were circulated
through the mill pass by pass for several passes. This means that the entire 20 L of
slurry was passed through the mill, collected at the discharge outlet and then passed
through again. The grinding operation conditions for both limestone and quartzite are
shown in Table 3. About 200 ml of slurry sample was taken after each pass. The
samples were then analysed for particle size, rheological property and specific surface
area, respectively.
3.1.3 Measurements
3.1.3.1 Particle size and specific surface area
An X-ray Sedimentometer Sedigraph 5100D (Micromeritics Co. Ltd., USA) was
used to analyze the particle size and distribution of samples. Its measurement range of
particle size ranges from 0.1 to 300 μm, which is suitable for the samples in this
study. A representative amount of sample was directly dispersed in an aqueous
solution with 0.1 wt. % of Calgon for the measurement.
The specific surface area of a sample was measured by Flow Sorb 2300
(Micromeritics Co. Ltd., USA), which is an instrument designed to take the
measurements on bone-dried powders by N2 gas adsorption and desorption at liquid
nitrogen temperature and room temperature (BET), respectively. A representative
11
amount of sample was taken from each sample, and then was dried in an oven at
110oC for 24 hours in order to remove the residual moisture in the sample prior to
measurements. The mean value of the adsorption and desorption specific surface areas
of a sample was regarded as its real value.
Figure 6 Drais stirred media mill with a grinding chamber of 5.6 L net volume.
(a) Stirred media mill set-up
Feed inlet
Slurry pump
Motor
Driving belt
Mill cylinder
Discharge outlet Control panel
A A
(b) Grinding chamber of 5.6 L net volume.
A-A cross section
12
For Limestone For quartzite Constants: Stirrer speed (rpm): 1808 (11.36 m/sec),
Feed flowrate (L / min): 1.5, ZrSiO4 grinding beads: 1.6-2.0 mm, 3.7 g/ml,
Filling rate of grinding media (vol.%): 70, Feed flowrate (L / min): 1.5,
(1) Solid concentration (wt.%): 65, 70 (2) Grinding media type, size and density: Al2O3 beads:0.75-1.0 mm, 3.7 g/ml,
Al2O3 beads: 1.0-1.5 mm, 3.7 g/ml, ZrSiO4 beads: 1.6-2.0 mm, 3.7 g/ml,
SiO2 beads: 1.6-2.0 mm, 2.5 g/ml, ZrO2 beads: 1.6-2.0 mm, 5.4 g/ml
(3) Stirrer speed (rpm): 1204, 1808, 2255
Variables: (1) Solid concentration (wt.%): 65, 70, 75 (2) Filling rate of grinding media (vol.%): 65 - 83 (3) Dispersants: BCX-476 (2000 Da) (wt.%): 0.2, Dispersant S40 (5500 Da) (wt.%): 0 - 0.6, BCX-552 (85000 Da) (wt.%): 0.2
(4) Chemicals: Dispersant S40: 0.04 wt.% Flotigam P: 0.04 wt.%
3.1.3.2 Rheological measurements
Slurry samples were aged for several hours and then shaken at an intensity of 225
min–1 (TH-30 shaker from Edmund Bühler, Germany) for 1 hour to re-disperse the
samples prior to rheological measurements.
A rotational viscometer called a Bohlin Visco 88 BV (Bohlin Reologi UK Ltd.,
UK) was utilized to determine the rheological property of slurries. It employs a
concentric clylinder geometry with a rotating inner cylinder and a stationary outer
cylinder. The concentric cylinder system can be configured in 8 different
measurement systems (3 DIN, 2 ‘Wide Gap’, 3 ‘Infinite Sea’), corresponding to
SYSTEM knob 1 to 8 on the instrument, and their design allows measurement of
samples to be made in-situ (e.g. in a container) as well as on a laboratory bench. Any
inner cylinder has 8 different rotation speeds to be chosen, which is from 20 to 1000
rpm corresponding to a shear-rate range of 4 to 1200 s-1. The torque developed on the
inner cylinder due to a sample is directly related to the sample viscosity and should be
in the range of 0.5 to 9.5 mN·m for the accuracy. In this study, all samples were
measured by the use of C30 system (C30 DIN), which has a gap width of 1.5 mm
between the inner and outer cylinders and can provide a viscosity range of 0.007 to
6.18 Pa·s. A thermal jacket allows the use of an external fluid circulator to control or
regulate the temperature of a sample measured.
The sedimentation of particles has always been a major problem in measuring the
rheology of mineral slurries (Kawatra et al., 1996 and 1999), but unfortunately, no
Table 3 Experimental conditions for grinding tests
13
modification for the viscometer was made to prevent particle settling in this study.
The viscometer employs a so-called “viscosoft” computation program so the digital
readings (measured parameters), such as shear rate, shear stress, viscosity, and torque,
are directly displayed on the screen of the viscometer. Each slurry sample was first
pre-sheared for 3 min at 1000 rpm (i.e., 1200 sec–1) prior to the measurement; then the
measurement started at such a high shear rate. The shear rate was stepped down one
by one until the torque reading was less than 0.5 mN·m. The digital readings
(viscosity, shear rate, shear stress, and torque) were recorded at each shear rate. About
25 ml of slurry sample was required for each measurement. Each sample was
measured three times, and the mean values of shear stress, shear rate, and viscosity
were used for analysis.
A controlled-stress rheometer called a TA Instruments CSL2 500 (TA Instruments,
Leatherhead, UK) was used to characterize the time-dependent flowability of a
ground slurry because it can give far more shear rate-viscosity points than Bohlin
Visco 88 BV viscometer. According to measurement requirements, TA Instruments
CSL2 500 can calibrate and optimize parameter options itself through an auxiliary
computer software called TA Instruments Rheology Solutions. Also, the rheometer
can accurately maintain a given temperature varying in the range of ± 0.1 °C using a
heating-refrigerating bath and circulator system. Samples were measured in the shear-
rate range of 20 to 600 sec-1 using a cone-and-plate geometry with a 3° angle and 60
mm diameter cone. A sample was first pre-sheared at 800 sec-1 for 5 sec rather than 3
min to avoid evaporation; then was subjected to a varying shear rate, which was first
increasingly increased from 20 to 600 sec-1 (“up”) in 2 min and then was decreased to
20 sec-1 (“down”) in 2 min.
In addition, the rheological data were fitted using both Bingham plastic (Gao and
Forssberg 1993a; Prestidge 1997; Muster and Prestidge 1995) and Casson (Yue and
Klein, 2004; Yang et al., 2001) models (Eqs. (9) and (10)) as these two models are
simple two-parameter equations.
BB (9)
21
21
21
)()( CC (10)
where B and C are the yield stress terms, and B and C are the viscosity terms.
14
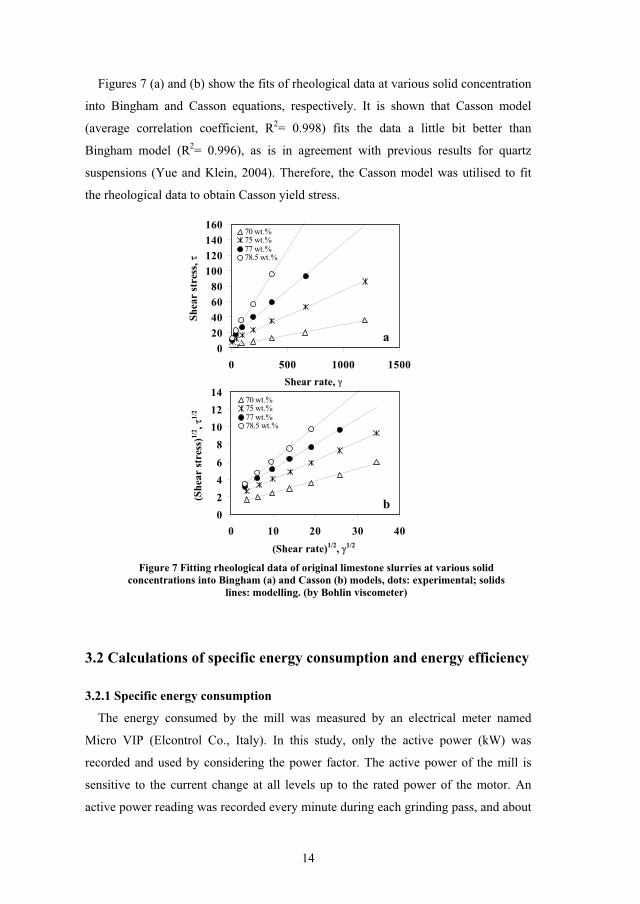
Figures 7 (a) and (b) show the fits of rheological data at various solid concentration
into Bingham and Casson equations, respectively. It is shown that Casson model
(average correlation coefficient, R2= 0.998) fits the data a little bit better than
Bingham model (R2= 0.996), as is in agreement with previous results for quartz
suspensions (Yue and Klein, 2004). Therefore, the Casson model was utilised to fit
the rheological data to obtain Casson yield stress.
020406080
100120140160
0 500 1000 1500
70 wt.%75 wt.%77 wt.%78.5 wt.%
02468
101214
0 10 20 30 40
70 wt.%75 wt.%77 wt.%78.5 wt.%
3.2 Calculations of specific energy consumption and energy efficiency
3.2.1 Specific energy consumption
The energy consumed by the mill was measured by an electrical meter named
Micro VIP (Elcontrol Co., Italy). In this study, only the active power (kW) was
recorded and used by considering the power factor. The active power of the mill is
sensitive to the current change at all levels up to the rated power of the motor. An
active power reading was recorded every minute during each grinding pass, and about
a
b
(Shear rate)1/2, 1/2
Shear rate,
(She
ar st
ress
)1/2 ,
1/2
Shea
r st
ress
,
Figure 7 Fitting rheological data of original limestone slurries at various solid concentrations into Bingham (a) and Casson (b) models, dots: experimental; solids
lines: modelling. (by Bohlin viscometer)

15
10 readings were done for each pass. The mean active power of each pass was
regarded as its real one. The mean active power, Pmn (kW), of the nth pass for a
grinding experiment was determined by
m
pP
m
iin
mn1 (11)
where Pni is the ith discrete power reading of the nth pass, and m, the number of
readings of the nth pass. The milling energy of the nth pass was calculated by taking
away the idle power draw of the mill, P0 (kW) (without grinding media or ground
material) from the mean active power, Pmn (kW) at a given rotation speed. And only
the power adsorbed by the mill chamber was accounted in all the tests in this work. In
order to evaluate the net energy consumption of the Drais mill, the mass specific
energy consumption, Em (kW h/t), was determined by (Stehr and Weyand, 1990):
CMPPEp
mnm 6.3
0 (12)
where Mp (kg/s) is the mass flowrate of a slurry suspension fed to the mill, and C is
the solid concentration by weight. Due to the volume flowrate of a feed slurry being
controlled and measured in this study, the formula (12) is modified as
vv
mnm CM
PPE
6.30 (13)
where Mv (m3/s) is the volume flowrate of a slurry suspension fed to the mill, and Cv,
the volume concentration of the slurry, and (kg/m3), the density of solid.
3.2.2 Energy efficiency
Energy efficiency or energy utilization, Ef (m2/Wh), which is defined as the
increment of specific surface area per unit of specific energy consumption (Zheng et
al., 1997; Gao and Forssberg, 1993 b), was calculated by
mf E
SE 1000 (14)
16
where S =S-S0, S and S0 are the specific surface areas (m2/g) of a ground product
and its feed by BET, respectively.
3.3 Reproducibility of experimental data
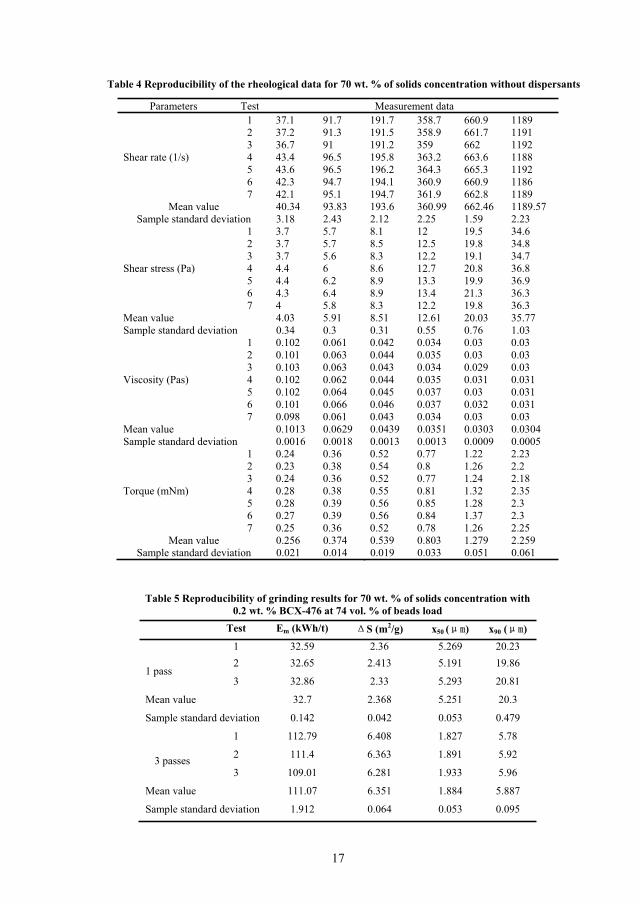
3.3.1 Rheological measurements
The accuracy of Bohlin viscometer was examined by the reproducibility of the
rheological measurements of a limestone slurry (<100 m) over a wide range of shear
rates. The results are shown in Table 4. It is evident that the viscometer exhibits good
reproducibility with a rather small standard deviation for all the measured parameters.
The sample standard deviation of viscosity is less than 0.0013 Pa·s when the torque is
larger than 0.5 mN·m. Even though the measured torque is less than 0.5 mN·m, the
sample standard deviation of viscosity is still less than 0.0018 Pas. Thus, the
viscometer accurately gives a resolution of 0.001 Pa·s at a torque larger than 0.5
mN·m.
3.3.2 Grinding results
Table 5 shows the mean value and the sample standard deviation for the measured
values from three grinding tests, which were performed under the same conditions. It
is evident that the grinding results with the stirred media mill (PMH 5 TEX) exhibit
good reproducibility with a rather small sample standard deviation for all the
measured parameters, as was confirmed and emphasized by Reinisch et al. (2001a).
17
Parameters Test Measurement data 1 37.1 91.7 191.7 358.7 660.9 1189 2 37.2 91.3 191.5 358.9 661.7 1191 3 36.7 91 191.2 359 662 1192 4 43.4 96.5 195.8 363.2 663.6 1188 5 43.6 96.5 196.2 364.3 665.3 1192 6 42.3 94.7 194.1 360.9 660.9 1186
Shear rate (1/s)
7 42.1 95.1 194.7 361.9 662.8 1189 Mean value 40.34 93.83 193.6 360.99 662.46 1189.57
Sample standard deviation 3.18 2.43 2.12 2.25 1.59 2.23 1 3.7 5.7 8.1 12 19.5 34.6 2 3.7 5.7 8.5 12.5 19.8 34.8 3 3.7 5.6 8.3 12.2 19.1 34.7 4 4.4 6 8.6 12.7 20.8 36.8 5 4.4 6.2 8.9 13.3 19.9 36.9 6 4.3 6.4 8.9 13.4 21.3 36.3
Shear stress (Pa)
7 4 5.8 8.3 12.2 19.8 36.3 Mean value 4.03 5.91 8.51 12.61 20.03 35.77 Sample standard deviation 0.34 0.3 0.31 0.55 0.76 1.03
1 0.102 0.061 0.042 0.034 0.03 0.03 2 0.101 0.063 0.044 0.035 0.03 0.03 3 0.103 0.063 0.043 0.034 0.029 0.03 4 0.102 0.062 0.044 0.035 0.031 0.031 5 0.102 0.064 0.045 0.037 0.03 0.031 6 0.101 0.066 0.046 0.037 0.032 0.031
Viscosity (Pas)
7 0.098 0.061 0.043 0.034 0.03 0.03 Mean value 0.1013 0.0629 0.0439 0.0351 0.0303 0.0304 Sample standard deviation 0.0016 0.0018 0.0013 0.0013 0.0009 0.0005
1 0.24 0.36 0.52 0.77 1.22 2.23 2 0.23 0.38 0.54 0.8 1.26 2.2 3 0.24 0.36 0.52 0.77 1.24 2.18 4 0.28 0.38 0.55 0.81 1.32 2.35 5 0.28 0.39 0.56 0.85 1.28 2.3 6 0.27 0.39 0.56 0.84 1.37 2.3
Torque (mNm)
7 0.25 0.36 0.52 0.78 1.26 2.25 Mean value 0.256 0.374 0.539 0.803 1.279 2.259
Sample standard deviation 0.021 0.014 0.019 0.033 0.051 0.061
Test Em (kWh/t) S (m2/g) x50 ( ) x90 ( )1 32.59 2.36 5.269 20.23 2 32.65 2.413 5.191 19.86
1 pass 3 32.86 2.33 5.293 20.81
Mean value 32.7 2.368 5.251 20.3
Sample standard deviation 0.142 0.042 0.053 0.479
1 112.79 6.408 1.827 5.78
2 111.4 6.363 1.891 5.92 3 passes 3 109.01 6.281 1.933 5.96
Mean value 111.07 6.351 1.884 5.887
Sample standard deviation 1.912 0.064 0.053 0.095
Table 4 Reproducibility of the rheological data for 70 wt. % of solids concentration without dispersants
Table 5 Reproducibility of grinding results for 70 wt. % of solids concentration with 0.2 wt. % BCX-476 at 74 vol. % of beads load
18
4 Results and discussion
4.1 Slurry rheology (Paper 2)
4.1.1 Effect of solid concentration
The influence of solid concentration on the rheology of limestone slurry is
significant since a range of solid concentrations can lead to different types of flows, as
shown in Figure 8. The result shows the rhological properties of seven solid
concentrations of original limestone slurries (< 100 m) without dispersant at 25 ±
0.2ºC. Clearly, the slurry appears to be a weakly dilatant flow at a solid concentration
65 wt. % (40.75 vol. %) if the effect of particle settling is neglected. This is because
in a dilute slurry (i.e., 65 wt.% or 40.75 vol.%), the interparticle distance is so large
that the limestone particles in the slurry are not subjected to the attractive forces
between the particles.
At lower shear rates, the particles have enough opportunities to slip over each other
and are free to move as individuals. Increasing shear rate increases the degree of
shear-induced aggregation, leading to an increase in viscosity (Klein and Hallbom,
2002). Alternatively, the slurry at a solid concentration 65 wt. % may present
Newtonian fluid if particle sedimentation is eliminated.
A decrease in apparent viscosity with reducing shear rate may arise from particle
settling. Unfortunately, there was no effort to overcome the issue of particle settling in
the study. At the solid concentration up to 67 wt. % (42.92 vol. %), the flowability of
the slurry exhibits a pseudoplastic characteristic without a definite yield stress at shear
rates less than 663 sec-1 and a weakly dilatant or Newtonian flow at shear rates larger
than 663 sec-1. This indicates that at shear rates < 663 sec-1, the interparticle attraction
is predominant over the hydrodynamic force exerted by a flow field at 67 wt. % of
solid concentration, as opposite at shear rates > 663 sec-1.
With further increasing the solid concentration to 70 wt.% (46.36 vol.%) or more,
the slurry rheology is changed into a pesudoplastic flow with an evident shear yield
stress at low shear rates, followed by a transition to a Casson plastic flow (with a
higher extrapolated Casson yield stress) at high shear rates. Furthermore, the degree
of pseudoplasticity, the apparent viscosity at a given shear rate and the shear yield
stress increase with increasing solid concentration when the solid concentration is
larger than 70 wt.% (Figure 8).

19
0
10
20
30
40
50
60
70
80
90
100
0 500 1000 1500
60 wt.%65 wt.%67 wt.%70 wt.%75 wt.%77 wt.%78.5 wt.%
0.01
0.1
1
10
0 500 1000 1500
60 wt.% (35.71 vol.%)65 wt.% (40.75 vol.%)67 wt.% (42.92 vol.%)70 wt.% (46.36 vol.%)75 wt.% (52.63 vol.%)77 wt.% (55.36 vol.%)78.5 wt.% (57.49 vol.%)
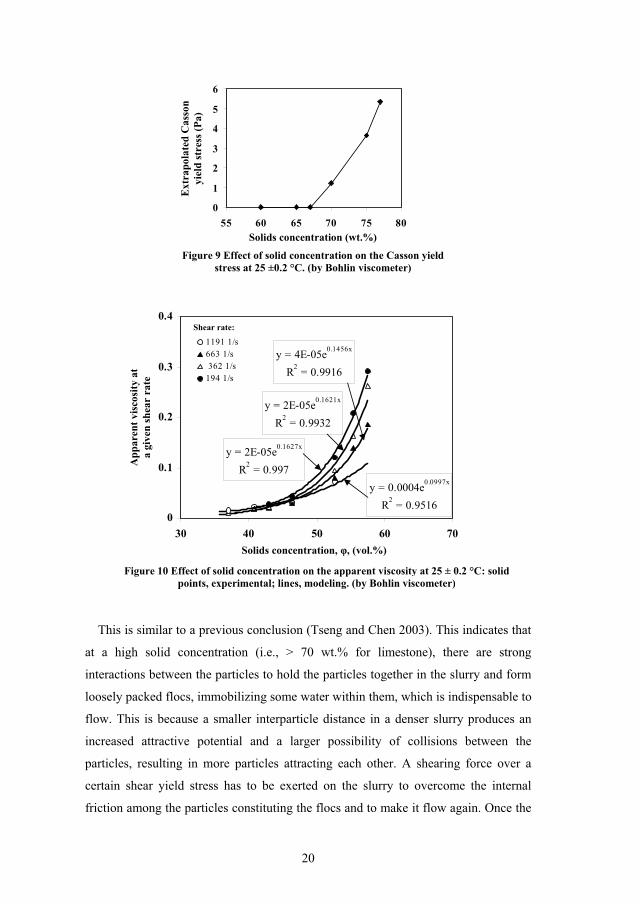
Similar phenomena were observed for quartz (Yue and Klein, 2004), and titanium
dioxide suspensions (Yang et al., 2001). The effect of solid concentration on the
extrapolated Casson yield stress and the apparent viscosity at a given shear rate for the
slurry is shown in Figures 9 and 10, respectively. The yield stress and the viscosity
increase in power-law and exponential forms with increasing solid concentration
when the solid concentration is larger than 70 wt. % (46.36 vol. %), respectively. The
influence of solid concentration on the rheological behaviour (apparent viscosity and
Casson yield stress) of quartzite slurry is quite similar to that of limestone slurry and
is not described in detail here due to limited space.
Figure 8 Effect of solid concentration on the rheological properties of original limestone slurry in the absence of chemicals at 25 ±0.2 °C. (by Bohlin viscometer)
Shear rate (1/sec)
App
aren
t vis
cosi
ty (P
a·se
c)
b
a
Shear rate (1/sec)
Shea
r st
ress
(Pa)
20
0
1
2
3
4
5
6
55 60 65 70 75 80
y = 2E-05e0.1621x
R2 = 0.9932
y = 2E-05e0.1627x
R2 = 0.997y = 0.0004e0.0997x
R2 = 0.9516
y = 4E-05e0.1456x
R2 = 0.9916
0
0.1
0.2
0.3
0.4
30 40 50 60 70
1191 1/s663 1/s 362 1/s194 1/s
This is similar to a previous conclusion (Tseng and Chen 2003). This indicates that
at a high solid concentration (i.e., > 70 wt.% for limestone), there are strong
interactions between the particles to hold the particles together in the slurry and form
loosely packed flocs, immobilizing some water within them, which is indispensable to
flow. This is because a smaller interparticle distance in a denser slurry produces an
increased attractive potential and a larger possibility of collisions between the
particles, resulting in more particles attracting each other. A shearing force over a
certain shear yield stress has to be exerted on the slurry to overcome the internal
friction among the particles constituting the flocs and to make it flow again. Once the
Solids concentration (wt.%)
Ext
rapo
late
d C
asso
n yi
eld
stre
ss (P
a)
Figure 9 Effect of solid concentration on the Casson yield stress at 25 ±0.2 °C. (by Bohlin viscometer)
App
aren
t vis
cosi
ty a
t a
give
n sh
ear
rate
Figure 10 Effect of solid concentration on the apparent viscosity at 25 ± 0.2 °C: solid points, experimental; lines, modeling. (by Bohlin viscometer)
Shear rate:
Solids concentration, , (vol.%)
21
slurry flows, the flocs are broken down into smaller flow fragments with increasing
flow intensity (i.e., shear rate for a given slurry system). The fragment size is mainly
determined by the balance between the strength of the aggregation structure and the
flow intensity (Higashitani et al., 2001). An increase in shear rate (flow intensity)
gives smaller flow units and thus decreases the viscosity of the slurry.
The effect of solid concentration on the apparent viscosity of the limestone slurry
at a certain shear rate (see Figure 10) is consistent with previous conclusions for
dolomite (Velamakanni and Fuerstenau, 1993) and for quartz slurries
(Tangsathitkulchai and Austin, 1988). By fitting the experimental data, we found that
a relation between the apparent viscosity of limestone slurry at a given shear rate and
solid concentration can be described by
)()( bp ea (15)
where p is the apparent viscosity; is the solid concentration by volume; a( ) and
b( ) are the coefficients related to a used shear rate, and the higher the shear rate is,
the larger a( ), and the smaller b( ).
This model gives good accuracy in the investigated range of solid concentration, as
shown in Figure 10. The errors between the experimental and predicted viscosities at
a certain solid concentration are less than 14.28 % at a shear rate of 1191 s-1, 26.08 %
at 663 s-1, 19.39 % at 362 s-1, or 19.94 % at 194 s-1.
It is evident that in the case of solid concentration over 75 wt.% or 52.63 vol.%, the
slurry viscosity increases rather sharply in the range of shear rate investigated, tending
towards infinity at a limited solid concentration. Consistent phenomenon is observed
when the apparent viscosity ( p) of the slurry is substituted by the relative viscosity, r
(the viscosity of the slurry with respect to the viscosity of the suspending fluid, 0, at a
given shear rate). Figure 11 shows a relation between the relative viscosity of the
slurry and solid volume concentration at the shear rate of 663 s-1.

22
y = 0.0257e0.128x
R2 = 0.966
0
10
20
30
40
50
30 40 50 60 70
Besides, the relation between the relative viscosity ( r) and the volume fraction of
solid in the slurry ( ) allows to calculate the theoretical, maximum solid volume
fraction ( m, at which the relative viscosity approaches toward infinity and the slurry
ceases from flowing) attainable in the limestone-water slurry according to (Tseng and
Chen, 2003):
banr
/11 (16)
where a and b are constants, which can be determined from the nr
/11 -
relationship, and n is an integer in the range of 2 to 4 (Tseng and Chen, 2003). Table 6
lists the values of parameters obtained by fitting experimental data into Equation (16)
with three different n-values, i.e., 2, 3 and 4. The experimentally determined r
derivative, i.e. nr
/11 appears to be linearly proportional to with a reasonable
correlation factor for all three n-values. The theoretical, maximum solid concentration
can hence be obtained from the fitted equation by extrapolating the linear line to
11 /1 nr . The corresponding m is given in Table 6.
banr
/11Parameters
n a b m
(vol.%) R2
(correlation factor)
2 0.0195 -0.2597 64.6 0.9925 3 0.0191 -0.3771 72.1 0.9879 4 0.0174 -0.3909 79.94 0.9839
Solids concentration, , (vol.%)
Rel
ativ
e vi
scos
ity
Figure 11 Effect of solid concentration on the relative viscosity at the shear rate of 663 s-1 at 25 ± 0.2 °C: solid points, experimental; lines, modeling.
Table 6 parameter values obtained by fitting experimental data into Eq. (16).

23
The calculated m is compared with the c- , p- and r- relations, which are
shown in Figures 9, 10 and 11, respectively. The apparent viscosity, relative viscosity
and extrapolated Casson yield stress approach infinity at the solid concentration of 65
vol. % or 83.37 wt. %. Thus, the exponent n=2 in equation (16) is applicable to the
limestone slurry at a high shear rate of 663 s-1, and gives a good correlation factor
(Figure 12) and a reasonable maximum packing volume fraction of 0.646, which is
close to the random close packing fraction ( =0.64) for spheres.
y = 0.0195x - 0.2597R2 = 0.9925
0.4
0.6
0.8
1
30 40 50 60 70
In addition, it is interesting to note that the 75 wt. % limestone slurry or more
presents a thixotropic characteristic (Figure 13). For a given solid concentration, the
apparent viscosity of the slurry decreases with time at a certain shear rate. The time to
reach a stable apparent viscosity is about 3 min for 75 wt. % of solid concentration at
1191 s-1 and 4 min for 77 wt. % at 663 s-1. The shear-thinning behaviour with a
definite yield stress associated with thixotropic characteristics is typical of
agglomerated or flocculated slurries (Muster and prestidge, 1995; Papo et al., 2002;
Hackly, 1998). A similar conclusion was drawn for kaolin suspensions with sodium
tripolyphosphate (Papo et al., 2002), for concentrated alumina suspensions (Lemke et
al., 1999), for sphalerite slurries (Muster and Prestidge, 1995) and for galena slurries
(Prestidge, 1997).
Figure 12 The 2/11 r - relationship at the shear rate of 663 s-1 at 25 ± 0.2 °C.
Solids concentration, , (vol.%)
1-r-1
/2

24
0
0.05
0.1
0.15
0.2
0.25
0 1 2 3 4 5 6
75 wt.% limestone slurryat the shear rate 1191 1/s77 wt.% limestone slurryat the shear rate 663 1/s
4.1.2 Effect of molecular weight of a dispersant
The effect of the concentration of sodium polyacrylate dispersants with various
molecular weights on the rheological behaviour of 70 wt.% and 75 wt.% of original
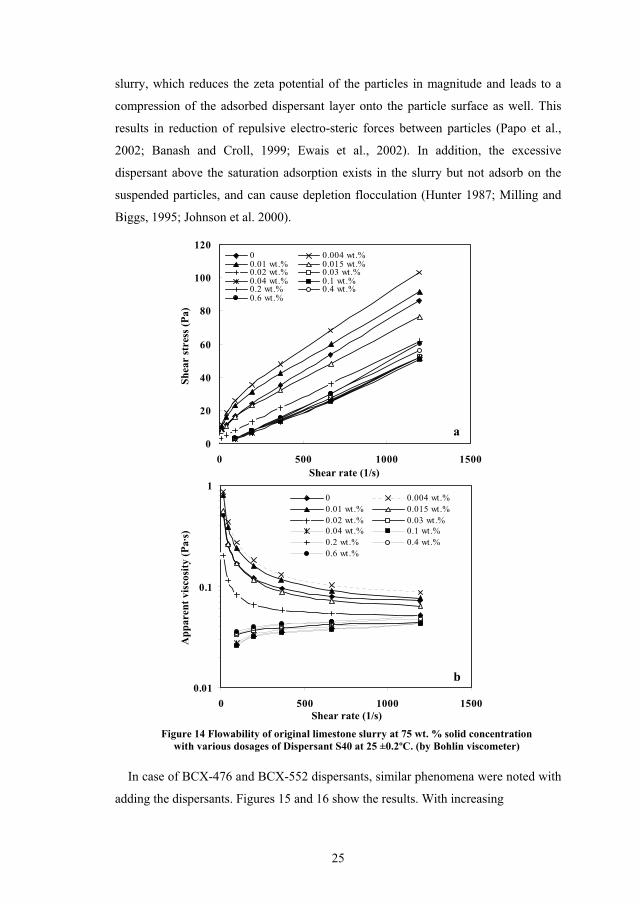
limestone slurries (< 100 m) was investigated, respectively. Figure 14 shows the
effect of the concentration of a sodium polyacrylate called Dispersant S40 (Mw: 5500
Da) on the flowability of original limestone slurry at 75 wt. % of solid concentration.
The slurry with less than 0.01 wt.% of Dispersant S40 shows a pseudoplastic
characteristic with a yield stress and possesses a higher apparent viscosity than that
without the dispersant at a given shear rate. This reason is that an insufficient
dispersant causes the flocculation of particles in the slurry by bridging attraction
forces, leading to larger flow units (Johnson et al. 2000). At the addition amount of
Dispersant S40 up to 0.015 wt. %, the apparent viscosity of the slurry is lower than
that without the dispersant, and the slurry still exhibits a pseudoplastic flow with a
smaller yield stress. When the addition dosage of Dispersant S40 is up to 0.03 wt. %
or more, the slurry is transformed into a weakly dilatant flow if the effect of particle
settling is neglected, and the apparent viscosity in the range of shear rates investigated
slightly decreases with the further addition of Dispersant S40 and is down to a
minimum at the addition level of 0.1 wt. %. In this case, it is supposed that the
saturation adsorption of the dispersant on the particle surface has been attained, and
electrostatic and steric stabilizations (i.e., electro-steric stabilizations) occur. By
further adding the dispersant, the apparent viscosity at a given shear rate
insignificantly reverts. The excessive dispersant can increase the ion strength of the
Time (min)
App
aren
t Visc
osity
(Pa·
s)
Figure 13 Changes of the viscosity of limestone slurry with time at 25 ±0.2 °C (by Bohlin viscometer)
25
slurry, which reduces the zeta potential of the particles in magnitude and leads to a
compression of the adsorbed dispersant layer onto the particle surface as well. This
results in reduction of repulsive electro-steric forces between particles (Papo et al.,
2002; Banash and Croll, 1999; Ewais et al., 2002). In addition, the excessive
dispersant above the saturation adsorption exists in the slurry but not adsorb on the
suspended particles, and can cause depletion flocculation (Hunter 1987; Milling and
Biggs, 1995; Johnson et al. 2000).
0
20
40
60
80
100
120
0 500 1000 1500
0 0.004 wt.%0.01 wt.% 0.015 wt.%0.02 wt.% 0.03 wt.%0.04 wt.% 0.1 wt.%0.2 wt.% 0.4 wt.%0.6 wt.%
0.01
0.1
1
0 500 1000 1500
0 0.004 wt.%0.01 wt.% 0.015 wt.%0.02 wt.% 0.03 wt.%0.04 wt.% 0.1 wt.%0.2 wt.% 0.4 wt.%0.6 wt.%
In case of BCX-476 and BCX-552 dispersants, similar phenomena were noted with
adding the dispersants. Figures 15 and 16 show the results. With increasing
Figure 14 Flowability of original limestone slurry at 75 wt. % solid concentration with various dosages of Dispersant S40 at 25 ±0.2ºC. (by Bohlin viscometer)
a
b
Shear rate (1/s)
Shea
r st
ress
(Pa)
Shear rate (1/s)
App
aren
t vis
cosi
ty (P
a·s)

26
0
0.05
0.1
0.15
0.2
0 0.01 0.02 0.03 0.04 0.05
BCX-476Dispersant S40BCX-552BCX-476Dispersant S40BCX-552
0
0.05
0.1
0.15
0.2
0.25
0.05 0.1 0.15 0.2 0.25 0.3 0.35 0.4 0.45 0.5 0.55 0.6 0.65
BCX-476Dispersant S40BCX-552BCX-476Dispersant S40BCX-552
0
2
4
6
8
10
12
0 0.01 0.02 0.03 0.04 0.05
BCX-476: 2000Dispersant S40: 5500BCX-552: 85000
Addition amount of dispersants with various molecular weights (wt.%)
Ext
rapo
late
d C
asso
n yi
eld
stre
ss (P
a)
Figure 16 Effect of dispersant concentration on the extrapolated Casson yield stress for 75 wt.% of solid concentration at 25 ±0.2 °C. (by Bohlin viscometer)
Figure 15 Effect of dispersant concentration on the apparent viscosity at 194 s-1 and 663 s-1 for 75 wt.% of solid concentration at 25 ±0.2 °C. (by Bohlin viscometer)
194 s-1:
663 s-1:
663 s-1:
194 s-1:
Addition amount of dispersants with various molecular weights (wt.%)
App
aren
t vis
cosi
ty (P
a·s)
a
b

27
the addition dosage of dispersants, the apparent viscosity of the 75 wt.% limestone
slurry at a given shear rate first increases and reaches a respective maximum at the
addition amount of 0.004 wt.% for each dispersant and then decreases. It marginally
reverts for BCX-476 and Dispersant S40, and distinctly does for BCX-552 after
reaching a respective minimum (Figure 15), which is located at an addition level of
0.2 wt.% for BCX-476, 0.1 wt.% for Dispersant S40 and 0.04 wt.% for BCX-552.
For dispersant BCX-552, it possesses a much larger molecular weight (i.e., 85,000)
with a longer molecular chain than BCX-476 and Dispersant S40, so the depletion
flocculation is more significant besides the reduction of electro-steric force (Banash
and Croll, 1999; Kiratzis, 1999). Therefore, further addition of BCX-552 above the
saturation adsorption significantly raises the apparent viscosity of the slurry at a given
shear rate (Figure 15 (b)). The extrapolated Casson yield stress of the 75 wt.%
limestone slurry first increases and then decreases with increasing the addition dosage
of dispersants with different molecular weights. The extrapolated Casson yield stress
reaches a respective maximum at 0.004 wt.% addition level and is eliminated when
the addition amount exceeds 0.03 wt. % for each dispersant (Figure 16).
Similar phenomena were observed for kaolin suspensions with sodium
tripolyphosphate and sodium polyphosphate (Papo et al., 2002), and zirconia slurries
with tri-ammonium citrate (Ewais et al., 2002), and silica suspensions with
polyethylene oxide (Zaman et al., 2000).
For 70 wt. % of the limestone slurry, similar rheological behaviour was also noted
with addition of dispersants with various molecular weights (Papers 2 and 5). The
apparent viscosity of 70 wt. % of the limestone slurry reaches a respective minimum
at an addition level of 0.1 wt. % for BCX-476 or Dispersant S40 and 0.04 wt.% for
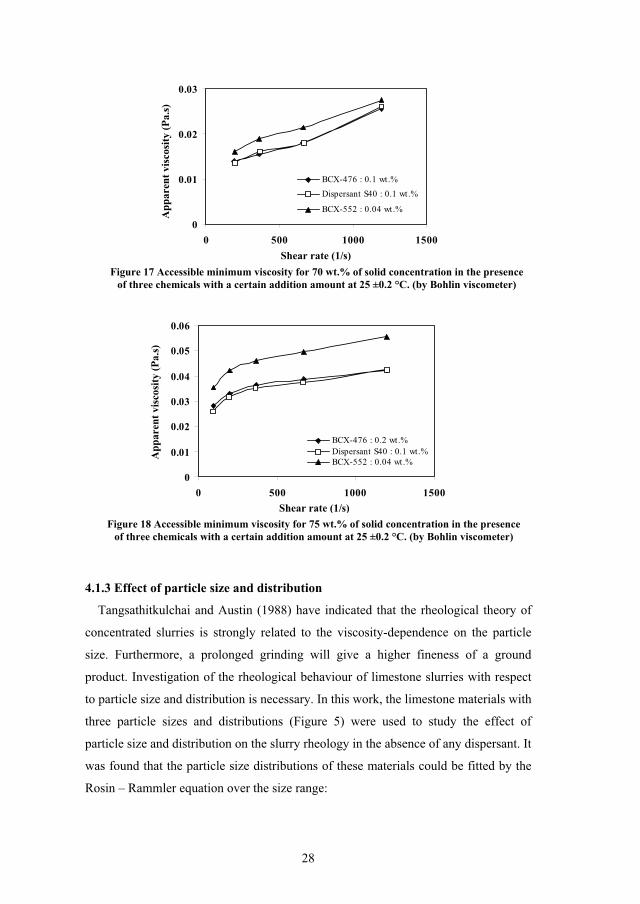
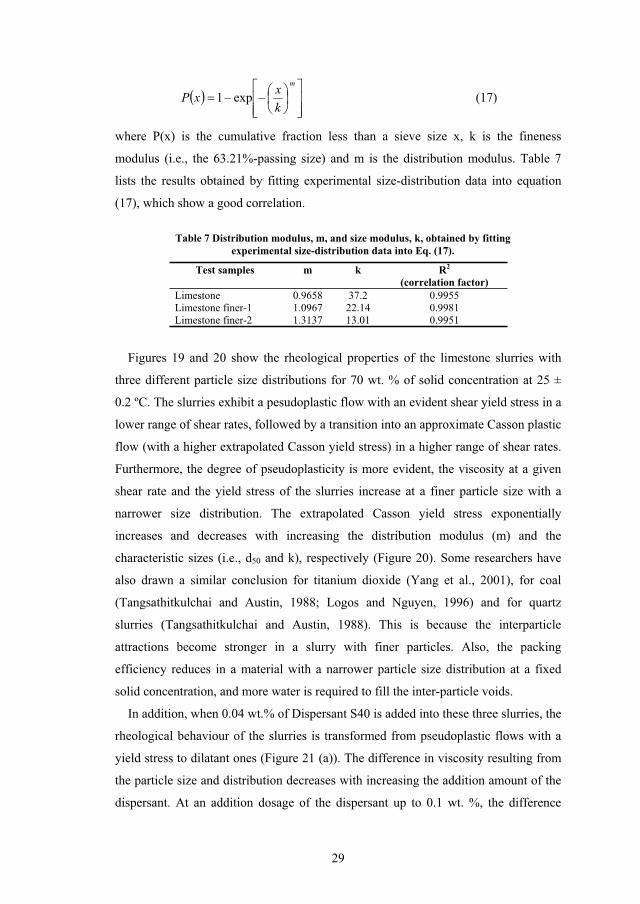
BCX-552. Figures 17 and 18 show the accessible minimum viscosity for 70 wt. % and
75wt. % of the limestone slurry in the presence of a given addition amount for each
dispersant, respectively. In the case of reduction of the apparent viscosity of the
limestone slurry, Dispersant S40 and BCX-476 are better than BCX-552. Dispersant
S40 and BCX-476 show quite similar effect for 70 wt. % of the limestone slurry,
while the former is better than the latter for 75 wt. % of the slurry. The reason could
be that Dispersant S40 gives a better steric stabilization than BCX-476 in a denser
limestone slurry due to its relatively larger molecular weight with respect to BCX-
476.
28
0
0.01
0.02
0.03
0 500 1000 1500
BCX-476 : 0.1 wt.%Dispersant S40 : 0.1 wt.%
BCX-552 : 0.04 wt.%
0
0.01
0.02
0.03
0.04
0.05
0.06
0 500 1000 1500
BCX-476 : 0.2 wt.%Dispersant S40 : 0.1 wt.%BCX-552 : 0.04 wt.%
4.1.3 Effect of particle size and distribution
Tangsathitkulchai and Austin (1988) have indicated that the rheological theory of
concentrated slurries is strongly related to the viscosity-dependence on the particle
size. Furthermore, a prolonged grinding will give a higher fineness of a ground
product. Investigation of the rheological behaviour of limestone slurries with respect
to particle size and distribution is necessary. In this work, the limestone materials with
three particle sizes and distributions (Figure 5) were used to study the effect of
particle size and distribution on the slurry rheology in the absence of any dispersant. It
was found that the particle size distributions of these materials could be fitted by the
Rosin – Rammler equation over the size range:
Shear rate (1/s)
App
aren
t vis
cosi
ty (P
a.s)
Figure 17 Accessible minimum viscosity for 70 wt.% of solid concentration in the presence of three chemicals with a certain addition amount at 25 ±0.2 °C. (by Bohlin viscometer)
Shear rate (1/s)
App
aren
t vis
cosi
ty (P
a.s)
Figure 18 Accessible minimum viscosity for 75 wt.% of solid concentration in the presence of three chemicals with a certain addition amount at 25 ±0.2 °C. (by Bohlin viscometer)
29
m
kxxP exp1 (17)
where P(x) is the cumulative fraction less than a sieve size x, k is the fineness
modulus (i.e., the 63.21%-passing size) and m is the distribution modulus. Table 7
lists the results obtained by fitting experimental size-distribution data into equation
(17), which show a good correlation.
Test samples m k R2
(correlation factor) Limestone 0.9658 37.2 0.9955 Limestone finer-1 1.0967 22.14 0.9981 Limestone finer-2 1.3137 13.01 0.9951
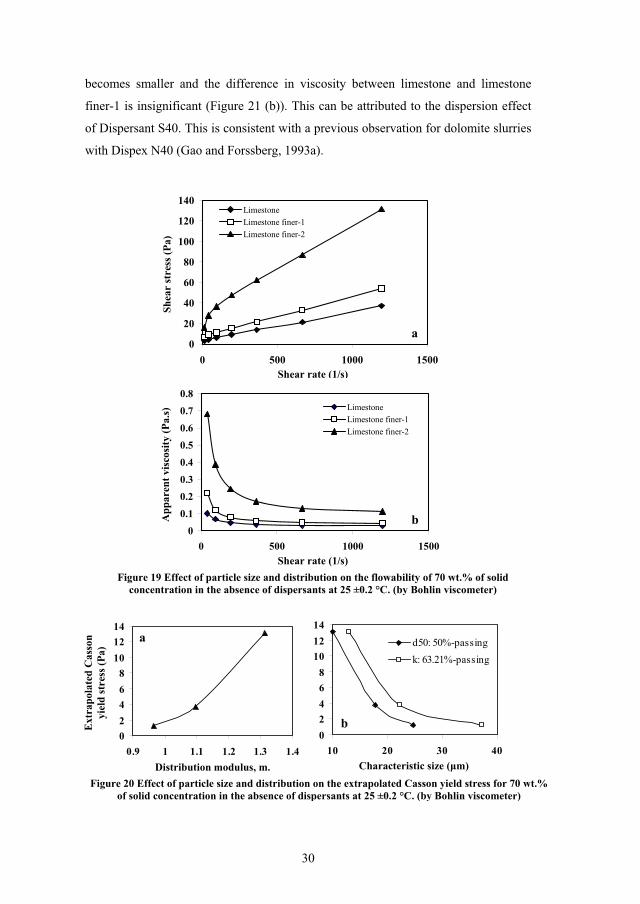
Figures 19 and 20 show the rheological properties of the limestone slurries with
three different particle size distributions for 70 wt. % of solid concentration at 25 ±
0.2 ºC. The slurries exhibit a pesudoplastic flow with an evident shear yield stress in a
lower range of shear rates, followed by a transition into an approximate Casson plastic
flow (with a higher extrapolated Casson yield stress) in a higher range of shear rates.
Furthermore, the degree of pseudoplasticity is more evident, the viscosity at a given
shear rate and the yield stress of the slurries increase at a finer particle size with a
narrower size distribution. The extrapolated Casson yield stress exponentially
increases and decreases with increasing the distribution modulus (m) and the
characteristic sizes (i.e., d50 and k), respectively (Figure 20). Some researchers have
also drawn a similar conclusion for titanium dioxide (Yang et al., 2001), for coal
(Tangsathitkulchai and Austin, 1988; Logos and Nguyen, 1996) and for quartz
slurries (Tangsathitkulchai and Austin, 1988). This is because the interparticle
attractions become stronger in a slurry with finer particles. Also, the packing
efficiency reduces in a material with a narrower particle size distribution at a fixed
solid concentration, and more water is required to fill the inter-particle voids.
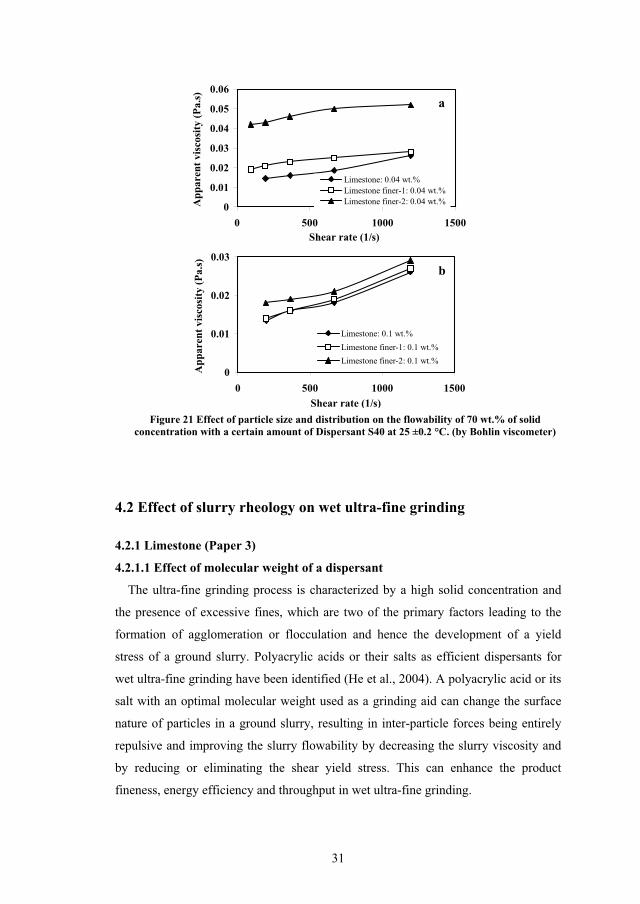
In addition, when 0.04 wt.% of Dispersant S40 is added into these three slurries, the
rheological behaviour of the slurries is transformed from pseudoplastic flows with a
yield stress to dilatant ones (Figure 21 (a)). The difference in viscosity resulting from
the particle size and distribution decreases with increasing the addition amount of the
dispersant. At an addition dosage of the dispersant up to 0.1 wt. %, the difference
Table 7 Distribution modulus, m, and size modulus, k, obtained by fitting experimental size-distribution data into Eq. (17).
30
becomes smaller and the difference in viscosity between limestone and limestone
finer-1 is insignificant (Figure 21 (b)). This can be attributed to the dispersion effect
of Dispersant S40. This is consistent with a previous observation for dolomite slurries
with Dispex N40 (Gao and Forssberg, 1993a).
0
20
40
60
80
100
120
140
0 500 1000 1500
LimestoneLimestone finer-1Limestone finer-2
00.10.20.30.40.50.60.70.8
0 500 1000 1500
LimestoneLimestone finer-1Limestone finer-2
02468
101214
0.9 1 1.1 1.2 1.3 1.402468
101214
10 20 30 40
d50: 50%-passingk: 63.21%-passing
Shear rate (1/s)
App
aren
t vis
cosi
ty (P
a.s)
Figure 19 Effect of particle size and distribution on the flowability of 70 wt.% of solid concentration in the absence of dispersants at 25 ±0.2 °C. (by Bohlin viscometer)
Shear rate (1/s)
a
b
Shea
r st
ress
(Pa)
Ext
rapo
late
d C
asso
n yi
eld
stre
ss (P
a)
Characteristic size ( m)Distribution modulus, m.Figure 20 Effect of particle size and distribution on the extrapolated Casson yield stress for 70 wt.%
of solid concentration in the absence of dispersants at 25 ±0.2 °C. (by Bohlin viscometer)
a
b
31
0
0.01
0.02
0.03
0.04
0.05
0.06
0 500 1000 1500
Limestone: 0.04 wt.%Limestone finer-1: 0.04 wt.%Limestone finer-2: 0.04 wt.%
0
0.01
0.02
0.03
0 500 1000 1500
Limestone: 0.1 wt.%Limestone finer-1: 0.1 wt.%Limestone finer-2: 0.1 wt.%
4.2 Effect of slurry rheology on wet ultra-fine grinding
4.2.1 Limestone (Paper 3)
4.2.1.1 Effect of molecular weight of a dispersant
The ultra-fine grinding process is characterized by a high solid concentration and
the presence of excessive fines, which are two of the primary factors leading to the
formation of agglomeration or flocculation and hence the development of a yield
stress of a ground slurry. Polyacrylic acids or their salts as efficient dispersants for
wet ultra-fine grinding have been identified (He et al., 2004). A polyacrylic acid or its
salt with an optimal molecular weight used as a grinding aid can change the surface
nature of particles in a ground slurry, resulting in inter-particle forces being entirely
repulsive and improving the slurry flowability by decreasing the slurry viscosity and
by reducing or eliminating the shear yield stress. This can enhance the product
fineness, energy efficiency and throughput in wet ultra-fine grinding.
Figure 21 Effect of particle size and distribution on the flowability of 70 wt.% of solid concentration with a certain amount of Dispersant S40 at 25 ±0.2 °C. (by Bohlin viscometer)
Shear rate (1/s)
Shear rate (1/s)
App
aren
t vis
cosi
ty (P
a.s)
A
ppar
ent v
isco
sity
(Pa.
s)
a
b
32
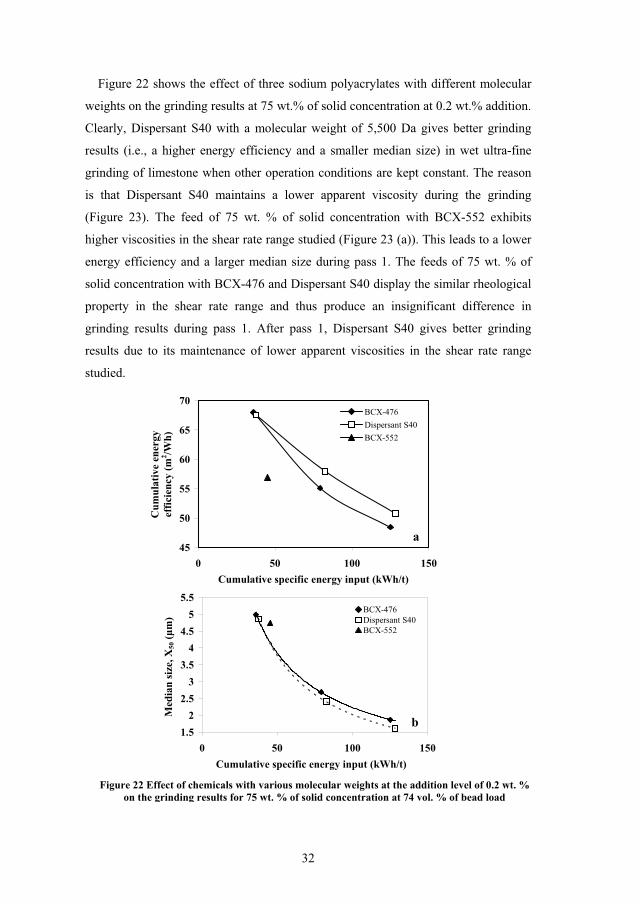
Figure 22 shows the effect of three sodium polyacrylates with different molecular
weights on the grinding results at 75 wt.% of solid concentration at 0.2 wt.% addition.
Clearly, Dispersant S40 with a molecular weight of 5,500 Da gives better grinding
results (i.e., a higher energy efficiency and a smaller median size) in wet ultra-fine
grinding of limestone when other operation conditions are kept constant. The reason
is that Dispersant S40 maintains a lower apparent viscosity during the grinding
(Figure 23). The feed of 75 wt. % of solid concentration with BCX-552 exhibits
higher viscosities in the shear rate range studied (Figure 23 (a)). This leads to a lower
energy efficiency and a larger median size during pass 1. The feeds of 75 wt. % of
solid concentration with BCX-476 and Dispersant S40 display the similar rheological
property in the shear rate range and thus produce an insignificant difference in
grinding results during pass 1. After pass 1, Dispersant S40 gives better grinding
results due to its maintenance of lower apparent viscosities in the shear rate range
studied.
45
50
55
60
65
70
0 50 100 150
BCX-476Dispersant S40BCX-552
1.52
2.53
3.54
4.55
5.5
0 50 100 150
BCX-476Dispersant S40BCX-552
Figure 22 Effect of chemicals with various molecular weights at the addition level of 0.2 wt. % on the grinding results for 75 wt. % of solid concentration at 74 vol. % of bead load
Cumulative specific energy input (kWh/t)
Cumulative specific energy input (kWh/t)
Cum
ulat
ive
ener
gy
effic
ienc
y (m
2 /Wh)
M
edia
n si
ze, X
50 (
m)
a
b

33
0
0.05
0.1
0.15
0.2
0.25
0.3
0 500 1000 1500
without dispersantBCX-476Dispersant S40BCX-552
0
0.02
0.04
0.06
0.08
0 500 1000 1500
BCX-476Dispersant S40BCX-552
0
0.02
0.04
0.06
0.08
0 500 1000 1500
BCX-476Dispersant S40
0
0.4
0.8
1.2
1.6
0 500 1000 1500
BCX-476Dispersant S40BCX-552
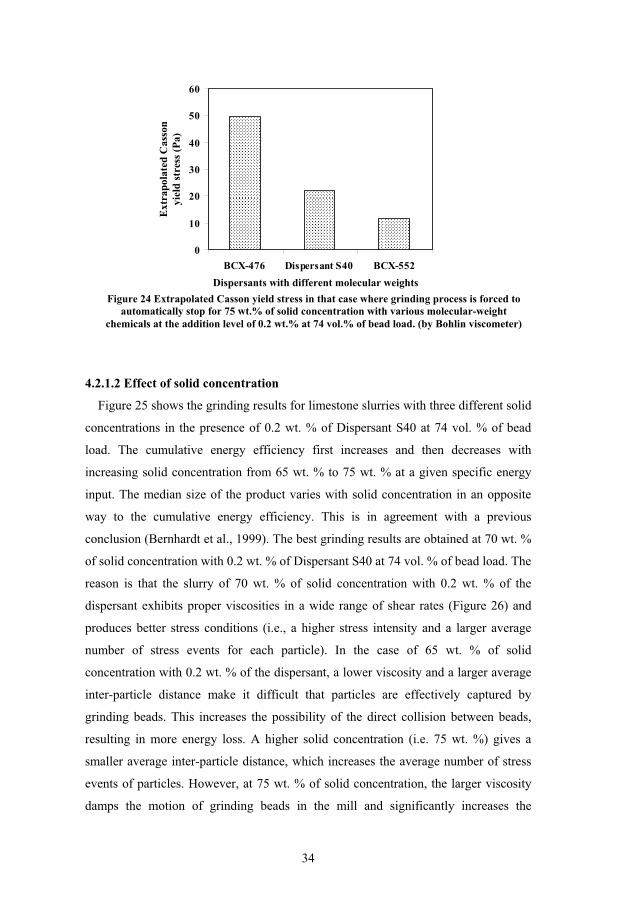
However, whatever dispersant exists at 75 wt. % of solid concentration, the
grinding operation is forced to automatically stop due to a high pressure inside the
mill chamber by a safety control device when a ground slurry presents a pseudoplastic
flow with a definite extrapolated Casson yield stress (Figures 23(d) and 24). The more
viscous slurry with a yield stress could be the reason since the slurry is circulated
through the mill by a pump, which has to use more power to make the slurry flow.
This increases the pressure in the mill up to the limit. The slurry of 75 wt. % of solid
concentration with 0.2 wt. % of BCX-552 can only be ground for one pass, but three
passes for BCX-476 or Dispersant S40. Similar results were also obtained in the case
of 70 wt. % of solid concentration with these dispersants.
a b
c d
Figure 23 Change of rheological behaviours for 75 wt. % of solid concentration with various molecular-weight chemicals at the addition level of 0.2 wt.% with increasing pass number
(grinding time) at 74 vol.% of bead load; a: feed; b: after pass 1; c: after pass 2; d: in that case where grinding is forced to stop automatically. (by Bohlin viscometer)
Shear rate (1/s)
App
aren
t vis
cosi
ty (P
a·s)
34
0
10
20
30
40
50
60
BCX-476 Dispersant S40 BCX-552
4.2.1.2 Effect of solid concentration
Figure 25 shows the grinding results for limestone slurries with three different solid
concentrations in the presence of 0.2 wt. % of Dispersant S40 at 74 vol. % of bead
load. The cumulative energy efficiency first increases and then decreases with
increasing solid concentration from 65 wt. % to 75 wt. % at a given specific energy
input. The median size of the product varies with solid concentration in an opposite
way to the cumulative energy efficiency. This is in agreement with a previous
conclusion (Bernhardt et al., 1999). The best grinding results are obtained at 70 wt. %
of solid concentration with 0.2 wt. % of Dispersant S40 at 74 vol. % of bead load. The
reason is that the slurry of 70 wt. % of solid concentration with 0.2 wt. % of the
dispersant exhibits proper viscosities in a wide range of shear rates (Figure 26) and
produces better stress conditions (i.e., a higher stress intensity and a larger average
number of stress events for each particle). In the case of 65 wt. % of solid
concentration with 0.2 wt. % of the dispersant, a lower viscosity and a larger average
inter-particle distance make it difficult that particles are effectively captured by
grinding beads. This increases the possibility of the direct collision between beads,
resulting in more energy loss. A higher solid concentration (i.e. 75 wt. %) gives a
smaller average inter-particle distance, which increases the average number of stress
events of particles. However, at 75 wt. % of solid concentration, the larger viscosity
damps the motion of grinding beads in the mill and significantly increases the
Ext
rapo
late
d C
asso
n yi
eld
stre
ss (P
a)
Figure 24 Extrapolated Casson yield stress in that case where grinding process is forced to automatically stop for 75 wt.% of solid concentration with various molecular-weight
chemicals at the addition level of 0.2 wt.% at 74 vol.% of bead load. (by Bohlin viscometer)
Dispersants with different molecular weights
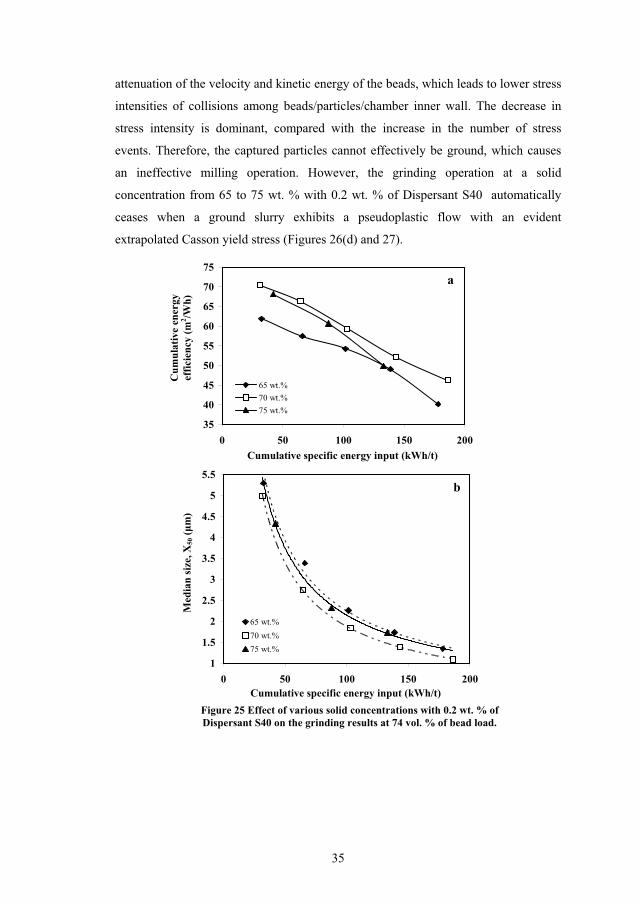
35
attenuation of the velocity and kinetic energy of the beads, which leads to lower stress
intensities of collisions among beads/particles/chamber inner wall. The decrease in
stress intensity is dominant, compared with the increase in the number of stress
events. Therefore, the captured particles cannot effectively be ground, which causes
an ineffective milling operation. However, the grinding operation at a solid
concentration from 65 to 75 wt. % with 0.2 wt. % of Dispersant S40 automatically
ceases when a ground slurry exhibits a pseudoplastic flow with an evident
extrapolated Casson yield stress (Figures 26(d) and 27).
35
40
45
50
55
60
65
70
75
0 50 100 150 200
65 wt.%70 wt.%75 wt.%
1
1.5
2
2.5
3
3.5
4
4.5
5
5.5
0 50 100 150 200
65 wt.%70 wt.%75 wt.%
Cumulative specific energy input (kWh/t)
Cumulative specific energy input (kWh/t)
Figure 25 Effect of various solid concentrations with 0.2 wt. % of Dispersant S40 on the grinding results at 74 vol. % of bead load.
a
b
Med
ian
size
, X50
(m
)C
umul
ativ
e en
ergy
ef
ficie
ncy
(m2 /W
h)
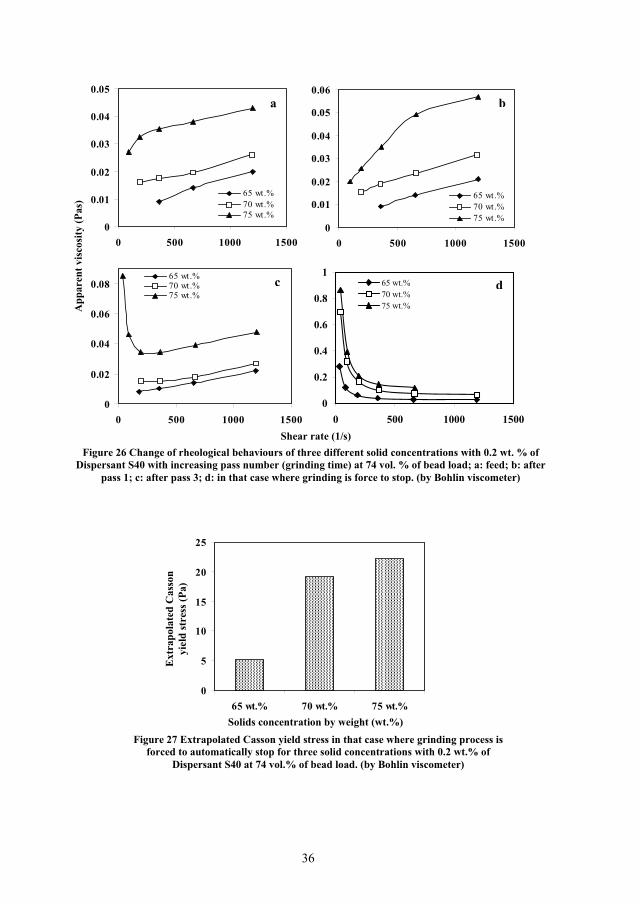
36
0
0.01
0.02
0.03
0.04
0.05
0 500 1000 1500
65 wt.%70 wt.%75 wt.%
0
0.01
0.02
0.03
0.04
0.05
0.06
0 500 1000 1500
65 wt.%70 wt.%75 wt.%
0
0.02
0.04
0.06
0.08
0 500 1000 1500
65 wt.%70 wt.%75 wt.%
0
0.2
0.4
0.6
0.8
1
0 500 1000 1500
65 wt.%70 wt.%75 wt.%
0
5
10
15
20
25
65 wt.% 70 wt.% 75 wt.%
Figure 26 Change of rheological behaviours of three different solid concentrations with 0.2 wt. % of Dispersant S40 with increasing pass number (grinding time) at 74 vol. % of bead load; a: feed; b: after
pass 1; c: after pass 3; d: in that case where grinding is force to stop. (by Bohlin viscometer)
a b
c d
Shear rate (1/s)
App
aren
t vis
cosi
ty (P
as)
Ext
rapo
late
d C
asso
n yi
eld
stre
ss (P
a)
Figure 27 Extrapolated Casson yield stress in that case where grinding process is forced to automatically stop for three solid concentrations with 0.2 wt.% of
Dispersant S40 at 74 vol.% of bead load. (by Bohlin viscometer)
Solids concentration by weight (wt.%)
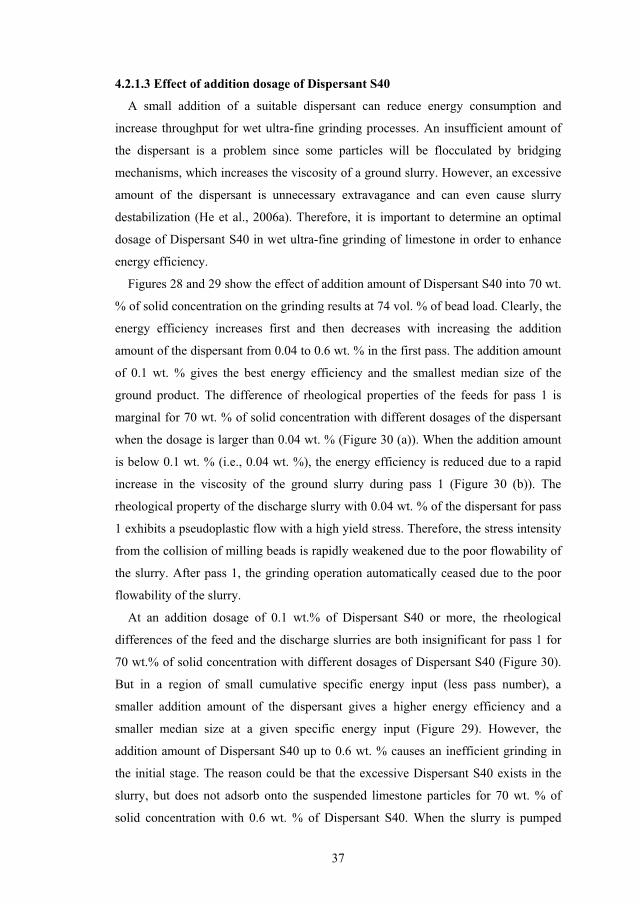
37
4.2.1.3 Effect of addition dosage of Dispersant S40
A small addition of a suitable dispersant can reduce energy consumption and
increase throughput for wet ultra-fine grinding processes. An insufficient amount of
the dispersant is a problem since some particles will be flocculated by bridging
mechanisms, which increases the viscosity of a ground slurry. However, an excessive
amount of the dispersant is unnecessary extravagance and can even cause slurry
destabilization (He et al., 2006a). Therefore, it is important to determine an optimal
dosage of Dispersant S40 in wet ultra-fine grinding of limestone in order to enhance
energy efficiency.
Figures 28 and 29 show the effect of addition amount of Dispersant S40 into 70 wt.
% of solid concentration on the grinding results at 74 vol. % of bead load. Clearly, the
energy efficiency increases first and then decreases with increasing the addition
amount of the dispersant from 0.04 to 0.6 wt. % in the first pass. The addition amount
of 0.1 wt. % gives the best energy efficiency and the smallest median size of the
ground product. The difference of rheological properties of the feeds for pass 1 is
marginal for 70 wt. % of solid concentration with different dosages of the dispersant
when the dosage is larger than 0.04 wt. % (Figure 30 (a)). When the addition amount
is below 0.1 wt. % (i.e., 0.04 wt. %), the energy efficiency is reduced due to a rapid
increase in the viscosity of the ground slurry during pass 1 (Figure 30 (b)). The
rheological property of the discharge slurry with 0.04 wt. % of the dispersant for pass
1 exhibits a pseudoplastic flow with a high yield stress. Therefore, the stress intensity
from the collision of milling beads is rapidly weakened due to the poor flowability of
the slurry. After pass 1, the grinding operation automatically ceased due to the poor
flowability of the slurry.
At an addition dosage of 0.1 wt.% of Dispersant S40 or more, the rheological
differences of the feed and the discharge slurries are both insignificant for pass 1 for
70 wt.% of solid concentration with different dosages of Dispersant S40 (Figure 30).
But in a region of small cumulative specific energy input (less pass number), a
smaller addition amount of the dispersant gives a higher energy efficiency and a
smaller median size at a given specific energy input (Figure 29). However, the
addition amount of Dispersant S40 up to 0.6 wt. % causes an inefficient grinding in
the initial stage. The reason could be that the excessive Dispersant S40 exists in the
slurry, but does not adsorb onto the suspended limestone particles for 70 wt. % of
solid concentration with 0.6 wt. % of Dispersant S40. When the slurry is pumped
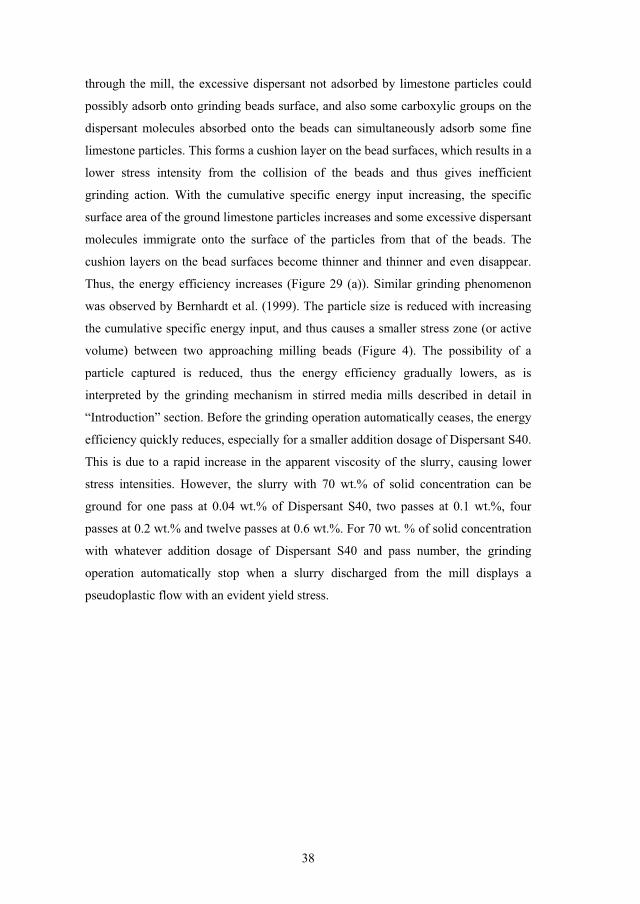
38
through the mill, the excessive dispersant not adsorbed by limestone particles could
possibly adsorb onto grinding beads surface, and also some carboxylic groups on the
dispersant molecules absorbed onto the beads can simultaneously adsorb some fine
limestone particles. This forms a cushion layer on the bead surfaces, which results in a
lower stress intensity from the collision of the beads and thus gives inefficient
grinding action. With the cumulative specific energy input increasing, the specific
surface area of the ground limestone particles increases and some excessive dispersant
molecules immigrate onto the surface of the particles from that of the beads. The
cushion layers on the bead surfaces become thinner and thinner and even disappear.
Thus, the energy efficiency increases (Figure 29 (a)). Similar grinding phenomenon
was observed by Bernhardt et al. (1999). The particle size is reduced with increasing
the cumulative specific energy input, and thus causes a smaller stress zone (or active
volume) between two approaching milling beads (Figure 4). The possibility of a
particle captured is reduced, thus the energy efficiency gradually lowers, as is
interpreted by the grinding mechanism in stirred media mills described in detail in
“Introduction” section. Before the grinding operation automatically ceases, the energy
efficiency quickly reduces, especially for a smaller addition dosage of Dispersant S40.
This is due to a rapid increase in the apparent viscosity of the slurry, causing lower
stress intensities. However, the slurry with 70 wt.% of solid concentration can be
ground for one pass at 0.04 wt.% of Dispersant S40, two passes at 0.1 wt.%, four
passes at 0.2 wt.% and twelve passes at 0.6 wt.%. For 70 wt. % of solid concentration
with whatever addition dosage of Dispersant S40 and pass number, the grinding
operation automatically stop when a slurry discharged from the mill displays a
pseudoplastic flow with an evident yield stress.
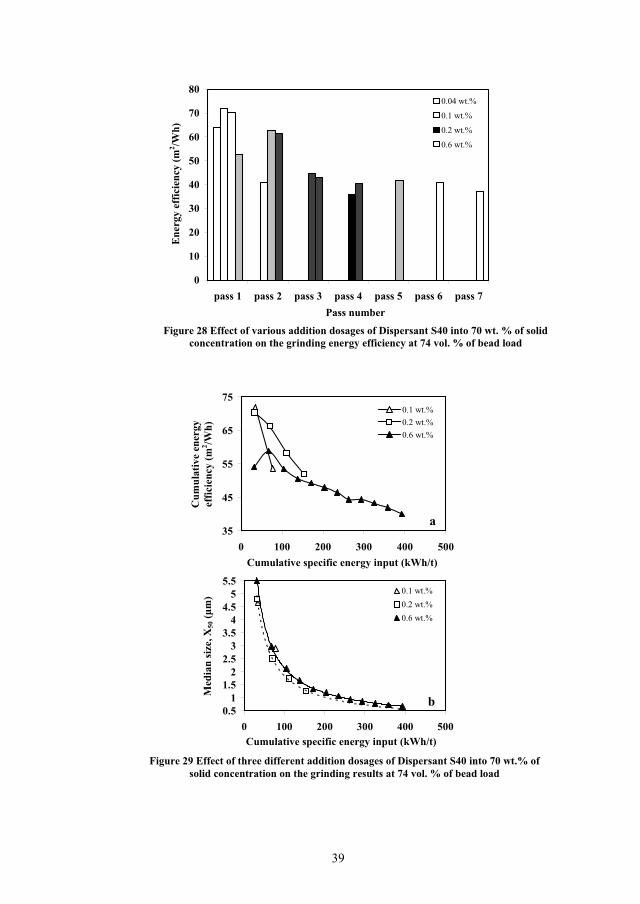
39
0
10
20
30
40
50
60
70
80
pass 1 pass 2 pass 3 pass 4 pass 5 pass 6 pass 7
0.04 wt.%
0.1 wt.%
0.2 wt.%
0.6 wt.%
35
45
55
65
75
0 100 200 300 400 500
0.1 wt.%0.2 wt.%0.6 wt.%
0.51
1.52
2.53
3.54
4.55
5.5
0 100 200 300 400 500
0.1 wt.%0.2 wt.%0.6 wt.%
Figure 28 Effect of various addition dosages of Dispersant S40 into 70 wt. % of solid concentration on the grinding energy efficiency at 74 vol. % of bead load
Figure 29 Effect of three different addition dosages of Dispersant S40 into 70 wt.% of solid concentration on the grinding results at 74 vol. % of bead load
Cumulative specific energy input (kWh/t)
Cumulative specific energy input (kWh/t)
Med
ian
size
, X50
(m
)
a
b
Cum
ulat
ive
ener
gy
effic
ienc
y (m
2 /Wh)
Ene
rgy
effic
ienc
y (m
2 /Wh)
Pass number

40
0
0.01
0.02
0.03
0 500 1000 1500
0.04 wt.%0.1 wt.%0.2 wt.%0.6 wt.%
0
0.2
0.4
0.6
0.8
1
0 500 1000 1500
0.04 wt.%0.1 wt.%0.2 wt.%0.6 wt.%
4.2.1.4 Effect of addition method of Dispersant S40
The achievement of a specific product fineness needs a certain addition amount of a
suitable dispersant for a ground limestone slurry at a given solid concentration (paper
5). For instance, at 70 wt. % of solid concentration, at least 0.5 wt. % of Dispersant
S40 is indispensable for the achievement of the product fineness of 90% passing 2
m. To avoid the detrimental effect of excessive Dispersant S40 in a ground
limestone slurry, the multi-point addition of the dispersant was adopted (Wang and
Forssberg, 1995). Figure 31 shows the effect of multi-point and single-point additions
of Dispersant S40 on wet ultra-fine grinding of the limestone. It is evident that an
insignificant difference exists between three-point and one-point additions for 70 wt.
% of solid concentration at an addition level of 0.2 wt. % of Dispersant S40 at 74 vol.
% of bead load. This is because the existence of a small addition amount (i.e., 0.2 wt.
%) in the limestone slurry cannot form a cushion layer on the milling bead surfaces.
However, in the case of 75 wt. % of solid concentration, the multi-point addition of
0.6 wt. % Dispersant S40 gives a higher energy efficiency in a range of lower specific
energy input (i.e., < 200 kWh/t). While at a higher level of the specific energy input >
300 kWh/t, the difference in cumulative energy efficiency resulting from different
addition methods of Dispersant S40 is marginal. For an addition amount of 0.6 wt.%
of the dispersant, a multi-point addition avoids the existence of the excessive
dispersant, and thus the formation of a cushion layer on milling bead surfaces in the
lower specific energy input.
Figure 30 Rheological properties of the feed and discharge slurries for 70 wt.% of solid concentration with various addition dosages of Dispersant S40 for pass 1: a,
Feeds; b, Discharges. (by Bohlin viscometer)
App
aren
t vis
cosi
ty (P
a·s)
ba
Shear rate (1/s)
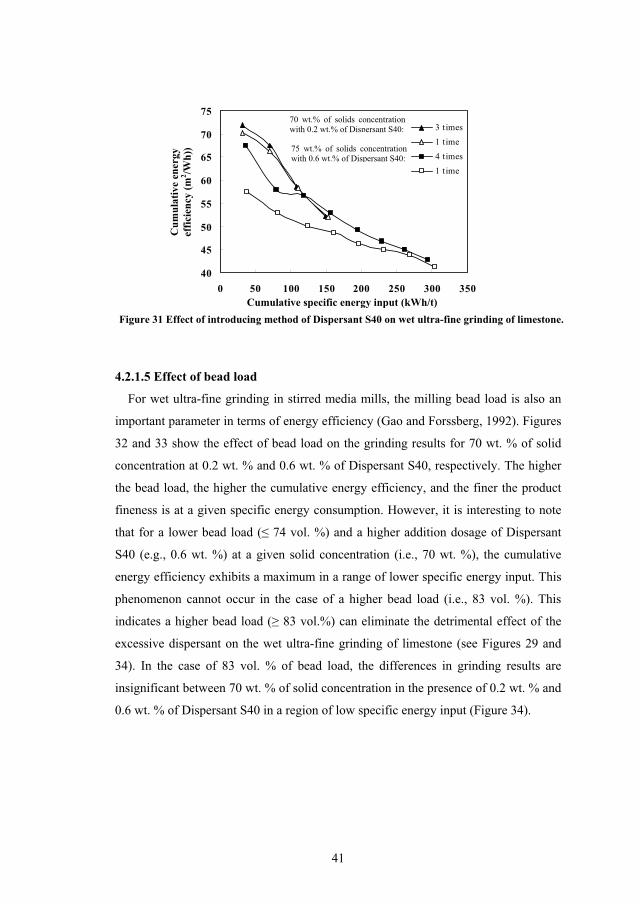
41
40
45
50
55
60
65
70
75
0 50 100 150 200 250 300 350
3 times1 time4 times1 time
4.2.1.5 Effect of bead load
For wet ultra-fine grinding in stirred media mills, the milling bead load is also an
important parameter in terms of energy efficiency (Gao and Forssberg, 1992). Figures
32 and 33 show the effect of bead load on the grinding results for 70 wt. % of solid
concentration at 0.2 wt. % and 0.6 wt. % of Dispersant S40, respectively. The higher
the bead load, the higher the cumulative energy efficiency, and the finer the product
fineness is at a given specific energy consumption. However, it is interesting to note
that for a lower bead load ( 74 vol. %) and a higher addition dosage of Dispersant
S40 (e.g., 0.6 wt. %) at a given solid concentration (i.e., 70 wt. %), the cumulative
energy efficiency exhibits a maximum in a range of lower specific energy input. This
phenomenon cannot occur in the case of a higher bead load (i.e., 83 vol. %). This
indicates a higher bead load ( 83 vol.%) can eliminate the detrimental effect of the
excessive dispersant on the wet ultra-fine grinding of limestone (see Figures 29 and
34). In the case of 83 vol. % of bead load, the differences in grinding results are
insignificant between 70 wt. % of solid concentration in the presence of 0.2 wt. % and
0.6 wt. % of Dispersant S40 in a region of low specific energy input (Figure 34).
Cumulative specific energy input (kWh/t)
Cum
ulat
ive
ener
gy
effic
ienc
y (m
2 /Wh)
)
Figure 31 Effect of introducing method of Dispersant S40 on wet ultra-fine grinding of limestone.
70 wt.% of solids concentration with 0.2 wt.% of Dispersant S40:
75 wt.% of solids concentration with 0.6 wt.% of Dispersant S40:
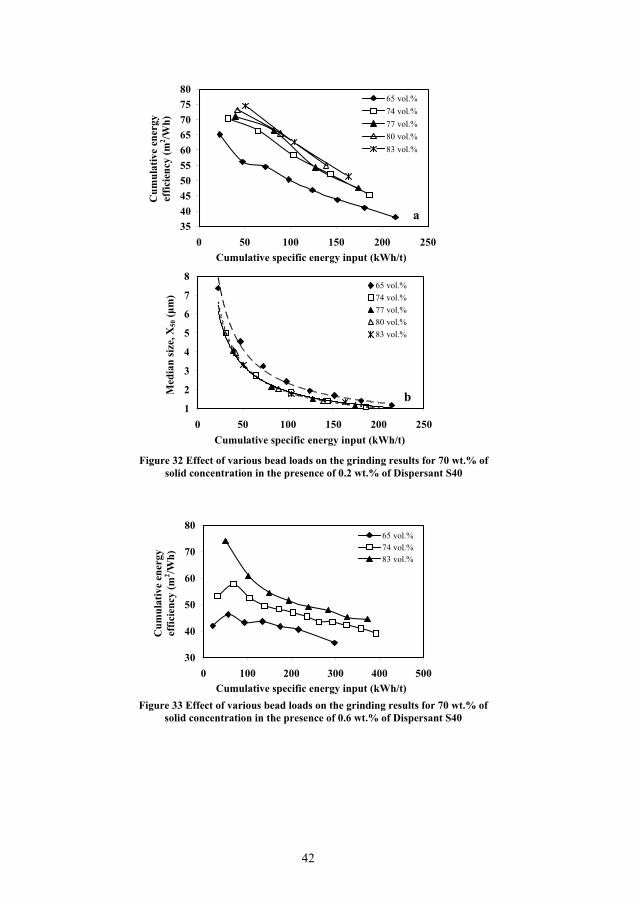
42
35404550556065707580
0 50 100 150 200 250
65 vol.%74 vol.%77 vol.%80 vol.%83 vol.%
1
2
3
4
5
6
7
8
0 50 100 150 200 250
65 vol.%74 vol.%77 vol.%80 vol.%83 vol.%
30
40
50
60
70
80
0 100 200 300 400 500
65 vol.%74 vol.%83 vol.%
Figure 32 Effect of various bead loads on the grinding results for 70 wt.% of solid concentration in the presence of 0.2 wt.% of Dispersant S40
Cumulative specific energy input (kWh/t)
Cumulative specific energy input (kWh/t)
Cum
ulat
ive
ener
gy
effic
ienc
y (m
2 /Wh)
a
b
Cumulative specific energy input (kWh/t)Figure 33 Effect of various bead loads on the grinding results for 70 wt.% of
solid concentration in the presence of 0.6 wt.% of Dispersant S40
Med
ian
size
, X50
(m
)C
umul
ativ
e en
ergy
ef
ficie
ncy
(m2 /W
h)
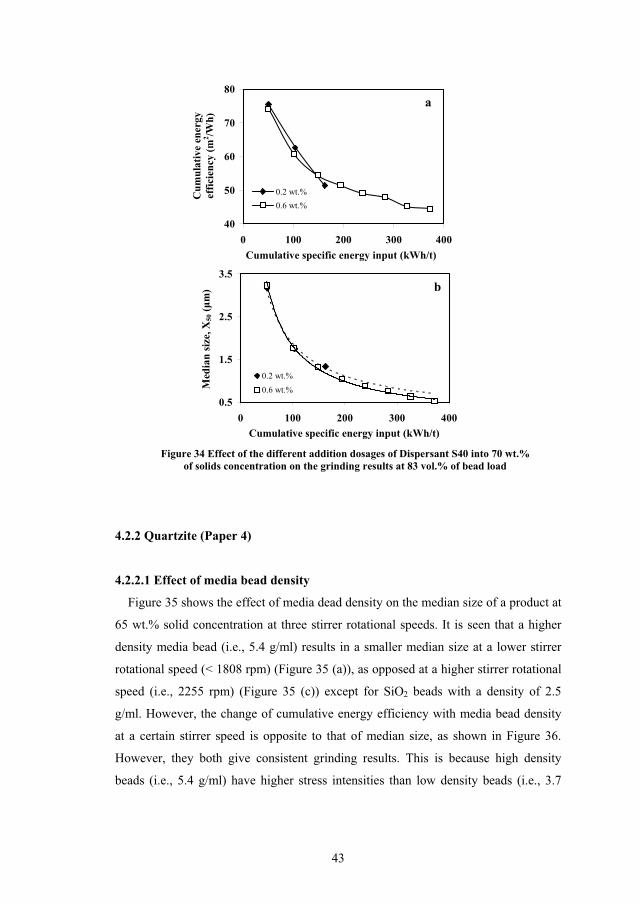
43
40
50
60
70
80
0 100 200 300 400
0.2 wt.%0.6 wt.%
0.5
1.5
2.5
3.5
0 100 200 300 400
0.2 wt.%0.6 wt.%
4.2.2 Quartzite (Paper 4)
4.2.2.1 Effect of media bead density
Figure 35 shows the effect of media dead density on the median size of a product at
65 wt.% solid concentration at three stirrer rotational speeds. It is seen that a higher
density media bead (i.e., 5.4 g/ml) results in a smaller median size at a lower stirrer
rotational speed (< 1808 rpm) (Figure 35 (a)), as opposed at a higher stirrer rotational
speed (i.e., 2255 rpm) (Figure 35 (c)) except for SiO2 beads with a density of 2.5
g/ml. However, the change of cumulative energy efficiency with media bead density
at a certain stirrer speed is opposite to that of median size, as shown in Figure 36.
However, they both give consistent grinding results. This is because high density
beads (i.e., 5.4 g/ml) have higher stress intensities than low density beads (i.e., 3.7
Cumulative specific energy input (kWh/t)
Cumulative specific energy input (kWh/t)
Figure 34 Effect of the different addition dosages of Dispersant S40 into 70 wt.% of solids concentration on the grinding results at 83 vol.% of bead load
a
b
Cum
ulat
ive
ener
gy
effic
ienc
y (m
2 /Wh)
M
edia
n si
ze, X
50 (
m)
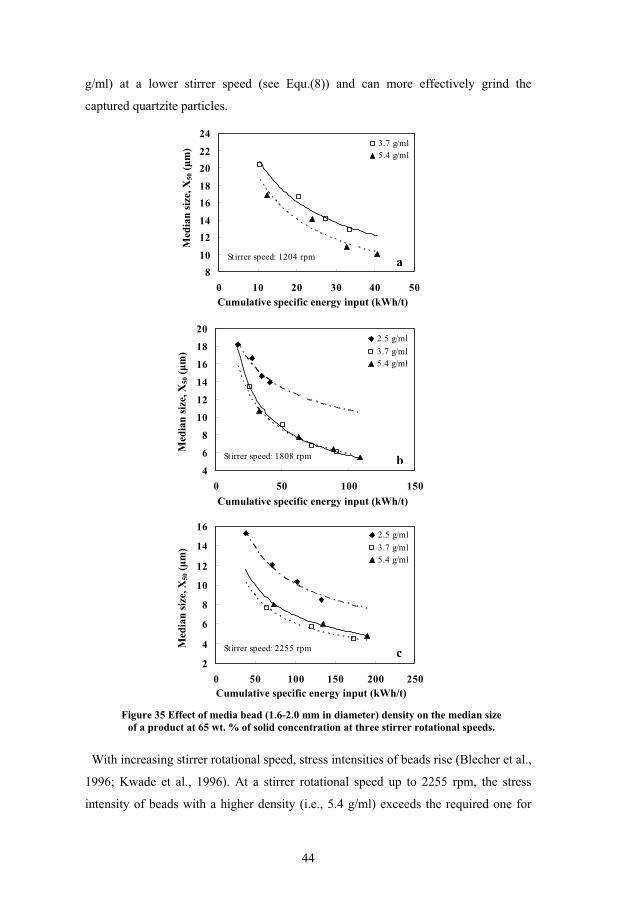
44
g/ml) at a lower stirrer speed (see Equ.(8)) and can more effectively grind the
captured quartzite particles.
Stirrer speed: 1204 rpm
810
1214
1618
2022
24
0 10 20 30 40 50
3.7 g/ml5.4 g/ml
Stirrer speed: 1808 rpm
4
6
8
10
12
14
16
18
20
0 50 100 150
2.5 g/ml3.7 g/ml5.4 g/ml
Stirrer speed: 2255 rpm
2
4
6
8
10
12
14
16
0 50 100 150 200 250
2.5 g/ml3.7 g/ml5.4 g/ml
With increasing stirrer rotational speed, stress intensities of beads rise (Blecher et al.,
1996; Kwade et al., 1996). At a stirrer rotational speed up to 2255 rpm, the stress
intensity of beads with a higher density (i.e., 5.4 g/ml) exceeds the required one for
Cumulative specific energy input (kWh/t)
Cumulative specific energy input (kWh/t)
Cumulative specific energy input (kWh/t)
Med
ian
size
, X50
(m
)M
edia
n si
ze, X
50 (
m)
Med
ian
size
, X50
(m
)
Figure 35 Effect of media bead (1.6-2.0 mm in diameter) density on the median size of a product at 65 wt. % of solid concentration at three stirrer rotational speeds.
c
b
a
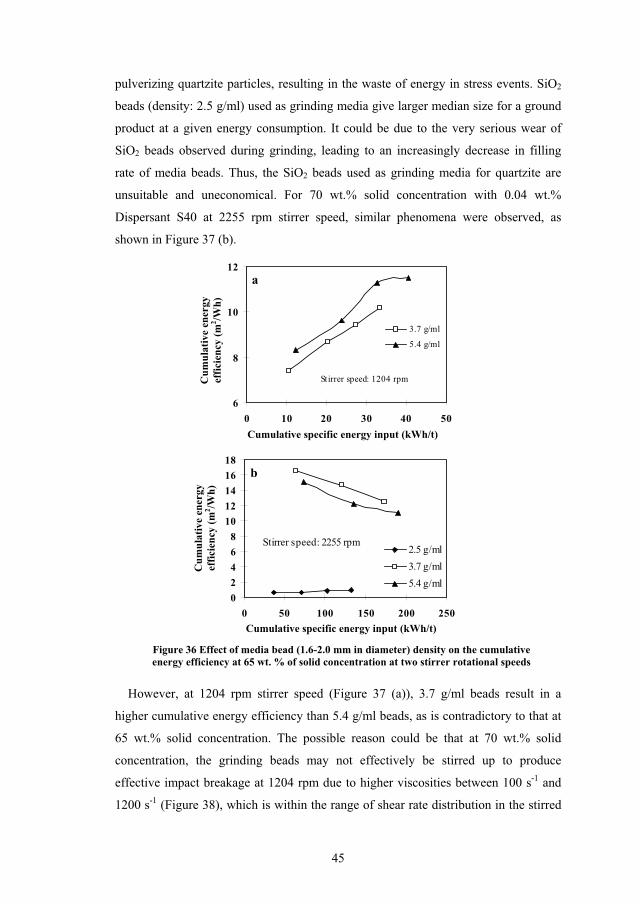
45
pulverizing quartzite particles, resulting in the waste of energy in stress events. SiO2
beads (density: 2.5 g/ml) used as grinding media give larger median size for a ground
product at a given energy consumption. It could be due to the very serious wear of
SiO2 beads observed during grinding, leading to an increasingly decrease in filling
rate of media beads. Thus, the SiO2 beads used as grinding media for quartzite are
unsuitable and uneconomical. For 70 wt.% solid concentration with 0.04 wt.%
Dispersant S40 at 2255 rpm stirrer speed, similar phenomena were observed, as
shown in Figure 37 (b).
Stirrer speed: 1204 rpm
6
8
10
12
0 10 20 30 40 50
3.7 g/ml
5.4 g/ml
Stirrer speed: 2255 rpm
02468
1012141618
0 50 100 150 200 250
2.5 g/ml3.7 g/ml5.4 g/ml
However, at 1204 rpm stirrer speed (Figure 37 (a)), 3.7 g/ml beads result in a
higher cumulative energy efficiency than 5.4 g/ml beads, as is contradictory to that at
65 wt.% solid concentration. The possible reason could be that at 70 wt.% solid
concentration, the grinding beads may not effectively be stirred up to produce
effective impact breakage at 1204 rpm due to higher viscosities between 100 s-1 and
1200 s-1 (Figure 38), which is within the range of shear rate distribution in the stirred
Cumulative specific energy input (kWh/t)
Cumulative specific energy input (kWh/t)
Cum
ulat
ive
ener
gy
effic
ienc
y (m
2 /Wh)
Cum
ulat
ive
ener
gy
effic
ienc
y (m
2 /Wh)
Figure 36 Effect of media bead (1.6-2.0 mm in diameter) density on the cumulative energy efficiency at 65 wt. % of solid concentration at two stirrer rotational speeds
b
a
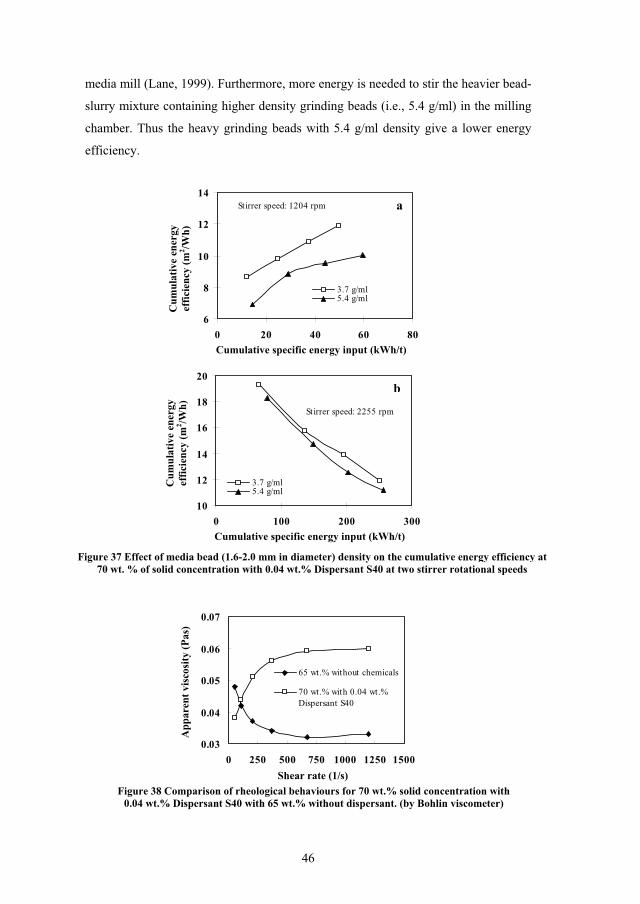
46
media mill (Lane, 1999). Furthermore, more energy is needed to stir the heavier bead-
slurry mixture containing higher density grinding beads (i.e., 5.4 g/ml) in the milling
chamber. Thus the heavy grinding beads with 5.4 g/ml density give a lower energy
efficiency.
Stirrer speed: 1204 rpm
6
8
10
12
14
0 20 40 60 80
3.7 g/ml5.4 g/ml
Stirrer speed: 2255 rpm
10
12
14
16
18
20
0 100 200 300
3.7 g/ml5.4 g/ml
0.03
0.04
0.05
0.06
0.07
0 250 500 750 1000 1250 1500
65 wt.% without chemicals
70 wt.% with 0.04 wt.%Dispersant S40
Figure 37 Effect of media bead (1.6-2.0 mm in diameter) density on the cumulative energy efficiency at 70 wt. % of solid concentration with 0.04 wt.% Dispersant S40 at two stirrer rotational speeds
Cumulative specific energy input (kWh/t)
Cumulative specific energy input (kWh/t)
Cum
ulat
ive
ener
gy
effic
ienc
y (m
2 /Wh)
C
umul
ativ
e en
ergy
ef
ficie
ncy
(m2 /W
h)
a
b
Shear rate (1/s)
App
aren
t vis
cosi
ty (P
as)
Figure 38 Comparison of rheological behaviours for 70 wt.% solid concentration with 0.04 wt.% Dispersant S40 with 65 wt.% without dispersant. (by Bohlin viscometer)

47
4.2.2.2 Effect of chemical
Chemicals have an important impact on wet ultra-fine grinding in stirred media
mills since the addition of chemicals can modify the rheology of a ground slurry (He
et al, 2006a and b). The effect of addition of Flotigam P or Dispersant S40 on wet
ultrafine grinding of quartzite was investigated. Figure 39 shows the grinding results
at 65 wt.% solid concentration using 1.6-2.0 mm media beads with 3.7 g/ml density.
Bead density: 3.7 g/ml4
6
8
10
12
14
0 50 100 150
No
0.04 wt.%Dispersant S40 0.04 wt.%Flotigam P
68
1012141618202224
0 50 100 150
Clearly, Dispersant S40 leads to better grinding results (i.e., a higher energy
efficiency and a smaller median size) when quartzite is ground in the stirred bead
mill. The reason is that Dispersant S40 maintains lower viscosities at shear rates
studied for 65 wt.% solid concentration during the grinding (see Figure 40). However,
65 wt. % of solid concentration with 0.04 wt.% Flotigam P exhibits higher viscosities
at shear rates studied during the grinding, which damp the motion of grinding beads in
the mill and significantly increase the attenuation of the velocity and kinetic energy of
the beads. This brings about lower stress intensities of collisions among
Cumulative specific energy input (kWh/t)
Cumulative specific energy input (kWh/t)
Med
ian
size
, X50
(m
)C
umul
ativ
e en
ergy
ef
ficie
ncy
(m2 /W
h)
Figure 39 Effect of chemicals on grinding results at 65 wt. % of solid concentration with 1.6-2.0 mm media beads with a density of 3.7 g/ml.
b
a
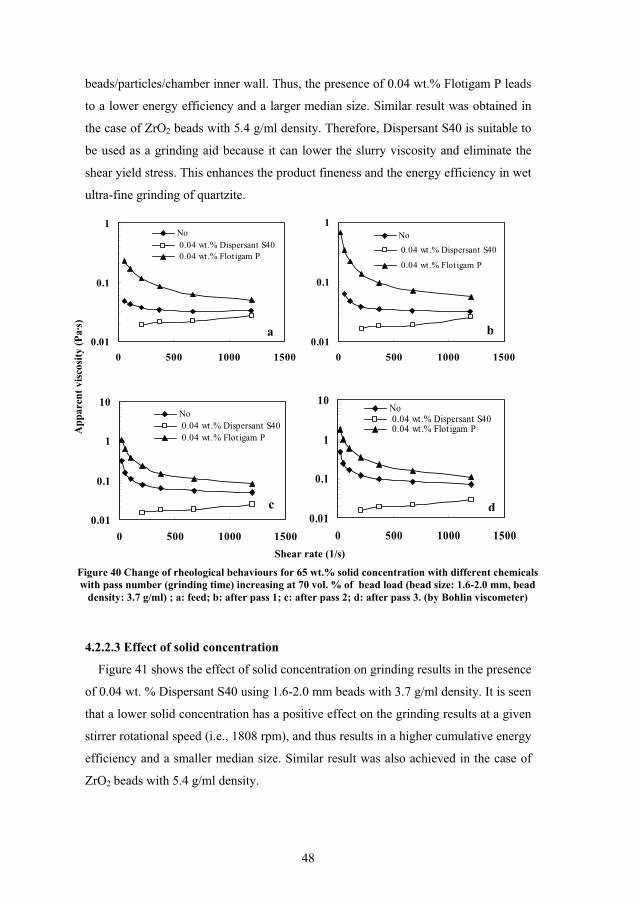
48
beads/particles/chamber inner wall. Thus, the presence of 0.04 wt.% Flotigam P leads
to a lower energy efficiency and a larger median size. Similar result was obtained in
the case of ZrO2 beads with 5.4 g/ml density. Therefore, Dispersant S40 is suitable to
be used as a grinding aid because it can lower the slurry viscosity and eliminate the
shear yield stress. This enhances the product fineness and the energy efficiency in wet
ultra-fine grinding of quartzite.
0.01
0.1
1
0 500 1000 1500
No 0.04 wt.% Dispersant S40 0.04 wt.% Flotigam P
0.01
0.1
1
0 500 1000 1500
No 0.04 wt.% Dispersant S40
0.04 wt.% Flotigam P
0.01
0.1
1
10
0 500 1000 1500
No 0.04 wt.% Dispersant S40 0.04 wt.% Flotigam P
0.01
0.1
1
10
0 500 1000 1500
No 0.04 wt.% Dispersant S40 0.04 wt.% Flotigam P
4.2.2.3 Effect of solid concentration
Figure 41 shows the effect of solid concentration on grinding results in the presence
of 0.04 wt. % Dispersant S40 using 1.6-2.0 mm beads with 3.7 g/ml density. It is seen
that a lower solid concentration has a positive effect on the grinding results at a given
stirrer rotational speed (i.e., 1808 rpm), and thus results in a higher cumulative energy
efficiency and a smaller median size. Similar result was also achieved in the case of
ZrO2 beads with 5.4 g/ml density.
a b
c d
Shear rate (1/s)
App
aren
t vis
cosi
ty (P
a·s)
Figure 40 Change of rheological behaviours for 65 wt.% solid concentration with different chemicals with pass number (grinding time) increasing at 70 vol. % of bead load (bead size: 1.6-2.0 mm, bead
density: 3.7 g/ml) ; a: feed; b: after pass 1; c: after pass 2; d: after pass 3. (by Bohlin viscometer)

49
Although a higher solid concentration (i.e. 70 wt. %) gives a smaller average
interparticle distance, which leads to a larger average number of stress events of each
particle, 70 wt. % of solid concentration with 0.04 wt.% Dispersant S40 exhibits a
larger viscosity than 65 wt.% in the range of shear rates studied during the grinding
(Figure 42). It retards the motion of grinding beads in the mill and significantly
attenuates the velocity of the beads, which results in lower stress intensities of
collisions between beads and beads or chamber inner wall. Therefore, the captured
particles cannot be effectively ground, which causes a lower cumulative energy
efficiency and a larger median size at a given specific energy consumption.
Bead density: 3.7 g/mlBead size: 1.6-2.0 mm
4
6
8
10
12
14
0 50 100 150 200
65 wt.%70 wt.%
Bead density: 3.7 g/mlBead size: 1.6-2.0 mm
12
14
16
18
20
22
24
0 50 100 150 200
65 wt.%70 wt.%
Cumulative specific energy input (kWh/t)
Cumulative specific energy input (kWh/t)
Cum
ulat
ive
ener
gy
effic
ienc
y (m
2 /Wh)
M
edia
n si
ze, X
50 (
m)
Figure 41 Effect of solid concentration with 0.04 wt.% Dispersant S40 on grinding results at 1808 rpm stirrer rotational speed with 1.6-2.0 mm media beads with a density of 3.7 g/ml.
a
b
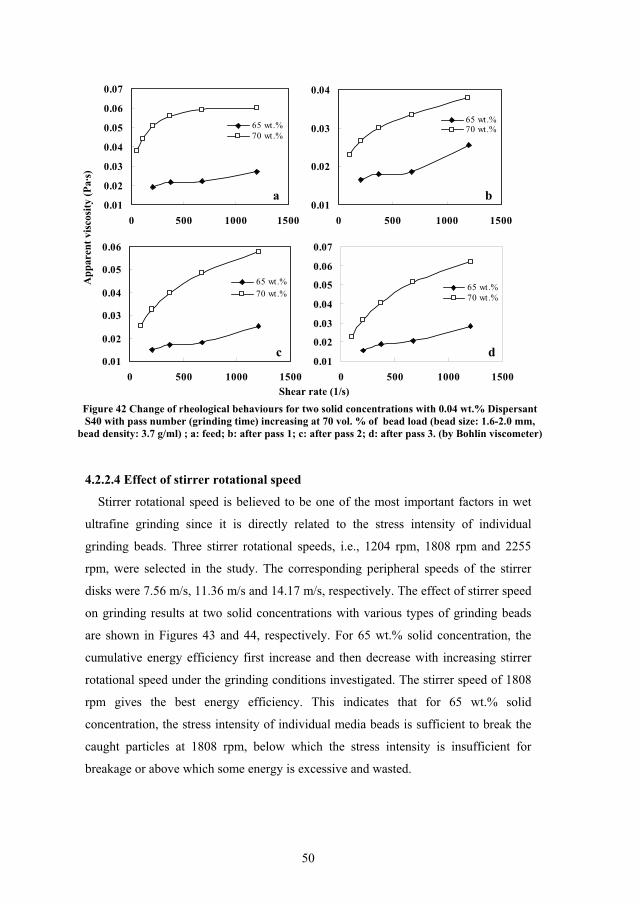
50
0.01
0.02
0.03
0.04
0.05
0.06
0.07
0 500 1000 1500
65 wt.%70 wt.%
0.01
0.02
0.03
0.04
0 500 1000 1500
65 wt.%70 wt.%
0.01
0.02
0.03
0.04
0.05
0.06
0 500 1000 1500
65 wt.%70 wt.%
0.01
0.02
0.03
0.04
0.05
0.06
0.07
0 500 1000 1500
65 wt.%70 wt.%
4.2.2.4 Effect of stirrer rotational speed
Stirrer rotational speed is believed to be one of the most important factors in wet
ultrafine grinding since it is directly related to the stress intensity of individual
grinding beads. Three stirrer rotational speeds, i.e., 1204 rpm, 1808 rpm and 2255
rpm, were selected in the study. The corresponding peripheral speeds of the stirrer
disks were 7.56 m/s, 11.36 m/s and 14.17 m/s, respectively. The effect of stirrer speed
on grinding results at two solid concentrations with various types of grinding beads
are shown in Figures 43 and 44, respectively. For 65 wt.% solid concentration, the
cumulative energy efficiency first increase and then decrease with increasing stirrer
rotational speed under the grinding conditions investigated. The stirrer speed of 1808
rpm gives the best energy efficiency. This indicates that for 65 wt.% solid
concentration, the stress intensity of individual media beads is sufficient to break the
caught particles at 1808 rpm, below which the stress intensity is insufficient for
breakage or above which some energy is excessive and wasted.
Shear rate (1/s)
App
aren
t vis
cosi
ty (P
a·s)
Figure 42 Change of rheological behaviours for two solid concentrations with 0.04 wt.% Dispersant S40 with pass number (grinding time) increasing at 70 vol. % of bead load (bead size: 1.6-2.0 mm,
bead density: 3.7 g/ml) ; a: feed; b: after pass 1; c: after pass 2; d: after pass 3. (by Bohlin viscometer)
a b
c d
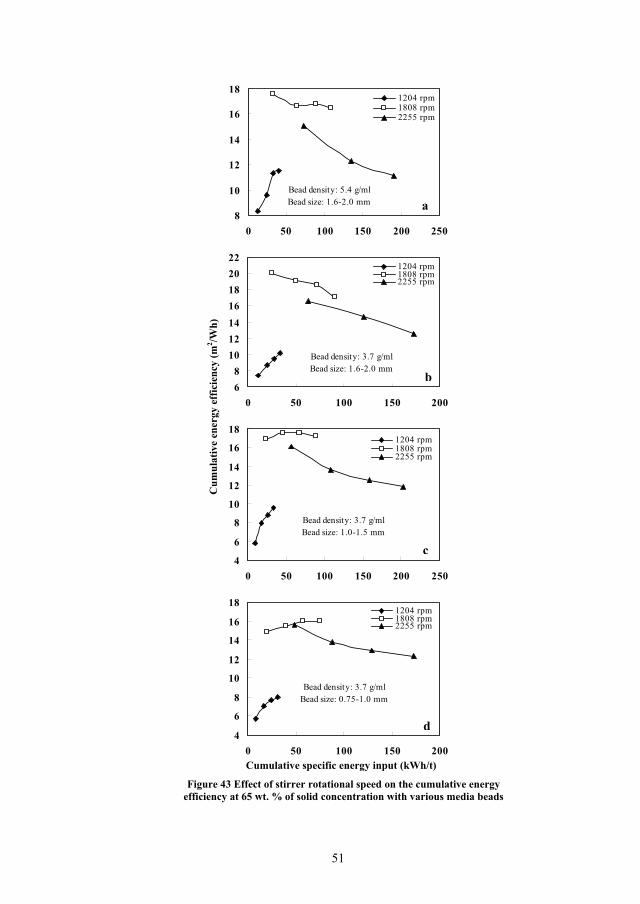
51
Bead density: 5.4 g/mlBead size: 1.6-2.0 mm
8
10
12
14
16
18
0 50 100 150 200 250
1204 rpm1808 rpm2255 rpm
Bead density: 3.7 g/mlBead size: 1.6-2.0 mm
68
10121416182022
0 50 100 150 200
1204 rpm1808 rpm2255 rpm
Bead density: 3.7 g/mlBead size: 1.0-1.5 mm
4
6
8
10
12
14
16
18
0 50 100 150 200 250
1204 rpm1808 rpm2255 rpm
Bead density: 3.7 g/mlBead size: 0.75-1.0 mm
4
6
8
10
12
14
16
18
0 50 100 150 200
1204 rpm1808 rpm2255 rpm
Cumulative specific energy input (kWh/t)
Cum
ulat
ive
ener
gy e
ffic
ienc
y (m
2 /Wh)
a
c
b
d
Figure 43 Effect of stirrer rotational speed on the cumulative energy efficiency at 65 wt. % of solid concentration with various media beads
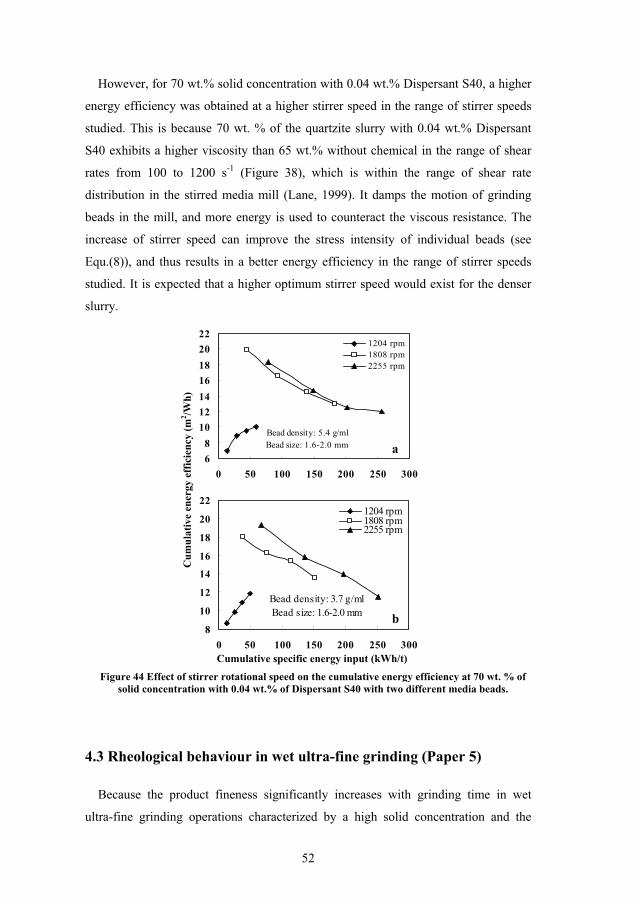
52
However, for 70 wt.% solid concentration with 0.04 wt.% Dispersant S40, a higher
energy efficiency was obtained at a higher stirrer speed in the range of stirrer speeds
studied. This is because 70 wt. % of the quartzite slurry with 0.04 wt.% Dispersant
S40 exhibits a higher viscosity than 65 wt.% without chemical in the range of shear
rates from 100 to 1200 s-1 (Figure 38), which is within the range of shear rate
distribution in the stirred media mill (Lane, 1999). It damps the motion of grinding
beads in the mill, and more energy is used to counteract the viscous resistance. The
increase of stirrer speed can improve the stress intensity of individual beads (see
Equ.(8)), and thus results in a better energy efficiency in the range of stirrer speeds
studied. It is expected that a higher optimum stirrer speed would exist for the denser
slurry.
Bead density: 5.4 g/mlBead size: 1.6-2.0 mm
68
10121416182022
0 50 100 150 200 250 300
1204 rpm1808 rpm2255 rpm
Bead density: 3.7 g/mlBead size: 1.6-2.0 mm
8
10
12
14
16
18
20
22
0 50 100 150 200 250 300
1204 rpm1808 rpm2255 rpm
4.3 Rheological behaviour in wet ultra-fine grinding (Paper 5)
Because the product fineness significantly increases with grinding time in wet
ultra-fine grinding operations characterized by a high solid concentration and the
Cumulative specific energy input (kWh/t)
Cum
ulat
ive
ener
gy e
ffic
ienc
y (m
2 /Wh)
a
b
Figure 44 Effect of stirrer rotational speed on the cumulative energy efficiency at 70 wt. % of solid concentration with 0.04 wt.% of Dispersant S40 with two different media beads.
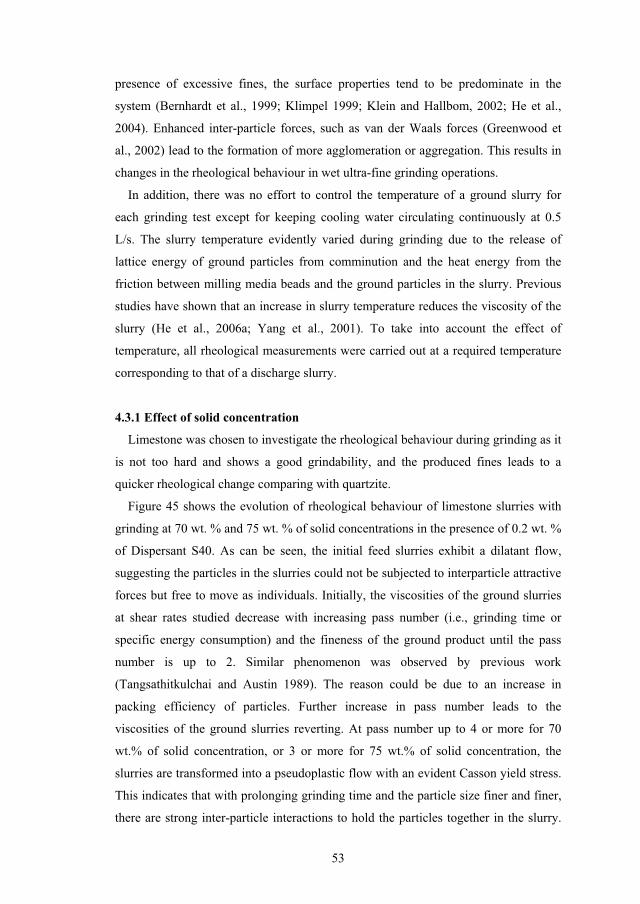
53
presence of excessive fines, the surface properties tend to be predominate in the
system (Bernhardt et al., 1999; Klimpel 1999; Klein and Hallbom, 2002; He et al.,
2004). Enhanced inter-particle forces, such as van der Waals forces (Greenwood et
al., 2002) lead to the formation of more agglomeration or aggregation. This results in
changes in the rheological behaviour in wet ultra-fine grinding operations.
In addition, there was no effort to control the temperature of a ground slurry for
each grinding test except for keeping cooling water circulating continuously at 0.5
L/s. The slurry temperature evidently varied during grinding due to the release of
lattice energy of ground particles from comminution and the heat energy from the
friction between milling media beads and the ground particles in the slurry. Previous
studies have shown that an increase in slurry temperature reduces the viscosity of the
slurry (He et al., 2006a; Yang et al., 2001). To take into account the effect of
temperature, all rheological measurements were carried out at a required temperature
corresponding to that of a discharge slurry.
4.3.1 Effect of solid concentration
Limestone was chosen to investigate the rheological behaviour during grinding as it
is not too hard and shows a good grindability, and the produced fines leads to a
quicker rheological change comparing with quartzite.
Figure 45 shows the evolution of rheological behaviour of limestone slurries with
grinding at 70 wt. % and 75 wt. % of solid concentrations in the presence of 0.2 wt. %
of Dispersant S40. As can be seen, the initial feed slurries exhibit a dilatant flow,
suggesting the particles in the slurries could not be subjected to interparticle attractive
forces but free to move as individuals. Initially, the viscosities of the ground slurries
at shear rates studied decrease with increasing pass number (i.e., grinding time or
specific energy consumption) and the fineness of the ground product until the pass
number is up to 2. Similar phenomenon was observed by previous work
(Tangsathitkulchai and Austin 1989). The reason could be due to an increase in
packing efficiency of particles. Further increase in pass number leads to the
viscosities of the ground slurries reverting. At pass number up to 4 or more for 70
wt.% of solid concentration, or 3 or more for 75 wt.% of solid concentration, the
slurries are transformed into a pseudoplastic flow with an evident Casson yield stress.
This indicates that with prolonging grinding time and the particle size finer and finer,
there are strong inter-particle interactions to hold the particles together in the slurry.
54
The grinding operation for 70 wt.% of solid concentration with 0.2 wt.% of
Dispersant S40 automatically ceases at pass 5 but stops at pass 4 for 75 wt.% of solid
concentration with 0.2 wt.% of Dispersant S40 by a safety control device due to high
pressure inside the mill chamber. A pseudoplastic slurry with a high extrapolated
Casson yield stress could be the reason because the more viscous the slurry, the more
power is needed to make the slurry flow when the slurry is circulated through the mill
by a pump. This increases the pressure in the mill up to the limit.
0.01
0.1
1
0 500 1000 1500
pass 0Pass 2Pass 3Pass 4Pass 5
0.01
0.1
1
0 500 1000 1500
pass 0Pass 2Pass 3Pass 4
0
5
10
15
20
25
0 1 2 3 4 5 6
70 wt.%75 wt.%
App
aren
t vis
cosi
ty (P
a·s)
Shear rate (1/sec)
a
70 wt.% solids concentration
b
75 wt.% solids concentration
Figure 45 Variation of the rheological behaviours of limestone slurry at two different solid concentrations in the presence of 0.2 wt. % Dispersant S40 at 74 vol.% bead load with grinding:
a and b, Apparent viscosity; c, Extrapolated Casson yield stress. (by Bohlin viscometer).
Pass number
Ext
rapo
late
d C
asso
n yi
eld
stre
ss (P
a)
c
Shear rate (1/sec)
App
aren
t vis
cosi
ty (P
a·s)
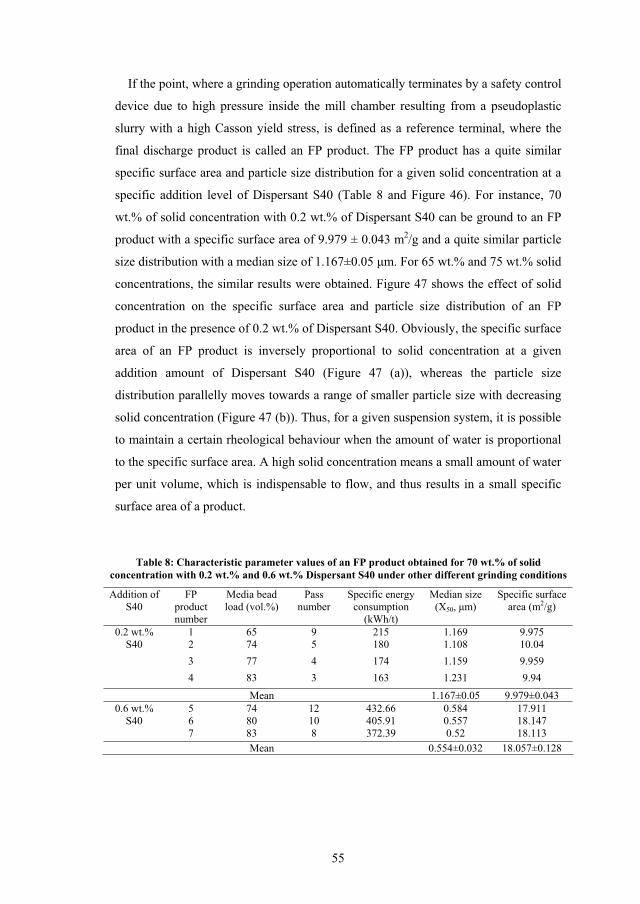
55
If the point, where a grinding operation automatically terminates by a safety control
device due to high pressure inside the mill chamber resulting from a pseudoplastic
slurry with a high Casson yield stress, is defined as a reference terminal, where the
final discharge product is called an FP product. The FP product has a quite similar
specific surface area and particle size distribution for a given solid concentration at a
specific addition level of Dispersant S40 (Table 8 and Figure 46). For instance, 70
wt.% of solid concentration with 0.2 wt.% of Dispersant S40 can be ground to an FP
product with a specific surface area of 9.979 ± 0.043 m2/g and a quite similar particle
size distribution with a median size of 1.167±0.05 m. For 65 wt.% and 75 wt.% solid
concentrations, the similar results were obtained. Figure 47 shows the effect of solid
concentration on the specific surface area and particle size distribution of an FP
product in the presence of 0.2 wt.% of Dispersant S40. Obviously, the specific surface
area of an FP product is inversely proportional to solid concentration at a given
addition amount of Dispersant S40 (Figure 47 (a)), whereas the particle size
distribution parallelly moves towards a range of smaller particle size with decreasing
solid concentration (Figure 47 (b)). Thus, for a given suspension system, it is possible
to maintain a certain rheological behaviour when the amount of water is proportional
to the specific surface area. A high solid concentration means a small amount of water
per unit volume, which is indispensable to flow, and thus results in a small specific
surface area of a product.
Addition of S40
FPproduct number
Media bead load (vol.%)
Passnumber
Specific energy consumption
(kWh/t)
Median size (X50, m)
Specific surface area (m2/g)
1 65 9 215 1.169 9.975 2 74 5 180 1.108 10.04 3 77 4 174 1.159 9.959
0.2 wt.% S40
4 83 3 163 1.231 9.94
Mean 1.167±0.05 9.979±0.043 5 74 12 432.66 0.584 17.911 6 80 10 405.91 0.557 18.147
0.6 wt.% S40
7 83 8 372.39 0.52 18.113 Mean 0.554±0.032 18.057±0.128
Table 8: Characteristic parameter values of an FP product obtained for 70 wt.% of solid concentration with 0.2 wt.% and 0.6 wt.% Dispersant S40 under other different grinding conditions
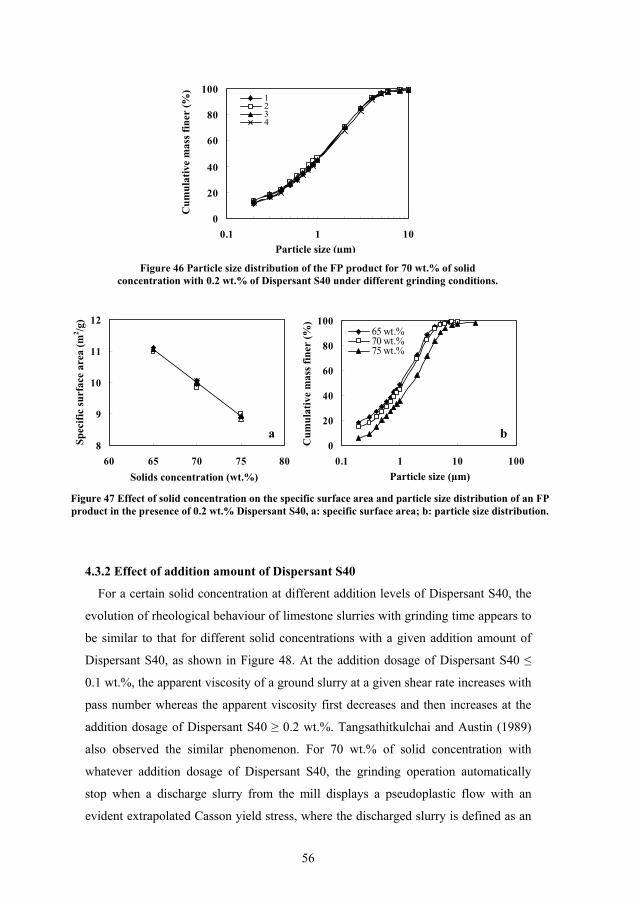
56
0
20
40
60
80
100
0.1 1 10
1234
8
9
10
11
12
60 65 70 75 800
20
40
60
80
100
0.1 1 10 100
65 wt.%70 wt.%75 wt.%
4.3.2 Effect of addition amount of Dispersant S40
For a certain solid concentration at different addition levels of Dispersant S40, the
evolution of rheological behaviour of limestone slurries with grinding time appears to
be similar to that for different solid concentrations with a given addition amount of
Dispersant S40, as shown in Figure 48. At the addition dosage of Dispersant S40
0.1 wt.%, the apparent viscosity of a ground slurry at a given shear rate increases with
pass number whereas the apparent viscosity first decreases and then increases at the
addition dosage of Dispersant S40 0.2 wt.%. Tangsathitkulchai and Austin (1989)
also observed the similar phenomenon. For 70 wt.% of solid concentration with
whatever addition dosage of Dispersant S40, the grinding operation automatically
stop when a discharge slurry from the mill displays a pseudoplastic flow with an
evident extrapolated Casson yield stress, where the discharged slurry is defined as an
Particle size (μm)
Cum
ulat
ive
mas
s fin
er (%
)
Figure 46 Particle size distribution of the FP product for 70 wt.% of solid concentration with 0.2 wt.% of Dispersant S40 under different grinding conditions.
Solids concentration (wt.%)
Spec
ific
surf
ace
area
(m2 /g
)
Figure 47 Effect of solid concentration on the specific surface area and particle size distribution of an FP product in the presence of 0.2 wt.% Dispersant S40, a: specific surface area; b: particle size distribution.
Particle size (μm)
Cum
ulat
ive
mas
s fin
er (%
)
a b
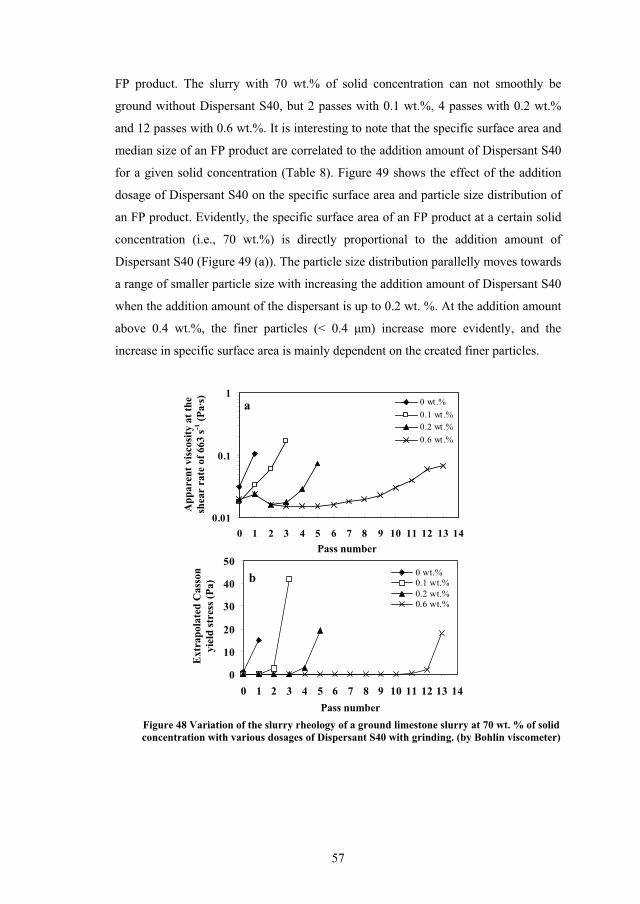
57
FP product. The slurry with 70 wt.% of solid concentration can not smoothly be
ground without Dispersant S40, but 2 passes with 0.1 wt.%, 4 passes with 0.2 wt.%
and 12 passes with 0.6 wt.%. It is interesting to note that the specific surface area and
median size of an FP product are correlated to the addition amount of Dispersant S40
for a given solid concentration (Table 8). Figure 49 shows the effect of the addition
dosage of Dispersant S40 on the specific surface area and particle size distribution of
an FP product. Evidently, the specific surface area of an FP product at a certain solid
concentration (i.e., 70 wt.%) is directly proportional to the addition amount of
Dispersant S40 (Figure 49 (a)). The particle size distribution parallelly moves towards
a range of smaller particle size with increasing the addition amount of Dispersant S40
when the addition amount of the dispersant is up to 0.2 wt. %. At the addition amount
above 0.4 wt.%, the finer particles (< 0.4 m) increase more evidently, and the
increase in specific surface area is mainly dependent on the created finer particles.
0.01
0.1
1
0 1 2 3 4 5 6 7 8 9 10 11 12 13 14
0 wt.%0.1 wt.%0.2 wt.%0.6 wt.%
0
10
20
30
40
50
0 1 2 3 4 5 6 7 8 9 10 11 12 13 14
0 wt.%0.1 wt.%0.2 wt.%0.6 wt.%
Pass number
Pass number
App
aren
t vis
cosi
ty a
t the
sh
ear
rate
of 6
63 s-1
(Pa·
s)
Ext
rapo
late
d C
asso
n yi
eld
stre
ss (P
a)
Figure 48 Variation of the slurry rheology of a ground limestone slurry at 70 wt. % of solid concentration with various dosages of Dispersant S40 with grinding. (by Bohlin viscometer)
b
a
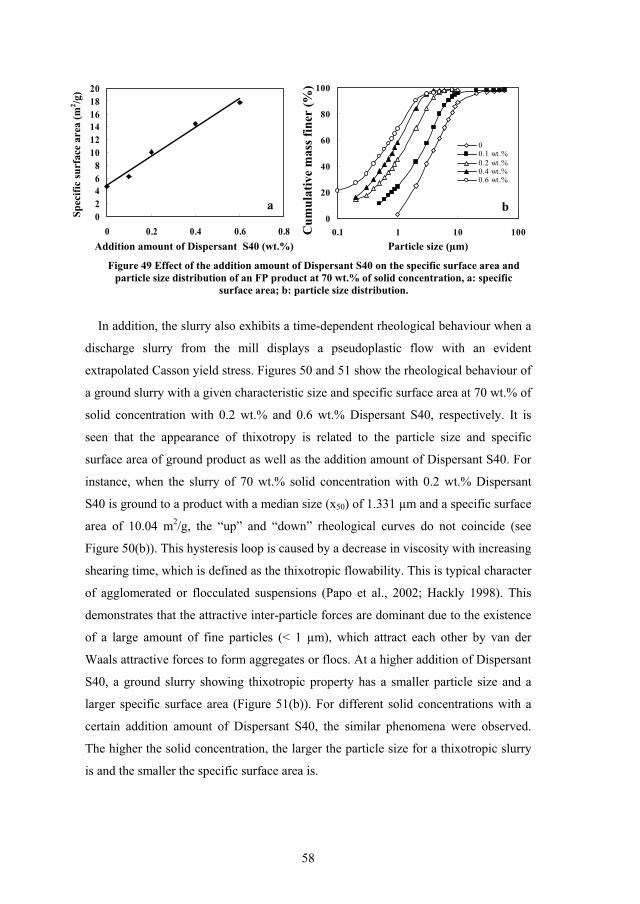
58
02468
101214161820
0 0.2 0.4 0.6 0.80
20
40
60
80
100
0.1 1 10 100
00.1 wt.%0.2 wt.%0.4 wt.%0.6 wt.%
In addition, the slurry also exhibits a time-dependent rheological behaviour when a
discharge slurry from the mill displays a pseudoplastic flow with an evident
extrapolated Casson yield stress. Figures 50 and 51 show the rheological behaviour of
a ground slurry with a given characteristic size and specific surface area at 70 wt.% of
solid concentration with 0.2 wt.% and 0.6 wt.% Dispersant S40, respectively. It is
seen that the appearance of thixotropy is related to the particle size and specific
surface area of ground product as well as the addition amount of Dispersant S40. For
instance, when the slurry of 70 wt.% solid concentration with 0.2 wt.% Dispersant
S40 is ground to a product with a median size (x50) of 1.331 μm and a specific surface
area of 10.04 m2/g, the “up” and “down” rheological curves do not coincide (see
Figure 50(b)). This hysteresis loop is caused by a decrease in viscosity with increasing
shearing time, which is defined as the thixotropic flowability. This is typical character
of agglomerated or flocculated suspensions (Papo et al., 2002; Hackly 1998). This
demonstrates that the attractive inter-particle forces are dominant due to the existence
of a large amount of fine particles (< 1 μm), which attract each other by van der
Waals attractive forces to form aggregates or flocs. At a higher addition of Dispersant
S40, a ground slurry showing thixotropic property has a smaller particle size and a
larger specific surface area (Figure 51(b)). For different solid concentrations with a
certain addition amount of Dispersant S40, the similar phenomena were observed.
The higher the solid concentration, the larger the particle size for a thixotropic slurry
is and the smaller the specific surface area is.
Particle size (μm)
Cum
ulat
ive
mas
s fin
er (%
)
Figure 49 Effect of the addition amount of Dispersant S40 on the specific surface area and particle size distribution of an FP product at 70 wt.% of solid concentration, a: specific
surface area; b: particle size distribution.
Spec
ific
surf
ace
area
(m2 /g
)
Addition amount of Dispersant S40 (wt.%)
ba
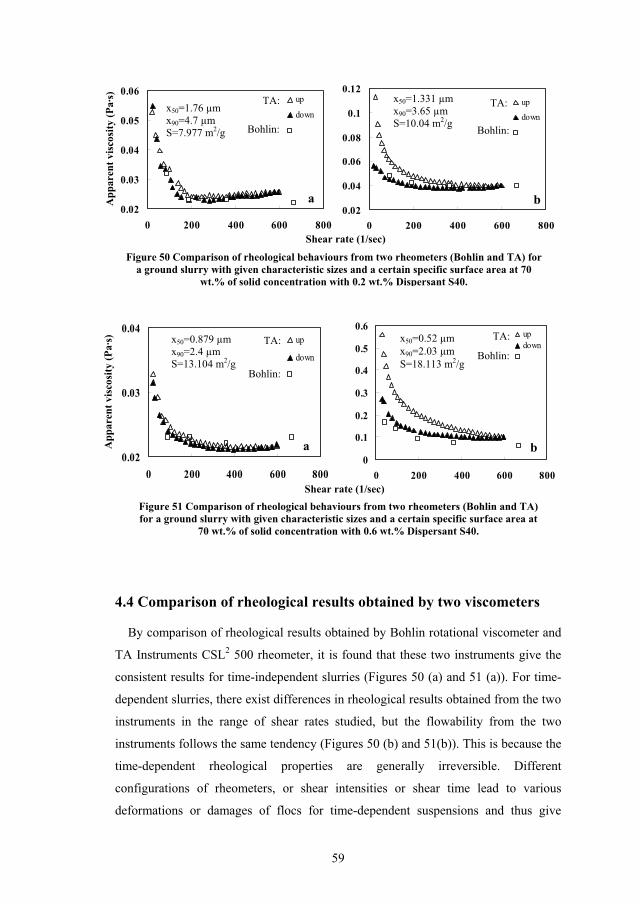
59
0.02
0.03
0.04
0.05
0.06
0 200 400 600 800
up
down
0.02
0.04
0.06
0.08
0.1
0.12
0 200 400 600 800
up
down
0.02
0.03
0.04
0 200 400 600 800
up
down
0
0.1
0.2
0.3
0.4
0.5
0.6
0 200 400 600 800
up down
4.4 Comparison of rheological results obtained by two viscometers
By comparison of rheological results obtained by Bohlin rotational viscometer and
TA Instruments CSL2 500 rheometer, it is found that these two instruments give the
consistent results for time-independent slurries (Figures 50 (a) and 51 (a)). For time-
dependent slurries, there exist differences in rheological results obtained from the two
instruments in the range of shear rates studied, but the flowability from the two
instruments follows the same tendency (Figures 50 (b) and 51(b)). This is because the
time-dependent rheological properties are generally irreversible. Different
configurations of rheometers, or shear intensities or shear time lead to various
deformations or damages of flocs for time-dependent suspensions and thus give
Figure 50 Comparison of rheological behaviours from two rheometers (Bohlin and TA) for a ground slurry with given characteristic sizes and a certain specific surface area at 70
wt.% of solid concentration with 0.2 wt.% Dispersant S40.
Shear rate (1/sec)
App
aren
t vis
cosi
ty (P
a·s)
x50=1.331 μm x90=3.65 μm S=10.04 m2/g Bohlin:
TA:
b
x50=1.76 μm x90=4.7 μm S=7.977 m2/g
TA:
Bohlin:
a
Figure 51 Comparison of rheological behaviours from two rheometers (Bohlin and TA) for a ground slurry with given characteristic sizes and a certain specific surface area at
70 wt.% of solid concentration with 0.6 wt.% Dispersant S40.
Shear rate (1/sec)
App
aren
t vis
cosi
ty (P
a·s)
x50=0.52 μm x90=2.03 μm S=18.113 m2/g
Bohlin:
TA:
b
x50=0.879 μm x90=2.4 μm S=13.104 m2/g
TA:
Bohlin:
a
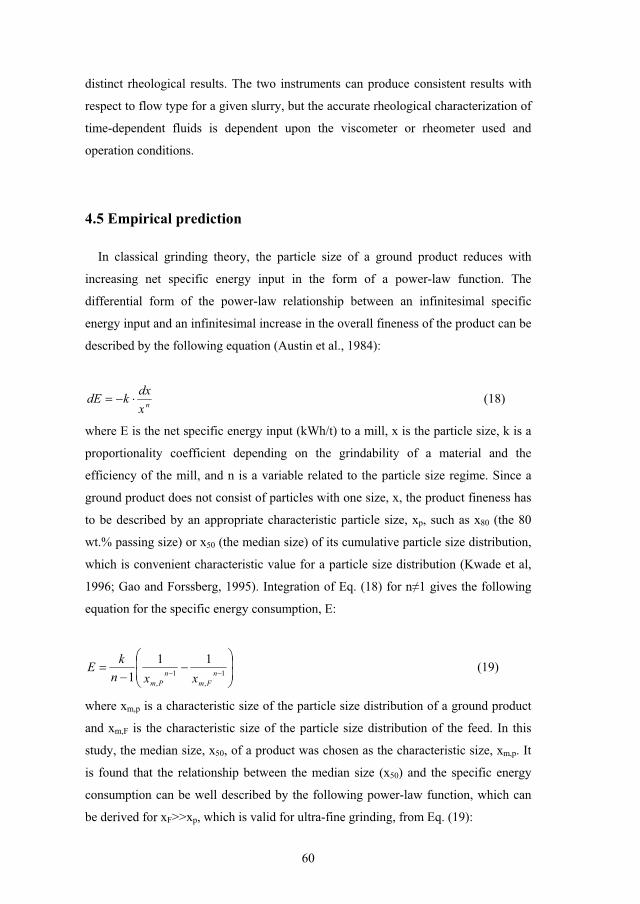
60
distinct rheological results. The two instruments can produce consistent results with
respect to flow type for a given slurry, but the accurate rheological characterization of
time-dependent fluids is dependent upon the viscometer or rheometer used and
operation conditions.
4.5 Empirical prediction
In classical grinding theory, the particle size of a ground product reduces with
increasing net specific energy input in the form of a power-law function. The
differential form of the power-law relationship between an infinitesimal specific
energy input and an infinitesimal increase in the overall fineness of the product can be
described by the following equation (Austin et al., 1984):
nxdxkdE (18)
where E is the net specific energy input (kWh/t) to a mill, x is the particle size, k is a
proportionality coefficient depending on the grindability of a material and the
efficiency of the mill, and n is a variable related to the particle size regime. Since a
ground product does not consist of particles with one size, x, the product fineness has
to be described by an appropriate characteristic particle size, xp, such as x80 (the 80
wt.% passing size) or x50 (the median size) of its cumulative particle size distribution,
which is convenient characteristic value for a particle size distribution (Kwade et al,
1996; Gao and Forssberg, 1995). Integration of Eq. (18) for n 1 gives the following
equation for the specific energy consumption, E:
1,
1,
111 n
Fmn
Pm xxnkE (19)
where xm,p is a characteristic size of the particle size distribution of a ground product
and xm,F is the characteristic size of the particle size distribution of the feed. In this
study, the median size, x50, of a product was chosen as the characteristic size, xm,p. It
is found that the relationship between the median size (x50) and the specific energy
consumption can be well described by the following power-law function, which can
be derived for xF>>xp, which is valid for ultra-fine grinding, from Eq. (19):
61
mECx50 (20)
where1
1
1n
nkC ,
11
nm .
Figures 22(b), 25(b), 29(b), 32(b), 34(b), 35, 39(a) and 41(a) present the
experimental (dots) and predicted (lines) results for all grinding experiments under
various grinding conditions. Clearly, the particle size-energy model of Equation (20)
provides a good fit to the experimental results for both limestone and quartzite with a
high regression coefficient (> 0.904) under grinding conditions investigated. This is in
agreement with a previous conclusion for dolomite (Gao and Forssberg, 1995).
5 Conclusions
This thesis investigated the slurry rheology of industrial minerals (limestone and
quartzite) and its effects on the wet ultra-fine grinding. The following conclusions
were drawn:
(1) The rheological behaviour of a limestone slurry (< 100 m) is transformed from
a weakly dilatant characteristic to a pseudoplastic one with a yield stress, which is in
combination with a thixotropic property at a higher solid concentration (i.e., 75
wt.%), when the solid concentration is increased from 60 wt.% (35.71 vol.%) to 78.5
wt.% (57.49 vol.%). At a certain shear rate, the apparent viscosity and the relative
viscosity of the slurry increase exponentially with increasing solid concentration. The
extrapolated Casson yield stress increases in a power-law form with increasing solid
concentration when the solid concentration of the slurry is larger than 70 wt.% (i.e.,
46.36 vol.%). The attainable maximum packing solid fraction ( m) is predicted as
m=64.6 vol.% at the certain limestone-water slurry.
For control of slurry rheology, the mostly used dispersant is polyacrylic acid or its
salts. The effect of sodium polyacrylate salts with various molecular weights on the
rheological behaviour of a limestone slurry (<100 m) at a given solid concentration
appears to be similar. With increasing the addition amount of a sodium polyacrylate,
the apparent viscosity of the slurry first increases, and decreases, then reverts after
reaching a minimum. Also, the yield stress is eliminated when the addition amount
62
exceeds a certain value. Sodium polyacrylate called Dispersant S40 with a molecular
weight of 5500 Da appears to be most effective for reduction of the apparent viscosity
and maintenance of stable flowability.
For a given solid concentration of limestone slurry, the smaller the particle size, the
more evident the pseudoplastic property is with a larger yield stress and a larger
apparent viscosity at a given shear rate. However, a sufficient addition dosage of the
dispersant called Dispersant S40 significantly decreases or even eliminates the effect
of particle size and distribution on the slurry rheology.
(2) Wet ultra-fine grinding of a limestone powder (< 100 m) has been investigated
in a stirred media mill with respect to the effect of slurry rheology. A polymeric
dispersant called Dispersant S40 with a molecular weight of 5,500 Da gives a higher
energy efficiency and a smaller product size for wet ultra-fine grinding of the
limestone due to its maintenance of a lower viscosity during grinding. For a certain
media bead load, an optimal solid concentration exists for the effective grinding. At
an addition dosage of 0.1 wt. % of Dispersant S40 or more, a smaller addition amount
leads to a higher energy efficiency and a smaller product size at a given specific
energy consumption in a lower level of specific energy input. However, the excessive
amount of the dispersant causes the grinding less efficient. This can be avoided by the
multi-point addition of the dispersant or by a higher bead load ( 83 vol. %).
(3) The effect of slurry rheology on stirred media milling of quartzite has been
studied as well. Media bead density has an evident but complex effect on stirred
milling performance, depending on stirrer rotational speed and solid concentration.
Addition of Dispersant S40 or a lower solid concentration results in better grinding
results (i.e., a higher energy efficiency and a smaller median size) due to maintenance
of lower viscosities at shear rates investigated during grinding. The combined effect
of stirrer rotational speed and solid concentration is evident. For a given solid
concentration, an optimal stirrer speed exists. The observed phenomena can be
explained by the effect of slurry rheology on the stress intensity of individual grinding
beads.
(4) The rheological behaviour of ground limestone slurries vary with grinding from
a starting dilatant flowability to a resulting pseudoplastic one with an evident Casson
yield stress in combination with a thixotropic character. The appearance of
pseudoplastic flowability combining thixotropy is related to solid concentration and
the addition amount of Dispersant S40. The less the dispersant amount is for a given
63
solid concentration, the earlier a pseudoplastic flowability accompanying a thixotropic
character appears. The lower the solid concentration with a specific addition amount
of the dispersant, the later a pseudoplastic fluid with a thixotropic character displays.
Regardless of whatever grinding conditions, the grinding operation automatically
ceases when a discharge slurry from the mill shows a pseudoplastic flow with an
evident extrapolated Casson yield stress, where the discharged slurry is defined as an
FP product. The specific surface area and particle size distribution of an FP product
are correlated to solid concentration and the addition level of Dispersant S40. The
specific surface area of an FP product is inversely and directly proportional to solid
concentration and the addition amount of Dispersant S40, respectively, whereas the
particle size distribution of an FP product parallelly moves towards a range of smaller
particle size with decreasing solid concentration or increasing the addition amount of
Dispersant S40. Besides, the accurate rheological characterization of time-dependent
fluids is dependent upon the instruments used and operation conditions.
(5) In addition, an empirical particle size-energy model provides a good fit to the
wet ultra-fine grinding results for both limestone and quartzite under the experimental
conditions investigated.
Recommendations for future work
Interfacial chemistry of industrial minerals should be performed by zeta potential
measurements in a concentrated suspension. Polymeric dispersant adsorption onto
industrial minerals should also be investigated by means of some effective
characterization methods such as attenuated total reflection Fourier transform infrared
spectrometry (ATR-FTIR) and x-ray photonelectron energy spectrometry (XPS). It
would be interesting to draw a link between interfacial chemistry / polymer adsorption
and slurry rheology for industrial minerals.
Motion of grinding beads, flow filed and shear rate distributions are not well
understood in a stirred media mill. Modelling of motion of grinding beads, flow filed
and shear rate distributions in a stirred media mill is a challenge using Computational
Fluid Dynamics (CFD). This can provide scientific understanding of the role of slurry
rheology in stirred media milling and grinding mechanisms in a stirred media mill. It
64
would be desirable to build up a quantitative grinding mechanism involving grinding
operation parameters and slurry rheology.
References
Austin, L. G., Klimpel, R. R. and Luckie, P. T., 1984. Process engineering of size
reduction: Ball milling. Pub. By Society of Mining Engineers, New York, pp.
21-81 (ISBN 0-89520-421-5).
Banash, Mark A. and Croll, Stuart G., 1999. A quantitative study of polymeric
dispersant adsorption onto oxide-coated titania pigments. Progress in Organic
Coatings 35: 37-44.
Bernhardt, C., Reinsch, E., and Husemann, K., 1999. The influence of suspension
properties on ultra-fine grinding in stirred ball mills. Powder Tchnology 105:
357-361.
Blecher, Lutz, Kwade, Arno and Schwedes, Jörg, 1996. Motion and stress intensity of
grinding beads in a stirred media mill, Part 1: Energy density distribution and
motion of single grinding beads. Powder Technology 86, 59-68.
Blecher, L., and Schwedes, J., 1996. Energy distribution and particle trajectories in a
grinding chamber of a stirred ball mill. International Journal of Mineral
Processing 44-45, 617-627.
Ewais, Emad, Zaman, Abbas A. and Sigmund, 2002. Wolfgang, Temperature induced
forming of zirconia from aqueous slurries: mechanism and rheology. Journal of
the European Ceramic Society 22, 2805-2812.
Gao, Mingwei and Forssberg, Eric, 1995. Prediction of product size distributions for a
stirred ball mill. Powder Tchnology 84, 101-106.
Gao, M. and Forssberg, E., 1993 a. The influence of slurry rheology on ultra-fine
grinding in a stirred ball mill. 18th International Mineral Processing Congress,
Sydney, CA (Conference Article) Vol. 2, 237-244.
Gao, Ming-wei and Forssberg, Eric, 1993 b. A study on the effect of parameters in
stirred ball milling. International Journal of Mineral Processing 37, 45-59.
Gao, Ming-wei and Weller, Keith, 1993. Fine grinding in mineral processing using
stirred ball mills. Chemical Engineering in Australia 18 (2), 8-12.
65
Gao, M.W. and Forssberg, E., 1992. Increasing the specific surface area of dolomite
by stirred ball milling. In: S.K.Kawatra (Editor), Comminution---Theory and
Practice Symposium, Phoenix, AZ. SME, Society for Mining, Metallurgy and
Exploration, Littleton, CO., pp.154-170.
Greenwood, R., Rowson, N., Kingman, S. and Brown, G., 2002. A new method for
determining the optimum dispersant concentration in aqueous grinding. Powder
Technology 123, 199-207.
Hackley, Vincent A., 1998. Colloidal processing of silicon nitride with poly (acrylic
acid): , Rheological properties. J. Am. Ceram. Soc. 81 (9), 2421-28.
Harris, J., 1977. Rheology and non-Newtonian flow. Pub. by Longman Inc., New
York, pp. 1-5 (ISBN 0-582-46331-9).
He, Mingzhao, Wang, Yanmin, and Forssberg, Eric, 2004. Slurry rheology in wet
ultra-fine grinding of industrial minerals: A review. Powder technology 147, 94-
112.
He, Mingzhao, Wang, Yanmin, and Forssberg, Eric, 2006a. Parameter studies on the
rheology of limestone slurries. International Journal of Mineral Processing 78:
63-77.
He, Mingzhao, Wang, Yanmin, and Forssberg, Eric, 2006b. Parameter effects on wet
ultrafine grinding of limestone through slurry rheology in a stirred media mill.
Powder Technology 161: 10-21.
Higashitani, Ko, Iimura, Kenji and Sanda, Hiroko, 2001. Simulation of deformation
and breakup of large aggregates in flows of viscous fluids. Chemical
Engineering Science 56: 2927-2938.
Hunter, R.J., 1987. Foundations of colloid science, Vol. I. Oxford: Oxford University
Press.
Johnson, Stephen B., Franks, George V., Scales, Peter J., Boger, David V., and
Headly, Thomas W., 2000. Surface chemistry – rheology relationships in
concentrated mineral suspensions. International Journal of Mineral Processing
58: 267-304.
Kapur, Prakash C., Healy, Thomas W., Scales, Peter J., Boger, David V., and Wilson,
David, 1996. Role of dispersants in kinetics and energetics of stirred ball mill
grinding. International Journal of Mineral Processing 47, 141-152.
Kawatra, S.K., Bakshi A.K., and Eisele, T.C., 1999. An on-line pressure vessel
rheometer for slurries. Powder Technology 105: 418-423.

66
Kawatra, S.K., Bakshi A.K., and Miller, T.E., 1996. Rheological characterization of
mineral suspensions using a vibrating sphere and a rotational viscometer.
International Journal of Mineral Processing 44-45: 155-165.
Kiratzis, Nikos, Faers, Malcolm, and Luckham, Paul F., 1999. Depletion flocculation
of particulate systems induced by hydroxyethylcellulose. Colloids Surf., A
Physicochem. Eng. Asp. 151, 461-471.
Klein, B., and Hallbom, D.J., 2002. Modifying the rheology of nickel laterite
suspensions. Minerals Engineering 15: 745-749.
Klimpel, R. R., 1999. The selection of wet grinding chemical additives based on
slurry rheology control. Powder Technology 105, 430-435.
Kwade, Arno, 1999 a. Wet comminution in stirred media mills – research and its
practical application. Powder Technology 105, 14-20.
Kwade, Arno, 1999 b. Determination of the most important grinding mechanism in
stirred media mills by calculating stress intensity and stress number. Powder
Technology 105, 382-388.
Kwade, Arno, Blecher, Lutz and Schwedes, Jörg, 1996. Motion and stress intensity of
grinding beads in a stirred media mill, Part 2: Stress intensity and its effect on
comminution. Powder Technology 86, 69-76.
Lane, Graeme L., 1999. CFD modelling of a stirred bead mill for fine grinding,
Second International Conference on CFD in the Minerals and Process Industries,
Melbourne, Australia, pp. 449-454.
Lemke, T., Bagusat, F., Köhnke, K., Husemann, K. and Mögel, H. –J., 1999. Time
dependent viscosity of concentrated alumina suspensions. Colloids and Surfaces,
A: Physicochemical and Engineering Aspects 150, 283-287.
Logos, C., and Nguyen, Q. D., 1996. Effect of particle size on the flow properties of
a south Australian coal-water slurry. Powder Technology 88: 55-58.
Milling, A., Biggs, S., 1995. Direct measurement of the depletion force using an
atomic force microscope. Journal of Colloid and Interface Science 170: 604-606.
Muster, T. H. and Prestidge, C. A., 1995. Rheological investigations of sulphide
mineral slurries. Minerals Engineering 8, 1541-1555.
Orumwense, Osawaru A. and Forssberg, Eric, 1992. Superfine and ultrafine grinding -
A literature Survey. Mineral Processing and Extractive Metallurgy Review 11,
107-127.
67
Papo, A., Piani, L. and Ricceri, R., 2002. Sodium tripolyphosphate and polyphosphate
as dispersing agents for kaolin suspensions: rheological characterization.
Colloids and surfaces A: Physicochemical and engineering aspects 201, 219-230.
Prestidge, Clive A., 1997. Rheological investigations of ultra-fine galena particle
slurries under flotation-related conditions. International Journal of Mineral
Processing. 51, 241-254.
Reinisch, E., Bernhardt, C., and Husemann, K., 2001 a. The influence of additives
during wet ultra-fine grinding in agitator bead mills, Part 1: General principles
and experimental. Ceram. Forum Int. / Ber. DKG 78 (3), 38-42.
Reinisch, E., Bernhardt, C., and Husemann, K., 2001 b. The influence of additives
during wet ultra-fine grinding in agitator bead mills, Part 2: Results and
conclusions. Ceram. Forum Int. / Ber. DKG 78 (4), 36-40.
Somasundaran, P. and Moudgil, Brij M. (Ed.), 1988. Grinding aids based on slurry
rheology control. Reagents in Mineral Technology, Surfactant Science Series,
Volume 27, New York, pp. 179-193.
Stehr, N. and Weyand, C., 1990. Control system for agitated media mills. 7th
European symposium of comminution, Part 2, Ed. K.Schönert, Ljubljana,
pp.681-695.
Tangsathitkulchai, C. and Austin, L. G., 1988. Rheology of concentrated slurries of
particles of natural size distribution produced by grinding. Powder Technology
56, 293-299.
Tangsathitkulchai, C., and Austin, L. G., 1989. Slurry density effects on ball milling
in a laboratory ball mill. Powder Technology 59: 285-293.
Tanner, Roger I., 2000. Engineering Rheology (Second Edition), Oxford University
Press, New York, pp. 1-29.
Tattersall, G.H., and Banfill, P.F.G., 1983. The rheology of fresh concrete. Pub. by
Pitman Books Limited, London, pp. 10-25 (ISBN 0-273-08558-1).
Theuerkauf, J. and Schwedes, J., 1999. Theoretical and experimental investigation
on particle and fluid motion in stirred media mills. Powder Technology 105, 406-
412.
Tseng, Wenjea J., Chen, Chun-Nan, 2003. Effect of polymeric dispersant on
rheological behaviour of nickel-terpineol suspensions. Materials Science and
Engineering A347, 145-153.

68
Velamakanni, Bhaskar V. and Fuerstenau, Douglas W., 1993. The effect of the
adsorption of polymeric additives on the wet grinding of minerals, 2. Dispersion
and fine grinding of concentrated suspensions. Powder Technology 75, 11-19.
Wang, Y. and Forssberg, E., 1995. Dispersants in stirred ball mill grinding. KONA 13,
67-77.
Whorlow, R. W., 1992. Rheological Techniques (Second Edition). Ellis Horwood
Limited, West Sussex (England), pp. 1-40.
Yang, Hua-Gui, Li, Chun-Zhong, Gu, Hong-chen and Fang, Tu-Nan, 2001.
Rheological behavior of titanium dioxide suspensions. Journal of Colloid and
Interface Science 236, 96-103.
Yue, J., and Klein, B., 2004. Influence of rheology on the performance of horizontal
stirred mills. Minerals Engineering 17: 1169-1177.
Zaman, A. A., Bjelopavlic M., and Moudgil, B. M., 2000. Effect of Adsorbed
polyethylene oxide on the rheology of colloidal silica suspensions. Journal of
Colloid and Interface Science 226: 290-298.
Zheng, Jie, Harris, Colin C. and Somasundaran, P., 1997. The effect of additives on
stirred media milling of limestone. Powder Technology 91, 173-179.

Appendix

Paper 1
Slurry rheology in wet ultrafine grinding of industrial minerals: A review
Powder Technology, 147 (2004) 94-112
Reprinted from Powder Technology with permission from Elsevier (copyright 2004).

Slurry rheology in wet ultrafine grinding of industrial minerals: a review
Mingzhao Hea,*, Yanmin Wanga,b, Eric Forssberga
aDepartment of Chemical Engineering and Geosciences, Lulea University of Technology, SE-97187, Lule3, SwedenbInstitute of Material Science and Engineering, South China University of Technology, Guangzhou, 510 640, China
Received 27 January 2004; received in revised form 25 July 2004; accepted 17 September 2004
Available online 10 November 2004
Abstract
Wet ultrafine grinding has been increasingly used for production of ultrafine powders in various industries. It has been known that slurry
rheology significantly influences the grindability of industrial minerals in wet ultrafine grinding. This review represents some previous work
with respect to slurry rheology in ultrafine grinding. In this review, some methods for the characterization of the slurry rheology and some
empirical equations modelling rheological behaviours of slurries were presented. The semiempirical model incorporating slurry rheology,
solids concentration, particle size and slurry temperature was described. In addition, on-line measurement for the slurry rheology control was
also discussed. In the case of ultrafine grinding, various parameters (such as solid concentration, particle size and distribution, particle shape,
temperature, rotation and pH, use of dispersants), which affect the slurry rheology, have been described. It was revealed that the optimization
of the rheological behaviours of slurry in ultrafine grinding could increase throughput, energy efficiency and product fineness as well. It is
suggested to further study the mechanisms of slurry rheology in the presence of chemical dispersants in wet ultrafine grinding. It is desired to
develop a model, which can represent a relation among slurry rheology, comminution parameters, amount of dispersant, energy efficiency
and particle size characterization.
D 2004 Elsevier B.V. All rights reserved.
Keywords: Rheology; Wet ultrafine grinding; Slurry; Fine particles; Industrial minerals; Dispersants
1. Introduction
With an increasing demand for ultrafine powders for
industries [1–3], wet ultrafine grinding has been increas-
ingly used in various fields, such as minerals [4–6], ceramic
materials [7–9], pigments [10], chemical products [2,11],
microorganisms [12], pharmaceutics [13,14] and paper-
making [15]. It has well been known that slurry rheology
affects the wet comminution of materials [16–30]. From a
diagnostic point of view, the rheological behaviour of
mineral slurries is indicative of the level of interparticle
interaction or aggregation in a slurry and therefore it is an
important variable of the processing control [31]. The
influence of rheological behaviour of mineral slurries on
their grindabilities has attracted more and more interests and
attention, especially on ultrafine grinding performance
[8,10,29,30,32–37]. Most of the mills used in ultrafine
grinding are stirred media mills, rather than conventional
tumbling ball mills [3]. Although many studies [16–
26,28,38–43] on the slurry rheology in tumbling ball mills
have been published, there is still little understanding on the
slurry rheology relevant to ultrafine grinding at high slurry
densities [29,36]. This is because the breakage mechanism
of ultrafine comminution in stirred media mills is rather
different from that of tumbling ball mills. In the case of
tumbling ball milling, the size reduction is mainly depend-
ent on the cataracting and cascading motions of charge balls,
leading to striking charge particles nipped against other
balls, and rubbing charge particles between balls in the bed
on the bottom of cylinder [40,44]. The impact stress from
cataracting and cascading is far larger than shear stress from
rubbing [40]. However, the fragment in stirred media mills
for ultrafine grinding is mainly subject to shear stress [3].
The predominant comminution mechanisms are dependent
0032-5910/$ - see front matter D 2004 Elsevier B.V. All rights reserved.
doi:10.1016/j.powtec.2004.09.032
* Corresponding author. Tel.: +46 920 491692.
E-mail addresses: [email protected], [email protected]
(M. He).
Powder Technology 147 (2004) 94–112
www.elsevier.com/locate/powtec
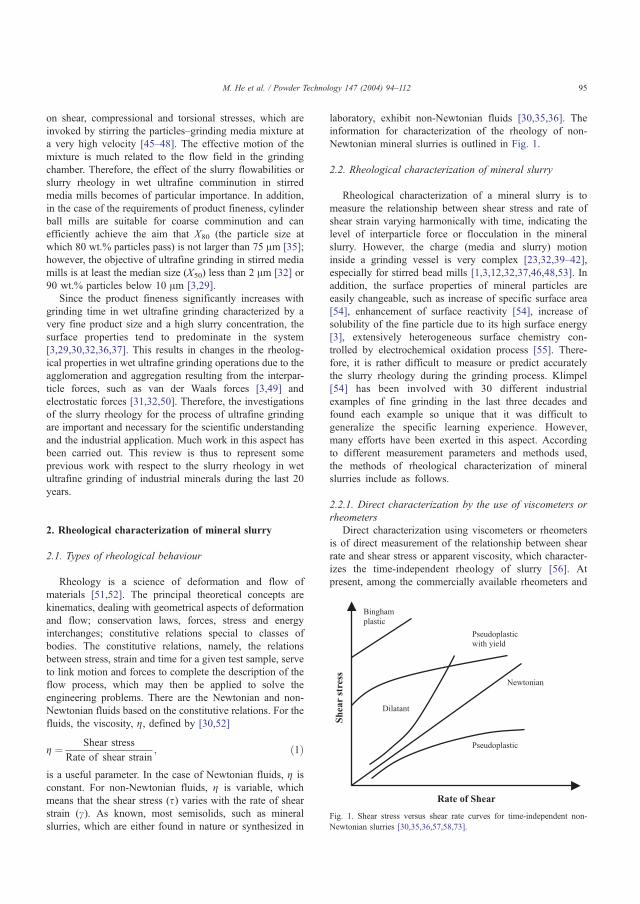
on shear, compressional and torsional stresses, which are
invoked by stirring the particles–grinding media mixture at
a very high velocity [45–48]. The effective motion of the
mixture is much related to the flow field in the grinding
chamber. Therefore, the effect of the slurry flowabilities or
slurry rheology in wet ultrafine comminution in stirred
media mills becomes of particular importance. In addition,
in the case of the requirements of product fineness, cylinder
ball mills are suitable for coarse comminution and can
efficiently achieve the aim that X80 (the particle size at
which 80 wt.% particles pass) is not larger than 75 Am [35];
however, the objective of ultrafine grinding in stirred media
mills is at least the median size (X50) less than 2 Am [32] or
90 wt.% particles below 10 Am [3,29].
Since the product fineness significantly increases with
grinding time in wet ultrafine grinding characterized by a
very fine product size and a high slurry concentration, the
surface properties tend to predominate in the system
[3,29,30,32,36,37]. This results in changes in the rheolog-
ical properties in wet ultrafine grinding operations due to the
agglomeration and aggregation resulting from the interpar-
ticle forces, such as van der Waals forces [3,49] and
electrostatic forces [31,32,50]. Therefore, the investigations
of the slurry rheology for the process of ultrafine grinding
are important and necessary for the scientific understanding
and the industrial application. Much work in this aspect has
been carried out. This review is thus to represent some
previous work with respect to the slurry rheology in wet
ultrafine grinding of industrial minerals during the last 20
years.
2. Rheological characterization of mineral slurry
2.1. Types of rheological behaviour
Rheology is a science of deformation and flow of
materials [51,52]. The principal theoretical concepts are
kinematics, dealing with geometrical aspects of deformation
and flow; conservation laws, forces, stress and energy
interchanges; constitutive relations special to classes of
bodies. The constitutive relations, namely, the relations
between stress, strain and time for a given test sample, serve
to link motion and forces to complete the description of the
flow process, which may then be applied to solve the
engineering problems. There are the Newtonian and non-
Newtonian fluids based on the constitutive relations. For the
fluids, the viscosity, g, defined by [30,52]
g ¼ Shear stress
Rate of shear strain; ð1Þ
is a useful parameter. In the case of Newtonian fluids, g is
constant. For non-Newtonian fluids, g is variable, which
means that the shear stress (s) varies with the rate of shear
strain (c). As known, most semisolids, such as mineral
slurries, which are either found in nature or synthesized in
laboratory, exhibit non-Newtonian fluids [30,35,36]. The
information for characterization of the rheology of non-
Newtonian mineral slurries is outlined in Fig. 1.
2.2. Rheological characterization of mineral slurry
Rheological characterization of a mineral slurry is to
measure the relationship between shear stress and rate of
shear strain varying harmonically with time, indicating the
level of interparticle force or flocculation in the mineral
slurry. However, the charge (media and slurry) motion
inside a grinding vessel is very complex [23,32,39–42],
especially for stirred bead mills [1,3,12,32,37,46,48,53]. In
addition, the surface properties of mineral particles are
easily changeable, such as increase of specific surface area
[54], enhancement of surface reactivity [54], increase of
solubility of the fine particle due to its high surface energy
[3], extensively heterogeneous surface chemistry con-
trolled by electrochemical oxidation process [55]. There-
fore, it is rather difficult to measure or predict accurately
the slurry rheology during the grinding process. Klimpel
[54] has been involved with 30 different industrial
examples of fine grinding in the last three decades and
found each example so unique that it was difficult to
generalize the specific learning experience. However,
many efforts have been exerted in this aspect. According
to different measurement parameters and methods used,
the methods of rheological characterization of mineral
slurries include as follows.
2.2.1. Direct characterization by the use of viscometers or
rheometers
Direct characterization using viscometers or rheometers
is of direct measurement of the relationship between shear
rate and shear stress or apparent viscosity, which character-
izes the time-independent rheology of slurry [56]. At
present, among the commercially available rheometers and
Fig. 1. Shear stress versus shear rate curves for time-independent non-
Newtonian slurries [30,35,36,57,58,73].
M. He et al. / Powder Technology 147 (2004) 94–112 95

viscometers, three basic types have been tried for slurry
applications [57]:
(1) Coaxial cylinder viscometers or rheometers (Bohlin
Instruments [58], Brookfield Viscometers [30,56–61],
Haake viscometers [29,30,55,62,63], TA Instruments
[49], Debex viscometers [38–42]) can be used to
measure at a particular shear rate, which can be varied
by changing the rotational speed of the spindle.
Because of this control in shear rate, coaxial cylinder
viscometers have been popular for many applications.
However, the settling of solid particles causes serious
problems in the case of coaxial cylinder viscometers or
rheometers. In order to overcome this problem,
Kawatra et al. [57,58] developed a Brookfield setup
including a slurry presentation system and a UL
adaptor assembly, consisting of a UL adaptor spindle
and a UL adaptor tube (see Fig. 2). Slurry is mixed in
an overhead tank and passes continuously through the
annular space between the UL adaptor spindle and the
tube. Then, the viscosity is determined by measuring
the torque required to rotate the spindle at a constant
rotational speed. The Brookfield viscometer setup can
eliminate any swirling motion caused by the flow at
the inlet and display a steady reading before the
settling of particles occurs. In addition, it is suitable for
the measurement of apparent viscosity at low and
different shear rates and can measure a viscosity as low
as 0.001 Pad s. Another modified viscometer, Debex, is
shown in Fig. 3 [39]. A sample of slurry is presented to
the bobbin for measurement. The feed slurry flows
upwards in an annulus around the measuring cup,
overflows into the cup and into an outer annulus, and
drains after viscosity measurement. Slurry collected
from the drain and overflow is returned to the circuit.
The measuring cup thus provides a constant level of
flowing slurry in which the bobbin rotates. The flow
through the cup is sufficient to maintain the slurry in a
homogeneous suspension. In addition, in order to
eliminate a rotational movement of the fluid, to assist
mixing and to allow the free passage of coarse
particles, the measuring cup is fitted with six radial
baffles.
(2) Capillary tube viscometers or rheometers (pressure
vessel rheometers [56], a capillary rheometer system
designed and constructed [60], balanced beam tube
viscometer [64]) are mechanically simple and rather
sensible to low viscosity. A capillary viscometer can
operate at high shear rates but at a fixed value [56,65].
Besides, during the measurement of a capillary
rheometer, a test sample is not subject to a sustain
flow but varying shear rate and shear stress over the
tube cross section, allowing to measure time-depend-
ent effects, such as thixotropy flow. These two
parameters are generally calculated at the wall [65].
Hence, this kind of rheometers cannot be directly used
as the accurate measurement of slurry rheology. In
order to avoid the disadvantages of capillary tube
viscometers or rheometers, a pressure vessel rheom-
eter, which is a capillary rheometer (see Fig. 4), has
been developed [56]. The inlet tube of this rheometer
is attached to a recirculating fluid line and the other
end is connected to a conical sealed chamber. An
automatic ball value is attached to the base of the
vessel to drain fluids or slurries after each test. An
absolute pressure transducer measures the pressure of
the air inside the vessel, and a differential pressure
transducer does the pressure difference across the tube.
Data from both pressure transducers are collected by a
digital computer. The pressure vessel rheometer vary-
ing continuously the shear rate can measure the
Fig. 2. Brookfield viscometer setup showing the UL adaptor assembly and
the slurry presentation system to avoid the settling of particles and to
eliminate any swirling motion [57,58].
Fig. 3. Schematic section of Debex viscometer specifically designed to
measure the viscosity of settling slurries continuously [39].
M. He et al. / Powder Technology 147 (2004) 94–11296
viscosity at different shear rates, the rheological types,
and the yield stresses for a wide range of fluids and
slurries with high precision and complete shear stress
vs. shear rate curves.
(3) Vibrating sphere viscometers or rheometers (Nametre
viscometer [56–58,66,67]) operate at a very high shear
rate, and cannot operate at a specific shear rate but
average the shear rates from zero to the maximum
value. The maximum shear rate is not a definite
constant for the instrument but varies according to the
velocity of propagation of the shear wave in a fluid,
which in turn depends upon the fluid viscosity. This
instrument is insensitive to most turbulence, and can
easily measure the viscosity of well-mixed slurries. In
order to avoid solids settling during measurement by
the use of a Nametre viscometer, the Nametre setup
containing a Nametre viscometer and a special slurry
presentation system (see Fig. 5) was developed by
Kawatra et al. [57,58,66]. The Nametre viscometer
consists of a spherical probe, which oscillates along a
vertical shaft at its resonant frequency with a constant
amplitude. The special slurry presentation system is
composed of a vessel of two concentric cylinders. The
bottom of the inner cylinder is made conical to avoid
solids settling and has an inlet opening through which
the slurry from the pump enters the vessel. The outer
cylinder is 1 in. taller than the inner one and has a
discharge opening on its side. The viscometer is
suspended from the top by a cable and the probe of
the viscometer is immersed inside the inner cylinder.
This arrangement prevents problems with vibration
and excessive fluid drag on the sensor. A thermocou-
ple is also placed inside the sump, so that both the
viscosity and the temperature of a test sample are
recorded simultaneously. The Nametre setup can
measure the apparent viscosity of rapidly settling
mineral suspensions, such as coal slurries [67] and
silica slurries [57,58,66], at a high shear rate and a
viscosity as low as 0.001 Pad s.
Much rheological data [29,30,33,35,55,58,68,69] were
obtained by off-line measurements. However, the rheolog-
ical properties of ground slurries vary continuously with
grinding time in the case of wet grinding, the on-line
measurement is thus far more important for plant-scale
production and control. Shi and Napier-Munn [39,41,42]
used the single bobbin Debex viscometer (see Fig. 3) as on-
line measurements of unstable slurries, such as gold, copper
and lead/zinc on 16 full-scale industrial grinding mills. A
sample of the suspension of interest is taken continuously
from process and presented to the bobbin for measurement.
Feed to the viscometer can be degritted by a screen fixed
inside a constant-head tank, or by some other appropriate
methods. In addition, a turbulence correction procedure
obtaining a full shear rate–shear stress flow curve was
developed. Another viscometry system involving a coaxial
cylinder rotational viscometer (see Fig. 2) and a vibrating
sphere viscometer (see Fig. 5) has been developed for the
on-line measurement of viscosity, and for rheological
characterization of mineral slurries into either Newtonian
or non-Newtonian flow curves [57,58]. Both of the
viscometers are combined respectively with a slurry
presentation system to avoid settling of solids particles
during a viscosity measurement. It uses a rotating-type
viscometer to measure apparent viscosities at a low shear
rate and a vibrating sphere-type viscometer, at a high shear
rate. The two instruments together can accurately determine
the shear-rate dependency of the viscosity. In addition,
Kawatra et al. [56] developed an on-line pressure vessel
rheometer (see Fig. 4), which is a capillary viscometer with
continuously various shear rates. It can be used for on-line
Fig. 5. Nametre viscometer setup, sample is placed in the sump and is
circulated through the system by a centrifugal pump. This arrangement is
very suitable for suspensions with rapidly settling particles [57,58,66].
Fig. 4. Schematic diagram of the pressure vessel rheometer modified [56].
The instrument is directly connected to the process line to tap a sample for
measurement. Legend: (1) process line, (2) vessel, (3) stainless steel tube,
(4) differential pressure transducer, (5) absolute pressure transducer, (6)
drain value, (7) water value.
M. He et al. / Powder Technology 147 (2004) 94–112 97
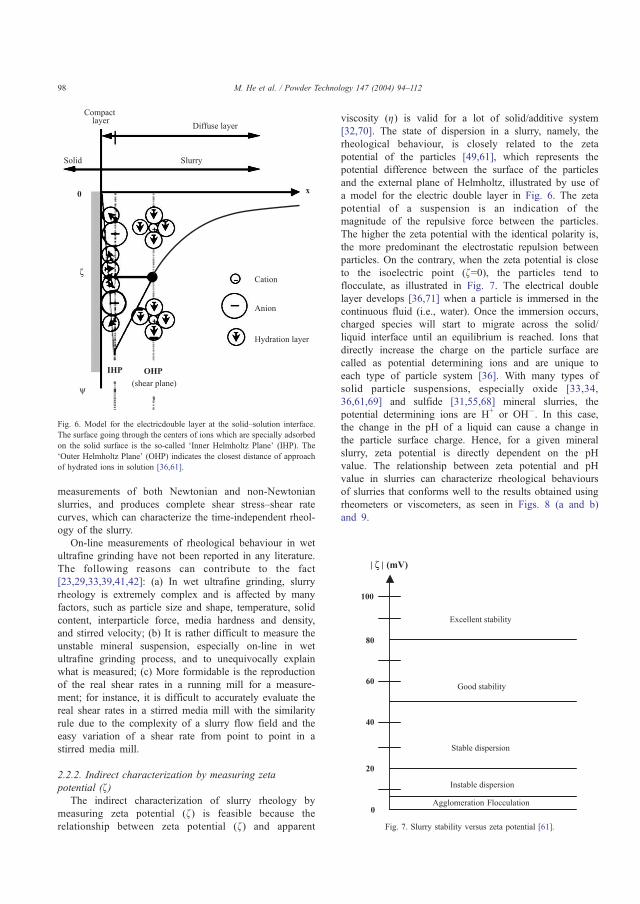
measurements of both Newtonian and non-Newtonian
slurries, and produces complete shear stress–shear rate
curves, which can characterize the time-independent rheol-
ogy of the slurry.
On-line measurements of rheological behaviour in wet
ultrafine grinding have not been reported in any literature.
The following reasons can contribute to the fact
[23,29,33,39,41,42]: (a) In wet ultrafine grinding, slurry
rheology is extremely complex and is affected by many
factors, such as particle size and shape, temperature, solid
content, interparticle force, media hardness and density,
and stirred velocity; (b) It is rather difficult to measure the
unstable mineral suspension, especially on-line in wet
ultrafine grinding process, and to unequivocally explain
what is measured; (c) More formidable is the reproduction
of the real shear rates in a running mill for a measure-
ment; for instance, it is difficult to accurately evaluate the
real shear rates in a stirred media mill with the similarity
rule due to the complexity of a slurry flow field and the
easy variation of a shear rate from point to point in a
stirred media mill.
2.2.2. Indirect characterization by measuring zeta
potential (f)The indirect characterization of slurry rheology by
measuring zeta potential (f) is feasible because the
relationship between zeta potential (f) and apparent
viscosity (g) is valid for a lot of solid/additive system
[32,70]. The state of dispersion in a slurry, namely, the
rheological behaviour, is closely related to the zeta
potential of the particles [49,61], which represents the
potential difference between the surface of the particles
and the external plane of Helmholtz, illustrated by use of
a model for the electric double layer in Fig. 6. The zeta
potential of a suspension is an indication of the
magnitude of the repulsive force between the particles.
The higher the zeta potential with the identical polarity is,
the more predominant the electrostatic repulsion between
particles. On the contrary, when the zeta potential is close
to the isoelectric point (f=0), the particles tend to
flocculate, as illustrated in Fig. 7. The electrical double
layer develops [36,71] when a particle is immersed in the
continuous fluid (i.e., water). Once the immersion occurs,
charged species will start to migrate across the solid/
liquid interface until an equilibrium is reached. Ions that
directly increase the charge on the particle surface are
called as potential determining ions and are unique to
each type of particle system [36]. With many types of
solid particle suspensions, especially oxide [33,34,
36,61,69] and sulfide [31,55,68] mineral slurries, the
potential determining ions are H+ or OH�. In this case,
the change in the pH of a liquid can cause a change in
the particle surface charge. Hence, for a given mineral
slurry, zeta potential is directly dependent on the pH
value. The relationship between zeta potential and pH
value in slurries can characterize rheological behaviours
of slurries that conforms well to the results obtained using
rheometers or viscometers, as seen in Figs. 8 (a and b)
and 9.
Fig. 6. Model for the electricdouble layer at the solid–solution interface.
The surface going through the centers of ions which are specially adsorbed
on the solid surface is the so-called dInner Helmholtz PlaneT (IHP). ThedOuter Helmholtz PlaneT (OHP) indicates the closest distance of approach
of hydrated ions in solution [36,61].
Fig. 7. Slurry stability versus zeta potential [61].
M. He et al. / Powder Technology 147 (2004) 94–11298

2.2.3. Indirect characterization by measurements of the
torque drawn by mills
The slurry viscosity is directly proportional to the torque
drawn by mills under a given grinding condition. Therefore,
the indirect characterization of slurry rheology by measure-
ments of the torque drawn by mills during the operation
period cannot obtain the accurate rheological behaviours of
slurry, but give a relative indication of the slurry rheology
under different milling conditions. The characterization of
slurry rheology using average torque drawn by tumbling
ball mills has been reported [26,72]. Zheng et al. [37]
measured the relationship of the torque of a stirred media
mill versus grinding time to characterize slurry rheology in
wet ultrafine grinding in order to reveal the effect of
grinding aids on the slurry rheology.
2.3. Modelling of the rheology of mineral suspensions
Modelling of the rheology of mineral suspension is to use
mathematic methods describing the constitutive relations
between shear stress and shear rate for a given test slurry.
The empirical rheological models describing the shear stress
(s)–shear rate (c) dependence of non-Newtonian mineral
slurries are the two-parameter power-law [35,73], Bingham
plastic [31,43,55,68,74,75] and Casson [69,76,77], and the
three-parameter Herschel–Bulkley [31,55,62,68,69] and
Sisko models [60,78]. These models are given as follows:
Power� law model : s ¼ Kpcnp ð2Þ
Bingham plastic model : s ¼ s0 þ gpc ð3Þ
Casson model : s1=2 ¼ s1=20 þ gpc� �1=2 ð4Þ
Herschel� Bulkley model : s ¼ s0 þ Khcnh ð5Þ
Sisko model : s ¼ gpcþ Kscns ð6Þ
where s0 is the yield stress; gp is the plastic viscosity; np, nhand ns are the power-law indexes for various models,
respectively; Kp, Kh and Ks are the consistencies, with the
dimension of time, for various models, respectively.
Fig. 9. The influence of pH on the rheological behaviour and zeta potential
of ultrafine galena particles: (a) extrapolated yield values for slurries of
45.5% solid content; (b) viscosity for slurries of 45.5% solids content; (c)
zeta potentials [68].
Fig. 8. (a) Zeta potential of the mixed slurry (involving TiO2, SnO2, ZrO2,
NiO and La2O3) versus pH, (b) Rheogramms for the mixed slurries (40
wt.% density) for two different pH [61].
M. He et al. / Powder Technology 147 (2004) 94–112 99
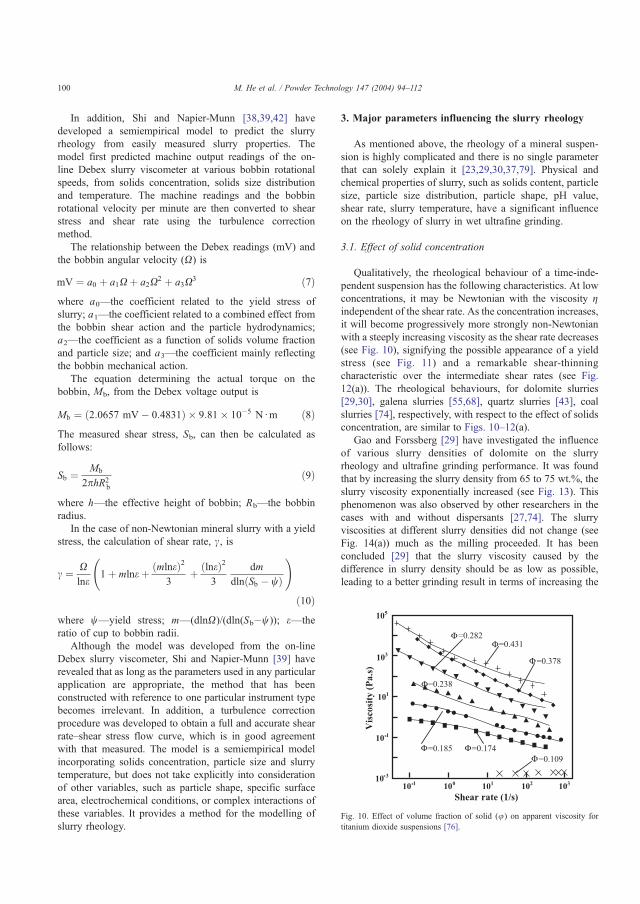
In addition, Shi and Napier-Munn [38,39,42] have
developed a semiempirical model to predict the slurry
rheology from easily measured slurry properties. The
model first predicted machine output readings of the on-
line Debex slurry viscometer at various bobbin rotational
speeds, from solids concentration, solids size distribution
and temperature. The machine readings and the bobbin
rotational velocity per minute are then converted to shear
stress and shear rate using the turbulence correction
method.
The relationship between the Debex readings (mV) and
the bobbin angular velocity (X) is
mV ¼ a0 þ a1Xþ a2X2 þ a3X
3 ð7Þwhere a0—the coefficient related to the yield stress of
slurry; a1—the coefficient related to a combined effect from
the bobbin shear action and the particle hydrodynamics;
a2—the coefficient as a function of solids volume fraction
and particle size; and a3—the coefficient mainly reflecting
the bobbin mechanical action.
The equation determining the actual torque on the
bobbin, Mb, from the Debex voltage output is
Mb ¼ 2:0657 mV� 0:4831ð Þ � 9:81� 10�5 Ndm ð8ÞThe measured shear stress, Sb, can then be calculated as
follows:
Sb ¼ Mb
2phR2b
ð9Þ
where h—the effective height of bobbin; Rb—the bobbin
radius.
In the case of non-Newtonian mineral slurry with a yield
stress, the calculation of shear rate, c, is
c ¼ Xlne
1þ mlneþ mlneð Þ23
þ lneð Þ23
dm
dln Sb � wð Þ
!
ð10Þwhere w—yield stress; m—(dlnX)/(dln(Sb�w)); e—the
ratio of cup to bobbin radii.
Although the model was developed from the on-line
Debex slurry viscometer, Shi and Napier-Munn [39] have
revealed that as long as the parameters used in any particular
application are appropriate, the method that has been
constructed with reference to one particular instrument type
becomes irrelevant. In addition, a turbulence correction
procedure was developed to obtain a full and accurate shear
rate–shear stress flow curve, which is in good agreement
with that measured. The model is a semiempirical model
incorporating solids concentration, particle size and slurry
temperature, but does not take explicitly into consideration
of other variables, such as particle shape, specific surface
area, electrochemical conditions, or complex interactions of
these variables. It provides a method for the modelling of
slurry rheology.
3. Major parameters influencing the slurry rheology
As mentioned above, the rheology of a mineral suspen-
sion is highly complicated and there is no single parameter
that can solely explain it [23,29,30,37,79]. Physical and
chemical properties of slurry, such as solids content, particle
size, particle size distribution, particle shape, pH value,
shear rate, slurry temperature, have a significant influence
on the rheology of slurry in wet ultrafine grinding.
3.1. Effect of solid concentration
Qualitatively, the rheological behaviour of a time-inde-
pendent suspension has the following characteristics. At low
concentrations, it may be Newtonian with the viscosity gindependent of the shear rate. As the concentration increases,
it will become progressively more strongly non-Newtonian
with a steeply increasing viscosity as the shear rate decreases
(see Fig. 10), signifying the possible appearance of a yield
stress (see Fig. 11) and a remarkable shear-thinning
characteristic over the intermediate shear rates (see Fig.
12(a)). The rheological behaviours, for dolomite slurries
[29,30], galena slurries [55,68], quartz slurries [43], coal
slurries [74], respectively, with respect to the effect of solids
concentration, are similar to Figs. 10–12(a).
Gao and Forssberg [29] have investigated the influence
of various slurry densities of dolomite on the slurry
rheology and ultrafine grinding performance. It was found
that by increasing the slurry density from 65 to 75 wt.%, the
slurry viscosity exponentially increased (see Fig. 13). This
phenomenon was also observed by other researchers in the
cases with and without dispersants [27,74]. The slurry
viscosities at different slurry densities did not change (see
Fig. 14(a)) much as the milling proceeded. It has been
concluded [29] that the slurry viscosity caused by the
difference in slurry density should be as low as possible,
leading to a better grinding result in terms of increasing the
Fig. 10. Effect of volume fraction of solid (u) on apparent viscosity for
titanium dioxide suspensions [76].
M. He et al. / Powder Technology 147 (2004) 94–112100

specific surface area per unit of energy consumption (energy
efficiency), as was consistent with that by Zheng et al. [37]
in the cases with and without the dispersant of PAA. It was
found that a higher slurry density allowed fewer numbers of
milling passes because of the yield stress jumped up from
zero (see Fig. 14).
Bernhardt et al. [32] have studied the effect of the solid
concentration of limestone on the slurry rheology for the
effective wet ultrafine grinding and the energy utilization.
The curves in Fig. 12(a) showed the typical non-Newtonian
behaviour with a yield stress value and remarkable shear-
thinning characterization, both strongly dependent on the
solid concentration. Fig. 12(b) revealed that the energy
utilization was nearly independent of the energy consump-
tion for low solid concentrations, but for high solid
concentrations, it showed a clear maximum, which was
shifted to lower energy consumption with increasing solid
concentrations. The reason is that in the region of low
specific energy input (or short grinding time), the number of
particles increases with grinding time, and the stressing
conditions become better, and the energy efficiency
increases. However, there is a point where the ground
particles increase the viscosity of the suspension to such an
extent that they increase the attenuation of the velocity and
kinetic energy of the grinding media ball. Besides, they
found that the earlier the maximum shift occurs, the higher
the solids concentration.
Fig. 13. Variation in the slurry viscosity at different slurry densities of
dolomite in size less than 30 Am in the presence of 1.0 wt.%DispexN40 [29].
Fig. 11. The maximum yield stress of alumina A16 and zirconia Unitec
suspensions, respectively, as a function of solid loading [80].
Fig. 12. The influences of various slurry concentration of limestone on
slurry rheology (a) and on energy utilization (b), respectively, parameter
cm=solid concentration [32].
Fig. 14. Influence of the slurry density on the viscosity (a) and the yield
stress (b) during milling process for dolomite below 30 Am in the presence
of 1.0 wt.% Dispex N40 [29].
M. He et al. / Powder Technology 147 (2004) 94–112 101

3.2. Effects of particle size and particle size distribution
Tangsathitkulchai and Austin [74] investigated the
influence of natural size distributions of ground coal and
quartz on the rheological properties of concentrated
slurries. They found that the strong influence of character-
istic particle size on the slurry rheology was not due to
packing or adsorbed layers on the particles. In addition, it
was deduced that any rheological theory of concentrated
slurries, which does not include a strong dependence of
viscosity on particle size, could not be correct. A similar
investigation was reported by Logos and Nguyen [63] that
by adding a narrow-sized coarse coal fraction (208–279
Am) to the fine (b45 Am) coal slurry, the flow character-
istics of the slurry, at a fixed total solids concentration,
could be changed significantly with a substantial reduction
in the slurry viscosity. It was also found that an optimum
coarse-to-fine particle ratio of 40:60 existed at which the
slurry was Newtonian with a minimum viscosity of about
five times lower than that of a slurry containing only the
fine particles at the same solids concentration. Another
similar work [76] has presented that the titanium dioxide
suspensions with a broad size distribution exhibited a
lower yield stress and a smaller viscosity than those with a
narrow size distribution at the same solid volume fraction
(see Fig. 15). Other several researchers have reported the
effect of particle size and distribution on the flow patterns
of the slurries of iron ore [35], quartz [43] and metal [38].
Although these reported results are not in complete
agreement with each other, the influence of particle size
and distribution on the rheological behaviour of slurry is
significant (see Fig. 16).
3.3. Effect of pH value of slurries
Some literature shows that the pH value greatly
influenced the rheological behaviours of ultrafine sulphide
mineral slurries in size below 5 Am, such as sphalerite [31]
and galena [55,68]. It was found that the yield stress was
strongly dependent on the pH value due to the significant
dependence of the surface properties of ultrafine sulphide
mineral particles in slurries on the pH value (see Fig. 17).
Furthermore, the maximum yield stress value occurred in
the region of pH values corresponding closely to the
isoelectric points (IEP) of various minerals, as is in
agreement with the results from the slurry of oxides
[61,69,76,81–86], and kaolin [85]. Besides, Prestidge
[55,68] studied the effect of pH on the viscosity of galena
slurry. The results showed that the plastic viscosity of the
slurry was insignificantly dependent on pH, which is
similar to the experimental results for alumina suspensions
in the pH ranges from 7.3 to 10.8 by Zhou et al. [84].
However, some studies on the slurries of titanium dioxide
[69,76,86] and of ZST ((Zr,Sn)TiO4) and Nb2O5 [61] have
shown that the pH of slurry could change the flow pattern
of slurry and thus varied the viscosity of slurry (see Figs.
8(b) and 18). These results are not free from contradictions
due to the complexity of the factors influencing slurry
rheology, such as particle size/shape and particle surface
properties. Besides, the effect of the interactions between
or among the pH value and other factors on slurry
rheology is unclear.
3.4. Effect of shear rate (rotation)
Viscometric investigations of concentrated aqueous
alumina suspensions with particle size smaller than 5 Amhave been investigated [62]. In the shear rate interval
between 20 and 640 s�1, the experimental flow curves
indicated thixotropy, which exhibited a pseudoplastic flow
behaviour in the range smaller than 200 s�1 and a dilatant
flow behaviour in the higher range. The shear rate in a
stirred bead mill is closely pertinent to its rotational speed.
Thus, the effect of rotational speeds on slurry rheology is
important to characterize correctly the flow behaviour of
slurry and to provide reasonable data for commercial
production. However, no methods can accurately predict a
real shear rate in a stirred media mill at present. Therefore,
the precise evaluation of the shear rate distribution at
different points in a stirred media mill with respect to the
slurry rheology should be studied by means of computa-
tional fluid dynamics [87].Fig. 15. Effects of particle size distribution on yield stress (a) and viscosity
at a solid volume fraction of 0.28 (b) [76].
M. He et al. / Powder Technology 147 (2004) 94–112102
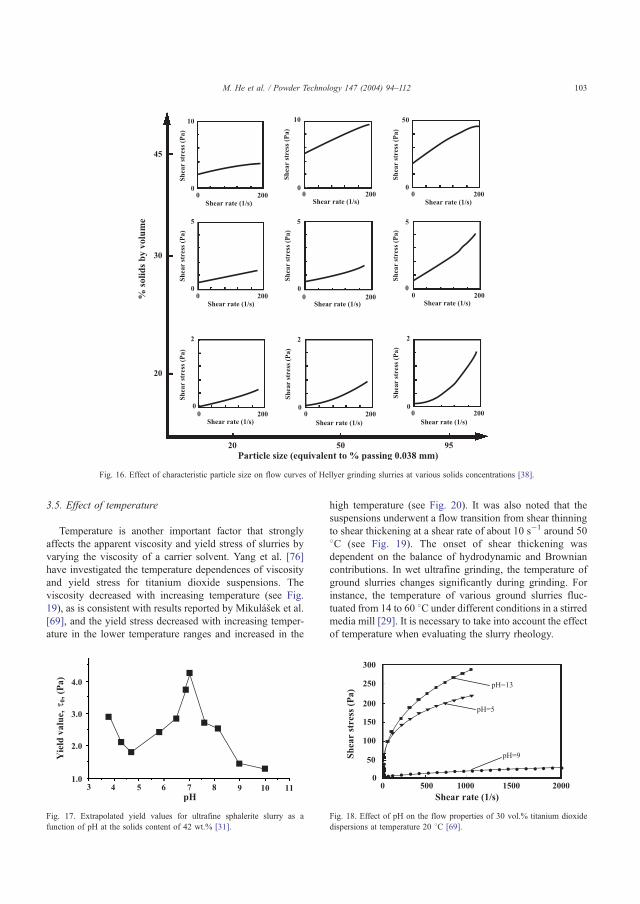
3.5. Effect of temperature
Temperature is another important factor that strongly
affects the apparent viscosity and yield stress of slurries by
varying the viscosity of a carrier solvent. Yang et al. [76]
have investigated the temperature dependences of viscosity
and yield stress for titanium dioxide suspensions. The
viscosity decreased with increasing temperature (see Fig.
19), as is consistent with results reported by Mikulasek et al.
[69], and the yield stress decreased with increasing temper-
ature in the lower temperature ranges and increased in the
high temperature (see Fig. 20). It was also noted that the
suspensions underwent a flow transition from shear thinning
to shear thickening at a shear rate of about 10 s�1 around 50
8C (see Fig. 19). The onset of shear thickening was
dependent on the balance of hydrodynamic and Brownian
contributions. In wet ultrafine grinding, the temperature of
ground slurries changes significantly during grinding. For
instance, the temperature of various ground slurries fluc-
tuated from 14 to 60 8C under different conditions in a stirred
media mill [29]. It is necessary to take into account the effect
of temperature when evaluating the slurry rheology.
Fig. 17. Extrapolated yield values for ultrafine sphalerite slurry as a
function of pH at the solids content of 42 wt.% [31].
Fig. 18. Effect of pH on the flow properties of 30 vol.% titanium dioxide
dispersions at temperature 20 8C [69].
Fig. 16. Effect of characteristic particle size on flow curves of Hellyer grinding slurries at various solids concentrations [38].
M. He et al. / Powder Technology 147 (2004) 94–112 103
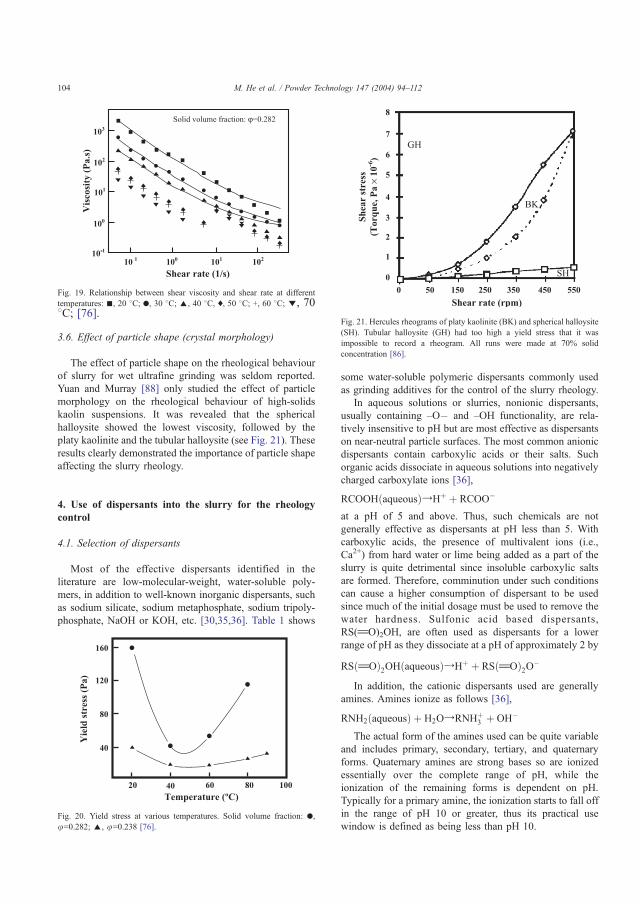
3.6. Effect of particle shape (crystal morphology)
The effect of particle shape on the rheological behaviour
of slurry for wet ultrafine grinding was seldom reported.
Yuan and Murray [88] only studied the effect of particle
morphology on the rheological behaviour of high-solids
kaolin suspensions. It was revealed that the spherical
halloysite showed the lowest viscosity, followed by the
platy kaolinite and the tubular halloysite (see Fig. 21). These
results clearly demonstrated the importance of particle shape
affecting the slurry rheology.
4. Use of dispersants into the slurry for the rheology
control
4.1. Selection of dispersants
Most of the effective dispersants identified in the
literature are low-molecular-weight, water-soluble poly-
mers, in addition to well-known inorganic dispersants, such
as sodium silicate, sodium metaphosphate, sodium tripoly-
phosphate, NaOH or KOH, etc. [30,35,36]. Table 1 shows
some water-soluble polymeric dispersants commonly used
as grinding additives for the control of the slurry rheology.
In aqueous solutions or slurries, nonionic dispersants,
usually containing –O� and –OH functionality, are rela-
tively insensitive to pH but are most effective as dispersants
on near-neutral particle surfaces. The most common anionic
dispersants contain carboxylic acids or their salts. Such
organic acids dissociate in aqueous solutions into negatively
charged carboxylate ions [36],
RCOOHðaqueousÞYHþ þ RCOO�
at a pH of 5 and above. Thus, such chemicals are not
generally effective as dispersants at pH less than 5. With
carboxylic acids, the presence of multivalent ions (i.e.,
Ca2+) from hard water or lime being added as a part of the
slurry is quite detrimental since insoluble carboxylic salts
are formed. Therefore, comminution under such conditions
can cause a higher consumption of dispersant to be used
since much of the initial dosage must be used to remove the
water hardness. Sulfonic acid based dispersants,
RS(jO)2OH, are often used as dispersants for a lower
range of pH as they dissociate at a pH of approximately 2 by
RSðjOÞ2OHðaqueousÞYHþ þ RSðjOÞ2O�
In addition, the cationic dispersants used are generally
amines. Amines ionize as follows [36],
RNH2ðaqueousÞ þ H2OYRNHþ3 þ OH�
The actual form of the amines used can be quite variable
and includes primary, secondary, tertiary, and quaternary
forms. Quaternary amines are strong bases so are ionized
essentially over the complete range of pH, while the
ionization of the remaining forms is dependent on pH.
Typically for a primary amine, the ionization starts to fall off
in the range of pH 10 or greater, thus its practical use
window is defined as being less than pH 10.
Fig. 19. Relationship between shear viscosity and shear rate at different
temperatures: n, 20 8C; ., 30 8C; E, 40 8C, x, 50 8C; +, 60 8C; z, 708C; [76].
Fig. 20. Yield stress at various temperatures. Solid volume fraction: .,u=0.282; E, u=0.238 [76].
Fig. 21. Hercules rheograms of platy kaolinite (BK) and spherical halloysite
(SH). Tubular halloysite (GH) had too high a yield stress that it was
impossible to record a rheogram. All runs were made at 70% solid
concentration [86].
M. He et al. / Powder Technology 147 (2004) 94–112104

With regard to the selection of an appropriate dispersant
for a given ground slurry, it is important to have some
fundamental knowledge of the effects of dispersants on wet
ultrafine grinding, product characteristics and energy con-
sumption, in addition to the type and the magnitude of
electrical charge existing on the surfaces of particles in a
slurry [30,36,37,89]. The additional attention is the side
effects of dispersants. For instance, complexation by the
polymer during ultrafine grinding in stirred media mills was
recently found to cause extraction of yttrium from the
milling beads of yttria-stabilized zirconia into the solution,
leading to significant changes in the composition of the
product [89].
In the case of the identification of suitable viscosity
control chemicals acting as dispersants, it is necessary to
satisfy some required conditions as follows [30,36]: (a) the
dispersants must adsorb on enough of the solid surfaces
available in an industrial mineral being ground so as to
affect slurry viscosity; (b) the slurry viscosity must be so
high that the utilization of the dispersant can detectably help
reduce or control slurry viscosity; (c) the dispersants must
be consistent in its ability to lower viscosity as a function of
changing dispersant concentrations, pH value, water quality,
and amount of shear present; (d) the dispersants must be
nontoxic and degradable; (e) the dispersants must not
adversely affect downstream operations, such as flotation,
thickening, and pelletization, or contaminate the resultant
products; (f) the use of dispersant must be economically
viable in grinding operations.
4.2. Disperse mechanisms of dispersants
From the viewpoint of slurry rheology, the role of
chemical dispersants or grinding aids is primarily to minimize
or to completely eliminate the yield stress of a ground slurry
[36]. In general, interparticle forces in an aqueous suspension
of minerals consist of a van der Waals force and an
electrostatic force. A steric force is included if a polymeric
dispersant is added. The attractive van der Waals forces
occurring in all particles decay to the second and third power
of the interparticle distances with respect to the shape and the
contact geometry. A liquid dispersion medium diminishes
their power and adsorbed layers in general cause a removal of
their reach. As known, the fine particles below 1 Am attract
each other by van der Waals attractive forces to form
aggregates or flocs [49]. Furthermore, in the case of wet
ultrafine grinding, especially at the end, the fraction of
particles less than 1 Am is very high; hence, the van derWaals
force is significant. The electrostatic repulsive force is due to
the surface charge of particle and the formation of an electric
double layer on particle surface (see Fig. 6). Similarly
charged particles repel one another as soon as they break
through the diffuse ranges of electric double layers. The
measurable evidence of surface charges is the zeta potential.
The steric force is caused by the long-tail interference of
absorbed polymeric molecules [36,90], resulting in repulsive
forces when sufficiently short distances between particles are
Fig. 22. Steric stabilization of particles due to adsorption of polymeric
dispersants [36,90].
Table 1
Common water-soluble polymers used as grinding aids [36]
M. He et al. / Powder Technology 147 (2004) 94–112 105

given. A simple illustration of the steric repulsion force of
particles by adsorbed polymers is given in Fig. 22. When the
steric interaction does not exist due to the absence of
adsorbed dispersants, the stabilization mechanisms of sus-
pensions can be quantificationally explained by the DLVO
(Derjagin–Landau–Verwey–Overbeck) theory [32,33,91].
By the utilization of polymeric dispersants, the electro-
static and steric forces can be essentially influenced [91]. An
increase in particle charge, which leads to a reinforcement in
electrostatic force, can be achieved through the changes in
pH or the adsorption of multivalued cations or anions. A
reinforcement of the steric force is fulfilled through hydro-
philic macromolecules with the molecular weight ranging
from several thousand to 100,000 [33,36], such as poly-
acrylamide or polyacrylate [33,49] and Dispex N40 (sodium
salt of a polyacrboxylic acid) [29,30], PAA (polyacrylic
acid) [37]. The steric force involving polymeric dispersants
is the primary mechanism involved with chemical disper-
sants [36,49]. The repulsive force is caused by the
interference of adsorbed chemical molecules so that the
particles cannot come close enough with one another. This
in turn weakens the van der Waals force due to the increase
in distance. For suspensions that are stabilized by poly-
electrolytes, there is still no quantitative theory to account
for the stabilization, but the behaviour of the suspensions
can be explained qualitatively as a combined effect of
electrostatic and steric interactions [91].
4.3. Influence of dispersants on slurry rheology in ultrafine
grinding
Most ultrafine grinding processes are characterized by a
high solids content and the presence of excessive fines
[29,36], which are two of the primary factors leading to the
formation of agglomerations or flocculations and hence the
development of a yield stress of slurry. The use of an
optimal dispersant can change the surface nature of particles
in a ground slurry, resulting in interparticle forces being
entirely repulsive. Thus, the slurry rheology is improved by
the reduction or elimination of yield stress. This can
increase the fineness of products and enhance the ultrafine
grinding efficiency and throughput. For instance, in the
absence of any dispersant, the typical maximum percentage
of solids by weight in a suspension is approximately 50%
for ultrafine grinding in a stirred ball mill while an upper
limit of solid concentration is up to 80% in the presence of
an optimum dispersant [49]. The effects of different
dispersants, quantities of dispersants, molecular weights of
dispersants and methods of introducing dispersants on slurry
rheology control in wet ultrafine grinding performance are
discussed in the following aspects:
4.3.1. Effect of different dispersants
Efforts have been made in developing and searching
grinding aids for wet ultrafine grinding system [30,32–
34,36,37,49]. Wang and Forssberg [30] have studied the
influence of five different dispersants [namely, Dispex CP
(sodium salt of an acrylic copolymer), Dispex N40 (sodium
salt of a polycarboxylic acid), DP6-3437 (sodium salt of
polymer), Calgon (sodium hexametaphosphate) and TSPOP
(Tetrasodiumpyrophosphate)] used as grinding aids in wet
ultrafine grinding of dolomite by a stirred bead mill. It was
shown that the organic dispersants exerted a more favour-
able grinding action than the inorganic ones and the
difference was more pronounced at the fine ends (see Fig.
23). In addition, it was found that the dispersant of Dispex
N40 gave the most excellent performance in grinding
energy efficiency (m2/Wh), resulting from its ability of a
controlled amount of weak flocculation and producing the
desired rheological properties of ground slurry. Similar work
by Zheng et al. [37] involved an investigation of the effects
of additions of sodium hydroxide, sodium carbonate,
sodium oleate, oleic acid, and poly (acrylic) acid (PAA)
on wet ultrafine grinding of limestone in a stirred bead mill.
It was found that PAA, which is similar to Dispex N40, was
best among selected grinding aids for the improvement of
the energy efficiency in grinding, resulting from the
beneficial fluidity of slurry obtained in the presence of
PAA. This is because PAA can modify the surface properties
of limestone and produce the moderate interaction presented
between media and particles. It is qualitatively interpreted
by adsorption density and zeta potential, respectively, as a
function of PAA concentration, as seen in Fig. 24. Other
similar investigations reported [32–34,36,49] are in good
agreement with those referred to above. The polyacrylic
acids or its salts as advanced dispersants for wet ultrafine
grinding of some industrial minerals are identified.
4.3.2. Effect of the quantities of dispersants
Of the numerous dispersants commercially available, it
can be difficult to determine the most appropriate one and its
correct dosage for a certain ground slurry. An insufficient
amount of dispersant is a problem since some particles will
be flocculated by bridging mechanisms [49,92], or electro-
static patch, or mosaic flocculation [50], which increases the
viscosity of slurry. However, an excessive amount of
dispersant is an unnecessary extravagance and can even
Fig. 23. Specific surface area versus specific energy input during ultrafine
grinding with different chemical dispersants at a slurry density of 70%
solids by weight [30].
M. He et al. / Powder Technology 147 (2004) 94–112106

cause slurry destabilization [29]. Therefore, it is important
to determine an optimal dosage of dispersant in wet ultrafine
grinding of a given raw material. Gao and Forssberg [29]
have studied the influences of different quantities of Dispex
N40 (sodium salt of a polycarboxylic acid) on the viscosity
of dolomite slurry in a stirred media mill. It was found that
the presence of different quantities of Dispex N40 trans-
formed the slurry through different rheological behaviours
(see Fig. 25). It was desirable for the ultrafine grinding from
the energy efficiency point of view that the addition of the
optimum amount (0.5 wt.%) of the dispersant could
eliminate a yield stress and make a slurry as viscous as
possible (see Fig. 26) at a fixed solids concentration,
resulting in more intense friction between particles and
milling beads without the formation of flocculation and thus
a high grinding efficiency.
Another work by Bernhardt et al. [32] involved a study
of the concentration of sodium polyacrylate (SPA) on the
slurry rheology of a limestone (b10 Am). It was concluded
that the amount of 0.5% SPA by weight of solids was
sufficient to obtain the optimum slurry rheology of the
limestone for wet ultrafine grinding in a stirred bead mill. In
addition, by the comparison of the dependences of the
energy utilization on the solids concentration without and
with SPA at a fixed value of energy consumption (see Fig.
27), it was found that for the solids concentration above 40
wt.%, a better grinding efficiency and a higher achievable
product fineness were attained in the presence of the optimal
Fig. 25. The influence of the amount of the dispersant of Dispex N40 on the
slurry flow patterns [29].
Fig. 26. The influence of the amount of dispersant on the slurry rheology
[29].
Fig. 27. Energy utilization in dependence on the solid concentration for a
fixed energy consumption of 0.5 kJ/g [32].
Fig. 24. (a) Adsorption density of PAA on limestone vs. PAA (mol. wt.
5000), (b) Zeta potential of limestone vs. PAA (mol. wt. 5000)
concentration [37].
M. He et al. / Powder Technology 147 (2004) 94–112 107
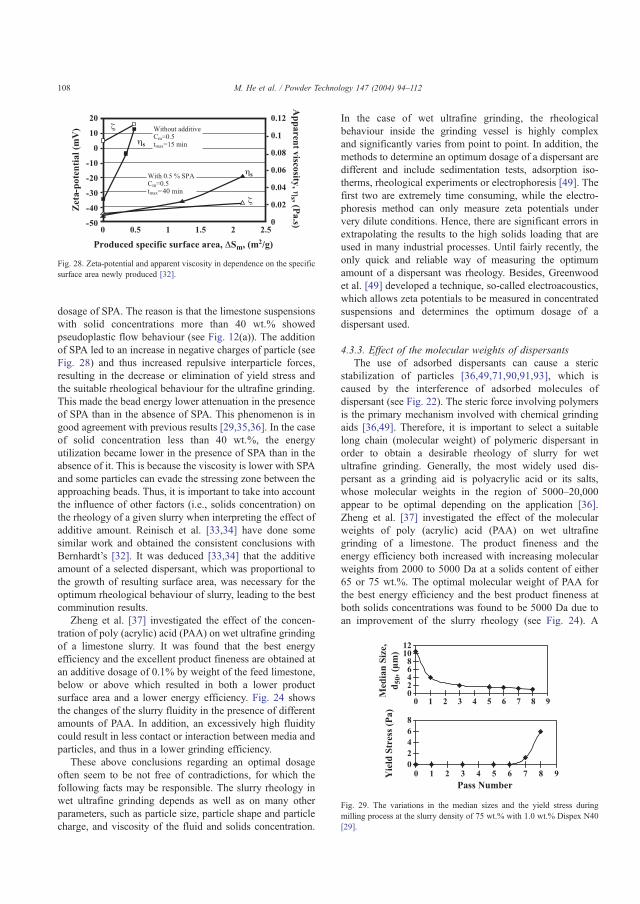
dosage of SPA. The reason is that the limestone suspensions
with solid concentrations more than 40 wt.% showed
pseudoplastic flow behaviour (see Fig. 12(a)). The addition
of SPA led to an increase in negative charges of particle (see
Fig. 28) and thus increased repulsive interparticle forces,
resulting in the decrease or elimination of yield stress and
the suitable rheological behaviour for the ultrafine grinding.
This made the bead energy lower attenuation in the presence
of SPA than in the absence of SPA. This phenomenon is in
good agreement with previous results [29,35,36]. In the case
of solid concentration less than 40 wt.%, the energy
utilization became lower in the presence of SPA than in the
absence of it. This is because the viscosity is lower with SPA
and some particles can evade the stressing zone between the
approaching beads. Thus, it is important to take into account
the influence of other factors (i.e., solids concentration) on
the rheology of a given slurry when interpreting the effect of
additive amount. Reinisch et al. [33,34] have done some
similar work and obtained the consistent conclusions with
Bernhardt’s [32]. It was deduced [33,34] that the additive
amount of a selected dispersant, which was proportional to
the growth of resulting surface area, was necessary for the
optimum rheological behaviour of slurry, leading to the best
comminution results.
Zheng et al. [37] investigated the effect of the concen-
tration of poly (acrylic) acid (PAA) on wet ultrafine grinding
of a limestone slurry. It was found that the best energy
efficiency and the excellent product fineness are obtained at
an additive dosage of 0.1% by weight of the feed limestone,
below or above which resulted in both a lower product
surface area and a lower energy efficiency. Fig. 24 shows
the changes of the slurry fluidity in the presence of different
amounts of PAA. In addition, an excessively high fluidity
could result in less contact or interaction between media and
particles, and thus in a lower grinding efficiency.
These above conclusions regarding an optimal dosage
often seem to be not free of contradictions, for which the
following facts may be responsible. The slurry rheology in
wet ultrafine grinding depends as well as on many other
parameters, such as particle size, particle shape and particle
charge, and viscosity of the fluid and solids concentration.
In the case of wet ultrafine grinding, the rheological
behaviour inside the grinding vessel is highly complex
and significantly varies from point to point. In addition, the
methods to determine an optimum dosage of a dispersant are
different and include sedimentation tests, adsorption iso-
therms, rheological experiments or electrophoresis [49]. The
first two are extremely time consuming, while the electro-
phoresis method can only measure zeta potentials under
very dilute conditions. Hence, there are significant errors in
extrapolating the results to the high solids loading that are
used in many industrial processes. Until fairly recently, the
only quick and reliable way of measuring the optimum
amount of a dispersant was rheology. Besides, Greenwood
et al. [49] developed a technique, so-called electroacoustics,
which allows zeta potentials to be measured in concentrated
suspensions and determines the optimum dosage of a
dispersant used.
4.3.3. Effect of the molecular weights of dispersants
The use of adsorbed dispersants can cause a steric
stabilization of particles [36,49,71,90,91,93], which is
caused by the interference of adsorbed molecules of
dispersant (see Fig. 22). The steric force involving polymers
is the primary mechanism involved with chemical grinding
aids [36,49]. Therefore, it is important to select a suitable
long chain (molecular weight) of polymeric dispersant in
order to obtain a desirable rheology of slurry for wet
ultrafine grinding. Generally, the most widely used dis-
persant as a grinding aid is polyacrylic acid or its salts,
whose molecular weights in the region of 5000–20,000
appear to be optimal depending on the application [36].
Zheng et al. [37] investigated the effect of the molecular
weights of poly (acrylic) acid (PAA) on wet ultrafine
grinding of a limestone. The product fineness and the
energy efficiency both increased with increasing molecular
weights from 2000 to 5000 Da at a solids content of either
65 or 75 wt.%. The optimal molecular weight of PAA for
the best energy efficiency and the best product fineness at
both solids concentrations was found to be 5000 Da due to
an improvement of the slurry rheology (see Fig. 24). A
Fig. 28. Zeta-potential and apparent viscosity in dependence on the specific
surface area newly produced [32].
Fig. 29. The variations in the median sizes and the yield stress during
milling process at the slurry density of 75 wt.% with 1.0 wt.% Dispex N40
[29].
M. He et al. / Powder Technology 147 (2004) 94–112108

higher molecular weight resulted in a higher energy input in
the both cases possibly due to increasing the particle
flocculation caused by the polymer. However, the mecha-
nisms of action of the dispersants with various molecular
weights on the slurry rheology in a stirred media mill are
sufficiently unclear. Therefore, further studies on this aspect
should be carried out.
4.3.4. Effect of the methods of introducing the dispersants
The fineness of ground products would increase signifi-
cantly with grinding time, leading to predominantly
increasing the yield stress (see Fig. 29) and the apparent
viscosity of ground slurry [29,30,32,33] (see Fig. 28). This
can markedly decrease the fineness of resulting products
and lower the grinding energy efficiency; and even stop a
grinding operation due to high yield stress and poor slurry
fluidity (see Fig. 30(a) and (b)) [29]. Wang and Forssberg
[30] have found the effects of periodic and instantaneous
additions of dispersants of Dispex N40 or DP6-3437,
respectively, on wet ultrafine grinding of a dolomite based
on the slurry rheology control in a stirred media mill. The
periodic addition led to an increased grinding rate and a
decreased specific energy input (kWh/t). They deduced that
the procedure of periodic addition could keep the viscosity
of slurry suitable for the attrition and impact of the particles
and media. An excessively high viscosity makes handling
impossible due to the poor fluidity of the slurry without or
with only a very small amount of dispersant. Too low a
viscosity gives a reduced grinding rate and an increased
specific energy input. The periodic addition can optimize
the slurry rheology until the final product is achieved. Gao
and Forssberg [29] also reported that the best results in
terms of the increase in the specific surface area per unit of
energy consumption (m2/Wh) were obtained by the addition
of 0.5 wt.% Dispex N40 in the case of the ultrafine grinding
70 wt.% dolomite in a stirred media mill. The operation was
stopped at the fourth pass due to the sudden increase in yield
stress, while the grinding operation could last at least nine
passes with a yield stress of zero or a small value and a
nearly constant viscosity with the number of passes if 1.5
wt.% Dispex N40 was added into the ground slurry of
dolomite (see Fig. 30). Provided that 1.5 wt.% Dispex N40
was separated into three parts and periodically added three
times, it was not reported whether or not the optimal slurry
rheology could be maintained and the excellent grinding
performance could be achieved. A further work related to
this aspect should be expected.
5. Summary
Most of mineral suspensions exhibit non-Newtonian
fluids. The characterization methods for non-Newtonian
mineral slurries include the direct measurement of rheolog-
ical relationship with a viscometer or a rheometer and indirect
characterizations by measurements of zeta potential or torque
drawn by mills. Several modified viscometers or rheometers
with special setups, which can avoid the settling of solids
particles and turbulent flow occurring in slurry, were
described. It will be desirable to develop a rheometer or a
viscometer system that can be used to be on-line measure-
ment of rheological behaviour in wet ultrafine grinding.
The slurry rheology in wet ultrafine grinding is highly
complex and is influenced by many parameters, like solid
concentration, particle size and distribution, particle shape,
slurry temperature, pH and the use of dispersant. Interpre-
tation of the rheological behaviours of slurry must essen-
tially take into account the identification of the respective
effects of these main factors and their interactions. The
optimization of the rheological behaviours of slurry in wet
ultrafine grinding can significantly increase throughput,
energy efficiency and product fineness as well. The optimal
rheological behaviour of slurry for wet ultrafine grinding
need further be ascertained.
The effect of a dispersant on wet ultrafine grinding
performance is crucial since the solids content of a ground
material with an appropriate dispersant in a stirred media
mill increases by about 30 wt.% and the fineness of the final
product significantly enhances. For the slurry rheology
control, the mostly used dispersant as a grinding aid is
polyacrylic acid or its salts with a molecular weight in the
range of 5000 to 20,000, which appears to be optimal
depending on the application. However, there is still little
understanding on the mechanism for the effect of molecular
weights of a dispersant on the slurry rheology control. The
methods to determine the optimum dosage of a dispersant
need further be optimized to accurately control a slurry
Fig. 30. The variations in slurry viscosity (a) and in yield stress (b) during
milling process at different amount of addition of Dispex N40 at dolomite
slurry concentration of 70 wt.% [29].
M. He et al. / Powder Technology 147 (2004) 94–112 109
rheology by the use of a dispersant. The influence of the
periodic addition of dispersant on slurry rheology is still
lack of reasonable experimental explanation. These relevant
investigations should be studied by means of some effective
characterization methods, such as X-ray photonelectron
energy spectrometry (XPS), infrared spectrometry (FT-IR),
atomic force microscopy (AFM), and the measurements of
rheology with a suitable rheometer and of zeta potential in a
concentrated suspension with a reliable technique as well.
In addition, some empirical equations, which can model
the slurry rheology of minerals, have been investigated.
However, a semiempirical model incorporating solids con-
centration, particle size and slurry temperature could be of
commercial interest. The relationships among rheological
properties, comminution parameters, amount of suitable
dispersant, energy efficiency and particle size character-
ization are of particular interests for wet ultrafine grinding.
Acknowledgements
The authors wish to thank the Swedish National Energy
Administration for the financial support.
References
[1] Arno Kwade, Wet comminution in stirred media mills—research and
its practical application, Powder Technology 105 (1999) 14–20.
[2] H. Bel Fadhel, C. Frances, Wet batch grinding of alumina hydrate in a
stirred bead mill, Powder Technology 119 (2001) 257–268.
[3] Osawaru A. Orumwense, Eric Forssberg, Superfine and ultrafine
grinding—a literature survey, Mineral Processing and Extractive
Metallurgy Review 11 (1992) 107–127.
[4] R.K. Mehta, C.W. Schultz, A novel energy efficient process for ultra-
fine coal grinding, SEM Annual Meeting, London, 1991, pp. 1–8.
[5] I.J. Corrans, J.E. Angove, Ultra fine milling for the recovery of
refractory gold, Minerals Engineering 4 (1991) 763–776.
[6] C.H. Lofthouse, F.E. Johns, The svedala (ECC international) detritor
and the metals industry, Minerals Engineering 12 (1999) 205–217.
[7] Rolf Krawczyk, Processing of alumina for oxide ceramics and
refractory products, Ceramic Forum International: Berichte der
Deutschen Keramischen Gesellschaft 67 (7/8) (1990) 342–348.
[8] W.G. Schmidt, Ultra-fine grinding of ceramic powders for the
sintering process, Interceram 40 (1991) 15–18.
[9] Takashi Hibino, Kazuo Suzuki, Ken-ichi Ushiki, Yoshitaka Kuwahara,
Mitsukuni Mizuo, Ultra-fine grinding of La0.8Sr0.2MnO3 oxide by
vibration mill, Applied Catalysis. A, General 145 (1996) 297–306.
[10] H. Bel Fadhel, C. Frances, A. Mamourian, Investigations on ultra-fine
grinding of titanium dioxide in a stirred media mill, Powder
Technology 105 (1999) 362–373.
[11] Richard Byrappa, Chun-wei Chen, Pavel Shuk, Charles S. Oakes,
Solution synthesis of hydroxyapatite designer particulates, Solid State
Ionics 151 (2002) 393–402.
[12] Arno Kwade, Joerg Schwedes, Breaking characteristics of different
materials and their effect on stress intensity and stress number in
stirred media mills, Powder Technology 122 (2002) 109–121.
[13] M. Akbarieh, R. Tawashi, Morphic features of solid particles after
micronization in the fluid energy mill, International Journal of
Pharmaceutics 35 (1987) 81–89.
[14] Ian Krycer, John A. Hersey, Fine powder mixing in a vibratory ball
mill, International Journal of Pharmaceutics 6 (1980) 119–129.
[15] Isidor Hirsch, Moshe Hirsch, Joseph Mizrahi, Production of white
carbonate paper-fillers by a new ultra-fine wet grinding technology,
Industrial Minerals (1985) 67–69 (November).
[16] W.A. Hockings, M.E. Volin, A.L. Mular, Effect of suspending fluid
viscosity on batch mill grinding, Transactions of the American
Institute of Mining Engineers 232 (1965) 59–62.
[17] B. Clarke, J.A. Kitchener, The influence of pulp viscosity on fine
grinding in a ball mill, British Chemical Engineering 13 (1968)
991–995.
[18] V.V. Jinescu, The rheology of suspension, International Chemical
Engineering 14 (1974) 397–420.
[19] R.R. Klimpel, Slurry rheology influence on the performance of
mineral/coal grinding circuit, Part 1, Mining Engineering 34 (1982)
1665–1668.
[20] R.R. Klimpel, Slurry rheology influence on the performance of
mineral/coal grinding circuit, Part 2, Mining Engineering 35 (1983)
21–26.
[21] R.R. Klimpel, Influence of material breakage properties and asso-
ciated slurry rheology on breakage rates in wet grinding of coals/ores
in tumbling media mills, in: M.J. Jones, R. Oblatt (Eds.), Reagents in
the Mineral Industry, I.M.M, London, 1984, pp. 265–270.
[22] H. El-shall, P. Somassundaran, Mechanisms of grinding modification
by chemical additives: organic reagents, Powder Technology 38
(1984) 267–273.
[23] P. Somasundaran, S. Shrotri, Grinding aids: a review of their use,
effects and mechanisms, Selected Topics in Mineral Processing, New
Age International Publishers, India, 1995, pp. 47–70.
[24] H. Laapas, U.R. Lahtinen, T. Lukkarinen, Effect of surfactants in fine
grinding, in: M.J. Jones, R. Oblatt (Eds.), Reagents in the Mineral
Industry, I.M.M, London, 1984, pp. 13–17.
[25] S.K. Kawatra, T.C. Eisele, Rheological effects in grinding circuits,
International Journal of Mineral Processing 20 (1988) 251–259.
[26] D.W. Fuerstenau, K.S. Venkataraman, B.V. Velamakanni, Effect of
chemical additives on the dynamics of grinding media in wet ball
mill grinding, International Journal of Mineral Processing 15 (1985)
251–267.
[27] B.V. Velamakanni, D.W. Fuerstenau, The influence of polymeric
additives on the rheology of dense slurries, Flocculation in Bio-
technology and Separation Systems, Elsevier Y. A, Amsterdam, 1987,
pp. 211–223.
[28] D.W. Fuerstenau, P.C. Kapur, B.V. Velamakanni, A multi-torque
model for the effects of dispersants and slurry viscosity on ball
milling, International Journal of Mineral Processing 28 (1990) 81–98.
[29] M. Gao, E. Forssberg, The influence of slurry rheology on ultra-
fine grinding in a stirred ball mill, 18th International Mineral
Processing Congress, Sydney, CA (Conference Article), Australian,
1993, pp. 237–244.
[30] Y. Wang, E. Forssberg, Dispersants in stirred ball mill grinding, Kona
13 (1995) 67–77.
[31] T.H. Muster, C.A. Prestidge, Rheological investigations of sulphide
mineral slurries, Minerals Engineering 8 (1995) 1541–1555.
[32] C. Bernhardt, E. Reinsch, K. Husemann, The influence of suspension
properties on ultra-fine grinding in stirred ball mills, Powder
Technology 105 (1999) 357–361.
[33] E. Reinisch, C. Bernhardt, K. Husemann, The influence of additives
during wet ultra-fine grinding in agitator bead mills: Part 1.
General principles and experimental, Ceramic Forum International:
Berichte der Deutschen Keramischen Gesellschaft 78 (3) (2001)
E38–E42.
[34] E. Reinisch, C. Bernhardt, K. Husemann, The influence of
additives during wet ultra-fine grinding in agitator bead mills:
Part 2. Results and conclusions, Ceramic Forum International:
Berichte der Deutschen Keramischen Gesellschaft 78 (4) (2001)
E36–E40.
[35] P. Somasundaran, Brij M. Moudgil (Eds.), Grinding aids based on
slurry rheology control, Reagents in Mineral Technology, Surfactant
Science Series, New York, vol. 27, 1988, pp. 179–193.
M. He et al. / Powder Technology 147 (2004) 94–112110

[36] R.R. Klimpel, The selection of wet grinding chemical additives based
on slurry rheology control, Powder Technology 105 (1999) 430–435.
[37] Jie Zheng, Colin C. Harris, P. Somasundaran, The effect of additives
on stirred media milling of limestone, Powder Technology 91 (1997)
173–179.
[38] F.N. Shi, T.J. Napier-Munn, A model for slurry rheology, International
Journal of Mineral Processing 47 (1996) 103–123.
[39] F.N. Shi, T.J. Napier-Munn, Measuring the rheology of slurries using
an on-line viscometer, International Journal of Mineral Processing 47
(1996) 153–176.
[40] F.N. Shi, T.J. Napier-Munn, Estimation of shear rates inside a ball
mill, International Journal of Mineral Processing 57 (1999) 167–183.
[41] F.N. Shi, Investigation of the effects of chrome ball charge on slurry
rheology and milling performance, Minerals Engineering 15 (2002)
297–299.
[42] F.N. Shi, T.J. Napier-Munn, Effects of slurry rheology on industrial
grinding performance, International Journal of Mineral Processing 65
(2002) 125–140.
[43] C. Tangsathitkulchai, The effect of slurry rheology on fine grinding in
a laboratory ball mill, International Journal of Mineral Processing
1587 (2002) 1–19.
[44] L.G. Austin, R.R. Klimpel, P.T. Luckie, Process Engineering of Size
Reduction: Ball Milling, 1984, pp. 80–81, New York.
[45] Mingwei Gao, Eric Forssberg, Prediction of product size distributions
for a stirred ball mill, Powder Technology 84 (1995) 101–106.
[46] Arno Kwade, Determination of the most important grinding mecha-
nism in stirred media mills by calculating stress intensity and stress
number, Powder Technology 105 (1999) 382–388.
[47] J. Theuerkauf, J. Schwedes, Theoretical and experimental investiga-
tion on particle and fluid motion in stirred media mills, Powder
Technology 105 (1999) 406–412.
[48] Lutz Blecher, Arno Kwade, Jfrg Schwedes, Motion and stress
intensity of grinding beads in a stirred media mill: Part 1. Energy
density distribution and motion of single grinding beads, Powder
Technology 86 (1996) 59–68.
[49] R. Greenwood, N. Rowson, S. Kingman, G. Brown, A new method
for determining the optimum dispersant concentration in aqueous
grinding, Powder Technology 123 (2002) 199–207.
[50] J. Gregory, in: Th.F. Tadros (Ed.), Solid/Liquid Dispersions:
Flocculation by Polymers and Polyelectrolytes, Academic Press,
London, 1987, Chap. 8.
[51] Roger I. Tanner, Engineering Rheology, second ed., Oxford Univer-
sity Press, New York, 2000, pp. 1–29.
[52] R.W. Whorlow, Rheological Techniques, second ed., Ellis Horwood,
West Sussex (England), 1992, pp. 1–40.
[53] Arno Kwade, Lutz Blecher, Jfrg Schwedes, Motion and stress
intensity of grinding beads in a stirred media mill: Part 2. Stress
intensity and its effect on comminution, Powder Technology 86
(1996) 69–76.
[54] R.R. Klimpel, Some industrial experiences in modifying fine grinding
environments for improved downstream product performance, Inter-
national Journal of Mineral Processing 44–45 (1996) 133–142.
[55] C.A. Prestidge, Rheological investigations of galena particle inter-
actions, Colloids and Surfaces. A, Physicochemical and Engineering
Aspects 126 (1997) 75–83.
[56] S.K. Kawatra, A.K. Bakshi, T.C. Eisele, An on-line pressure vessel
rheometer for slurries, Powder Technology 105 (1999) 418–423.
[57] S.K. Kawatra, A.K. Bakshi, On-line measurement of viscosity and
determination of flow types for mineral suspensions, International
Journal of Mineral Processing 47 (1996) 275–283.
[58] S.K. Kawatra, A.K. Bakshi, T.E. Miller, Rheological characterization
of mineral suspensions using a vibrating sphere and a rotational
viscometer, International Journal of Mineral Processing 44–45 (1996)
155–165.
[59] Sayavur I. Bakhtiyarov, Ruel A. Overfelt, Rheology of solid–liquid
suspensions in reduced gravity, Powder Technology 104 (1999)
151–156.
[60] R.M. Turian, T.W. Ma, F.L.G. Hsu, D.J. Sung, Characterization,
settling, and rheology of concentrated fine particulate mineral slurries,
Powder Technology 93 (1997) 219–233.
[61] S. Vallar, D. Houivet, J. El Fallah, D. Kervadec, J.-M. Haussonne,
Oxide slurries stability and powders dispersion: optimization with zeta
potential and rheological measurements, Journal of the European
Ceramic Society 19 (1999) 1017–1021.
[62] T. Lemke, F. Bagusat, K. Kfhnke, K. Husemann, H.-J. Mfgel, Time
dependent viscosity of concentrated alumina suspensions, Colloids
and Surfaces. A, Physicochemical and Engineering Aspects 150
(1999) 283–287.
[63] C. Logos, Q.D. Nguyen, Effect of particle size on the flow properties
of a South Australian coal–water slurry, Powder Technology 88
(1996) 55–58.
[64] P.T. Slatter, The rheological characterisation of sludges, Water Science
and Technology 36 (11) (1997) 9–18.
[65] Isabelle Seyssiecq, Jean-Henry Ferrasse, Nicolas Roche, State-of-the-
art: rheological characterization of wastewater treatment sludge,
Biochemical Engineering Journal 3719 (2003) 1–16.
[66] S.K. Kawatra, A.K. Bakshi, M.T. Rusesky, The effect of slurry
viscosity on hydrocyclone classification, International Journal of
Mineral Processing 48 (1996) 39–50.
[67] S.K. Kawatra, A.K. Bakshi, Determination of changes in rheological
properties of coal slurries in process streams, Coal Preparation 15
(1995) 165–175.
[68] Clive A. Prestidge, Rheological investigations of ultrafine galena
particle slurries under flotation-related conditions, International
Journal of Mineral Processing 51 (1997) 241–254.
[69] P. Mikulasek, R.J. Wakeman, J.Q. Marchant, The influence of
pH and temperature on the rheology and stability of aqueous
titanium dioxide dispersions, Chemical Engineering Journal 67
(1997) 97–102.
[70] M.D. Sacks, T.-Y. Tseng, Role of sodium citrate in aqueous milling of
aluminium oxide, Journal of the American Ceramic Society 66 (1983)
242–247.
[71] P.C. Hiemenz, R. Rajagopalan, Principles of Colloid and Surface
Chemistry, Dekker Marcel, New York, 1997.
[72] M. Katzer, R.R. Klimpel, J. Sewell, Example of the laboratory
characterization of grinding aids in the wet grinding ores, Mining
Engineering 33 (1981) 1471–1476.
[73] Richard Klimpel, Laboratory studies of the grinding and rheology of
coal–water slurries, Powder Technology 32 (1982) 267–277.
[74] C. Tangsathitkulchai, L.G. Austin, Rheology of concentrated slurries
of particles of natural size distribution produced by grinding, Powder
Technology 56 (1988) 293–299.
[75] C. Tangsathitkulchai, Acceleration of particle breakage rates in wet
batch ball milling, Powder Technology 124 (2002) 67–75.
[76] Hua-Gui Yang, Chun-Zhong Li, Hong-chen Gu, Tu-Nan Fang,
Rheological behavior of titanium dioxide suspensions, Journal of
Colloid and Interface Science 236 (2001) 96–103.
[77] Andreja Zupancic, Romano Lapasin, Annika Kristoffersson, Influence
of particle concentration on rheological properties of aqueous a–Al2O3 suspensions, Journal of the European Ceramic Society 18
(1998) 467–477.
[78] William J. Bailey, Iain S. Weir, Investigation of methods for direct
rheological model parameter estimation, Journal of Petroleum Science
& Engineering 21 (1998) 1–13.
[79] G.A. Banini, R.A. Bearman, Application of fuzzy cognitive maps to
factors affecting slurry rheology, International Journal of Mineral
Processing 52 (1998) 233–244.
[80] Manjunath Subbanna, Pradip, S.G. Malghan, Shear yield stress of
flocculated alumina–zirconia mixed suspensions: effect of solid
loading, composition and particle size distribution, Chemical Engi-
neering Science 53 (1998) 3073–3079.
[81] W.R. Richmond, R.L. Jones, P.D. Fawell, The relationship between
particle aggregation and rheology in mixed silica–titania suspensions,
Chemical Engineering Journal 71 (1998) 67–75.
M. He et al. / Powder Technology 147 (2004) 94–112 111
[82] Jan Gustafsson, Pasi Mikkola, Mika Jokinen, Jarl B. Rosenholm, The
influence of pH and NaCl on the zeta potential and rheology of
anatase dispersions, Colloids and Surfaces. A, Physicochemical and
Engineering Aspects 175 (2000) 349–359.
[83] Andrej Degen, Marija Kosec, Effect of pH and impurities on the
surface charge of zinc oxide in aqueous solution, Journal of the
European Ceramic Society 20 (2000) 667–673.
[84] Zhongwu Zhou, Peter J. Scales, David V. Boger, Chemical and
physical control of the rheology of concentrated metal oxide
suspensions, Chemical Engineering Science 56 (2001) 2901–2920.
[85] Stephen B. Johnson, George V. Franks, Peter J. Scales, David V.
Boger, Thomas W. Healy, Surface chemistry–rheology relationships in
concentrated mineral suspensions, International Journal of Mineral
Processing 58 (2000) 267–304.
[86] Gayle E. Morris, Willian A. Skinner, Peter G. Self, Roger St. C.
Smart, Surface chemistry and rheological behaviour of titania pigment
suspensions, Colloids and Surfaces. A, Physicochemical and Engi-
neering Aspects 155 (1999) 27–41.
[87] Graeme L. Lane, CFD modeling of a stirred bead mill for fine
grinding, Second International Conference on CFD in the Minerals
and Process Industries, Melbourne, Australia, 1999, pp. 449–454.
[88] Jun Yuan, Haydn H. Murray, The importance of crystal morphology
on the viscosity of concentrated suspensions of kaolins, Applied Clay
Science 12 (1997) 209–219.
[89] B. Lartiges, P. Somasundaran, Ultrafine grinding of yttria stabilized
zirconia in polyacrylic acid solution, Sep. Symp. Proc. Comminu-
tion–Theory and Practice, Phoenix, AZ, USA, Society for Mining,
Metallurgy, and Exploration, Littleton, CO, 1992, pp. 585–598
Chap. 43.
[90] Victoria S. Stenkamp, John C. Berg, The role of long tails in steric
stabilization and hydrodynamic layer thickness, Langmuir 13 (1997)
3827–3832.
[91] Bhaskar V. Velamakanni, Douglas W. Fuerstenau, The effect of the
adsorption of polymeric additives on the wet grinding of minerals: 1.
Mechanisms of suspension stabilization, Powder Technology 75
(1993) 1–9.
[92] R. Greenwood, L. Bergstrom, Electroacoustic and rheological proper-
ties of aqueous Ce–ZrO2 (Ce TZP) suspensions, Journal of the
European Ceramic Society 17 (1997) 537–548.
[93] A.W. Adamson, Physical Chemistry of Surfaces, Wiley, New York,
1990.
M. He et al. / Powder Technology 147 (2004) 94–112112

Paper 2
Parameter studies on the rheology of limestone slurries
International Journal of Mineral Processing, 78 (2006) 63-77
Reprinted from International Journal of Mineral Processing with permission from Elsevier (copyright 2006).

Parameter studies on the rheology of limestone slurries
Mingzhao He a,*, Yanmin Wang a,b, Eric Forssberg a
a Division of Mineral Processing, Lulea University of Technology, SE-971 87, Lulea, Swedenb Institute of Material Science and Engineering, South China University of Technology, Guangzhou, 510640, China
Received 26 October 2004; received in revised form 8 June 2005; accepted 12 July 2005
Available online 11 October 2005
Abstract
The influences of solids concentration, molecular weight of dispersant, particle size and distribution, and temperature on the
rheological behaviour of limestone slurries have been investigated. The results reveal that when the solids concentration of a limestone
slurry (b100 Am) is increased from 60 wt.% (35.71 vol.%) to 78.5 wt.% (57.49 vol.%), the rheological behaviour of the slurry is
transformed from a weakly dilatant characteristic to a pseudoplastic one with a yield stress, which is in combination with a thixotropic
property at a higher solids concentration (i.e.,z75wt.% or 52.63 vol.%). At a certain shear rate, the apparent viscosity and the relative
viscosity of the slurry increase exponentially with solids concentration. The extrapolated Bingham yield stress increases rather sharply
in a power-law formwith increasing solids concentration when the solids concentration of the slurry is larger than 70 wt.% (i.e., 46.36
vol.%). An attainable maximum packing solids fraction (/m) is predicted as /m=64.6 vol.% at the certain limestone–water
suspension system. A polymeric dispersant named Dispersant S40 with a molecular weight of 5500 appears most effective for the
reduction of the apparent viscosity of limestone slurry due to its good electrosteric stabilization and effective avoidance of depletion
flocculation. The smaller the particle size and the narrower the size distribution, the more evident the pseudoplastic property of
limestone slurry is with a larger yield stress and a larger apparent viscosity at a given shear rate in the range of 12 to 1200 s�1. Also, a
statistic model describes a relationship between the particle size and distribution and the apparent viscosity of the slurries at a given
solids concentration (i.e., 70 wt.% or 46.36 vol.%). However, a sufficient additive dosage of Dispersant S40 (i.e., z0.1 wt.%)
significantly decreases or even eliminates the rheological differences of limestone slurries (apparent viscosities and extrapolated yield
stresses) resulting from the difference in particle size and distribution. Besides, the apparent viscosity of limestone slurries decreases
with increasing temperature in the range of 13 to 55 8C, regardless of the absence or the presence of Dispersant S40.
D 2005 Elsevier B.V. All rights reserved.
Keywords: limestone; slurry rheology; solids concentration; molecular weight; fine particle; temperature
1. Introduction
From a diagnostic point of view, the rheological
behaviour of a mineral slurry is indicative of the level
of interparticle interaction or aggregation in the slurry
and therefore it is a useful variable to be controlled in
industrial processes such as transportation of slurries,
dewatering and wet grinding (Muster and Prestidge,
1995). However, the rheological property of a mineral
suspension is complicated and there is no single pa-
rameter that can solely explain it. Physical and chemical
properties of a slurry, such as solids concentration, use
of dispersants, particle size and distribution, particle
shape, pH value, shear rate, slurry temperature, have
a significant influence on the slurry rheology due to the
change or modification in surface property (He et al.,
2004). As known, the fine particles below 1 Am in a
suspension attract each other by van der Waals attrac-
0301-7516/$ - see front matter D 2005 Elsevier B.V. All rights reserved.
doi:10.1016/j.minpro.2005.07.006
* Corresponding author. Tel.: +46 920 491692; fax: +46 920 97364.
E-mail addresses: [email protected],
[email protected] (M. He).
Int. J. Miner. Process. 78 (2006) 63–77
www.elsevier.com/locate/ijminpro
tive forces to form aggregates or flocs, which evidently
increase the viscosity of the suspension. Furthermore,
the product fineness significantly increases with grind-
ing time in wet ultra-fine grinding characterized by a
very fine product size and a high solids concentration,
the surface properties tend to predominate in the system
(Bernhardt et al., 1999; Klimpel, 1999; Zheng et al.,
1997; Gao and Forssberg, 1993). This results in
changes in the rheological properties in wet ultra-fine
grinding operations due to the agglomeration and ag-
gregation resulting from the inter-particle forces, such
as van der Waals forces (Greenwood et al., 2002;
Reinisch et al., 2001a)) and electrostatic forces (Bern-
hardt et al., 1999; Muster and Prestidge, 1995; Gregory,
1987). Therefore, the effect of the slurry flowabilities or
slurry rheology in wet ultra-fine grinding becomes of
particular importance. It is known that an optimised
rheological behaviour of a ground slurry can enhance
energy efficiency and throughput in wet ultrafine grind-
ing operation. For instance, the addition of an optimum
dispersant to a given feed slurry can result in a drastic
reduction or even the elimination of yield stress and
permits a higher solids concentration of the ground
slurry (Kapur et al., 1996; Klimpel, 1999; Greenwood
et al., 2002; Reinisch et al., 2001a,b). In the absence of
any dispersant, the typical maximum percentage solids
by weight in a slurry is approximately 50% for a feed of
wet ultra-fine grinding in stirred media mills while an
upper limitation of solids concentration is up to 80
wt.% in the presence of an optimal dispersant (Green-
wood et al., 2002). Therefore, the improvement of the
rheological behaviour of a feed slurry with a suitable
dispersant can enhance the productivity and throughput
for wet ultra-fine grinding.
The objective of this work is to investigate the effects
of solids concentration, molecular weight of dispersant,
particle size and distribution, and temperature on the
rheology and flowability of limestone slurries.
2. Experimental set-up and procedures
2.1. Materials
A limestone material (93.7% CaCO3) provided by
SMA Karbonater AB in Sweden was used for the rhe-
ological experiments. The chemical analysis and phys-
ical characteristics of the limestone material are listed in
Tables 1 and 2, respectively. The samples of the material
with three various particle sizes and distributions were
prepared for the tests. The first sample is the original
sample provided with a size of b100 Am, as designated
as raw 1; the second is a sieved sample with a size of
b74 Am from the raw 1 by the use of a U. S. Standard
sieve (0–74 Am), as designated as raw 2; and the third,
with a size of b40 Am from the raw 1 by a sieve of
Retsch DIN 4188 type (0–40 Am), as designated as raw
3. Fig. 1 shows the particle sizes and distributions of
these samples, which were determined by an X-ray
Sedimentometer Sedigraph 5100D (Micromeritics Co.
Ltd., USA). Raw 1 has the characteristic sizes of d50 (the
median size) of 24.68 Am and d90 (the 90% passing size)
of 97.3 Am, and raw 2, d50 of 17.48 Am and d90 of 45
Am, and raw 3, d50 of 10.04 Am and d90 of 23.5 Am.
Three polymeric dispersants with various molecular
weights, i.e., BCX-476, Dispersant S40 and BCX-552
(CDM AB, Sweden) were used in this study. Table 3
lists the physical and chemical properties of these dis-
persants. In this investigation, the addition amount of a
dispersant is the percent of the pure dispersant (i.e.,
active content) by weight relative to the weight of solids
in a limestone slurry.
2.2. Experimental set-up
2.2.1. Mixing
A limestone–water slurry was prepared by the addi-
tion of 30 kg of limestone powder into a certain amount
of water for a pre-determined solids concentration of
Table 1
Chemical analysis of composition of the limestone
Main chemical composition Percent (%) Standard deviation
CaO total 50 1
CaO ASTM C-602 52.5 0.7
CaCO3 ASTM C-602 93.7 1.3
MgO 4.50 1
Fe2O3 0.70 0.2
SiO2 3.50 1
Al2O3 0.85 0.2
MnO 0.15 0.03
P2O5 0.01
Loss on ignition 40 0.6
Moisture 0.2
Table 2
Physical characteristics of the limestone
Real density (kg/m3) Volume density (kg/m3) Moh’s hardness Whiteness (ISO 457) pH Particle shape Specific surface area (m2/g)
2700 1000 3 77% 9 Nodular 1.174
M. He et al. / Int. J. Miner. Process. 78 (2006) 63–7764

each slurry sample. The slurry was stirred as the lime-
stone powder was added into water, and the stirring was
continued for 15 min to make the slurry uniform after
the completion of adding limestone powder. If a chem-
ical with a given amount was added, the slurry was
stirred for 15 min again after the addition of the chem-
ical to make the chemical disperse uniformly in the
slurry. About 200 ml slurry was taken from each sam-
ple, which was used to analyse the particle size and
distribution and to measure the rheological behaviour of
the slurry. The slurry samples were aged for 4 hr, and
then were shaken at an intensity of 225 min�1 with a
shaker of Model TH-30 (Edmund Buhler Co., Ger-
many) for 1 hr to re-disperse the samples prior to the
rheological measurement.
2.2.2. Viscometer
A rotational viscometer was used for the determina-
tion of slurry viscosities and shear stress–shear rate
curves. The viscometer is the Bohlin Visco 88 BV (Boh-
lin Reologi UK Ltd., UK). It employs a concentric
cylinder geometry with a rotating inner cylinder and a
stationary outer cylinder. The concentric cylinder system
can be configured in 8 different measurement systems (3
DIN, 2 dWide GapT, 3 dInfinite SeaT), corresponding to
SYSTEM knob 1 to 8 on the instrument, and its design
allows the measurement of samples to be made in situ
(e.g., in a container) as well as on the laboratory bench.
Any inner cylinder has 8 different rotation speeds to be
chosen, which is from 20 to 1000 rpm (in agreement with
a SPEED setting value 1 to 8 on the instrument),
corresponding to a shear-rate range of 4 to 1200 s�1.
The torque developed on the inner cylinder due to a
sample is directly related to the sample viscosity and
should be in the range of 0.5 to 9.5 mNm for the
accurateness. In this study, all samples were measured
by the use of C30 system (C30 DIN), which has a gap
width of 1.5 mm between the inner and outer cylinders
and can provide a viscosity range of 0.007 to 6.18 Pas. A
thermal jacket allows the use of an external fluids circu-
lator to control or regulate the temperature of a measured
sample. Prior to the measurement, each slurry sample
was pre-sheared for 3 min at the highest shear rate
(corresponding to the SPEED setting value 8 on the
instrument), and then the measurement started from
this highest shear rate. The shear rate was stepped
down one by one until the torque reading was less than
0.5 mNm, and the measurement was finished. The digital
readings (viscosity, shear rate, shear stress, torque) were
recorded at each shear rate. About 25 ml of slurry sample
was required for each measurement. Each sample was
measured thrice and the mean values of shear stress,
shear rate and viscosity were used for analysis.
0
20
40
60
80
100
1 10 100 1000
Particle size (μm)
Cum
ulat
ive
mas
s fi
ner
(%)
a
b
c
raw 2w 1
raraw 3
Fig. 1. Particle size distributions of three limestone samples.
Table 3
Physical and chemical properties of three chemicals
Physical and chemical
properties
BCX-476 Dispersant
S40
BCX-552
Solid content (wt.%) 45% 45% 30%
Active content (wt.%) 40% 40% 26%
pH 7.5 7.5 7.5
Density at 20 8C 1.30 1.30 1.315
Molecular weightc 2000 5500 85,000
Sodium polyacrylate
content (wt.%)
40% 40% 26%
Water content (wt.%) 55% 55% 70%
Solubility (in water) Very soluble Very soluble Very soluble
M. He et al. / Int. J. Miner. Process. 78 (2006) 63–77 65
2.3. Evaluation procedures
The viscometer (Bohlin Visco 88 BV), which is
widely used for industrials, including coatings, foods
and pharmaceuticals, directly measures the rotational
speed of a rotor (a rotating inner cylinder), V (rpm), and
the shear stress-related torque, M (mNm). Shear rate (c,1/s), shear stress (s, Pa) and apparent viscosity (gp, Pas)are calculated by the following formulas,
s ¼ C1M ð1Þc ¼ C2V ð2Þ
gp ¼sc
ð3Þ
where C1 and C2 are constants related to a measure-
ment system. The viscometer employs a so-called
bviscosoftQ computation program so the digital readings
or measurement parameters such as shear rate, shear
stress, viscosity, torque are directly displayed on the
screen of the viscometer. In this work, the accuracy of
this viscometer was examined by the reproducibility of
the rheological measurements of a limestone slurry
(b100 Am, i.e., raw 1) over a wide range of shear
rate. The results are shown in Table 4. It is evident
that the viscometer exhibits a very good reproducibility
with a rather small standard deviation for all the mea-
surement parameters. The sample standard deviation of
viscosity is less than 0.0013 Pas when the torque is
larger than 0.5 mNm. Even though the measured torque
is less than 0.5 mNm, the sample standard deviation of
viscosity is still less than 0.0018 Pas. Thus, the vis-
cometer accurately gives a resolution of 0.001 Pas at a
torque larger than 0.5 mNm.
Table 4
Reproducibility of the rheological data for 70 wt.% of a limestone slurry (i.e., raw 1) without chemicals
Parameters Time Measurement data
Shear rate (1/s) 1 37.1 91.7 191.7 358.7 660.9 1189
2 37.2 91.3 191.5 358.9 661.7 1191
3 36.7 91 191.2 359 662 1192
4 43.4 96.5 195.8 363.2 663.6 1188
5 43.6 96.5 196.2 364.3 665.3 1192
6 42.3 94.7 194.1 360.9 660.9 1186
7 42.1 95.1 194.7 361.9 662.8 1189
Mean value 40.34 93.83 193.6 360.99 662.46 1189.57
Sample standard deviation 3.18 2.43 2.12 2.25 1.59 2.23
Shear stress (Pa) 1 3.7 5.7 8.1 12 19.5 34.6
2 3.7 5.7 8.5 12.5 19.8 34.8
3 3.7 5.6 8.3 12.2 19.1 34.7
4 4.4 6 8.6 12.7 20.8 36.8
5 4.4 6.2 8.9 13.3 19.9 36.9
6 4.3 6.4 8.9 13.4 21.3 36.3
7 4 5.8 8.3 12.2 19.8 36.3
Mean value 4.03 5.91 8.51 12.61 20.03 35.77
Sample standard deviation 0.34 0.3 0.31 0.55 0.76 1.03
Viscosity (Pas) 1 0.102 0.061 0.042 0.034 0.03 0.03
2 0.101 0.063 0.044 0.035 0.03 0.03
3 0.103 0.063 0.043 0.034 0.029 0.03
4 0.102 0.062 0.044 0.035 0.031 0.031
5 0.102 0.064 0.045 0.037 0.03 0.031
6 0.101 0.066 0.046 0.037 0.032 0.031
7 0.098 0.061 0.043 0.034 0.03 0.03
Mean value 0.1013 0.0629 0.0439 0.0351 0.0303 0.0304
Sample standard deviation 0.0016 0.0018 0.0013 0.0013 0.0009 0.0005
Torque (mNm) 1 0.24 0.36 0.52 0.77 1.22 2.23
2 0.23 0.38 0.54 0.8 1.26 2.2
3 0.24 0.36 0.52 0.77 1.24 2.18
4 0.28 0.38 0.55 0.81 1.32 2.35
5 0.28 0.39 0.56 0.85 1.28 2.3
6 0.27 0.39 0.56 0.84 1.37 2.3
7 0.25 0.36 0.52 0.78 1.26 2.25
Mean value 0.256 0.374 0.539 0.803 1.279 2.259
Sample standard deviation 0.021 0.014 0.019 0.033 0.051 0.061
M. He et al. / Int. J. Miner. Process. 78 (2006) 63–7766
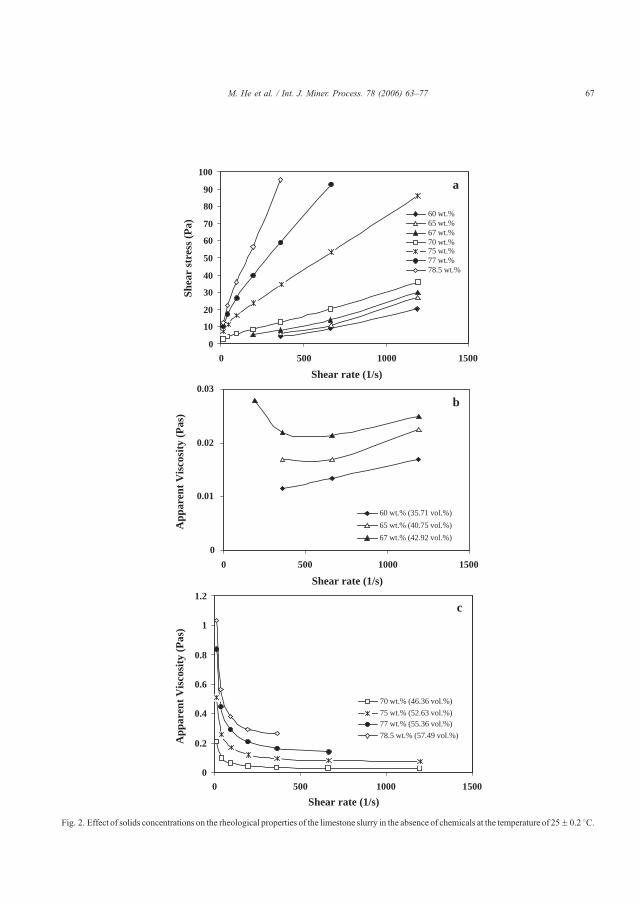
0
10
20
30
40
50
60
70
80
90
100
60 wt.%65 wt.%67 wt.%70 wt.%75 wt.%77 wt.%78.5 wt.%
0
0.01
0.02
0.03
0 500 1000 1500
60 wt.% (35.71 vol.%)
65 wt.% (40.75 vol.%)
67 wt.% (42.92 vol.%)
0
0.2
0.4
0.6
0.8
1
1.2
0 500 1000 1500
70 wt.% (46.36 vol.%)
75 wt.% (52.63 vol.%)77 wt.% (55.36 vol.%)
78.5 wt.% (57.49 vol.%)App
aren
t V
isco
sity
(P
as)
App
aren
t V
isco
sity
(P
as)
b
c
a
Shear rate (1/s)
Shea
r st
ress
(P
a)
Shear rate (1/s)
Shear rate (1/s)
0 500 1000 1500
Fig. 2. Effect of solids concentrations on the rheological properties of the limestone slurry in the absence of chemicals at the temperature of 25F0.2 8C.
M. He et al. / Int. J. Miner. Process. 78 (2006) 63–77 67
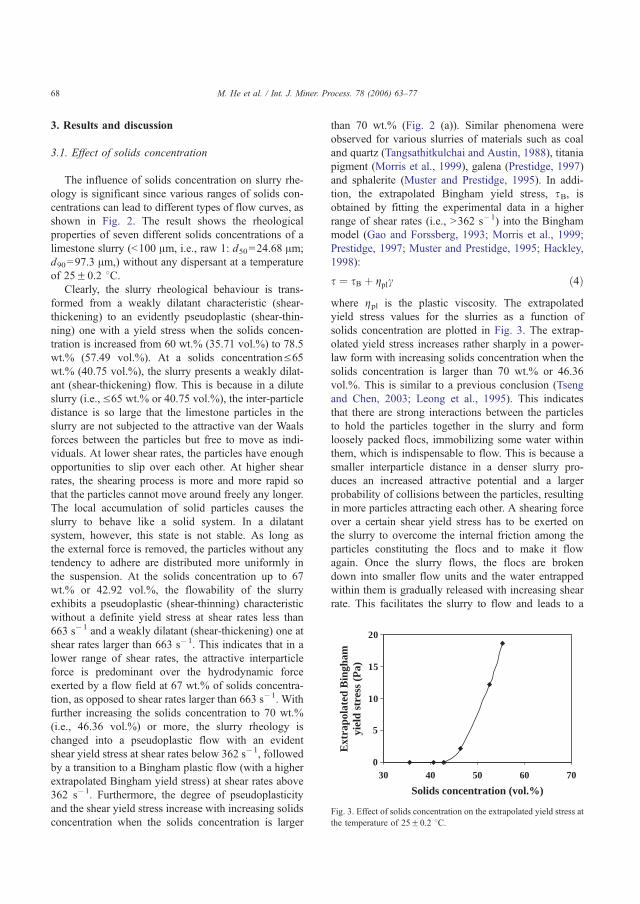
3. Results and discussion
3.1. Effect of solids concentration
The influence of solids concentration on slurry rhe-
ology is significant since various ranges of solids con-
centrations can lead to different types of flow curves, as
shown in Fig. 2. The result shows the rheological
properties of seven different solids concentrations of a
limestone slurry (b100 Am, i.e., raw 1: d50=24.68 Am;
d90=97.3 Am,) without any dispersant at a temperature
of 25F0.2 8C.Clearly, the slurry rheological behaviour is trans-
formed from a weakly dilatant characteristic (shear-
thickening) to an evidently pseudoplastic (shear-thin-
ning) one with a yield stress when the solids concen-
tration is increased from 60 wt.% (35.71 vol.%) to 78.5
wt.% (57.49 vol.%). At a solids concentrationV65wt.% (40.75 vol.%), the slurry presents a weakly dilat-
ant (shear-thickening) flow. This is because in a dilute
slurry (i.e., V65 wt.% or 40.75 vol.%), the inter-particle
distance is so large that the limestone particles in the
slurry are not subjected to the attractive van der Waals
forces between the particles but free to move as indi-
viduals. At lower shear rates, the particles have enough
opportunities to slip over each other. At higher shear
rates, the shearing process is more and more rapid so
that the particles cannot move around freely any longer.
The local accumulation of solid particles causes the
slurry to behave like a solid system. In a dilatant
system, however, this state is not stable. As long as
the external force is removed, the particles without any
tendency to adhere are distributed more uniformly in
the suspension. At the solids concentration up to 67
wt.% or 42.92 vol.%, the flowability of the slurry
exhibits a pseudoplastic (shear-thinning) characteristic
without a definite yield stress at shear rates less than
663 s�1 and a weakly dilatant (shear-thickening) one at
shear rates larger than 663 s�1. This indicates that in a
lower range of shear rates, the attractive interparticle
force is predominant over the hydrodynamic force
exerted by a flow field at 67 wt.% of solids concentra-
tion, as opposed to shear rates larger than 663 s�1. With
further increasing the solids concentration to 70 wt.%
(i.e., 46.36 vol.%) or more, the slurry rheology is
changed into a pseudoplastic flow with an evident
shear yield stress at shear rates below 362 s�1, followed
by a transition to a Bingham plastic flow (with a higher
extrapolated Bingham yield stress) at shear rates above
362 s�1. Furthermore, the degree of pseudoplasticity
and the shear yield stress increase with increasing solids
concentration when the solids concentration is larger
than 70 wt.% (Fig. 2 (a)). Similar phenomena were
observed for various slurries of materials such as coal
and quartz (Tangsathitkulchai and Austin, 1988), titania
pigment (Morris et al., 1999), galena (Prestidge, 1997)
and sphalerite (Muster and Prestidge, 1995). In addi-
tion, the extrapolated Bingham yield stress, sB, is
obtained by fitting the experimental data in a higher
range of shear rates (i.e., N362 s�1) into the Bingham
model (Gao and Forssberg, 1993; Morris et al., 1999;
Prestidge, 1997; Muster and Prestidge, 1995; Hackley,
1998):
s ¼ sB þ gplc ð4Þwhere gpl is the plastic viscosity. The extrapolated
yield stress values for the slurries as a function of
solids concentration are plotted in Fig. 3. The extrap-
olated yield stress increases rather sharply in a power-
law form with increasing solids concentration when the
solids concentration is larger than 70 wt.% or 46.36
vol.%. This is similar to a previous conclusion (Tseng
and Chen, 2003; Leong et al., 1995). This indicates
that there are strong interactions between the particles
to hold the particles together in the slurry and form
loosely packed flocs, immobilizing some water within
them, which is indispensable to flow. This is because a
smaller interparticle distance in a denser slurry pro-
duces an increased attractive potential and a larger
probability of collisions between the particles, resulting
in more particles attracting each other. A shearing force
over a certain shear yield stress has to be exerted on
the slurry to overcome the internal friction among the
particles constituting the flocs and to make it flow
again. Once the slurry flows, the flocs are broken
down into smaller flow units and the water entrapped
within them is gradually released with increasing shear
rate. This facilitates the slurry to flow and leads to a
0
5
10
15
20
30 40 50 60 70
Solids concentration (vol.%)
Ext
rapo
late
d B
ingh
am
yiel
d st
ress
(P
a)
Fig. 3. Effect of solids concentration on the extrapolated yield stress at
the temperature of 25F0.2 8C.
M. He et al. / Int. J. Miner. Process. 78 (2006) 63–7768
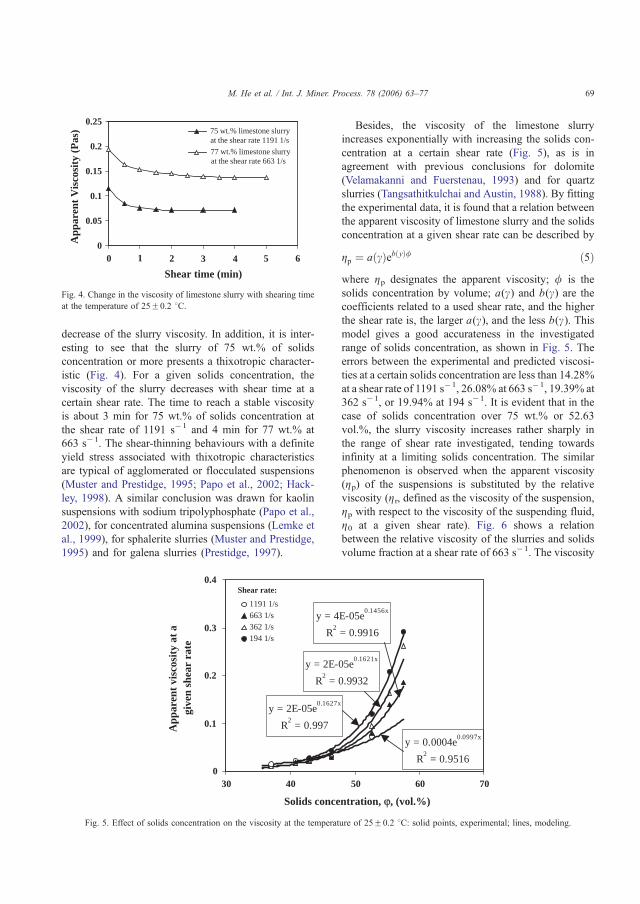
decrease of the slurry viscosity. In addition, it is inter-
esting to see that the slurry of 75 wt.% of solids
concentration or more presents a thixotropic character-
istic (Fig. 4). For a given solids concentration, the
viscosity of the slurry decreases with shear time at a
certain shear rate. The time to reach a stable viscosity
is about 3 min for 75 wt.% of solids concentration at
the shear rate of 1191 s�1 and 4 min for 77 wt.% at
663 s�1. The shear-thinning behaviours with a definite
yield stress associated with thixotropic characteristics
are typical of agglomerated or flocculated suspensions
(Muster and Prestidge, 1995; Papo et al., 2002; Hack-
ley, 1998). A similar conclusion was drawn for kaolin
suspensions with sodium tripolyphosphate (Papo et al.,
2002), for concentrated alumina suspensions (Lemke et
al., 1999), for sphalerite slurries (Muster and Prestidge,
1995) and for galena slurries (Prestidge, 1997).
Besides, the viscosity of the limestone slurry
increases exponentially with increasing the solids con-
centration at a certain shear rate (Fig. 5), as is in
agreement with previous conclusions for dolomite
(Velamakanni and Fuerstenau, 1993) and for quartz
slurries (Tangsathitkulchai and Austin, 1988). By fitting
the experimental data, it is found that a relation between
the apparent viscosity of limestone slurry and the solids
concentration at a given shear rate can be described by
gp ¼ a cð Þeb yð Þ/ ð5Þwhere gp designates the apparent viscosity; / is the
solids concentration by volume; a(c) and b(c) are the
coefficients related to a used shear rate, and the higher
the shear rate is, the larger a(c), and the less b(c). Thismodel gives a good accurateness in the investigated
range of solids concentration, as shown in Fig. 5. The
errors between the experimental and predicted viscosi-
ties at a certain solids concentration are less than 14.28%
at a shear rate of 1191 s�1, 26.08% at 663 s�1, 19.39% at
362 s�1, or 19.94% at 194 s�1. It is evident that in the
case of solids concentration over 75 wt.% or 52.63
vol.%, the slurry viscosity increases rather sharply in
the range of shear rate investigated, tending towards
infinity at a limiting solids concentration. The similar
phenomenon is observed when the apparent viscosity
(gp) of the suspensions is substituted by the relative
viscosity (gr, defined as the viscosity of the suspension,
gp with respect to the viscosity of the suspending fluid,
g0 at a given shear rate). Fig. 6 shows a relation
between the relative viscosity of the slurries and solids
volume fraction at a shear rate of 663 s�1. The viscosity
0
0.05
0.1
0.15
0.2
0.25 75 wt.% limestone slurryat the shear rate 1191 1/s
77 wt.% limestone slurryat the shear rate 663 1/s
Shear time (min)
App
aren
t V
isco
sity
(P
as)
10 32 4 5 6
Fig. 4. Change in the viscosity of limestone slurry with shearing time
at the temperature of 25F0.2 8C.
y = 2E-05e0.1621x
R2 = 0.9932
y = 2E-05e0.1627x
R2 = 0.997
y = 0.0004e0.0997x
R2 = 0.9516
y = 4E-05e0.1456x
R2 = 0.9916
0
0.1
0.2
0.3
0.4
30 40 50 60 70
1191 1/s663 1/s 362 1/s194 1/s
App
aren
t vi
scos
ity
at a
gi
ven
shea
r ra
te
Shear rate:
Solids concentration, ϕ, (vol.%)
Fig. 5. Effect of solids concentration on the viscosity at the temperature of 25F0.2 8C: solid points, experimental; lines, modeling.
M. He et al. / Int. J. Miner. Process. 78 (2006) 63–77 69
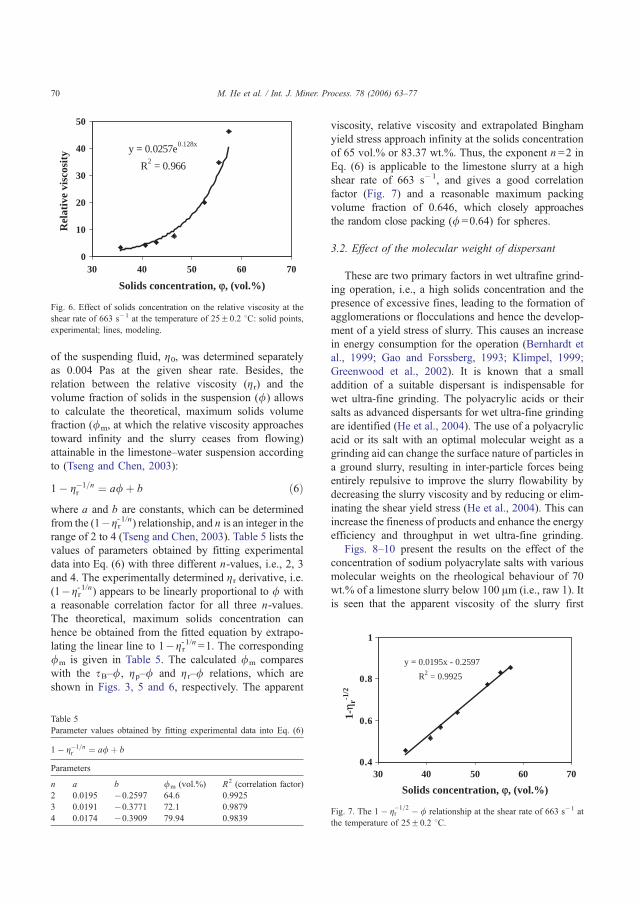
of the suspending fluid, g0, was determined separately
as 0.004 Pas at the given shear rate. Besides, the
relation between the relative viscosity (gr) and the
volume fraction of solids in the suspension (/) allowsto calculate the theoretical, maximum solids volume
fraction (/m, at which the relative viscosity approaches
toward infinity and the slurry ceases from flowing)
attainable in the limestone–water suspension according
to (Tseng and Chen, 2003):
1� g�1=nr ¼ a/þ b ð6Þ
where a and b are constants, which can be determined
from the (1�gr- 1/n) relationship, and n is an integer in the
range of 2 to 4 (Tseng and Chen, 2003). Table 5 lists the
values of parameters obtained by fitting experimental
data into Eq. (6) with three different n-values, i.e., 2, 3
and 4. The experimentally determined gr derivative, i.e.(1�gr
- 1/n) appears to be linearly proportional to / with
a reasonable correlation factor for all three n-values.
The theoretical, maximum solids concentration can
hence be obtained from the fitted equation by extrapo-
lating the linear line to 1�gr- 1/n =1. The corresponding
/m is given in Table 5. The calculated /m compares
with the sB–/, gp–/ and gr–/ relations, which are
shown in Figs. 3, 5 and 6, respectively. The apparent
viscosity, relative viscosity and extrapolated Bingham
yield stress approach infinity at the solids concentration
of 65 vol.% or 83.37 wt.%. Thus, the exponent n =2 in
Eq. (6) is applicable to the limestone slurry at a high
shear rate of 663 s�1, and gives a good correlation
factor (Fig. 7) and a reasonable maximum packing
volume fraction of 0.646, which closely approaches
the random close packing (/ =0.64) for spheres.
3.2. Effect of the molecular weight of dispersant
These are two primary factors in wet ultrafine grind-
ing operation, i.e., a high solids concentration and the
presence of excessive fines, leading to the formation of
agglomerations or flocculations and hence the develop-
ment of a yield stress of slurry. This causes an increase
in energy consumption for the operation (Bernhardt et
al., 1999; Gao and Forssberg, 1993; Klimpel, 1999;
Greenwood et al., 2002). It is known that a small
addition of a suitable dispersant is indispensable for
wet ultra-fine grinding. The polyacrylic acids or their
salts as advanced dispersants for wet ultra-fine grinding
are identified (He et al., 2004). The use of a polyacrylic
acid or its salt with an optimal molecular weight as a
grinding aid can change the surface nature of particles in
a ground slurry, resulting in inter-particle forces being
entirely repulsive to improve the slurry flowability by
decreasing the slurry viscosity and by reducing or elim-
inating the shear yield stress (He et al., 2004). This can
increase the fineness of products and enhance the energy
efficiency and throughput in wet ultra-fine grinding.
Figs. 8–10 present the results on the effect of the
concentration of sodium polyacrylate salts with various
molecular weights on the rheological behaviour of 70
wt.% of a limestone slurry below 100 Am (i.e., raw 1). It
is seen that the apparent viscosity of the slurry first
y = 0.0257e0.128x
R2 = 0.966
0
10
20
30
40
50
30 40 50 60 70
Rel
ativ
e vi
scos
ity
Solids concentration, ϕ, (vol.%)
Fig. 6. Effect of solids concentration on the relative viscosity at the
shear rate of 663 s�1 at the temperature of 25F0.2 8C: solid points,
experimental; lines, modeling.
Table 5
Parameter values obtained by fitting experimental data into Eq. (6)
1� g�1=nr ¼ a/þ b
Parameters
n a b /m (vol.%) R2 (correlation factor)
2 0.0195 �0.2597 64.6 0.9925
3 0.0191 �0.3771 72.1 0.9879
4 0.0174 �0.3909 79.94 0.9839
y = 0.0195x - 0.2597
R2 = 0.9925
0.4
0.6
0.8
1
30 40 50 60 70
1-η r
-1/2
Solids concentration, ϕ, (vol.%)
Fig. 7. The 1� g�1=2r � / relationship at the shear rate of 663 s�1 at
the temperature of 25F0.2 8C.
M. He et al. / Int. J. Miner. Process. 78 (2006) 63–7770

increases, and then decreases, and reverts after reaching a
minimum. Clearly, the slurry with less than 0.01 wt.% of
BCX-476, or Dispersant S40 or BCX-552 shows a pseu-
doplastic characteristics with a yield stress and possesses
a higher apparent viscosity than that without dispersants
at a given shear rate. This reason is that an insufficient
dispersant causes the flocculation of particles in the
slurry by bridging attraction forces, leading to larger
flow units (Zhou et al., 2001; Johnson et al., 2000). At
the addition amount of dispersants up to 0.02 wt.%, the
apparent viscosity of the slurry is lower than that without
dispersants. The slurry exhibits a pseudoplastic property
without a yield stress at shear rates below 663 s�1 and a
weakly dilatant one at shear rates above 663 s�1 for
BCX-476 or BCX-552, and a Newtonian flow with a
viscosity of 0.021 Pas at shear rates less than 663 s�1 and
a weakly dilatant one at shear rates larger than 663 s�1
for Dispersant S40. The gradual increase in the addition
amount of a dispersant leads to a complete transition to a
weakly dilatant flow and a further slight decrease of the
apparent viscosity in the range of shear rates investigat-
ed, and to a minimum at an addition level of 0.1 wt.% for
BCX-476 or Dispersant S40 (Figs. 8 (c) and 9 (c)), or
0.04 wt.% for BCX-552 (Fig. 10 (c)). In these cases, the
saturation adsorption of the dispersants on the particle
surface has been attained, and electrostatic and steric
0
5
10
15
20
25
30
35
400 0.004 wt.%0.01 wt.% 0.02 wt.%0.04 wt.% 0.1 wt.%0.2 wt.% 0.4 wt.%0.6 wt.% 0.8 wt.%
0
0.05
0.1
0.15
0.2
0.25
00.004 wt.%0.01 wt.%0.02 wt.%
0
0.01
0.02
0.03
0.04
0 500 1000 1500
0.02 wt.% 0.04 wt.%0.1 wt.% 0.2 wt.%0.4 wt.% 0.6 wt.%0.8 wt.%
Shear rate (1/s)
App
aren
t vi
scos
ity
(Pa.
s) b
c
Shea
r st
ress
(P
a)
a
0 500 1000 1500
Shear rate (1/s)
0 500 1000 1500
Shear rate (1/s)
App
aren
t vi
scos
ity
(Pa.
s)
Fig. 8. Flowability of 70 wt.% of solids concentration with various
dosages of BCX-476 at the temperature of 25F0.2 8C.
0
5
10
15
20
25
30
35
40
450 0.004 wt.%0.01 wt.% 0.02 wt.%0.04 wt.% 0.1 wt.%0.2 wt.% 0.4 wt.%0.6 wt.% 0.8 wt.%
0
0.05
0.1
0.15
0.2
0.25
0 500 1000 1500
00.004 wt.%0.01 wt.%0.02 wt.%
0
0.005
0.01
0.015
0.02
0.025
0.03
0.02 wt.%
0.04 wt.%0.1 wt.%
0.2 wt.%
0.4 wt.%
0.6 wt.%
0.8 wt.%
Shear rate (1/s)
App
aren
t vi
scos
ity
(Pa.
s) b
c
a
Shea
r st
ress
(P
a)
0 500 1000 1500
Shear rate (1/s)
0 500 1000 1500
Shear rate (1/s)
App
aren
t vi
scos
ity
(Pa.
s)
Fig. 9. Flowability of 70 wt.% of solids concentration with various
dosages of Dispersant S40 at the temperature of 25F0.2 8C.
M. He et al. / Int. J. Miner. Process. 78 (2006) 63–77 71
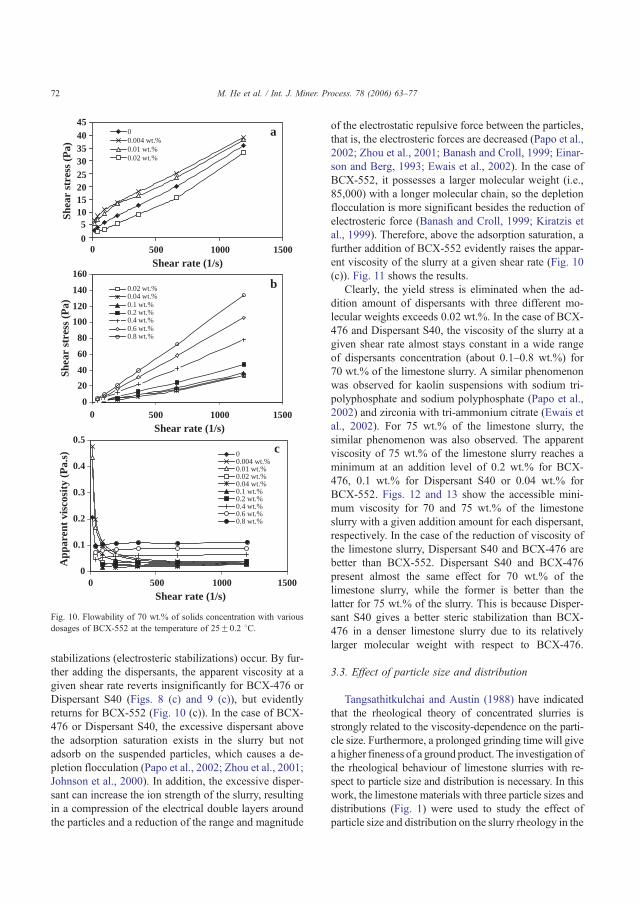
stabilizations (electrosteric stabilizations) occur. By fur-
ther adding the dispersants, the apparent viscosity at a
given shear rate reverts insignificantly for BCX-476 or
Dispersant S40 (Figs. 8 (c) and 9 (c)), but evidently
returns for BCX-552 (Fig. 10 (c)). In the case of BCX-
476 or Dispersant S40, the excessive dispersant above
the adsorption saturation exists in the slurry but not
adsorb on the suspended particles, which causes a de-
pletion flocculation (Papo et al., 2002; Zhou et al., 2001;
Johnson et al., 2000). In addition, the excessive disper-
sant can increase the ion strength of the slurry, resulting
in a compression of the electrical double layers around
the particles and a reduction of the range and magnitude
of the electrostatic repulsive force between the particles,
that is, the electrosteric forces are decreased (Papo et al.,
2002; Zhou et al., 2001; Banash and Croll, 1999; Einar-
son and Berg, 1993; Ewais et al., 2002). In the case of
BCX-552, it possesses a larger molecular weight (i.e.,
85,000) with a longer molecular chain, so the depletion
flocculation is more significant besides the reduction of
electrosteric force (Banash and Croll, 1999; Kiratzis et
al., 1999). Therefore, above the adsorption saturation, a
further addition of BCX-552 evidently raises the appar-
ent viscosity of the slurry at a given shear rate (Fig. 10
(c)). Fig. 11 shows the results.
Clearly, the yield stress is eliminated when the ad-
dition amount of dispersants with three different mo-
lecular weights exceeds 0.02 wt.%. In the case of BCX-
476 and Dispersant S40, the viscosity of the slurry at a
given shear rate almost stays constant in a wide range
of dispersants concentration (about 0.1–0.8 wt.%) for
70 wt.% of the limestone slurry. A similar phenomenon
was observed for kaolin suspensions with sodium tri-
polyphosphate and sodium polyphosphate (Papo et al.,
2002) and zirconia with tri-ammonium citrate (Ewais et
al., 2002). For 75 wt.% of the limestone slurry, the
similar phenomenon was also observed. The apparent
viscosity of 75 wt.% of the limestone slurry reaches a
minimum at an addition level of 0.2 wt.% for BCX-
476, 0.1 wt.% for Dispersant S40 or 0.04 wt.% for
BCX-552. Figs. 12 and 13 show the accessible mini-
mum viscosity for 70 and 75 wt.% of the limestone
slurry with a given addition amount for each dispersant,
respectively. In the case of the reduction of viscosity of
the limestone slurry, Dispersant S40 and BCX-476 are
better than BCX-552. Dispersant S40 and BCX-476
present almost the same effect for 70 wt.% of the
limestone slurry, while the former is better than the
latter for 75 wt.% of the slurry. This is because Disper-
sant S40 gives a better steric stabilization than BCX-
476 in a denser limestone slurry due to its relatively
larger molecular weight with respect to BCX-476.
3.3. Effect of particle size and distribution
Tangsathitkulchai and Austin (1988) have indicated
that the rheological theory of concentrated slurries is
strongly related to the viscosity-dependence on the parti-
cle size. Furthermore, a prolonged grinding time will give
a higher fineness of a ground product. The investigation of
the rheological behaviour of limestone slurries with re-
spect to particle size and distribution is necessary. In this
work, the limestone materials with three particle sizes and
distributions (Fig. 1) were used to study the effect of
particle size and distribution on the slurry rheology in the
00.004 wt.%0.01 wt.%0.02 wt.%
0
20
40
60
80
100
120
140
160
0.02 wt.%0.04 wt.%0.1 wt.%0.2 wt.%0.4 wt.%0.6 wt.%0.8 wt.%
0
0.1
0.2
0.3
0.4
0.5
0 500 1000 1500
00.004 wt.%0.01 wt.%0.02 wt.%0.04 wt.%0.1 wt.%0.2 wt.%0.4 wt.%0.6 wt.%0.8 wt.%
Shear rate (1/s)
App
aren
t vi
scos
ity
(Pa.
s)
a
b
c
Shea
r st
ress
(P
a)
0
51015202530354045
Shea
r st
ress
(P
a)
0 500 1000 1500Shear rate (1/s)
0 500 1000 1500Shear rate (1/s)
Fig. 10. Flowability of 70 wt.% of solids concentration with various
dosages of BCX-552 at the temperature of 25F0.2 8C.
M. He et al. / Int. J. Miner. Process. 78 (2006) 63–7772

absence of any dispersant. It was found that the particle
size distributions of these materials could be fitted by the
Rosin–Rammler equation over the size range:
P xð Þ ¼ 1� exp � x
k
�m� ihð7Þ
where P(x) is the cumulative fraction less than a sieve
size x, k is the fineness modulus (i.e., the 63.21%-
passing size) and m is the distribution modulus. Table
6 lists the results obtained by fitting, which present a
good correlation.
Figs. 14 and 15 show the rheological properties of
the limestone slurries with three different particle size
distributions for 70 wt.% of solids concentration at a
temperature of 25F0.2 8C.The slurries exhibit a pesudoplastic flow with an
evident shear yield stress in a lower range of shear
0123456789
0 0.01 0.02 0.03 0.04 0.05
BCX-476: 2000
Dispersant S40: 5500
BCX-552: 85000
0
0.02
0.04
0.06
0.08
0.1
0.12
0 0.2 0.4 0.6 0.8 1
BCX-476: 2000
Dispersant S40: 5500
BCX-552: 85000
Addition amount of dispersants with various molecular weights (wt.%)
Ext
rapo
late
d B
ingh
am
yiel
d st
ress
(P
a)
Addition amount of dispersants with various molecular weights (wt.%)
App
aren
t vi
scos
ity
at t
he
shea
r ra
te o
f 66
3 s-1
(P
a.s)
a
b
Fig. 11. Change in rheological behaviours of 70 wt.% of solids concentration with the addition amount of dispersants with different molecular
weights at the temperature of 25F0.2 8C: (a) extrapolated Bingham yield stress; (b) apparent viscosity at the shear rate of 663 s�1.
0
0.01
0.02
0.03
0 500 1000 1500
BCX-476 : 0.1 wt.%
Dispersant S40 : 0.1 wt.%
BCX-552 : 0.04 wt.%
Shear rate (1/s)
Ap
pa
ren
t v
isco
sity
(P
a.s
)
Fig. 12. Accessible minimum viscosity for 70 wt.% of solids concen-
tration in the presence of three chemicals with a certain addition
amount at the temperature of 25F0.2 8C.
0
0.01
0.02
0.03
0.04
0.05
0.06
0 500 1000 1500
BCX-476 : 0.2 wt.%Dispersant S40 : 0.1 wt.%BCX-552 : 0.04 wt.%
Shear rate (1/s)
App
aren
t vi
scos
ity
(Pa.
s)
Fig. 13. Accessible minimum viscosity for 75 wt.% of solids concen-
tration in the presence of three chemicals with a certain addition
amount at the temperature of 25F0.2 8C.
M. He et al. / Int. J. Miner. Process. 78 (2006) 63–77 73
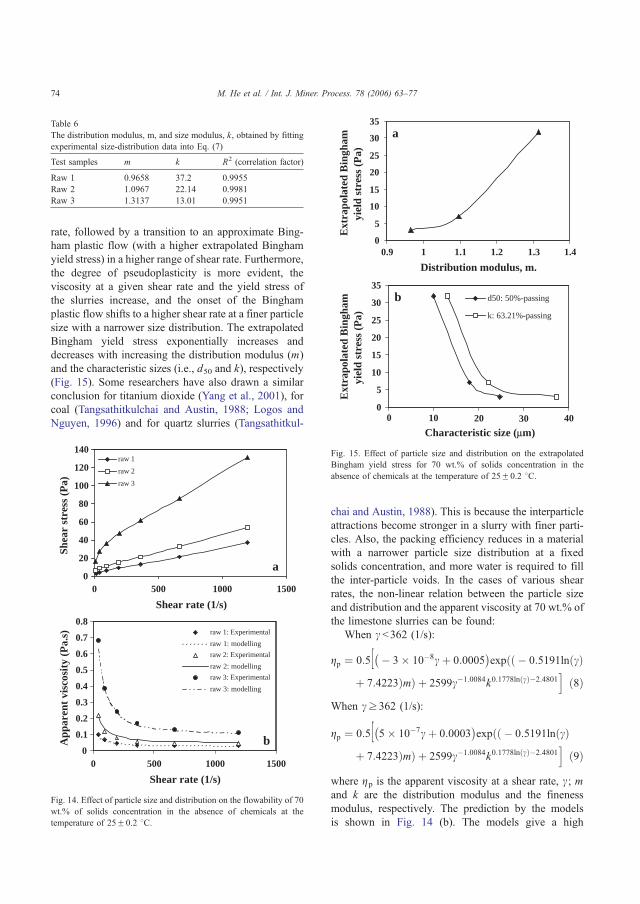
rate, followed by a transition to an approximate Bing-
ham plastic flow (with a higher extrapolated Bingham
yield stress) in a higher range of shear rate. Furthermore,
the degree of pseudoplasticity is more evident, the
viscosity at a given shear rate and the yield stress of
the slurries increase, and the onset of the Bingham
plastic flow shifts to a higher shear rate at a finer particle
size with a narrower size distribution. The extrapolated
Bingham yield stress exponentially increases and
decreases with increasing the distribution modulus (m)
and the characteristic sizes (i.e., d50 and k), respectively
(Fig. 15). Some researchers have also drawn a similar
conclusion for titanium dioxide (Yang et al., 2001), for
coal (Tangsathitkulchai and Austin, 1988; Logos and
Nguyen, 1996) and for quartz slurries (Tangsathitkul-
chai and Austin, 1988). This is because the interparticle
attractions become stronger in a slurry with finer parti-
cles. Also, the packing efficiency reduces in a material
with a narrower particle size distribution at a fixed
solids concentration, and more water is required to fill
the inter-particle voids. In the cases of various shear
rates, the non-linear relation between the particle size
and distribution and the apparent viscosity at 70 wt.% of
the limestone slurries can be found:
When c b362 (1/s):
gp ¼ 0:5½ � 3� 10�8cþ 0:0005� �
exp � 0:5191ln cð Þððþ 7:4223ÞmÞ þ 2599c�1:0084k0:1778ln cð Þ�2:4801
ið8Þ
When cz362 (1/s):
gp ¼ 0:5½ 5� 10�7cþ 0:0003� �
exp � 0:5191ln cð Þððþ 7:4223ÞmÞ þ 2599c�1:0084k0:1778ln cð Þ�2:4801
ið9Þ
where gp is the apparent viscosity at a shear rate, c; mand k are the distribution modulus and the fineness
modulus, respectively. The prediction by the models
is shown in Fig. 14 (b). The models give a high
Table 6
The distribution modulus, m, and size modulus, k, obtained by fitting
experimental size-distribution data into Eq. (7)
Test samples m k R2 (correlation factor)
Raw 1 0.9658 37.2 0.9955
Raw 2 1.0967 22.14 0.9981
Raw 3 1.3137 13.01 0.9951
0
20
40
60
80
100
120
140raw 1
raw 2
raw 3
0
0.1
0.2
0.3
0.4
0.5
0.6
0.7
0.8raw 1: Experimental
raw 1: modelling
raw 2: Experimental
raw 2: modelling
raw 3: Experimental
raw 3: modelling
App
aren
t vi
scos
ity
(Pa.
s)
a
b
Shea
r st
ress
(P
a)
0 500 1000 1500
Shear rate (1/s)
0 500 1000 1500
Shear rate (1/s)
Fig. 14. Effect of particle size and distribution on the flowability of 70
wt.% of solids concentration in the absence of chemicals at the
temperature of 25F0.2 8C.
0
5
10
15
20
25
30
35
0.9 1 1.1 1.2 1.3 1.4
0
5
10
15
20
25
30
35
0
d50: 50%-passing
k: 63.21%-passing
Ext
rapo
late
d B
ingh
am
yiel
d st
ress
(P
a)
Ext
rapo
late
d B
ingh
amyi
eld
stre
ss (
Pa)
Characteristic size (μm)
Distribution modulus, m.
a
b
10 20 30 40
Fig. 15. Effect of particle size and distribution on the extrapolated
Bingham yield stress for 70 wt.% of solids concentration in the
absence of chemicals at the temperature of 25F0.2 8C.
M. He et al. / Int. J. Miner. Process. 78 (2006) 63–7774
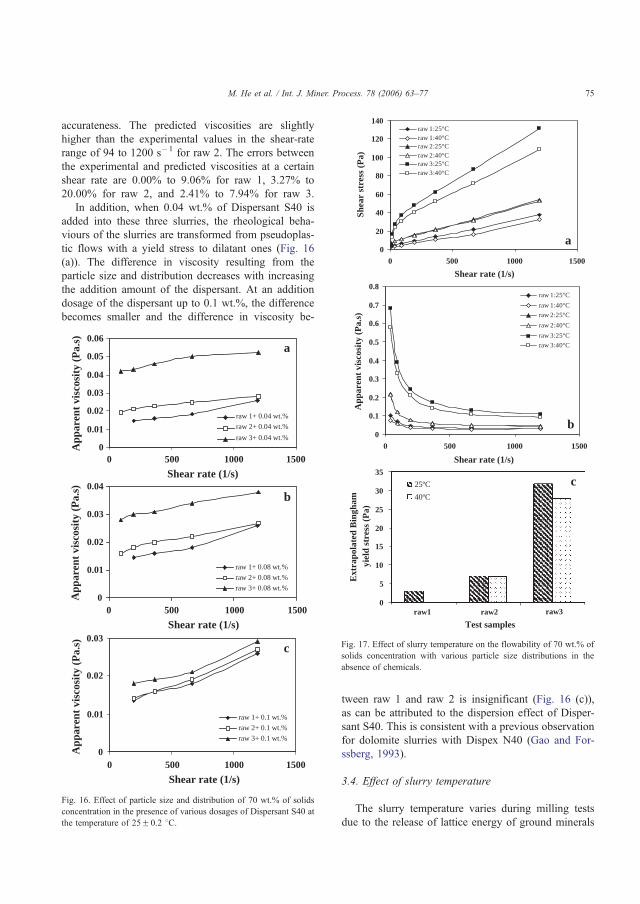
accurateness. The predicted viscosities are slightly
higher than the experimental values in the shear-rate
range of 94 to 1200 s�1 for raw 2. The errors between
the experimental and predicted viscosities at a certain
shear rate are 0.00% to 9.06% for raw 1, 3.27% to
20.00% for raw 2, and 2.41% to 7.94% for raw 3.
In addition, when 0.04 wt.% of Dispersant S40 is
added into these three slurries, the rheological beha-
viours of the slurries are transformed from pseudoplas-
tic flows with a yield stress to dilatant ones (Fig. 16
(a)). The difference in viscosity resulting from the
particle size and distribution decreases with increasing
the addition amount of the dispersant. At an addition
dosage of the dispersant up to 0.1 wt.%, the difference
becomes smaller and the difference in viscosity be-
tween raw 1 and raw 2 is insignificant (Fig. 16 (c)),
as can be attributed to the dispersion effect of Disper-
sant S40. This is consistent with a previous observation
for dolomite slurries with Dispex N40 (Gao and For-
ssberg, 1993).
3.4. Effect of slurry temperature
The slurry temperature varies during milling tests
due to the release of lattice energy of ground minerals
0
0.01
0.02
0.03
0.04
0.05
0.06
raw 1+ 0.04 wt.%
raw 2+ 0.04 wt.%
raw 3+ 0.04 wt.%
0
0.01
0.02
0.03
0.04
raw 1+ 0.08 wt.%
raw 2+ 0.08 wt.%
raw 3+ 0.08 wt.%
raw 1+ 0.1 wt.%
raw 2+ 0.1 wt.%
raw 3+ 0.1 wt.%
App
aren
t vi
scos
ity
(Pa.
s)
a
b
c
App
aren
t vi
scos
ity
(Pa.
s)
0.03
0.02
0.01
0
0 500 1000 1500
Shear rate (1/s)
0 500 1000 1500
Shear rate (1/s)
App
aren
t vi
scos
ity
(Pa.
s)
0 500 1000 1500
Shear rate (1/s)
Fig. 16. Effect of particle size and distribution of 70 wt.% of solids
concentration in the presence of various dosages of Dispersant S40 at
the temperature of 25F0.2 8C.
0
20
40
60
80
100
120
140
0 500 1000 1500
raw 1:25ºC raw 1:40ºC raw 2:25ºC raw 2:40ºC raw 3:25ºC raw 3:40ºC
0
0.1
0.2
0.3
0.4
0.5
0.6
0.7
0.8
0 500 1000 1500
raw 1:25ºC
raw 1:40ºC
raw 2:25ºC
raw 2:40ºC
raw 3:25ºC
raw 3:40ºC
0
5
10
15
20
25
30
35
25ºC
40ºC
App
aren
t vi
scos
ity
(Pa.
s)
Shear rate (1/s)
Shea
r st
ress
(P
a)
a
b
Ext
rapo
late
d B
ingh
am
yiel
d st
ress
(P
a)
Test samples
c
Shear rate (1/s)
raw1 raw2 raw3
Fig. 17. Effect of slurry temperature on the flowability of 70 wt.% of
solids concentration with various particle size distributions in the
absence of chemicals.
M. He et al. / Int. J. Miner. Process. 78 (2006) 63–77 75
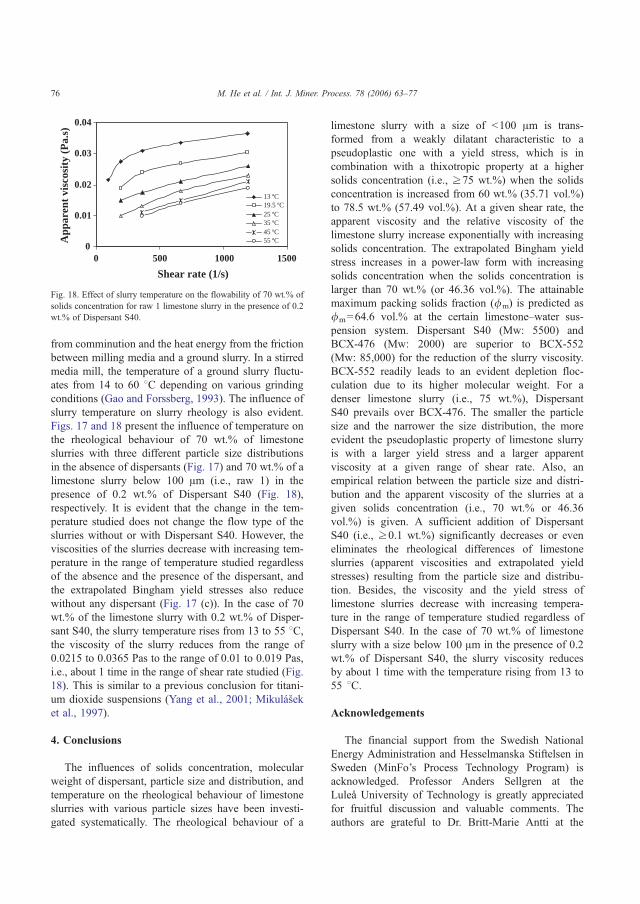
from comminution and the heat energy from the friction
between milling media and a ground slurry. In a stirred
media mill, the temperature of a ground slurry fluctu-
ates from 14 to 60 8C depending on various grinding
conditions (Gao and Forssberg, 1993). The influence of
slurry temperature on slurry rheology is also evident.
Figs. 17 and 18 present the influence of temperature on
the rheological behaviour of 70 wt.% of limestone
slurries with three different particle size distributions
in the absence of dispersants (Fig. 17) and 70 wt.% of a
limestone slurry below 100 Am (i.e., raw 1) in the
presence of 0.2 wt.% of Dispersant S40 (Fig. 18),
respectively. It is evident that the change in the tem-
perature studied does not change the flow type of the
slurries without or with Dispersant S40. However, the
viscosities of the slurries decrease with increasing tem-
perature in the range of temperature studied regardless
of the absence and the presence of the dispersant, and
the extrapolated Bingham yield stresses also reduce
without any dispersant (Fig. 17 (c)). In the case of 70
wt.% of the limestone slurry with 0.2 wt.% of Disper-
sant S40, the slurry temperature rises from 13 to 55 8C,the viscosity of the slurry reduces from the range of
0.0215 to 0.0365 Pas to the range of 0.01 to 0.019 Pas,
i.e., about 1 time in the range of shear rate studied (Fig.
18). This is similar to a previous conclusion for titani-
um dioxide suspensions (Yang et al., 2001; Mikulasek
et al., 1997).
4. Conclusions
The influences of solids concentration, molecular
weight of dispersant, particle size and distribution, and
temperature on the rheological behaviour of limestone
slurries with various particle sizes have been investi-
gated systematically. The rheological behaviour of a
limestone slurry with a size of b100 Am is trans-
formed from a weakly dilatant characteristic to a
pseudoplastic one with a yield stress, which is in
combination with a thixotropic property at a higher
solids concentration (i.e., z75 wt.%) when the solids
concentration is increased from 60 wt.% (35.71 vol.%)
to 78.5 wt.% (57.49 vol.%). At a given shear rate, the
apparent viscosity and the relative viscosity of the
limestone slurry increase exponentially with increasing
solids concentration. The extrapolated Bingham yield
stress increases in a power-law form with increasing
solids concentration when the solids concentration is
larger than 70 wt.% (or 46.36 vol.%). The attainable
maximum packing solids fraction (/m) is predicted as
/m=64.6 vol.% at the certain limestone–water sus-
pension system. Dispersant S40 (Mw: 5500) and
BCX-476 (Mw: 2000) are superior to BCX-552
(Mw: 85,000) for the reduction of the slurry viscosity.
BCX-552 readily leads to an evident depletion floc-
culation due to its higher molecular weight. For a
denser limestone slurry (i.e., 75 wt.%), Dispersant
S40 prevails over BCX-476. The smaller the particle
size and the narrower the size distribution, the more
evident the pseudoplastic property of limestone slurry
is with a larger yield stress and a larger apparent
viscosity at a given range of shear rate. Also, an
empirical relation between the particle size and distri-
bution and the apparent viscosity of the slurries at a
given solids concentration (i.e., 70 wt.% or 46.36
vol.%) is given. A sufficient addition of Dispersant
S40 (i.e., z0.1 wt.%) significantly decreases or even
eliminates the rheological differences of limestone
slurries (apparent viscosities and extrapolated yield
stresses) resulting from the particle size and distribu-
tion. Besides, the viscosity and the yield stress of
limestone slurries decrease with increasing tempera-
ture in the range of temperature studied regardless of
Dispersant S40. In the case of 70 wt.% of limestone
slurry with a size below 100 Am in the presence of 0.2
wt.% of Dispersant S40, the slurry viscosity reduces
by about 1 time with the temperature rising from 13 to
55 8C.
Acknowledgements
The financial support from the Swedish National
Energy Administration and Hesselmanska Stiftelsen in
Sweden (MinFo’s Process Technology Program) is
acknowledged. Professor Anders Sellgren at the
Lulea University of Technology is greatly appreciated
for fruitful discussion and valuable comments. The
authors are grateful to Dr. Britt-Marie Antti at the
0
0.01
0.02
0.03
0.04
13 ºC19.5 ºC25 ºC35 ºC45 ºC55 ºCA
ppar
ent
visc
osit
y (P
a.s)
0 500 1000 1500
Shear rate (1/s)
Fig. 18. Effect of slurry temperature on the flowability of 70 wt.% of
solids concentration for raw 1 limestone slurry in the presence of 0.2
wt.% of Dispersant S40.
M. He et al. / Int. J. Miner. Process. 78 (2006) 63–7776
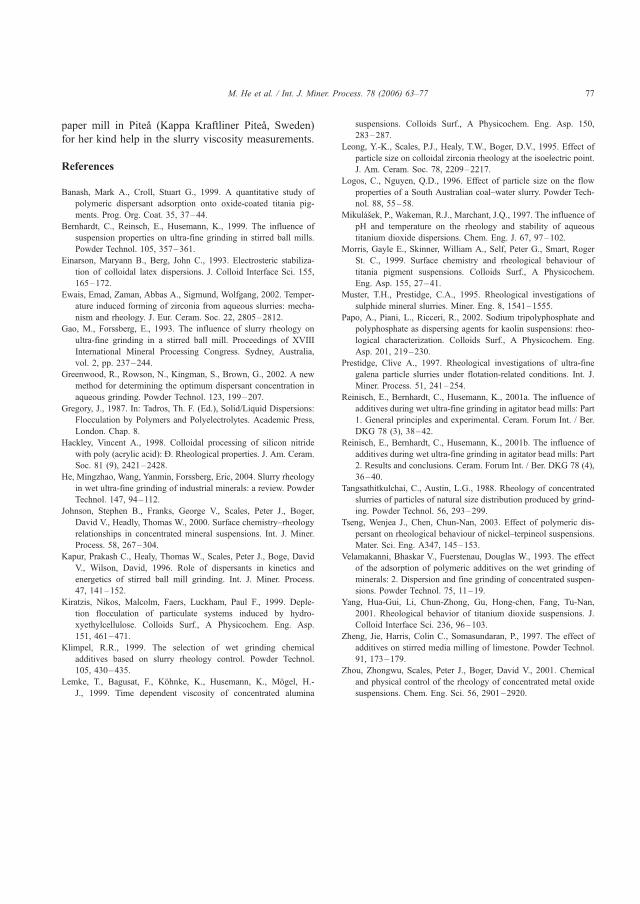
paper mill in Pitea (Kappa Kraftliner Pitea, Sweden)
for her kind help in the slurry viscosity measurements.
References
Banash, Mark A., Croll, Stuart G., 1999. A quantitative study of
polymeric dispersant adsorption onto oxide-coated titania pig-
ments. Prog. Org. Coat. 35, 37–44.
Bernhardt, C., Reinsch, E., Husemann, K., 1999. The influence of
suspension properties on ultra-fine grinding in stirred ball mills.
Powder Technol. 105, 357–361.
Einarson, Maryann B., Berg, John C., 1993. Electrosteric stabiliza-
tion of colloidal latex dispersions. J. Colloid Interface Sci. 155,
165–172.
Ewais, Emad, Zaman, Abbas A., Sigmund, Wolfgang, 2002. Temper-
ature induced forming of zirconia from aqueous slurries: mecha-
nism and rheology. J. Eur. Ceram. Soc. 22, 2805–2812.
Gao, M., Forssberg, E., 1993. The influence of slurry rheology on
ultra-fine grinding in a stirred ball mill. Proceedings of XVIII
International Mineral Processing Congress. Sydney, Australia,
vol. 2, pp. 237–244.
Greenwood, R., Rowson, N., Kingman, S., Brown, G., 2002. A new
method for determining the optimum dispersant concentration in
aqueous grinding. Powder Technol. 123, 199–207.
Gregory, J., 1987. In: Tadros, Th. F. (Ed.), Solid/Liquid Dispersions:
Flocculation by Polymers and Polyelectrolytes. Academic Press,
London. Chap. 8.
Hackley, Vincent A., 1998. Colloidal processing of silicon nitride
with poly (acrylic acid): C. Rheological properties. J. Am. Ceram.
Soc. 81 (9), 2421–2428.
He, Mingzhao, Wang, Yanmin, Forssberg, Eric, 2004. Slurry rheology
in wet ultra-fine grinding of industrial minerals: a review. Powder
Technol. 147, 94–112.
Johnson, Stephen B., Franks, George V., Scales, Peter J., Boger,
David V., Headly, Thomas W., 2000. Surface chemistry–rheology
relationships in concentrated mineral suspensions. Int. J. Miner.
Process. 58, 267–304.
Kapur, Prakash C., Healy, Thomas W., Scales, Peter J., Boge, David
V., Wilson, David, 1996. Role of dispersants in kinetics and
energetics of stirred ball mill grinding. Int. J. Miner. Process.
47, 141–152.
Kiratzis, Nikos, Malcolm, Faers, Luckham, Paul F., 1999. Deple-
tion flocculation of particulate systems induced by hydro-
xyethylcellulose. Colloids Surf., A Physicochem. Eng. Asp.
151, 461–471.
Klimpel, R.R., 1999. The selection of wet grinding chemical
additives based on slurry rheology control. Powder Technol.
105, 430–435.
Lemke, T., Bagusat, F., Kohnke, K., Husemann, K., Mogel, H.-
J., 1999. Time dependent viscosity of concentrated alumina
suspensions. Colloids Surf., A Physicochem. Eng. Asp. 150,
283–287.
Leong, Y.-K., Scales, P.J., Healy, T.W., Boger, D.V., 1995. Effect of
particle size on colloidal zirconia rheology at the isoelectric point.
J. Am. Ceram. Soc. 78, 2209–2217.
Logos, C., Nguyen, Q.D., 1996. Effect of particle size on the flow
properties of a South Australian coal–water slurry. Powder Tech-
nol. 88, 55–58.
Mikulasek, P., Wakeman, R.J., Marchant, J.Q., 1997. The influence of
pH and temperature on the rheology and stability of aqueous
titanium dioxide dispersions. Chem. Eng. J. 67, 97–102.
Morris, Gayle E., Skinner, William A., Self, Peter G., Smart, Roger
St. C., 1999. Surface chemistry and rheological behaviour of
titania pigment suspensions. Colloids Surf., A Physicochem.
Eng. Asp. 155, 27–41.
Muster, T.H., Prestidge, C.A., 1995. Rheological investigations of
sulphide mineral slurries. Miner. Eng. 8, 1541–1555.
Papo, A., Piani, L., Ricceri, R., 2002. Sodium tripolyphosphate and
polyphosphate as dispersing agents for kaolin suspensions: rheo-
logical characterization. Colloids Surf., A Physicochem. Eng.
Asp. 201, 219–230.
Prestidge, Clive A., 1997. Rheological investigations of ultra-fine
galena particle slurries under flotation-related conditions. Int. J.
Miner. Process. 51, 241–254.
Reinisch, E., Bernhardt, C., Husemann, K., 2001a. The influence of
additives during wet ultra-fine grinding in agitator bead mills: Part
1. General principles and experimental. Ceram. Forum Int. / Ber.
DKG 78 (3), 38–42.
Reinisch, E., Bernhardt, C., Husemann, K., 2001b. The influence of
additives during wet ultra-fine grinding in agitator bead mills: Part
2. Results and conclusions. Ceram. Forum Int. / Ber. DKG 78 (4),
36–40.
Tangsathitkulchai, C., Austin, L.G., 1988. Rheology of concentrated
slurries of particles of natural size distribution produced by grind-
ing. Powder Technol. 56, 293–299.
Tseng, Wenjea J., Chen, Chun-Nan, 2003. Effect of polymeric dis-
persant on rheological behaviour of nickel–terpineol suspensions.
Mater. Sci. Eng. A347, 145–153.
Velamakanni, Bhaskar V., Fuerstenau, Douglas W., 1993. The effect
of the adsorption of polymeric additives on the wet grinding of
minerals: 2. Dispersion and fine grinding of concentrated suspen-
sions. Powder Technol. 75, 11–19.
Yang, Hua-Gui, Li, Chun-Zhong, Gu, Hong-chen, Fang, Tu-Nan,
2001. Rheological behavior of titanium dioxide suspensions. J.
Colloid Interface Sci. 236, 96–103.
Zheng, Jie, Harris, Colin C., Somasundaran, P., 1997. The effect of
additives on stirred media milling of limestone. Powder Technol.
91, 173–179.
Zhou, Zhongwu, Scales, Peter J., Boger, David V., 2001. Chemical
and physical control of the rheology of concentrated metal oxide
suspensions. Chem. Eng. Sci. 56, 2901–2920.
M. He et al. / Int. J. Miner. Process. 78 (2006) 63–77 77


Paper 3
Parameter effects on wet ultrafine grinding of limestone
through slurry rheology in a stirred media mill
Powder Technology, 161 (2006) 10-21
Reprinted from Powder Technology with permission from Elsevier (copyright 2006).

Parameter effects on wet ultrafine grinding of limestone through slurry
rheology in a stirred media mill
Mingzhao He a,*, Yanmin Wang a,b, Eric Forssberg a
a Department of Chemical Engineering and Geosciences, Lulea University of Technology, SE-971 87, Lulea, Swedenb Institute of Material Science and Engineering, South China University of Technology, Guangzhou, 510640, China
Received 4 November 2004; received in revised form 9 June 2005; accepted 15 August 2005
Available online 25 October 2005
Abstract
Wet ultra-fine grinding of a limestone powder (<100 Am) has been investigated in a stirred media mill with respect to the effect of slurry
rheology. The grinding results obtained by various parameters (i.e., molecular weight of a dispersant, solids concentration, additive dosage,
addition method and beads load) are evaluated in terms of energy efficiency and the fineness of a product. A polymeric dispersant called
Dispersant S40 with a molecular weight of 5500 gives the best grinding results. For a certain level of beads load, an optimal solids concentration
exists. In the case of the additive dosage of Dispersant S40 at 0.1 wt.% or more, a smaller additive amount of Dispersant S40 gives a higher energy
efficiency and a smaller median size at a lower level of specific energy input. However, the excessive amount of the dispersant could cause a
cushion layer formed on milling beads and thus lowers stress intensities from the collisions of milling beads, leading to an inefficient milling
operation. This can be avoided by either the multi-point addition of the dispersant or a higher beads load (�83 vol.%). In addition, it was found
that the higher the beads load, the better the cumulative energy efficiency, and the smaller the product size at the same specific energy
consumption. For a given solids concentration, the relationships between the specific surface area and the particle size of an FP product and the
additive amount of Dispersant S40 are explored, respectively. Furthermore, an empirical particle size-energy model provides a good fit
(R2>0.991) to the grinding results under the experimental conditions investigated.
D 2005 Elsevier B.V. All rights reserved.
Keywords: Wet ultra-fine grinding; Stirred media mills; Slurry rheology; Limestone; Dispersants; Ultra-fine particles
1. Introduction
Due to some advanced properties of ultra-fine powders
such as surface chemistry, packing characteristics, strength,
optical properties and reaction kinetics and an increasing
demand for ultra-fine powders for industries, wet ultra-fine
grinding has found increased use in many fields such as
minerals [1,2], ceramic materials [3,4], pigments [5], chemical
products [6,7], microorganisms [8], pharmaceutics [9,10],
papermaking [11].
Ultrafine ground limestone powder is widely used in paints,
pigments, food, plastics and pharmaceuticals industries as
fillers [5,11,12]. For instance, this powder is employed as
fillers in plastics to improve heat resistance, hardness, colour
fastness and stability of materials. It is also utilised in
papermaking as coatings and fillers to produce highly bright
paper with a good resistance to yellowing and ageing and to
provide large opacity, printability, ink receptivity and smooth-
ness to paper [12].
Most of the mills used in wet ultra-fine grinding are stirred
media mills due to their high unit outputs and high-energy
efficiencies [13–16]. The stirred media mills are equipped
with a stationary grinding chamber and a high-speed stirrer
(disks or pins) fixed on a drive shaft. The grinding chamber is
filled with small grinding media (normally spherical annealed
glass, steel, or ceramic beads) at a high beads load. By
stirring a slurry-bead mixture at a high stirring speed, a
characteristic flow pattern and a grinding action are generated
in the chamber. The respective kind of flow determines the
spatial distribution of zones with high grinding intensities and
the predominant types of grinding mechanisms as well as
their composition [16,17]. Thus, the predominant grinding
mechanisms in stirred media mills are dependent on
0032-5910/$ - see front matter D 2005 Elsevier B.V. All rights reserved.
doi:10.1016/j.powtec.2005.08.026
* Corresponding author. Tel.: +46 920 491692; fax: +46 920 97364.
E-mail address: [email protected] (M. He).
Powder Technology 161 (2006) 10 – 21
www.elsevier.com/locate/powtec

compressional, shear and torsional stresses, which are invoked
by stirring the slurry-bead mixture at a very high velocity
[16–21]. The effective grinding motions of the mixture are
correlated to its flow behaviour in the grinding chamber. The
optimization of the rheological behaviour of a ground slurry
can enhance energy efficiency and throughput in wet ultra-
fine grinding operation.
From a diagnostic point of view, the rheological behav-
iour of a mineral slurry is indicative of the level of
interparticle interaction or aggregation in the slurry. There-
fore, it is a useful variable to be controlled in industrial
processes such as transportation of slurries, dewatering and
wet grinding [22]. Since the product fineness significantly
increases with grinding time in wet ultra-fine grinding
operation characterized by a very fine product size and a
high solids concentration, the surface properties tend to
predominate in the system [13,14,23,24]. Inter-particle forces,
such as van der Waals forces [25,26] and electrostatic forces
[13,22], lead to the formation of agglomeration and
aggregation. This results in changes in rheological property
in wet ultra-fine grinding operations. The effect of slurry
flowability or slurry rheology in wet ultra-fine grinding
becomes of particular importance. For instance, the addition
of an optimum dispersant to a given feed slurry can result in
a drastic reduction or even elimination of yield stress and
permits a higher solids concentration of a ground slurry
[15,23,25–27]. In the absence of any dispersant, the typical
maximum percentage solids by weight in a slurry is
approximately 50% for the feed of ultra-fine grinding in
stirred media mills, whereas an upper limitation of solids
concentration is up to 80 wt.% in the presence of an optimal
dispersant [25]. Therefore, the improvement of rheological
behaviours of a feed slurry with the addition of a suitable
dispersant can enhance the productivity and throughput for
wet ultra-fine grinding.
Many studies related to slurry rheology in conventional
tumbling ball mills have been published, but there is still little
understanding of slurry rheology relevant to wet ultrafine
grinding characterized by a very fine product size and a high
slurry concentration due to the complex slurry rheological
behaviours in stirred media mills [24,28]. Also, findings from
tumbling ball mills involving the role of slurry rheology on the
grinding results cannot be completely applicable to the stirred
media milling case due to their different breakage mechanisms
[18,19,29,30]. Therefore, it is necessary for scientific under-
standing and industrial application to systematically investigate
the effect of slurry rheology on wet ultra-fine grinding
performance by varying grinding conditions.
The objective of this paper is to investigate the effect of
the rheological behaviours of limestone slurries ground in a
stirred media mill on the energy efficiency and the product
fineness obtained by varying the grinding parameters such as
molecular weight of a dispersant, solids concentration,
additive dosage, addition method, beads load. The grinding
results were evaluated by energy efficiency and the median
size of a ground product with respect to specific energy
consumption.
2. Experimental set-up and procedures
2.1. Materials
A limestone powder <100 Am (93.7% CaCO3) provided
by SMA Karbonater AB in Sweden was used for grinding
experiments in this study. Sodium polyacrylates with a range
of molecular weights such as BCX-476, Dispersant S40 and
BCX-552 obtained from CDM AB in Sweden were selected
as dispersants. Table 1 shows the physical and chemical
properties of the sodium polyacrylates including the molec-
ular weights. In this investigation, the additive amount of a
dispersant is the percent of the pure dispersant (i.e., active
content) by weight relative to the weight of solids in a
limestone slurry.
2.2. Stirred media mill
A stirred media mill utilized for the grinding experiments
is the PMH 5 TEX Drais mill (Draiswerk GmbH, Germany).
It consists of a U150�420 mm stainless steel cylinder
chamber (5.6 l of net grinding chamber volume) and a
stirrer with six U120�10 perforated discs installed on a
horizontal driven shaft. The grinding chamber is equipped
with a water jacket for cooling. The discs rotate at 1808
rpm (corresponding to a peripheral speed of 11.36 m/s). The
flowrate of the slurry was controlled by a feeding pump at
1.5 l/min. Discharge of the product was facilitated by means
of two specially designed screen cartridges inserted at the
end of the cylinder. Zircon beads with diameters of 1.6–2.0
mm and a density of 3700 kg/m3 were used as the grinding
media. The grinding operation in the PMH 5 TEX is the
mode of circulation pass by pass. A limestone–water slurry
was prepared at a pre-determined solids concentration by
mixing 40 to 50 kg of limestone powder with water to make
up about 35 l of the slurry. 15 l of the slurry were fed through
the mill first and then thrown away in order to attain a steady
milling state with regard to the solids concentration. The
remaining about 20 l of the slurry were circulated through the
mill pass by pass. About 200 ml of slurry sample was taken
after each pass. The samples were then analysed for particle
size, rheological property and specific surface area, respec-
tively. The grinding operation was stopped either when the
Table 1
Physical and chemical properties of three sodium polyacrylates
Physical and chemical
properties
BCX-476 Dispersant
S40
BCX-552
Solid content (wt.%) 45% 45% 30%
Active content (wt.%) 40% 40% 26%
pH 7.5 7.5 7.5
Density at 20 -C 1.30 1.30 1.315
Molecular weightc 2000 5500 85,000
Sodium polyacrylate
content (wt.%)
40% 40% 26%
Water content (wt.%) 55% 55% 70%
Solubility (in water) Very soluble Very soluble Very soluble
(cmolecular weight determined by gel permeation chromatography (GPC)).
M. He et al. / Powder Technology 161 (2006) 10–21 11
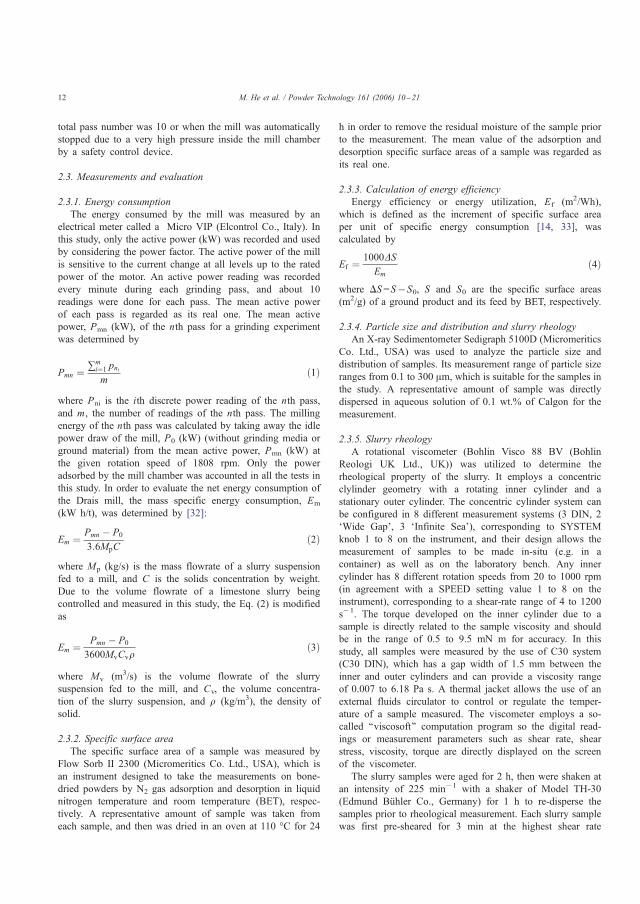
total pass number was 10 or when the mill was automatically
stopped due to a very high pressure inside the mill chamber
by a safety control device.
2.3. Measurements and evaluation
2.3.1. Energy consumption
The energy consumed by the mill was measured by an
electrical meter called a Micro VIP (Elcontrol Co., Italy). In
this study, only the active power (kW) was recorded and used
by considering the power factor. The active power of the mill
is sensitive to the current change at all levels up to the rated
power of the motor. An active power reading was recorded
every minute during each grinding pass, and about 10
readings were done for each pass. The mean active power
of each pass is regarded as its real one. The mean active
power, Pmn (kW), of the nth pass for a grinding experiment
was determined by
Pmn ¼ ~mi¼1 pnim
ð1Þ
where Pni is the ith discrete power reading of the nth pass,
and m, the number of readings of the nth pass. The milling
energy of the nth pass was calculated by taking away the idle
power draw of the mill, P0 (kW) (without grinding media or
ground material) from the mean active power, Pmn (kW) at
the given rotation speed of 1808 rpm. Only the power
adsorbed by the mill chamber was accounted in all the tests in
this study. In order to evaluate the net energy consumption of
the Drais mill, the mass specific energy consumption, Em
(kW h/t), was determined by [32]:
Em ¼ Pmn � P0
3:6MpCð2Þ
where Mp (kg/s) is the mass flowrate of a slurry suspension
fed to a mill, and C is the solids concentration by weight.
Due to the volume flowrate of a limestone slurry being
controlled and measured in this study, the Eq. (2) is modified
as
Em ¼ Pmn � P0
3600MvCvqð3Þ
where Mv (m3/s) is the volume flowrate of the slurry
suspension fed to the mill, and Cv, the volume concentra-
tion of the slurry suspension, and q (kg/m3), the density of
solid.
2.3.2. Specific surface area
The specific surface area of a sample was measured by
Flow Sorb II 2300 (Micromeritics Co. Ltd., USA), which is
an instrument designed to take the measurements on bone-
dried powders by N2 gas adsorption and desorption in liquid
nitrogen temperature and room temperature (BET), respec-
tively. A representative amount of sample was taken from
each sample, and then was dried in an oven at 110 -C for 24
h in order to remove the residual moisture of the sample prior
to the measurement. The mean value of the adsorption and
desorption specific surface areas of a sample was regarded as
its real one.
2.3.3. Calculation of energy efficiency
Energy efficiency or energy utilization, Ef (m2/Wh),
which is defined as the increment of specific surface area
per unit of specific energy consumption [14, 33], was
calculated by
Ef ¼ 1000DSEm
ð4Þ
where DS =S�S0, S and S0 are the specific surface areas
(m2/g) of a ground product and its feed by BET, respectively.
2.3.4. Particle size and distribution and slurry rheology
An X-ray Sedimentometer Sedigraph 5100D (Micromeritics
Co. Ltd., USA) was used to analyze the particle size and
distribution of samples. Its measurement range of particle size
ranges from 0.1 to 300 Am, which is suitable for the samples in
the study. A representative amount of sample was directly
dispersed in aqueous solution of 0.1 wt.% of Calgon for the
measurement.
2.3.5. Slurry rheology
A rotational viscometer (Bohlin Visco 88 BV (Bohlin
Reologi UK Ltd., UK)) was utilized to determine the
rheological property of the slurry. It employs a concentric
clylinder geometry with a rotating inner cylinder and a
stationary outer cylinder. The concentric cylinder system can
be configured in 8 different measurement systems (3 DIN, 2
FWide Gap_, 3 FInfinite Sea_), corresponding to SYSTEM
knob 1 to 8 on the instrument, and their design allows the
measurement of samples to be made in-situ (e.g. in a
container) as well as on the laboratory bench. Any inner
cylinder has 8 different rotation speeds from 20 to 1000 rpm
(in agreement with a SPEED setting value 1 to 8 on the
instrument), corresponding to a shear-rate range of 4 to 1200
s�1. The torque developed on the inner cylinder due to a
sample is directly related to the sample viscosity and should
be in the range of 0.5 to 9.5 mN m for accuracy. In this
study, all samples were measured by the use of C30 system
(C30 DIN), which has a gap width of 1.5 mm between the
inner and outer cylinders and can provide a viscosity range
of 0.007 to 6.18 Pa s. A thermal jacket allows the use of an
external fluids circulator to control or regulate the temper-
ature of a sample measured. The viscometer employs a so-
called ‘‘viscosoft’’ computation program so the digital read-
ings or measurement parameters such as shear rate, shear
stress, viscosity, torque are directly displayed on the screen
of the viscometer.
The slurry samples were aged for 2 h, then were shaken at
an intensity of 225 min�1 with a shaker of Model TH-30
(Edmund Buhler Co., Germany) for 1 h to re-disperse the
samples prior to rheological measurement. Each slurry sample
was first pre-sheared for 3 min at the highest shear rate
M. He et al. / Powder Technology 161 (2006) 10–2112
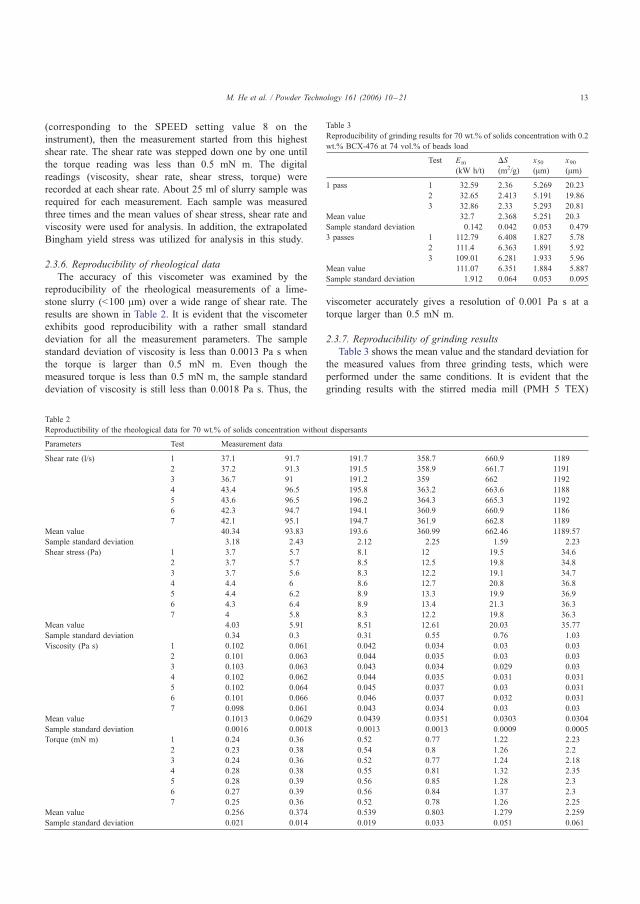
(corresponding to the SPEED setting value 8 on the
instrument), then the measurement started from this highest
shear rate. The shear rate was stepped down one by one until
the torque reading was less than 0.5 mN m. The digital
readings (viscosity, shear rate, shear stress, torque) were
recorded at each shear rate. About 25 ml of slurry sample was
required for each measurement. Each sample was measured
three times and the mean values of shear stress, shear rate and
viscosity were used for analysis. In addition, the extrapolated
Bingham yield stress was utilized for analysis in this study.
2.3.6. Reproducibility of rheological data
The accuracy of this viscometer was examined by the
reproducibility of the rheological measurements of a lime-
stone slurry (<100 Am) over a wide range of shear rate. The
results are shown in Table 2. It is evident that the viscometer
exhibits good reproducibility with a rather small standard
deviation for all the measurement parameters. The sample
standard deviation of viscosity is less than 0.0013 Pa s when
the torque is larger than 0.5 mN m. Even though the
measured torque is less than 0.5 mN m, the sample standard
deviation of viscosity is still less than 0.0018 Pa s. Thus, the
viscometer accurately gives a resolution of 0.001 Pa s at a
torque larger than 0.5 mN m.
2.3.7. Reproducibility of grinding results
Table 3 shows the mean value and the standard deviation for
the measured values from three grinding tests, which were
performed under the same conditions. It is evident that the
grinding results with the stirred media mill (PMH 5 TEX)
Table 2
Reproductibility of the rheological data for 70 wt.% of solids concentration without dispersants
Parameters Test Measurement data
Shear rate (l/s) 1 37.1 91.7 191.7 358.7 660.9 1189
2 37.2 91.3 191.5 358.9 661.7 1191
3 36.7 91 191.2 359 662 1192
4 43.4 96.5 195.8 363.2 663.6 1188
5 43.6 96.5 196.2 364.3 665.3 1192
6 42.3 94.7 194.1 360.9 660.9 1186
7 42.1 95.1 194.7 361.9 662.8 1189
Mean value 40.34 93.83 193.6 360.99 662.46 1189.57
Sample standard deviation 3.18 2.43 2.12 2.25 1.59 2.23
Shear stress (Pa) 1 3.7 5.7 8.1 12 19.5 34.6
2 3.7 5.7 8.5 12.5 19.8 34.8
3 3.7 5.6 8.3 12.2 19.1 34.7
4 4.4 6 8.6 12.7 20.8 36.8
5 4.4 6.2 8.9 13.3 19.9 36.9
6 4.3 6.4 8.9 13.4 21.3 36.3
7 4 5.8 8.3 12.2 19.8 36.3
Mean value 4.03 5.91 8.51 12.61 20.03 35.77
Sample standard deviation 0.34 0.3 0.31 0.55 0.76 1.03
Viscosity (Pa s) 1 0.102 0.061 0.042 0.034 0.03 0.03
2 0.101 0.063 0.044 0.035 0.03 0.03
3 0.103 0.063 0.043 0.034 0.029 0.03
4 0.102 0.062 0.044 0.035 0.031 0.031
5 0.102 0.064 0.045 0.037 0.03 0.031
6 0.101 0.066 0.046 0.037 0.032 0.031
7 0.098 0.061 0.043 0.034 0.03 0.03
Mean value 0.1013 0.0629 0.0439 0.0351 0.0303 0.0304
Sample standard deviation 0.0016 0.0018 0.0013 0.0013 0.0009 0.0005
Torque (mN m) 1 0.24 0.36 0.52 0.77 1.22 2.23
2 0.23 0.38 0.54 0.8 1.26 2.2
3 0.24 0.36 0.52 0.77 1.24 2.18
4 0.28 0.38 0.55 0.81 1.32 2.35
5 0.28 0.39 0.56 0.85 1.28 2.3
6 0.27 0.39 0.56 0.84 1.37 2.3
7 0.25 0.36 0.52 0.78 1.26 2.25
Mean value 0.256 0.374 0.539 0.803 1.279 2.259
Sample standard deviation 0.021 0.014 0.019 0.033 0.051 0.061
Table 3
Reproducibility of grinding results for 70 wt.% of solids concentration with 0.2
wt.% BCX-476 at 74 vol.% of beads load
Test Em
(kW h/t)
DS(m2/g)
x50(Am)
x90(Am)
1 pass 1 32.59 2.36 5.269 20.23
2 32.65 2.413 5.191 19.86
3 32.86 2.33 5.293 20.81
Mean value 32.7 2.368 5.251 20.3
Sample standard deviation 0.142 0.042 0.053 0.479
3 passes 1 112.79 6.408 1.827 5.78
2 111.4 6.363 1.891 5.92
3 109.01 6.281 1.933 5.96
Mean value 111.07 6.351 1.884 5.887
Sample standard deviation 1.912 0.064 0.053 0.095
M. He et al. / Powder Technology 161 (2006) 10–21 13

exhibit good reproducibility with a rather small sample
standard deviation for all the measurement parameters, as
was confirmed and emphasized in Ref. [26].
3. Results and discussion
3.1. Effect of molecular weight of a dispersant
The ultra-fine grinding process is characterized by a high
solids concentration and the presence of excessive fines, which
are two of the primary factors leading to the formation of
agglomerations or flocculations and hence the development of
a yield stress of slurry. This results in an increase in the energy
consumption for ultra-fine grinding and even makes the
operation impossible [13,23–25]. It is known that a small
addition of a suitable dispersant is indispensable for wet ultra-
fine grinding. The polyacrylic acids or its salts as efficient
dispersants for wet ultra-fine grinding have been identified
[34]. The use of a polyacrylic acid or its salt with an optimal
molecular weight as grinding aids can change the surface
nature of particles in a ground slurry, resulting in inter-particle
forces being entirely repulsive to improve the slurry flowability
by decreasing the slurry viscosity and by reducing or
eliminating the shear yield stress. This can enhance the
fineness of products, energy efficiency and throughput in wet
ultra-fine grinding.
Fig. 1 shows the effect of three sodium polyacrylates with
different molecular weights on the grinding results for 75 wt.%
of solids concentration with 0.2 wt.% of each dispersant.
Clearly, Dispersant S40 with a molecular weight of 5500 gives
the better grinding results (i.e., a higher energy efficiency and a
smaller median size) in wet ultra-fine grinding of limestone
when other operation conditions are kept constant. The reason
is that Dispersant S40 maintains a lower viscosity during the
grinding (Fig. 2). Clearly, the feed of 75 wt.% of solids
concentration with BCX-552 exhibits higher viscosities in the
shear rate range studied (Fig. 2 (a)). This gives a lower energy
efficiency and a larger median size during pass 1. The feeds of
75 wt.% of solids concentration with BCX-476 and Dispersant
S40 display almost the same rheological property in the shear
rate range and produce an insignificant difference in grinding
results during pass 1. After pass 1, the better grinding results
are obtained for 75 wt.% of solids concentration with
Dispersant S40 due to its lower viscosities in the shear rate
range. However, whatever dispersants exist at 75 wt.% of
solids concentration, the grinding operation is forced to
automatically stop due to high pressure inside the mill chamber
by a safety control device when a ground slurry presents a
pseudoplastic flow with a definite extrapolated Bingham yield
stress (Figs. 2(d) and 3). The pseudoplastic slurry with a yield
stress could be the reason because the more viscous the slurry,
the more power is needed to make the slurry flow when the
slurry is circulated through the mill by a pump. This increases
the pressure in the mill up to the limit. In addition, for 75 wt.%
of solids concentration with 0.2 wt.% of BCX-552, the
grinding process can only run for one pass but can run for
three passes for BCX-476 or Dispersant S40. Consistent results
were also obtained in the case of 70 wt.% of solids
concentration with the three dispersants.
3.2. Effect of solids concentration
A small addition of a suitable dispersant is indispensable
for the wet ultra-fine grinding of limestone [13,26,27]. It can
change the surface nature of limestone particles in a ground
slurry, resulting in inter-particle forces being entirely repulsive
to improve the slurry flowability [31]. This decreases the
energy consumption and increases throughput for the ultra-
fine grinding. Based on the previous results, Dispersant S40
is selected as a grinding aid. Fig. 4 shows the grinding results
of limestone slurries with three different solids concentrations
with 0.2 wt.% of Dispersant S40 at 74 vol.% of beads load.
The cumulative energy efficiency increases first and then
decreases with increasing solids concentration from 65 to 75
wt.% at a given specific energy input. The median size of the
product varies with solids concentration in an opposite way
from the cumulative energy efficiency. This is in agreement
with a previous conclusion [13]. The best grinding results are
obtained at 70 wt.% of solids concentration with 0.2 wt.% of
Dispersant S40 at 74 vol.% of beads load. The reason is that
the slurry of 70 wt.% of solids concentration with 0.2 wt.% of
the dispersant exhibits proper viscosities in a wide range of
shear rate (Fig. 5) and produces better stress conditions (i.e., a
higher stress intensity and a larger average number of stress
events for each particle). In the case of 65 wt.% of solids
concentration with 0.2 wt.% of the dispersant, a lower
45
50
55
60
65
70
0 50 100 150
BCX-476
Dispersant S40
BCX-552
1.5
2
2.5
3
3.5
4
4.5
5
5.5
0 50 100 150
BCX-476Dispersant S40BCX-552
Cumulative specific energy input (kWh/t)
Cumulative specific energy input (kWh/t)
Cum
ulat
ive
ener
gy e
ffic
ienc
y (m
2 /Wh)
Med
ian
size
, X50
(μm
)
a
b
Fig. 1. Effect of chemicals with various molecular weights at the additive level
of 0.2 wt.% on the grinding results for 75 wt.% of solids concentration at 74
vol.% of beads load.
M. He et al. / Powder Technology 161 (2006) 10–2114
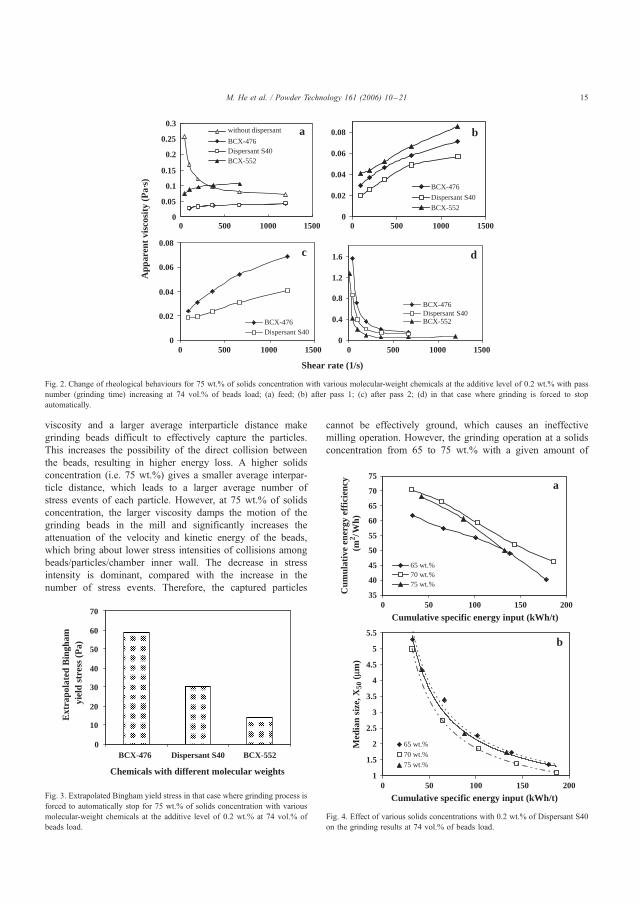
viscosity and a larger average interparticle distance make
grinding beads difficult to effectively capture the particles.
This increases the possibility of the direct collision between
the beads, resulting in higher energy loss. A higher solids
concentration (i.e. 75 wt.%) gives a smaller average interpar-
ticle distance, which leads to a larger average number of
stress events of each particle. However, at 75 wt.% of solids
concentration, the larger viscosity damps the motion of the
grinding beads in the mill and significantly increases the
attenuation of the velocity and kinetic energy of the beads,
which bring about lower stress intensities of collisions among
beads/particles/chamber inner wall. The decrease in stress
intensity is dominant, compared with the increase in the
number of stress events. Therefore, the captured particles
cannot be effectively ground, which causes an ineffective
milling operation. However, the grinding operation at a solids
concentration from 65 to 75 wt.% with a given amount of
0
10
20
30
40
50
60
70
BCX-476 Dispersant S40 BCX-552
Ext
rapo
late
d B
ingh
am
yiel
d st
ress
(P
a)
Chemicals with different molecular weights
Fig. 3. Extrapolated Bingham yield stress in that case where grinding process is
forced to automatically stop for 75 wt.% of solids concentration with various
molecular-weight chemicals at the additive level of 0.2 wt.% at 74 vol.% of
beads load.
35
40
45
50
55
60
65
70
75
0 50 100 150 200
65 wt.%70 wt.%75 wt.%
1
1.5
2
2.5
3
3.5
4
4.5
5
5.5
0 50 100 150 200
65 wt.%
70 wt.%
75 wt.%
Cumulative specific energy input (kWh/t)
Cumulative specific energy input (kWh/t)
a
b
Med
ian
size
, X50
(μm
)C
umul
ativ
e en
ergy
eff
icie
ncy
(m2 /W
h)
Fig. 4. Effect of various solids concentrations with 0.2 wt.% of Dispersant S40
on the grinding results at 74 vol.% of beads load.
0
0.05
0.1
0.15
0.2
0.25
0.3
0 500 1000 1500 0 500 1000 1500
0 500 1000 1500 0 500 1000 1500
without dispersant
BCX-476Dispersant S40BCX-552
0
0.02
0.04
0.06
0.08
BCX-476
Dispersant S40
BCX-552
0
0.02
0.04
0.06
0.08
BCX-476Dispersant S40
0
0.4
0.8
1.2
1.6
BCX-476Dispersant S40BCX-552
a b
c d
Shear rate (1/s)
App
aren
t vi
scos
ity
(Pa·
s)
Fig. 2. Change of rheological behaviours for 75 wt.% of solids concentration with various molecular-weight chemicals at the additive level of 0.2 wt.% with pass
number (grinding time) increasing at 74 vol.% of beads load; (a) feed; (b) after pass 1; (c) after pass 2; (d) in that case where grinding is forced to stop
automatically.
M. He et al. / Powder Technology 161 (2006) 10–21 15
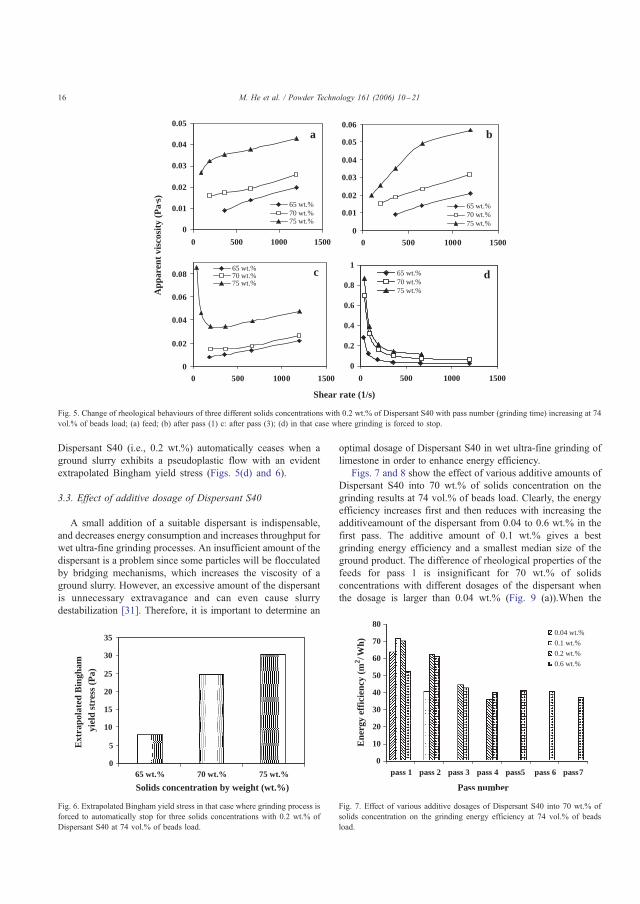
Dispersant S40 (i.e., 0.2 wt.%) automatically ceases when a
ground slurry exhibits a pseudoplastic flow with an evident
extrapolated Bingham yield stress (Figs. 5(d) and 6).
3.3. Effect of additive dosage of Dispersant S40
A small addition of a suitable dispersant is indispensable,
and decreases energy consumption and increases throughput for
wet ultra-fine grinding processes. An insufficient amount of the
dispersant is a problem since some particles will be flocculated
by bridging mechanisms, which increases the viscosity of a
ground slurry. However, an excessive amount of the dispersant
is unnecessary extravagance and can even cause slurry
destabilization [31]. Therefore, it is important to determine an
optimal dosage of Dispersant S40 in wet ultra-fine grinding of
limestone in order to enhance energy efficiency.
Figs. 7 and 8 show the effect of various additive amounts of
Dispersant S40 into 70 wt.% of solids concentration on the
grinding results at 74 vol.% of beads load. Clearly, the energy
efficiency increases first and then reduces with increasing the
additiveamount of the dispersant from 0.04 to 0.6 wt.% in the
first pass. The additive amount of 0.1 wt.% gives a best
grinding energy efficiency and a smallest median size of the
ground product. The difference of rheological properties of the
feeds for pass 1 is insignificant for 70 wt.% of solids
concentrations with different dosages of the dispersant when
the dosage is larger than 0.04 wt.% (Fig. 9 (a)).When the
0
0.01
0.02
0.03
0.04
0.05
0 500 1000 1500
65 wt.%70 wt.%75 wt.%
0
0.01
0.02
0.03
0.04
0.05
0.06
0 500 1000 1500
65 wt.%70 wt.%75 wt.%
0
0.02
0.04
0.06
0.08
0 500 1000 1500
65 wt.%70 wt.%75 wt.%
0
0.2
0.4
0.6
0.8
1
0 500 1000 1500
65 wt.%70 wt.%75 wt.%
a b
c d
Shear rate (1/s)
App
aren
t vi
scos
ity
(Pa·
s)
Fig. 5. Change of rheological behaviours of three different solids concentrations with 0.2 wt.% of Dispersant S40 with pass number (grinding time) increasing at 74
vol.% of beads load; (a) feed; (b) after pass (1) c: after pass (3); (d) in that case where grinding is forced to stop.
0
5
10
15
20
25
30
35
65 wt.% 70 wt.% 75 wt.%
Ext
rapo
late
d B
ingh
am
yiel
d st
ress
(P
a)
Solids concentration by weight (wt.%)
Fig. 6. Extrapolated Bingham yield stress in that case where grinding process is
forced to automatically stop for three solids concentrations with 0.2 wt.% of
Dispersant S40 at 74 vol.% of beads load.
0
10
20
30
40
50
60
70
80
pass 1 pass 2 pass 3 pass 4 pass5 pass 6 pass 7
0.04 wt.%
0.1 wt.%
0.2 wt.%
0.6 wt.%
Ene
rgy
effi
cien
cy (
m2 /W
h)
Pass number
Fig. 7. Effect of various additive dosages of Dispersant S40 into 70 wt.% of
solids concentration on the grinding energy efficiency at 74 vol.% of beads
load.
M. He et al. / Powder Technology 161 (2006) 10–2116

additive amount is below 0.1 wt.% (i.e., 0.04 wt.%), the energy
efficiency is reduced due to a rapid increase in the viscosity of
the ground slurry during pass 1 (Fig. 9 (b)). The rheological
property of the discharge slurry with 0.04 wt.% of the
dispersant for pass 1 exhibits a pseudoplastic flow with a high
extrapolated Bingham yield stress of 45.8 Pa. Therefore, the
stress intensity from the collision of milling beads is rapidly
weakened due to the poor flowability of the slurry. After pass
1, the grinding operation automatically ceased due to the poor
flowability of the slurry. At an additive dosage of 0.1 wt.% of
Dispersant S40 or more, the rheological differences of the feed
and the discharge slurries are both insignificant for pass 1 for
70 wt.% of solids concentration with different dosages of
Dispersant S40 (Fig. 9). But in a region of small cumulative
specific energy input (less pass number), a smaller addition
amount of the dispersant gives a higher energy efficiency and a
smaller median size at a given specific energy input (Fig. 8).
However, the additive amount of Dispersant S40 up to 0.6
wt.% causes an inefficient grinding in the initial stage. This is
because the excessive Dispersant S40 exists in the slurry, but
does not adsorb on the suspended limestone particles for 70
wt.% of solids concentration with 0.6 wt.% of Dispersant S40
[31]. When the slurry is pumped through the mill, the excessive
dispersant not adsorbed by limestone particles could possibly
adsorb on the grinding beads surface, and also some carboxylic
groups on the dispersant molecules adsorbed on the grinding
beads can simultaneously adsorb some fine limestone particles.
This forms a cushion layer on the beads surface, which results
in a lower stress intensity from the collision of the beads and
thus gives the inefficient grinding action. With the cumulative
specific energy input increasing, the specific surface area of the
ground limestone particles increases and some excessive
dispersant molecules immigrate onto the surface of the particles
from that of the beads. The cushion layers on the beads become
thinner and thinner and even disappear. Thus, the energy
efficiency increases (Fig. 8 (a)). Similar phenomenon was
observed by Bernhardt et al. [13]. The particle size is reduced
with increasing the cumulative specific energy input, which
causes a smaller stress zone (or active volume) between two
approaching milling beads [19]. The possibility of a particle
captured is reduced, thus the energy efficiency gradually
lowers, as is interpreted by the grinding mechanism in stirred
media mills, which has been described in detail by Kwade
[18,19]. Before the grinding operation automatically ceases, the
energy efficiency quickly reduces, especially for a smaller
additive dosage of the dispersant. This is due to the rapid
increase in the viscosity of the slurry, causing lower stress
intensities. However, the slurry with 70 wt.% of solids
concentration can be ground for one pass at 0.04 wt.% of
Dispersant S40, two passes at 0.1 wt.%, four passes at 0.2 wt.%
and twelve passes at 0.6 wt.%. For 70 wt.% of solids
concentration with whatever additive dosages of Dispersant
S40 and pass number, the grinding operation automatically
stop when a discharge slurry from the mill displays a
pseudoplastic flow with an evident extrapolated Bingham yield
stress (Fig. 10), where the discharged slurry is defined as an FP
product or FP slurry. In addition, it is interesting to observe the
35
45
55
65
75
0 100 200 300 400 500
0.1 wt.%
0.2 wt.%
0.6 wt.%
0.51
1.52
2.53
3.54
4.55
5.5
0 100 200 300 400 500
0.1 wt.%
0.2 wt.%
0.6 wt.%
Cumulative specific energy input (kWh/t)
Cumulative specific energy input (kWh/t)
Med
ian
size
, X50
(μm
)
a
b
Cum
ulat
ive
ener
gy e
ffic
ienc
y (m
2 /Wh)
Fig. 8. Effect of three different additive dosages of Dispersant S40 into 70 wt.%
of solids concentration on the grinding results at 74% vol.% of beads load.
0
0.01
0.02
0.03
0 500 1000 1500
0 500 1000 1500
0.04 wt.%
0.1 wt.%
0.2 wt.%
0.6 wt.%
0
0.2
0.4
0.6
0.8
1
0.04 wt.%0.1 wt.%
0.2 wt.%0.6 wt.%
Shear rate (1/s)
App
aren
t vi
scos
ity
(Pa·
s)
b
a
Fig. 9. Rheological properties of the feed and discharge slurries for 70 wt.% of
solids concentration with various additive dosages of Dispersant S40 for pass 1:
(a) Feeds; (b) Discharges.
M. He et al. / Powder Technology 161 (2006) 10–21 17

influences of the additive amount of Dispersant S40 on the
particle size distribution and the specific surface area of an FP
product at the same solids concentration regardless of other
grinding conditions (Figs. 11 and 12), respectively. This
indicates that the limestone slurry with a given solids
concentration is ground to an FP product with approximately
the same particle size and specific surface area in the presence
of the same additive amount of Dispersant S40. Obviously, the
specific surface area of the FP product is directly proportional
to the additive amount of Dispersant S40 (Fig. 12). The particle
size distribution parallelly moves towards a range of smaller
particle size with increasing the additive amount of Dispersant
S40 when the additive amount of the dispersant is up to 0.2
wt.%. At the additive amount above 0.4 wt.%, the finer
particles (<0.4 Am) increase more evidently, and the increase in
specific surface area is mainly dependent on the created finer
particles.
3.4. Effect of addition method of Dispersant S40
A product fineness of 90% passing 2 Am is required in
industrials such as papermaking. The achievement of the
product fineness needs a certain addition of a suitable
dispersant for the limestone powder at a given solids
concentration (Fig. 11). It is obvious that for 70 wt.% of
solids concentration, at least 0.5 wt.% of Dispersant S40 is
indispensable for the achievement of a product fineness of 90%
passing 2 Am. To avoid the detrimental effect of the existence
of excessive Dispersant S40 in a limestone slurry, the multi-
point addition of the dispersant was adopted [35]. Fig. 13
shows the effect of multi-point and one-point additions of
Dispersant S40 on wet ultra-fine grinding of the limestone. It is
evident that an insignificant difference exists between three-
point and one-point additions for 70 wt.% of solids concen-
tration at an additive level of 0.2 wt.% of Dispersant S40 at 74
vol.% of beads load. This is because the existence of a small
0
20
40
60
80
100
0.1 1 10 100
0
0.1 wt.%
0.2 wt.%
0.4 wt.%
0.6 wt.%Cum
ulat
ive
mas
s fi
ner
(%)
Particle size (μm)
Fig. 11. Effect of the additional amount of Dispersant S40 on the particle size
distribution of an FP product for 70 wt.% of solids concentration.
y = 22.582x + 4.7291
R2 = 0.9847
0
5
10
15
20
0 0.2 0.4 0.6 0.8
Spec
ific
sur
face
are
a (m
2 /g)
Amount of dispersant (wt.%)
Fig. 12. Effect of the additive amount of Dispersant S40 on the specific surface
area of an FP product for 70 wt.% of solids concentration.
40
45
50
55
60
65
70
75
0 50 100 150 200 250 300 350
3 times
1 time
4 times
1 time
Cumulative specific energy input (kWh/t)
Cum
ulat
ive
ener
gy e
ffic
ienc
y (m
2 /Wh)
70 wt.% of solids concentration with 0.2 wt.% of Dispersant S40:
75 wt.% of solids concentration with 0.6 wt.% of Dispersant S40:
Fig. 13. Effect of introducing method of Dispersant S40 on wet ultra-fine
grinding.
0
20
40
60
80
100
120
140
160
0 500 1000 1500
0.04 wt.% 0.1 wt.% 0.2 wt.%0.6 wt.%
0
10
20
30
40
50
60
70
0.04 wt.% 0.1 wt.% 0.2 wt.% 0.6 wt.%
Shear rate (1/s)
Addition amount of Dispersant S40 (wt.%)
Shea
r st
ress
(P
a)
Ext
rapo
late
d B
ingh
am
yiel
d st
ress
(P
a)
b
a
Fig. 10. Rheological behaviours of where the grinding operation is forced to
automatically stop for 70 wt.% of solids concentration with various dosages of
Dispersant S40 at vol.% of beads load: (a) shear stress-shear rate relationship;
(b) extrapolated Bingham yield stress.
M. He et al. / Powder Technology 161 (2006) 10–2118

additive amount (i.e., 0.2 wt.%) in the limestone slurry cannot
form an effective cushion layer on the milling beads. However,
in the case of 75 wt.% of solids concentration with 0.6 wt.%
Dispersant S40, the multi-point addition of the dispersant gives
a better energy efficiency in a range of lower specific energy
input (i.e.,<200 kW h/t). While in a higher level of the specific
energy input above 300 kW h/t, the difference in cumulative
energy efficiency resulting from different addition methods of
Dispersant S40 is marginal. For an additive amount of 0.6 wt.%
of the dispersant, a multi-point addition avoids the existence of
the excessive dispersant, and thus the formation of a cushion
layer on the milling beads in the lower specific energy input.
3.5. Effect of beads load
For wet ultra-fine grinding in stirred beads mills, the
milling beads load is the most important parameter in terms
of energy efficiency [36]. Fig. 14 shows the effect of various
beads loads on the grinding results for 70 wt.% of solids
concentration with 0.2 wt.% of Dispersant S40. The higher
the beads load, the better the cumulative energy efficiency,
the finer the product fineness at the same specific energy
consumption. Besides, a higher beads load causes a less pass
number under the same other grinding conditions before the
grinding operation automatically stops when a discharge
slurry from the mill displays a pseudoplastic flow with an
evident extrapolated Bingham yield stress. For 65 vol.%
beads load, the ground slurry of 70 wt.% of solids
concentration with 0.2 wt.% of the dispersant can be
circulated at least 7 passes, but can be circulated only 3
passes for 83 vol.% of beads load. This means less time
needed at a constant feed flowrate of the slurry (1.5 l per
min). This shows that a higher beads load gives a better
energy efficiency and a higher milling rate ((m2/g)/min),
which is defined as the increase in the specific surface area
per unit of mean residence time [33]. For 70 wt.% of solids
concentration with 0.6 wt.% of the dispersant, the consistent
conclusion is drawn (Fig. 15). Also, it is interesting to see
that for a lower beads load (�74 vol.%) and a higher additive
dosage of the dispersant (e.g., 0.6 wt.%) at a given solids
concentration (i.e., 70 wt.%), the cumulative energy efficiency
exhibits a maximum in a range of lower specific energy input.
This phenomenon cannot occur in the case of a higher beads
load (i.e., 83 vol.%). This indicates a higher beads load (�83
vol.%) can eliminate the detrimental effect of the excessive
35
40
45
50
55
60
65
70
75
80
0 50 100 150 200 250
65 vol.%74 vol.%
77 vol.%80 vol.%
83 vol.%
1
2
3
4
5
6
7
865 vol.%74 vol.%77 vol.%80 vol.%83 vol.%
Cumulative specific energy input (kWh/t)
0 50 100 150 200 250
Cumulative specific energy input (kWh/t)
Cum
ulat
ive
ener
gy e
ffic
ienc
y (m
2 /Wh)
a
bMed
ian
size
, X50
(μm
)
Fig. 14. Effect of various beads loads on the grinding results for 70 wt.% of
solids concentration in the presence of 0.2 wt.% of Dispersant S40.
30
40
50
60
70
80
0 100 200 300 400 500
65 vol.%74 vol.%83 vol.%
Cumulative specific energy input (kWh/t)
Cum
ulat
ive
ener
gy e
ffic
ienc
y
(m2 /W
h)
Fig. 15. Effect of various beads loads on the grinding results for 70 wt.% of
solids concentration in the presence of 0.6 wt.% of Dispersant S40.
40
50
60
70
80
0 100 200 300 400
0.2 wt.%
0.6 wt.%
0.5
1.5
2.5
3.5
0.2 wt.%
0.6 wt.%
Cumulative specific energy input (kWh/t)
0 100 200 300 400
Cumulative specific energy input (kWh/t)
a
b
Cum
ulat
ive
ener
gy e
ffic
ienc
y (m
2 /Wh)
M
edia
n si
ze, X
50 (
μm)
Fig. 16. Effect of the different additive dosages of Dispersant S40 into 70 wt.%
of solids concentration on the grinding results at 83 vol.% of beads load.
M. He et al. / Powder Technology 161 (2006) 10–21 19

dispersant in a limestone slurry on the wet utralfine grinding,
as is confirmed by comparing Figs. 8 with 16. In the case of
83 vol.% of beads load, the differences in grinding results are
insignificant for 70 wt.% of solids concentration in the
presences of 0.2 and 0.6 wt.% of the dispersant in a region of
low specific energy input (Fig. 16).
4. Empirical prediction
In classical grinding theory, the particle size of a ground
product reduces with increasing net specific energy input in the
form of a power–law function. The differential form of the
power–law relationship between an infinitesimal specific
energy input and an infinitesimal increase in the overall
fineness of the product can be described by the following
equation [30]:
dE ¼ � k Idx
xnð5Þ
where E is the net specific energy input (kW h/t) to a mill, x
is the particle size, k is a proportionality coefficient depending
on the grindability of a material and the efficiency of a mill,
and n is a variant related to the particle size regime. Since a
ground product does not consist of particles with one size, x,
the product fineness has to be described by an appropriate
characteristic particle size, xP, such as x80 (the 80 wt.%
passing size) and x50 (the median size) of its cumulative
particle size distribution, which are convenient characteristic
values for a particle size distribution [17,21]. Integration of
Eq. (5) for n m1 gives the following equation for the specific
energy consumption, E:
E ¼ k
n� 1
1
xn�1m;P
� 1
xn�1m;F
!ð6Þ
where xm ,P is a characteristic size of the particle size
distribution of a ground product and xm,F is the characteristic
size of the particle size distribution of the feed. In this study,
the median size, x50, of a product was chosen as the
characteristic size, xP. It is found that the relationship between
the median size (x50) and the specific energy consumption can
be well described by the following power–law function,
which can be derived for xFHxP, which is valid for ultra-fine
grinding, from Eq. (6):
x50 ¼ CIEm ð7Þwhere
C ¼ k
n� 1
� � 1n�1
;m ¼ � 1
n� 1:
Figs. 1(b), 4(b), 8(b), 14(b) and 16(b) present the
experimental (dots) and predicted (lines) results for the
grinding results under various conditions. Clearly, the particle
size-energy model of Eq. (7) provides a good fit to the
experimental results with a high regression coefficient
(>0.991), regardless of whatever grinding conditions. This
is in agreement with a previous conclusion for dolomite [21].
5. Conclusions
Wet ultra-fine grinding of a limestone powder (<100 Am)
has been investigated in a stirred media mill with respect to the
effect of slurry rheology. The results were evaluated in terms of
energy efficiency and the fineness of a product as functions of
various parameters such as molecular weight of a dispersant,
solids concentration, additive dosage, addition method and
beads load.
A polymeric dispersant, Dispersant S40, with a molecular
weight of 5500 gave a higher energy efficiency and a smaller
product size for wet ultra-fine grinding of the limestone due to
its maintenance of a lower viscosity during grinding. For a
certain media beads load, an optimal solids concentration
existed for the effective grinding. The higher the beads load,
the better the cumulative energy efficiency, the higher the
milling rate, the finer the product fineness at the same specific
energy consumption. At an additive dosage of 0.1 wt.% of
Dispersant S40 or more, a smaller additive amount gave a
higher energy efficiency and a smaller product size at a given
specific energy consumption in a lower level of specific energy
input. The excessive additive could cause a cushion layer
formed on the surface of the milling beads and thus lowered
stress intensities from the collisions of the beads, causing the
ineffective grinding operation. This could be avoided by the
multi-point addition of the dispersant or by a higher beads load
(�83 vol.%). The wet ultra-fine grinding operation in the
stirred media mill ceased when a discharge slurry from the mill
displayed a pseudoplastic flow with an evident extrapolated
Bingham yield stress. For a given solids concentration of
limestone slurry, the relationships between the specific surface
area and the particle size of an FP product and the additive
amount of Dispersant S40 were explored, respectively. For a
given solids concentration, the particle size and the specific
surface area of an FP product were only related to the additive
amount of Dispersant S40 regardless of other grinding
conditions. Furthermore, a particle size-energy model provided
a good fit (R2>0.991) to the grinding results under the
experimental conditions studied.
Acknowledgements
The financial support from the Swedish National Energy
Administration and Hesselmanska Stiftelsen in Sweden (Min-
Fo’s Process Technology Program) is acknowledged. Professor
Anders Sellgren at the Lulea University of Technology is
appreciated for his valuable suggestions. The authors are also
grateful to Dr. Britt-Marie Antti at the paper mill in Pitea
(Kappa Kraftliner Pitea, Sweden) for her kind help in the slurry
viscosity measurements. Professor Robert Pugh at the Institute
for Surface Chemistry (YKI), Stockholm is acknowledged for
the improvement of English language.
References
[1] C.H. Lofthouse, F.E. Johns, The Svedala (ECC international) Detritor and
the metals industry, Minerals Engineering 12 (1999) 205–217.
M. He et al. / Powder Technology 161 (2006) 10–2120

[2] I.J. Corrans, J.E. Angove, Ultra fine milling for the recovery of refractory
gold, Minerals Engineering 4 (1991) 763–776.
[3] Takashi Hibino, Kazuo Suzuki, Ken-ichi Ushiki, Yoshitaka Kuwahara,
Mitsukuni Mizuo, Ultra-fine grinding of La0I8Sr0I2MnO3 oxide by
vibration mill, Applied Catalysis. A, General 145 (1996) 297–306.
[4] W.G. Schmidt, Ultra-fine grinding of ceramic powders for the sintering
process, Interceram 40 (1991) 15–18.
[5] H. Bel Fadhel, C. Frances, A. Mamourian, Investigations on ultra-fine
grinding of titanium dioxide in a stirred media mill, Powder Technology
105 (1999) 362–373.
[6] Richard Byrappa, Chun-wei Chen, Pavel Shuk, Charles S. Oakes,
Solution synthesis of hydroxyapatite designer particulates, Solid State
Ionics 151 (2002) 393–402.
[7] H. Bel Fadhel, C. Frances, Wet batch grinding of alumina hydrate in a
stirred bead mill, Powder Technology 119 (2001) 257–268.
[8] Arno Kwade, Joerg Schwedes, Breaking characteristics of different
materials and their effect on stress intensity and stress number in stirred
media mills, Powder Technology 122 (2002) 109–121.
[9] M. Akbarieh, R. Tawashi, Morphic features of solid particles after
micronization in the fluid energy mill, International Journal of Pharma-
ceutics 35 (1987) 81–89.
[10] Ian Krycer, John A. Hersey, Fine powder mixing in a vibratory ball mill,
International Journal of Pharmaceutics 6 (1980) 119–129.
[11] Isidor Hirsch, Moshe Hirsch, Joseph Mizrahi, Production of white
carbonate paper-fillers by a new ultra-fine wet grinding technology,
Industrial Minerals (1985 (November)) 67–69.
[12] F. Garcia, N. Le Bolay, C. Frances, Changes of surface and volume
properties of calcite during a batch wet grinding process, Chemical
Engineering Journal 85 (2002) 177–187.
[13] C. Bernhardt, E. Reinsch, K. Husemann, The influence of suspension
properties on ultra-fine grinding in stirred ball mills, Powder Technology
105 (1999) 357–361.
[14] Jie Zheng, Colin C. Harris, P. Somasundaran, The effect of additives
on stirred media milling of limestone, Powder Technology 91 (1997)
173–179.
[15] Prakash C. Kapur, Thomas W. Healy, Peter J. Scales, David V. Boger,
David Wilson, Role of dispersants in kinetics and energetics of stirred
ball mill grinding, International Journal of Mineral Processing 47 (1996)
141–152.
[16] Lutz Blecher, Arno Kwade, Jorg Schwedes, Motion and stress intensity
of grinding beads in a stirred media mill, Part 1: Energy density
distribution and motion of single grinding beads, Powder Technology 86
(1996) 59–68.
[17] Arno Kwade, Lutz Blecher, Jorg Schwedes, Motion and stress intensity of
grinding beads in a stirred media mill, Part 2: Stress intensity and its effect
on comminution, Powder Technology 86 (1996) 69–76.
[18] Arno Kwade, Wet comminution in stirred media mills — research and its
practical application, Powder Technology 105 (1999) 14–20.
[19] Arno Kwade, Determination of the most important grinding mechanism in
stirred media mills by calculating stress intensity and stress number,
Powder Technology 105 (1999) 382–388.
[20] J. Theuerkauf, J. Schwedes, Theoretical and experimental investigation on
particle and fluid motion in stirred media mills, Powder Technology 105
(1999) 406–412.
[21] Mingwei Gao, Eric Forssberg, Prediction of product size distributions for
a stirred ball mill, Powder Technology 84 (1995) 101–106.
[22] T.H. Muster, C.A. Prestidge, Rheological investigations of sulphide
mineral slurries, Minerals Engineering 8 (1995) 1541–1555.
[23] R.R. Klimpel, The selection of wet grinding chemical additives based on
slurry rheology control, Powder Technology 105 (1999) 430–435.
[24] M. Gao, E. Forssberg, The influence of slurry rheology on ultra-
fine grinding in a stirred ball mill, 18th International Mineral
Processing Congress, Sydney, CA (Conference Article), Australian,
1993, pp. 237–244.
[25] R. Greenwood, N. Rowson, S. Kingman, G. Brown, A new method for
determining the optimum dispersant concentration in aqueous grinding,
Powder Technology 123 (2002) 199–207.
[26] E. Reinisch, C. Bernhardt, K. Husemann, The influence of additives
during wet ultra-fine grinding in agitator bead mills, Part 1: General
principles and experimental, Ceramic Forum International: Berichte der
Deutschen Keramischen Gesellschaft 78 (3) (2001) E38–E42.
[27] E. Reinisch, C. Bernhardt, K. Husemann, The influence of additives
during wet ultra-fine grinding in agitator bead mills, Part 2: Results and
conclusions, Ceramic Forum International: Berichte der Deutschen
Keramischen Gesellschaft 78 (4) (2001) E36–E40.
[28] L. Blecher, J. Schwedes, Energy distribution and particle trajectories in a
grinding chamber of a stirred ball mill, International Journal of Mineral
Processing 44-45 (1996) 617–627.
[29] Ming-wei Gao, Keith Weller, Fine grinding in mineral processing using
stirred ball mills, Chemical Engineering in Australia 18 (2) (1993) 8–12.
[30] L.G. Austin, R.R. Klimpel, P.T. Luckie, Process Engineering of Size
Reduction: Ball Milling, Pub. By Society of Mining Engineers, New York,
1984, (ISBN 0-89520-421-5).
[31] Mingzhao He, Slurry rheology of limestone and its effects on wet ultra-
fine grinding, Licentiate Thesis; Lulea University of Technology, Lulea,
Sweden, 2005 (2005:06; ISSN: 1402-1757).
[32] N. Stehr, C. Weyand, Control System for Agitated Media Mills, in: K.
Schonert (Ed.), 7th European symposium of comminution: Part 2,
Ljubljana, 1990, pp. 681–695.
[33] Ming-wei Gao, Eric Forssberg, A study on the effect of parameters in
stirred ball milling, International Journal of Mineral Processing 37 (1993)
45–59.
[34] Mingzhao He, Yanmin Wang, Eric Forssberg, Slurry rheology in wet
ultrafine grinding of industrial minerals: a review, Powder Technology
147 (2004) 94–112.
[35] Y. Wang, E. Forssberg, Dispersants in stirred ball mill grinding, Kona 13
(1995) 67–77.
[36] M.W. Gao, E. Forssberg, Increasing the specific surface area of dolomite
by stirred ball milling, in: S.K. Kawatra (Ed.), Comminution — Theory
and Practice Symposium, Phoenix, AZ. SME, Society for Mining,
Metallurgy and Exploration, Littleton, CO, 1992, pp. 153–170.
M. He et al. / Powder Technology 161 (2006) 10–21 21

Paper 4
Influence of slurry rheology on stirred media milling of
quartzite
International Journal of Mineral Processing, 84 (2007) 240-251
Reprinted from International Journal of Mineral Processing with permission from Elsevier (copyright 2007).

Author's personal copy
Influence of slurry rheology on stirred media milling of quartzite
Mingzhao He ⁎, Eric Forssberg
Division of Mineral Processing, Luleå University of Technology, SE-971 87, Luleå, Sweden
Received 24 March 2006; received in revised form 14 August 2006; accepted 14 August 2006Available online 20 September 2006
Abstract
The role of slurry rheology in stirred media milling of quartzite has been investigated by varying important grinding parameterssuch as media bead density and size, addition of chemicals, solids concentration, stirrer rotational speed as well as the combinedeffect of these factors. Media bead density has an evident but complex effect on stirred milling performance, depending on stirrerrotational speed and solids concentration. The effect of media bead size on the ultra-fine grinding of quartzite is relevant to the feedsize. Optimal ratio of media bead size to the median size of a feed is between 150 and 200. The combined effect of grinding beadsize and stirrer speed or solids concentration is insignificant. The addition of Dispersant S40 or a lower solids concentration resultsin better grinding performance (i.e., a higher energy efficiency and a smaller median size) due to the maintenance of lowerviscosities at shear rates investigated during grinding. Stirrer rotational speed interacts with solids concentration. For a given solidsconcentration, an optimal stirrer speed exists. The observed phenomena can be explained by the interaction of slurry rheology andthe stress intensity of individual grinding bead.
In addition, an empirical particle size-energy model provides a good fit (R2N0.904) to the grinding results under theexperimental conditions investigated. Furthermore, the wear of grinding media beads is involved. ZrO2 beads have a lowest wearrate whereas the wear of SiO2 beads is most serious. The wear rate of Al2O3 beads is related to bead size.© 2006 Elsevier B.V. All rights reserved.
Keywords: Wet ultra-fine grinding; Stirred media mill; Slurry rheology; Quartzite; Chemicals; Ultra-fine particle
1. Introduction
Due to some advanced properties of ultra-finepowders, such as surface chemistry, packing character-istics, strength, optical properties and reaction kinetics,and an increasing demand for ultra-fine powders forindustries, wet ultra-fine grinding has found increaseduse in many fields such as minerals, ceramic materials,
pigments, chemical products, microorganisms, pharma-ceutics, papermaking. Most of the mills used in wetultra-fine grinding are stirred media mills due to theirhigh unit throughput and energy efficiency (Bernhardtet al., 1999; Zheng et al., 1997; Kapur et al., 1996;Blecher et al., 1996). The stirred media mills areequipped with a stationary grinding chamber and a high-speed stirrer (disks or pins) fixed on a drive shaft. Thegrinding chamber is filled with small grinding media(normally spherical annealed glass, steel, or ceramicbeads) at a high bead load. By stirring a slurry-beadmixture at a high stirring speed, a characteristic flowpattern and a grinding action are generated in the
Int. J. Miner. Process. 84 (2007) 240–251www.elsevier.com/locate/ijminpro
⁎ Corresponding author. Present address: Ian Wark ResearchInstitute, University of South Australia, Mawson Lakes, Adelaide,SA 5095, Australia. Tel.: +61 8 83023692; Fax: +61 8 83023683.
E-mail address: [email protected] (M. He).
0301-7516/$ - see front matter © 2006 Elsevier B.V. All rights reserved.doi:10.1016/j.minpro.2006.08.001
Author's personal copy
chamber. The respective kind of flow determines thespatial distribution of zones with high grinding intensityand the predominant types of grinding mechanisms aswell as their composition (Blecher et al., 1996; Kwadeet al., 1996). Thus, the predominant grinding mechan-isms in stirred media mills are dependent on compres-sional, shear and torsional stresses, which are invokedby stirring the slurry-bead mixture at a very high veloc-ity (Blecher et al., 1996; Kwade et al., 1996; Theuerkaufand Schwedes, 1999; Gao and Forssberg, 1995). Theeffective grinding motions of the mixture are correlatedto its flow behaviour in the grinding chamber.
From a diagnostic point of view, the rheologicalbehaviour of a mineral slurry is indicative of the level ofinterparticle interaction or aggregation in the slurry.Therefore, it is a useful variable to be controlled inindustrial processes such as transportation of slurries,dewatering and wet grinding (Muster and Prestidge,1995). Physical and chemical properties of a slurry, suchas solids concentration, use of dispersants, particle sizeand distribution, particle shape, pH value, shear rate,and slurry temperature, have a significant influence onthe slurry rheology due to the change or modification insurface property (He et al., 2004).
Since the product fineness significantly increaseswith grinding time in wet ultra-fine grinding operationcharacterized by a very fine product size and a highsolids concentration, the surface properties tend topredominate in the system (Bernhardt et al., 1999;Zheng et al., 1997; Klimpel, 1999). Inter-particle forces,such as van der Waals forces (Greenwood et al., 2002;Reinisch et al., 2001) and electrostatic forces (Bernhardtet al., 1999; Muster and Prestidge, 1995), lead to theformation of agglomeration and aggregation. Thisresults in changes in rheological property in wet ultra-fine grinding operations. The effect of slurry flowabilityin wet ultra-fine grinding becomes particularly impor-tant. The optimization of the rheological behaviour of aground slurry can enhance the energy efficiency andthroughput in wet ultra-fine grinding operations. Forinstance, the addition of an optimum dispersant to agiven feed slurry can result in a drastic reduction or evenelimination of yield stress and permits a higher solidsconcentration of a ground slurry (He et al., 2006b;Klimpel, 1999; Greenwood et al., 2002; Reinisch et al.,2001). In the absence of any dispersant, the typical
maximum percentage solids in a slurry is approximately27.4% by volume for the feed of ultra-fine grinding instirred media mills, whereas an upper limitation of solidsconcentration is up to 60.15 vol.% in the presence of anoptimal dispersant (Greenwood et al., 2002). Therefore,the improvement of rheological behaviours of a feedslurry with the addition of a suitable dispersant canenhance the productivity and throughput for wet ultra-fine grinding.
However there is still little understanding of slurryrheology relevant to wet ultra-fine grinding character-ized by the presence of excessive fineness and a highslurry concentration due to the complex slurry rheolog-ical behaviours in stirred media mills (Gao andForssberg, 1993a; Blecher and Schwedes, 1996). Theobjective of this work is to study the role of slurryrheology in stirred media milling of quartzite by varyingimportant grinding parameters such as media bead den-sity and size, addition of chemicals, solids concentration,stirrer rotational speed as well as the combined effect ofsome factors. The grinding results were evaluated byenergy efficiency and the median size of a ground prod-uct with respect to specific energy consumption.
2. Materials and experimental procedures
2.1. Materials
A quartzite material (94.52% SiO2) with a realdensity of 2710 kg/m3 (Density meter called Multivol-ume Pycnometer 1305, Micromeritics Instrument Cor-poration, USA) was provided by LKAB, Sweden andwas used for grinding experiments in this study. Thechemical analysis and particle size distribution of thequartzite material are presented in Table 1 and Fig. 1,respectively. Dispersant S40 (Sodium polyacrylate)from CDM AB, Sweden and Genamin CC 100 (C8–C18 amine, alias: Flotigam P) from Clariant GmbH,Germany were selected as dispersants.
2.2. Experimental procedures
2.2.1. Mix-upA quartzite-water slurry was prepared at a predeter-
mined solids concentration by the addition of 40 to 50 kgof quartzite powder into a certain amount of water to
Table 1Chemical analysis of quartzite composition
Main chemical composition SiO2 Al2O3 TiO2 MnO MgO CaO Na2O K2O V2O5 P2O5 FexOy
Percent (%) 94.52 0.65 0.04 0.01 0.53 0.24 b0.001 0.132 0.01 0.041 3.71
241M. He, E. Forssberg / Int. J. Miner. Process. 84 (2007) 240–251
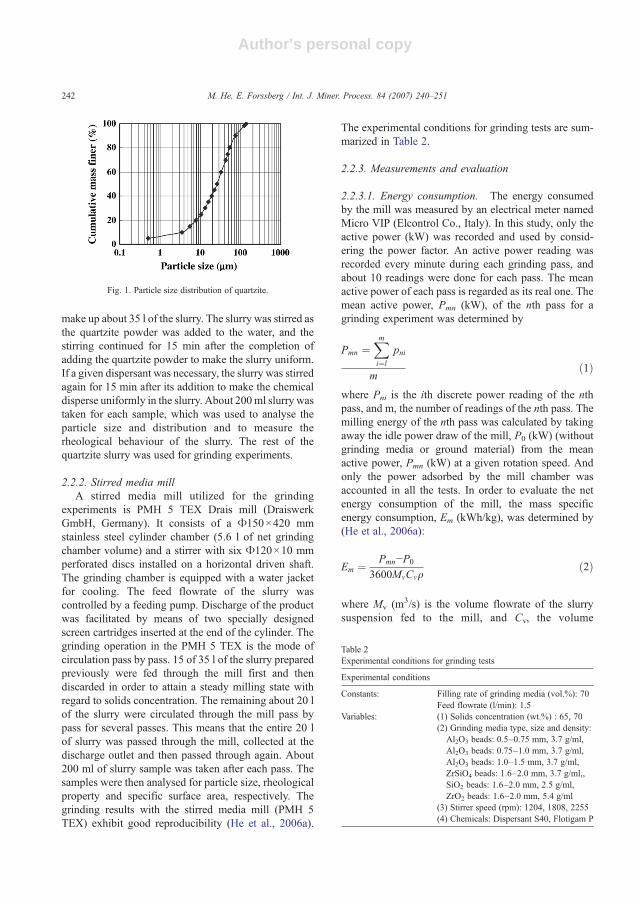
Author's personal copy
make up about 35 l of the slurry. The slurry was stirred asthe quartzite powder was added to the water, and thestirring continued for 15 min after the completion ofadding the quartzite powder to make the slurry uniform.If a given dispersant was necessary, the slurry was stirredagain for 15 min after its addition to make the chemicaldisperse uniformly in the slurry. About 200ml slurry wastaken for each sample, which was used to analyse theparticle size and distribution and to measure therheological behaviour of the slurry. The rest of thequartzite slurry was used for grinding experiments.
2.2.2. Stirred media millA stirred media mill utilized for the grinding
experiments is PMH 5 TEX Drais mill (DraiswerkGmbH, Germany). It consists of a Φ150×420 mmstainless steel cylinder chamber (5.6 l of net grindingchamber volume) and a stirrer with six Φ120×10 mmperforated discs installed on a horizontal driven shaft.The grinding chamber is equipped with a water jacketfor cooling. The feed flowrate of the slurry wascontrolled by a feeding pump. Discharge of the productwas facilitated by means of two specially designedscreen cartridges inserted at the end of the cylinder. Thegrinding operation in the PMH 5 TEX is the mode ofcirculation pass by pass. 15 of 35 l of the slurry preparedpreviously were fed through the mill first and thendiscarded in order to attain a steady milling state withregard to solids concentration. The remaining about 20 lof the slurry were circulated through the mill pass bypass for several passes. This means that the entire 20 lof slurry was passed through the mill, collected at thedischarge outlet and then passed through again. About200 ml of slurry sample was taken after each pass. Thesamples were then analysed for particle size, rheologicalproperty and specific surface area, respectively. Thegrinding results with the stirred media mill (PMH 5TEX) exhibit good reproducibility (He et al., 2006a).
The experimental conditions for grinding tests are sum-marized in Table 2.
2.2.3. Measurements and evaluation
2.2.3.1. Energy consumption. The energy consumedby the mill was measured by an electrical meter namedMicro VIP (Elcontrol Co., Italy). In this study, only theactive power (kW) was recorded and used by consid-ering the power factor. An active power reading wasrecorded every minute during each grinding pass, andabout 10 readings were done for each pass. The meanactive power of each pass is regarded as its real one. Themean active power, Pmn (kW), of the nth pass for agrinding experiment was determined by
Pmn ¼Xmi¼l
pni
mð1Þ
where Pni is the ith discrete power reading of the nthpass, and m, the number of readings of the nth pass. Themilling energy of the nth pass was calculated by takingaway the idle power draw of the mill, P0 (kW) (withoutgrinding media or ground material) from the meanactive power, Pmn (kW) at a given rotation speed. Andonly the power adsorbed by the mill chamber wasaccounted in all the tests. In order to evaluate the netenergy consumption of the mill, the mass specificenergy consumption, Em (kWh/kg), was determined by(He et al., 2006a):
Em ¼ Pmn−P0
3600MmCmqð2Þ
where Mv (m3/s) is the volume flowrate of the slurrysuspension fed to the mill, and Cv, the volume
Table 2Experimental conditions for grinding tests
Experimental conditions
Constants: Filling rate of grinding media (vol.%): 70Feed flowrate (l/min): 1.5
Variables: (1) Solids concentration (wt.%) : 65, 70(2) Grinding media type, size and density:
Al2O3 beads: 0.5–0.75 mm, 3.7 g/ml,Al2O3 beads: 0.75–1.0 mm, 3.7 g/ml,Al2O3 beads: 1.0–1.5 mm, 3.7 g/ml,ZrSiO4 beads: 1.6–2.0 mm, 3.7 g/ml,,SiO2 beads: 1.6–2.0 mm, 2.5 g/ml,ZrO2 beads: 1.6–2.0 mm, 5.4 g/ml
(3) Stirrer speed (rpm): 1204, 1808, 2255(4) Chemicals: Dispersant S40, Flotigam P
Fig. 1. Particle size distribution of quartzite.
242 M. He, E. Forssberg / Int. J. Miner. Process. 84 (2007) 240–251
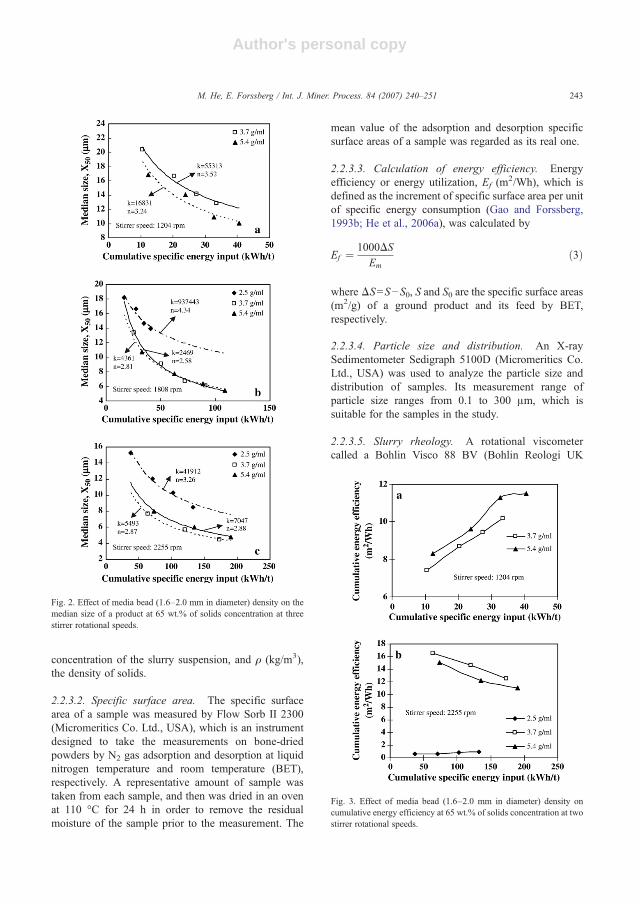
Author's personal copy
concentration of the slurry suspension, and ρ (kg/m3),the density of solids.
2.2.3.2. Specific surface area. The specific surfacearea of a sample was measured by Flow Sorb II 2300(Micromeritics Co. Ltd., USA), which is an instrumentdesigned to take the measurements on bone-driedpowders by N2 gas adsorption and desorption at liquidnitrogen temperature and room temperature (BET),respectively. A representative amount of sample wastaken from each sample, and then was dried in an ovenat 110 °C for 24 h in order to remove the residualmoisture of the sample prior to the measurement. The
mean value of the adsorption and desorption specificsurface areas of a sample was regarded as its real one.
2.2.3.3. Calculation of energy efficiency. Energyefficiency or energy utilization, Ef (m
2/Wh), which isdefined as the increment of specific surface area per unitof specific energy consumption (Gao and Forssberg,1993b; He et al., 2006a), was calculated by
Ef ¼ 1000DSEm
ð3Þ
where ΔS=S−S0, S and S0 are the specific surface areas(m2/g) of a ground product and its feed by BET,respectively.
2.2.3.4. Particle size and distribution. An X-raySedimentometer Sedigraph 5100D (Micromeritics Co.Ltd., USA) was used to analyze the particle size anddistribution of samples. Its measurement range ofparticle size ranges from 0.1 to 300 μm, which issuitable for the samples in the study.
2.2.3.5. Slurry rheology. A rotational viscometercalled a Bohlin Visco 88 BV (Bohlin Reologi UK
Fig. 2. Effect of media bead (1.6–2.0 mm in diameter) density on themedian size of a product at 65 wt.% of solids concentration at threestirrer rotational speeds.
Fig. 3. Effect of media bead (1.6–2.0 mm in diameter) density oncumulative energy efficiency at 65 wt.% of solids concentration at twostirrer rotational speeds.
243M. He, E. Forssberg / Int. J. Miner. Process. 84 (2007) 240–251
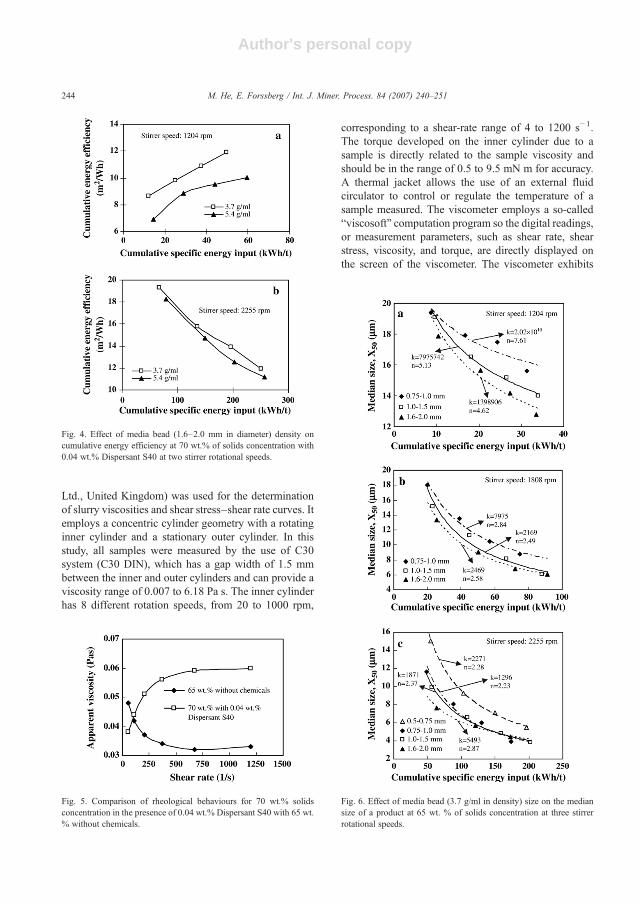
Author's personal copy
Ltd., United Kingdom) was used for the determinationof slurry viscosities and shear stress–shear rate curves. Itemploys a concentric cylinder geometry with a rotatinginner cylinder and a stationary outer cylinder. In thisstudy, all samples were measured by the use of C30system (C30 DIN), which has a gap width of 1.5 mmbetween the inner and outer cylinders and can provide aviscosity range of 0.007 to 6.18 Pa s. The inner cylinderhas 8 different rotation speeds, from 20 to 1000 rpm,
corresponding to a shear-rate range of 4 to 1200 s−1.The torque developed on the inner cylinder due to asample is directly related to the sample viscosity andshould be in the range of 0.5 to 9.5 mN m for accuracy.A thermal jacket allows the use of an external fluidcirculator to control or regulate the temperature of asample measured. The viscometer employs a so-called“viscosoft” computation program so the digital readings,or measurement parameters, such as shear rate, shearstress, viscosity, and torque, are directly displayed onthe screen of the viscometer. The viscometer exhibits
Fig. 4. Effect of media bead (1.6–2.0 mm in diameter) density oncumulative energy efficiency at 70 wt.% of solids concentration with0.04 wt.% Dispersant S40 at two stirrer rotational speeds.
Fig. 5. Comparison of rheological behaviours for 70 wt.% solidsconcentration in the presence of 0.04 wt.% Dispersant S40 with 65 wt.% without chemicals.
Fig. 6. Effect of media bead (3.7 g/ml in density) size on the mediansize of a product at 65 wt. % of solids concentration at three stirrerrotational speeds.
244 M. He, E. Forssberg / Int. J. Miner. Process. 84 (2007) 240–251
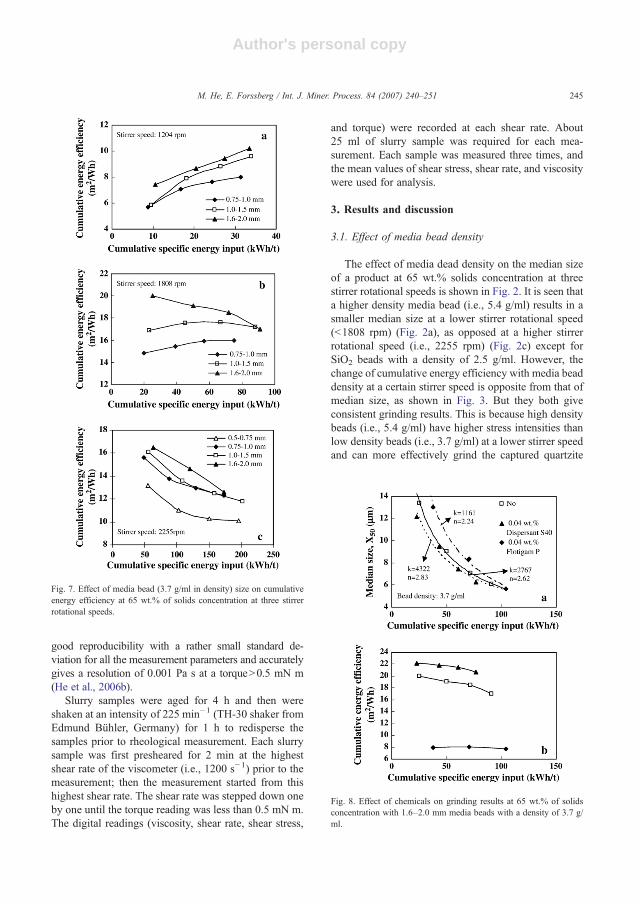
Author's personal copy
good reproducibility with a rather small standard de-viation for all the measurement parameters and accuratelygives a resolution of 0.001 Pa s at a torqueN0.5 mN m(He et al., 2006b).
Slurry samples were aged for 4 h and then wereshaken at an intensity of 225 min−1 (TH-30 shaker fromEdmund Bühler, Germany) for 1 h to redisperse thesamples prior to rheological measurement. Each slurrysample was first presheared for 2 min at the highestshear rate of the viscometer (i.e., 1200 s−1) prior to themeasurement; then the measurement started from thishighest shear rate. The shear rate was stepped down oneby one until the torque reading was less than 0.5 mN m.The digital readings (viscosity, shear rate, shear stress,
and torque) were recorded at each shear rate. About25 ml of slurry sample was required for each mea-surement. Each sample was measured three times, andthe mean values of shear stress, shear rate, and viscositywere used for analysis.
3. Results and discussion
3.1. Effect of media bead density
The effect of media dead density on the median sizeof a product at 65 wt.% solids concentration at threestirrer rotational speeds is shown in Fig. 2. It is seen thata higher density media bead (i.e., 5.4 g/ml) results in asmaller median size at a lower stirrer rotational speed(b1808 rpm) (Fig. 2a), as opposed at a higher stirrerrotational speed (i.e., 2255 rpm) (Fig. 2c) except forSiO2 beads with a density of 2.5 g/ml. However, thechange of cumulative energy efficiency with media beaddensity at a certain stirrer speed is opposite from that ofmedian size, as shown in Fig. 3. But they both giveconsistent grinding results. This is because high densitybeads (i.e., 5.4 g/ml) have higher stress intensities thanlow density beads (i.e., 3.7 g/ml) at a lower stirrer speedand can more effectively grind the captured quartzite
Fig. 7. Effect of media bead (3.7 g/ml in density) size on cumulativeenergy efficiency at 65 wt.% of solids concentration at three stirrerrotational speeds.
Fig. 8. Effect of chemicals on grinding results at 65 wt.% of solidsconcentration with 1.6–2.0 mm media beads with a density of 3.7 g/ml.
245M. He, E. Forssberg / Int. J. Miner. Process. 84 (2007) 240–251
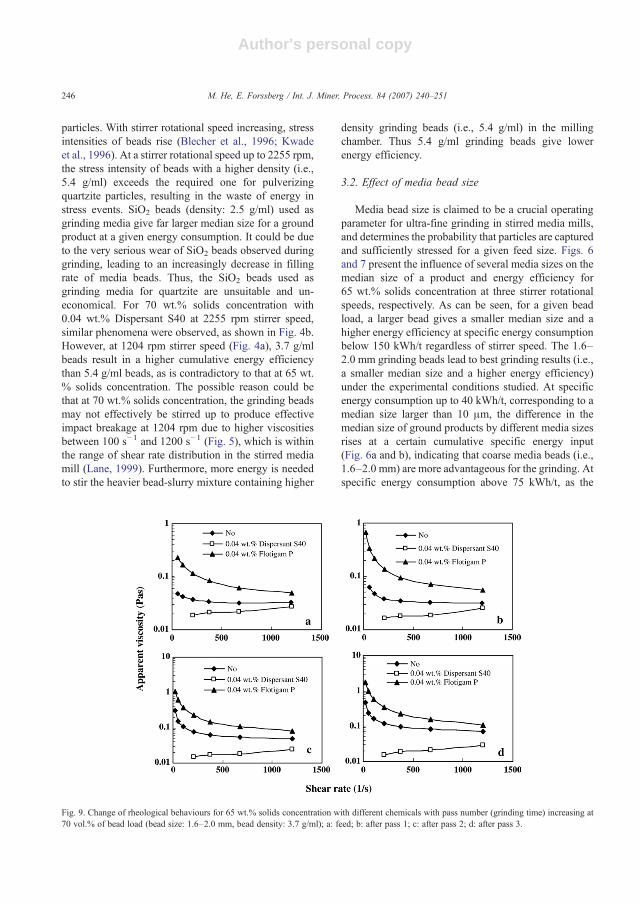
Author's personal copy
particles. With stirrer rotational speed increasing, stressintensities of beads rise (Blecher et al., 1996; Kwadeet al., 1996). At a stirrer rotational speed up to 2255 rpm,the stress intensity of beads with a higher density (i.e.,5.4 g/ml) exceeds the required one for pulverizingquartzite particles, resulting in the waste of energy instress events. SiO2 beads (density: 2.5 g/ml) used asgrinding media give far larger median size for a groundproduct at a given energy consumption. It could be dueto the very serious wear of SiO2 beads observed duringgrinding, leading to an increasingly decrease in fillingrate of media beads. Thus, the SiO2 beads used asgrinding media for quartzite are unsuitable and un-economical. For 70 wt.% solids concentration with0.04 wt.% Dispersant S40 at 2255 rpm stirrer speed,similar phenomena were observed, as shown in Fig. 4b.However, at 1204 rpm stirrer speed (Fig. 4a), 3.7 g/mlbeads result in a higher cumulative energy efficiencythan 5.4 g/ml beads, as is contradictory to that at 65 wt.% solids concentration. The possible reason could bethat at 70 wt.% solids concentration, the grinding beadsmay not effectively be stirred up to produce effectiveimpact breakage at 1204 rpm due to higher viscositiesbetween 100 s−1 and 1200 s−1 (Fig. 5), which is withinthe range of shear rate distribution in the stirred mediamill (Lane, 1999). Furthermore, more energy is neededto stir the heavier bead-slurry mixture containing higher
density grinding beads (i.e., 5.4 g/ml) in the millingchamber. Thus 5.4 g/ml grinding beads give lowerenergy efficiency.
3.2. Effect of media bead size
Media bead size is claimed to be a crucial operatingparameter for ultra-fine grinding in stirred media mills,and determines the probability that particles are capturedand sufficiently stressed for a given feed size. Figs. 6and 7 present the influence of several media sizes on themedian size of a product and energy efficiency for65 wt.% solids concentration at three stirrer rotationalspeeds, respectively. As can be seen, for a given beadload, a larger bead gives a smaller median size and ahigher energy efficiency at specific energy consumptionbelow 150 kWh/t regardless of stirrer speed. The 1.6–2.0 mm grinding beads lead to best grinding results (i.e.,a smaller median size and a higher energy efficiency)under the experimental conditions studied. At specificenergy consumption up to 40 kWh/t, corresponding to amedian size larger than 10 μm, the difference in themedian size of ground products by different media sizesrises at a certain cumulative specific energy input(Fig. 6a and b), indicating that coarse media beads (i.e.,1.6–2.0 mm) are more advantageous for the grinding. Atspecific energy consumption above 75 kWh/t, as the
Fig. 9. Change of rheological behaviours for 65 wt.% solids concentration with different chemicals with pass number (grinding time) increasing at70 vol.% of bead load (bead size: 1.6–2.0 mm, bead density: 3.7 g/ml); a: feed; b: after pass 1; c: after pass 2; d: after pass 3.
246 M. He, E. Forssberg / Int. J. Miner. Process. 84 (2007) 240–251
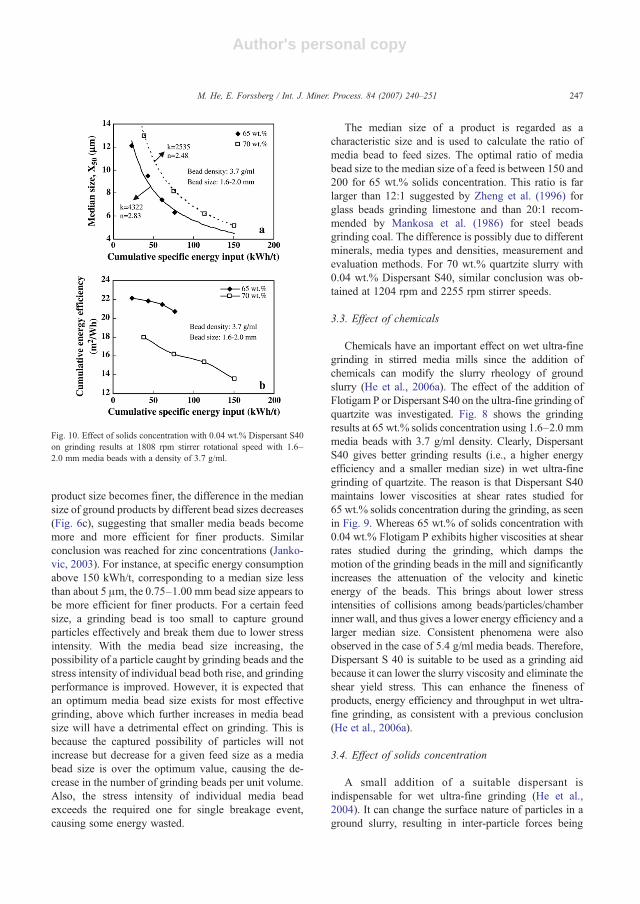
Author's personal copy
product size becomes finer, the difference in the mediansize of ground products by different bead sizes decreases(Fig. 6c), suggesting that smaller media beads becomemore and more efficient for finer products. Similarconclusion was reached for zinc concentrations (Janko-vic, 2003). For instance, at specific energy consumptionabove 150 kWh/t, corresponding to a median size lessthan about 5 μm, the 0.75–1.00 mm bead size appears tobe more efficient for finer products. For a certain feedsize, a grinding bead is too small to capture groundparticles effectively and break them due to lower stressintensity. With the media bead size increasing, thepossibility of a particle caught by grinding beads and thestress intensity of individual bead both rise, and grindingperformance is improved. However, it is expected thatan optimum media bead size exists for most effectivegrinding, above which further increases in media beadsize will have a detrimental effect on grinding. This isbecause the captured possibility of particles will notincrease but decrease for a given feed size as a mediabead size is over the optimum value, causing the de-crease in the number of grinding beads per unit volume.Also, the stress intensity of individual media beadexceeds the required one for single breakage event,causing some energy wasted.
The median size of a product is regarded as acharacteristic size and is used to calculate the ratio ofmedia bead to feed sizes. The optimal ratio of mediabead size to the median size of a feed is between 150 and200 for 65 wt.% solids concentration. This ratio is farlarger than 12:1 suggested by Zheng et al. (1996) forglass beads grinding limestone and than 20:1 recom-mended by Mankosa et al. (1986) for steel beadsgrinding coal. The difference is possibly due to differentminerals, media types and densities, measurement andevaluation methods. For 70 wt.% quartzite slurry with0.04 wt.% Dispersant S40, similar conclusion was ob-tained at 1204 rpm and 2255 rpm stirrer speeds.
3.3. Effect of chemicals
Chemicals have an important effect on wet ultra-finegrinding in stirred media mills since the addition ofchemicals can modify the slurry rheology of groundslurry (He et al., 2006a). The effect of the addition ofFlotigam P or Dispersant S40 on the ultra-fine grinding ofquartzite was investigated. Fig. 8 shows the grindingresults at 65 wt.% solids concentration using 1.6–2.0 mmmedia beads with 3.7 g/ml density. Clearly, DispersantS40 gives better grinding results (i.e., a higher energyefficiency and a smaller median size) in wet ultra-finegrinding of quartzite. The reason is that Dispersant S40maintains lower viscosities at shear rates studied for65 wt.% solids concentration during the grinding, as seenin Fig. 9. Whereas 65 wt.% of solids concentration with0.04 wt.% Flotigam P exhibits higher viscosities at shearrates studied during the grinding, which damps themotion of the grinding beads in the mill and significantlyincreases the attenuation of the velocity and kineticenergy of the beads. This brings about lower stressintensities of collisions among beads/particles/chamberinner wall, and thus gives a lower energy efficiency and alarger median size. Consistent phenomena were alsoobserved in the case of 5.4 g/ml media beads. Therefore,Dispersant S 40 is suitable to be used as a grinding aidbecause it can lower the slurry viscosity and eliminate theshear yield stress. This can enhance the fineness ofproducts, energy efficiency and throughput in wet ultra-fine grinding, as consistent with a previous conclusion(He et al., 2006a).
3.4. Effect of solids concentration
A small addition of a suitable dispersant isindispensable for wet ultra-fine grinding (He et al.,2004). It can change the surface nature of particles in aground slurry, resulting in inter-particle forces being
Fig. 10. Effect of solids concentration with 0.04 wt.% Dispersant S40on grinding results at 1808 rpm stirrer rotational speed with 1.6–2.0 mm media beads with a density of 3.7 g/ml.
247M. He, E. Forssberg / Int. J. Miner. Process. 84 (2007) 240–251
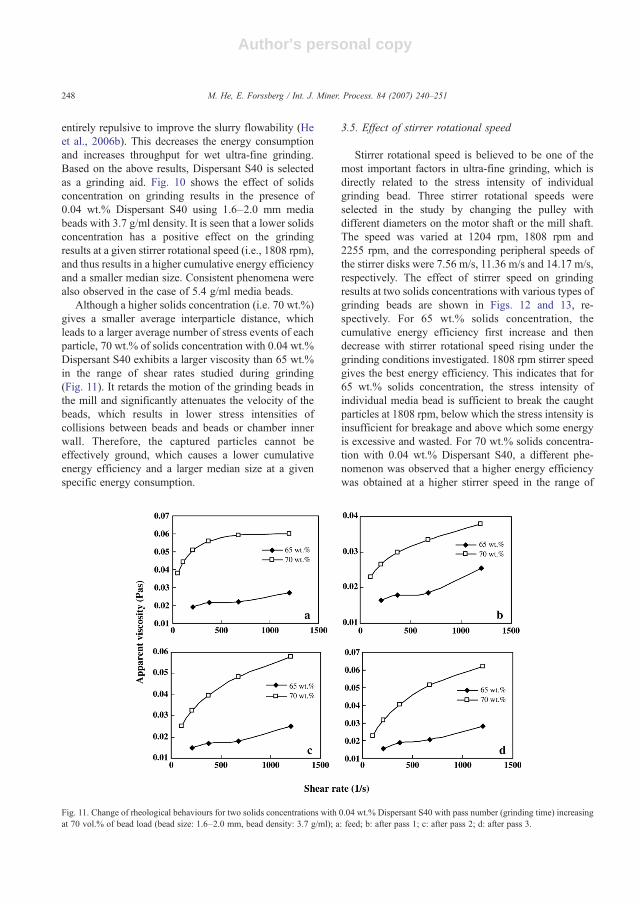
Author's personal copy
entirely repulsive to improve the slurry flowability (Heet al., 2006b). This decreases the energy consumptionand increases throughput for wet ultra-fine grinding.Based on the above results, Dispersant S40 is selectedas a grinding aid. Fig. 10 shows the effect of solidsconcentration on grinding results in the presence of0.04 wt.% Dispersant S40 using 1.6–2.0 mm mediabeads with 3.7 g/ml density. It is seen that a lower solidsconcentration has a positive effect on the grindingresults at a given stirrer rotational speed (i.e., 1808 rpm),and thus results in a higher cumulative energy efficiencyand a smaller median size. Consistent phenomena werealso observed in the case of 5.4 g/ml media beads.
Although a higher solids concentration (i.e. 70 wt.%)gives a smaller average interparticle distance, whichleads to a larger average number of stress events of eachparticle, 70 wt.% of solids concentration with 0.04 wt.%Dispersant S40 exhibits a larger viscosity than 65 wt.%in the range of shear rates studied during grinding(Fig. 11). It retards the motion of the grinding beads inthe mill and significantly attenuates the velocity of thebeads, which results in lower stress intensities ofcollisions between beads and beads or chamber innerwall. Therefore, the captured particles cannot beeffectively ground, which causes a lower cumulativeenergy efficiency and a larger median size at a givenspecific energy consumption.
3.5. Effect of stirrer rotational speed
Stirrer rotational speed is believed to be one of themost important factors in ultra-fine grinding, which isdirectly related to the stress intensity of individualgrinding bead. Three stirrer rotational speeds wereselected in the study by changing the pulley withdifferent diameters on the motor shaft or the mill shaft.The speed was varied at 1204 rpm, 1808 rpm and2255 rpm, and the corresponding peripheral speeds ofthe stirrer disks were 7.56 m/s, 11.36 m/s and 14.17 m/s,respectively. The effect of stirrer speed on grindingresults at two solids concentrations with various types ofgrinding beads are shown in Figs. 12 and 13, re-spectively. For 65 wt.% solids concentration, thecumulative energy efficiency first increase and thendecrease with stirrer rotational speed rising under thegrinding conditions investigated. 1808 rpm stirrer speedgives the best energy efficiency. This indicates that for65 wt.% solids concentration, the stress intensity ofindividual media bead is sufficient to break the caughtparticles at 1808 rpm, below which the stress intensity isinsufficient for breakage and above which some energyis excessive and wasted. For 70 wt.% solids concentra-tion with 0.04 wt.% Dispersant S40, a different phe-nomenon was observed that a higher energy efficiencywas obtained at a higher stirrer speed in the range of
Fig. 11. Change of rheological behaviours for two solids concentrations with 0.04 wt.% Dispersant S40 with pass number (grinding time) increasingat 70 vol.% of bead load (bead size: 1.6–2.0 mm, bead density: 3.7 g/ml); a: feed; b: after pass 1; c: after pass 2; d: after pass 3.
248 M. He, E. Forssberg / Int. J. Miner. Process. 84 (2007) 240–251
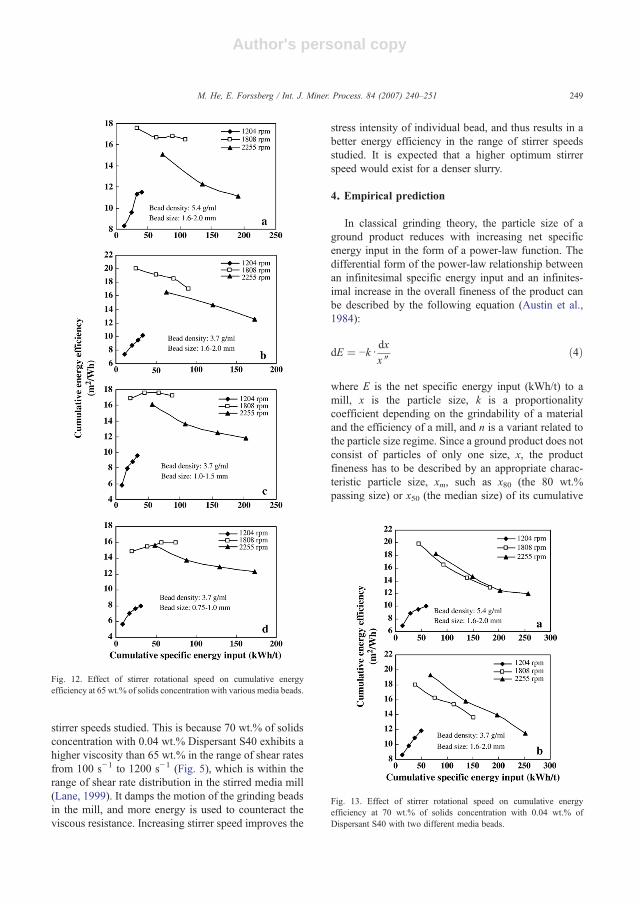
Author's personal copy
stirrer speeds studied. This is because 70 wt.% of solidsconcentration with 0.04 wt.% Dispersant S40 exhibits ahigher viscosity than 65 wt.% in the range of shear ratesfrom 100 s−1 to 1200 s−1 (Fig. 5), which is within therange of shear rate distribution in the stirred media mill(Lane, 1999). It damps the motion of the grinding beadsin the mill, and more energy is used to counteract theviscous resistance. Increasing stirrer speed improves the
stress intensity of individual bead, and thus results in abetter energy efficiency in the range of stirrer speedsstudied. It is expected that a higher optimum stirrerspeed would exist for a denser slurry.
4. Empirical prediction
In classical grinding theory, the particle size of aground product reduces with increasing net specificenergy input in the form of a power-law function. Thedifferential form of the power-law relationship betweenan infinitesimal specific energy input and an infinites-imal increase in the overall fineness of the product canbe described by the following equation (Austin et al.,1984):
dE ¼ −kddxx W
ð4Þ
where E is the net specific energy input (kWh/t) to amill, x is the particle size, k is a proportionalitycoefficient depending on the grindability of a materialand the efficiency of a mill, and n is a variant related tothe particle size regime. Since a ground product does notconsist of particles of only one size, x, the productfineness has to be described by an appropriate charac-teristic particle size, xm, such as x80 (the 80 wt.%passing size) or x50 (the median size) of its cumulative
Fig. 12. Effect of stirrer rotational speed on cumulative energyefficiency at 65 wt.% of solids concentration with various media beads.
Fig. 13. Effect of stirrer rotational speed on cumulative energyefficiency at 70 wt.% of solids concentration with 0.04 wt.% ofDispersant S40 with two different media beads.
249M. He, E. Forssberg / Int. J. Miner. Process. 84 (2007) 240–251
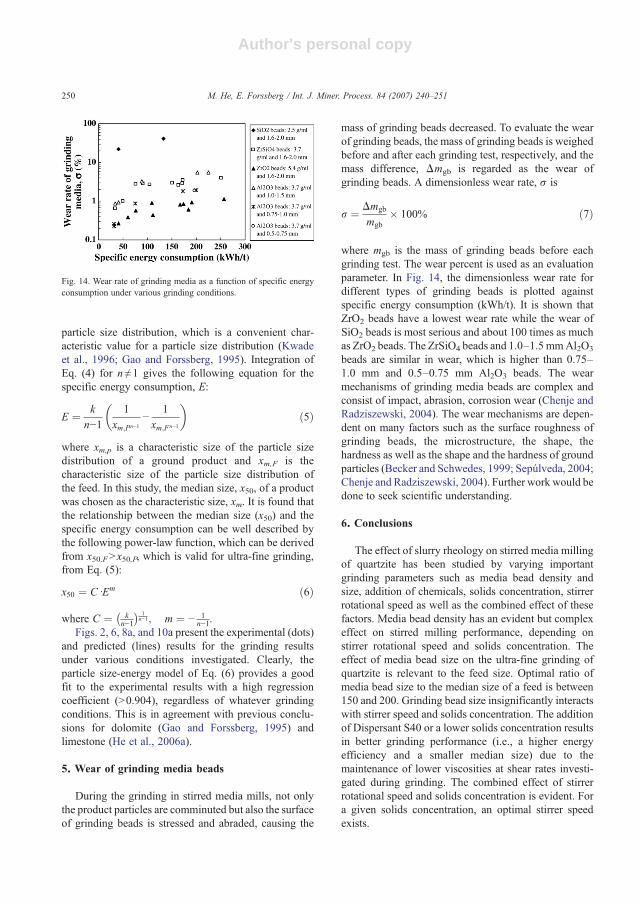
Author's personal copy
particle size distribution, which is a convenient char-acteristic value for a particle size distribution (Kwadeet al., 1996; Gao and Forssberg, 1995). Integration ofEq. (4) for n≠1 gives the following equation for thespecific energy consumption, E:
E ¼ kn−1
1xm;Pn−1
−1
xm;Fn−1
� �ð5Þ
where xm,p is a characteristic size of the particle sizedistribution of a ground product and xm,F is thecharacteristic size of the particle size distribution ofthe feed. In this study, the median size, x50, of a productwas chosen as the characteristic size, xm. It is found thatthe relationship between the median size (x50) and thespecific energy consumption can be well described bythe following power-law function, which can be derivedfrom x50,FNx50,P, which is valid for ultra-fine grinding,from Eq. (5):
x50 ¼ CdEm ð6Þ
where C ¼ kn−1
� � 1n−1; m ¼ − 1
n−1.Figs. 2, 6, 8a, and 10a present the experimental (dots)
and predicted (lines) results for the grinding resultsunder various conditions investigated. Clearly, theparticle size-energy model of Eq. (6) provides a goodfit to the experimental results with a high regressioncoefficient (N0.904), regardless of whatever grindingconditions. This is in agreement with previous conclu-sions for dolomite (Gao and Forssberg, 1995) andlimestone (He et al., 2006a).
5. Wear of grinding media beads
During the grinding in stirred media mills, not onlythe product particles are comminuted but also the surfaceof grinding beads is stressed and abraded, causing the
mass of grinding beads decreased. To evaluate the wearof grinding beads, the mass of grinding beads is weighedbefore and after each grinding test, respectively, and themass difference, Δmgb is regarded as the wear ofgrinding beads. A dimensionless wear rate, σ is
r ¼ Dmgb
mgb� 100% ð7Þ
where mgb is the mass of grinding beads before eachgrinding test. The wear percent is used as an evaluationparameter. In Fig. 14, the dimensionless wear rate fordifferent types of grinding beads is plotted againstspecific energy consumption (kWh/t). It is shown thatZrO2 beads have a lowest wear rate while the wear ofSiO2 beads is most serious and about 100 times as muchas ZrO2 beads. The ZrSiO4 beads and 1.0–1.5 mmAl2O3
beads are similar in wear, which is higher than 0.75–1.0 mm and 0.5–0.75 mm Al2O3 beads. The wearmechanisms of grinding media beads are complex andconsist of impact, abrasion, corrosion wear (Chenje andRadziszewski, 2004). The wear mechanisms are depen-dent on many factors such as the surface roughness ofgrinding beads, the microstructure, the shape, thehardness as well as the shape and the hardness of groundparticles (Becker and Schwedes, 1999; Sepúlveda, 2004;Chenje and Radziszewski, 2004). Further work would bedone to seek scientific understanding.
6. Conclusions
The effect of slurry rheology on stirred media millingof quartzite has been studied by varying importantgrinding parameters such as media bead density andsize, addition of chemicals, solids concentration, stirrerrotational speed as well as the combined effect of thesefactors. Media bead density has an evident but complexeffect on stirred milling performance, depending onstirrer rotational speed and solids concentration. Theeffect of media bead size on the ultra-fine grinding ofquartzite is relevant to the feed size. Optimal ratio ofmedia bead size to the median size of a feed is between150 and 200. Grinding bead size insignificantly interactswith stirrer speed and solids concentration. The additionof Dispersant S40 or a lower solids concentration resultsin better grinding performance (i.e., a higher energyefficiency and a smaller median size) due to themaintenance of lower viscosities at shear rates investi-gated during grinding. The combined effect of stirrerrotational speed and solids concentration is evident. Fora given solids concentration, an optimal stirrer speedexists.
Fig. 14. Wear rate of grinding media as a function of specific energyconsumption under various grinding conditions.
250 M. He, E. Forssberg / Int. J. Miner. Process. 84 (2007) 240–251
Author's personal copy
In addition, an empirical particle size-energy modelprovides a good fit (R2N0.904) to the grinding resultsunder the experimental conditions investigated. Fur-thermore, the wear of grinding media beads is involved.ZrO2 beads have a lowest wear rate whereas the wear ofSiO2 beads is most serious. The wear rate of Al2O3
beads is related to the bead size.
Acknowledgements
The financial support from LKAB and AgricolaResearch Center (ARC), Luleå University of Technol-ogy, Sweden is acknowledged. Mr Anders Hägglund atLKAB is thanked for providing quartzite samples andfruitful discussions. The authors are also grateful to Dr.Britt-Marie Antti at the paper mill in Piteå (KappaKraftliner Piteå, Sweden) for providing the Bohlin Visco88 BV viscometer.
References
Austin, L.G., Klimpel, R.R., Luckie, P.T., 1984. Process Engineeringof Size Reduction: Ball Milling. Society of Mining Engineers,New York0-89520-421-5(ISBN).
Becker, M., Schwedes, J., 1999. Comminution of ceramics in stirredmedia mills and wear of grinding beads. Powder Technology 105,374–381.
Bernhardt, C., Reinsch, E., Husemann, K., 1999. The influence ofsuspension properties on ultra-fine grinding in stirred ball mills.Powder Technology 105, 357–361.
Blecher, L., Schwedes, J., 1996. Energy distribution and particletrajectories in a grinding chamber of a stirred ball mill.International Journal of Mineral Processing 44–45, 617–627.
Blecher, Lutz, Kwade, Arno, Schwedes, Jörg, 1996. Motion and stressintensity of grinding beads in a stirred media mill, Part 1: energydensity distribution and motion of single grinding beads. PowderTechnology 86, 59–68.
Chenje, Tapiwa, Radziszewski, Peter, 2004. Determining the steelmedia abrasive wear as a function of applied force and friction.Minerals Engineering 17, 1255–1258.
Gao, M., Forssberg, E., 1993a. The influence of slurry rheology onultra-fine grinding in a stirred ball mill. 18th International MineralProcessing Congress, Sydney, CA (Conference Article), Austra-lian, pp. 237–244.
Gao, Ming-Wei, Forssberg, Eric, 1993b. A study on the effect ofparameters in stirred ball milling. International Journal of MineralProcessing 37, 45–59.
Gao, Mingwei, Forssberg, Eric, 1995. Prediction of product sizedistributions for a stirred ball mill. Powder Technology 84,101–106.
Greenwood, R., Rowson, N., Kingman, S., Brown, G., 2002. A newmethod for determining the optimum dispersant concentration inaqueous grinding. Powder Technology 123, 199–207.
He, Mingzhao, Wang, Yanmin, Forssberg, Eric, 2004. Slurry rheologyin wet ultrafine grinding of industrial minerals: a review. PowderTechnology 147, 94–112.
He, Mingzhao, Wang, Yanmin, Forssberg, Eric, 2006a. Parametereffects on wet ultrafine grinding of limestone through slurryrheology in a stirred media mill. Powder Technology 161, 10–21.
He, Mingzhao, Wang, Yanmin, Forssberg, Eric, 2006b. Parameterstudies on the rheology of limestone slurries. International Journalof Mineral Processing 78, 63–77.
Jankovic, A., 2003. Variables affecting the fine grinding of mineralsusing stirred mills. Minerals Engineering 16, 337–345.
Kapur, Prakash C., Healy, Thomas W., Scales, Peter J., Boger, DavidV., Wilson, David, 1996. Role of dispersants in kinetics andenergetics of stirred ball mill grinding. International Journal ofMineral Processing 47, 141–152.
Klimpel, R.R., 1999. The selection of wet grinding chemical additivesbased on slurry rheology control. Powder Technology 105,430–435.
Kwade, Arno, Blecher, Lutz, Schwedes, Jörg, 1996. Motion and stressintensity of grinding beads in a stirred media mill, Part 2: stressintensity and its effect on comminution. Powder Technology 86,69–76.
Lane, Graeme L., 1999. CFD modelling of a stirred bead mill for finegrinding. Second International Conference on CFD in the Mineralsand Process Industries, Melbourne, Australia, pp. 449–454.
Mankosa, M.J., Adel, G.T., Yoon, R.H., 1986. Effect of media size instirred ball mill grinding of coal. Powder Technology 49, 75–82.
Muster, T.H., Prestidge, C.A., 1995. Rheological investigations ofsulphide mineral slurries. Minerals Engineering 8, 1541–1555.
Reinisch, E., Bernhardt, C., Husemann, K., 2001. The influence ofadditives during wet ultra-fine grinding in agitator bead mills, Part1: general principles and experimental. Ceramic Forum Interna-tional: Berichte der Deutschen Keramischen Gesellschaft 78 (3),E38–E42.
Sepúlveda, Jaime E., 2004. Methodologies for the evaluation ofgrinding media consumption rates at full plant scale. MineralsEngineering 17, 1269–1279.
Theuerkauf, J., Schwedes, J., 1999. Theoretical and experimentalinvestigation on particle and fluid motion in stirred media mills.Powder Technology 105, 406–412.
Zheng, Jie, Harris, Colin C., Somasundaran, P., 1996. A study ongrinding and energy input in stirred media mills. PowderTechnology 86, 171–178.
Zheng, Jie, Harris, Colin C., Somasundaran, P., 1997. The effect ofadditives on stirred media milling of limestone. Powder Technol-ogy 91, 173–179.
251M. He, E. Forssberg / Int. J. Miner. Process. 84 (2007) 240–251
Paper 5
Rheological behaviors in wet ultrafine grinding of limestone
Minerals & Metallurgical Processing, 24 (2007) 19-29
Reprinted from Minerals & Metallurgical Processing with permission from Society for Mining, Metallurgy, and Exploration, Inc. (copyright
2007).

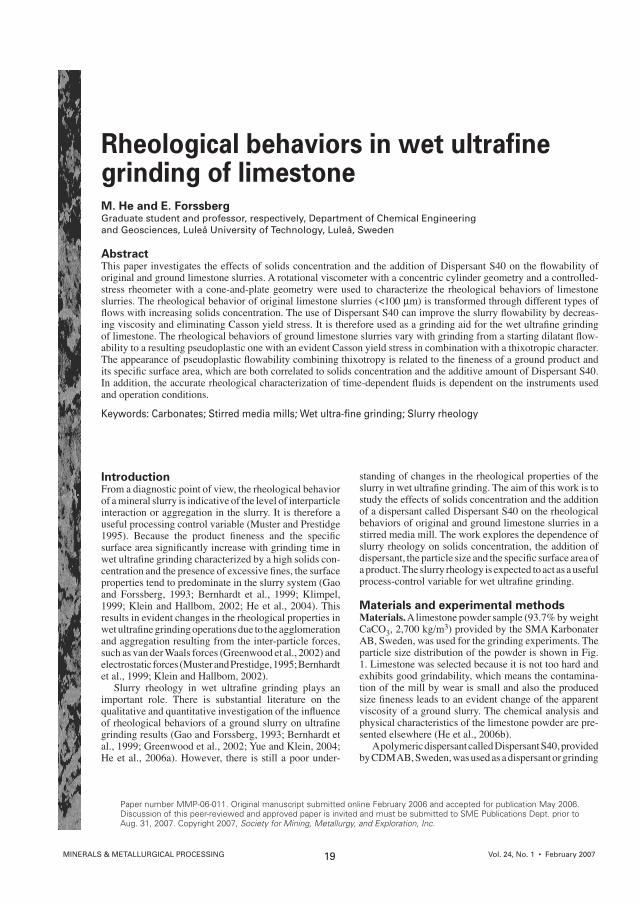
MINERALS & METALLURGICAL PROCESSING Vol. 24, No. 1 • February 200719
Rheological behaviors in wet ultrafine grinding of limestoneM. He and E. ForssbergGraduate student and professor, respectively, Department of Chemical Engineeringand Geosciences, Luleå University of Technology, Luleå, Sweden
Abstract
and operation conditions.
Keywords: Carbonates; Stirred media mills; Wet ultra-fine grinding; Slurry rheology
Introduction
results in evident changes in the rheological properties in
standing of changes in the rheological properties of the
of a dispersant called Dispersant S40 on the rheological
Materials and experimental methodsMaterials.
Fig.
Paper number MMP-06-011. Original manuscript submitted online February 2006 and accepted for publication May 2006. Discussion of this peer-reviewed and approved paper is invited and must be submitted to SME Publications Dept. prior to Aug. 31, 2007. Copyright 2007, Society for Mining, Metallurgy, and Exploration, Inc.

February 2007 • Vol. 24 No. 1 MINERALS & METALLURGICAL PROCESSING20
amount of the dispersant is the percent of the pure dispersant
Experimental methods.Mixing:
Stirred media milling:
tions are listed in
Rheological measurements:
redisperse the samples prior to rheological measurement.
.
·
temperature of a sample measured.
) prior to
highest shear rate.
·m. The digital readings
Figure 1 — Particle size distribution of limestone powder.
Constants:
Filling rate of grinding media 70% (by volume)
Feed flow rate 1.5 L/min
Stirrer speed 1,808 rpm (11.36 m/s)
ZrSiO4 milling beads 1.6-2.0 mm, 3.7 g/mL
Variables:
Solids concentration 65%, 70%, 75% (by weight)
Addition of Dispersant S40 0% – 0.6% (by weight)
Table 1 — Experimental conditions for grinding tests.

MINERALS & METALLURGICAL PROCESSING Vol. 24, No. 1 • February 200721
B B
C C
and
B and C
Energy consumption:
Pn nth
Figure 2 — Drais stirred media mill with a grinding chamber of 5.6-L net volume.
Figure 3 — Fitting rheological data of original limestone slurries at various solids concentration into (a) Bingham and (b) Casson models: dots = experimental, solids lines = modeling (by Bohlin viscometer).
(a)
(b)
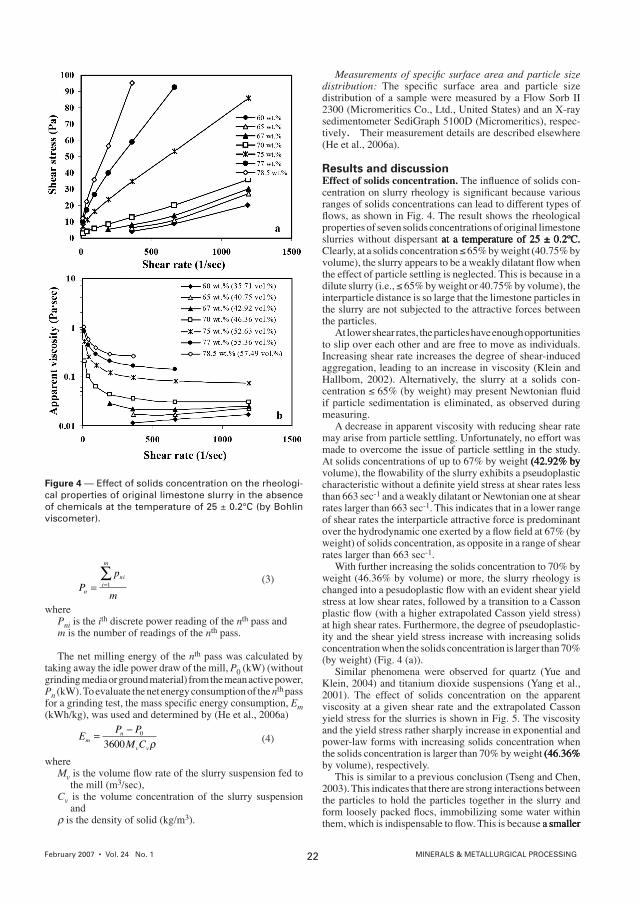
February 2007 • Vol. 24 No. 1 MINERALS & METALLURGICAL PROCESSING22
Pp
mn
nii
m
Pni is the ith nth pass and m nth pass.
nth
P0
Pn nth pass Em
EP P
M Cmn
v v
0
Mv
Cvand
).
distribution:
Results and discussionEffect of solids concentration.
Fig. 4properties of seven solids concentrations of original limestone
interparticle distance is so large that the limestone particles in
the particles.
to slip over each other and are free to move as individuals.
measuring.
of shear rates the interparticle attractive force is predominant
.
a smaller smaller
Figure 4 — Effect of solids concentration on the rheologi-cal properties of original limestone slurry in the absence of chemicals at the temperature of 25 ± 0.2°C (by Bohlin viscometer).

MINERALS & METALLURGICAL PROCESSING Vol. 24, No. 1 • February 200723
produces an increasedproduces an increased Effect of Dispersant S40.
further addition of Dispersant S40 and is up to a minimum
Figure 5 — Effect of solids concentration on the (a) apparent viscosity and (b) the Casson yield stress at the temperature of 25 ± 0.2°C (by Bohlin viscometer).
Figure 6 — Flowability of original limestone slurry at 75% (by weight) solids concentration with various dosages of Dispersant S40 at the temperature of 25 ± 0.2ºC (by Bohlin viscometer).
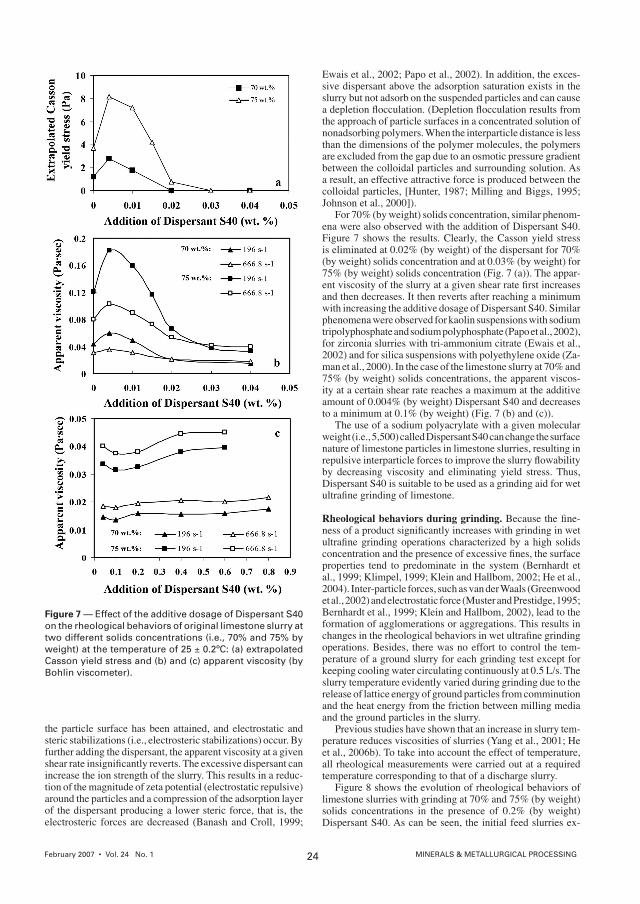
February 2007 • Vol. 24 No. 1 MINERALS & METALLURGICAL PROCESSING24
the approach of particle surfaces in a concentrated solution of
Rheological behaviors during grinding.
formation of agglomerations or aggregations. This results in Figure 7 — Effect of the additive dosage of Dispersant S40 on the rheological behaviors of original limestone slurry at two different solids concentrations (i.e., 70% and 75% by weight) at the temperature of 25 ± 0.2ºC: (a) extrapolated Casson yield stress and (b) and (c) apparent viscosity (by Bohlin viscometer).
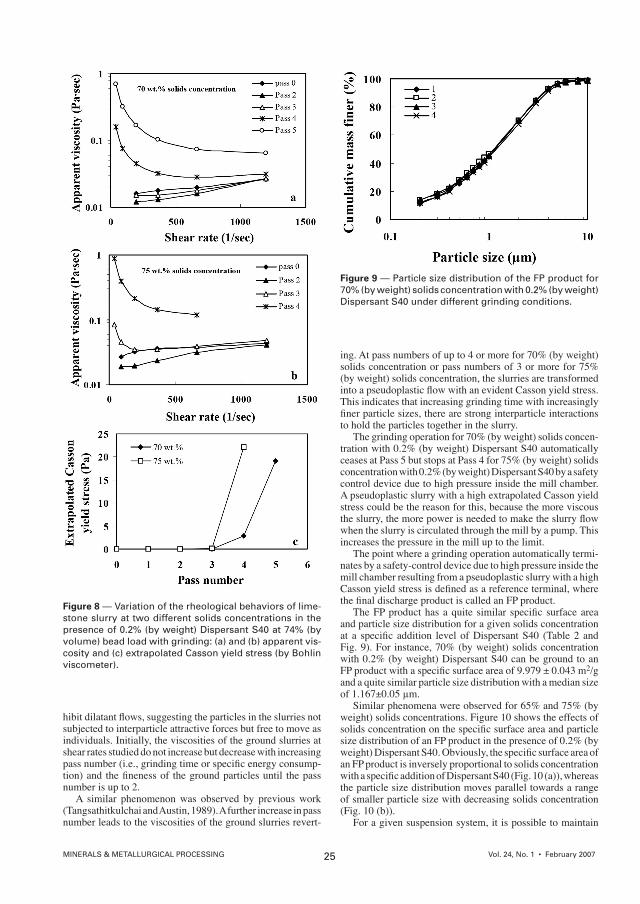
MINERALS & METALLURGICAL PROCESSING Vol. 24, No. 1 • February 200725
increases the pressure in the mill up to the limit.
and
μm.
Figure 8 — Variation of the rheological behaviors of lime-stone slurry at two different solids concentrations in the presence of 0.2% (by weight) Dispersant S40 at 74% (by volume) bead load with grinding: (a) and (b) apparent vis-cosity and (c) extrapolated Casson yield stress (by Bohlin viscometer).
Figure 9 — Particle size distribution of the FP product for 70% (by weight) solids concentration with 0.2% (by weight) Dispersant S40 under different grinding conditions.
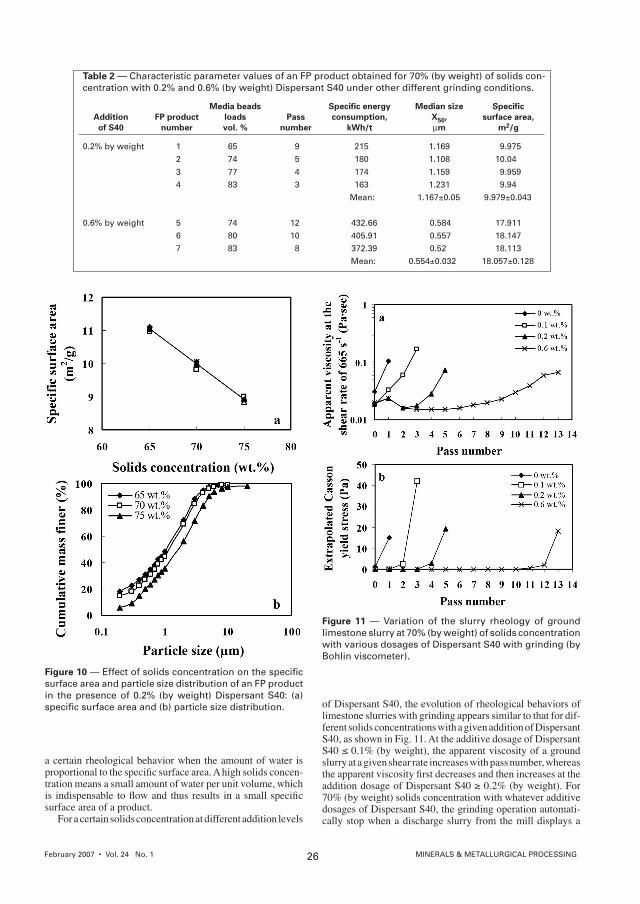
February 2007 • Vol. 24 No. 1 MINERALS & METALLURGICAL PROCESSING26
surface area of a product. For a certain solids concentration at different addition levels
. At the additive dosage of Dispersant
0.2% by weight 1 65 9 215 1.169 9.975
2 74 5 180 1.108 10.04
3 77 4 174 1.159 9.959
4 83 3 163 1.231 9.94
Mean: 1.167±0.05 9.979±0.043
0.6% by weight 5 74 12 432.66 0.584 17.911
6 80 10 405.91 0.557 18.147
7 83 8 372.39 0.52 18.113
Mean: 0.554±0.032 18.057±0.128
Media beads Specific energy Median size Specific
Addition FP product loads Pass consumption, X50, surface area,
of S40 number vol. % number kWh/t m m2/g
Table 2 — Characteristic parameter values of an FP product obtained for 70% (by weight) of solids con-centration with 0.2% and 0.6% (by weight) Dispersant S40 under other different grinding conditions.
Figure 10 — Effect of solids concentration on the specific surface area and particle size distribution of an FP product in the presence of 0.2% (by weight) Dispersant S40: (a) specific surface area and (b) particle size distribution.
Figure 11 — Variation of the slurry rheology of ground limestone slurry at 70% (by weight) of solids concentration with various dosages of Dispersant S40 with grinding (by Bohlin viscometer).
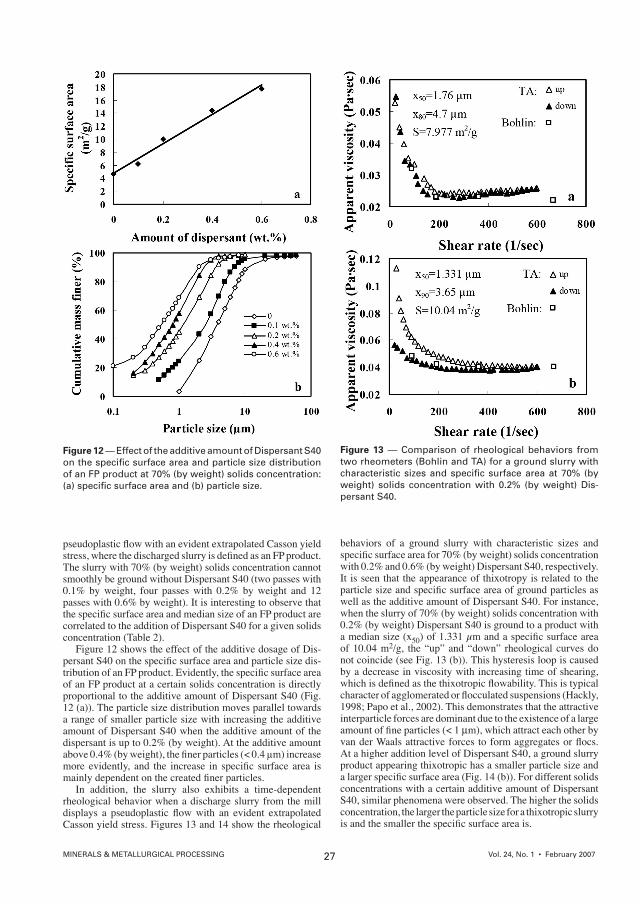
MINERALS & METALLURGICAL PROCESSING Vol. 24, No. 1 • February 200727
correlated to the addition of Dispersant S40 for a given solids ).
μm) increase
Figure 13 — Comparison of rheological behaviors from two rheometers (Bohlin and TA) for a ground slurry with characteristic sizes and specific surface area at 70% (by weight) solids concentration with 0.2% (by weight) Dis-persant S40.
Figure 12 — Effect of the additive amount of Dispersant S40 on the specific surface area and particle size distribution of an FP product at 70% (by weight) solids concentration: (a) specific surface area and (b) particle size.
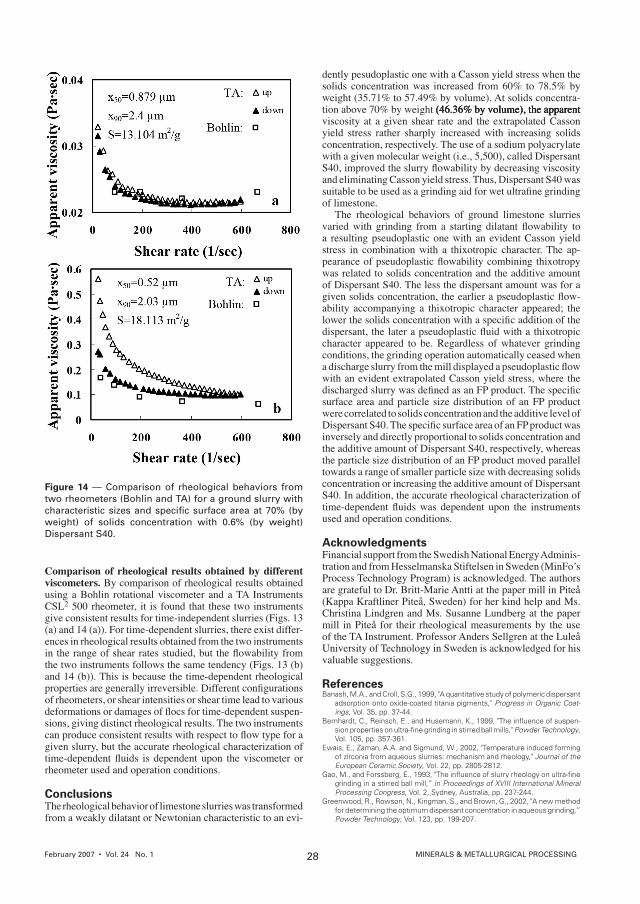
February 2007 • Vol. 24 No. 1 MINERALS & METALLURGICAL PROCESSING28
Comparison of rheological results obtained by different viscometers.
rheometer used and operation conditions.
Conclusions
Figure 14 — Comparison of rheological behaviors from two rheometers (Bohlin and TA) for a ground slurry with characteristic sizes and specific surface area at 70% (by weight) of solids concentration with 0.6% (by weight) Dispersant S40.
of limestone.
concentration or increasing the additive amount of Dispersant
used and operation conditions.
Acknowledgments
ReferencesBanash, M.A., and Croll, S.G., 1999, "A quantitative study of polymeric dispersant
adsorption onto oxide-coated titania pigments," Progress in Organic Coat-ings, Vol. 35, pp. 37-44.
Bernhardt, C., Reinsch, E., and Husemann, K., 1999, "The influence of suspen-sion properties on ultra-fine grinding in stirred ball mills," Powder Technology,Vol. 105, pp. 357-361.
Ewais, E., Zaman, A.A. and Sigmund, W., 2002, "Temperature induced forming of zirconia from aqueous slurries: mechanism and rheology," Journal of the European Ceramic Society, Vol. 22, pp. 2805-2812.
Gao, M., and Forssberg, E., 1993, "The influence of slurry rheology on ultra-fine grinding in a stirred ball mill,” in Proceedings of XVIII International Mineral Processing Congress, Vol. 2, Sydney, Australia, pp. 237-244.
Greenwood, R., Rowson, N., Kingman, S., and Brown, G., 2002, "A new method for determining the optimum dispersant concentration in aqueous grinding,” Powder Technology, Vol. 123, pp. 199-207.

MINERALS & METALLURGICAL PROCESSING Vol. 24, No. 1 • February 200729
Hackley, V.A., 1998, "Colloidal processing of silicon nitride with poly(acrylic acid): II, Rheological properties,” Journal of the American Ceramic Society, Vol. 81, No. 9, pp. 2421-2428.
He, M., Wang, Y., and Forssberg, E., 2004, “Slurry rheology in wet ultrafine grinding of industrial minerals: a review,” Powder Technology, pp. 147, pp. 94-112.
He, M., Wang, Y., and Forssberg, E., 2006a, “Parameter effects on wet ultrafine grinding of limestone through slurry rheology in a stirred media mill,” PowderTechnology, pp. 161, pp. 10-21.
He, M., Wang, Y., and Forssberg, E., 2006b, “Parameter studies on the rheol-ogy of limestone slurries,” International Journal of Mineral Processing, Vol. 78, pp. 63-77.
Higashitani, K., Iimura, K. and Sanda, H., 2001, “Simulation of deformation and breakup of large aggregates in flows of viscous fluids,” Chemical Engineering Science, Vol. 56, pp. 2927-2938.
Hunter, R.J., 1987, Foundations of Colloid Science, Vol. I, Oxford University Press.
Johnson, S.B., Franks, G.V., Scales, P.J., Boger, D.V., and Headly, T.W., 2000, “Surface chemistry – rheology relationships in concentrated mineral suspen-sions,” International Journal of Mineral Processing, Vol. 58, pp. 267-304.
Kawatra, S.K., Bakshi A.K., and Eisele, T.C., 1999, “An on-line pressure vessel rheometer for slurries,” Powder Technology, Vol. 105, pp. 418-423.
Kawatra, S.K., Bakshi A.K., and Miller, T.E., 1996, “Rheological characterization of mineral suspensions using a vibrating sphere and a rotational viscometer,” International Journal of Mineral Processing, Vol. 44-45, pp. 155-165.
Klein, B., and Hallbom, D.J., 2002, “Modifying the rheology of nickel laterite suspensions,” Minerals Engineering, Vol. 15, pp. 745-749.
Klimpel, R.R., 1999, “The selection of wet grinding chemical additives based on slurry rheology control,” Powder Technology, Vol. 105, pp. 430-435.
Logos, C., and Nguyen, Q.D., 1996, “Effect of particle size on the flow proper-ties of a south Australian coal-water slurry”, Powder Technology, Vol. 88, pp. 55-58.
Milling, A., and Biggs, S., 1995, “Direct measurement of the depletion force using an atomic force microscope,” Journal of Colloid and Interface Science,Vol. 170, pp. 604-606.
Muster, T.H., and Prestidge, C.A., 1995, “Rheological investigations of sulphide mineral slurries,” Minerals Engineering, Vol. 8, pp. 1541-1555.
Papo, A., Piani, L., and Ricceri, R., 2002, “Sodium tripolyphosphate and polyphos-phate as dispersing agents for kaolin suspensions: rheological characteriza-tion,” Colloids and surfaces A: Physicochemical and Engineering Aspects,Vol. 201, pp. 219-230.
Prestidge, C.A., 1997, “Rheological investigations of ultra-fine galena particle slurries under flotation-related conditions,” International Journal of Mineral Processing, Vol. 51, pp. 241-254.
Tangsathitkulchai, C., and Austin, L.G., 1989, “Slurry density effects on ball milling in a laboratory ball mill,” Powder Technology, Vol. 59, pp. 285-293.
Tseng, W.J., and Chen, C.-N., 2003, “Effect of polymeric dispersant on rheological behaviour of nickel-terpineol suspensions,” Materials Science & Engineering A, Vol. 347, pp. 145-153.
Yang, H.-G., Li, C.-Z., Gu, H.-C., and Fang, T.-N., 2001, “Rheology behaviour of titanium dioxide suspensions,” Journal of Colloid and Interface Science,Vol. 236, pp. 96-103.
Yue, J., and Klein, B., 2004, “Influence of rheology on the performance of hori-zontal stirred mills,” Minerals Engineering, Vol. 17, pp. 1169-1177.
Zaman, A.A., Bjelopavlic, M., and Moudgil, B.M., 2000, “Effect of Adsorbed polyethylene oxide on the rheology of colloidal silica suspensions,” Journalof Colloid and Interface Science, Vol. 226, pp. 290-298.


