thumbtack.com small business survey: …/media/kauffman_org/research reports and covers... ·...
TRANSCRIPT

454 Natoma Street
San Francisco, CA 94103
THUMBTACK.COM SMALL BUSINESS SURVEY: METHODOLOGY & ANALYSIS
Conducted in partnership with the Kauffman Foundation
Nathan Allen Research specialist, Thumbtack.com
Sander Daniels Co-founder, Thumbtack.com
With special thanks to Yasuyuki Motoyama and Kate Maxwell at the Kauffman Foundation for
generously lending their support and expertise to this project.

1
454 Natoma Street San Francisco, CA 94103
I. INTRODUCTION
Small businesses have been described as the engine driving America’s economy, and with good reason. Small businesses accounted for 65% of net new jobs created between 1993 and 2009 and employ nearly half of all private sector employees.1 A recently released Kauffman Foundation report noted that the Great Recession has had the effect of “pushing many individuals into business ownership because of high rates of unemployment.”2 Despite this, the share of GDP produced by small businesses has steadily declined over the past decade.3 There has never been a more important time to determine what matters most to small businesses.
The Thumbtack.com Small Business Survey, conducted in partnership with the
Kauffman Foundation, is designed to provide the media, researchers, policy makers, and the public at large with a better understanding of what small businesses value. This information can be used by would-be entrepreneurs to decide where to start their companies and by governments to determine where they excel and where they can improve. II. OVERVIEW OF SURVEY
There are many business climate indexes that are designed to determine a particular city or state’s appeal to businesses. The Thumbtack.com Small Business Survey differs from virtually all other such indexes in a number of ways.
First, business climate indexes are frequently produced by organizations promoting
a particular policy or agenda, and they often reach very divergent conclusions.4 For example, the Tax Foundation’s Business Tax Climate Index has a clear agenda aligned with that organization’s interests which are clearly stated on its website.5 Indeed, one academic has noted that the Tax Foundation index is aimed solely at penalizing states with what it
1 U.S. Small Business Administration. Advocacy Small Business Statistics and Research. Retrieved from http://web.sba.gov/faqs/faqindex.cfm?areaID=24. 2 R. W. Fairlie. “2011 Kauffman Index of Entrepreneurial Activity: 1996-2011.” March, 2012. Retrieved from http://www.kauffman.org/uploadedfiles/kiea_2012_report.pdf. 3 J. Tozzi. Small Business’s Shrinking GDP Contribution. Bloomberg BusinessWeek, Feb 16, 2012. Retrieved from http://www.businessweek.com/articles/2012-02-17/small-businesss-shrinking-gdp-contribution. 4 See Peter Fisher, “Grading Places: What Do the Business Climate Rankings Really Tell Us?” Economic Policy Institute, 2005. See also Kolko et al, “Public Policy, State Business Climates, and Economic Growth”. Retrieved from http://www.nber.org/papers/w16968 5 The Tax Foundation’s 2012 State Business Tax Climate Index can be found here: http://www.taxfoundation.org/news/show/22658.html. The Tax Foundation’s mission statement can be found here: http://www.taxfoundation.org/about/

2
454 Natoma Street San Francisco, CA 94103
deems to be “higher” taxes, though the actual tax burdens are not clear.6 In contrast to these types of rankings, we have no prior agenda in developing the rankings. We only care about creating rankings that properly reflect the feelings of small business owners.
Second, most extant rankings use widely available statistics (e.g., unemployment
levels and tax rates) to determine the rank ordering. For example, the methodology for Forbes’ “Best States for Business” ranking includes no survey responses. Rather, that ranking uses 37 components within what it terms “six vital categories for businesses: costs, labor supply, regulatory environment, current economic climate, growth prospects, and quality of life.”
Instead of attempting to find proxies for state friendliness towards business (e.g.,
unemployment levels and tax rates), we have asked the source directly - the data used in Thumbtack.com’s Small Business Survey comes from real small business owners themselves. By reaching out directly to some of the 250,000+ small business owners and managers who list their services on Thumbtack.com and having them rate their state and city across a number of categories, we are able to capture nuances that are difficult or impossible to measure through other data sources. For example, a ranking of state tax burdens on businesses must account for all the different ways in which a small business is taxed. In contrast, by asking the small businesses themselves, all relevant taxes are accounted for, while irrelevant ones are excluded. We believe that the source of our data gives our rankings a significant advantage when compared with other indices.
Finally, a related strength of our data is that it derives from a segment of the
business community that is often ignored in other rankings. This is because most other authors of indices like ours simply do not have access to a large number of small businesses that operate in the real world every day. As a result, the interests and values of these otherwise ignored business owners can be made known in a manner not possible in other rankings. III. SURVEY QUESTIONNAIRE & DATA COLLECTION
Our data was collected over a period of two months.7 We provided a link on the login page of our website asking our small business users to take the survey. The survey can be found here, and also appears in Appendix A of this paper.
6 See Fisher, Peter. “Grading Places: What Do the Business Climate Rankings Really Tell Us?” Economic Policy Institute, 2005. 7 Although the data collection is ongoing, the results used here were gathered between November 8th, 2011 and January 10th, 2012.

3
454 Natoma Street San Francisco, CA 94103
We collected three types of raw data from over 7,000 respondents, 6,022 of whom completed the survey:
1. Responses to survey questions regarding state friendliness towards small business.
These are responses to questions on pages 2 and 3 of the survey, and cover topics including the state’s overall friendliness towards small businesses, regulations, and the availability networking/training programs.
This includes a ‘free form’ question (page 3 of the survey) in which respondents were given the opportunity to provide additional information on doing business in their state. About 50% of respondents answered this question.
2. Responses to survey questions regarding economic health of small business. These are responses to questions on page 4 of the survey.
3. Demographic information connected to each respondent. This information comes from two sources:
i. Pages 1 and 5 of our survey. This includes age of business, number of employees at business, respondent’s gender, respondent’s age, respondent’s political preference, and respondent’s highest level of education.
ii. Thumbtack’s internal database. The respondents to this survey are Thumbtack users, and many of these users have given us information about themselves separate from that given in the survey. This includes location (zip, county, and state of business; also includes the major city in which respondent resides if he/she resides in a major city), profession, and hourly rate charged by respondent.
IV. ANALYSIS & DISCUSSION
The survey responses were converted to numerical scores, and an average for each
state and city was computed. Grades of A+ through F were assigned evenly on the basis of a state or city’s rank within a particular category. The ranked categories include:
1. Overall small business friendliness 2. Ease of starting a small business 3. Cost of hiring a new employee 4. Overall regulatory friendliness 5. Friendliness of health and safety regulations 6. Friendliness of employment, labor, and hiring regulations 7. Friendliness of tax code 8. Friendliness of licensing regulations

4
454 Natoma Street San Francisco, CA 94103
9. Friendliness of environmental regulations 10. Friendliness of zoning regulations 11. Publicity of training programs 12. Publicity of networking programs
Responses to survey questions pertaining to economic health were also ranked,
though no grade was assigned:
13. Current economic health of small business 14. Change in revenue over past 12 months 15. Forecast of small business’s future economic health
The survey response level by state roughly parallels the population of that state as a
percentage of the United States’ total population.8 Each response is mapped to a state (and almost all are also mapped to individual counties), and over three thousand are also coded to one of the 40 cities we ranked. Although we received responses from all states, we excluded those states that did not have at least ten respondents providing an overall business friendliness ranking. This threshold eliminated Alaska, North Dakota, South Dakota, West Virginia, and Wyoming from the rankings. In addition to state and cities,9 several other groupings were constructed. Individual states were divided into state regions (provided they had sufficient data) and each state was assigned to a national region, with rankings performed in each instance.10
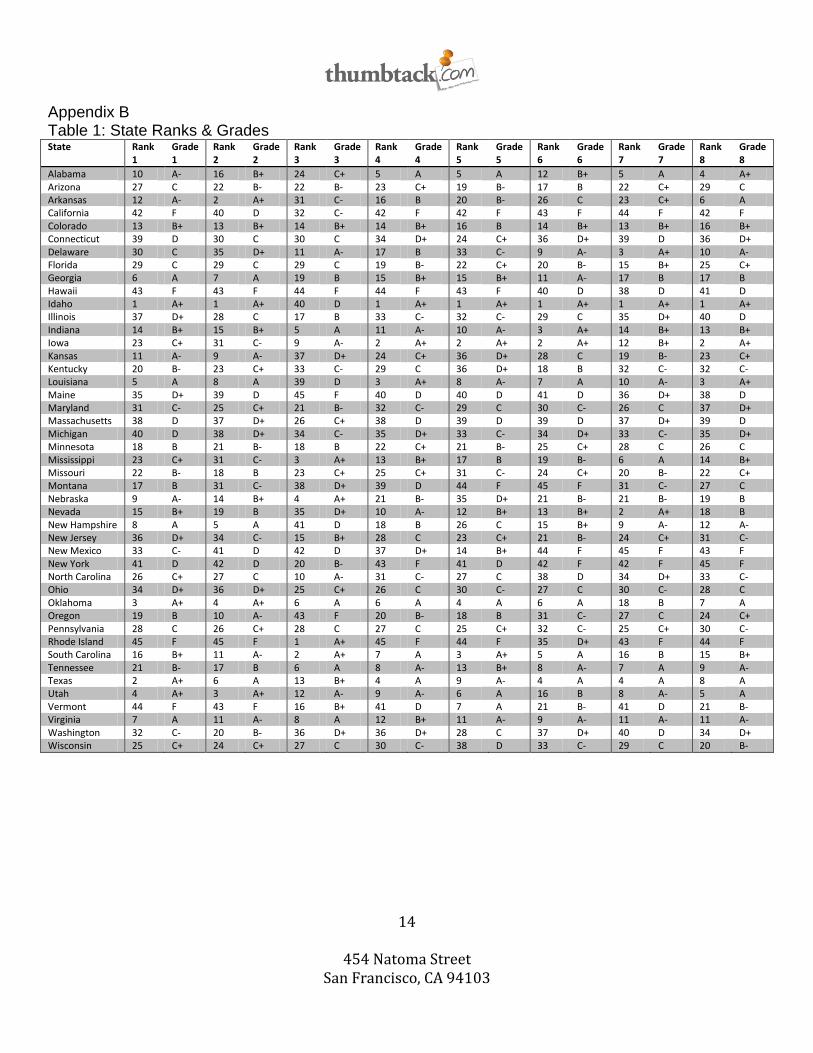
Many study rankings distill all of the evaluated factors into one final number. While having the advantage of providing a simple and easily comparable result, we felt that this is an oversimplification and fails to provide the level of detail that is needed by small businesses and those studying them. Acknowledging that different factors are important to different businesses, we provide rankings and grades for each category. Although we do assign a ranking and grade for “Overall Business Friendliness,” it is based on its own questions,11 and not a combination of the other questions in the survey. The full results for grades and rankings can be found in Appendix B.
8 Nine states varied by more than 1%, and only California and Florida varied by more than 1.25%. Their response levels were 2.96% and 3.72% higher, respectively. 9 The full state and city rankings can be found in Appendix B, Tables 1 and 2, respectively. 10 These rankings can be found in Appendix B, Tables 3 and 4, respectively. 11 The overall small business friendliness score was determined by combining the scores of three related questions:
In general, how would you rate your state's support of small business owners? Would you discourage or encourage someone from starting a new business in your state? How difficult or easy do you think it is to start a business in your state?

5
454 Natoma Street San Francisco, CA 94103
Of the respondents who finished the survey, there were some that omitted answers to some questions. As with any survey analysis, there are two competing factors when deciding how to handle these missing responses. On one hand, more data is better than less. However, we are also sensitive to potential issues of response bias that could potentially arise from using responses from respondents who did not answer every question. To determine whether this was an issue, we compared the rankings created using all of the data with the rankings created using the 3,376 respondents that answered every question, and found that there was little change, though some of the states whose total number of responses dropped towards the threshold response level were more affected, as would be expected. We did further analysis on the non-responses without observing a systemic pattern or correlation, leading us to believe that the inclusion of the maximum data points would allow for the most accurate and meaningful analysis.12 Although we did not assign weights to the different questions, we did perform linear regressions on the entire data set (as well as several subsets of the data) in an attempt to find meaningful trends. Using each respondent’s “Overall Small Business Friendliness Score” as the dependent variable,13 we tested the predictive power of the other questions by using various combinations as the predictive/independent variables.14
The best predictor of small business friendliness was whether the respondent was aware of the state or local government offering training programs for small businesses.15 Interestingly, while those aware of training programs gave overall small business friendliness scores approximately 10% higher than those who were not, respondents who had actually attended one of the trainings rated their states less than one-percent higher than those who were aware of the trainings but had never attended. This may indicate that although offering (and publicizing) training programs makes a meaningful difference in how small businesses view the government, the training itself could stand to be improved. However, more detailed research would need to be done in this area to draw definitive conclusions.
Other top predictors of small business friendliness were the respondent’s forecast of his/her company’s financial performance over the coming 12 months and his/her
12 The one trend that we did observe was a higher rate of non-response for four questions: 1. Health & safety regulations; 2. Hiring & labor regulations; 3. Environmental regulations; 4. Zoning regulations. The most likely explanation is that some of the small businesses feel that these factors are only somewhat or not relevant to them, a conclusion that seems to be borne out by the regressions discussed hereafter. 13 Although we ranked “Ease of Starting a Business,” we did not include it as an independent variable in any of the tests in order to avoid the obvious correlation problems that would exist. Furthermore, we made use of some categories in the regressions and we did not rank individually. 14 The full results can be seen in Appendix C. 15 It had a coefficient of 0.4457. See Appendix C, Table 1. As a side note, the training and networking programs categories have binary answers, while the cost of hiring a new employee is measured on a ten-point scale. All others are rated 1-5.

6
454 Natoma Street San Francisco, CA 94103
assessment of the small business’ current financial state. Although taxes are a dominant topic in many discussions of a location’s attractiveness to business,16 our analysis indicates that small businesses tend to care more deeply about the friendliness of a region’s licensing regime by a factor of nearly two.17 Similarly, being subject to special regulatory requirements had a negative effect on overall small business friendliness, and among those small businesses subject to special regulations, the ease of complying with these requirements was by far the most important factor.18 A regression analysis of the data for a low-ranking and a high-ranking state—California and Texas, respectively—reveals both commonalities and striking differences.19 Both of the states had similar numbers that matched the national coefficients for the importance of current and predicted financial situations. Additionally, licensing requirements were top predictors of overall scores. In contrast, the tax code was more important to Texas small businesses than the cost of hiring new employees while the opposite was true in California. In future iterations of this study, we intend to obtain the sample sizes that will allow us to perform similarly detailed regression analysis on all states. In addition to the analyses performed by geographic location, we evaluated select categories by gender and political orientation.20 Nationally, women small business owners were nearly 9% more likely to rate their state as being supportive and almost 10% more likely to consider starting a business as easy in their state as compared to their male counterparts. However, male-led small businesses were over 7% more likely to view their business’ current situation as good or very good.21
Similar differences were calculated between those identifying themselves as
Conservative, Liberal, and Independent/Other. Nationally, there was little difference across the political spectrum in terms of how respondents rated states’ friendliness towards small business. Within states, however, there were substantial differences. Within California, for instance, conservatives were 30% less likely than liberals to view the state as supportive of small business, while independents were 15% less likely than liberals.22
16 In fact, there are rankings (such as those produced by the Tax Foundation) that exclusively evaluate a state’s tax policies. 17 Friendliness of the tax code and tax-related regulations had a coefficient of 0.2436, as compared to .04232 for licensing forms/requirements/fees. 18 The coefficients for those factors were -0.3246 and 0.5892, respectively. See Appendix C, Tables 6 & 4. 19 See Appendix C, Tables 2 & 3. 20 These results can be found in Appendix D. 21 See Appendix D, Table 1. 22 See Appendix D, Table 2.

7
454 Natoma Street San Francisco, CA 94103
For more information on any of our findings or to learn more about Thumbtack, please contact us at [email protected] or [email protected].

8
454 Natoma Street San Francisco, CA 94103
Appendix A: Thumbtack State Competitiveness Survey Thanks for participating in the inaugural Thumbtack State Competitiveness Survey! This survey should take 5-8 minutes to complete. This survey was developed in partnership between Thumbtack and the Kauffman Foundation and seeks to provide insight into the friendliness of state and local governments towards small businesses. The results of this survey will be used by Thumbtack and the Kauffman Foundation to provide policymakers and researchers with valuable information on how small businesses feel about their state and local governments. Individual responses to the survey will not be released outside of Thumbtack and the Kauffman Foundation, and all publicly released analysis of the survey's results will reflect only aggregate results. Thanks again.
1. In which state do you primarily operate your business? [DROP-DOWN LIST OF STATES]
2. In how many states does your business operate?
1
2-3
4-5
6 or more 3. Are 90% or more of your sales made to customers located within 50 miles of your
company's primary location?
Yes
No 4. In general, how would you rate your state’s support of small business owners?
Very supportive
Somewhat supportive
Neither supportive nor unsupportive
Somewhat unsupportive
Very unsupportive 5. Would you discourage or encourage someone from starting a new business in your state?
Highly encourage
Somewhat encourage
Neither encourage nor discourage

9
454 Natoma Street San Francisco, CA 94103
Somewhat discourage
Highly discourage 6. How difficult or easy do you think it is to start a business in your state?
Very easy
Somewhat easy
Neither easy nor difficult
Somewhat difficult
Very difficult 7. Do you offer health insurance to your employees through your business?
Yes
No
8. How unfriendly or friendly is your state or local government with regard to the following types of regulations:
Very
friendly
Somewhat
friendly
Neither
friendly nor
unfriendly
Somewhat
unfriendly
Very
unfriendly
Does not
apply to my
business
Health and safety
regulations 1 2 3 4 5 6
Employment, labor
and hiring regulations 1 2 3 4 5 6
Tax code and tax-
related regulations 1 2 3 4 5 6
Licensing forms,
requirements and fees 1 2 3 4 5 6
Environmental
regulations 1 2 3 4 5 6
Zoning or land use
regulations 1 2 3 4 5 6

10
454 Natoma Street
San Francisco, CA 94103
9. Does your state impose any special regulatory requirements on your profession?
Yes
No 10. Are you aware of your state or local government offering training programs for
small business owners?
Yes
No 11. Are you aware of your state or local government offering networking programs for
small business owners?
Yes
No 12. Please let us know any experiences or thoughts you have regarding the ease of doing business in your state.
[BOX FOR COMMENTS] 13. Would you be willing to be quoted in the press about your views on small
business in your state? [YES/NO DROPDOWN MENU] 14. How would you rate your company’s financial situation today?
Very good
Somewhat good
Neither good nor bad
Somewhat bad
Very bad 15. Over the past 12 months, did your company’s revenues:
Increase a lot
Increase a little
Stay the same
Decrease a little
Decrease a lot 16. How has the rate you charge your customers or clients changed over the last 12 months?
Increased a lot
Increased a little
Stayed the same
Decreased a little

11
454 Natoma Street
San Francisco, CA 94103
Decreased a lot 17. How do you think your company’s financial situation will be 12 months from now?
Substantially better
A little better
The same as today
A little worse
Substantially worse 18. How would you rate the situation of the national economy over the past 12 months?
Very good
Somewhat good
Neither good nor bad
Somewhat bad
Very bad 19. How would you rate the situation of your state economy in comparison to the
national economy?
Substantially better
A little better
The same
A little worse
Substantially worse 20. How long has your business been operating?
Less than 1 year
1-2 years
3-4 years
5 or more years 21. How many people does your business employ?
1-5
6-10
11-30
31-50
51-100
100+ 22. How much does it cost to hire a new employee in addition to their salary?

12
454 Natoma Street
San Francisco, CA 94103
10% or less of total salary
11-20% of total salary
21-30% of total salary
31-40% of total salary
41-50% of total salary
51-60% of total salary
61-70% of total salary
71-80% of total salary
81-90% of total salary
91-100% of total salary
More than 100% of total salary 23. Which best describes your position in your business?
Owner and manager
Owner but not manager
Manager but not owner
Non-manager employee 24. Have you ever been an entrepreneur prior to your current company?
Yes
No 25. What is your gender?
Female
Male 26. What is your age?
Under 25
25-34
35-44
45-54
55-64
65 or above 27. What is your political preference?
Strong conservative
Lean conservative
Independent

13
454 Natoma Street
San Francisco, CA 94103
Lean liberal/progressive
Strong liberal/progressive
Other 28. What is the highest level of education you have reached?
No high school
High school
Community college
Technical college
Undergraduate degree
Masters degree
Doctoral degree
14
454 Natoma Street
San Francisco, CA 94103
Appendix B Table 1: State Ranks & Grades State Rank
1 Grade 1
Rank 2
Grade 2
Rank 3
Grade 3
Rank 4
Grade 4
Rank 5
Grade 5
Rank 6
Grade 6
Rank 7
Grade 7
Rank 8
Grade 8
Alabama 10 A- 16 B+ 24 C+ 5 A 5 A 12 B+ 5 A 4 A+ Arizona 27 C 22 B- 22 B- 23 C+ 19 B- 17 B 22 C+ 29 C Arkansas 12 A- 2 A+ 31 C- 16 B 20 B- 26 C 23 C+ 6 A California 42 F 40 D 32 C- 42 F 42 F 43 F 44 F 42 F Colorado 13 B+ 13 B+ 14 B+ 14 B+ 16 B 14 B+ 13 B+ 16 B+ Connecticut 39 D 30 C 30 C 34 D+ 24 C+ 36 D+ 39 D 36 D+ Delaware 30 C 35 D+ 11 A- 17 B 33 C- 9 A- 3 A+ 10 A- Florida 29 C 29 C 29 C 19 B- 22 C+ 20 B- 15 B+ 25 C+ Georgia 6 A 7 A 19 B 15 B+ 15 B+ 11 A- 17 B 17 B Hawaii 43 F 43 F 44 F 44 F 43 F 40 D 38 D 41 D Idaho 1 A+ 1 A+ 40 D 1 A+ 1 A+ 1 A+ 1 A+ 1 A+ Illinois 37 D+ 28 C 17 B 33 C- 32 C- 29 C 35 D+ 40 D Indiana 14 B+ 15 B+ 5 A 11 A- 10 A- 3 A+ 14 B+ 13 B+ Iowa 23 C+ 31 C- 9 A- 2 A+ 2 A+ 2 A+ 12 B+ 2 A+ Kansas 11 A- 9 A- 37 D+ 24 C+ 36 D+ 28 C 19 B- 23 C+ Kentucky 20 B- 23 C+ 33 C- 29 C 36 D+ 18 B 32 C- 32 C- Louisiana 5 A 8 A 39 D 3 A+ 8 A- 7 A 10 A- 3 A+ Maine 35 D+ 39 D 45 F 40 D 40 D 41 D 36 D+ 38 D Maryland 31 C- 25 C+ 21 B- 32 C- 29 C 30 C- 26 C 37 D+ Massachusetts 38 D 37 D+ 26 C+ 38 D 39 D 39 D 37 D+ 39 D Michigan 40 D 38 D+ 34 C- 35 D+ 33 C- 34 D+ 33 C- 35 D+ Minnesota 18 B 21 B- 18 B 22 C+ 21 B- 25 C+ 28 C 26 C Mississippi 23 C+ 31 C- 3 A+ 13 B+ 17 B 19 B- 6 A 14 B+ Missouri 22 B- 18 B 23 C+ 25 C+ 31 C- 24 C+ 20 B- 22 C+ Montana 17 B 31 C- 38 D+ 39 D 44 F 45 F 31 C- 27 C Nebraska 9 A- 14 B+ 4 A+ 21 B- 35 D+ 21 B- 21 B- 19 B Nevada 15 B+ 19 B 35 D+ 10 A- 12 B+ 13 B+ 2 A+ 18 B New Hampshire 8 A 5 A 41 D 18 B 26 C 15 B+ 9 A- 12 A- New Jersey 36 D+ 34 C- 15 B+ 28 C 23 C+ 21 B- 24 C+ 31 C- New Mexico 33 C- 41 D 42 D 37 D+ 14 B+ 44 F 45 F 43 F New York 41 D 42 D 20 B- 43 F 41 D 42 F 42 F 45 F North Carolina 26 C+ 27 C 10 A- 31 C- 27 C 38 D 34 D+ 33 C- Ohio 34 D+ 36 D+ 25 C+ 26 C 30 C- 27 C 30 C- 28 C Oklahoma 3 A+ 4 A+ 6 A 6 A 4 A 6 A 18 B 7 A Oregon 19 B 10 A- 43 F 20 B- 18 B 31 C- 27 C 24 C+ Pennsylvania 28 C 26 C+ 28 C 27 C 25 C+ 32 C- 25 C+ 30 C- Rhode Island 45 F 45 F 1 A+ 45 F 44 F 35 D+ 43 F 44 F South Carolina 16 B+ 11 A- 2 A+ 7 A 3 A+ 5 A 16 B 15 B+ Tennessee 21 B- 17 B 6 A 8 A- 13 B+ 8 A- 7 A 9 A- Texas 2 A+ 6 A 13 B+ 4 A 9 A- 4 A 4 A 8 A Utah 4 A+ 3 A+ 12 A- 9 A- 6 A 16 B 8 A- 5 A Vermont 44 F 43 F 16 B+ 41 D 7 A 21 B- 41 D 21 B- Virginia 7 A 11 A- 8 A 12 B+ 11 A- 9 A- 11 A- 11 A- Washington 32 C- 20 B- 36 D+ 36 D+ 28 C 37 D+ 40 D 34 D+ Wisconsin 25 C+ 24 C+ 27 C 30 C- 38 D 33 C- 29 C 20 B-

15
454 Natoma Street
San Francisco, CA 94103
Table 1 (cont.) State Rank
9 Grade 9
Rank 10
Grade 10
Rank 11
Grade 11
Rank 12
Grade 12
Rank 13
Rank 14
Rank 15
Alabama 11 A- 6 A 6 A 6 A 23 5 10 Arizona 22 C+ 27 C 39 D 14 B+ 22 20 26 Arkansas 15 B+ 13 B+ 7 A 45 F 2 2 2 California 40 D 38 D 30 C- 34 D+ 40 40 35 Colorado 19 B- 20 B- 35 D+ 28 C 33 33 9 Connecticut 38 D 23 C+ 31 C- 41 D 45 44 37 Delaware 36 D+ 38 D 44 F 40 D 21 21 32 Florida 23 C+ 24 C+ 29 C 23 C+ 34 35 23 Georgia 21 B- 18 B 13 B+ 8 A 31 39 8 Hawaii 43 F 44 F 41 D 21 B- 20 45 19 Idaho 2 A+ 2 A+ 2 A+ 3 A+ 9 28 7 Illinois 27 C 22 C+ 34 D+ 20 B- 36 23 28 Indiana 12 B+ 12 B+ 28 C 39 D 29 13 14 Iowa 1 A+ 3 A+ 1 A+ 30 C- 4 3 45 Kansas 41 D 11 A- 18 B 5 A 16 8 34 Kentucky 28 C 32 C- 42 F 35 D+ 6 31 18 Louisiana 4 A 1 A+ 5 A 4 A+ 5 14 16 Maine 42 F 30 C- 12 B+ 44 F 44 11 19 Maryland 31 C- 33 C- 15 B+ 22 C+ 18 18 15 Massachusetts 35 D+ 37 D+ 26 C 10 A- 24 10 37 Michigan 34 D+ 34 D+ 22 C+ 19 B- 28 15 25 Minnesota 18 B 17 B 21 B- 32 C- 12 4 24 Mississippi 15 B+ 14 B+ 45 F 43 F 25 36 36 Missouri 32 C- 31 C- 32 C- 33 C- 37 38 13 Montana 14 B+ 38 D 43 F 1 A+ 3 30 4 Nebraska 30 C- 14 B+ 17 B 42 F 1 1 1 Nevada 6 A 9 A- 36 D+ 7 A 43 42 11 New Hampshire 20 B- 28 C 33 C- 18 B 15 32 44 New Jersey 37 D+ 41 D 14 B+ 29 C 38 43 43 New Mexico 15 B+ 26 C 19 B- 11 A- 32 6 5 New York 39 D 42 F 20 B- 31 C- 35 37 29 North Carolina 25 C+ 25 C+ 38 D 25 C+ 27 25 22 Ohio 24 C+ 19 B- 37 D+ 38 D 41 24 40 Oklahoma 5 A 4 A 11 A- 12 B+ 10 17 6 Oregon 13 B+ 21 B- 16 B 16 B 19 12 27 Pennsylvania 29 C 29 C 40 D 26 C 26 34 39 Rhode Island 44 F 43 F 4 A+ 2 A+ 11 27 42 South Carolina 3 A+ 10 A- 25 C+ 24 C+ 7 19 31 Tennessee 8 A- 7 A 10 A- 13 B+ 17 16 30 Texas 9 A- 5 A 24 C+ 27 C 13 29 17 Utah 7 A 8 A- 23 C+ 15 B+ 8 7 3 Vermont 45 F 45 F 3 A+ 17 B 30 9 33 Virginia 10 A- 16 B 9 A- 9 A- 39 26 12 Washington 33 C- 35 D+ 8 A- 36 D+ 42 41 21 Wisconsin 26 C 36 D+ 27 C 37 D+ 14 22 41

16
454 Natoma Street
San Francisco, CA 94103
Table 2: City Ranks & Grades City Rank
1 Grade 1
Rank 2
Grade 2
Rank 3
Grade 3
Rank 4
Grade 4
Rank 5
Grade 5
Rank 6
Grade 6
Rank 7
Grade 7
Albuquerque 13 B+ 30 D+ 38 F 34 D 5 A 38 F 39 F
Atlanta 5 A 6 A 14 B+ 16 B 16 B 12 B+ 15 B
Austin 4 A+ 4 A+ 19 B- 5 A 4 A+ 2 A+ 3 A+
Baltimore 34 D 28 C- 16 B 33 D 31 D+ 25 C 27 C-
Boston 35 D 34 D 27 C- 35 D 34 D 33 D 32 D+
Charlotte 11 A- 16 B 2 A+ 21 C+ 14 B+ 32 D+ 29 C-
Chicago 33 D 26 C 17 B 31 D+ 30 D+ 24 C 31 D+
Cleveland 26 C 30 D+ 24 C 27 C- 33 D 23 C+ 21 C+
Colorado Springs 6 A 3 A+ 37 F 4 A+ 3 A+ 6 A 7 A
Columbus 23 C+ 25 C 18 B- 22 C+ 18 B- 11 A- 35 D
Dallas-Fort Worth 2 A+ 2 A+ 12 B+ 3 A+ 6 A 4 A+ 4 A+
Denver 14 B+ 17 B 7 A 11 A- 19 B- 10 A- 12 B+
Detroit 36 D 33 D 32 D+ 29 C- 36 D 19 B- 22 C+
Houston 9 A- 19 B- 15 B 8 A 9 A- 8 A 8 A
Indianapolis 12 B+ 8 A 13 B+ 6 A 10 A- 5 A 9 A-
Jacksonville 27 C- 27 C- 9 A- 10 A- 22 C+ 9 A- 5 A
Las Vegas 10 A- 14 B+ 33 D 7 A 13 B+ 7 A 1 A+
Los Angeles 38 F 36 D 28 C- 37 F 37 F 36 D 33 D
Miami 25 C 29 C- 23 C+ 13 B+ 17 B 14 B+ 13 B+
Milwaukee 22 C+ 18 B- 5 A 23 C+ 28 C- 17 B 14 B+
Minneapolis 15 B 13 B+ 8 A 20 B- 20 B- 21 C+ 25 C
Nashville 16 B 5 A 6 A 9 A- 11 A- 14 B+ 11 A-
New York City 30 D+ 37 F 20 B- 30 D+ 32 D+ 34 D 30 D+
Oklahoma City 1 A+ 1 A+ 1 A+ 1 A+ 1 A+ 1 A+ 6 A
Omaha 7 A 20 B- 2 A+ 26 C 34 D 20 B- 26 C
Orlando 28 C- 23 C+ 22 C+ 28 C- 29 C- 28 C- 19 B-
Philadelphia 24 C 24 C 31 D+ 24 C 23 C+ 31 D+ 23 C+
Phoenix 21 C+ 15 B 29 C- 18 B- 21 C+ 13 B+ 16 B
Portland 18 B- 7 A 40 F 19 B- 24 C 26 C 24 C
Raleigh 17 B 10 A- 26 C 17 B 25 C 29 C- 20 B-
Sacramento 40 F 39 F 30 D+ 39 F 39 F 39 F 40 F
Salt Lake City 7 A 11 A- 11 A- 15 B 7 A 27 C- 18 B-
San Antonio 3 A+ 12 B+ 21 C+ 14 B+ 12 B+ 18 B- 10 A-
San Diego 39 F 35 D 25 C 40 F 40 F 40 F 38 F
San Francisco 32 D+ 30 D+ 34 D 38 F 38 F 37 F 36 D
San Jose 20 B- 21 C+ 35 D 25 C 26 C 22 C+ 28 C-
Seattle 29 C- 22 C+ 36 D 32 D+ 27 C- 30 D+ 34 D
Tucson 37 F 40 F 4 A+ 36 D 15 B 35 D 37 F
Virginia Beach 19 B- 9 A- 10 A- 12 B+ 7 A 16 B 17 B
Washington, DC 31 D+ 38 F 39 F 2 A+ 1 A+ 3 A+ 2 A+

17
454 Natoma Street
San Francisco, CA 94103
Table 2 (cont.) City Rank
8 Grade 8
Rank 9
Grade 9
Rank 10
Grade 10
Rank 11
Grade 11
Rank 12
Grade 12
Rank 13
Rank 14
Rank 15
Albuquerque 40 F 17 B 31 D+ 12 B+ 8 A 6 3 2
Atlanta 14 B+ 25 C 19 B- 11 A- 3 A+ 26 30 5
Austin 6 A 8 A 4 A+ 8 A 22 C+ 11 27 28
Baltimore 32 D+ 36 D 38 F 25 C 23 C+ 9 15 25
Boston 33 D 33 D 36 D 27 C- 12 B+ 17 8 34
Charlotte 29 C- 9 A- 16 B 39 F 24 C 8 7 3
Chicago 34 D 27 C- 26 C 31 D+ 10 A- 24 18 22
Cleveland 26 C 29 C- 27 C- 37 F 37 F 37 16 39
Colorado Springs 10 A- 1 A+ 11 A- 20 B- 36 D 1 2 4
Columbus 23 C+ 16 B 28 C- 3 A+ 16 B 28 6 32
Dallas-Fort Worth 4 A+ 5 A 5 A 36 D 32 D+ 22 29 11
Denver 5 A 19 B- 23 C+ 35 D 27 C- 20 25 8
Detroit 31 D+ 24 C 34 D 12 B+ 19 B- 23 22 27
Houston 12 B+ 20 B- 3 A+ 7 A 6 A 19 26 17
Indianapolis 3 A+ 4 A+ 7 A 24 C 38 F 33 10 19
Jacksonville 9 A- 13 B+ 8 A 12 B+ 4 A+ 34 24 14
Las Vegas 13 B+ 6 A 6 A 30 D+ 1 A+ 36 36 7
Los Angeles 37 F 37 F 29 C- 28 C- 29 C- 38 37 30
Miami 11 A- 14 B+ 17 B 32 D+ 34 D 21 28 9
Milwaukee 18 B- 35 D 32 D+ 21 C+ 39 F 10 33 40
Minneapolis 21 C+ 15 B 14 B+ 22 C+ 30 D+ 7 4 24
Nashville 2 A+ 7 A 12 B+ 6 A 13 B+ 15 5 16
New York City 28 C- 26 C 24 C 16 B 21 C+ 29 34 15
Oklahoma City 1 A+ 2 A+ 1 A+ 1 A+ 2 A+ 3 13 6
Omaha 20 B- 34 D 20 B- 4 A+ 35 D 4 1 1
Orlando 30 D+ 21 C+ 30 D+ 38 F 15 B 12 19 12
Philadelphia 24 C 30 D+ 18 B- 40 F 33 D 27 38 37
Phoenix 22 C+ 18 B- 25 C 33 D 7 A 14 14 23
Portland 16 B 11 A- 15 B 19 B- 11 A- 18 12 26
Raleigh 7 A 22 C+ 9 A- 34 D 28 C- 25 17 29
Sacramento 39 F 39 F 37 F 23 C+ 31 D+ 31 23 21
Salt Lake City 17 B 10 A- 10 A- 10 A- 17 B 15 20 10
San Antonio 15 B 22 C+ 13 B+ 9 A- 13 B+ 4 9 33
San Diego 36 D 40 F 40 F 17 B 9 A- 35 35 31
San Francisco 35 D 38 F 35 D 26 C 26 C 32 31 36
San Jose 25 C 30 D+ 21 C+ 18 B- 40 F 13 21 13
Seattle 27 C- 32 D+ 33 D 2 A+ 25 C 30 32 18
Tucson 38 F 28 C- 39 F 29 C- 18 B- 39 39 35
Virginia Beach 8 A 12 B+ 22 C+ 12 B+ 20 B- 40 40 20
Washington, DC 19 B- 3 A+ 2 A+ 5 A 5 A 2 11 38

18
454 Natoma Street
San Francisco, CA 94103
Table 3: State Region Rankings
State Region Rank 1 Rank 2 Rank 3 Rank 4 Rank 5 Rank 6 Rank 7 Rank 8 Rank 9 Rank
10 Rank
11 Rank
12 Rank
13 Rank
14 Rank
15
Alabama Central Alabama 1 1 1 1 2 2 1 1 3 1 1 1 1 2 1
Alabama Northern Alabama 2 2 2 2 1 1 2 2 2 2 2 2 2 1 3
Alabama Southern Alabama 3 3 3 3 3 3 3 3 1 3 3 3 3 3 2
Arizona Northern Arizona 2 1 1 3 1 3 3 3 3 3 3 3 2 2 3
Arizona Southeastern Arizona 3 3 2 2 3 2 2 2 2 2 1 2 3 3 2
Arizona Southwestern Arizona 1 2 3 1 2 1 1 1 1 1 2 1 1 1 1
California Central Coast 2 8 1 3 2 4 5 2 3 4 7 2 6 3 8
California Central Valley 9 9 9 8 4 7 9 6 7 9 8 9 9 9 7
California High Sierra/Gold Country 6 6 6 7 7 6 8 8 6 7 4 7 2 2 2
California Inland Empire/Deserts 8 7 7 6 6 8 6 9 3 6 9 4 7 4 5
California Los Angeles 4 4 4 2 3 1 2 5 2 1 6 8 8 8 3
California Orange County 5 5 2 1 1 2 3 1 1 2 1 5 1 1 1
California San Diego 7 2 5 5 8 5 1 7 9 3 3 3 3 7 9
California San Francisco Bay Area 1 3 3 9 9 9 7 4 8 8 2 1 5 6 4
California North Coast/Shasta Cascade 3 1 8 4 5 3 4 3 5 5 5 6 4 5 6
Colorado Denver Metro 3 3 1 3 3 3 3 2 2 3 4 4 2 3 2
Colorado Eastern Plains 5 4 2 5 5 5 5 4 4 5 5 5 5 4 4
Colorado Front Range 1 1 3 2 2 4 2 1 3 1 1 1 3 2 1
Colorado South Central Colorado 2 2 4 1 1 2 1 3 1 2 2 2 1 1 3
Colorado Western Colorado 4 5 5 4 4 1 4 5 5 4 3 3 4 5 5
Connecticut Eastern Connecticut 4 4 3 1 1 1 1 1 1 1 4 4 2 3 4
Connecticut New Haven 2 1 2 2 2 2 2 2 2 2 2 2 1 1 1
Connecticut River Valley 1 2 4 3 4 3 3 4 3 3 1 1 4 2 2
Connecticut Western Connecticut 3 3 1 4 3 4 4 3 4 3 3 3 3 4 3
Florida East Central Florida 4 4 5 5 5 5 5 4 4 4 7 4 1 1 2
Florida North Central Florida 7 7 2 7 7 6 7 6 7 7 6 6 4 2 5
Florida Northeastern Florida 3 5 1 2 4 2 1 2 2 1 4 1 6 4 4
Florida Northwestern Florida 5 1 6 6 6 7 6 7 6 6 2 2 7 6 3
Florida Southeastern Florida 1 2 3 1 1 1 3 1 1 2 5 7 3 5 1
Florida Southwestern Florida 6 6 7 4 2 3 2 5 5 5 3 5 2 3 7
Florida Tampa Bay 2 3 4 3 3 4 4 3 3 3 1 3 5 7 6

19
454 Natoma Street
San Francisco, CA 94103
Table 3 (cont.)
State Region Rank 1 Rank 2 Rank 3 Rank 4 Rank 5 Rank 6 Rank 7 Rank 8 Rank 9 Rank
10 Rank
11 Rank
12 Rank
13 Rank
14 Rank
15
Georgia Central Georgia 2 4 2 2 3 3 1 2 3 1 2 1 4 1 3
Georgia Metro Atlanta 3 3 3 3 4 2 2 4 2 3 3 3 3 2 2
Georgia Northern Georgia 4 2 4 4 2 4 3 3 4 4 4 4 2 3 4
Georgia Southern Georgia 1 1 1 1 1 1 3 1 1 2 1 2 1 4 1
Illinois Central Illinois 3 4 1 1 1 1 2 1 1 1 1 1 2 1 1
Illinois Metro Chicago 1 2 2 2 3 2 1 3 3 2 2 2 1 2 2
Illinois Southern Illinois 2 1 4 4 4 4 4 2 4 3 3 3 3 3 4
Illinois Western Illinois 4 3 3 3 2 3 3 4 2 3 4 4 4 4 3
Indiana Central/Southern Indiana 1 3 2 2 1 1 1 2 2 2 3 1 1 2 2
Indiana Metro Indianapolis 2 1 3 1 2 2 2 1 1 1 2 2 3 1 3
Indiana Northern Indiana 3 2 1 3 3 3 3 3 3 3 1 3 2 3 1
Kansas Central/Western Kansas 3 3 2 1 2 2 2 2 1 1 1 1 2 2 1
Kansas Eastern Kansas 2 2 1 2 3 1 1 1 2 2 2 2 1 1 2
Kansas Metro Kansas City 1 1 3 3 1 3 3 3 3 3 3 3 3 3 3
Massachusetts Central/Western Massachusetts 2 2 1 1 1 2 1 2 2 1 1 1 2 2 1
Massachusetts Metro Boston 1 3 3 2 2 1 2 1 1 2 3 2 1 1 2
Massachusetts Southeastern Massachusetts 3 1 2 3 3 3 3 3 3 3 2 3 3 3 3
Maryland Baltimore 5 5 1 2 1 1 1 3 3 1 5 2 2 1 2
Maryland Capital Region 1 1 3 1 2 3 2 1 1 2 2 1 4 2 1
Maryland Central Maryland 2 2 4 3 4 4 3 2 2 4 4 3 3 3 3
Maryland Eastern Shore/Southern Maryland 4 3 5 5 3 5 4 4 5 5 3 5 5 4 4
Maryland Western Maryland 3 4 2 4 5 2 4 5 4 3 1 4 1 5 5
Michigan Metro Detroit 2 2 2 1 3 1 1 3 1 3 3 3 3 3 3
Michigan Southeast Lower Michigan 3 1 4 2 2 3 2 1 2 1 1 1 4 4 4
Michigan Southwest Lower Michigan 4 3 3 4 4 4 3 2 3 2 4 4 2 2 2
Michigan Upper/Northern Lower Michigan 1 4 1 3 1 2 4 4 4 4 2 2 1 1 1
Minnesota Central Minnesota 1 2 3 3 3 4 3 3 3 3 2 4 2 3 1
Minnesota Metro Minneapolis 2 1 1 2 1 1 2 2 1 2 3 3 1 2 2
Minnesota Northern Minnesota 3 4 2 1 2 2 1 1 2 1 1 2 4 4 3
Minnesota Southern Minnesota 4 3 4 4 4 3 4 4 4 4 4 1 3 1 4
Missouri Central/Northern Missouri 1 1 4 3 4 3 3 4 3 1 2 2 3 1 1
Missouri Metro Kansas City 3 3 3 4 2 4 4 2 4 3 3 4 2 2 3
Missouri Metro St. Louis 2 2 1 2 3 2 1 3 2 4 4 3 4 4 4
Missouri Southern Missouri 4 4 2 1 1 1 2 1 1 2 1 1 1 3 2

20
454 Natoma Street
San Francisco, CA 94103
Table 3 (cont.)
State Region Rank 1 Rank 2 Rank 3 Rank 4 Rank 5 Rank 6 Rank 7 Rank 8 Rank 9 Rank
10 Rank
11 Rank
12 Rank
13 Rank
14 Rank
15
North Carolina Central North Carolina 5 5 3 6 8 5 6 5 6 7 6 6 7 6 5
North Carolina Eastern North Carolina 9 8 1 5 2 8 1 3 5 8 8 3 8 8 8
North Carolina Greater Asheville 7 9 9 7 6 6 7 6 7 6 3 3 6 5 2
North Carolina Metro Charlotte 1 2 2 2 1 4 3 4 1 2 7 2 1 1 1
North Carolina Metro Raleigh 3 1 7 1 3 3 2 1 3 1 5 6 5 4 3
North Carolina Northern Central North Carolina 2 3 6 3 4 2 4 2 2 5 2 8 2 3 7
North Carolina Southern North Carolina 4 6 4 9 5 7 7 9 9 9 3 3 3 2 4
North Carolina Western Central North Carolina 8 7 5 4 6 1 4 7 4 4 9 9 9 9 9
North Carolina Western North Carolina 6 4 8 8 9 9 9 8 7 3 1 1 4 7 6
New Hampshire Northern New Hampshire 3 3 3 3 3 3 3 3 3 3 1 1 2 3 3
New Hampshire Seacoast 2 2 2 2 2 2 2 2 2 2 3 2 3 2 2
New Hampshire Southwestern New Hampshire 1 1 1 1 1 1 1 1 1 1 2 3 1 1 1
New Jersey Delaware River 3 2 3 1 2 3 2 2 2 1 4 3 1 2 2
New Jersey Gateway 2 3 1 4 3 4 3 3 1 3 3 1 2 1 1
New Jersey Shore 1 1 2 3 1 1 4 4 3 4 1 2 4 3 3
New Jersey Skyland 4 4 4 2 4 2 1 1 4 1 2 4 3 4 4
New York Central New York 5 4 8 7 6 6 6 8 7 6 3 4 7 7 7
New York Finger Lakes 7 5 2 8 8 8 8 7 8 8 2 1 8 5 8
New York Long Island 3 2 1 4 5 3 5 4 4 4 8 6 4 6 2
New York Lower-Hudson 1 1 5 5 7 7 2 3 5 7 7 5 3 3 4
New York Mid-Hudson 4 3 4 6 4 4 7 6 6 5 6 8 1 1 3
New York New York City 2 7 3 1 2 2 1 2 2 1 4 3 5 4 1
New York Southern New York 6 5 7 2 3 4 4 1 1 2 1 7 6 8 6
New York Western New York 8 8 6 3 1 1 3 5 3 3 5 2 2 2 5
Ohio Central Ohio 2 1 2 3 2 1 4 3 3 4 1 1 2 1 1
Ohio Central Western Ohio 5 5 5 5 5 5 5 5 5 5 3 3 4 2 3
Ohio Eastern Ohio 3 3 3 4 3 2 2 2 4 3 2 2 5 3 2
Ohio Northwestern Ohio 1 2 1 1 1 3 1 1 1 2 5 5 1 3 4
Ohio Southwestern Ohio 4 4 4 2 4 4 3 4 2 1 4 4 3 5 5
Oregon Central/Eastern Oregon 3 2 1 2 1 4 4 3 1 3 1 2 4 3 4
Oregon Metro Portland 2 3 4 1 3 2 1 1 2 1 4 3 2 2 2
Oregon Northwestern Oregon 1 1 3 3 4 1 2 3 3 2 2 1 1 1 1
Oregon Southwestern Oregon 4 4 2 4 1 3 3 2 4 4 3 4 3 4 3

21
454 Natoma Street
San Francisco, CA 94103
Table 3 (cont.)
State Region Rank 1 Rank 2 Rank 3 Rank 4 Rank 5 Rank 6 Rank 7 Rank 8 Rank 9 Rank
10 Rank
11 Rank
12 Rank
13 Rank
14 Rank
15
Pennsylvania Central Pennsylvania/Great Lakes 4 3 1 5 5 5 4 5 5 5 5 4 2 2 5
Pennsylvania Metro Philadelphia 2 4 3 3 3 4 3 3 4 2 4 3 4 5 3
Pennsylvania Metro Pittsburgh 3 2 5 4 2 2 2 4 1 4 2 2 1 3 4
Pennsylvania Northeastern Pennsylvania 5 5 4 2 4 3 5 2 2 1 3 5 5 4 2
Pennsylvania Pennsylvania Dutch Country 1 1 2 1 1 1 1 1 3 3 1 1 3 1 1
South Carolina Northeastern South Carolina 4 4 4 4 4 4 4 4 4 4 3 3 4 4 4
South Carolina South Carolina Midlands 2 1 1 3 1 3 3 3 2 3 1 2 3 2 2
South Carolina South Carolina Upstate 1 2 3 2 3 2 2 2 3 2 2 1 1 1 1
South Carolina Southeastern South Carolina 3 3 2 1 2 1 1 1 1 1 4 3 2 3 3
Tennessee Central Tennessee 2 2 3 3 2 2 3 1 3 3 1 2 3 1 2
Tennessee Eastern Tennessee 1 1 2 2 3 1 1 2 2 2 2 1 2 3 3
Tennessee Western Tennessee 3 3 1 1 1 3 2 3 1 1 3 3 1 2 1
Texas East Texas 4 4 2 3 4 3 3 3 4 1 1 1 3 3 2
Texas North Texas 1 1 1 2 2 2 2 1 1 3 4 4 4 4 1
Texas South Texas 2 3 4 4 3 4 4 4 3 4 3 2 1 1 4
Texas West Texas 3 2 3 1 1 1 1 2 2 2 2 3 2 2 3
Utah Central/Southern Utah 2 2 3 2 2 2 1 2 2 2 2 2 1 1 1
Utah Northern Utah 1 1 1 1 1 1 1 1 1 1 3 1 3 2 3
Utah Salt Lake City 3 3 2 3 3 3 3 3 2 3 1 3 2 2 2
Virginia Central/Eastern Virginia 4 4 5 3 4 5 4 5 3 3 3 2 2 3 5
Virginia Hampton Roads 5 5 4 4 3 4 5 3 4 4 5 5 5 6 4
Virginia Northern Virginia 3 3 2 2 2 2 1 1 2 1 1 3 1 1 1
Virginia Northern Virginia: Metro DC 1 1 3 1 1 1 2 2 1 2 2 4 3 5 3
Virginia Western Valley 2 2 1 5 5 3 3 3 5 6 4 1 4 2 2
Virginia Western Virginia 6 6 6 6 6 6 6 6 6 5 6 6 6 4 6
Washington Eastern Washington 3 2 5 5 5 5 5 5 5 5 5 5 2 2 2
Washington Metro Seattle 4 4 3 4 4 4 4 4 3 4 2 1 1 1 1
Washington Northwestern Washington 2 3 2 2 3 1 3 3 1 1 4 2 3 5 4
Washington Southwestern Washington 1 1 4 1 2 2 1 2 4 2 3 3 4 3 5
Washington Western Washington 5 5 1 3 1 3 2 1 2 3 1 4 5 4 3
Wisconsin Metro Milwaukee 3 2 1 1 1 1 1 3 2 3 2 4 2 4 4
Wisconsin Northeastern Wisconsin 4 4 3 3 4 3 4 4 1 1 3 1 4 3 3
Wisconsin Southern Central Wisconsin 1 1 2 4 3 2 3 2 4 4 1 2 1 1 2
Wisconsin Western Wisconsin 2 3 4 2 2 4 2 1 2 2 4 3 3 2 1
22
454 Natoma Street
San Francisco, CA 94103
Table 4: National Region Rankings
Region State Rank 1 Rank 2 Rank 3 Rank 4 Rank 5 Rank 6 Rank 7 Rank 8 Rank 9 Rank
10 Rank
11 Rank
12 Rank
13 Rank
14 Rank
15
Mid-Atlantic Virginia 1 1 1 2 2 2 3 2 2 2 2 1 7 4 1
Mid-Atlantic Pennsylvania 2 3 6 4 4 6 5 4 3 3 6 4 4 5 5
Mid-Atlantic Delaware 3 5 2 3 6 2 2 1 5 5 7 7 3 3 4
Mid-Atlantic Maryland 4 2 5 6 5 5 6 6 4 4 4 3 2 2 2
Mid-Atlantic Washington DC 5 7 7 1 1 1 1 3 1 1 1 2 1 1 6
Mid-Atlantic New Jersey 6 4 3 5 3 4 4 5 6 6 3 5 6 7 7
Mid-Atlantic New York 7 6 4 7 7 7 7 7 7 7 5 6 5 6 3
Region State Rank 1 Rank 2 Rank 3 Rank 4 Rank 5 Rank 6 Rank 7 Rank 8 Rank 9 Rank
10 Rank
11 Rank
12 Rank
13 Rank
14 Rank
15
Midwest Nebraska 1 2 1 3 8 3 5 3 7 4 2 10 1 1 1
Midwest Kansas 2 1 10 5 9 7 3 6 10 2 3 1 5 4 7
Midwest Indiana 3 3 2 2 2 2 2 2 2 3 7 9 7 5 3
Midwest Minnesota 4 5 5 4 3 5 6 7 3 5 4 5 3 3 4
Midwest Missouri 5 4 6 6 5 4 4 5 8 8 8 6 9 10 2
Midwest Iowa 6 8 3 1 1 1 1 1 1 1 1 4 2 2 10
Midwest Wisconsin 7 6 8 8 10 9 7 4 5 10 6 7 4 7 9
Midwest Ohio 8 9 7 7 4 6 8 8 4 6 10 8 10 9 8
Midwest Illinois 9 7 4 9 6 8 10 10 6 7 9 3 8 8 6
Midwest Michigan 10 10 9 10 7 10 9 9 9 9 5 2 6 6 5
Region State Rank 1 Rank 2 Rank 3 Rank 4 Rank 5 Rank 6 Rank 7 Rank 8 Rank 9 Rank
10 Rank
11 Rank
12 Rank
13 Rank
14 Rank
15
New England New Hampshire 1 1 5 1 3 1 1 1 1 2 6 4 2 5 6
New England Maine 2 4 6 4 5 6 2 4 4 3 3 6 5 3 1
New England Massachusetts 3 3 3 3 4 5 3 5 2 4 4 2 3 2 3
New England Connecticut 4 2 4 2 2 4 4 3 3 1 5 5 6 6 3
New England Vermont 5 5 2 5 1 2 5 2 6 6 1 3 4 1 2
New England Rhode Island 6 6 1 6 6 3 6 6 5 5 2 1 1 4 5

23
454 Natoma Street
San Francisco, CA 94103
Table 4 (cont.)
Region State Rank 1 Rank 2 Rank 3 Rank 4 Rank 5 Rank 6 Rank 7 Rank 8 Rank 9 Rank
10 Rank
11 Rank
12 Rank
13 Rank
14 Rank
15
South Texas 1 3 6 2 5 1 1 5 5 3 7 9 6 8 6
South Oklahoma 2 2 3 4 2 3 9 4 3 2 5 4 5 5 2
South Louisiana 3 5 12 1 4 4 5 1 2 1 1 1 2 3 5
South Georgia 4 4 7 8 7 6 8 9 9 9 6 3 11 12 3
South Alabama 5 7 8 3 3 7 2 2 6 4 2 2 8 2 4
South Arkansas 6 1 10 9 9 11 10 3 7 7 3 12 1 1 1
South South Carolina 7 6 1 5 1 2 7 8 1 6 8 7 4 6 11
South Kentucky 8 9 11 11 12 8 11 11 12 12 11 10 3 9 7
South Tennessee 9 8 3 6 6 5 4 6 4 5 4 5 7 4 10
South Mississippi 10 12 2 7 8 9 3 7 7 8 12 11 9 11 12
South North Carolina 11 10 5 12 11 12 12 12 11 11 10 8 10 7 8
South Florida 12 11 9 10 10 10 6 10 10 10 9 6 12 10 9
Region State Rank 1 Rank 2 Rank 3 Rank 4 Rank 5 Rank 6 Rank 7 Rank 8 Rank 9 Rank
10 Rank
11 Rank
12 Rank
13 Rank
14 Rank
15
West Idaho 1 1 8 1 1 1 1 1 1 1 1 2 3 5 4
West Utah 2 2 1 2 2 4 3 2 3 2 5 6 2 2 1
West Colorado 3 4 2 4 5 3 4 3 7 4 7 9 8 7 5
West Nevada 4 5 5 3 3 2 2 4 2 3 8 3 11 10 6
West Montana 5 8 7 9 11 11 7 6 5 9 11 1 1 6 2
West Oregon 6 3 10 5 6 6 6 5 4 5 3 7 4 3 10
West Arizona 7 7 3 6 7 5 5 7 8 7 9 5 6 4 9
West Washington 8 6 6 7 8 7 9 8 9 8 2 11 10 9 8
West New Mexico 9 10 9 8 4 10 11 11 6 6 4 4 7 1 3
West California 10 9 4 10 9 9 10 10 10 9 6 10 9 8 11
West Hawaii 11 11 11 11 10 8 8 9 11 11 10 8 5 11 7

24
454 Natoma Street
San Francisco, CA 94103
Appendix C: Linear Regressions
Table 1: Nation
Regression Statistics
R 0.59644
R Square 0.35574
Adjusted R Square 0.35364
S 2.08401
Total number of observations 3376
ANOVA d.f. SS MS F p-level
Regression 11. 8,067.43014 733.40274 168.86567 0.0000
Residual 3,364. 14,610.23307 4.34311
Total 3,375.
22,677.66321
Coefficient Standard Error LCL UCL t Stat p-level
H0 (2%) rejected?
Intercept 2.8536 0.2448 2.2838 3.4234 11.6564 0.0000 Yes
How much does it cost to hire a new employee in addition to their salary? 0.117 0.0183 0.0745 0.1595 6.4013 0.0000 Yes
Health and safety regulations 0.2148 0.0586 0.0783 0.3513 3.6629 0.0003 Yes
Employment, labor and hiring regulations 0.2087 0.0579 0.0739 0.3434 3.6045 0.0003 Yes
Tax code and tax-related regulations 0.2436 0.0546 0.1166 0.3706 4.4637 0.0000 Yes
Licensing forms, requirements and fees 0.4232 0.0497 0.3075 0.5388 8.5162 0.0000 Yes
Environmental regulations -0.0168 0.0593 -0.1548 0.1211 -0.2842 0.7763 No
Zoning or land use regulations 0.1137 0.0545 -0.0131 0.2406 2.0864 0.037 No
How would you rate your company's financial situation today? 0.3661 0.0381 0.2775 0.4548 9.6106 0.0000 Yes
How do you think your company's financial situation will be 12 months from now? 0.4208 0.0461 0.3134 0.5282 9.1207 0.0000 Yes Are you aware of your state or local government offering training programs for small business owners? 0.4457 0.0866 0.2442 0.6472 5.1475 0.0000 Yes Are you aware of your state or local government offering networking programs for small business owners? 0.3483 0.1016 0.1119 0.5848 3.4291 0.0006 Yes

25
454 Natoma Street
San Francisco, CA 94103
Table 2: California
Regression Statistics
R 0.63892 R Square 0.40822 Adjusted R Square 0.39486 S 2.24231 Total number of observations 499 ANOVA d.f. SS MS F p-level
Regression 11. 1,689.1072 153.5552 30.54041 0.0000
Residual 487. 2,448.6042
2 5.02793
Total 498. 4,137.7114
2
Coefficients Standard
Error LCL UCL t Stat p-level H0 (2%) rejected?
Intercept 1.12579 0.63178 -0.3488 2.60038 1.78194 0.07538 No
How much does it cost to hire a new employee in addition to their salary? 0.23374 0.04767 0.12247 0.345 4.90314 0. 0000 Yes
Health and safety regulations 0.09731 0.16172 -0.28014 0.47475 0.60171 0.54765 No
Employment, labor and hiring regulations 0.50381 0.16741 0.11307 0.89455 3.00946 0.00275 Yes
Tax code and tax-related regulations -0.08253 0.16859 -0.47603 0.31097 -0.48954 0.62468 No
Licensing forms, requirements and fees 0.633 0.14945 0.28416 0.98183 4.23536 0.00003 Yes
Environmental regulations 0.2051 0.15056 -0.14631 0.55652 1.36226 0.17374 No
Zoning or land use regulations -0.0434 0.15678 -0.40934 0.32253 -0.27684 0.78202 No
How would you rate your company's financial situation today? 0.35191 0.10549 0.1057 0.59813 3.336 0.00091 Yes
How do you think your company's financial situation will be 12 months from now? 0.41135 0.12027 0.13062 0.69207 3.42005 0.00068 Yes Are you aware of your state or local government offering training programs for small business owners? 0.30385 0.24525 -0.26857 0.87627 1.23894 0.21597 No Are you aware of your state or local government offering networking programs for small business owners? 0.13664 0.29846 -0.55999 0.83326 0.4578 0.6473 No

26
454 Natoma Street
San Francisco, CA 94103
Table 3: Texas
Regression Statistics
R 0.63069 R Square 0.39777 Adjusted R Square 0.36958 S 1.81251 Total number of observations 247 ANOVA d.f. SS MS F p-level
Regression 11. 509.91522 46.35593 14.11057 0.0000 Residual 235. 772.02 3.28519
Total 246. 1,281.93522
Coefficients Standard
Error LCL UCL t Stat p-level H0 (2%) rejected?
Intercept 4.67345 0.99964 2.33197 7.01492 4.67513 0.0000 Yes
How much does it cost to hire a new employee in addition to their salary? 0.006 0.06716 -0.1513 0.1633 0.08931 0.92891 No
Health and safety regulations 0.09797 0.20393 -0.37971 0.57565 0.4804 0.63139 No
Employment, labor and hiring regulations 0.13054 0.19482 -0.32579 0.58686 0.67006 0.50348 No
Tax code and tax-related regulations 0.55904 0.18322 0.12989 0.98818 3.05125 0.00254 Yes
Licensing forms, requirements and fees 0.46888 0.18923 0.02564 0.91212 2.47783 0.01392 Yes
Environmental regulations -0.37178 0.1767 -0.78566 0.04211 -2.10402 0.03644 No
Zoning or land use regulations 0.13582 0.17756 -0.28009 0.55173 0.76489 0.4451 No
How would you rate your company's financial situation today? 0.46967 0.12089 0.18651 0.75283 3.88515 0.00013 Yes
How do you think your company's financial situation will be 12 months from now? 0.43899 0.15193 0.08312 0.79485 2.88943 0.00422 Yes Are you aware of your state or local government offering training programs for small business owners? -0.2169 0.28527 -0.88511 0.4513 -0.76033 0.44782 No Are you aware of your state or local government offering networking programs for small business owners? 1.24956 0.35881 0.40911 2.09 3.48251 0.00059 Yes

27
454 Natoma Street
San Francisco, CA 94103
Table 4: Special Regulatory Requirements Imposed on Respondent's Profession
Regression Statistics
R 0.63526 R Square 0.40355 Adjusted R Square 0.39838 S 2.10938 Total number of observations 1397 ANOVA d.f. SS MS F p-level
Regression 12. 4,166.53871 347.21156 78.03409 0.0000 Residual 1,384. 6,158.08835 4.44949
Total 1,396.
10,324.62706
Coefficients Standard Error LCL UCL t Stat p-level
H0 (2%) rejected?
Intercept 1.8945 0.3637 1.0475 2.7416 5.2092 0.0000 Yes
How much does it cost to hire a new employee in addition to their salary? 0.1341 0.0288 0.0669 0.2013 4.6494 0.0000 Yes
Health and safety regulations 0.1926 0.0876 -0.0115 0.3967 2.1983 0.0281 No
Employment, labor and hiring regulations 0.1312 0.086 -0.069 0.3314 1.5265 0.1271 No
Tax code and tax-related regulations 0.2745 0.0825 0.0822 0.4667 3.3251 0.0009 Yes
Licensing forms, requirements and fees 0.2302 0.073 0.0602 0.4002 3.1537 0.0016 Yes
Environmental regulations -0.0513 0.0893 -0.2593 0.1566 -0.5748 0.5655 No
Zoning or land use regulations 0.0969 0.0803 -0.0902 0.2839 1.206 0.228 No
How would you rate your company's financial situation today? 0.391 0.059 0.2535 0.5284 6.6245 0.0000 Yes
How do you think your company's financial situation will be 12 months from now? 0.3431 0.0726 0.174 0.5123 4.7251 0.0000 Yes Are you aware of your state or local government offering training programs for small business owners? 0.22 0.1352 -0.0949 0.5348 1.6273 0.1039 No Are you aware of your state or local government offering networking programs for small business owners? 0.2735 0.1584 -0.0955 0.6426 1.7264 0.0845 No How difficult or easy is it to comply with your state's regulatory requirements for your profession? 0.5892 0.056 0.4587 0.7197 10.5121 0.0000 Yes

28
454 Natoma Street
San Francisco, CA 94103
Table 5: No Special Regulatory Requirements Imposed on Respondent's Profession
Regression Statistics
R 0.5935 R Square 0.35224 Adjusted R Square 0.34856 S 1.99391 Total number of observations 1950 ANOVA d.f. SS MS F p-level
Regression 11. 4,189.74723 380.88611 95.80373 0.0000 Residual 1,938. 7,704.89072 3.97569
Total 1,949.
11,894.63795
Coefficients
Standard Error LCL UCL t Stat p-level
H0 (2%) rejected?
Intercept 3.43962 0.32824 2.67538 4.20387 10.47886 0.0000 Yes
How much does it cost to hire a new employee in addition to their salary? 0.07226 0.02321 0.01821 0.1263 3.11296 0.00188 Yes
Health and safety regulations 0.17519 0.07724 -0.00465 0.35503 2.2681 0.02343 No
Employment, labor and hiring regulations 0.26479 0.07656 0.08655 0.44303 3.45877 0.00055 Yes
Tax code and tax-related regulations 0.23385 0.07135 0.06772 0.39997 3.27739 0.00107 Yes
Licensing forms, requirements and fees 0.46317 0.06799 0.30486 0.62147 6.81185 1.28138E-11 Yes
Environmental regulations -0.02737 0.07726 -0.20724 0.1525 -0.35428 0.72317 No
Zoning or land use regulations 0.08239 0.07251 -0.08643 0.25121 1.13622 0.256 No
How would you rate your company's financial situation today? 0.34861 0.04879 0.23501 0.46222 7.14481 1.27021E-12 Yes
How do you think your company's financial situation will be 12 months from now? 0.4021 0.05864 0.26557 0.53862 6.85728 9.40392E-12 Yes Are you aware of your state or local government offering training programs for small business owners? 0.57631 0.11028 0.31956 0.83307 5.22598 0.0000 Yes Are you aware of your state or local government offering networking programs for small business owners? 0.40136 0.12929 0.10033 0.70238 3.10428 0.00194 Yes

29
454 Natoma Street
San Francisco, CA 94103
Table 6: Effect of Imposition of Special Professional Requirements
Regression Statistics
R 0.60066 R Square 0.3608 Adjusted R Square 0.3585 S 2.07691 Total number of observations 3359 ANOVA d.f. SS MS F p-level
Regression 12. 8,146.75377 678.89615 157.38631 0.0000
Residual 3,346. 14,433.18966 4.31357
Total 3,358.
22,579.94344
Coefficients
Standard Error LCL UCL t Stat p-level
H0 (2%) rejected?
Intercept 3.07447 0.24995 2.49274 3.65621 12.30057 0.0000 Yes
How much does it cost to hire a new employee in addition to their salary? 0.11189 0.01827 0.06937 0.15442 6.12412 0.0000 Yes
Health and safety regulations 0.22368 0.0585 0.08752 0.35985 3.82344 0.00013 Yes
Employment, labor and hiring regulations 0.20838 0.05778 0.0739 0.34285 3.60658 0.00031 Yes
Tax code and tax-related regulations 0.23738 0.05444 0.11067 0.36409 4.36035 0.00001 Yes
Licensing forms, requirements and fees 0.41544 0.04968 0.29981 0.53107 8.36222 1.11022E-16 Yes
Environmental regulations -0.02013 0.05909 -0.15766 0.11741 -0.34059 0.73343 No
Zoning or land use regulations 0.1117 0.05439 -0.01489 0.2383 2.05369 0.04008 No
How would you rate your company's financial situation today? 0.37085 0.03813 0.28211 0.45959 9.7271 0.0000 Yes
How do you think your company's financial situation will be 12 months from now? 0.41403 0.04614 0.30665 0.52142 8.97356 0.0000 Yes Are you aware of your state or local government offering training programs for small business owners? 0.44901 0.08659 0.24747 0.65055 5.18537 0.0000 Yes Are you aware of your state or local government offering networking programs for small business owners? 0.35291 0.10153 0.1166 0.58921 3.47593 0.00052 Yes
Does your state impose any special regulatory requirements on your profession? -0.32464 0.0733 -0.49525 -0.15403 -4.42884 0.00001 Yes

30
454 Natoma Street
San Francisco, CA 94103
Appendix D: Demographics
Table 1: Gender % more (less) likely a Female
small business owner is to rate the state as supportive
vs. her Male counterpart
% more (less) likely a Female small business owner is to rate
the state as easy to start a business vs. her Male
counterpart
% more (less) likely a Female small business owner is to rate
her company's financial situation today as good or very good vs.
her Male counterpart
% more (less) likely a Female small business owner is to rate
her company's financial situation in a year as better vs.
her Male counterpart
NATION 8.85% 9.85% -7.54% 5.15%
AL 33.33% 66.67% 7.14% 12.50%
AR 42.86% -6.25% 150.00% 10.00%
AZ -16.00% -2.89% -41.98% -0.02%
CA 37.39% 16.95% -15.91% 8.38%
CO -10.61% 25.27% 14.23% 7.78%
CT -5.88% -38.38% -48.24% 15.00%
DE 125.00% 8.00% -100.00% -29.63%
FL 0.83% 4.12% -7.79% 5.41%
GA 12.46% 31.17% 9.46% 15.94%
HI -22.08% 36.36% -12.73% -52.78%
IA -50.55% -76.19% 42.86% -86.67%
ID 17.95% -7.69% 10.77% -8.33%
IL 6.78% -3.03% -7.76% 7.47%
IN -2.86% 4.35% 14.29% 1.79%
KS 27.68% 11.43% -13.33% -34.62%
KY 0.00% 55.56% -3.03% 6.25%
LA -46.67% -12.73% 68.00% 33.33%
MA 5.10% 35.00% -15.38% -0.91%
MD 34.69% 31.90% -52.27% 15.46%
ME 166.67% 33.33% -33.33% 10.00%
MI 9.76% 1.87% 34.69% -3.77%
MN -1.09% 14.27% -17.02% 5.54%
MO 1.60% -26.37% -30.34% 7.76%
MS -11.11% -100.00% -100.00% -200.00%
MT 60.00% 300.00% -11.11% -31.25%
NC 9.09% 9.33% 21.88% 0.94%
NE -22.22% -2.78% 55.56% 0.00%
NH -0.62% 14.29% -14.67% 14.06%
NJ 8.44% 15.48% -8.66% 8.62%
NM -10.00% -25.00% -70.00% -25.93%
NV -13.73% -9.78% -2.89% -4.92%
NY 28.79% 26.81% 1.32% 5.86%
OH 13.32% -7.43% 21.01% 12.59%
OK 10.92% -2.26% 28.57% 6.35%
OR 23.19% 39.87% -10.25% -8.24%
PA -6.58% -7.32% -6.66% 4.07%
RI 71.43% 125.00% 50.00% 33.33%
SC 6.99% -9.47% 17.00% 14.65%
TN 2.71% 13.72% 37.67% 14.97%
TX 1.60% -2.00% -15.82% 7.73%
UT -14.47% 5.26% -26.32% -14.00%
VA 5.55% 30.88% 6.27% 1.99%
VT 12.50% -55.00% -62.50% -33.33%
WA 0.67% 1.66% -32.66% 1.12%
WI -5.71% 14.29% 50.46% 1.58%

31
454 Natoma Street
San Francisco, CA 94103
Table 2: Political Orientation % more
(less) likely a Conservative
small business
owner is to rate the state as
supportive vs. his
Independent counterpart
% more (less) likely a Conservative
small business
owner is to rate the state as
supportive vs. his Liberal
counterpart
% more (less) likely
an Independent
small business
owner is to rate the state as
supportive vs. his Liberal
counterpart
% more (less) likely a Conservative
small business
owner is to rate the
state as easy to start a
business vs. his
Independent counterpart
% more (less) likely a Conservative
small business
owner is to rate the
state as easy to start a
business vs. his Liberal
counterpart
% more (less) likely
an Independent
small business
owner is to rate the
state as easy to start a
business vs. his Liberal
counterpart
% more (less) likely a
Conservative small business
owner is to rate her
company's financial situation
today as good or very good
vs. her Independent counterpart
% more (less) likely a
Conservative small business
owner is to rate her
company's financial situation
today as good or very good
vs. her Liberal counterpart
% more (less) likely an
Independent small business
owner is to rate her
company's financial situation
today as good or very good
vs. her Liberal counterpart
% more (less) likely a
Conservative small business
owner is to rate her company's
financial situation in a year as better than today vs.
her Independent counterpart
% more (less) likely a
Conservative small
business owner is to
rate her company's
financial situation in a year as better than today vs.
her Liberal counterpart
% more (less) likely an
Independent small business
owner is to rate her
company's financial
situation in a year as better than today vs.
her Liberal counterpart
NATION 1.8% 0.4% -1.4% 16.3% -0.5% -14.4% 23.3% 17.0% -5.1% 0.0% -8.0% -8.0%
AL 3.9% n/a n/a 6.1% n/a n/a 90.9% n/a n/a 11.1% n/a n/a
AR 2.9% 71.4% 66.7% -31.4% -42.9% -16.7% 28.6% -57.1% -66.7% -14.3% -14.3% 0.0%
AZ 3.4% -22.4% -25.0% 57.6% -12.0% -44.1% 72.1% -2.2% -43.2% 0.0% -9.9% -9.9%
CA -18.5% -30.5% -14.6% -15.0% -33.0% -21.3% 48.6% 29.1% -13.1% -2.7% -15.1% -12.7%
CO -21.1% -27.8% -8.4% -3.1% -7.2% -4.3% 15.5% 39.1% 20.5% -13.9% -23.6% -11.3%
CT 3.3% 52.7% 47.8% -23.0% 1.8% 32.2% 40.3% 90.9% 36.1% -3.0% -21.7% -19.2%
DE 6.7% 0.0% -6.2% 166.7% 50.0% -43.8% 433.3% 100.0% -62.5% -11.1% 0.0% 12.5%
FL 17.6% 26.2% 7.3% 38.8% 23.9% -10.8% 25.1% 4.8% -16.2% 4.5% 3.4% -1.1%
GA -25.2% -4.3% 27.9% 5.3% -10.4% -14.9% -38.8% -42.8% -6.5% -11.8% 5.6% 19.7%
HI -35.0% -20.0% 23.1% 56.0% 260.0% 130.8% -13.3% 20.0% 38.5% -48.0% -52.0% -7.7%
IA 20.0% -4.0% -20.0% 20.0% -40.0% -50.0% -28.0% 20.0% 66.7% -28.0% -60.0% -44.4%
ID 21.9% 40.6% 15.4% 9.4% 181.3% 157.1% -12.5% 31.3% 50.0% 13.8% -18.8% -28.6%
IL 0.9% 5.8% 4.8% 6.1% 18.1% 11.2% -42.6% -8.6% 59.2% -0.1% -9.9% -9.8%
IN 5.6% 47.8% 40.0% 39.8% -13.0% -37.8% 4.3% -30.4% -33.3% -0.9% -0.9% 0.0%
KS -7.1% -27.8% -22.2% 185.7% 14.3% -60.0% 2.9% -14.3% -16.7% -4.8% -4.8% 0.0%
KY 16.1% 42.9% 23.1% -53.6% -71.4% -38.5% -7.1% -14.3% -7.7% -7.1% -21.4% -15.4%
LA -27.3% n/a n/a 12.0% -30.0% -37.5% 145.0% -30.0% -71.4% -4.5% -30.0% -26.7%
MA 5.9% -25.4% -29.6% 11.2% 0.0% -10.1% 7.5% 48.5% 38.1% -9.8% -16.9% -7.9%
MD -31.5% 20.3% 75.5% -42.7% -48.9% -10.7% 22.3% 143.5% 99.1% -8.8% -14.9% -6.7%
ME 37.5% -50.0% -63.6% 37.5% -50.0% -63.6% 175.0% n/a n/a -38.9% -50.0% -18.2%
MI -10.1% -13.0% -3.2% 24.1% -28.4% -42.2% 0.7% -3.2% -3.8% -0.7% -11.2% -10.6%

32
454 Natoma Street
San Francisco, CA 94103
Table 2 (cont.) % more
(less) likely a Conservative
small business
owner is to rate the state as
supportive vs. his
Independent counterpart
% more (less) likely a Conservative
small business
owner is to rate the state as
supportive vs. his Liberal
counterpart
% more (less) likely
an Independent
small business
owner is to rate the state as
supportive vs. his Liberal
counterpart
% more (less) likely a Conservative
small business
owner is to rate the
state as easy to start a
business vs. his
Independent counterpart
% more (less) likely a Conservative
small business
owner is to rate the
state as easy to start a
business vs. his Liberal
counterpart
% more (less) likely
an Independent
small business
owner is to rate the
state as easy to start a
business vs. his Liberal
counterpart
% more (less) likely a
Conservative small business
owner is to rate her
company's financial
situation today as good or very
good vs. her Independent counterpart
% more (less) likely a
Conservative small business
owner is to rate her
company's financial situation
today as good or very good
vs. her Liberal counterpart
% more (less) likely an
Independent small business
owner is to rate her
company's financial situation
today as good or very good
vs. her Liberal counterpart
% more (less) likely a
Conservative small business
owner is to rate her company's
financial situation in a year as better than today vs.
her Independent counterpart
% more (less) likely a
Conservative small business
owner is to rate her
company's financial
situation in a year as better than today vs.
her Liberal counterpart
% more (less) likely an
Independent small business
owner is to rate her
company's financial
situation in a year as better than today vs.
her Liberal counterpart
MO 32.2% 68.8% 27.7% 20.2% 27.9% 6.5% 23.0% 12.2% -8.8% 17.2% 5.0% -10.4%
MS 0.0% 12.5% 12.5% 300.0% n/a n/a 100.0% n/a n/a 33.3% 50.0% 12.5%
MT -41.7% n/a n/a 162.5% n/a n/a -41.7% n/a n/a 40.0% n/a n/a
NC -2.0% -8.3% -6.4% 44.7% 35.3% -6.5% 42.9% 3.6% -27.5% -5.6% -1.8% 4.0%
NE -13.3% 20.0% 38.5% -25.7% -46.7% -28.2% 73.3% 220.0% 84.6% 0.0% 0.0% 0.0%
NH -36.0% -23.6% 19.3% -9.6% -25.8% -17.9% 33.9% 27.3% -4.9% -4.5% -36.4% -33.3%
NJ 8.7% -3.4% -11.2% -8.0% 3.5% 12.5% -18.2% 4.0% 27.2% -10.0% -26.9% -18.7%
NM 24.4% 620.0% 478.6% -6.7% -28.0% -22.9% 180.0% 35.0% -51.8% 16.7% 28.6% 10.2%
NV 43.7% 71.4% 19.3% 22.1% -11.6% -27.6% -18.6% -42.9% -29.8% 4.0% 2.9% -1.1%
NY -17.0% -37.4% -24.5% 0.8% -12.5% -13.2% 35.2% 4.3% -22.8% 3.2% -13.2% -15.8%
OH 14.5% 17.5% 2.6% 5.2% -9.1% -13.6% 32.5% 40.3% 5.8% 15.0% 26.5% 10.0%
OK 10.2% 16.7% 5.9% 9.1% 5.9% -2.9% 136.1% 66.7% -29.4% -5.9% 182.4% 200.0%
OR -26.5% -25.3% 1.6% -13.6% -38.6% -28.9% 22.6% 14.2% -6.8% 14.9% 8.4% -5.7%
PA -4.0% -10.9% -7.2% 11.1% -7.5% -16.8% -2.7% 7.2% 10.1% -2.9% -18.8% -16.4%
RI -7.1% -25.0% -19.2% -18.8% -62.5% -53.8% 95.0% 125.0% 15.4% 8.3% -25.0% -30.8%
SC 36.8% -26.3% -46.2% 31.4% 68.4% 28.2% 0.0% -36.8% -36.8% 6.2% -21.1% -25.6%
TN -16.8% 0.3% 20.6% 59.1% 53.5% -3.5% -2.1% -20.3% -18.6% 6.0% 0.3% -5.4%
TX 13.7% 11.7% -1.7% 29.9% -1.1% -23.9% 56.8% 28.9% -17.8% -2.1% 0.0% 2.1%
UT 4.9% -11.7% -15.8% 12.9% 3.0% -8.8% 12.5% 33.3% 18.5% -2.8% -6.5% -3.8%
VA 3.4% 17.6% 13.7% 17.8% -12.9% -26.1% -19.2% -31.4% -15.1% 6.0% -19.1% -23.6%
VT -100.0% -100.0% -46.4% -100.0% -100.0% -28.6% -12.5% 25.0% 42.9% -50.0% -50.0% 0.0%
WA 1.0% -26.7% -27.4% 9.5% -15.2% -22.5% 111.1% 60.0% -24.2% 6.0% -13.6% -18.4%
WI 21.9% 75.0% 43.6% -24.2% 18.7% 56.5% -10.8% 22.2% 37.0% -13.0% -2.6% 11.9%