small crack detection in cementitious materials using
TRANSCRIPT
Small crack detection in cementitious materials using nonlinear codawave modulation
Benoit Hilloulin a,n, Yuxiang Zhang b,c,d, Odile Abrahamb, Ahmed Loukili a,Frédéric Grondin a, Olivier Durand b, Vincent Tournat c
a LUNAM Université, Institut de Recherche en Génie Civil et Mécanique (GeM), UMR-CNRS 6183, Ecole Centrale de Nantes, 1 rue de la Noë,44321 Nantes, Franceb LUNAM Université, IFSTTAR, GERS, CS4, F-44344 Bouguenais Cedex, Francec LUNAM Université, LAUM, CNRS UMR 6613, Université du Maine, Av. O. Messiaen, 72085 Le Mans Cedex 9, Franced ISTerre, Université Joseph Fourier, 1381 rue de la Piscine, 38400 Grenoble, France
a r t i c l e i n f o
Article history:Received 15 April 2014Received in revised form25 August 2014Accepted 29 August 2014Available online 6 September 2014
Keywords:Ultrasonic wave speedConcreteCracksHealth monitoring
a b s t r a c t
This paper presents an ultrasonic method, based on the nonlinear acoustic mixing of coda waves withlower-frequency swept pump waves, for providing an efficient global detection of small cracks incementitious materials. By simultaneously comparing, for both uncracked and cracked mortars, theultrasonic velocity variations and decorrelation coefficients between the unperturbed and perturbedsignals with pump amplitude, this method makes it possible to accurately detect cracks with widths ofaround 20 mm in correlation with velocity variations of approximately 0.01%. The potential influence ofcertain material parameters such as microscopic damage is also discussed.
& 2014 Elsevier Ltd. All rights reserved.
1. Introduction
Concrete is a widely used construction material by virtue of itscost and mechanical properties. Due to its low tensile strengthhowever, concrete is very sensitive to crack formation. Cracks aretaken into consideration in design code recommendations, yetthey still endanger the durability of structures since aggressivesubstances can easily penetrate and deteriorate the material,leading in some cases to structural failure. Cracks are alsopotentially involved when leakage is detected [1]. Cracks inconcrete are therefore responsible for significant inspection, main-tenance and repair costs [2,3]. In order to optimize structuralhealth management, Non-Destructive Testing (NDT) has beenextensively studied. Among all NDT techniques, ultrasonic meth-ods are considered advantageous by providing information onmechanical properties in areas not directly accessible from thesurface. The damage of a concrete structure, in the form of cracksfor example, changes the structure's mechanical properties andcan therefore be detected and monitored using an ultrasonic NDT
method. In general however, linear ultrasonic methods are onlyable to detect relatively large cracks, either by monitoring thecrack influence on the effective acoustic properties of the mediumor through the acoustic scattering caused by the crack. In theformer case, in-depth knowledge of the medium properties with-out the crack is required, but such a condition is unrealistic forconcrete due, for instance, to the evolution of medium acousticproperties with time or temperature. In the latter case, theidentification of an acoustic echo from the crack requires boththe use of an acoustic wavelength of the same order of magnitudeas the crack size and the absence of strong scattering from themedium matrix. Such only occurs at wavelengths greater than afew centimeters (i.e. frequencies less than �50 kHz), where concreteacts as an effective propagation medium. To be detected, the cracksneed to be opened (in order to exhibit a sufficient acoustic mismatchwith the matrix) and have a size of a few centimeters if sizequantification is a target of the investigation [4–6]. Consequently,recent studies have led to developing nonlinear ultrasonic methodsto increase the sensitivity to damage [7,8]. In using diffuse waves, thedetection of large cracks/notches and the monitoring of crackevolution have both been achieved [9–13], which has allowedemphasizing the sensitivity of diffuse ultrasound to a crack opening.Diffuse ultrasound can also be used to monitor the evolution of crackgeometry over time [14]. However, the detection of small cracks incementitious materials remains a great challenge for NDT techniques,
Contents lists available at ScienceDirect
journal homepage: www.elsevier.com/locate/ndteint
NDT&E International
http://dx.doi.org/10.1016/j.ndteint.2014.08.0100963-8695/& 2014 Elsevier Ltd. All rights reserved.
n Corresponding author. Tel.:þ33 2 40 37 16 63.E-mail addresses: [email protected] (B. Hilloulin),
[email protected] (Y. Zhang), [email protected] (O. Abraham),[email protected] (A. Loukili), [email protected] (F. Grondin),[email protected] (O. Durand), [email protected] (V. Tournat).
NDT&E International 68 (2014) 98–104
despite the special interest in making such detections since thesecracks may lead to undesirable premature failure or leakage.
Coda Wave Interferometry (CWI), which relies on an analysis ofthe last part of the signal formed by multiple scattered waves,offers a sensitive method for detecting time-lapse perturbationson a propagation medium. This method was originally developedin order to measure small changes in wave velocity within theearth's crust [15] and was then introduced to the NDT communityby Snieder [16]. CWI has been successfully adapted to concrete,which is a highly heterogeneous material, for determining non-linear elastic properties [17] or detecting and locating a smalldefect (holes with a diameter of several millimeters) [18,19]. Bycontrolling the thermal bias [20], CWI can monitor propagationvelocities with high precision (10�3% concerning relative velocityvariations) in concrete and moreover provides information on thelevel of microcracking induced by loading [21].
In addition, nonlinear acoustic modulation amplifies thesignature of a defect when used with an acoustic load providedby a pump source. The sample is subjected to both a low-amplitude ultrasonic wave (known as a probe wave) and a large-amplitude wave at a lower frequency (known as a pump wave).If the sample contains nonlinearity, caused for example by thepresence of cracks or, more generally, contact-type defects, theprobe wave will become modulated due to the variation in localand surrounding effective elasticity (elastic modulus or acousticdissipation) resulting from pump excitation [22–27]. Manydifferent signal shapes can be input as pump and probe waves;however, the use of higher-order modulation side lobes oramplitude-modulated pump waves has shown greater sensitiv-ity to the presence of cracks than other nonlinear modulationtechniques [28].
With the objective of detecting small cracks in cementitiousmaterials, we present herein a novel NDT technique that combinesthe use of diffuse ultrasound with the nonlinear modulationmethod. Based on a previous study that had been conducted todetect extended nonlinear damage (cracks) in an initially linearmedium (glass) [29], we are proposing a simple and robustmethod to detect cracks in an initially nonlinear material (concreteor mortar).
2. Physical background and methodology
2.1. CWI analysis by means of stretching
In CWI, multiple scattered waves are introduced to detecttemporal changes in a medium considered as an interferometer.The corresponding model [16,30] allows the detection of tem-perature fluctuations [31], external loading [18] and damage[19,20]. CWI has been successfully applied to concrete [32],which contains a large quantity of scatterers of varying composi-tion, size and shape. This paper will focus on the observedvariation in elastic wave velocity associated with the presenceof a single small crack.
Two methods may be applied to estimate velocity variation:Doublet and Stretching [15,33]. Under the assumption of a uni-form velocity variation, Stretching provides more stable andaccurate results [34], hence an opportunity to increase detectionsensitivity. For this reason, the Stretching method has beenchosen to carry out the CWI analysis of this study. This methodassumes that a decrease (resp. increase) in propagation velocityδvi must be simulated by means of stretching (resp. compressing)the time axis t of a reference signal h0[t] with a given dilatationrate τi¼δvi/v0. In order to quantify the similarity between thestretched reference signal h0[t(1 þ τi)] and the test signal h1[t]within a selected time interval [t1,t2], a correlation coefficient CC
can be calculated as follows:
CC t1 ;t2ð Þh0 ;h1ð ÞðτiÞ ¼
R t2t1h0 t 1þτið Þ½ �h1½t� dtffiffiffiffiffiffiffiffiffiffiffiffiffiffiffiffiffiffiffiffiffiffiffiffiffiffiffiffiffiffiffiffiffiffiffiffiffiffiffiffiffiffiffiffiffiffiffiffiffiffiffiffiffiffiffiffiffiffiffiffiR t2
t1h20 t 1þτið Þ½ � dt R t2
t1h21½t� dt
q
Following a grid search over all reasonable values of τi, the valuethat maximizes the correlation coefficient CC(τi) is set as the searchresult and denoted α. Under the assumption that velocity changeΔvis spatially uniform, α can be considered as the relative variation ofcoda velocity since α¼Δv/v0. The perturbed velocity is thereforev1¼v0þΔv. Moreover, the decorrelation coefficient Kd¼1�CC(α)(from 0% to 100%) yields an indication of the decorrelation existingbetween the unperturbed and perturbed signals.
2.2. Nonlinear mixing via frequency-swept pump waves
In order to minimize the pump frequency dependence on theextracted α and Kd values, frequency-swept pump waves are used,as recommended in [29], instead of searching for close resonancefrequencies. With frequency-swept pump waves, several specimenmodes can be excited. Excitation occurs over a relatively wideband (in our case, 10–50 kHz, which corresponds to around 20modes numerically determined and experimentally observed). Itcan therefore be considered that the samples are excited homo-geneously in space and results are not affected by the presence oflocalized vibration nodes, thus making it possible to conduct aglobal inspection. In the following section, experiments will becarried out to demonstrate that this principle may be applied tothe detection of small cracks in mortar.
3. Experimental design
3.1. Specimen preparation
Two series of three mortar samples of equivalent geometry(7 cm�7 cm�28 cm) were mixed with a water-to-cement ratioof 0.35. Mortar mixtures consisted of 1350 g of sand (0/2 sand),450 g of Portland cement (CEM II), 155 g of water and 8 g ofsuperplasticizer (ChrysoFluid Optima 206). All mortar prepara-tions were carefully vibrated in order to minimize the amount ofoccluded air. After 1 day of curing under sealed conditions in anair-conditioned room at a temperature of 20 1C, the specimenswere demolded and further cured under moist conditions (air-conditioned room at a temperature of 20 1C and 480% relativehumidity (RH)) for series 1, or cured under sealed conditions andwrapped in aluminum foil for series 2. After one week, a notch1.5 cm deep and 5 mm wide was cut at the center of all beams inorder to initiate cracking on the cracked specimens. The specimenswere once again placed under the same curing conditions.
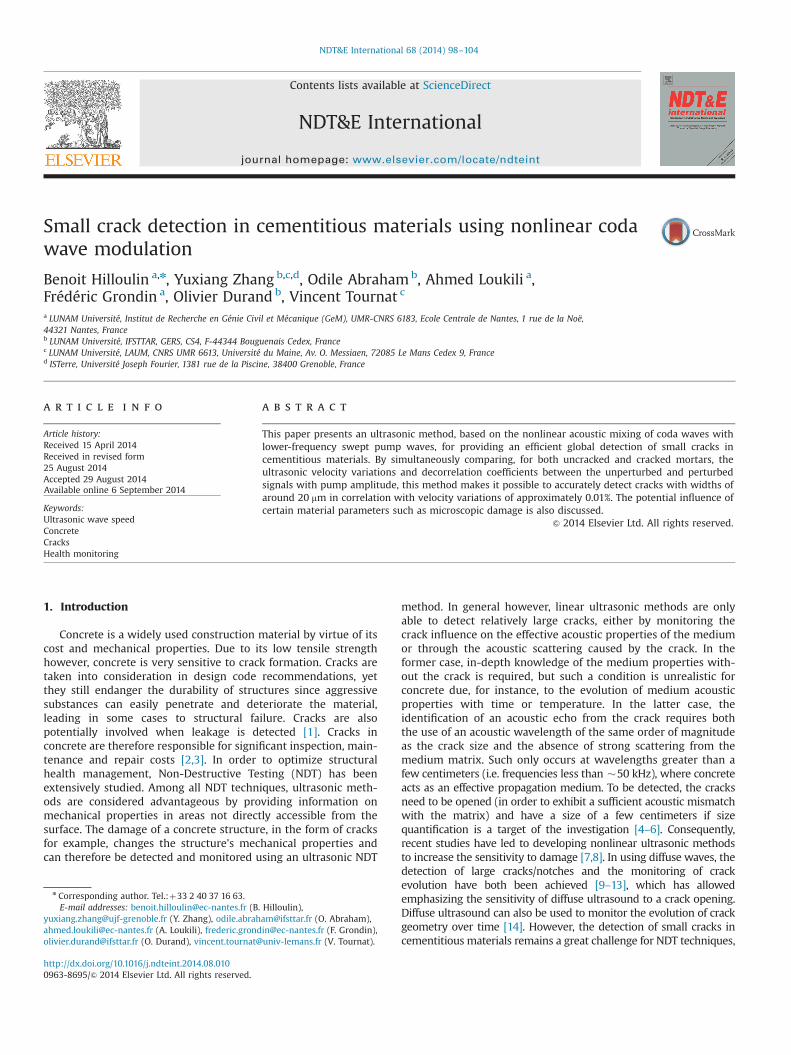
Two weeks after casting, some of the specimens were crackedaccording to a crack mouth opening displacement (CMOD) con-trolled three-point-bending test. In order to study the influence ofa crack on CWI measurements and their repeatability, only onespecimen of the first series was cracked (1B). On the other hand, tostudy the influence of crack width on CWI measurements, 2 speci-mens of the second series were cracked (2B and 2C). Aftercracking, mortar prisms were stored in an air-conditioned roomat a temperature of 20 1C and a RH of 50%. The second seriesspecimens were wrapped in aluminum foil so as to avoid dryingshrinkage, while the mortar prism of the first series was leftuncovered to determine whether the damage induced by shrink-age might exert an influence on CWI measurements. The crackedspecimen and curing conditions are listed in Table 1. The CMODvalues and geometrical details of the cracks after unloading aresummarized in Table 2 and explained in Fig. 1.
B. Hilloulin et al. / NDT&E International 68 (2014) 98–104 99
The crack widths and length were investigated using a reflectedlight microscope (Nikon Epiphot 300 with a Scion CorporationDigital Camera and Perfect Image software) at 50� , 100� and200� magnifications. The crack widths at the bottom part of thebeams (on top of the notch) were measured on both sides of thespecimen at various locations. The crack length was determinedfor the different specimens using a 200� magnification along thecrack path from bottom to top of the specimens until the crackcould no longer be observed (i.e. a crack width less than 1 mm).The crack on specimen 1B was observed to reach the top of themortar prism and thus probably corresponds to one of the largestfeasible cracks on such mortar samples of that age. The averagemaximum crack width (determined by analyzing two microscopicpictures from the bottom part of the crack between 0 and 2 mmabove the notch, one for each side of the specimen) and length aredetailed in Table 2.
3.2. CWI setup
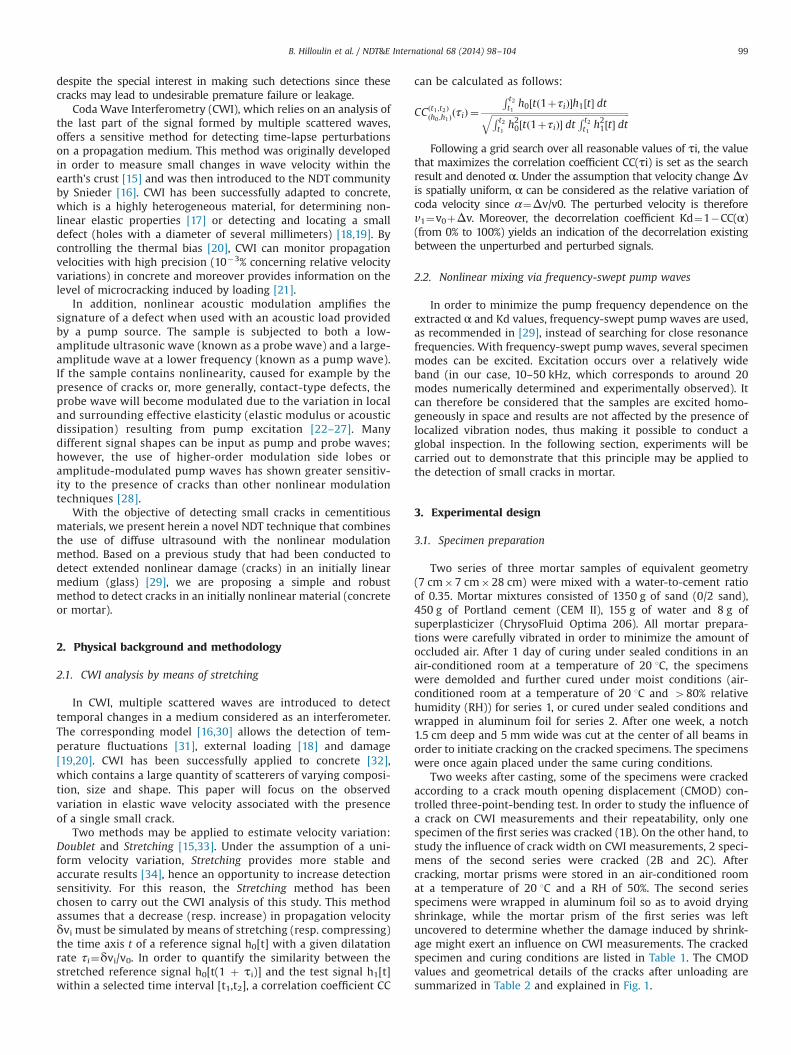
To carry out CWI measurements, three piezoelectric transdu-cers were glued on each specimen: two transducers with aworking frequency range between 200 and 800 kHz were gluedto the specimen around the notch for the probe wave excitationand detection, and one piezoelectric ceramic transducer, respon-sible for generating the larger-amplitude acoustic pump wave atlower frequencies typically in the range of 10–50 kHz, was gluedon one side of each specimen (see Fig. 2).
The excitation signal for the probe source was a chirp with afrequency varying linearly from 200 to 800 kHz. The smallestwavelengths of the signal were of the same order of magnitude asthe largest sand grains (i.e. 2 mm). Formation of the coda wave ismainly due to multiple reflections by the specimen boundaries.Synchronously, a 4-ms long received signal is recorded by theprobe receiver using a 5-MHz sampling frequency and 16-bitamplitude dynamics. To improve the signal-to-noise ratio, anaverage of 256 successive acquisitions was established as onecoda record, with a repetition frequency of 100 Hz. With 10records per non-linear solicitation step, each coda measurementtook approximately 6 min for all the 14 solicitation steps.
A pump signal with a lower frequency (10–50 kHz) was sent tothe specimen in order to induce nonlinear acoustic modulation.These pump signals fed to the transducer were amplified by aBruël and Kjærs type 2713 power amplifier at up to 100 V RMS(for an amplification gain of 60 dB in the following discussion).During the test, the pump signal amplitude was manually alteredthrough the power amplifier gain. We were able to verify that thereal output gain was proportional to the gain displayed on theamplifier. The pump signal was being linearly swept in frequencyfrom 10 to 50 kHz within 11 ms, with swept signals beingcontinuously generated. To distribute the effect of the swept pumpwaves on the coda waves, both the pump and probe signals weregenerated asynchronously.
Probe signals corresponding to various pump amplitudes wererecorded from two specimens of a given series (composed of3 specimens) during an experiment that lasted approximately 30
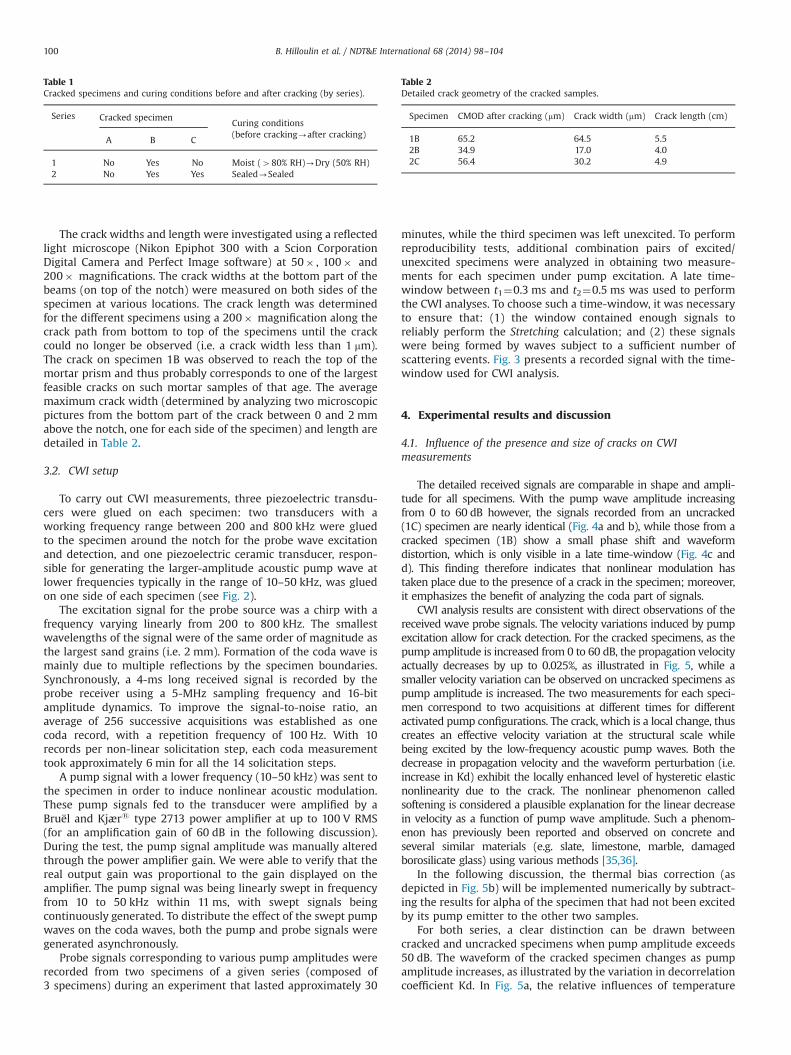
minutes, while the third specimen was left unexcited. To performreproducibility tests, additional combination pairs of excited/unexcited specimens were analyzed in obtaining two measure-ments for each specimen under pump excitation. A late time-window between t1¼0.3 ms and t2¼0.5 ms was used to performthe CWI analyses. To choose such a time-window, it was necessaryto ensure that: (1) the window contained enough signals toreliably perform the Stretching calculation; and (2) these signalswere being formed by waves subject to a sufficient number ofscattering events. Fig. 3 presents a recorded signal with the time-window used for CWI analysis.
4. Experimental results and discussion
4.1. Influence of the presence and size of cracks on CWImeasurements
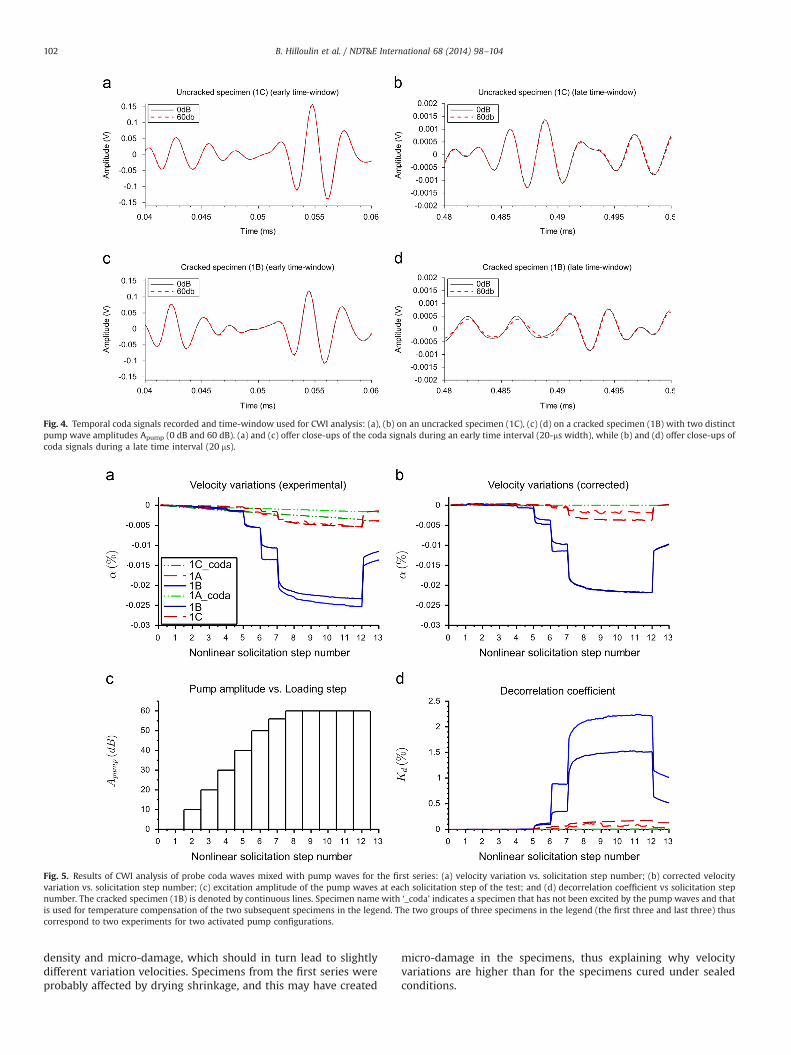
The detailed received signals are comparable in shape and ampli-tude for all specimens. With the pump wave amplitude increasingfrom 0 to 60 dB however, the signals recorded from an uncracked(1C) specimen are nearly identical (Fig. 4a and b), while those from acracked specimen (1B) show a small phase shift and waveformdistortion, which is only visible in a late time-window (Fig. 4c andd). This finding therefore indicates that nonlinear modulation hastaken place due to the presence of a crack in the specimen; moreover,it emphasizes the benefit of analyzing the coda part of signals.
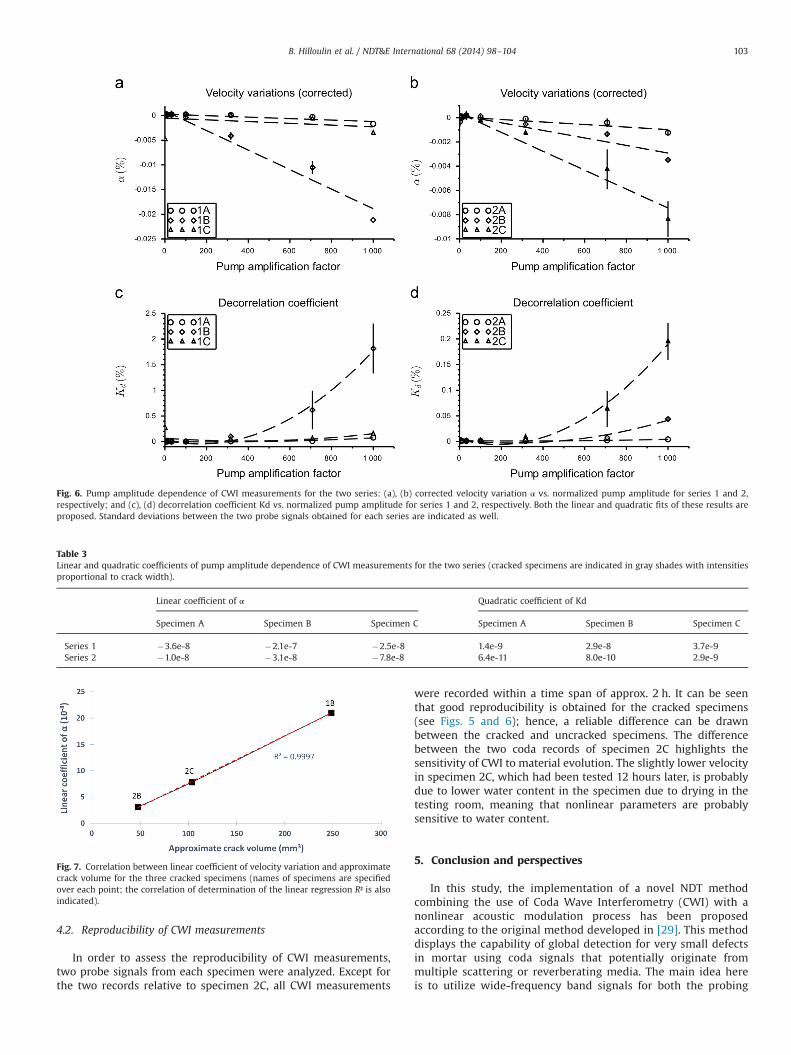
CWI analysis results are consistent with direct observations of thereceived wave probe signals. The velocity variations induced by pumpexcitation allow for crack detection. For the cracked specimens, as thepump amplitude is increased from 0 to 60 dB, the propagation velocityactually decreases by up to 0.025%, as illustrated in Fig. 5, while asmaller velocity variation can be observed on uncracked specimens aspump amplitude is increased. The two measurements for each speci-men correspond to two acquisitions at different times for differentactivated pump configurations. The crack, which is a local change, thuscreates an effective velocity variation at the structural scale whilebeing excited by the low-frequency acoustic pump waves. Both thedecrease in propagation velocity and the waveform perturbation (i.e.increase in Kd) exhibit the locally enhanced level of hysteretic elasticnonlinearity due to the crack. The nonlinear phenomenon calledsoftening is considered a plausible explanation for the linear decreasein velocity as a function of pump wave amplitude. Such a phenom-enon has previously been reported and observed on concrete andseveral similar materials (e.g. slate, limestone, marble, damagedborosilicate glass) using various methods [35,36].
In the following discussion, the thermal bias correction (asdepicted in Fig. 5b) will be implemented numerically by subtract-ing the results for alpha of the specimen that had not been excitedby its pump emitter to the other two samples.
For both series, a clear distinction can be drawn betweencracked and uncracked specimens when pump amplitude exceeds50 dB. The waveform of the cracked specimen changes as pumpamplitude increases, as illustrated by the variation in decorrelationcoefficient Kd. In Fig. 5a, the relative influences of temperature
Table 1Cracked specimens and curing conditions before and after cracking (by series).
Series Cracked specimenCuring conditions(before cracking-after cracking)
A B C
1 No Yes No Moist (480% RH)-Dry (50% RH)2 No Yes Yes Sealed-Sealed
Table 2Detailed crack geometry of the cracked samples.
Specimen CMOD after cracking (mm) Crack width (mm) Crack length (cm)
1B 65.2 64.5 5.52B 34.9 17.0 4.02C 56.4 30.2 4.9
B. Hilloulin et al. / NDT&E International 68 (2014) 98–104100
variation and pump wave amplitude on the stretching coefficientvariations can be distinguished. Due to the short duration of theultrasonic experiment, an average temperature variation can beapproximated as a linear evolution of the stretching parameterover time (or as an equivalent signal number). At the end of theexperiment, the associated change in stretching parameter reaches
a maximum value of 0.005% (reference sample lC_coda) with apractically undetectable change of Kd (less than 0.1%), undoubt-edly due to the low conversion rate between P and S waves in ourconfiguration [33]. Once the temperature bias has been corrected,the variations in stretching coefficient and Kd due to the interac-tion between coda wave and pump wave are at least one order ofmagnitude higher than those due to temperature change.
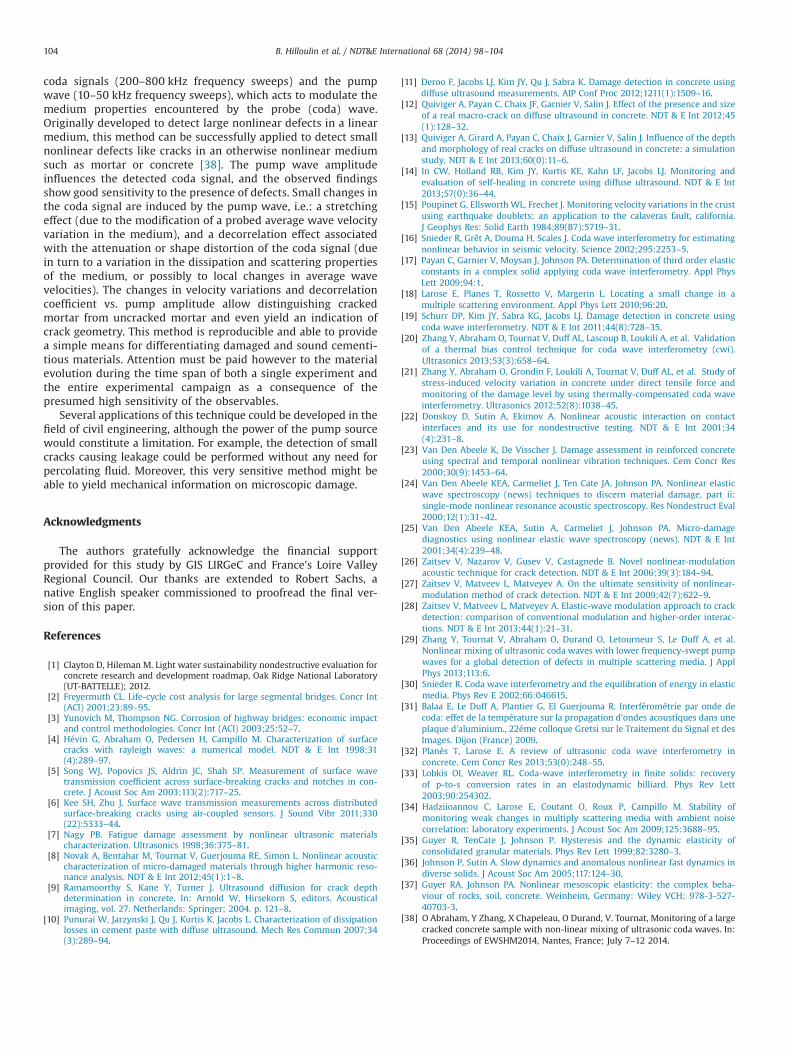
The observed effects of coda wave stretching and decorrelation bymeans of pump wave action can only be attributed to nonlineareffects originating from the nonlinear elastic behavior of the sample.It is well established that the nonlinearity level of an initiallyhomogeneous and defect-free sample can be greatly increased bythe presence of one or more cracks (see for instance [37] andreferences therein). It can thus be expected that the effect ofnonlinear pump wave action on the coda wave is more pronouncedfor a cracked medium than for an uncracked one. This finding isconsistent with the results presented in Fig. 6b and c. The enhanceddecorrelation can therefore be attributed to the presence of a crack,via its influence on the efficiency of nonlinear wave mixing effects.
CWI analysis results of the second series specimens distinguishspecimen C with the larger crack from specimen B with thesmaller crack (see Fig. 6b). As pump amplitude is lowered backto 0 dB after excitation to 60 dB, both α and Kd return to valuesvery close to their initial values obtained at the beginning of thetest. Any slight difference can be explained by a slow dynamicrelaxation effect, as observed in previous studies [29].
A linear fit for the evolution of corrected propagation velocity α asa function of pump amplitude closely matches the CWI data (Fig. 6aand b), as proposed in [29]. This linear fit allows for a clear distinctionbetween cracked and uncracked specimens. For the remnant correla-tion coefficient Kd, a quadratic increase with pump amplitude is found(Fig. 6c and d). The fit coefficients are summarized in Table 3.
The linear coefficient of α for the three cracked specimensappears to be proportional to an approximate crack volumedefined as the product of the maximum crack width multipliedby the crack length (see Table 2) and the crack penetration depth(7 cm), as illustrated in Fig. 7. This approach could therefore offer ameans for finding the crack aperture in knowing its geometry.
By comparing the evolution in corrected propagation velocityas a function of pump amplitude for the two series and, morespecifically, the linear coefficient of α listed in Table 3 for theuncracked specimens, it can be observed that the velocity varia-tions differ slightly. It can also be stated that the mortar curingconditions lead to different microscopic properties, especially
Fig. 1. Schematic diagram of the three-point-bending test and measurements of crack geometry properties (measured crack widths are indicated in micrometers).
Fig. 2. Schematic diagram of the experimental setup.
Fig. 3. Temporal coda signals recorded and the time-window used for CWIanalysis.
B. Hilloulin et al. / NDT&E International 68 (2014) 98–104 101
density and micro-damage, which should in turn lead to slightlydifferent variation velocities. Specimens from the first series wereprobably affected by drying shrinkage, and this may have created
micro-damage in the specimens, thus explaining why velocityvariations are higher than for the specimens cured under sealedconditions.
Fig. 4. Temporal coda signals recorded and time-window used for CWI analysis: (a), (b) on an uncracked specimen (1C), (c) (d) on a cracked specimen (1B) with two distinctpump wave amplitudes Apump (0 dB and 60 dB). (a) and (c) offer close-ups of the coda signals during an early time interval (20-ms width), while (b) and (d) offer close-ups ofcoda signals during a late time interval (20 ms).
Fig. 5. Results of CWI analysis of probe coda waves mixed with pump waves for the first series: (a) velocity variation vs. solicitation step number; (b) corrected velocityvariation vs. solicitation step number; (c) excitation amplitude of the pump waves at each solicitation step of the test; and (d) decorrelation coefficient vs solicitation stepnumber. The cracked specimen (1B) is denoted by continuous lines. Specimen name with ‘_coda’ indicates a specimen that has not been excited by the pump waves and thatis used for temperature compensation of the two subsequent specimens in the legend. The two groups of three specimens in the legend (the first three and last three) thuscorrespond to two experiments for two activated pump configurations.
B. Hilloulin et al. / NDT&E International 68 (2014) 98–104102
4.2. Reproducibility of CWI measurements
In order to assess the reproducibility of CWI measurements,two probe signals from each specimen were analyzed. Except forthe two records relative to specimen 2C, all CWI measurements
were recorded within a time span of approx. 2 h. It can be seenthat good reproducibility is obtained for the cracked specimens(see Figs. 5 and 6); hence, a reliable difference can be drawnbetween the cracked and uncracked specimens. The differencebetween the two coda records of specimen 2C highlights thesensitivity of CWI to material evolution. The slightly lower velocityin specimen 2C, which had been tested 12 hours later, is probablydue to lower water content in the specimen due to drying in thetesting room, meaning that nonlinear parameters are probablysensitive to water content.
5. Conclusion and perspectives
In this study, the implementation of a novel NDT methodcombining the use of Coda Wave Interferometry (CWI) with anonlinear acoustic modulation process has been proposedaccording to the original method developed in [29]. This methoddisplays the capability of global detection for very small defectsin mortar using coda signals that potentially originate frommultiple scattering or reverberating media. The main idea hereis to utilize wide-frequency band signals for both the probing
Fig. 6. Pump amplitude dependence of CWI measurements for the two series: (a), (b) corrected velocity variation α vs. normalized pump amplitude for series 1 and 2,respectively; and (c), (d) decorrelation coefficient Kd vs. normalized pump amplitude for series 1 and 2, respectively. Both the linear and quadratic fits of these results areproposed. Standard deviations between the two probe signals obtained for each series are indicated as well.
Table 3Linear and quadratic coefficients of pump amplitude dependence of CWI measurements for the two series (cracked specimens are indicated in gray shades with intensitiesproportional to crack width).
Linear coefficient of α Quadratic coefficient of Kd
Specimen A Specimen B Specimen C Specimen A Specimen B Specimen C
Series 1 �3.6e-8 �2.1e-7 �2.5e-8 1.4e-9 2.9e-8 3.7e-9Series 2 �1.0e-8 �3.1e-8 �7.8e-8 6.4e-11 8.0e-10 2.9e-9
Fig. 7. Correlation between linear coefficient of velocity variation and approximatecrack volume for the three cracked specimens (names of specimens are specifiedover each point; the correlation of determination of the linear regression R² is alsoindicated).
B. Hilloulin et al. / NDT&E International 68 (2014) 98–104 103
coda signals (200–800 kHz frequency sweeps) and the pumpwave (10–50 kHz frequency sweeps), which acts to modulate themedium properties encountered by the probe (coda) wave.Originally developed to detect large nonlinear defects in a linearmedium, this method can be successfully applied to detect smallnonlinear defects like cracks in an otherwise nonlinear mediumsuch as mortar or concrete [38]. The pump wave amplitudeinfluences the detected coda signal, and the observed findingsshow good sensitivity to the presence of defects. Small changes inthe coda signal are induced by the pump wave, i.e.: a stretchingeffect (due to the modification of a probed average wave velocityvariation in the medium), and a decorrelation effect associatedwith the attenuation or shape distortion of the coda signal (duein turn to a variation in the dissipation and scattering propertiesof the medium, or possibly to local changes in average wavevelocities). The changes in velocity variations and decorrelationcoefficient vs. pump amplitude allow distinguishing crackedmortar from uncracked mortar and even yield an indication ofcrack geometry. This method is reproducible and able to providea simple means for differentiating damaged and sound cementi-tious materials. Attention must be paid however to the materialevolution during the time span of both a single experiment andthe entire experimental campaign as a consequence of thepresumed high sensitivity of the observables.
Several applications of this technique could be developed in thefield of civil engineering, although the power of the pump sourcewould constitute a limitation. For example, the detection of smallcracks causing leakage could be performed without any need forpercolating fluid. Moreover, this very sensitive method might beable to yield mechanical information on microscopic damage.
Acknowledgments
The authors gratefully acknowledge the financial supportprovided for this study by GIS LIRGeC and France's Loire ValleyRegional Council. Our thanks are extended to Robert Sachs, anative English speaker commissioned to proofread the final ver-sion of this paper.
References
[1] Clayton D, Hileman M. Light water sustainability nondestructive evaluation forconcrete research and development roadmap, Oak Ridge National Laboratory(UT-BATTELLE); 2012.
[2] Freyermuth CL. Life-cycle cost analysis for large segmental bridges. Concr Int(ACI) 2001;23:89–95.
[3] Yunovich M, Thompson NG. Corrosion of highway bridges: economic impactand control methodologies. Concr Int (ACI) 2003;25:52–7.
[4] Hévin G, Abraham O, Pedersen H, Campillo M. Characterization of surfacecracks with rayleigh waves: a numerical model. NDT & E Int 1998;31(4):289–97.
[5] Song WJ, Popovics JS, Aldrin JC, Shah SP. Measurement of surface wavetransmission coefficient across surface-breaking cracks and notches in con-crete. J Acoust Soc Am 2003;113(2):717–25.
[6] Kee SH, Zhu J. Surface wave transmission measurements across distributedsurface-breaking cracks using air-coupled sensors. J Sound Vibr 2011;330(22):5333–44.
[7] Nagy PB. Fatigue damage assessment by nonlinear ultrasonic materialscharacterization. Ultrasonics 1998;36:375–81.
[8] Novak A, Bentahar M, Tournat V, Guerjouma RE, Simon L. Nonlinear acousticcharacterization of micro-damaged materials through higher harmonic reso-nance analysis. NDT & E Int 2012;45(1):1–8.
[9] Ramamoorthy S, Kane Y, Turner J. Ultrasound diffusion for crack depthdetermination in concrete. In: Arnold W, Hirsekorn S, editors. Acousticalimaging, vol. 27. Netherlands: Springer; 2004. p. 121–8.
[10] Punurai W, Jarzynski J, Qu J, Kurtis K, Jacobs L. Characterization of dissipationlosses in cement paste with diffuse ultrasound. Mech Res Commun 2007;34(3):289–94.
[11] Deroo F, Jacobs LJ, Kim JY, Qu J, Sabra K. Damage detection in concrete usingdiffuse ultrasound measurements. AIP Conf Proc 2012;1211(1):1509–16.
[12] Quiviger A, Payan C, Chaix JF, Garnier V, Salin J. Effect of the presence and sizeof a real macro-crack on diffuse ultrasound in concrete. NDT & E Int 2012;45(1):128–32.
[13] Quiviger A, Girard A, Payan C, Chaix J, Garnier V, Salin J. Influence of the depthand morphology of real cracks on diffuse ultrasound in concrete: a simulationstudy. NDT & E Int 2013;60(0):11–6.
[14] In CW, Holland RB, Kim JY, Kurtis KE, Kahn LF, Jacobs LJ. Monitoring andevaluation of self-healing in concrete using diffuse ultrasound. NDT & E Int2013;57(0):36–44.
[15] Poupinet G, Ellsworth WL, Frechet J. Monitoring velocity variations in the crustusing earthquake doublets: an application to the calaveras fault, california.J Geophys Res: Solid Earth 1984;89(B7):5719–31.
[16] Snieder R, Grêt A, Douma H, Scales J. Coda wave interferometry for estimatingnonlinear behavior in seismic velocity. Science 2002;295:2253–5.
[17] Payan C, Garnier V, Moysan J, Johnson PA. Determination of third order elasticconstants in a complex solid applying coda wave interferometry. Appl PhysLett 2009;94:1.
[18] Larose E, Planes T, Rossetto V, Margerin L. Locating a small change in amultiple scattering environment. Appl Phys Lett 2010;96:20.
[19] Schurr DP, Kim JY, Sabra KG, Jacobs LJ. Damage detection in concrete usingcoda wave interferometry. NDT & E Int 2011;44(8):728–35.
[20] Zhang Y, Abraham O, Tournat V, Duff AL, Lascoup B, Loukili A, et al. Validationof a thermal bias control technique for coda wave interferometry (cwi).Ultrasonics 2013;53(3):658–64.
[21] Zhang Y, Abraham O, Grondin F, Loukili A, Tournat V, Duff AL, et al. Study ofstress-induced velocity variation in concrete under direct tensile force andmonitoring of the damage level by using thermally-compensated coda waveinterferometry. Ultrasonics 2012;52(8):1038–45.
[22] Donskoy D, Sutin A, Ekimov A. Nonlinear acoustic interaction on contactinterfaces and its use for nondestructive testing. NDT & E Int 2001;34(4):231–8.
[23] Van Den Abeele K, De Visscher J. Damage assessment in reinforced concreteusing spectral and temporal nonlinear vibration techniques. Cem Concr Res2000;30(9):1453–64.
[24] Van Den Abeele KEA, Carmeliet J, Ten Cate JA, Johnson PA. Nonlinear elasticwave spectroscopy (news) techniques to discern material damage, part ii:single-mode nonlinear resonance acoustic spectroscopy. Res Nondestruct Eval2000;12(1):31–42.
[25] Van Den Abeele KEA, Sutin A, Carmeliet J, Johnson PA. Micro-damagediagnostics using nonlinear elastic wave spectroscopy (news). NDT & E Int2001;34(4):239–48.
[26] Zaitsev V, Nazarov V, Gusev V, Castagnede B. Novel nonlinear-modulationacoustic technique for crack detection. NDT & E Int 2006;39(3):184–94.
[27] Zaitsev V, Matveev L, Matveyev A. On the ultimate sensitivity of nonlinear-modulation method of crack detection. NDT & E Int 2009;42(7):622–9.
[28] Zaitsev V, Matveev L, Matveyev A. Elastic-wave modulation approach to crackdetection: comparison of conventional modulation and higher-order interac-tions. NDT & E Int 2013;44(1):21–31.
[29] Zhang Y, Tournat V, Abraham O, Durand O, Letourneur S, Le Duff A, et al.Nonlinear mixing of ultrasonic coda waves with lower frequency-swept pumpwaves for a global detection of defects in multiple scattering media. J ApplPhys 2013;113:6.
[30] Snieder R. Coda wave interferometry and the equilibration of energy in elasticmedia. Phys Rev E 2002;66:046615.
[31] Balaa E, Le Duff A, Plantier G, El Guerjouma R. Interférométrie par onde decoda: effet de la température sur la propagation d'ondes acoustiques dans uneplaque d'aluminium., 22éme colloque Gretsi sur le Traitement du Signal et desImages. Dijon (France) 2009.
[32] Planès T, Larose E. A review of ultrasonic coda wave interferometry inconcrete. Cem Concr Res 2013;53(0):248–55.
[33] Lobkis OI, Weaver RL. Coda-wave interferometry in finite solids: recoveryof p-to-s conversion rates in an elastodynamic billiard. Phys Rev Lett2003;90:254302.
[34] Hadziioannou C, Larose E, Coutant O, Roux P, Campillo M. Stability ofmonitoring weak changes in multiply scattering media with ambient noisecorrelation: laboratory experiments. J Acoust Soc Am 2009;125:3688–95.
[35] Guyer R, TenCate J, Johnson P. Hysteresis and the dynamic elasticity ofconsolidated granular materials. Phys Rev Lett 1999;82:3280–3.
[36] Johnson P, Sutin A. Slow dynamics and anomalous nonlinear fast dynamics indiverse solids. J Acoust Soc Am 2005;117:124–30.
[37] Guyer RA, Johnson PA. Nonlinear mesoscopic elasticity: the complex beha-viour of rocks, soil, concrete. Weinheim, Germany: Wiley VCH; 978-3-527-40703-3.
[38] O Abraham, Y Zhang, X Chapeleau, O Durand, V. Tournat, Monitoring of a largecracked concrete sample with non-linear mixing of ultrasonic coda waves. In:Proceedings of EWSHM2014, Nantes, France; July 7–12 2014.
B. Hilloulin et al. / NDT&E International 68 (2014) 98–104104