small farmers' decisions: utility versus profit...
TRANSCRIPT
Pertanika 5(2): 141-153 (1982)
Small Farmers' Decisions: Utility Versus Profit Maximization
MOHD. GHAZALI MOHAYIDINFaculty ofResource Economics and Agribusiness
Universiti Pertanian Malaysia, Serdang, Selangor, Malaysia.
Key-words: Risk; decision making; crop selection; quadratic programming; mean-variance; expected uility.
RINGKASAN
Sikap petani terhadap risiko dimodel dengan menggunakan fungsi-jungsi nilai-faedah Cobb-Douglas,transendental, exponensial negatif, dan ukuran-bersama. Pengamatan petani-petani mengenai risiko tanamantanaman altematif juga disukat dan algorithm programan quadratik digunakan untuk mendapat sempadan
jangkaan min-varians (E- V) paling cekap bagi tiap-tiap petani. Sempadan E- V ini, seterusnya, digunakanbersama-sama jungsi-fungsi nilai-faedah untuk menentukan rancangan ladang yang optimum. Rancanganrancangan ladang yang memaksimumkan jangkaan-untung juga ditentukan. Keputusan analisis menunjukkanbahawa model ukuran-bersama membuat ramalan yang hampir tepat dengan gelagat petani yang sebenarnya.Modal jangkaan-untung sebaliknya ialah peramal yang paling lemah sekali. Ini membuktikan bahawa risikomemainkan peranan di dalam membuat keputusan dan petani-petani bertujuan memaksimumkan nilaifaedah dan bukan keuntungan sahaja. Oleh yang demikian, program-program yang lebih berkesan adalahprogram-program yang mengurangkan risiko dan ketidakpastian yang dihadapi oleh petani-petani.
SUMMARY
Farmer's risk attitudes are modelled using the Cobb-Douglas, transcendental, negative exponential,and conjoint measurement utility functions. The farmers' perception of the riskiness ofaltemative crops arealso measured and a quadratic programming algorithm is used to derive the most efficient expected meanvariance (E- V) frontier of each farmer. The E- V frontiers are then used in conjunction with the utilityjunctions to determine the optimal farm plans. Farm plans that maximise expected profit are alsodetermined.
The results reveal that the conjoint measurement utility model predicts actual behaviour better thanthe other models. The expected profit model, on the other hand, is the worst predictor. This indicates thatrisk does playa role in decision-making and that the farmers are utility maximizers rather than profitmaximizers only. Therefore, more effective programs would be those that tend to reduce risks anduncertainties faced by the farmers.
INTRODUCTION
Agricultural production in Malaysia isundertaken mainly on smallholdings ranging fromless than one-half hectare to about 25 hectares.The situation in agriculture is very complex. Thesoil characteristics and the area topography varymodestly from farm to farm and vary moreimportantly among farms in different villages,
Key to author's name: M. Ghazali
141
districts, and states; the labour supply and creditavailability vary from farm to farm; the inputand product prices vary from place to place; andthe farmers have differing experience with newtechnologies and new practices. The farmers arealso faced with differing market conditions.Thus the technical production coefficients ofeach farmer and the economic relationshipsamong factors and products confronting him
M. GHAZALI
differ to some degree - perhaps modestly, perhapsgreatly - as each of these farmers considers theadoption of new technology brought to his attention or made available to him by governmentprograms or policies. The entire scenerio is furtherconfounded by the differences in attitudes of eachfarmer towards the risk of adopting the newtechnology and his perception of the riskiness ofthe new innovation. Thus, almost every development program or policy that may be conceivedfor agriculture cannot be appraised as to its profitability or productiveness within itself. It can onlybe done in terms of the response it evokes amongthe farmers who come in contact with the programor policy.
In the present study, the basic concern iswhether risk and uncertainty affect the processof decision-making regarding crop selection,which in tum may affect policy prescriptions andthe effectiveness of policy tools. Since the majoractors of this study are the small farmers, attentionis concentrated on analysing their risk preferencesand their perceptions of risk The study wascarried out in the districts of Muar and PerakTengah in the Malaysian Peninsula. Even thoughboth districts are major fruit producing areas,the local agriculture is still dominated by rubber.
An accurate estimate of the domestic consumption of fruits and fruit products is extremelydifficult because of the lack of data. A projectionon the demand for and supply of fruits indicatesthat there is and will be a shortfall in the supplyfor many more years to come unless domesticproduction is stepped up vigorously. At present,the country is importing large quantities of fruitsand fruit products to supplement the local market.
Realizing that there is a good market potentialfor local fruit, the government has taken severalsignificant steps to promote the development ofthe fruit industry. Some of the steps taken includeraising the amount of financial assistance to farmersand raising tariffs on imported fruits. The government also provides some of the essential supportingselVices, such as extension and marketing.
Despite these programs, most of the farmersare still hesitant to commit themselves to fruitproduction. The reasons are diverse; however, itis hypothesized that one of the major factorsinhibiting the farmers from participating in thegovernment programs is risk and uncertainty. Inother words, the hypothesis is that the farmersare maximizing utilities rather than profits.
142
ANALYTICAL FRAMEWORK
Farmers' Utility FunctionsPerhaps the most widely accepted model of
individual behavior under uncertainty is based onthe expected utility theorem (Anderson et al.,1977), which takes into account the risk attitudesand beliefs of the decision-maker. There are severalmethods of eliciting farmers' utility functions. Inthis study, two methods were used: (i) certainty equivalent (Francisco and Anderson, 1972) and(li) conjoint-measurement (Garrod and Miklius,1981).
In the certainty-equivalent technique, the riskattitude of each farmer was ascertained within therange of losing his entire annual income and gainingtwice the amount of income. The farmer wasconfronted with a hypothetical decision problemwhich was set to present a real-world situationfaced by him in his agricultural environment. Anexample of the hypothetical problem is as follows:
The farmers' crop is maturing well and by thenext month it will be ready for halVest. Whilethe farmer is waiting anxiously for the halVest,an agricultural officer breaks the news that aparticular type of disease is spreading veryrapidly and is expected to reach his area verysoon. At the speed the disease is spreading, hehas a fifty-fifty chance of haIVesting his crop.If the disease strikes before the crop can behaIVested he will lose the entire crop and thushis annual income (assume sunk costs equalzero). However, ifhe manages to halVest beforethe disease strikes, he will be able to sell hiscrop at a higher price (say double the normalprice) because many other farmers' cropswould have been completely destroyed. Whilehe is in this uncertain situation, somebodycomes to "pajak" his crop, that is, offers topay cash now in return for the rights to halVestthe crop. What will be the sum of money offeredat which he would find himself indifferentbetween selling and not selling?
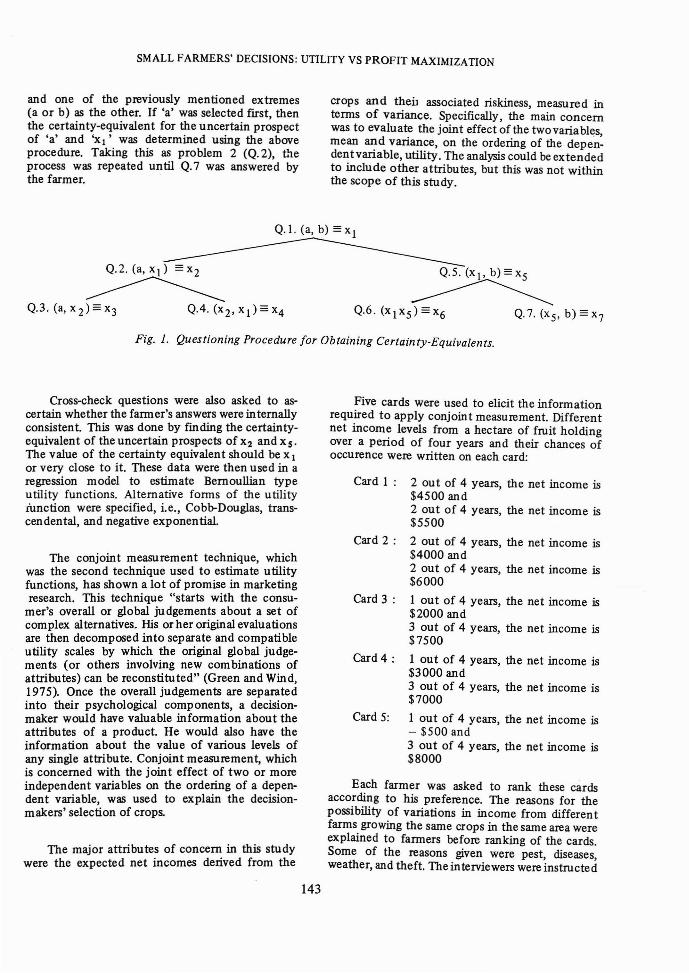
If the farmer found it difficult to answer, theintelViewer would act as the "pemajak" and startto bargain with the farmer until a point was reachedwhere the farmer was just willing to sell his crop.This value Xl was recorded as the certainty-equivalent of the uncertain prospect of losing this entireincome 'a' and gaining twice this annual income'b' (Figure 1).
Once the first set of information was obtained,a new problem with equally-likely outcomes wasset-up using x I as one of the uncertain outcomes
SMALL FARMERS' DECISIONS: UTILITY VS PROFIT MAXIMIZATION
and one of the previously mentioned extremes(a or b) as the other. If 'a' was selected first, thenthe certainty-equivalent for the uncertain prospectof 'a' and 'Xl' was determined using the aboveprocedure. Taking this as problem 2 (Q.2), t.'leprocess was repeated until Q.7 was answered bythe farmer. .
crops and theiJ associated riskiness, measured interms of variance. Specifically, the main concernwas to evaluate the joint effect of the two variables,mean and variance, on the ordering of the dependent variable, utility. The analysis could be extendedto include other attributes, but this was not withinthe scope of this study.
Q.l. Ca, b) == Xl
Fig. 1. Questioning Procedure for Obtaining Certainty-Equivalents.
Cross-check questions were also asked to ascertain whether the farmer's answers were internallyconsistent. This was done by rmding the certaintyequivalent of the uncertain prospects of X2 and X s.The value of the certainty equivalent should be X I
or very close to it. These data were then used in aregression model to estimate Bernoullian typeutility functions. Alternative forms of the utilityiunction were specified, ie., Cobb-Douglas, transcendental, and negative exponential.
The conjoint measurement technique, whichwas the second technique used to estimate utilityfunctions, has shown a lot of promise in marketingresearch. This technique "starts with the consu
mer's overall or global judgements about a set ofcomplex alternatives. His orher original evaluationsare then decomposed into separate and compatibleutility scales by which the original global judgements (or others involving new combinations ofattributes) can be reconstituted" (Green and Wind,1975). Once the overall judgements are separatedinto their psychological components, a decisionmaker would have valuable information about theattributes of a product. He would also have theinformation about the value of various levels ofany single attribute. Conjoint measurement, whichis concerned with the joint effect of two or moreindependent variables on the ordering of a dependent variable, was used to explain the decisionmakers' selection of crops.
The major attributes of concern in this studywere the expected net incomes derived from the
143
Five cards were used to elicit the informationrequired to apply conjoint measurement. Differentnet income levels from a hectare of fruit holdingover a period of four years and their chances ofoccurence were written on each card:
Card I: 2 out of 4 years, the net income is$4500 and2 out of 4 years, the net income is$5500
Card 2: 2 out of 4 years, the net income is$4000 and2 out of 4 years, the net income is$6000
Card 3: lout of 4 years, the net income is$2000 and3 out of 4 years, the net income is$7500
Card 4: lout of 4 years, the net income is$3000 and3 out of 4 years, the net income is$7000
Card 5: lout of 4 years, the net income is- $500 and3 out of 4 years, the net income is$8000
Each farmer was asked to rank these cardsaccording to his preference. The reasons for thepossibility of variations in income from differentfarms growing the same crops in the same area wereexplained to farmers before ranking of the cards.Some of the reasons given were pest, diseases,weather, and theft. The interviewers were instructe d
M. GHAZALI
In this study, the objective function was tominimize
n nV = L L G" x' x'
i = 1 j = 1 IJ 1 J
n,L ahJ' xJ' {.;;;; = >} bh , (h = I , , . . , m),J = 1 .
A more common approach like the one developed by Wolfe (1959) is to divide the analysis intotwo stages. The first stage is to make use of aparametric programming procedure to determinethe efficient E-V set of portfolios or the E-V~rontier. The second stage is to ascertain the utilitymaximizing member of this se·t.
the quantity of the hth resource, and
the technical input-output coefficient specifying the amount of thehth resource required to produce aunit of the jth activity.
where bh
Programming FrameworkAttempts to incorporate risk in mathematical
p~ogramming formulations in a whole-farm plann~g ~roble~ include quadratic risk programming.Risk IS conSldered only in relation to the activitynet revenues that are assumed to follow a multivariate normal distribution. Choice of the utilitymaximizing set of Xj values is a type of portfolioanalysis where the optimal portfolio is some vectorof X - x x th t " 'I'- i ' ... , j"" X n a maxImIzes uti Itysubject to the following resource constraints:
The technique adopted for the purpose ofestimating the farmer's perception of risk in thisstu~y was to elicit the components for the approximation of the frequency distributions of incomesfrom various crops. Problems of pest and weatherthat the farmer perceived as being associated withmajor and moderate crop damage were first discussed. 'Good,' 'medium,' and 'poor' seasons werethen defined according to the extent of damage.The farmer was then asked to respon'd to thequestion: "How many years out of ten do youexpect the seasons to be good, medium, and poor?"He was also asked to indicate the output and priceshe expected to get in each of these seasons. Thedata obtained from this technique were then usedto calculate means, variances, and covariances ofdif~erent crops to be used as input data for quadratic programming to derive E-V frontiers.
Farmers' Perception of RiskIn the second stage of the analysis, the farmers'
degree of beliefs or subjective probabilities werequantified and their perception of the most efficientproduction frontiers were developed in the formof Mean-Variance (E-V) frontiers using a quadraticprogramming algorithm.
Probability distributions are used to describethe stochastic or probabilistic behavior of randomvariables. The states of nature depend on one ormore random variables. Hence, an assessment ofthe su bjective probabilities of states usually requiresknowledge of the decision-maker's degree of beliefabout the underlying random variables. A varietyof methods are available for estimating theseprobabilities. Anderson et al., (1977) recommend the 'gross method' of eliciting subjectiveprobabilities of income levels directly from thedecision-maker. However, this method is quitesensitive to interview techniq]Je. This often resultsin inconsistencies in the decision-makers' responses.Many decision-makers, particularly farmers, do notthink in terms of probabilities. Thus they may notbe able to implicitly evaluate production responsesof different enterprises undervarious environmentalconditions, consider their price expectations, andcombine all this information to come up withprobability distributions.
to make sure that the ranking was based on thefarmer's preference concerning the mean andvariance of income.
Computation of the utility scales of each attribute was carried out by a mathematical progrllmmingformulation of monotonic (or order-preserving)regression (Garrod, 1979). Monotonic regressionhas been applied to all conjoin t measurement andalso to certain types of multidimensional scalingproblems. Pekelman and Sen (1974) developedmodels that minimize the number of discordantpairs; Srinivasan and Shocker (1973) used allnearprogramming formulation to minimize the sum ofthe differences between discordant pairs; and bothJohnson (1975) and Kruskal (1965) used squareddifferences between discordant ranks in their lossfunctions. Concordance in this case was defined as"the event where the sign of the difference betweenthe estimated rank order of any pair of observationsis the same as the sign of the difference betweenthe true or initial ranks." Garrod (1979) has provedthat the mathematical programming formulationof monotonic regression generally yields moreconcordant results than the other techniques andthat it will always yield results at least as concordant. For this reason, this formulation was used inthe analysis.
144
SMALL FARMERS' DECISIONS: UTILITY VS PROFIT MAXIMIZATION
su bjected to a parametric expected profit constraintn
. L E(cj)xj - F = {3, ((3 = - F to Emax),J = 1
n
L ahjxj l~ =;;.1 bh, (h = I, ... , m), andj = I
where:
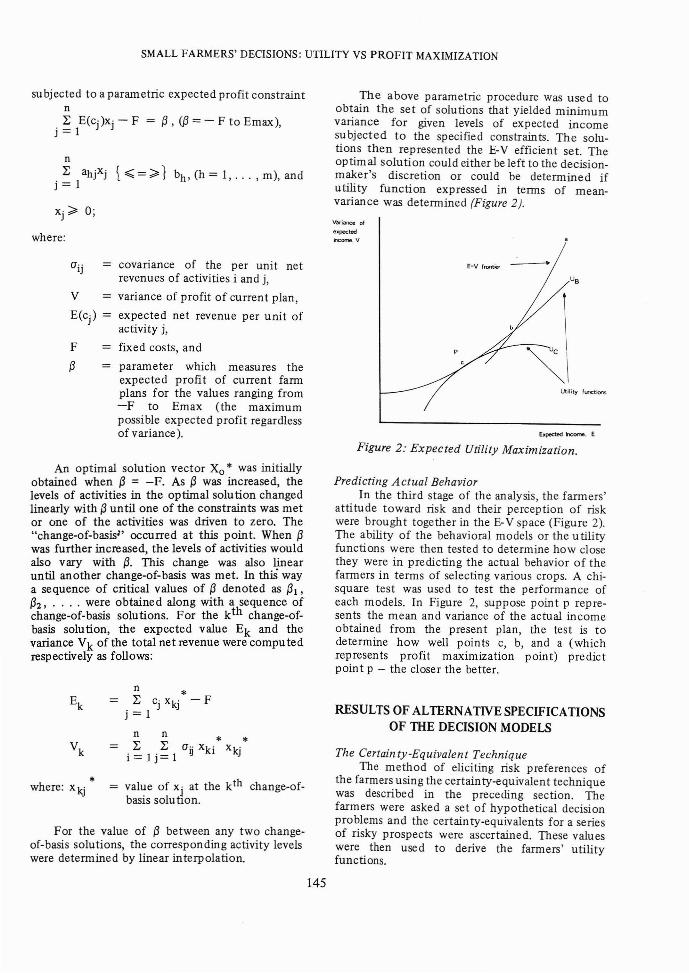
The above parametric procedure was used toobtain the set of solu tions that yielded minimumvariance for given levels of expected incomesubjected to the specified constraints. The solutions then represented the E-V efficient set. Theoptimal solution could either be left to the decisionmaker's discretion or could be determined ifutility function expressed in terms of meanvariance was determined (Figure 2).
Variance of
expectedncome. V
F
{3
covariance of the per unit netrevenues of activities i and j,
variance of profit of current plan,
expected net revenue per unit ofactivity j,
fixed costs, and
parameter which measures theexpected profit of current farmplans for the values ranging from-F to Emax (the maximumpossible expected profit regardlessof variance).
E-V frootiet" -----
~\Utility hn::tions
E..pocted ncome. E
Figure 2: Expected Utility Maximization.
An optimal solution vector Xo* was initiallyobtained when {3 = -F. As {3 was increased, thelevels of activities in the optimal solution changedlinearly with {3 until one of the constraints was metor one of the activities was driven to zero. The"change-of-basisl ' occurred at this point. When {3was further increased, the levels of activities wouldalso vary with {3. This change was also linearuntil another change-of-basis was met. In thiS waya sequence of critical values of {3 denoted as {31,{32, .... were obtained along with a sequence ofchange-of-basis solutions. For the kth change-ofbasis solution, the expected value Ek and thevariance Vk of the total net revenue were computedrespectively as follows:
Predicting Actual BehaviorIn the third stage of the analysis, the farmers'
attitude toward risk and their perception of riskwere brought together in the E- V space (Figure 2).The ability of the behavioral models or the utilityfunctions were then tested to determine how closethey were in predicting the actual behavior of thefarmers in terms of selecting various crops. A chisquare test was used to test the performance ofeach models. In Figure 2, suppose point p represents the mean and variance of the actual incomeobtained from the present plan, the test is todetermine how well points c, b, and a (whichrepresents profit maximization point) predictpoint p - the closer the better.
For the value of {3 between any two changeof-basis solutions, the corresponding activity levelswere determined by linear interpolation.
*where: Xkj value of Xj at the kth change-ofbasis solu tlOn.
145
RESULTS OF ALTERNATNESPECIFICATIONSOF THE DECISION MODELS
The Certainty-Equivalent TechniqueThe method of eliciting risk preferences of
the farmers using the certainty-equivalent techniquewas described in the preceding section. Thefarmers were asked a set of hypothetical decisionproblems and the certainty-equivalents for a seriesof risky prospects were ascertained. These valueswere then used to derive the farmers' utilityfunctions.
M. GHAZALI
Al ternative Stimuli
StandardDeviation
Expected AverageIncome
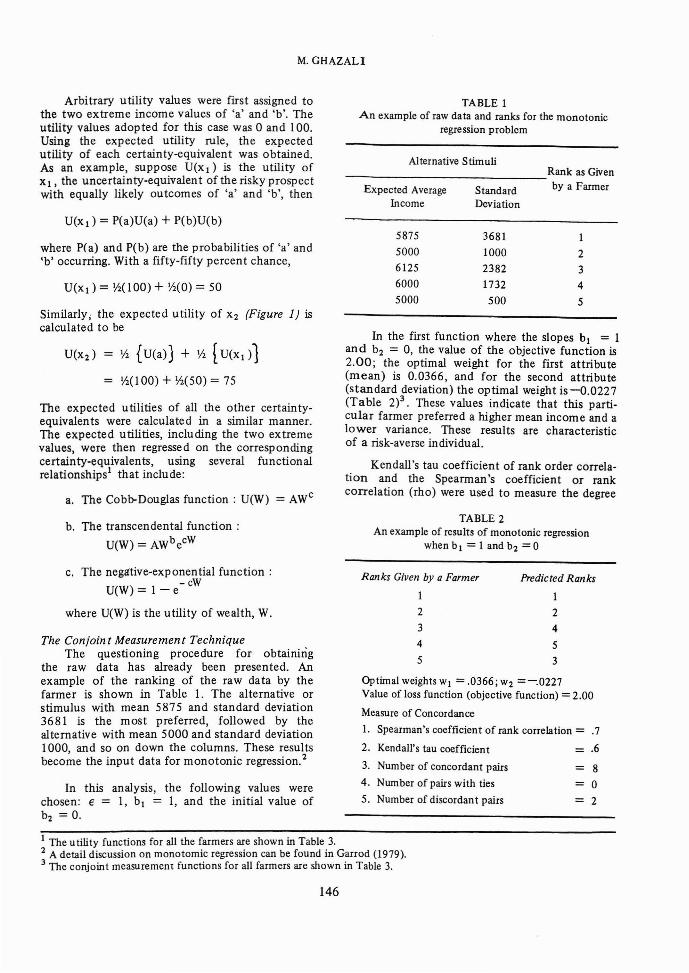
TABLE 1An example of raw data and ranks for the monotonic
regression problem
_______________Rank as Given
by a Farmer
Arbitrary utility values were first assigned tothe two extreme income values of 'a' and 'b'. Theutility values adopted for this case was 0 and 100.Using the expected utility rule, the expectedutility of each certainty-equivalent was obtained.As an example, suppose U(XI) is the utility ofXl, the uncertainty-equivalent of the risky prospectwith equally likely outcomes of 'a' and 'b', then
U(XI) = P(a)U(a) + P(b)U(b)
Kendall's tau coefficient of rank order correlation and the Spearman's coefficient or rankcorrelation (rho) were used to measure the degree
In the first function where the slopes bl = 1and b2 = 0, the value of the objective function is2.00; the optimal weight for the first attribute(mean) is 0.0366, and for the second attribute(standard deviation) the optimal weight is-0.0227(Table 2)3. These values indicate that this particular farmer preferred a higher mean income and alower variance. These results are characteristicof a risk-averse individual.
where pea) and PCb) are the probabilities of 'a' and'b' occurring. With a fifty-fifty percent chance,
U(xd = WlOO) + 1'2(0) = 50
Similarly; the expected utility of X2 (Figure 1) iscalculated to be
U(X2) = 1'2 {U(a)) + 1'2 { U(xdl
1'2(100) + 1'2(50) = 75
The expected utilities of all the other certaintyequivalents were calculated in a similar manner.The expected utilities, including the two extremevalues, were then regressed on the correspondingcertainty-equivalents, using several functionalrelationshipsl that include:
a. The Cobb-Douglas function: U(W) = AWc
5875
5000
6125
6000
5000
3681
1000
2382
1732
500
1
2
3
4
5
b. The transcendental function:
U(W) = AWbecW
TABLE 2An example of results of monotonic regression
when b I =1 and b2 =0
= 8
= 0
= 2
Predicted Ranks
1
2
4
5
3
Ranks Given by a Farmer
1
2
3
4
5
Optimal weights WI = .0366; W2 =-.0227Value of loss function (objective function) = 2.00
Measure of Concordance
1. Spearman's coefficient of rank correlation = .7
2. Kendall's tau coefficient .6
3. Number of concordant pairs
4. Number of pairs with ties
5. Number of discordant pairs
The Conjoint Measurement TechniqueThe questioning procedure for obtaining
the raw data has already been presented. Anexample of the ranking of the raw data by thefarmer is shown in Table 1. The alternative orstimulus with mean 5875 and standard deviation3681 is the most preferred, followed by thealternative with mean 5000 and standard deviation1000, and so on down the columns. These resultsbecome the input data for monotonic regression.2
c. The negative-exponential function:U(W) = I - e- cW
where U(W) is the utili ty of we alth, W.
In this analysis, the following values werechosen: € = I, bl = 1, and the initial value ofb2 = O.
I The utility functions for all the farmers are shown in Table 3.2 A detail discussion on monotomic regression can be found in Garrod (1979).3 The conjoint measurement functions for all farmers are shown in Table 3.
146
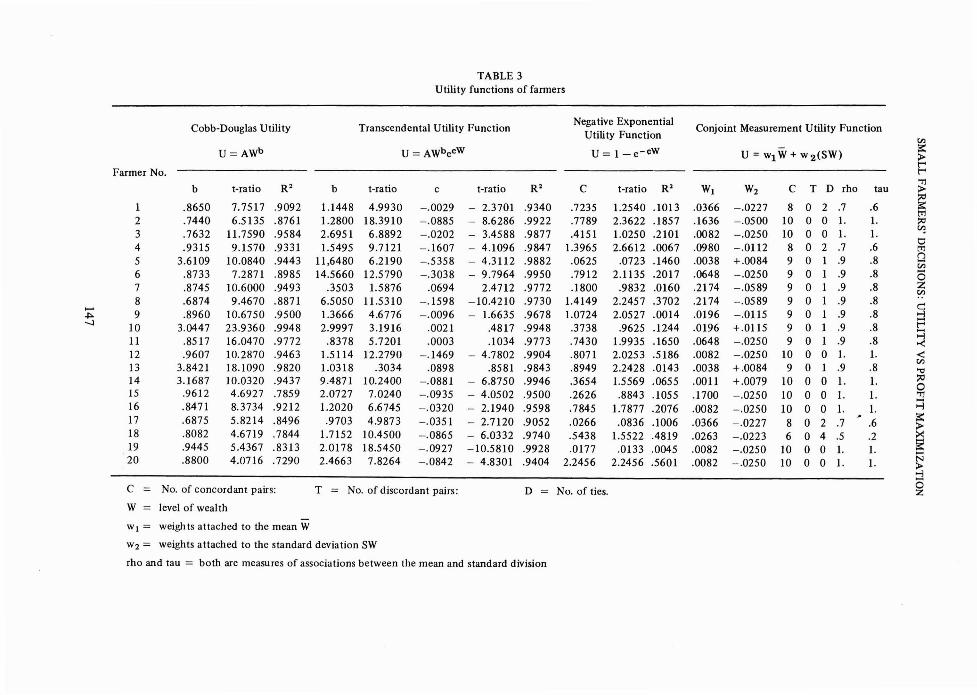
TABLE 3Utility functions of farmers
Cobb-Douglas Utility Transcendental Utility FunctionNegative Exponential
Conjoint Measurement Utility FunctionUtility Function en
U=AWb U = AWbecW U = 1 - e- cW U = wI W + w 2(SW)E:::>t""'
Farmer No. t""'
t-ratio R2 t-ra tio R2 R2 'Tlb b c t-ratio C t-ratio WI W2 C T D rho tau :>
'"1 .8650 7.7517 .9092 1.1448 4.9930 -.0029 - 2.3701 .9340 .7235 1.2540 .1013 .0366 -.0227 8 0 2 .7 .6 E::ttl
2 .7440 6.5135 .8761 1.2800 18.3910 -.0885 - 8.6286 .9922 .7789 2.3622 .1857 .1636 -.0500 10 o 0 1. 1. '"3 .7632 11.7590 .9584 2.6951 6.8892 -.0202 - 3.4588 .9877 .4151 1.0250 .2101 .0082 -.0250 10 o 0 1. 1. ~
4 .9315 9.1570 .9331 1.5495 9.7121 -.1607 - 4.1096 .9847 1.3965 2.6612 .0067 .0980 -.0112 8 o 2 .7 .6 0ttl
5 3.6109 10.0840 .9443 11,6480 6.2190 -.5358 - 4.3112 .9882 .0625 .0723 .1460 .0038 +.0084 9 0 1 .9 .8(")
Vi6 .8733 7.2871 .8985 14.5660 12.5790 -.3038 - 9.7964 .9950 .7912 2.1135 .2017 .0648 -.0250 9 0 1 .9 .8 (37 .8745 10.6000 .9493 .3503 1.5876 .0694 2.4712 .9772 .1800 .9832 .0160 .2174 -.0589 9 0 1 .9 .8 z
en8 .6874 9.4670 .8871 6.5050 11.5310 -.1598 -10.4210 .9730 1.4149 2.2457 .3702 .2174 -.0589 9 0 1 .9 .8 ..
...- c:::~ 9 .8960 10.6750 .9500 1.3666 4.6776 -.0096 - 1.6635 .9678 1.0724 2.0527 .0014 .0196 -.0115 9 0 1 .9 .8 ::J-.l 10 3.0447 23.9360 .9948 2.9997 3.1916 .0021 .4817 .9948 .3738 .9625 .1244 .0196 +.0115 9 0 1 .9 .8 t""'
:::l11 .8517 16.0470 .9772 .8378 5.7201 .0003 .1034 .9773 .7430 1.9935 .1650 .0648 -.0250 9 0 1 .9 .8 -<12 .9607 10.2870 .9463 1.5114 12.2790 -.1469 - 4.7802 .9904 .8071 2.0253 .5186 .0082 -.0250 10 0 0 l. 1. <:13 3.8421 18.1090 .9820 1.0318 .3034 .0898 .8581 .9843 .8949 2.2428 .0143 .0038 +.0084 9 0 1 .9 .8
en"tl
14 3.1687 10.0320 .9437 9.4871 10.2400 -.0881 - 6.8750 .9946 .3654 1.5569 .0655 .0011 +.0079 10 0 0 1. 1. :;Q0
15 .9612 4.6927 .7859 2.0727 7.0240 -.0935 - 4.0502 .9500 .2626 .8843 .1055 .1700 -.0250 10 o 0 1. 1. 'Tl
16 .8471 8.3734 .9212 1.2020 6.6745 -.0320 - 2.1940 .9598 .7845 1.7877 .2076 .0082 -.0250 10 o 0 1. 1. :::l17 .6875 5.8214 .8496 .9703 4.9873 -.0351 - 2.7120 .9052 .0266 .0836 .1006 .0366 8 0 2
"
.6 E::-.0227 .7 :>18 .8082 4.6719 .7844 1.7152 10.4500 -.0865 - 6.0332 .9740 .5438 1.5522 .4819 .0263 -.0223 6 o 4 .5 .2 ><19 .9445 5.4367 .8313 2.0178 18.5450 -.0927 -10.5810 .9928 .0177 .0133 .0045 .0082 -.0250 10 o 0 1. 1. ~20 .8800 4.0716 .7290 2.4663 7.8264 -.0842 - 4.8301 .9404 2.2456 2.2456 .5601 .0082 -.0250 10 o 0 1. 1. N
:>I-:l
C = No. of concordant pairs: T = No. of discordant pairs: D = No. of ties.(3Z
W = level of wealth
WI = weights attached to the mean W
W2 = weights attached to the standard deviation SW
rho and tau = both are measures of associations between the mean and standard division

M.GHAZALI
of association between the actual and predictedranks. The values of .7 and .6 for the Spearman'srho and Kendall's tau respectively indicate thatthere was a moderately strong association betweenthe initial ranks and the estimated ranks. Alsopresented in the table is a count of the num ber ofconcordant, discordant and tied pairs. There areeight concordant pairs and two discordant pairs;none of the pairs are tied.
The problem of multiple vectors of w corresponding to the same minimum value of the lossfunction was partially alleviated by parametricallyvarying the initial value of bl from 0 to b l = b l ·
The values selected were 0, .1, .5, and 1. Parametrically varying b l did not show any improvement in the number of concordant pairs or in thevalue of the optimal weights in this example. Thisalso held true for most other cases.
The Probability DistributionsThe response functions were estimated for
individual crops rather than for a heterogeneous
aggregate for the total farm. Price and yieldexpectations were combined to get an estimateof the expectation of gross returns per hectarefor the individual crops. An illustration of thistechnique is shown in Table 4.
The average yields and prices in the threedifferent seasons were calculated for all cropsbelonging to each of the farmers. Rubber wasconsidered the least risky crop. Farmers expectedno fluctuation in the income level generated bythis crop over the years. They did, however,expect some monthly fluctuation. In the courseof the interview, the farmers were also asked togive their opinion on inflation. The general responsewas that even though they expected an increase inthe price level, as far as their products were concerned, prices would remain fairly stable. Regardingthe price of inputs, particularly fertilizer andplanting materials, they believed that prices wouldincrease but they expected the government to stepin and stabilize the prices they would have to pay.
TABLE 4Expected output, prices and incomes of one crop per hectare
Seasons No. of Year Expected Expected ExpectedGassification out of ten Output Price Income
(Kilogram s) (M$/Kilogram) (M$)
Good 3 5990 .55 3295
Medium 4 1122 1.10 1234
Poor 3 625 1.65 1031
Average * 2433 1.10 2676
*Average expected output is computed using the formula
E(Y) = Yli where Yj = output in jth seasonPj = probability of the jth type of season
Average expected price and average expected income are computed in similar manner.
TABLE 5Activity gross margin per hectare (M$)
Cropping Activities*Type of growingseasons
Good
Medium
Poor
Average
Durian (Xl)
3295 (n = 3)
1234 (n = 4)
1031 (n = 3)
1791
Duku (Xl)
1754 (n = 1)
1261 (n = 7)
1124 (n =2)
1283
Rambutan (X 3)
2377 (n = 3)
1373 (n = 4)
589 (n =3)
1439
Rubber (X4)
1266 (n = 10)
1266
*n = number of years out of ten.
148
SMALL FARMERS' DECISIONS: UTILITY VS PROFIT MAXIMIZATION
The E-V Fran tierThe farmer's subjective probability distribu
tion of prices and yields were incorporated in theestimation of the expected net returns ana thevariances. The figures were obtained by thetechnique discussed in the preceding section andan example of the elicited gross margins perhectare from one farmer are shown in Table 5.
A closer look at Table 5 reveals that this particular farmer perceived the presence of good,medium, and poor seasons for all the fruit cropsbut not for rubber. He believed that the incomefrom rubber was not subjected to annual fluctuation even though he expected monthly variations.
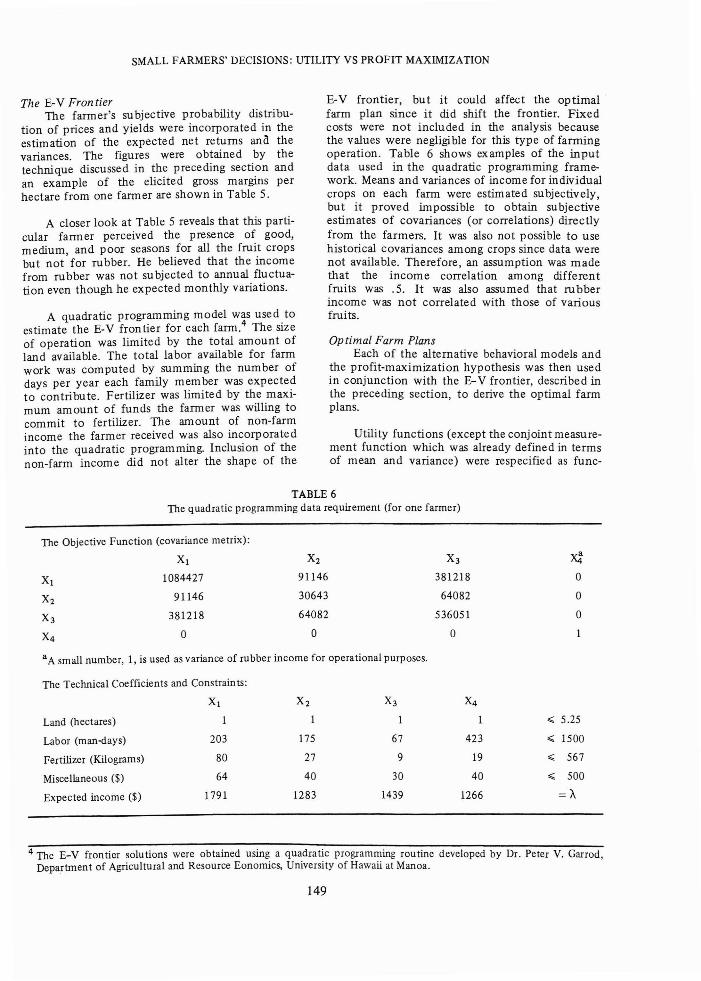
A quadratic programming model was used toestimate the E-V fron tier for each farm.4 The sizeof operation was limited by the total amount ofland available. The total labor available for farmwork was computed by summing the number ofdays per year each family member was expectedto contribute. Fertilizer was limited by the maximum amount of funds the farmer was willing tocommit to fertilizer. The amount of non-farmincome the farmer received was also incorporatedinto the quadratic programming. Inclusion of thenon-farm income did not alter the shape of the
E- V frontier, but it could affect the optimalfarm plan since it did shift the frontier. Fixedcosts were not included in the analysis becausethe values were negligible for this type of farmingoperation. Table 6 shows examples of the inputdata used in the quadratic programming framework. Means and variances of income for individualcrops on each farm were estimated subjectively,but it proved impossible to obtain subjectiveestimates of covariances (or correlations) directlyfrom the farmers. It was also not possible to usehistorical covariances among crops since data werenot available. Therefore, an assumption was madethat the income correlation among differen tfruits was .5. It was also assumed that rubberincome was not correlated with those of variousfruits.
Optimal Farm PlansEach of the alternative behavioral models and
the profit-maximization hypothesis was then usedin conjunction with the E- V frontier, described inthe preceding section, to derive the optimal farmplans.
Utility functions (except the conjoint measurement function which was already defined in termsof mean and variance) were respecified as func-
TABLE 6The quadratic programming data requirement (for one farmer)
The Objective Function (covariance metrix):
Xl X2 X3 ~
Xl 1084427 91146 381218 0
X2 91146 30643 64082 0
X3 381218 64082 536051 0
X4 0 0 0
a A small number, 1, is used as variance of rubber income for operational purposes.
The Technical Coefficients and Constraints:
Xl X2 X3 X4
Land (hectares) 1 1 1 ,;,;: 5.25
Labor (man-days) 203 175 67 423 ,;,;: 1500
Fertilizer (Kilograms) 80 27 9 19 ,;,;: 567
Miscellaneous ($) 64 40 30 40 ,;,;: 500
Expected income ($) 1791 1283 1439 1266 =A
4 The E-V frontier solutions were obtained using a quadratic programming routine developed by Dr. Peter V. Garrod,Department of Agricultural and Resource Eonomics, University of Hawaii at Manoa.
149

M.GHAZALI
and the negative exponential utility function as:
U = fwo + E(w)1 - cVar(w)j2,
Profit maximization implies a linear utilityfunction. This implies vertical indifference curves.Therefore, the profit maximizing farm plan wasthe extreme right of the E-V frontier (poin t a inFigure 2).
tions defined in terms of the mean and varianceto estimate the optimal farm plans. Assuming anormal or approximately normal distribution, theCobb-Douglas utility function was written use:
U = two + E(w)l b + b(rl)
two + E(w)l b-2 Var (w)j2;
the transcendental utility function as:
U = two + E(w)] b eC {W + E(w)}
+ U r b(b-l) + 2bc
LlWo+E(w)12 {W+E(w)}
+ C2 } V" (w)/2;
where:
WoE(w)
Var(w)
= ini tial weal th,
= expected gain or loss of wealth, and
= variance of wealth.
TABLE 7The Chi-square goodness-of-fit and the estimated probability of income profile of actual and predicted plan being equal
Calculated Chi-Square Valuef Estimated ProbabilityI
Farmer CDa TRb BWc CMd PMe CD TR BW CM PMNo.
1 3.084 3.088 3.082 3.088 3.090 .0835 .0833 0.836 .0833 .0832
2 .628 .628 .628 .628 .850 .7182 .7182 .7182 .7182 .6523
3 3.579 3.580 3.578 3.580 3.582 .0615 .0615 .0161 .0615 .0614
4 3.072 3.037 3.078 7.137 7.137 .0840 .0855 .0837 .0080 .0080
5 .796 .798 .786 .646 .798 .6683 .6682 .6713 .7129 .6682
6 7.621 7.621 7.621 7.628 7.628 .0060 .0060 .0060 .0060 .0060
7 12.645 12.650 12.624 12.650 12.652 0 0 0 0 0
8 3.770 3.793 3.793 3.794 3.794 .0214 .0213 .0213 .0213 .0213
9 66.936 66.936 66.973 66.936 69.363 0 0 0 0 0
10 6.266 6.270 6.266 6.270 6.270 .0314 .0134 .0314 .0134 .0134
11 10.693 10.690 10.678 6,220 10.690 0 0 0 .0138 0
12 9.345 5.993 5.990 5.990 9.345 0 .0159 .0160 .0160 0
13 16.135 16.132 16.132 16.135 16.135 0 0 0 0 0
14 3.081 .728 3.070 3.081 3.081 .0836 .6885 .0841 .0836 .0836
15 7.341 2.722 2.722 2.722 7.344 .0072 .0995 .0995 .0995 .0071
16 1.779 1.784 1.784 1.784 1.784 .3764 .3750 .3750 .3750 .3750
17 .328 .328 .311 .063 .328 .8073 .8073 .8123 .8860 .8073--18 12.761 12.763 12.761 12.761 12.763 0 0 0 0 0--19 1.022 1.022 .966 .742 1.022 .6012 .6012 .6719 .6844 .6012
20 5.648 5.652 5.650 5.648 5.652 .0191 .0191 .0191 .0191 .0191
a. CD Cobb-Douglas utility model.
b. TR Transcendental utility model.
c. BW Negative exponential/Binswanger utility model.
d. CM Conjoint Measurement.
e. PM Profit maximization model.
f. underlined values show the best predictor of actual behavior.
g. underlined valued show the predictor with the higher probability that the actual and predicted plans are equal.
150
SMALL FARMERS' DECISIONS: UTILITY VS PROFIT MAXIMIZATION
Prediction of Actual BehaviorThe final step in this analysis was to test the
ability of the models. to predict actual behavior(Le., the actual cropping pattern at the time of thestudy). It is obvious that the actual plan has manydimensions, including sizes of various crops,levels of various inputs, average income fromdifferent crops, etc. However, the income distribution for each plan -- i.e., its mean and variance-- is perhaps the best factor to characterize theplan. So, the test to determine which models bestdescribe actual behavior was made within the E-Vspace. The Chi-square goodness-of-fit test wasused. It was calculated by comparing the meanand variance of the income from the optimal planpredicted by each of these models with that of theactual plan. The results of the Chi-square test areshown in Table 7.
The Chi-square values were then used tocalculate the probability of obtaining the twodifferent distributions at random when in factthey have the same mean and variance. This meansthe higher the probability level, the better is theprediction.
The conjoint measurement model was the bestpredictor in seven cases. The next best predictor ofthe actual farm plan were the transcendental, thenegative exponential, and the Cobb-Douglas utilitymodels; and finally the profit maximization model.For the classical behavior assumption of profitmaximization, the probability of "correctly"predicting actual behaviour is essentially or veryclose to zero in IS of the 20 cases analysed.
Therefore, the results of the analysis showthat Bernoullian utility maximization explainsactual farmer behavior more accurately thanprofit maximization.
POLICY IMPLICATIONS AND AREAFOR FURlHER RESEARCH
What is the best way to get the numeroussmall farmers to participate in the programs ofthe fruit development plan in the prescribedway so as to contribute to the attainment of theplan goals and targets? It has been observed onmany occasions that a significantly large num berof farmers still fail to participate in governmentprograms to develop the fruit industry when itappears that it is to the economic advantage ofthe farmers to participate. Hence a conventionalwisdom has gained widespread acceptance amongsome people that the small farmers stubbornlyand irrationally resist change. This, of course, maynot be true. Firstly, a small farmer typically lacks
technical information concerning the technicalchange that may be involved, and he has had littleor no experience with it; hence he is inclined tomove slowly with respect to adopting the technology. Secondly, adoption of new technology may,in fact or in the mind of the farmer, involve considerable risk, and often, he can not afford to takethe chance. For both of these reasons one couldnot say that the farmer acts irrationally.
It would be ideal if the government programscould reach the individualized operation ofthousands of farms and direct the pattern ofoperation in each of these farms so as to maximizethe expected utility of each farmer. This, of course,is next to impossible. However, it is believed thatthe attainment of development goals and targetscan be achieved via the inducement approach; itwould be far easier and more productive to providea general incentive in terms of a temporarilyincreased price, or factor subsidy, etc. aimed atincreasing farm profit and to let each farmer, withthe aid of a good information program, work outthe most efficient pattern of operation for hisparticular farm according to his preference.
In light of the above, a consideration of a fruitdevelopment plan must contain within it a relatively large and effective production educationprogram to convey to farmers relevant and reliabletechnical information concerning the new technology or production program so that they makerational decisions with respect to adoption orparticipation. Where research for technologicaldevelopment is concerned, effort has been concentrated on propagating and developing fruit clonesthat are high yielding and at the same time haveshorter maturity periods. Another importantfeature of these crops that has not been researchedis the variability in production which is irregularand unpredictable. Research on developing clonesthat have lower variability and irregularity of WOduction but at the same time provide an acceptableyield and a short maturity period is highly relevantfor the development of the fruit industry.
The fruit development plan may be complemented by economic programs which providebetter marketing and credit facilities, input su bsidies, planting materials, technical information,and non-farm job opportunities which allowgreater pooling of risks at the household level
Agricultural price support has been used quitesuccessfully in the production of rice as part of anincomes policy. This policy is likely to be moreappropriate in cases where price uncertain tydominates. In this study, however, the extent of
151
M. GHAZALI
price and yield uncertainties are not examined individually; thus it would not be appropriate torecommend price support policy. This issue,therefore, requires further research before anyform of conclusion can be made.
In the area of crop insurance as a policyalternative to dealing with the undesirable consequences of risk aversion, various studies haveshown that pure insurance schemes based onindividual loss assessment are likely to have lowbenefit-cost ratios, particularly in countries withlow levels of income and small landholdingsbecause the administrative costs of assessingindividual losses become very high (Roumasset,1978). Furthermore, the relevant efficiency issueis not whether risk preferences change the allocation of resources, but whether risks are appropriately spread throughout the economy (Arrow,1971). There is also the possibility that where riskpreferences are derived from market imperfectionslike the differences in buying and selling prices,they serve a positive role in the efficient allocationof resources (Roumasset, 1978). In developingcountries where the insurance schemes seemed tohave worked, they are better described as incomesupport and distribution schemes towards poorareas rather than insurance schemes (Binswanger,1979). The prospect of crop insurance at thismoment appears bleak; however, to the extentthat one believes that it may be an affective toolto reduce risk, further research is warranted.
The biggest problem encountered during thesurvey was related to the process of eliciting thesubjective risk preferences of the farmers, and thismay have some effect on the results. If similartechniques were to be used in future researchwork, the problem could be alleviated by providingmore intensive training to the interviewers so thatthey could explain more clearly the nature andrequirement of the scheme to the farmers andbecome more alert in recognizing inconsistentanswers.
The conjoint measurement utility functionappears to work quite well in explaining farmers'attitudes towards risk and thus may be considereda good prospect for similar work in the future. Theconjoint measurement if carried out in more detail,may become a good tool in explaining the decisionmaking process of small farmers.
Research dealing with subjective probabilitydistribution has gained momentum in recent years.In this study, an approach combining personalprobabilities of certain 'disasters' such as pestoutbreaks with expected outcomes of yield and
prices is used. This approach appears to work quitewell, i.e., most farmers are able to specify thenum ber of good, medium, and poor years out often as well as the associated yields and prices.Future studies dealing with su bjective probabilitydistributions may consider using and improvingthis approach.
Because it considers only two moments of thedistribution of returns, there has been strongcriticism of the E-V approach. However, a cruderepresentation of risk may be better than ignoringit aI together. The analysis can be extended tohigher moments if required, though at somecomputational cost.
In the final analysis, planners for the fruitindustry must develop methodological innovationsfor dealing with uncertainty in complex croppingsituation and formulate research, projects, programs, and policies that are tailored to its specialcharacteristics but which constitute tolerablesolu tions to the difficult issues of its development.It is hoped that a recognition and understandingof these special characteristics an d issues will leadto a more effective development plan for the fruitindustry.
REFERENCES
ANDERSON, J.R., DILLON, J.L. and HARDAKER, lB.(1977): Decision Analysis in Agricultural Development. Ames. Iowa State University Press.
ARROW, K.l (1971): Essays in the Theory of RiskBearing. Chicago. Markham Publishing Company.
BINSWANGER, H.P. (1979): Risk and Uncertainty inAgricultural Development: An Overview. In Roumasset, J.A., Boussard, lM. and Singh, 1. (Eds.)."Risk, Uncertainty and Agricultural Development."Laguna. Southeast Asian Regional Centre for Graduate Study and Research in Agriculture.
FRANCISCO, E.M. and ANDERSON, J.R., (1972):Chance and Choice West of the Darling. Aust.J agri. Econ. 16(2): 82-93.
GARROD, P. V. (1979): A General Program for MonotonicRegression. (mimeograph). University of Hawaii.
GARROD, P.V. and MiKLIUS, W. (1981): A Method forEstimating the Value of Transport Service Attributes.Paper presented at WAEA Annual Meeting ofLincoln. Nebraska. July 19-21, 1981.
GREEN, P.E. and WIND., Y. (1975): New Way to Measure Consumers' Judgements. Harvard Bus. Rev. 54:107-f17. .
JOHNSON, R.M. (1975): A Simple Method for PairwiseMonotone Regression. Psychometrika. 40,(2): 163168.
152

SMALL FARMERS' DECISIONS: UTILITY VS PROFIT MAXIMIZATION
KRUSKAL, J.B. (1965): Analysis of Factorial Experiments by Estimating Monotone Transformations ofthe Data,J.R. statist. Soc. Series B. 27: 251-263.
MALAYSIA MINISTRY OF AGRICULTURE. (1975):Report of the Committee on Fruits and Vegetable.Vol. 1. Kuala Lumpur. Ministry of AgriculturePrinting Office.
PEKELMAN, D. and SEN., S.K. (1974): MathematicalProgramming Models for the Determination ofAttribute Weights. Management Science. 20(8):1217-1229.
153
ROUMASSET, J.A. (1978): The Case Against CropInsurance in Developing Countries. PhilippinesRev. Bus. and Econ. 1.
SRIl"IVASAN, V. and SHOCKER, A. (1973): LinearProgramming Techniques for MultidimensionalAnalysis of Preferences. Psychometrika. 38(3):337-369.
(Received 2 February 1982)