small scale old age and widow allowance for the poor in ...research.brac.net/monographs/monograph_36...
TRANSCRIPT

Small Scale Old Age and Widow Allowance for the Poor in Rural
Bangladesh: An Evaluation
July 2008
Research Monograph Series No. 36 Research and Evaluation Division, BRAC, 75 Mohakhali, Dhaka 1212, Bangladesh Telephone: 88-02-9881265-72, 8824180-7 (PABX) Fax: 88-02-8823542, 8823614 E-mail: [email protected], Website: www.brac.net/research

ii
Copyright © 2008 BRAC July 2008 Cover design Sajedur Rahman Design and Layout Md. Akram Hossain Published by: BRAC BRAC Centre 75 Mohakhali Dhaka 1212, Bangladesh Telephone: (88-02) 9881265, 8824180-87 Fax: (88-02) 8823542, 8823614 E-mail: [email protected] Website: www.brac.net/research BRAC/RED publishes research reports, scientific papers, monographs, working papers, research compendium in Bangla (Nirjash), proceedings, manuals, and other publications on subjects relating to poverty, social development, health, nutrition, education, gender, environment, and governance. Printed by BRAC Printers, 87-88 (old) 41 (new), Block C, Tongi Industrial area, Gazipur, Bangladesh

iii
TABLE OF CONTENTS
Acknowledgements iv Summary v Introduction 1 Materials and method 6 Syed Masud Ahmed, AKM Masud Rana and Naomi Hossain
Study settings 6 Sample 7 Data collection tools 7 Data collection 7 Intervention 8 Dependent variables 8 Explanatory variables 9 Analyses 9
Findings and discussion Targeting, implementation and distribution of benefits 11 Naomi Hossain and Nahleen Zahra
Targeting: who benefits from the allowances? 11 The selection process 12 The role of information in accessing safety nets 17 Accountability 18 Discussion 21
Uses, satisfaction and association of allowance with socioeconomic and health indicators AKM Masud Rana and Syed Masud Ahmed
Profile of the study participants 24 Proportion of beneficiaries invested allowance for income
generating activities 25 Satisfaction and dissatisfaction about old age allowance 25 Opinions of study participants regarding the roles of government
and non-government organizations for widows and elderly persons 26
Expenditure on food items during the last 24 hours 26 Individual food intake behaviour 26 Perceived change in body weight in the last three months 27 Self-reported illness 28 Health-related quality of life (HRQoL) of elderly persons (≥60 years
old) 28 Discussion 32 Conclusion 32
Recommendations 34 References 35

iv
ACKNOWLEDGEMENTS We are grateful to the study participants who provided information for this study. Thanks to Mamun-Ur-Rashid for conducting the training of interviewers and supervising the data collection. We acknowledge contribution of Syed Shoaib Ahmed, Shahidul Islam, Aroj Ali Joarder and Nazim Uddin for their assistance during the training of interviewers and data collection phase. Finally, thanks to Swapan Dev Roy for his assistance in processing, cleaning and preparing the data for analyses. The Research and Evaluation Division (RED) is supported by BRAC's core funds and funds from donor agencies, organizations and governments worldwide. Current donors of BRAC and RED include Aga Khan Foundation Canada, AusAID, Australian High Commission, Brigham Young University, Bill and Melinda Gates Foundation, BRAC University, NIKE Foundation, Campaign for Popular Education, Canadian International Development Agency, Charities Aid Foundation-America, Columbia University (USA), Conrad N Hilton Foundation, Danish International Development Agency, DEKA Emergence Energy (USA), Department for International Development (DFID) of UK, Embassy of Denmark, Embassy of Japan, European Commission, Fidelis France, GITAC Consult GmbH, The Global Fund, GTZ-Germany, Government of Bangladesh, The Hospital for Sick Children, ICDDR,B Centre for Health and Population Research, ICLARM/World Fish Centre, Institute of Development Studies (Sussex, UK), Inter-cooperation Bangladesh, International Committee of the Red Cross, Japan International Cooperation Agency, International Research and Exchange Board, The Johanriter, Land O Lakes (USA), Manusher Jonno Foundation, Micro-Nutrient Initiative, NORAD, NOVIB, OXFAM America, Plan Bangladesh, The Population Council (USA), RNE/DGIS, Embassy of the Kingdom of the Netherlands, Royal Norwegian Embassy, Scojo Foundation Incorporation, SIDA, Sight Savers, Stanford Medical School, Swiss Development Cooperation, ULG Northumbrain, UNICEF, United Way International, University of Calgory, University of Leeds, University of Manchester (UK), World Bank, World Food Programme, and World Health Organization.
v
SUMMARY This study was done to explore the process of targeting, selection and benefits distribution and the use of the allowances, satisfaction, and the association of old age and widow allowances with various factors (e.g., expenditure on food and food intake behaviour, self-reported illness and health-related quality of life). This allowances are provided by the government of Bangladesh to poor widows and the elderly persons (≥65 years). A cross-sectional quantitative survey was conducted in 10 districts of Bangladesh where BRAC RED has been maintaining a demographic surveillance system since 1995 in 52 villages. All ever-married single women irrespective of socioeconomic status and age, and all elderly persons (≥60 years) were sampled for this study totalling 5,524 participants. Of these 4,824 could be interviewed. Non-response rate was 13% for the overall sample (including single women and elderly persons) and 15% among the elderly persons. The findings are organized into two sections: the first section deals with targeting, selection and benefits distribution process while the second section deals with the use of the allowances, their satisfaction with it, and association of the benefit with various socioeconomic factors. Findings reveal that the vulnerable people were more likely to benefit than the poor, but both groups benefit significantly more than the non-poor. In practice, selection processes appears to be dominated by UP members and chairmen. Most of the respondent population actively lobbied to be selected as beneficiaries, suggesting a far greater willingness to engage politically among an elderly and marginal population than would necessarily have been expected. Beneficiaries appeared to be in a better position to access valuable information about government assistance programmes from UP representatives compared to those who did not benefit. Beneficiaries were more likely than non-beneficiaries to believe that the selection process was fair, and poor non-beneficiaries were most likely of all groups to believe process was unfair and to have grievances with the process. However, a similar proportion of both beneficiaries and non-beneficiaries went to the lengths of actually making a complaint, most to the UP representatives. There was some evidence of corruption in the process of beneficiary selection and in the distribution of benefits. Implications of these preliminary findings include that wider access to unbiased public information about eligibility, the selection process, and the beneficiary list are likely to help improve targeting to the poor and vulnerable, and may reduce leakage and corruption. NGOs currently appear to play a negligible role in promoting the rights of the poor and vulnerable in the areas studied.

vi
About 15% of the beneficiaries invested money for income generating activities beyond consumption. Among the beneficiary households, expenditure on protein consumption was significantly higher and carbohydrates consumption was lower compared to the eligible non-beneficiaries. A small proportion of participants perceived that their body weight was improved in last three months and improvement was significantly higher among the beneficiaries compared to eligible non-beneficiaries. Prevalence of self-reported illness in last 3 months was significantly higher among the beneficiaries compared to the eligible non-beneficiaries. Assessment of health-related quality of life of elderly persons shows that beneficiaries attained significantly higher scores in the social and economic dimensions and lower scores in the physical dimension compared to the eligible non-beneficiaries. On the other hand, in all the dimensions non-eligible participants attained significantly higher scores compared to both beneficiaries and eligible non-beneficiaries. Elderly persons who were involved in paid work, literate, men, currently married and belonged to younger age group attained significantly higher health-related quality of life scores. The majority of beneficiaries (93%) expressed satisfaction about the ongoing allowance scheme. This assistance allowed some beneficiaries to initiate income-generating activities. Furthermore, being a beneficiary was significantly associated with increased household expenditure on protein enriched food, improvement in body weight, social and economic dimensions of health-related quality of life of the elderly persons. This positive outcome of allowance, although small, justifies its continuation and expansion to bring more individuals in its net.

1
INTRODUCTION
Cash transfer is a social assistance given to individuals, as distinct from the communities (Farrington and Slater 2006). The World Bank Group defines cash transfer as the provision of assistance in the form of cash to the poor or to those who face probable risk, in the absence of the transfer, of falling into poverty. Ahmad (1991) defines the social security as public action including that by communities, to protect the poor and vulnerable from adverse changes in living standards. Research indicates that cash transfer impacts on level of poverty and vulnerability of the recipient households, facilitates access to essential healthcare services as well as improves intra-household relationship (Lloyd-Sherlock 2006). Recent research demonstrates that cash transfer reduces household’s probability of becoming poor by 21% in Brazil and 11% in South Africa (HelpAge 2006). Evidence shows that cash transfer impact not only among the beneficiaries but it also impacts on the lives of fellow household members. In South Africa for instance, drop out rate of student was reduced and improved nutritional status of children in the beneficiary of cash transfer households (Jones et al. 2007). Hence, cash transfer has increasingly become popular in many countries for reducing poverty. Although formal social assistance has significant effects on the lives of the beneficiaries, this is offered in a limited scale globally due to constraint of resources. This is substantially minimal in the low-income countries. Hence, 70% of the world population, eligible for social security assistance, rely on informal social assistance (World Bank 1994). Evidence shows that extended family system has been gradually disappearing in low-income countries which has important repercussion on the lives of elderly persons. Hence, the plight of elderly persons needs to be addressed (Senior Citizen 2007). Similar to the elderly persons, the poor ever-married single women are vulnerable in many aspects and deserves this sort of assistance for their welfare. In Bangladesh, until late nineties unlike government employees there was no provision of life-long formal social security assistance for the elderly persons and the poor ever-married single women. It may be mentioned here that considering the needs of ever-married single poor women, the government initiated vulnerable group development (VGD) programme before the inception of cash transfer scheme. Through this programme beneficiaries receive 30 kg food grains per month for two years and skill development training to initiate income-generating activities.

2
In 1998, the cash transfer scheme was introduced for these segments of the population. Since its inception the beneficiaries have been increased from 0.5 million in 1998 to 2.2 million in 2006 (0.6 million widow and 1.6 million elderly persons). Beneficiary selection processes are supposed to follow similar procedures for both allowance schemes (Box 1). Allowances are provided from the government revenue and allocation is 0.03% of the gross domestic products (GDP) (HelpAge 2008). Beneficiary lists are officially supposed to be drawn up at the ward level, and screened by upazila-level committees.1 The now-formally defunct Gram sarkar2 was originally responsible for initial ward-level selection. In 2007, exclusion criteria were changed to include elderly people. The following procedural conditions govern the selection process: • Applications by elite people, mass media and local people will be
recognized. • Upazila-level applicants to submit applications to the upazila social
welfare officer. • To select the beneficiaries, there will be an upazila-level committee,
and a Gram sarkar committee at ward and union levels. • In 'c' grade municipalities, applications should be submitted to the
upazila social welfare officer. • In 'a' and 'b' grade municipalities, applications should be submitted
to the deputy director of the district social welfare office. In practice, the union parishad member or chairman is likely to take key decisions regarding who makes it on to the beneficiary list. Research on other social safety net programmes has shown that lobbying by poor people is an important factor in how beneficiaries are selected. For the VGD programme, Matin and Hulme found women actively lobbying local elites and NGO staff to be selected (2003), while Ahmed et al. found more than two-thirds who attempted but failed to join the programme were told their turn would come: ‘persistent expression of demand by applicants played a very important role’ (Ahmed et al. 2004a).
1 In general, there are between 1 and 3 villages in each ward, and nine wards in
each union. There are around 4,484 unions in the country, under more than 480 rural thanas or upazilas (sub-districts). The lowest level of public administration is the upazila, but each UP has a council, to which representatives are elected. The UP council features a chairman, a member for each ward, and a woman member for every three wards, all of whom are elected.
2 This was an experiment with village councils introduced in 2003. 40,000 Gram sarkars were constituted on the basis of selection, but the Act establishing these was declared illegal by the High Court in 2006 (BRAC 2006).

3
Box 1. Official criteria for beneficiary selection for the old age and widowed/abandoned women’s allowances
Criteria Old age allowance Widowed and abandoned women’s allowance
Priority groups/ eligibility
Priority for • the oldest • those not less than 65 years of
age
Priority for women who are • widowed • abandoned • divorced • otherwise separated from or not
living with their husbands Physical/ health
Priority for • those least physically able • those suffering from physical or
mental illnesses or disabilities
Priority for women who are • elderly • disabled or physically
incapacitated Income Not more than Tk 3,000 per annum Socio-economic
Priority for • older freedom fighters • the destitute • refugees • landless • widows/widowers • divorced • childless • separated from family
Priority for the following women: • destitute • abandoned by their husbands • have at least two children
under 16 years
Other Priority for those who spend a high proportion of their income on food, healthcare, shelter and other expenses. Those who spend all their earnings on food should be given priority
Priority for landless applicants (ownership of less than 0.5 acres of land is defined as landless)
Exclusion criteria
The following are to be excluded: • government employee/family
member and pension allowance beneficiary
• VGD cardholders • recipient of any regular govern-
ment allowances • recipients of regular assistance
from any non-government agency or social welfare institution
• residents of city corporations1 • day labourers, domestic servants
and professional beggars
The following are to be excluded: • government or non-government
employees • recipients of pension
allowances • VGD cardholders • recipients of other government
allowances • recipients of regular assistance
from any other non-governmental or social welfare institute
• women who have remarried
Source: Implementation Manual for the Old Age Allowance Programme, Ministry of Social Welfare, December 2004 Implementation Manual for the Widowed and Abandoned Women’s Allowance Programme, Ministry of Women and Children’s Affairs, April 2004
1 These exclusion criteria are from the Implementation Manual for the Old Age Allowance dated December 2004. In 2007, the allowance was also extended to cover city corporation inhabitants.

4
Many safety net resources are distributed through local political administrations, usually formal but sometimes informal. Decentralizing targeting and selection processes in safety nets has its advantages, e.g., the efficiency gains in terms of local knowledge of the community. At the same time, it entails some loss of central control over resource distribution with potential for wider scope for corruption and leakage. ‘Whether community discretion leads to better or worse targeting depends entirely on the interplay between national politics and local politics and the pressures brought to bear at each level’ (Pritchett 2005: 25). While there has been some attention to the matter of the interplay between national and local politics in safety nets in Bangladesh (Hossain 2006), local political factors in how effectively safety nets are targeted have received little attention until recently, although their central importance in how well safety nets perform is increasingly recognized:
Political influences are likely to come into force most decisively at the level of implementation, and the institutions chosen for making lists and handling delivery. Does provision go through corrupt channels, reinforce patronage networks or miss out the poor? ... In some countries actors at local levels may be decisive in implementation and depart from central policy intentions. Ignoring the political nature of mechanisms for targeting runs the risk of delivery failure, whatever the motivation (Cliffe 2006: 24-5).
Safety nets may be used as part of the resources with which local political elites reward their clients within their patronage networks. In practice, local political leaders may siphon off resources intended for poor beneficiaries directly into their own or the pockets of supporters. Or they may select their own factional supporters, relatives or political activists as beneficiaries of programmes, including those who are not poor. The evidence for Bangladesh suggests that leakage, corruption and the use of safety net resources for patronage purposes are characteristic of government food security programmes for the poor. While there remains considerable doubt about its magnitude, there is no disagreement about leakage and corruption on levels that warrant action. There has, however, been little empirical evidence about corruption or leakage in either the old age or the widows’ allowance to date, nor have targeting and selection been explored in depth. The literature on how other safety nets work in the particular socio-political context of Bangladesh suggests two dimensions of local politics to understand how targeting, selection and the distribution of benefits take place in practice:

5
1. Political expectations. There is strong moral and political pressure on local elites, whether as patrons, respected community leaders, or as politicians, to provide for the poor. The strength of this expectation is likely to vary between social contexts, but local leadership appears to be substantially crafted on the ability to deliver, regularly demonstrated (Hossain 2005).
2. Poor people lobby. There is evidence that poor women are more successful at gaining access to safety nets if they do the political work involved in laying claim to them (Matin and Hulme 2003; Ahmed et al. 2004a).
To our knowledge, since the inception of old age and widow allowance scheme in Bangladesh, no population-based study was done to examine the targeting, selection, and distribution process of the benefits and association of these allowances with socioeconomic and health indicators. This study aims to provide some insights on these issues. Objectives The study aims to: i. explore the targeting, selection and disbursement process; process of
use of the allowances by the beneficiaries and their satisfaction,
ii. explore their opinions regarding the role of government and non-governmental organizations towards poor single women and elderly persons, and
iii. examine the association of the widow and old age allowance with expenditure on food, food intake behaviour, perception about change in body weight, prevalence of self-reported illness and health-related quality of life of the elderly persons.

6
MATERIALS AND METHOD
Syed Masud Ahmed, AKM Masud Rana, Naomi Hossain Study settings This cross-sectional study was conducted in 10 (out of 64) districts of Bangladesh where BRAC (formerly known as Bangladesh Rural Advancement Committee), a non-governmental organization has been maintaining a demographic surveillance system since 1995 in 52 villages (Fig 1). The selected districts are geographically representative (Ahmed et al., 2004b). At least one upazila is taken from each of the six administrative divisions of the country.
Figure 1. Map showing the study areas across the country
WATCH PROJECT BRAC DSA
LALMONIRHAT
INDIA
JOYPURHAT
INDIA
JAMALPUR
KISHOREGANJMANIKGANJ
DHAKA INDIA
JESSORE
MOULVIBAZAR
KUSHTIA
COX’S BAZAR
BANDARBAN
JHALOKATHI
BAY OF BENGAL
MYANMAR
N

7
Sample All ever-married single women irrespective of socioeconomic status and age, and all elderly persons (≥60 years) were sampled for this study totalling 5,524 participants. Of them, 4,824 were interviewed. Non-response rate was 13% for the overall sample (including single women and elderly persons) and 15% among the elderly persons. Data collection tools Two modules of pre-tested structured questionnaires were used to collect data on different indicators. The first module consisted of socio-demographic profiles of the participants; selection, and disbursement process of allowances; household’s expenditure on food in last 24 hours, food intake behaviour and perceived change in body weight in last three months; and information on self-reported illness. The food items included: rice, wheat, meat, lentils, fishes, milk, eggs, vegetables and fruits. This module was administered to all the study participants irrespective of age. The second module consisted of health-related quality of life (HRQoL) assessment tools administered only among the elderly persons. This assessment was done based on 24 items distributed across six dimensions and compared between beneficiaries and eligible non-beneficiaries as well as non-eligible. The reliability of the instrument was confirmed by Cronbach’s Alpha, which was 0.87, indicating high reliability of the instrument. Both sets of questionnaires were pre-tested in a village outside our study areas for ascertaining consistency, appropriateness of languages, sequencing of the questions, and to have an insight into the field operation procedure. These were then edited in the light of feedback received. The easily identifiable color-coded questionnaires were backed by an instruction manual in Bangla for the interviewers. Data collection A total of 37 field investigators were recruited and given weeklong hands on training on the questionnaires and procedures of data collection. Principal investigators conducted the training of field investigators. Following the training, the field investigators were divided into 10 teams. The distribution was done based on the sample size of the area and accordingly, three to four investigators were assigned in each team. The study passed through the usual institutional review process at BRAC Research and Evaluation Division (http://www.brac.net/research) for ethical approval. The final questionnaires were administered in face-to-

8
face interview at home of the study participants by the field investigators after obtaining informed verbal consent. The participants were informed about the objectives of the study and their autonomy to discontinue at any point of the data collection and given assurance that the data will be analyzed anonymously and confidentially. A field investigator from each team was assigned as team leader for supervision of the data collection activities over and above her/his own scheduled data collection, and 40% of her/his time was earmarked for this. Besides, the field investigators crosschecked each others filled-in questionnaires at the end of the day. Households were visited on two repeated occasions at intervals, if the first attempt was not successful due to absence of the respondents. When these repeated attempts failed, the interview was called-off for the particular household. For quality control of data five independent monitors were employed to oversee the field activities and to ensure that the data collection was performed as instructed. The monitors checked all the filled-in questionnaires at the field stations where field investigators stayed during data collection. If inconsistent and missing information found in any questionnaire, re-interview was done to make a correction for the inconsistencies and to collect the missing information. This was possible as the field investigators resided nearby the study areas. The principal investigators supervised the overall data collection activities. Intervention The government-supported cash transfers schemes namely widow and old age allowances, are being offered for the past decade in rural Bangladesh. Of these, old age allowance is offered to the poor elderly persons who are ≥65 years old while widow allowance is offered to the ever-married poor single women e.g. widows, abandoned and divorced women irrespective of age. An encouraging feature is that over the years both the number of beneficiaries as well as the amount of allowance per capita increased (from US$ 2 in 1998 to 2.9 in 2006), disbursed quarterly. However, due to the paucity of resources, substantial numbers of eligible people remained out of this scheme. Dependent variables The dependent variables include selection, implementation and disbursement process of the allowance, the households; expenditure on food items in the preceding 24 hours, individual food intake practice daily and weekly, prevalence, and duration of illness. The food items were categorized into carbohydrates, protein, fruits and vegetables. Carbohydrates include rice and wheat. Protein includes fish, meat, eggs and lentils. Health-related quality of life was assessed based on six

9
dimensions such as physical, psychological, social, spiritual, economic, environment as well as overall HRQoL scores. Explanatory variables The explanatory variables include age, sex, education, marital status, family size, present occupation, economic status, and duration of benefits for beneficiaries only and involvement in NGOs activities. Educational status was categorized into two groups such as illiterate and literate. Illiterate was considered, when individual reported that they couldn’t read or write Bangla language. Marital status was categorized as married and single. Married group comprised currently married individuals while single group comprised widows, widowers, divorced and abandoned. Current occupation of the respondents was divided into paid and unpaid work. Paid work was considered when individuals reported that they were involved in any income earning activities. On the other hand, unpaid work represents persons who did not involve in any income earning activities such as old, unable to work, unemployed and performed household work. Poverty status was measured based on whether the household was eligible to become member of the BRAC-operated development programmes as well as based on self-assessment of the household member. BRAC eligible was considered when a household owns less than 50 decimal of land including homestead and any member of household sells manual labour at least 100 days or more in a year in order to maintain livelihood. Furthermore, the self-assessment of economic status of households was done based on income and expenditure, which is categorized as deficit and non-deficit. To determine these categories the respondents were asked to assess their household economic status. Deficit category represents always and occasional deficit. Non-deficit represents break even and surplus categories. Analyses Both bi-variate and multivariate analyses such as chi-square, independent t tests and linear regressions were preformed to examine the group level differences in socioeconomic and demographic indicators as well as food consumption, body weight in last three months, morbidity, and health-related quality of life (HRQoL) was assessed only among the elderly persons. In exploring the selection, implementation and disbursement processes and to examine association of cash transfer with expenditure on food items of the households, individual food intake behaviour and prevalence of self-reported illness, the analyses were done for 811 persons who received allowances or was a member of the recipient households, 1,660 eligible non-beneficiaries and 2,353 non-

10
eligible individuals totalling 4,824. For HRQoL assessment, analyses were done for 509 beneficiaries, 1,224 eligible non-beneficiaries and 2,098 non-eligible individuals totalling 3,831.

11
FINDINGS AND DISCUSSION TARGETING,IMPLEMENTATION AND DISTRIBUTION OF BENEFITS Naomi Hossain and Nahleen Zahra This section of the report presents findings from the survey on targeting, beneficiary selection processes, and the distribution of benefits under the old age and the widows’ allowances schemes. The section concludes with an assessment of the factors influencing how local political representatives target and select beneficiaries. Targeting: who benefits from the allowances? Table 1a shows that just under half of the respondent population or 47% are poor based on the definition of poverty used by BRAC, however, according to the food security status reported by respondents suggest that vulnerability affects a considerably higher proportion of this elderly and widowed population: 62% reported always or sometimes being in food deficit, compared to only 38% reporting breaking even or being in surplus. When disaggregated (Table 1b), the elderly, widowed/abandoned women were found more likely to be vulnerable to food insecurity than to be designated as poor. Table 1b shows that similar proportions of elderly people and widowed/abandoned women reported being food-insecure, and were designated as poor. For this reason, where relevant, the discussion which follows will present and discuss findings on these groups in aggregate. Table 1a. Poverty and food security status in the respondent
population
Personally beneficiary
Non-beneficiary
Beneficiary in household
All respondents
Indicators
No. % No. % No. % No. % Deficit 595 87.0 2,299 57.0 99 84.0 2,993 62.0 Food
security status
breakeven/surplus 98 14.0 1,707 43.0 19 16.0 1,824 38.0
Poor 509 73.0 1,659 41.0 82 69.0 2,250 47.0 Poverty status non-poor 184 27.0 2,347 59.0 36 31.0 2,567 53.0 Total 693 100.0 4,006 100.0 118 100.0 4,817 100.0

12
Table 1b. Poverty and food security status among the elderly, and widowed/abandoned women
Elderly Widowed/abandoned Indicators
Number % Number % Deficit 378 87.0 217 85.0 Food security
status breakeven/surplus 59 14.0 39 15.0 poor 317 73.0 193 75.0 Poverty status non-poor 120 27.0 63 25.0
Total 437 100.0 256 100.0 Table 1a also shows that both programmes are better targeted to the self-reported food insecure, with some 87% of food insecure people personally benefiting from the allowances, compared to 14% of those reporting breaking even or being in surplus. By contrast, when we look at poverty status, a less impressive 73% of those benefiting personally are poor, and as many as 23% are classified as non-poor. A further 69% of those who do not benefit personally but whose households include a beneficiary are also poor, with some 31% of that group being defined as non-poor. Table 2 shows that around 14% of the respondent population benefitted personally from the allowances. A further 2% were from households in which another member was a beneficiary of either allowance.3 In terms of targeting, 23% of the poor were direct beneficiaries of the allowances, and 20% of the food insecure respondents. Interestingly, 5% of the food-secure and 7% of the non-poor were also direct beneficiaries.
The selection process Table 3 shows that more than 90% of respondents, beneficiaries and otherwise, felt that the local member or chairman was the key decision-maker on this issue. The assumption that the chairman/member are the most important actors in selection decisions is affirmed by reported experiences of being selected as beneficiaries: some 96% of beneficiaries had been selected (received cards) through either the member or the chairman, usually the member (Table 4). A similar proportion of both the poor and the non-poor beneficiaries reported having been selected by members and chairmen.
3 The rule is that there should be only one old age allowance or widow’s allowance
card per household.

13
Table 2. Beneficiaries by food security and poverty status
Self-reported food security status BRAC poverty definition Status of study participants Sometimes/
always deficit
Break-even/
surplus
Total poor non-poor
Total
Personally a beneficiary
595 (20.0)
98 (5.0)
693 (14.0)
509 (23.0)
184 (7.0)
693 (14.0)
Beneficiary in the household
99 (3.0)
19 (1.0)
118 (2.0)
82 (4.0)
36 (1.0)
118 (2.0)
Non-beneficiary 2,299 (77.0)
1,707 (94.0)
4,006 (83.0)
1,659 (74.0)
2,347 (91)
4,006 (83.0)
Total 2,993 (100.0)
1,824 (100.0)
4,817 (100.0)
2,250 (100.0)
2,567 (100.0)
4,817 (100.0)
NB. Figures in parentheses indicate (%) Table 3. Influence over the selection process Beneficiary Non-beneficiary Total Person deciding who receives the old age/widow allowance Member/Chairman 757 (93.0) 3,662 (91.0) 4,419 (92.0) Local influential person 50 (6.0) 300 (7.0) 350 (7.0) Others/Don’t know 4 (0.4) 44 (1.0) 48 (1.0) Total 811 (100.0) 4,006 (100.0) 4,817 (100.0) Beneficiary Non-beneficiary Total Person deciding who receives the old age/widow allowance Member/Chairman 757 (93.0) 3,662 (91.0) 4,419 (92.0) Local influential person 50 (6.0) 300 (7.0) 350 (7.0) Others/Don’t know 4 (0.4) 44 (1.0) 48 (1.0) Total 811 (100.0) 4,006 (100.0) 4,817 (100.0)
NB. Figures in parentheses indicate (%) Table 5 compares how the poor and the non-poor understand whom the programmes are supposed to be targeted to. Around one-third of both the poor and the non-poor beneficiaries felt that age was a factor taking into account, while almost half, 45% of the poor and 46% of the non-poor felt that the level of poverty of the individual was taken into account.

14
Table 4. Person who arranged for the respondent to get a card %
Self-reported food security status Poverty status Who arranged Deficit surplus Total Poor non-poor Total Chairman 152 (26.0) 26 (27.0) 178 (26.0) 133 (26.0) 45 (24.0) 178 (26.0) Member 419 (70.0) 70 (71.0) 489 (70.0) 358 (70.0) 131 (71.0) 489 (71.0) Relatives 10 (2.0) 1 (1.0) 11 (2.0) 7 (1.0) 4 (2.0) 12 (2.0) Gram Sarkar 11 (2.0) 1 (1.0) 12 (2.0) 8 (2.0) 4 (2.0) 12 (2.0) Guard/ chowkidar 3 (0.5) 0 (0.0) 3 (0.5) 3 (0.5) 0 (0.0) 3 (0.4)
Total 595
(100.0) 98
(100.0) 693
(100.0) 509
(100.0) 184
(100.0) 693
(100.0) NB. Figures in parentheses indicate (%) Table 5. Factors taken into account during beneficiary selection (old
age allowance only) Old age allowance Poor Non-poor Total No. % No. % No. % Age 183 33 63 32 246 32 Level of poverty 250 45 91 46 341 45 Widowhood 0 0 0 0 0 0 Illness 67 12 23 .4 97 13 Whether they have adult children who can help them
51 9 17 9 72 9
Recommendations from influential people
1 .2 2 1 3 .4
NA 3 .5 0 0 3 .4 Total 555 100 196 100 762 100
Note: totals amount to more than 100 because of multiple responses. Although marital status is supposed to be taken into account according to official guidelines, none of the beneficiaries mentioned this. Health status and the presence of adult children who can help were also seen as important factors; these are both in line with official eligibility criteria. Interestingly, while the poor almost universally believed they were eligible for the allowances, some 50% of the non-poor also believed so (Table 6). Table 6. Eligibility for receiving the allowance (%) Whether eligible or not (%) Poor Non-poor Total Yes 2,187 (97.0) 1,276 (50.0) 3,463 (72.0) No 63 (3.0) 1,291 (50.0) 1,354 (28.0) Total 2,250 (100.0) 2,567 (100.0) 4,817 (100.0)
Next, we wanted to explore to what extent do poor people actively lobbied to become beneficiaries of the old age and widows’ allowances. Table 7

15
shows that lobbying is crucial: beneficiaries were more likely to have made active efforts to get a beneficiary card, with fully 92% of poor beneficiaries and 90% of non-poor beneficiaries reported having done so. However, 82% of the poor who had not succeeded in becoming beneficiaries had also lobbied for cards. Almost all of those who had tried to get cards had lobbied to the members or chairmen. Such extensive lobbying is a striking finding, as it suggests a far higher level of political agency among poor, vulnerable, elderly and marginal groups than is normally assumed to be the case. It also suggests that local political representatives are likely to face considerably more scrutiny and demands for accountability than is commonly assumed. The extent to which the potential beneficiaries are informed and politically engaged to make demands on local political representatives is likely to determine how responsive they are to the poor and the vulnerable people. Table 7. Extent of lobbying to be selected as beneficiaries (%)
Beneficiary Non-beneficiary Whether tried to get a card
All Poor non-
poor Total Poor non-
poor Total
Yes 2,627 (76.0)
544 (92.0)
195 (90.0)
739 (92.0)
1,308 (82.0)
580 (54.0)
1,888 (71.0)
No 836 (24.0)
46 (8.0)
21 (10.0)
67 (8.0)
289 (18.0)
480 (45.0)
769 (29.0)
Total 3,463 (100.0)
590 (100.0)
216 (100.0)
807 (100.0)
1,597 (100.0)
1,060 (100.0)
2,657 (100.0)
NB. Figures in parentheses indicate (%) Not everyone lobbies, however, and it is likely to be the most vulnerable and poorest groups who fail to do so. Table 8 presents findings from questions intended to explore why some people lobby while others do not. About 46% of those who had not tried to get a card did not attempt because they either felt that they were not eligible, or had no need, being sufficiently well-off not to feel for lobbying members, or in a small number of cases, they received cards without lobbying. About 47% of those who had not lobbied had not done so because they felt or knew themselves to be excluded from access to the cards. One third of all respondents felt that they were unlikely to receive the cards because they did not usually receive much assistance from the government. Whether this is because they are not seen as poor or vulnerable enough, or because they are actively excluded despite eligibility is not clear. But 14% of all respondents had not lobbied for cards because of what can be termed failures of the governance of the safety net programme, along three dimensions: 1) Ten percent of these respondents reported lacking ‘good
relationships’ with those with the power to distribute resources. This strongly suggests the use of safety nets for patronage purposes, rather than selection of beneficiaries on the basis of need.

16
It also suggests the practices are so well-established that many people feel there is no point in expending energy on lobbying.
2) Another 3% reported their inability ‘to pay for the card’, suggesting that bribes are exchanged for cards. Given that the poorest will be least well-placed to ‘invest’ in the card, this may limit their possibility of being selected.
3) A further 1% reported lacking any information about the programme, suggesting that better information dissemination by the programme is needed.
Table 8. Reasons for not lobbying Reasons for not lobbying to get a card Frequency %
There are other people more deserving than I am
278 33.0
There are not enough cards for all the poor people
46 6.0
Husband/other family member gets allowance
29 3.0
Well-off financially/have land 8 1.0 Member came to house and gave it 20 2.0 Son is employed/husband is alive 6 1.0
Eligibility/lack of necessity
Have made list several times before, so haven't gone again
1 0.0
Don't have good relationship with those who give out cards
84 10.0
Couldn't afford to pay for the card 22 3.0
Governance failures
Due to lack of information 11 1.0 I normally don't get much 272 33.0 Ashamed 50 6.0
Exclusion
Was physically unable 9 1.0 All Total 836 100.0 Table 9 sheds further light on the local politics of beneficiary selection. The most widespread tactic is persistent pressure which more than two-thirds of beneficiaries reported. Around 21% used their social and political networks, while the remaining 11% did not have to take any action. Table 9. Actions taken by beneficiaries to get selected
Actions reported in lobbying for a card (beneficiaries only)
Frequency Percent
Repeatedly requested 455 69.0 Requested through other people 73 11.0 Got card without any effort 71 11.0 Use of political connections/activities 64 10.0 Total 663 100.0

17
The role of information in accessing safety nets Almost all (more than 99%) respondents knew about the various government assistance programmes, but there were differences in how different groups received information. Table 10 shows that among those who were currently benefiting from the old age or widows’ allowances, more than half (56%) had information about government safety nets from UP members or chairmen, while under one-third (29%) had heard from their neighbours. This pattern is reversed for non-beneficiaries, for whom just over half (54%) had heard from their neighbours, while one-third (32%) had information from UP chairmen or members. Other important sources of information were the UP, the now officially defunct gram sarkar,4 and to a more limited extent, relatives and other government officials. Comparing the sources of information according to whether the respondents were poor or not, it seems that the poor were more likely than the non-poor to know about government assistance programmes from the UP members and chairmen, and to rely on neighbours and relatives less than the non-poor (Table 10). The UP chowkidar played an important role for a higher proportion of the poor than for the non-poor, whereas the media was a source of information for the non-poor, but not the poor. Table 10. Sources of information about government assistance
programmes
Beneficiary non-beneficiary Source of information about allowances
Poor Non-poor Total Poor Non-poor Total
Neighbour 162 (27.0)
77 (35.0) 239 (29.0)
867 (52.0) 1,315 (56.0)
2,182 (54.0)
Member/ Chairmen
336 (57.0)
120 (55.0)
456 (56.0)
555 (33.0) 735 (31.0) 1,290 (32.0)
Chowkidar 59 (10.0) 11 (5.0) 70 (9.0) 153 (9.0) 109 (5.0) 262 (7.0) Relatives 8 (1.0) 4 (2.0) 12 (1.0) 33 (2.0) 90 (4.0) 123 (3.0) Gram sarkar 20 (3.0) 5 (2.0) 25 (3.0) 33 (2.0) 58 (2.0) 91 (2.0) Influential people of the area
1 (0.0) 2 (1.0) 3 (0.0) 8 (0.0) 9 (0.0) 17 (0.0)
Government official
5 (1.0) 1 (0.0) 6 (1.0) 2 (0.0) 12 (1.0) 14 (0.0)
Total 591 (100.0)
220 (100.0)
811 (100.0)
1,659 (100.0)
2,347 (100.0)
4,006 (100.0)
NB. Figures in parentheses indicate (%)
4 This was an experiment with village councils introduced in 2003. 40,000 Gram
Sarkars were constituted on the basis of selection, but the Act establishing these was declared illegal by the High Court in 2006 (BRAC 2006).
18
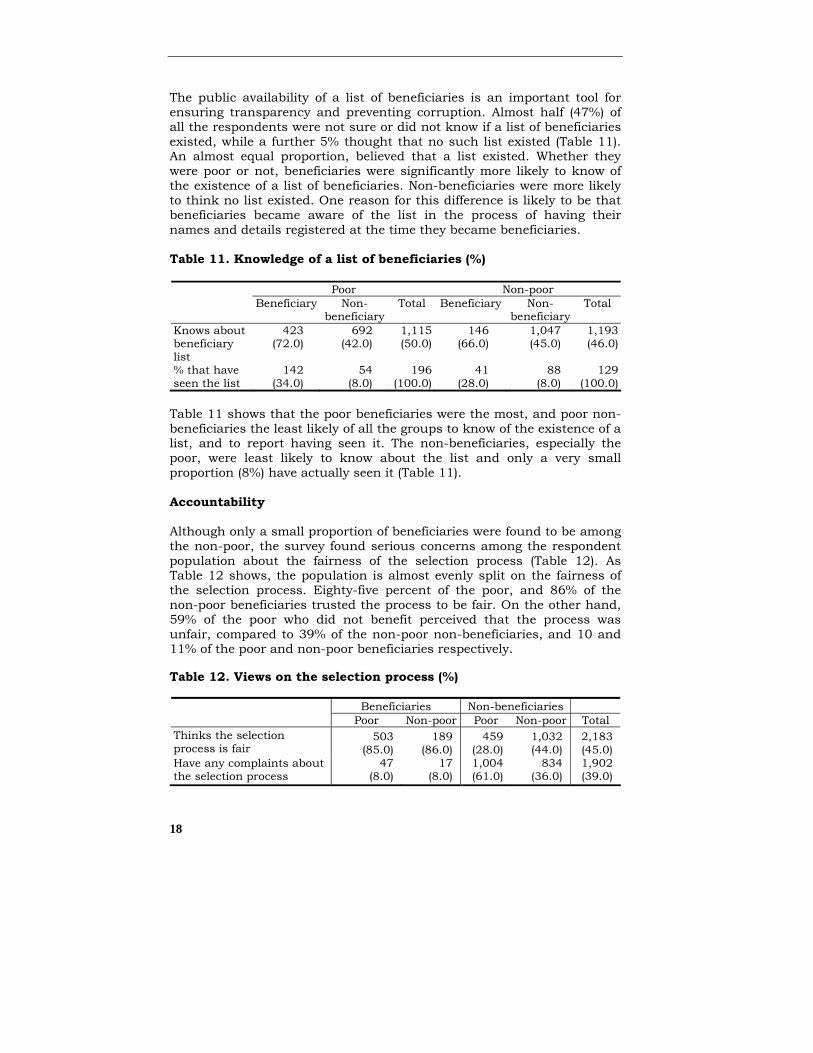
The public availability of a list of beneficiaries is an important tool for ensuring transparency and preventing corruption. Almost half (47%) of all the respondents were not sure or did not know if a list of beneficiaries existed, while a further 5% thought that no such list existed (Table 11). An almost equal proportion, believed that a list existed. Whether they were poor or not, beneficiaries were significantly more likely to know of the existence of a list of beneficiaries. Non-beneficiaries were more likely to think no list existed. One reason for this difference is likely to be that beneficiaries became aware of the list in the process of having their names and details registered at the time they became beneficiaries. Table 11. Knowledge of a list of beneficiaries (%)
Poor Non-poor Beneficiary Non-
beneficiary Total Beneficiary Non-
beneficiary Total
Knows about beneficiary list
423 (72.0)
692 (42.0)
1,115 (50.0)
146 (66.0)
1,047 (45.0)
1,193 (46.0)
% that have seen the list
142 (34.0)
54 (8.0)
196 (100.0)
41 (28.0)
88 (8.0)
129 (100.0)
Table 11 shows that the poor beneficiaries were the most, and poor non-beneficiaries the least likely of all the groups to know of the existence of a list, and to report having seen it. The non-beneficiaries, especially the poor, were least likely to know about the list and only a very small proportion (8%) have actually seen it (Table 11). Accountability Although only a small proportion of beneficiaries were found to be among the non-poor, the survey found serious concerns among the respondent population about the fairness of the selection process (Table 12). As Table 12 shows, the population is almost evenly split on the fairness of the selection process. Eighty-five percent of the poor, and 86% of the non-poor beneficiaries trusted the process to be fair. On the other hand, 59% of the poor who did not benefit perceived that the process was unfair, compared to 39% of the non-poor non-beneficiaries, and 10 and 11% of the poor and non-poor beneficiaries respectively. Table 12. Views on the selection process (%)
Beneficiaries Non-beneficiaries Poor Non-poor Poor Non-poor Total Thinks the selection process is fair
503 (85.0)
189 (86.0)
459 (28.0)
1,032 (44.0)
2,183 (45.0)
Have any complaints about the selection process
47 (8.0)
17 (8.0)
1,004 (61.0)
834 (36.0)
1,902 (39.0)

19
Table 12 also shows that poor non-beneficiaries are considerably more likely to have complaints about the selection process than all other groups, with 61% reported having complained. Just over one-third or 36% of the non-poor who were not benefiting also complained. Findings also show that a similar proportion of both beneficiaries and non-beneficiaries who had grievances with the process went to the effort of voicing complaints (29%). Table 13 summarizes the experience of making a complaint. Most (88%) of those who complained went to their UP members/chairmen to do so, but a wide range of other influential persons were also contacted. Regarding consequences of complaints: the members and chairmen typically promised cards, with 61% of all complainants reported such experience. But 27% of those further complained that this promise had not been met. Eleven percent reported being unable to pay for the card, suggesting that the card had been offered in return for payment after complaining. A small number had been turned down on grounds that they had not voted, were not related or for other discretionary reasons were not chosen by the UP members/chairmen, or faced abuse as a result of the complaint. In two cases, it was reported that chairmen had taken the money but not provided the card. Table 13. The experience of complaining for being not included in
the beneficiary list Frequency Percent Person complained to
Member/chairman 490 88.0 Neighbour 16 3.0 Matbar 11 2.0 Gram sarkar 11 2.0 Influential person 11 2.0 Political person 8 1.0 Guard 6 1.0 Others 7 1.0
Total 560 100.0 Consequences of the complaint?
Said they would give card when it is ready 188 34.0 Said they would give card when ready, but didn't 152 27.0 Couldn't afford to pay money for card 61 11.0 Nothing happened 27 5.0 Not enough cards relative to poor people 27 5.0 Didn't get because didn't vote 20 4.0 Didn’t get because too young 16 3.0 Didn’t get because son works/earns 15 3.0 Didn't get because well-off 11 2.0 Husband/wife/other family member gets allowance/stipend 10 2.0 Others 33 5.0
Total 560 100.0

20
Table 14 presents responses to a question about what could be done to make the selection process fairer. The majority of the respondents, (67%) opined that visits to potential beneficiaries’ homes would ensure fairer selection, presumably because it would provide better information about their true state of need. The respondents displayed considerable faith in the army (due to positive reputation of lack of corruption in the distribution of benefits), with nearly one quarter (24%) of respondents supporting army involvement in selection processes. The only other actions that attracted support were a process of open selection in front of the whole community (10%) and support for NGO involvement (only 5%). Table 14. Perceived ways to make the process fairer
Responses Number % Visit potential beneficiaries’ houses 1,345 67.0 Take help from the army in selection 495 24.0 Openly select in front of everyone 215 10.0 Involve NGOs in the selection process 100 5.0 Others 13 2.0 Total 1,994 108
Note: this was only asked of those who did not think the selection process was fair. Multiple responses were allowed. Only 3% of the respondents could identify any initiatives to make the process fairer (Table 15). Of these, 47% had made requests to the chairman or member, suggesting that these were claims for personal entitlements rather than requests for a fairer process. But there were also more confrontational approaches, with poor non-beneficiaries asking members why they had not got cards (14%); protests over the selection process (12%); and going collectively to the UP (5%). The small proportions of respondents claiming knowledge of actions taken to make the process fairer suggests that there is some acceptance of the current situation; however the forms of action taken also suggest a willingness to confront the relevant authorities among those who choose to act. The beneficiaries were asked whether they had to pay money to access their benefits. Some 12% of all the beneficiaries, whether poor or non-poor, reported paying to receive their cash allowances (Table 16). The overwhelming majority, or 57%, reported making payments to cashiers and other bank employees, while 25%, mostly the non-poor, reported making payments to the UP member. The total numbers reporting making payments are small, and so these results should be treated with caution.

21
Table 15. Actions taken to make the selection process fairer Types of action reportedly taken Frequency Percent Went to chairman/member and requested 99 47.0 Poor but non-beneficiaries asked member reason for not getting cards 29 14.0 Protested/fought 25 12.0 Told member/chairman that they would have to find an appropriate card holder 16 8.0 Everyone went to council to get card made 11 5.0 Neighbours took name 6 3.0 Told member that others get card/rice, and they should get it too 5 2.0 All poor people went to gram sarkar together 5 2.0 Others 14 4.0 Total 210 100.0 Table 16. Payments to access benefits (beneficiaries only) Poor Non-poor Total No. % No. % No. % Did you pay anyone to withdraw money from the bank? Yes 61 12.0 22 12.0 83 12.0 No 439 88.0 159 88.0 598 88.0 Total 500 100.0 181 100.0 681 100 Whom did you pay? Bank employees 41 68.0 7 32.0 48 57.0 Guard 4 7.0 2 9.0 6 7.0 Member 10 16.0 11 50.0 21 25.0 Peon 5 8.0 0 0.0 5 6.0 don't know 1 2.0 1 5.0 2 2.0 UP employee 0 0.0 1 5.0 1 1.0 Total 61 100.0 22 100.0 83 100.0
Further findings relating to corruption in the distribution of benefits include those who reported making payments, 36% had to pay once, 28% more than once, 8% reported paying several times, while 11% reported of making payments each time they went to collect their allowances. Only seven beneficiaries reported having complained about these payments, usually to the bank manager or their member. Discussion We attempted to assess how effective local representatives are in targeting the poor and vulnerable, to assess who benefits and why, and to explore the role of information and mechanisms of accountability in ensuring that allowances reach the poor and vulnerable. It found that the vulnerable were more likely to benefit than the poor, but more than half of the vulnerable and nearly half of the poor are currently excluded from

22
the allowances, The local political representatives appear to be better at targeting those who are vulnerable to food insecurity than targeting the poor. This suggests that they are able to take into account additional factors which are less readily observable. Overall, only 23 % of the poor and 20 % of the vulnerable benefitted, suggesting there is considerable scope for widening coverage. Although the official selection process is supposed to involve several stages and screening processes at different administrative levels, in practice, UP members and chairmen appear to play the decisive role. For the old age allowance, respondents’ views suggest that many of the official eligibility criteria are being taken into account in selection decisions. At the same time, while virtually all the poor felt that they were eligible to be beneficiaries, half of the non-poor also felt entitled highlighting the lack of clarity about the priority accorded to income poverty as a criterion for eligibility. Most respondents actively lobbied to be selected as beneficiaries. This is in line with the official guidelines which indicate that an application needs to be made to the relevant official. However, it also indicates a far greater willingness to be pro-active to ensure access to government resources among an elderly and otherwise marginal population than expected. Those who did not lobby, however, were divided between those who believed themselves to be ineligible (mainly the non-poor), and those who were excluded for various reasons, which included perceived bias and corruption in the selection process. Access to information about government assistance programmes also plays a significant role. The findings suggest that beneficiaries, whether poor or non-poor, were more likely to access information about government assistance programmes from the UP representatives. By contrast, the non-beneficiaries (both poor and non-poor) relied on apparently less valuable sources of information like neighbours or relatives. The poor who have failed to benefit from the allowances were least likely to know of the existence of a list of beneficiaries, although this group stands to benefit most from the open publication of such a list. The beneficiaries were considerably more likely than non-beneficiaries to believe the selection process was fair. Poor non-beneficiaries were most likely of all groups to believe that the process was unfair, and to have complaints about the process. However, a similar proportion of both beneficiaries and non-beneficiaries complained, mostly to the UP representatives. It seems clear that in most cases, people voice complaints for their own entitlements rather than for unfair selection process. However, findings also suggest that there is some recognition of the need to make more collective demands for a fairer process. Finally, there are some evidences of corruption in the process of beneficiary selection and the distribution of benefits. There were indications that

23
inability to pay for cards led to exclusion from the allowances, suggesting that such payments were reasonably routine. This would automatically exclude some of the poorest, as the survey findings suggest. More concretely, some 12% of the beneficiaries reported of making payments mostly to bank staff to receive their cash allowances. These preliminary findings warrant further analysis. An additional in-depth qualitative research is ongoing to shed more light on the processes of selection and leakage identified by the survey. One implication is that greater clarity about the eligibility criteria is likely to help improve the chances of the poor being selected; wider access to unbiased public information about eligibility, entitlement, the selection process, and the beneficiary list are also likely to help improve targeting to the poor and vulnerable, and may reduce leakage and corruption. NGOs appear to play a negligible role in the areas studied, suggesting there is considerable scope for NGO engagement in the process to ensure those currently excluded have a greater chance of being selected.

24
USES, SATISFACTION AND ASSOCIATION OF ALLOWANCE WITH SOCIOECONOMIC AND HEALTH INDICATORS
AKM Masud Rana and Syed Masud Ahmed This section provides a brief socioeconomic profile of the study participants, use and satisfaction about allowance, and opinions of study participants regarding the roles of government and non-government organizations for elderly persons and ever-married single poor women. Furthermore, it presents association of allowance with different socioeconomic and health indicators. Profile of the study participants Table 17 shows that the beneficiaries and eligible beneficiaries were comparable except mean age and occupation. The beneficiaries were older, and more frequently involved in paid work than their counterpart. Also, the beneficiary group was significantly different than the non-eligibles. Table 17. Socioeconomic and demographic profile of the study
participants by beneficiaries, eligible non-beneficiaries and non-eligible
Beneficiaries
Eligible
non-beneficiaries Non-eligible P values P values Indicators
1 2 3 1 vs 2 1 vs 3 Age (in years) (mean ±sd)
64.8 (13.0) 61.2 (13.3) 66.1 (10.6) P<0.001 P<0.001
Household size (mean ±sd)
4.3 (2.4) 4.4 (2.4) 5.8 (3.2) ns P<0.001
Sex Men Women
30.7 69.3
33.6 66.4
46.3 53.7
ns
P<0.001
Occupation Paid work Unpaid work
28.9 71.1
40.6 59.4
30.2 69.8
P<0.001
ns
Marital status Married Single
39.5 60.5
36.5 63.5
59.8 40.2
ns
P<0.001
Education Illiterate Literate
83.1 16.9
81.2 17.8
58.5 41.5
ns
P<0.001
n 811 1,660 2,353

25
Proportion of beneficiaries invested allowance for income generating activities About 15% of the beneficiaries invested their allowance for income generating activities. Of them, proportion of women was slightly higher compared to men. The mean investment was Tk. 149, which was slightly higher among women than men (Table 18). Table 18. Proportion of beneficiaries invested money in income
generating activities by sex Indicators Men Women All Proportion of beneficiaries invested allowance for IGA
12.0 15.8 15.0
Mean investment (in Taka) 114 164 149.0 (Range:70-5,400)
Satisfaction and dissatisfaction about old age allowance Table 19 indicates that majority of the beneficiaries were satisfied about the ongoing allowance scheme for the elderly and the women. Satisfaction was significantly higher among women. The reasons of satisfaction include can spend money for food, medicine and receive some money without any work. On the other hand, a small proportion of participants expressed dissatisfaction about the allowance. The reasons of dissatisfaction include inadequate money is given and some women recipients opined that they could not spend money on your own. Table 19. Expressed satisfaction or dissatisfaction about allowance
scheme by sex of the study participants
Whether satisfied or not Men Women All Yes 89.4 94.9 93.2 No 10.6 5.1 6.8 Reasons of satisfaction* Can spend money for food 70.6 76.2 73.5 Can spend money for healthcare
19.1 17.8 18.2
Get money without work 34.3 16.6 20.2 Reasons of dissatisfaction* Inadequate money 100.0 95.8 97.9 Others (cannot spend money on your own)
0.0 12.5 6.4
* Multiple responses are considered

26
Opinions of study participants regarding the roles of government and non-government organizations for widows and elderly persons We solicited the opinions of the study participants regarding the roles of government and non-government organizations for poor widows and elderly persons. Participants opined that both the government and NGOs may provide assets for income generating activities (IGAs) or financial assistance for such activities through provision of low-interest or interest-free loan. To make the IGA endeavour successful complementary assistances i.e. food, clothes, tin, latrine, tubewell and healthcare may be provided (Table 20). Table 20. Opinions regarding the roles of government and non-
government organizations for widows and elderly persons
Opinions regarding the roles of government and non-government organizations
Government %
Non-government organizations %
Providing financial assistance through low interest or interest free loan
49.3 43.5
Providing assets for income generating activities (IGA)
19.7 27.4
Providing commodities (food, clothes, tin., latrine, tube well etc.)
75.4 41.6
Providing healthcare 25.4 26.6 Multiple responses are considered Expenditure on food items during the last 24 hours Table 21 shows that expenditure on carbohydrates consumption (rice/wheat) was significantly higher among the eligible non-beneficiary households while protein consumption was significantly higher in the beneficiary households. On the other hand, expenditure on all of the items was significantly higher in the non-eligible households compared to both the beneficiaries and eligible non-beneficiaries. In the non-eligible households, total expenditure on food items during the last 24 hours was about double than both beneficiary and eligible non-beneficiaries households. Individual food intake behaviour Food intake behaviour showed no significant difference between the beneficiaries and eligible non-beneficiaries for most of the items except vegetable consumption where higher proportion of eligible non-beneficiaries consumed vegetables. However, higher proportion of participants from non-eligible group consumed different food items compared to beneficiaries and eligible non-beneficiaries (Table 22).

27
Table 21. Expenditure on food items in last 24 hours among beneficiaries, eligible non-beneficiaries and non-eligible households
Beneficiaries
(mean ) Eligible non-beneficiaries
(mean)
Non-eligible (mean)
P values
P values
Expenditure on food (in taka)
1 2 3 1 vs 2 1 vs 3 Carbohydrates (rice and wheat)
44.8±29.2 47.4±27.9 61.5±37.7 P<0.05
P<0.001
Protein intake (fish, meat, egg, lentils and milk)
19.4±34.0 16.2±25.1 54.2±69.3 P<0.05 P<0.001
Vegetables intake
14.5±11.6 14.0±10.3 21.4±14.6 Ns P<0.001
Fruits 0.2±1.8 0.1±1.3 3.4±14.1 Ns P<0.001 Total 78.8±58.1 77.8±48.7 140.5±104.9 Ns P<0.001 n 811 1,660 2,353 Table 22. Food intake behaviour of the study population
Non-beneficiaries Individual food intake behaviour
Beneficiaries Eligible
Non-
eligible P
values P values
% of people had chicken 2 times or more in a week
1.0 1.0 11.0 ns P<0.001
% of people had lentils 2 times or more in a week
64.5 67.7 80.5 ns P<0.001
% of people had two eggs or more in a week
15.3 12.6 44.2 ns P<0.001
% of people had fish everyday
3.7 3.0 20.1 ns P<0.001
% of people had vegetables 2 times or more everyday
84.5 90.1 88.6 P<0.001 P<0.01
% of people had fruits 2 times or more everyday
1.1 1.2 5.8 ns P<0.001
N 811 1,660 2,353 Perceived change in body weight in the last three months A small proportion of participants across the three groups perceived that their body weight has improved. Perceived improvement was significantly higher among the beneficiaries compared to eligible non-beneficiaries while no significant difference was noted between beneficiaries and non-eligible (Table 23).

28
Table 23. Perceived change in body weight in last three months among the study participants (%)
Beneficiaries Eligible non-
beneficiaries Non-
eligible P values P values Body weight
1 2 3 1 vs 2 1 vs 3 Improved 4.8 2.4 3.5 P<0.01 ns n 811 1,660 2,353 Self-reported illness Table 24 shows that prevalence of major illness in the last 3 months among the beneficiaries was significantly higher compared to both eligible non-beneficiaries and non-eligible. While no significant difference was noted between the beneficiaries and eligible non-beneficiaries for acute illness in the past 15 days, this was significantly higher among them compared to the non-eligibles. The mean duration of self-reported illness in the last 15 days was significantly higher among the beneficiaries compared to both eligible non-beneficiaries and non-eligible. Table 24. Prevalence of self-reported major illness in last 3 months
and acute illness in 15 days and mean duration of illness among beneficiaries, eligible non-beneficiaries and non-eligible
Beneficiaries
Eligible non-beneficiaries
Non-eligible
P values
P values
Prevalence and duration of illness
1 2 3 1 vs 2 1 vs 3 Prevalence of major illness in last 3 months (%) and (95% CI)
45.9 (42.4-49.3)
41.1 (36.7-43.5)
35.1 (33.2-37.0)
P<0.05 P<0.001
Prevalence of acute illness in last 15 days (%) and (95% CI)
65.8 (62.5-69.1)
63.5 (61.1-65.8)
52.2 (50.2-54.3)
ns P<0.001
Duration of illness in last 15 days (mean and SD)
8.1±4.6 7.6±4.6 7.5±4.7 P<0.05 P<0.05
n 811 1,660 2,353 Health-related quality of life (HRQoL) of elderly persons (≥60 years old) Table 25 shows that the beneficiaries attained significantly higher scores in the social and economic dimensions. On the other hand, eligible non-beneficiaries attained significantly higher scores in the physical and psychological dimensions. In the spiritual and environment dimensions

29
as well as overall scores no significant difference was observed between the two groups. To note, non-eligible participants attained significantly higher scores in all the dimensions and overall scores compared to both the beneficiaries and eligible non-beneficiaries. Table 25. Comparison of HRQoL scores between beneficiaries,
eligible non-beneficiaries and non-eligible group by each dimension and overall HRQoL
Beneficiaries (Mean scores
and SD)
Eligible non-beneficiaries (Mean scores
and SD)
Non-eligible (Mean scores
and SD)
P values P values HRQoL dimension
1 2 3 1 vs 2 1 vs 3 Physical 9.6±3.3 10.5±3.3 11.5±3.5 P<0.001 P<0.001 Psychological 10.5±2.6 10.9±2.5 12.5±2.8 P<0.01 P<0.001 Social 15.3±2.6 15.0±2.6 16.3±2.4 P<0.05 P<0.001 Spiritual 7.0±1.2 6.9±1.5 7.2±1.2 ns P<0.001 Economic 4.0±1.2 3.8±1.2 5.0±1.6 P<0.01 P<0.001 Environment 9.5±2.0 9.6±2.1 11.0±2.2 ns P<0.001 Overall 55.7±8.5 56.5±8.7 63.6±9.7 ns P<0.001 Table 26 shows that men attained significantly higher scores in the physical, psychological, social, economic, environment dimensions and overall scores. However, participants in the higher age group attained significantly lower scores in the physical, psychological, social, environment and overall scores. The literate persons attained significantly higher scores in all the dimensions and overall scores. Currently married participants attained significantly higher scores in the physical, psychological, social, environment and overall scores. Elderly persons who involved in paid work attained significantly higher scores in five dimensions and overall scores except in the spiritual dimension compared to persons involved in unpaid work. Table 27 shows that being a beneficiary of allowance was significantly associated with higher scores in the economic and social dimensions while significantly lower scores in the physical dimension. It also shows that higher age significantly predicted lower scores in the physical, psychological, social, environment and overall scores. A significant positive association of literacy was noted in all the dimensions and overall HRQoL scores. The total variation across dimensions (R2) accounted for by the explanatory variables ranged from 1.2%-9.7%.

30
Table 26. Comparison of mean HRQoL scores of elderly persons by different socioeconomic and demographic indicators
Indicators Physical Psychological Social Spiritual Economic Environment Overall Sex Men Women
10.8±3.5a
9.7±3.0
11.1±2.3a 10.4±2.4
15.3±2.6b 14.9±2.6
6.9±1.5 6.9±1.4
4.0±1.3a 3.7±1.2
9.8±2.1a 9.3±2.0
57.9±9.3a 54.9±7.9
Age group (year) 60-69 75+
10.8±3.3a
9.4±3.2
11.0±2.3a 10.4±2.5
15.5±2.3a 14.5±2.3
6.9±1.4 5.9±1.5
3.8±1.2 3.8±1.3
9.7±2.1a 9.3±2.1
57.7±8.4a 54.4±8.6
Education Illiterate Literate
10.0±3.2a 11.2±3.4
10.6±2.5a 11.3±2.6
14.9±2.3a 15.8±2.3
6.8±1.5a 7.2±1.3
3.4±1.2b 4.1±1.4
9.4±2.0a 10.1±2.2
55.6±8.4a 59.8±8.8
Marital status Married Single
10.8±3.3a
9.6±3.2
11.1±2.5a 10.3±2.4
15.3±2.5a 14.8±2.3
6.9±1.4 6.9±1.5
3.9±1.2 3.8±1.2
9.8±2.1a 9.3±2.0
57.7±8.8a 54.7±8.2
Occupation Paid work Un paid work
11.7±3.2a
9.5±3.1
11.5±2.3a 10.4±2.4
16.0±2.3a 14.6±2.6
6.9±1.4 6.9±1.5
4.1±1.3a 3.7±1.2
10.0±2.1a
9.3±2.0
60.2±8.3a 54.4±8.2
a=p<0/001; b=<0.01; c=<0/05

31
Table 27. Multiple linear regression analyses examining the association of allowances with different dimensions and overall HRQoL scores
Co-variates Physical
β Psychological
β Social
β Spiritual
β Economic
β Environment
β Overall
β Sex Man=1 Woman=2
-.134a
-.88b
-.049
.086c
-.100b
-.105b
-.116a
Age (years) -.205a -.138a -.223a -.020 -.038 -.109a -.219a Education Illiterate=1 Literate=2
.086b
.067b
.085b
.118a
.056c
.093a
.128a
Marital status Married=1 Single=2
-.018
-.039
-.026
-.035
.045
.004
-.025
Beneficiary of allowance Yes=1 No=0
-.073b
-.047
.089b
-.018
.056c
-.022
-.009
R2 9.1% 4.8% 6.9% 1.3% 1.2% 3.7% 9.7% a=p<0/001; b=<0.01; c=<0/05

32
Discussion A positive association of old age and widow allowance with expenditure on food was observed among the recipient households. For instance, expenditure on protein consumption was significantly higher compared to the eligible non-beneficiaries households. This implies that beneficiary households could spend more money on protein consumption. The increased household expenditure on protein food might have benefitted other fellow members as well. The positive association of allowances with economic and social dimensions of HRQoL of elderly persons is plausible as beneficiaries were able to contribute economically to the household. However, no positive association with the physical dimension was noted among the beneficiaries. It might be due to the fact that the beneficiaries are vulnerable in many aspects such as they were older and involved in paid work less frequently than the eligible non-beneficiaries. This differential profile between two groups may contribute to attain lower scores in this dimension. A positive association of educational status was noted in all the dimensions and overall scores indicates that educational status is an important indicator to have better health-related quality of life in old age. Similar association was observed among the participants who were involved in paid work, being a man of younger age and currently married. A proportion of participants invested allowance money for IGAs that reflects their motivation level to become self-reliant. Similar attitude was found among the women beneficiaries in South Africa regarding the investment of cash transfer (HelpAge 2006). The following methodological limitations should be taken into considerations while interpreting results. This is a cross-sectional study, hence no causal association can be derived. Secondly, the representation of higher proportion of vulnerable and aged participants in the beneficiary group could have biased the results. The strengths of this study include: a large number of participants took part in the study and they were selected from all the six administrative regions of the country. Furthermore, face-to-face interview and use of demographic surveillance system enhanced the reliability of the data. Finally, the instrument used in assessing the HRQoL was specifically designed for the elderly persons but used here for widows as well. Conclusion This study concludes that majority of the beneficiaries expressed satisfaction about allowance scheme. This assistance allowed some beneficiaries to initiate income-generating activities. Furthermore, being a beneficiary of allowance is significantly associated with household’s

33
increased expenditure on protein consumption, improvement in body weight, and improved social and economic dimensions of HRQoL of elderly persons. Targeting by local political representatives appears to be reasonably effective; a crucial factor here appears to be the willingness and ability of eligible poor and vulnerable people to actively lobby for selection and complain about unfairness in the process, that is, to hold their elected representatives to some form of account. Concerns remain about those who are unable, as a result of physical weakness or lack of social or political capital, to take such action on their own behalf. However, the positive association of allowances with different socioeconomic indicators emphasizes the benefit of its continuation.

34
RECOMMENDATIONS Based on the findings of the study following recommendations are made: • Per capita allocation should be revised based on the annual inflation
index;
• Current disbursement procedures may be reviewed further to make it convenient for persons who reside at far-off places from the Bank;
• Instead of offering life-long cash transfer for all the poor, physically able individuals might be provided income generating assets and related supports to enable them to be self-reliant. This may enhance sustainability of the scheme through easing burden;
• Commercial banks and NGOs in the private sector who offer microfinance, may introduce and promote a contributory pension scheme for this group of people through which individuals may have monetary benefits. This might complement the present public allowance scheme.

35
REFERENCES Ahmad E (1991). Social Security and the poor: Choices for developing countries. The World Bank Research Observer; 6:105-127.
Ahmed AU, Rashid S, Sharma M and Zohir S (2004a). ‘Food aid distribution in Bangladesh: leakage and operational performance’, IFPRI Food Consumption and Nutrition Division discussion paper no. 173, Washington DC: International Food Policy Research Institute. p96.
Ahmed SM, Bhuiya A, Rana AKMM, Hadi A, Mahmud S, Salam A, Chowdhury M (2004b). Monitoring the status of health equity in Bangladesh: The BHEW Survey 2002, Bangladesh Health Equity Watch; Dhaka, Bangladesh.
BRAC (2006). The State of Governance in Bangladesh 2006: Knowledge, Perceptions, Reality, Dhaka: Centre for Governance Studies and BRAC-Research and Evaluation Division, Dhaka, Bangladesh.
Cliffe L (2006). ‘Politics and the feasibility of initiatives on hunger and vulnerability’, Regional Hunger and Vulnerability Programme. www.wahenga.net
Farrington J and Slater R (2006). Introduction: Cash Transfers: Panacea for Poverty Reduction or Money Down the Drain? Development Policy Review; 24 (5):499-511.
HelpAge International (2006). Social cash transfer for Africa- a transformative agenda for the 21st century. www.helpage.org. (accessed on 26 February 2008)
HelpAge International (2008). Social pensions in Bangladesh. Available at: www.helpage.org/Researchandpolicy/Pension Watch/Bangladesh. (accessed on 31 January 2008)
Hossain N (2005). ‘Productivity and virtue: elite categories of the poor in Bangladesh’. World Development; 33:965-77.
Hossain N (2006). ‘The politics of what works: the case of the Vulnerable Group Development Programme in Bangladesh’, background paper for the Chronic Poverty 2008 Report.
Jones N, Vargas R, Villar E (2007). Conditional cash transfer in Peru: tackling the Multi-Dimensionality of Childhood Poverty and Vulnerability, New York: New School and UNICEF.
Lloyd-Sherlock P (2006). Simple Transfers, Complex Outcomes: The Impacts of Pensions on Poor Households in Brazil. Development and Change; 37: 969-995.
Matin I And Hulme D (2003). ‘Programmes for the poorest: learning from the IGVGD programme in Bangladesh’. World Development; 31: 647-665.
Pritchett L (2005). ‘A lecture on the political economy of targeted safety nets’, World Bank Social Protection Discussion Paper series no. 0501, Washington DC: World Bank.

36
Senior citizen: legislating old age security (Editorial). Econ Political Weekly. 42(10):801.
World Bank (1994). Averting the old age crisis. Oxford: Oxford University Press.
World Bank (2006). ‘Social Safety Nets in Bangladesh: An assessment’, The World Bank Bangladesh Development Series no. 9.