small-scalemovements of lobsters (homarus americanus): of
TRANSCRIPT
SMALL-SCALE MOVEMENTS OF LOBSTERS(HOMARUS AMERICANUS): AN APPLICATIONOF RADIO-ACOUSTIC POSITIONING ANDTELEMETRY (RAPT) WITH AN ANALYSIS OFSYSTEM RESOLUTION
M. John Tremblay, Yanko Andrade, and Ronald K. O'Dor
Science BranchMaritimes RegionFisheries and Oceans CanadaBedford Institute of OceanographyP.O. Box 1006, Dartmouth, Nova ScotiaB2Y 4A2
2003
Canadian Technical Report ofFisheries and Aquatic Sciences 2439
.+. Fisheries and Oceans Peches et OceansCanada Canada
Canadian Technical Report of
Fisheries and Aquatic Sciences 2439
2003
SMALL-SCALE MOVEMENTS OF LOBSTERS (HOMARUS AMERICANUS): ANAPPLICATION OF RADIO-ACOUSTIC POSITIONING AND TELEMETRY
(RAPT) WITH AN ANALYSIS OF SYSTEM RESOLUTION
by
M. John Tremblayl, Yanko Andrade2and Ronald K. O'Dor2
I Science Branch, Maritimes Region, Fisheries and Oceans Canada,Bedford Institute of Oceanography, P.O. Box 1006,
Dartmouth, Nova Scotia, B2Y 4A2
2Department of Biology, Dalhousie University
Halifax, Nova Scotia B3H 4JI

11
Think Recycling!
.~
\.1Penser arecycler
© Minister ofPublic Works and Government Services Canada 2003Cat. No. Fs 97-6/2439 ISSN 0706-6457
Correct citation for this publication:
Tremblay, M.J., Y. Andrade and R.K. O'Dor. 2003. Small-scale movements of lobsters(Homarus americanus): an application of radio-acoustic positioning and telemetry(RAPT) with an analysis of system resolution Can. Tech. Rep. Fish. Aquat. Sci. 2439:iv+19p.
iii
TABLE OF CONTENTS
ABSTRACT '" iv
RESUME .iv
INTRODUCTION 1
MATERIALS AND METHODS 2
Study area 2
Radio-acoustic positioning (RAPT) system 2
Lobsters, pinger tags, and trapping .4
Light, currents and temperature 5
Post-analysis of RAPT tracking data 5
Position resolution and buoy movement 5
RESULTS 6
Model of position resolution and comparison with fIxed pingers 6
Lobster territories and diurnal movements. 9
Lobster movements and trapping 13
DISCUSSION 15
RAPT system and application to benthic crustaceans 15
Day-night cycle and small-scale lobster movements 15
ACKNOWLEDGEMENTS 17
REFERENCES 17
iv
ABSTRACT
Five female lobsters (Homarus americanus) were tagged with ultrasonic pingers and trackedwith a 3-buoy system over a 2-week period using radio-acoustic positioning and telemetry(RAPT). Simulation analysis of positioning errors showed that the error distribution wasanisotropic and elliptical in shape. The errors increased with distance from the centre of thetriangle formed by the buoys. Inside the triangle the error in the radial direction was less than± 2 m. This error component was ± 4 mat 150 m from the centre of the buoy array, and ± 7m at 200 m from the centre. Buoy movements due to wind and current contributedapproximately 90% of the error. Two of the lobsters were tracked throughout the period withthe mean number of position fIxes;::: 99 per day. The remaining three lobsters either left thearea completely or carne into the range of the system to provide a series of positions on 2-3days. The two lobsters occupied overlapping territories of approximately 100 m diameter overthe 2-weeks. Distances traveled over 24-h periods by the two lobsters averaged 278 and 350m but were greater at night (means of 188 and 267 m between 2000-0700 hr), than during day(means of 90 and 83 m between 0700-2000). Movement of the two lobsters was significantlycorrelated with light levels, but not with current. Lobsters appeared to reside in sheltersduring part of the day. The utility of RAPT for studying lobster behavior is demonstrated bythe analysis of lobster behavior in the presence of baited traps on three nights. T here werefIve occasions when tagged lobsters were 10 m or less from a trap; a capture occurred onlyonce.
RESUME
Nous avons pose un emetteur d'ultasons acinq homards femelles (Homarus americanus) quenous avons ensuite suivis par localisationltelemetrie radio-acoustique pendant deux semainesau moyen d'un dispositif de trois bouees. Selon I'analyse de simulation des erreurs delocalisation, la distribution des erreurs etait anisotrope et de forme elliptique. L' erreuraugmentait avec la distance apartir du centre du triangle forme par les bouees. A I'interieurdu triangle, l'erreur sur l'axe radial etait inferieure a± 2 m. Cette erreur etait de ±4 m et de ±7 rna 150 met a200 m du centre du triangle, respectivement. Environ 90 % de I'erreur etaitattribuable aux mouvements des bouees sous l'action du vent et des courants. Nous avonssuivi deux des homards pendant toute la periode de deux semaines, avec un nombre moyend' au moins ;::: 991ocalisations par jour. Les trois autres homards ont completement quitte lazone ou n'ont ete ala portee du dispositif pour etre localises pendant deux ou trois jours.Durant les deux semaines, les deux homards ont occupe des territoires chevauchants faisantenviron 100 m de diametre. Durant des periodes de 24 heures, les deux homards se sontdeplaces sur des distances moyennes de 278 met de 350 m; les distances parcourues etaientplus grandes la nuit (moyennes de 188 met de 267 m de 20 h a7 h) que Ie jour (moyennes de90 met de 83 m de 7 h a20 h). Les deplacements des deux homards ont presente unecorrelation significative avec I'intensite lurnineuse, mais pas avec les courants. Les homardssemblaient occuper des abris pendant une partie du jour. L'analyse du comportement deshomards en presence de casiers appates pendant trois nuits illustre I' utilite de lalocalisationltelemetrie radio-acoustique pour I' etude du comportement des homards. Unhomard muni d'un emetteur s'est trouve a10 m ou moins d'un easier acinq occasions, mais iln'y a eu qu'une seule capture.
1
INTRODUCTION
The ability to measure small-scale movement (meters to lOs of meters) of benthic animals isimportant to the study of behavior and habitat use. For animals that are fished by baited traps,such as the American lobster Homarus americanus, measuring small-scale movement wouldbe valuable for examining behavioral reactions to the trap, and for estimating the area ofattraction of baited traps (sensu Miller 1990). In situ studies of small-scale movement in theAmerican lobster by diving (e.g. Stewart 1972; Ennis 1984a; Karnofsky et al. 1989) provide awealth of information on behaviors related to shelter, foraging, social interactions and homing.However around the clock tracking of individual lobster movements in nature by diving is notpractical.
Another approach for tracking individuals is via telemetry, either ultrasonic orelectomagnetic. In ultrasonic telemetry, acoustic pressure transmitters ("pingers" or"ultrasonic tags") that are fixed to the animal create waves at ultrasonic frequencies. Theultrasonic signals are detected by hydrophones and receivers. Most previous reports ofultrasonic tracking of Homarus americanus (Lund and Lockwood 1970; Maynard and Conan1984; Jarvis 1989; Watson et al. 1999) and other decapods (e.g. blue crab and spider crab Hines et al. 1995) have tracked animals from small boats, which limit the spatial and temporalresolution. Lund et al. (1973) were able to quantify movements greater than 30 m; Jarvis(1989) and Watson et al. (1999) were able to measure changes in position of greater than 50m. In these studies the animals were usually located less than 5 times per day. Although it isaccepted that lobsters are primarily nocturnal (Cooper and Uzmann 1980; Ennis 1984b;Lawton 1987; Karnofsky et al. 1989), studies which tracked animals both during the day andnight (Maynard and Conan 1984; Jarvis 1989) were unable to detect an effect of time of dayon movement. This may be due to the low spatial and temporal resolution of the trackingsystems used in those studies.
For higher resolution in both time and space, systems that do not require position fixesfrom boats, and provide automatic updates of pinger positions are needed. Radio-acousticpositioning telemetry (RAPT) is capable of high-resolution tracking of pelagic animals such assquid over areas greater than 300 m by 300 m (Sauer et al. 1997; O'Dor et al. 1998). In thissystem the hydrophones are attached to moored buoys, which transmit the signal to a shorebased receiver. Using the arrival times of the acoustic pulses from the pingers, the basestation calculates the position of the pinger. Optimally the buoys do not move once moored,but wind and currents can cause buoy movement, which can reduce the spatial resolutionassociated with tracking ultrasonic-tagged animals.
One of the challenges with tracking benthic animals that inhabit cobble-boulder habitats(such as lobsters) is the potential for signal attenuation and reflection by the rocky substrate.Electromagnetic systems are less affected by reef habitats, but have limited range and require anetwork of seabed aerials (Jernakoff 1987, Smith et al. 1998). Using such a system it wasclearly demonstrated that Homarus gammarus was more active at night, but the area studiedwas just 15 m by 35 m, and the distances moved by individual lobsters were not reported.
In a pilot study using RAPT to track lobsters (O'Dor and Webber 1991), four large (> 120mm carapace length) ovigerous females were tracked for five days in July 1989, and estimatedtotal distance moved varied from 1.5-15 km. This first generation system located animals only
2
every 20 minutes, and statistical analysis of the position data was not possible. Thedevelopment of routines for post-analysis of acoustic data have led to significantimprovements in the ability to validate pinger positions and to evaluate resolution (O'Dor etal. 1998). In addition, higher observation frequency has increased the chances of positioningthe animal if it leaves a shelter only periodically. With improved resolution and reliability,lobster habitat use and behavior in relation to fishing gear can be studied. Lower resolutionRAPT was recently able to position crabs in relation to baited traps (Skajaa et al. 1998).
In this paper we provide the first evaluation of the spatial resolution of ultrasonic trackingof lobsters. We model positioning error related to the movement of the moored acousticbuoys which in an ideal world would be fixed, but in the marine environment tend to swing onthe moorings due to wind and currents. This paper builds on earlier analyses presented inO'Dor et al. (2000). High resolution RAPT reveals interesting new insights about small-scalemovement and activity rhythms in Homarus americanus. We show a strong linkage betweenactivity and light levels, and provide examples of lobster tracks in the presence of baited traps.
MATERIALS AND METHODS
Study area
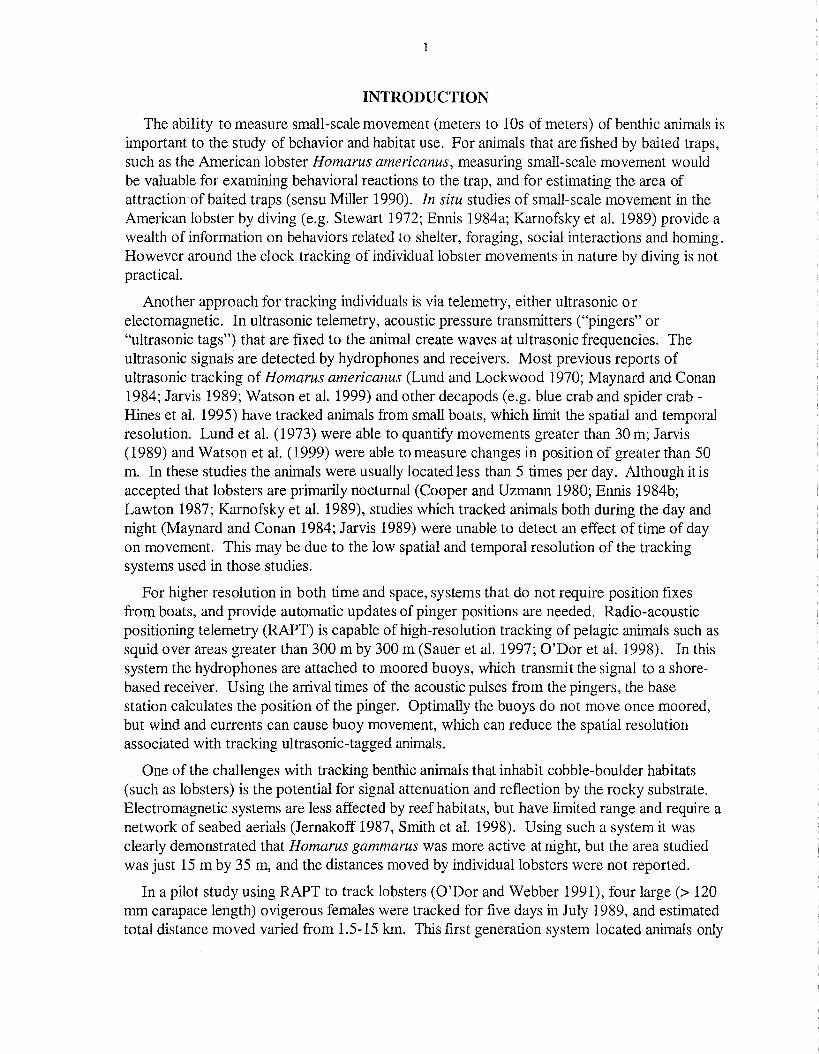
Jeddore Harbour on Nova Scotia's eastern shore (Fig. 1) was chosen as the study site becauseof previous studies of lobster movement and larval distribution in the area (Jarvis 1989;Dibacco and Pringle 1992; O'Dor and Webber, 1991). Jeddore Harbour consists of two innerarms linked to the open ocean via a channel. Tides are semi-diurnal with a mean range ofabout 1 m. Lobster fishing occurs in the harbour from April-June, although the area has lowlandings per km2 of lobster bottom relative to other areas of coastal Nova Scotia (Hudon1994). SCUBA diving in the area revealed a bottom type of primarily mud-silt at depths of 310 m, with rocky reefs close to shore and adjacent to islands. Lobsters densities were notrigorously estimated, but few lobsters were observed while diving on the mud bottom, anddensities oflobsters > 70 mm carapace length, were less than 0.5 per 100 m 2. In the reefhabitat, lobsters were more cryptic and densities were more difficult to estimate.
Radio-acoustic positioning (RAPT) system
A RAPT base station manufactured by VEMCO (Shad Bay, NS) was established in a fish shedon Jeddore Harbour from July 10-24 1997 (Fig. 1). The base station communicated withthree radio-acoustic positioning buoys arrayed in an equilateral triangle with sidesapproximately 250 m. Buoys were moored with a rope-chain-anchor system (ODor et al.1998), to minimize horizontal movements. The length of the sides of the triangle formed bythe buoys was checked acoustically every 1-4 hours. This involved a pinger on each buoytransmitting for a short period while the other two buoys "listened". The dimensions of thebuoy triangle were measured in this way every 1-4 hours during the two week experiment(148 times). The resultant time series of measurements of the three sides of the buoy trianglewere later used to estimate variation in buoy positions caused by water movement for input toa simulation model (see below).
3
""Study Area
a 250 500
meters 82
•83
Mud
•10m Cobble & .81
5,mOboulder
~
~-.
Fig. 1. Map of study area (Jeddore Harbour, N.S) showing location of buoys 1-3 (Bl, B2, B3indicated by triangles), base station. Also shown is bottom habitat in tracking area.Large "M" indicates mud
4
The calculation of pinger positions in RAPT systems is based on differences in the time forsignals to reach the three buoys, together with knowledge of the speed of sound in water andthe bottom depth in the study area. Pingers transmit on different frequencies so that they canbe distinguished. In the RAPT system used in the present study, each pinger produced a pulseapproximately every second. The buoys "listened" for one pinger for approximately 45seconds and then sent the data to the base station in "packets" of signal arrival times (up to 45individual pulses). The buoys then cycled through the remaining pingers. This cycle took 3-7minutes depending upon the total number of active pingers. Maximum data recovery wouldoccur if each buoy received all 45 pulses during each listening period over the two weekexperiment. As in most ultrasonic tracking studies, each buoy received only a subset of thetotal number of possible pulses because of signal attenuation, background noise, and becauseanimals carrying the pingers move out of range.
Lobsters, pinger tags, and trapping
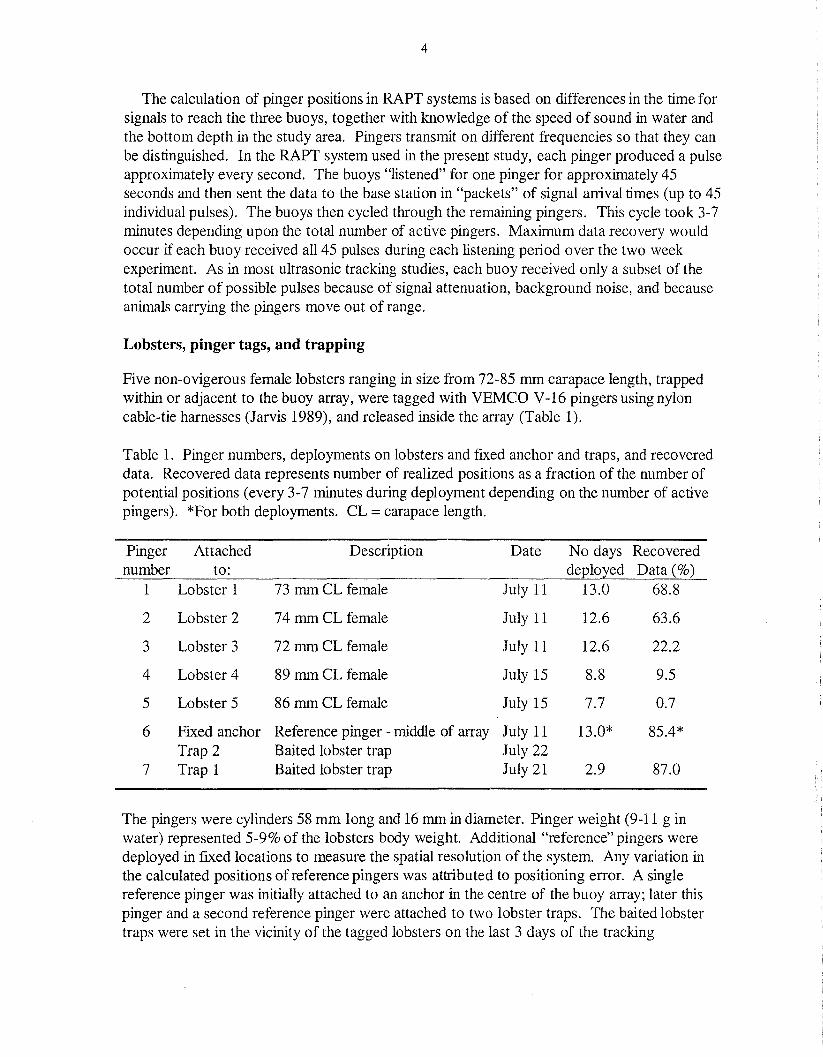
Five non-ovigerous female lobsters ranging in size from 72-85 mm carapace length, trappedwithin or adjacent to the buoy array, were tagged with VEMCO V-16 pingers using nyloncable-tie harnesses (Jarvis 1989), and released inside the array (Table 1).
Table 1. Pinger numbers, deployments on lobsters and fIxed anchor and traps, and recovereddata. Recovered data represents number of realized positions as a fraction of the number ofpotential positions (every 3-7 minutes during deployment depending on the number of activepingers). *For both deployments. CL =carapace length.
Pinger Attached Description Date No days Recoverednumber to: deployed Data (%)
1 Lobster 1 73 mm CL female July 11 13.0 68.8
2 Lobster 2 74 mm CL female July 11 12.6 63.6
3 Lobster 3 72 mm CL female July 11 12.6 22.2
4 Lobster 4 89 mm CL female July 15 8.8 9.5
5 Lobster 5 86 mm CL female July 15 7.7 0.7
6 Fixed anchor Reference pinger - middle of array July 11 13.0* 85.4*Trap 2 Baited lobster trap July 22
7 Trap 1 Baited lobster trap July 21 2.9 87.0
The pingers were cylinders 58 mm long and 16 mm in diameter. Pinger weight (9-11 g inwater) represented 5-9% of the lobsters body weight. Additional "reference" pingers weredeployed in fIxed locations to measure the spatial resolution of the system. Any variation inthe calculated positions of reference pingers was attributed to positioning error. A singlereference pinger was initially attached to an anchor in the centre of the buoy array; later thispinger and a second reference pinger were attached to two lobster traps. The baited lobstertraps were set in the vicinity of the tagged lobsters on the last 3 days of the tracking
5
experiment to study trap-related behaviour. Three overnight sessions of lobster movement inthe presence of baited traps were recorded. At the end of the experiment, 10 traps wereplaced in the area in an attempt to retrieve lobsters with pingers, and to roughly estimate thenumber of lobsters in the tracking area from the catch rate. The traps were 91 cm long by 53cm wide by 36 cm high with two compartments ("kitchen" and "parlour"), constructed ofplastic coated wire mesh with 3.8 cm mesh openings. Entrance ring diameters were 12.7 cmand there were no escape vents to allow release of small lobsters. Each trap was baited with0.5 kg of frozen mackerel, placed in wire mesh bait boxes.
Light, currents and temperature
Bottom light, current speed and temperature were measured with a diver-deployed instrumentdescribed by Miller et al. (1996). Data were recorded every 15 minutes from July 16-24. Theunit was deployed on the bottom at a depth of 4 m on the perimeter of the buoy array.
Post-analysis of RAPT tracking data
VEMeo's RAPT system software (versions 3.04 and later) records processed data to one file,and raw radio-transmitted data to another file. The processed data files contain positionscalculated in real-time from packets of signal arrival times transmitted by each buoy to thebase station. Buoy times are synchronized to base station time and signals are aligned in"triplets" (one pulse from one pinger received by each of the three buoys). The differencesbetween arrival times are combined with buoy co-ordinates from an autopositioning routine tosolve a set of hyperbolic equations to yield a position fix recorded in the processed data file.Thus a single position is derived for a given pinger from three packets of acoustic data (onefrom each buoy approximately every 3-7 minutes). Because the program must calculate, plotand save data arriving from a number of transmitters in real time, there is a limit to howsophisticated the analysis can be. With the raw radio-transmitted data, a more detailedanalysis is possible including position verification and analysis of resolution.
Position resolution and buoy movement
Position calculations of the RAPT system are based on two assumptions: 1) the speed ofsound in seawater is constant, isotropic and known and, 2) buoy positions are exactly known.Time differences are translated into distances and given the second assumption, the problemof calculating positions from time difference measurements reduces to a standard (butcomplex) geometry problem. We know that the second assumption was not met becausealthough the buoys were moored, wind and water movements caused them to swing on theirmoorings. This introduces error into the calculated positions. To model this effect anestimate of the variance of buoy movement was needed. A test of the three time series ofdistances between buoys (see Radio-acoustic positioning RAPT System) against Normalityindicated that they followed a Gaussian distribution, with an almost identical variance ofapproximately 1.44 m2
• This is consistent with similar positional variability among buoys. Tomodel the error on calculated pinger positions caused by buoy movements, the followingsimulation procedures were used. First simulated buoy locations were established in a griddedreference system with squares of 5 m by 5 m. Next a model pinger was set and allowed to
6
transmit 600 times at each corner of the grid squares. The regions where the hyperbolae hadtwo intersections (double solution regions) were not included in the simulation. Beforemeasuring the distances from pinger to buoy, the buoys were displaced randomly from aGaussian distribution with a variance of 1.44 m2
. Next the distances were transformed intoarrival times and processed by the calculating algorithm. The simulation was completed bycalculating the principal components of the distribution of calculated pinger positions for eachcorner of the grid squares. All data were processed under MATLAB® 5.1 and, the intricatesets of equations were solved using Maple® V.
RESULTS
Data recovery for the seven pingers ranged from 1-87% over the 13 days, with the fIxedpingers (Pingers 6 and 7) providing the highest recovery rates (Table 1). Of the 5 taggedlobsters, Lobsters 1 and 2 remained in the range of the RAPT system for the entire period.For these lobsters the mean number of position fIxes per day were 99 and 136. The remainingthree lobsters either left the area completely or came into the range of the system to provide aseries of positions on 2-3 days. Signals for the animals remaining in the area typicallydisappeared for several hours each day, mainly during daylight. Analysis suggests the animalsdid not leave the area during these hours, but instead entered shelters (see below).
Model of position resolution and comparison with fixed pingers
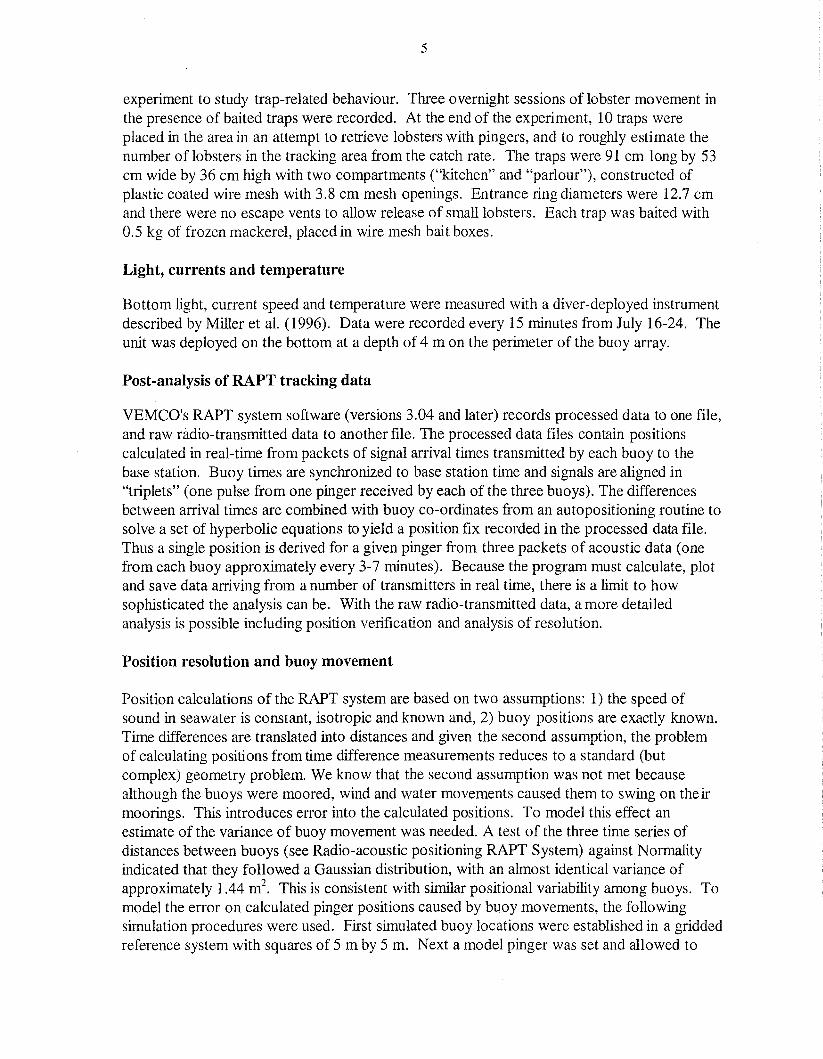
The simulation of positional errors caused by undetected buoy movements indicated that theerror variance was anisotropic, with the magnitude of the error at each point on the griddepending on the direction (Fig. 2). As such the error was best represented by an ellipseinstead of. a circle (as in the case of isotropic error). The aspect ratio of the error ellipse wasof the order of fIve with the long axis oriented in the radial direction. The errors increasedwith distance from the centre of the triangle formed by the buoys. Inside the triangle the errorin the radial direction was less than ± 2 m. This error component was ± 4 mat 150 m from thecentre of the buoy array, and ± 7 mat 200 m from the centre.
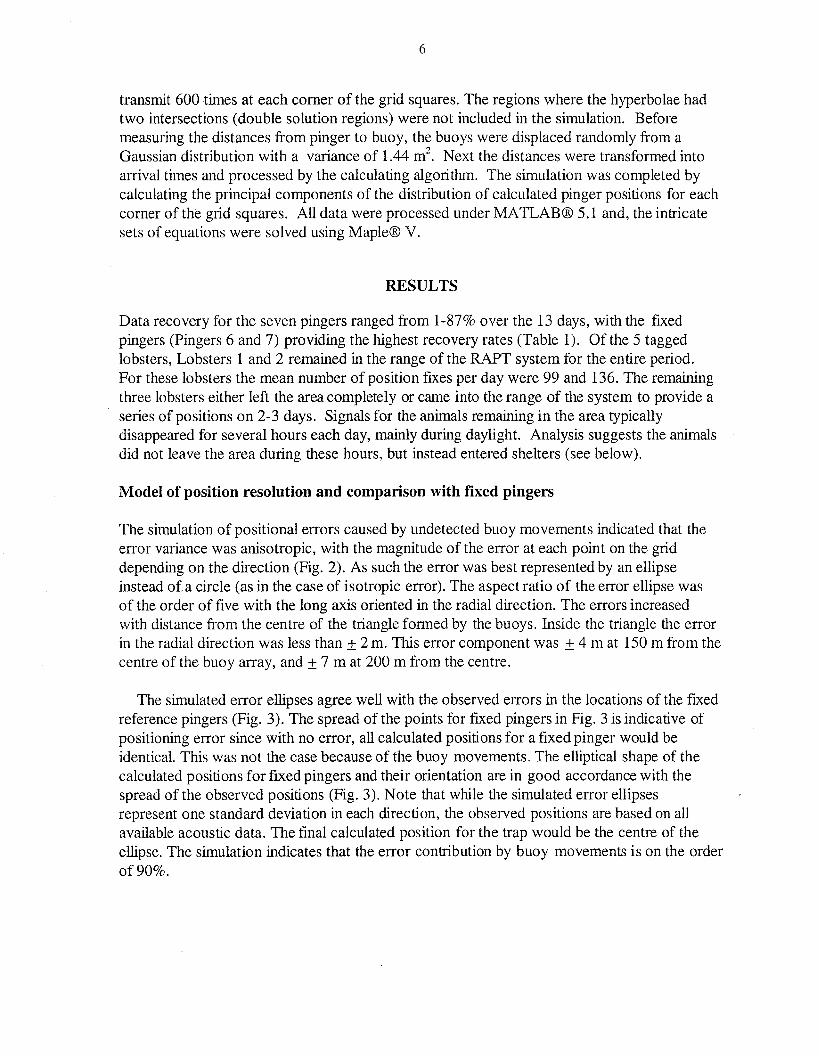
The simulated error ellipses agree well with the observed errors in the locations of the fIxedreference pingers (Fig. 3). The spread of the points for fIxed pingers in Fig. 3 is indicative ofpositioning error since with no error, all calculated positions for a fIxed pinger would beidentical. This was not the case because of the buoy movements. The elliptical shape of thecalculated positions for fIxed pingers and their orientation are in good accordance with thespread of the observed positions (Fig. 3). Note that while the simulated error ellipsesrepresent one standard deviation in each direction, the observed positions are based on allavailable acoustic data. The fInal calculated position for the trap would be the centre of theellipse. The simulation indicates that the error contribution by buoy movements is on the orderof90%.
7
180
120
I60
c: ~ ....-0
:0:- 0 ~ .--'000a.
I
>-
-60
-120
-180
-240 -180 -120 -60 o 60 120 180 240
x-position [m]
Fig. 2. Contour plot of positional errors caused by buoy movements derivedfrom a simulation model described in the text. Each "cross" within the gridmatrix shows the two major axes of the ellipses that describe positionalerrors. One standard deviation is shown for each axis. Also shown are buoypositions, double solution regions (behind each buoy) and estimatedterritories for Lobsters I and 2.
8
90
/
~ ~ ~/~ ~ ~/"
/ /60~ ~ ~ ~ 28m ~ ~/
.--. / / /E.....-
~/ 2.2rYr:::
~0 ~ ~ ~/ ~:t::'Ow
30 / / /00- +
I / Trap 2~(>-
~ ~/~ ~
I"~ / "0111' Trap 1
0 ~/ ~ ~ / 0'"1.8;
~ ° ,I 7I / / /
~I ~ I~ /~ ~ / %
-30
-180 -150 -120 -90 -60
x-position [m]
Fig. 3. Comparison between calculated positions for pingers fixed to traps (deployed infive locations) and principal axis positional errors caused by buoy movements and notaccounted for in calculations. Crosses are for Trap 1, open circles for Trap 2. Contoursfor the length of the semi-major axis are also shown.
9
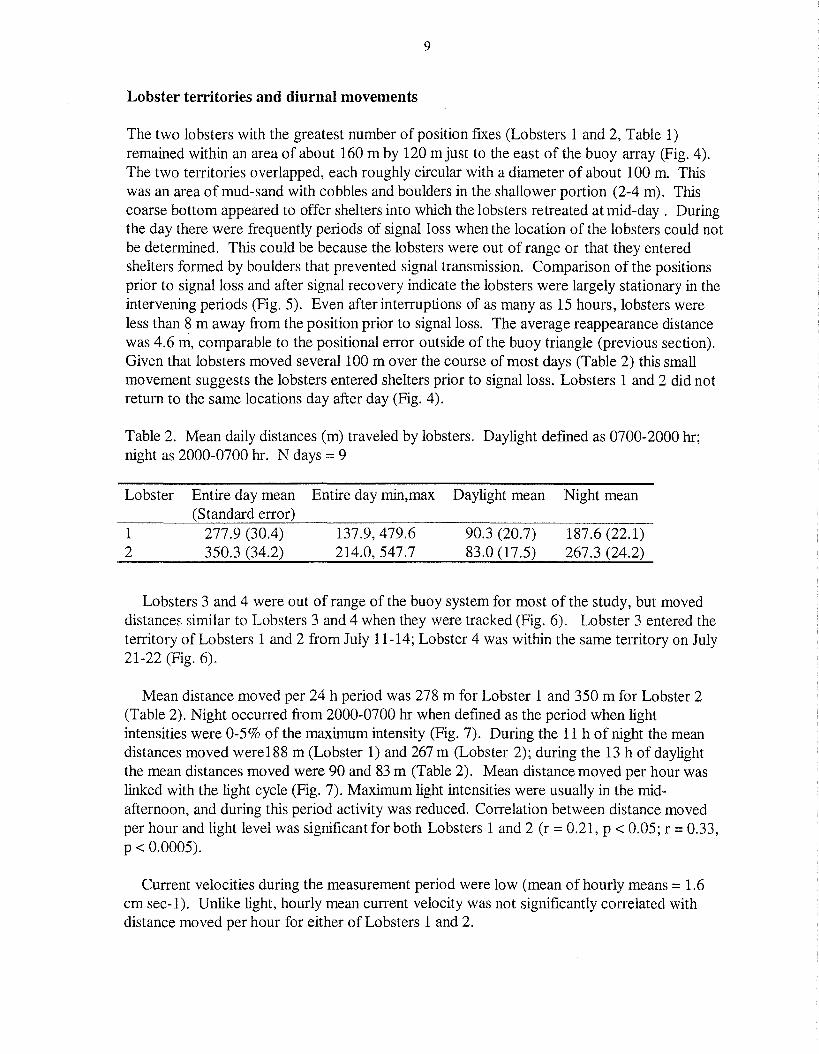
Lobster territories and diurnal movements
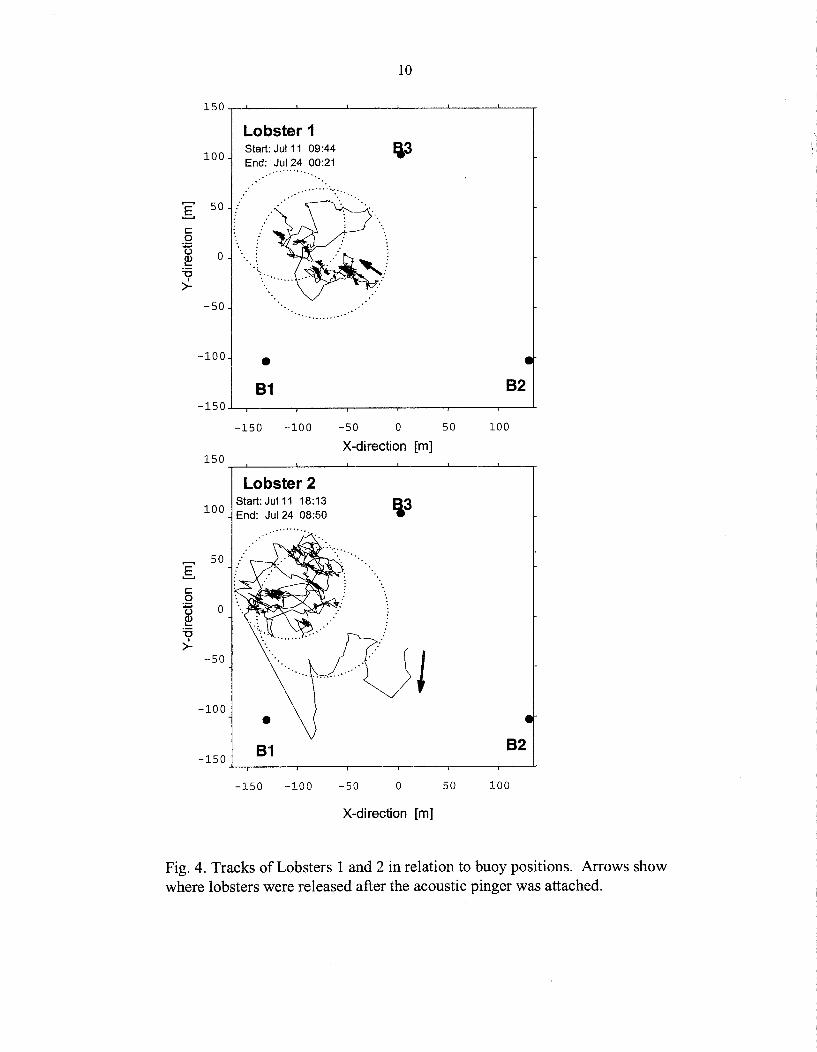
The two lobsters with the greatest number of position fIxes (Lobsters 1 and 2, Table 1)remained within an area of about 160 m by 120 mjust to the east of the buoy array (Fig. 4).The two territories overlapped, each roughly circular with a diameter of about 100 m. Thiswas an area of mud-sand with cobbles and boulders in the shallower portion (2-4 m). Thiscoarse bottom appeared to offer shelters into which the lobsters retreated at mid-day. Duringthe day there were frequently periods of signal loss when the location of the lobsters could notbe determined. This could be because the lobsters were out of range or that they enteredshelters formed by boulders that prevented signal transmission. Comparison of the positionsprior to signal loss and after signal recovery indicate the lobsters were largely stationary in theintervening periods (Fig. 5). Even after interruptions of as many as 15 hours, lobsters wereless than 8 m away from the position prior to signal loss. The average reappearance distancewas 4.6 m, comparable to the positional error outside of the buoy triangle (previous section).Given that lobsters moved several 100 m over the course of most days (Table 2) this smallmovement suggests the lobsters entered shelters prior to signal loss. Lobsters 1 and 2 did notreturn to the same locations day after day (Fig. 4).
Table 2. Mean daily distances (m) traveled by lobsters. Daylight defmed as 0700-2000 hr;night as 2000-0700 hr. N days =9
Lobster
12
Entire day mean(Standard error)
277.9 (30.4)350.3 (34.2)
Entire day min,max
137.9,479.6214.0,547.7
Daylight mean
90.3 (20.7)83.0 (17.5)
Night mean
187.6 (22.1)267.3 (24.2)
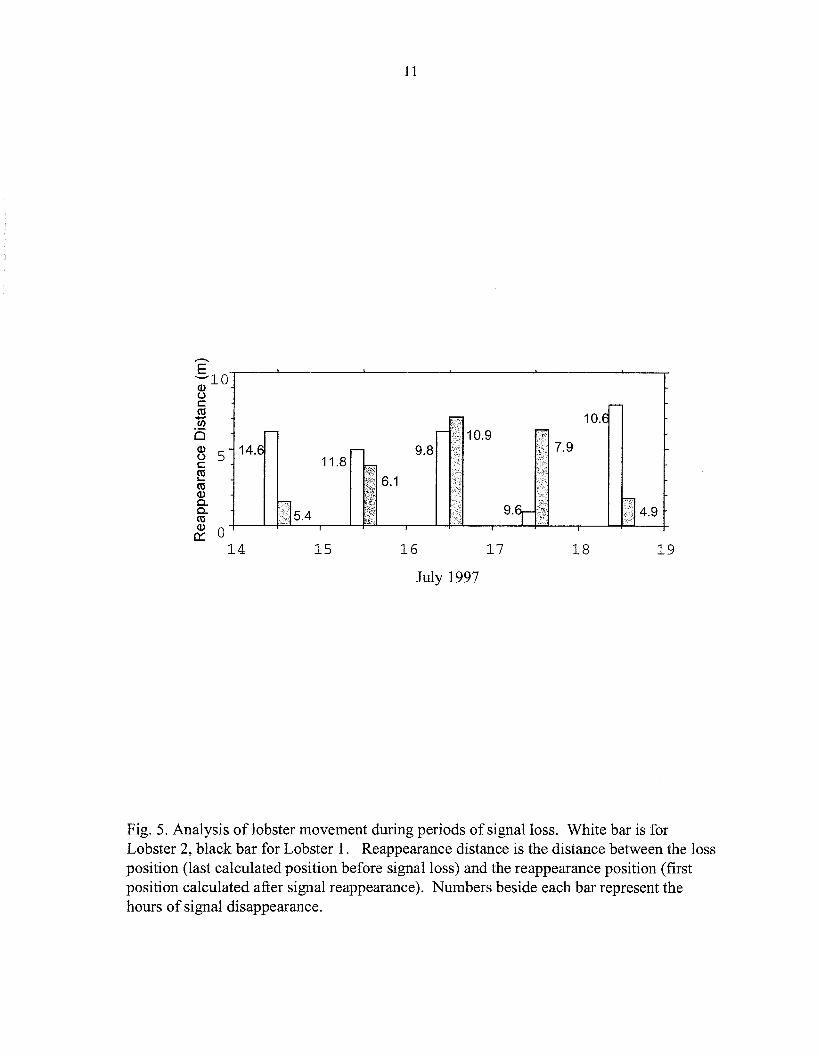
Lobsters 3 and 4 were out of range of the buoy system for most of the study, but moveddistances similar to Lobsters 3 and 4 when they were tracked (Fig. 6). Lobster 3 entered theterritory of Lobsters 1 and 2 from July 11-14; Lobster 4 was within the same territory on July21-22 (Fig. 6).
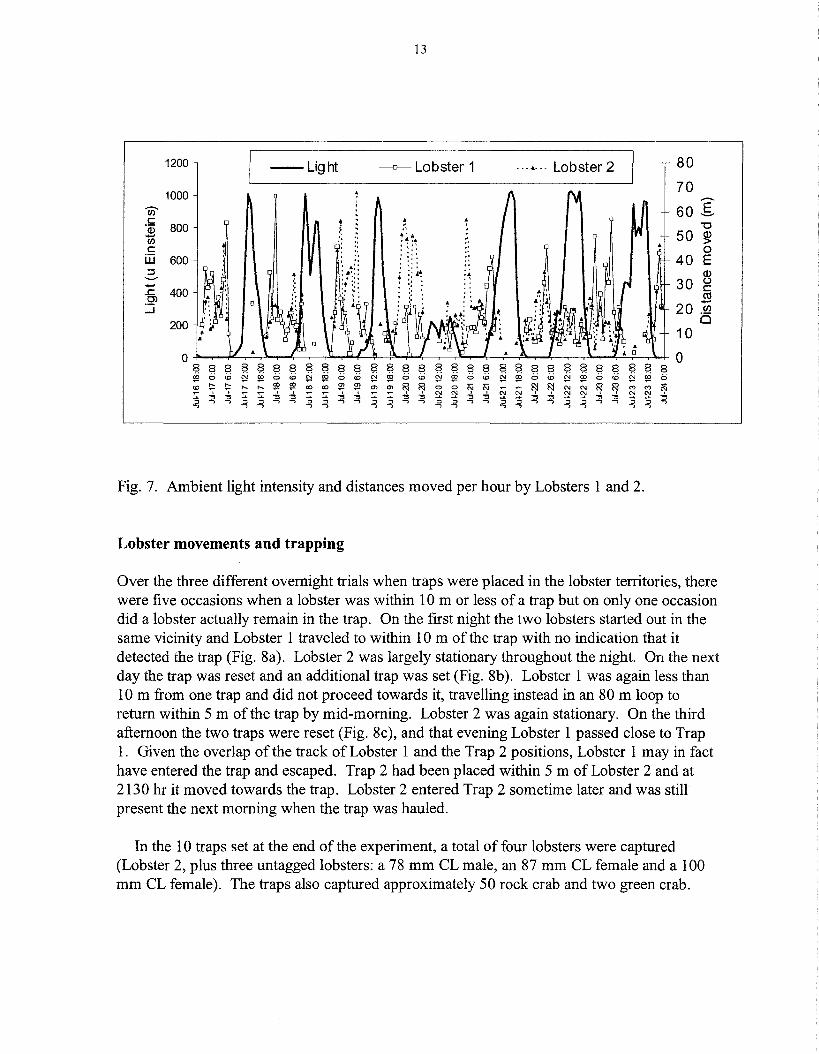
Mean distance moved per 24 h period was 278 m for Lobster 1 and 350 m for Lobster 2(Table 2). Night occurred from 2000-0700 hr when defined as the period when lightintensities were 0-5% of the maximum intensity (Fig. 7). During the 11 h of night the meandistances moved were188 m (Lobster 1) and 267 m (Lobster 2); during the 13 h of daylightthe mean distances moved were 90 and 83 m (Table 2). Mean distance moved per hour waslinked with the light cycle (Fig. 7). Maximum light intensities were usually in the midafternoon, and during this period activity was reduced. Correlation between distance movedper hour and light level was signifIcant for both Lobsters 1 and 2 (r= 0.21, p < 0.05; r = 0.33,P < 0.0005).
Current velocities during the measurement period were low (mean of hourly means = 1.6em sec-I). Unlike light, hourly mean current velocity was not signifIcantly correlated withdistance moved per hour for either of Lobsters 1 and 2.
10
150
Lobster 1
100Start: Jul 11 09:44 Ei3End: Jul 24 00:21
................
I 50 '.
c:0
:;:::u 0e:?
'""'C ..:....I
>--50 ....
-100 •81 82
-150
-150 -100 -50 0 50 100
X-direction [m]150
Lobster 2Start: Jul 11 18:13 113100 End: Jul 24 08:50
.........
I50
c:0
:;::: 0ue:?'5
I
>--50
J-100
81 82-150
-150 -100 -50 0 50 100
X-direction [m]
Fig. 4. Tracks of Lobsters 1 and 2 in relation to buoy positions. Arrows showwhere lobsters were released after the acoustic pinger was attached.
,--
10.E- - 10.9
14.6 - 9.8 7.911.8
6.1 IiI,
~5.4 i\' 9.6r ~4.9
..-..E-10(1)ol::(\j-C/)
is~ 5l::
~(\j(1)0.0.(\j
&014 15
11
16
July 1997
17 18 19
Fig. 5. Analysis of lobster movement during periods of signal loss. White bar is forLobster 2, black bar for Lobster 1. Reappearance distance is the distance between the lossposition (last calculated position before signal loss) and the reappearance position (firstposition calculated after signal reappearance). Numbers beside each bar represent thehours of signal disappearance.
12
100
50
E.......c: ao
:;:;'woc..>.
-50
•B3 Lobster 4
Start: Jul 20 23:58End: Jul 22 00:06
-100 ~1B2•
-150 -100 -50 a 50 100 150
100 • Lobster 3B3
Start: Jul 11 19:08End: Jul 14 04:12
--
50.......E.......c:0
:;:;'w a ...0c..I>.
~
-50-.~
-100I I
-150
• BIi i I i
-100
iii
-50 oiii
50
B2•100 150
x-position [m]
Fig. 6. Tracks of Lobsters 3 and 4 when their pingers were detectable by thebuoy array. Also shown are estimated territories for Lobsters 1 and 2,
13
1200 --Light --0- Lobster 1 .. - ..... _- Lobster 2 80
100070
.--.'U) 60 gc: • . .
"Q5 800 !- ", "0.,
50 ~....lJ) .,c: 0iIi 600 .' 40 E:::l ..
~--- .' 30.... .. c:J:: 400 ro.2'20
.-...J lJ)
200 i510
0 0$ 8 8 $ ~ 8 8 $ 8 8 8 ~ ~ 8 8 ~ $ 8 ~ ~ 8 8 8 ~ $ 8 8 $ $ 8~ 0 eO ~ ~ 0 eO ~ ~ 0 eO ~ ~ 0 eO ~ ~ 0 '" ~ ~ 0 eO ~ ~ 0 eO ~ ~ 0
'" t:: t:: .... .... ~ ~ <0 <0 ~ ~ en en I:<l I:<l 0 0 N N ~ &l N N 1(J 1(J '" '" ~.:, .:, .:, .:, ~ .:, .:, .:, .:, ~ ~ .:, .:, ~ ~ .:, ~ ~ .:, .:, ~ ~ .:,~ ~ ~ ~ ~ ~ ~ ":'
"..., ...,
" "..., ..., :;;J :;;J ..., ...,
" "..., ...,
" "..., ...,
" :;;J ..., ...," :;;J ..., ..., :;;J :;;J ...,..., ..., ..., ..., ..., ...., ..., ..., ..., ...., ...., ...., ..., ..., ....,
Fig. 7. Ambient light intensity and distances moved per hour by Lobsters 1 and 2.
Lobster movements and trapping
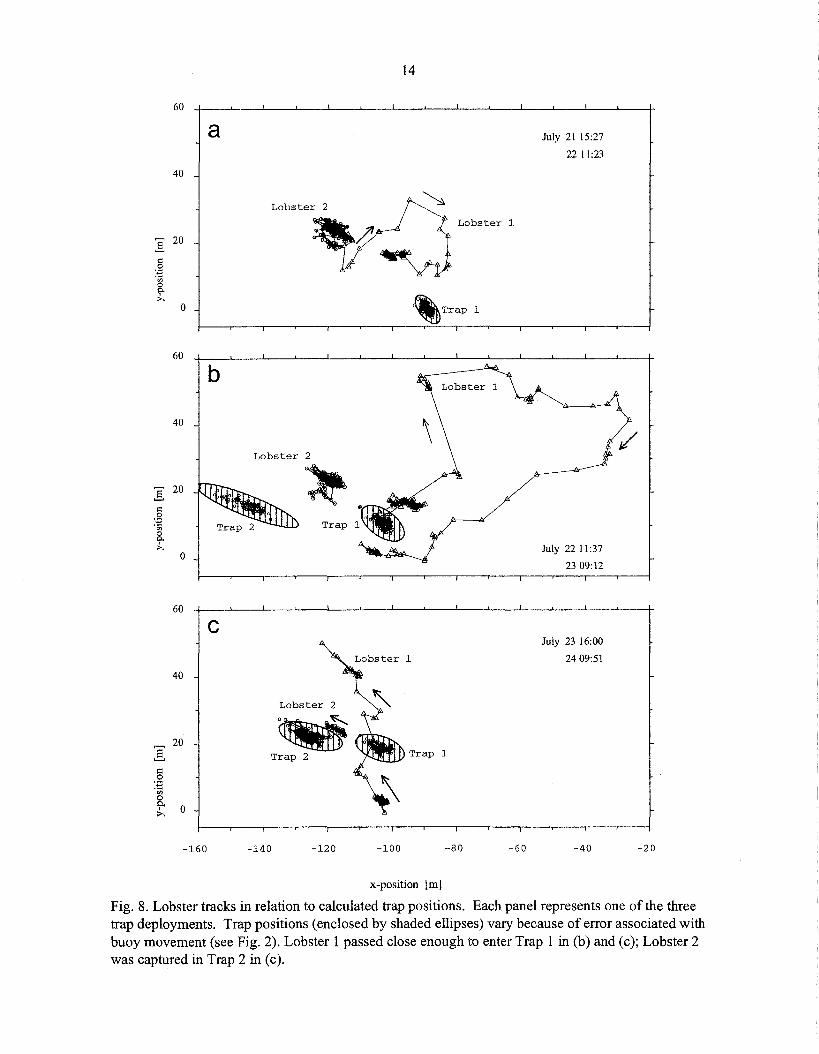
Over the three different overnight trials when traps were placed in the lobster territories, therewere five occasions when a lobster was within 10m or less of a trap but on only one occasiondid a lobster actually remain in the trap. On the first night the two lobsters started out in thesame vicinity and Lobster 1 traveled to within 10m of the trap with no indication that itdetected the trap (Fig. 8a). Lobster 2 was largely stationary throughout the night. On the nextday the trap was reset and an additional trap was set (Fig. 8b). Lobster 1 was again less than10m from one trap and did not proceed towards it, travelling instead in an 80 m loop toreturn within 5 m of the trap by mid-morning. Lobster 2 was again stationary. On the thirdafternoon the two traps were reset (Fig. 8c), and that evening Lobster 1 passed close to Trap1. Given the overlap of the track of Lobster 1 and the Trap 2 positions, Lobster 1 may in facthave entered the trap and escaped. Trap 2 had been placed within 5 m of Lobster 2 and at2130 hr it moved towards the trap. Lobster 2 entered Trap 2 sometime later and was stillpresent the next morning when the trap was hauled.
In the 10 traps set at the end of the experiment, a total of four lobsters were captured(Lobster 2, plus three untagged lobsters: a 78 mm CL male, an 87 mm CL female and a 100mm CL female). The traps also captured approximately 50 rock crab and two green crab.
14
60
40
]: 20
<=:.g.<:::en
?-;>,
o
60
40
.§. 20
<=:o.;::
.~
;>,
o
60
40
20:§:§
:-eVlo0.>. 0
a
b
c
Lobster 2
Lobster 2
Lobster 2..Trap 2
Lobster 1
Trap 1
July 21 15:27
2211:23
July 2211:37
2309:12
July 23 16:00
2409:51
-140-160 -120 -100 -80 -60 -40 -20
x-position [m]
Fig. 8. Lobster tracks in relation to calculated trap positions. Each panel represents one of the threetrap deployments. Trap positions (enclosed by shaded ellipses) vary because of error associated withbuoy movement (see Fig. 2). Lobster 1 passed close enough to enter Trap 1 in (b) and (c); Lobster 2was captured in Trap 2 in (c).
15
DISCUSSION
RAPT system and application to benthic crustaceans
The RAPT system is capable of detecting lobster movements of as small as 1 m in the centerof the buoy array. Fixed pingers are recommended to evaluate the positioning error, whichincreases away from the centre of the buoy array and with any movement of the buoys causedby wind and currents. It is encouraging that even with the error it was possible to track theapproach and entry of a lobster into a trap placed outside of the buoy array, some 130 ill fromthe centre. It would be difficult to obtain observations remotely at this resolution with othermethods.
Any effects of the pinger on lobster behavior were not evaluated here. Others haveexamined potential effects of pingers attached to lobsters (Watson et al. 1999) and to crabs(Hines et al. 1995) and have observed no obvious effects. Observations by Jarvis (1989)support the assumption of insignificant behavioral effects of pingers, at least for largerlobsters. Ovigerous females 98-120 mm CL tagged with pingers were observed to moveseveral km over two months, to extrude eggs successfully, and to molt in the same manner asuntagged females.
The number of lobsters tagged in this study was low, but compared to previous ultrasonictracking studies, resolution was very high. Higher resolution was manifested both temporally(99 or more position fIxes per day) and spatially (± a few metres). Signal loss during the daywas interpreted to be the result of shelter-seeking behavior of lobsters in the coarse bottomhabitat. This interpretation is based on analysis of positions before and after signalinterruption. Although this interpretation is not unequivocal, it is supported by diverobservations at the end of the study of one of the tagged lobsters retreating to the spacesbetween boulders when approached.
Day-night cycle and small-scale lobster movements
Observations of a day-night cycle in lobster activity are not new but this paper provides a cleardemonstration of a strong pattern for individual lobsters over several weeks. The lobsters inthis study were far from inactive during daylight, but bursts of high activity were limited tonight. With the high temporal and spatial resolution of the RAPT system, it would be possibleto test the strength of the day-night activity cycle in different environments and for differentlobster sizes. Currents were shown to be insignificant in the present study, but in some areaswith higher current, lobsters have been observed foraging more during slack tide, regardlessof light level (Lawton and Lavalli 1995). Daytime foraging may also be more important inareas with higher density (trade off between predation risk and food requirements) and amonglarger lobsters that are less likely to be preyed upon. Although Lobsters 1 and 2 stayed withinrelatively small areas over the two weeks, they did not appear to re-use shelters on subsequentdays as has been observed for lobsters of this size elsewhere (Karnofsky et al. 1989). Thismay be because the tagged lobsters were only temporary residents of the area, or perhapsbecause of competition from other lobsters in the area.
16
Estimates of daily distance moved by lobsters depend both on the individual lobster'scurrent "movement mode" and the methods of observation. Three scales or modes of lobstermovement were recognized in a Gulf of Maine estuary by Watson et al. (1999): localmeandering or foraging in one area, medium distance (0.3-1.0 km) rapid excursions, andlonger migrations. They reported that in summer lobsters 80-98 mm CL stayed in one area foran average of 29 days. The within area movement rate was estimated at 130 m dol; thebetween-area movement rate was estimated at 290 m d-l. Other estimates of daily movementsare 463-561 m for lobsters 62-96 mm CL in summer (Lund et al. 1973), 157 and 830m fortwo lobsters (65 and 73 mm CL) in November (Maynard and Conan 1984), and 300-3000 mdol for large ovigerous lobsters in summer (O'Dor and Webber 1991). These estimates werehampered by the accuracy and the number of position fIxes possible in a day. In the currentstudy Lobsters 1 and 2 were in local foraging mode, and the mean movement rates (278 and350 m dol) were intermediate to the above studies. While the present study provides accurateestimates of daily movement rates for two lobsters, they represent only a small portion of thelobster population in the area, and variability in lobster movement rates are likely related to ahost of biological and environmental factors. Ovigerous females for example move to certainlocations for hatching in Jeddore Harbour (Jarvis 1989). Influences of size, sex andreproductive condition can be difficult to detect however (Watson et al. 1999). The potentialfor individual variability represents a challenge to studies of lobster movement behavior.
The relatively small area occupied by Lobster 1 and 2 cannot be considered a territory inthe sense that it was defended, since other lobsters were in the same areas. We know thisfrom the fact that the two other lobsters that were tagged entered the areas for several days,and that other lobsters were trapped in the area at the end of the experiment. A coarseestimate of the densities oflobsters in the area is possible from catchability coefficients (q)estimated for another area in June (Lobster Bay N.S., Tremblay and Smith 2001). For themales and females between 70 and 100 mm CL, estimated q's ranged from 189-726 m 2 pertrap. Based on the observed catch rate (004 lobsters per trap) densities in the Jeddore studyarea are estimated to have been 0.0006-0.0021 m-2 (no m-2 = no trap-l/q), yielding an estimateof 12-40 lobsters in the 160 by 120 m area occupied by the two tagged lobsters. It would beof interest to examine local foraging areas of lobsters in areas of higher density. Lobster BayN.S. for example, has densities that are at least 20 times greater than the estimated range forJeddore (Tremblay and Smith 2001).
Lobsters came within 10 m or less of a trap on fIve occasions with only one capture. A lowcapture rate and one that is difficult to predict for individual lobsters is characteristic oftrapping studies (Karnofsky and Price 1989). While catchability coefficients are available fordifferent areas, seasons and habitats (Miller 1995; Tremblay and Smith 2001), prediction ofwhether an individual lobster will enter a trap will remain difficult. The area from which abaited lobster trap draws is a function of the area covered by the bah odour plume, thesensory ability of lobsters to detect the plume, and the size of the lobster foraging area. Alobster may be out of range of a bait odour plume, but could wander within range during thenightly foraging travels of several hundred metres observed in the present study. There are nomeasures of how far away a lobster can detect and follow a bait odour plume, but the recentstudy of Cancer pagurus trap responses (Skajaa et al. 1998) indicates bait odour detection is
17
possible from distances of up to 48 m. The processes involved in the entry of lobsters andother decapods to baited traps are complex and would benefit from spatial modelsincorporating physical effects on the shape and spread of the bait odour plume (e.g. currentspeed, bottom roughness) and biological factors such as bait odour detection, and the size offoraging areas. The RAPT system provides a powerful tool for field studies related to traprelated behaviors.
ACKNOWLEDGEMENTS
We thankDale Webber for his generous advice and help in the operation of the RAPT system,Robbie Pace for the use of his building as a base station, Ron Duggan for his field expertise,and Cameron Curtis and Catriona Day for assistance in the field and in data analysis. DanJackson and Peter Koeller are thanked for their reviews of the manuscript.
REFERENCES
Cooper RA. and J.R Uzmann. 1980. Ecology of juvenile and adult Homarus. In: Cobb JS,and Phillips BF (eds). The biology and management oflobsters. Academic Press, NewYork, pp 97-142.
Dibacco C. and J.D. Pringle. 1992. Larval lobster (Homarus americanus, H. Milne Edwards,1837) distribution in a protected Scotian Shelf Bay. J. Shellfish Res. 11:81-84.
Ennis, G.P. 1984a. Small-scale seasonal movements of the American lobster Homarusamericanus. Trans. Amer. Fish. Soc. 113:336-338.
Ennis, G.P. 1984b. Territorial behavior of the American lobstser Homarus americanus.Trans. Amer. Fish. Soc. 113:330-335.
Hines A.H., T.G. Wolcott, E. Gonzalez-Gurriaran, J.L. Gonzalez-Escalante and 1. Freire1995. Movement patterns and migrations in crabs: telemetry of juvenile and adultbehavior in Callinectes sapidus and Maja squinado. J. Mar. BioI. Ass. UK 75:27-42.
Hudon, C. 1994. Large-scale analysis of Atlantic Nova Scotia American lobster (Homarusamericanus) landings with respect to habitat, temperature and wind conditions. Can. J.Fish. Aquat. Sci. 51:1308-1321.
Jarvis, C. 1989. Movement patterns oflate-stage ovigerous female lobsters (Homarusamericanus Milne-Edwards) at Jeddore, Nova Scotia. M.Sc. thesis, Dept of Biology,Dalhousie University, Halifax, N.S.
Jernakoff, P. 1987. An electomagnetic tracking system for use in shallow water. J. Exp.Mar. BioI. EcoI. 113:1-8.
Karnofsky, E.B., J. Atema and RH. Elgin. 1989. Field observations of social behavior,shelter use, and foraging in the lobster Homarus americanus. BioI. Bull. 176:239-246.
Karnofsky, E.B. and H.J. Price. 1989. Behavioural response of the lobster Homarusamericanus to traps. Can. J. Fish. Aquat. Sci. 46:1625-1632.
18
Lawton, P. 1987. Diel activity and foraging behavior of juvenile American lobsters,Homarus americanus. Can. J. Fish. Aquat. Sci. 43: 1195-1205.
Lawton P. and KL. Lavalli. 1995. Postlarval, juvenile, adolescent and adult ecology. In:Factor I.R (ed) Biology of the lobster Homarus americanus. Academic Press, NewYork, pp 47-88.
Lund, W.A and RC. Lockwood. 1970. Sonic tag for large decapod crustaceans. J. Fish.Res. Bd. Can. 27:1147-1151.
Lund, W.A, L.L. Stewart and C.l Rathbun. 1973. Investigation on the lobster. FinalReport to Dept. of Commerce NOAA, NMFS, Comm. Fish. Res. Dev. Act, Conn.,Project 3-130-R
Maynard, D.R and O.Y. Conan. 1984. Preliminary monitoring of short term movements forlobsters (Homarus americanus) in the Bideford River, Prince Edward Island, usingultrasonic telemetry. Can. Atlantic Fish. Advis. Comm. (CAFSAC) Res. Doc. 84/99.
Miller, RJ. 1990. Effectiveness of crab and lobster traps. Can. J. Fish. Aquat. Sci. 47: 12281251.
Miller, RJ. 1995. Catchability coefficients for American lobster (Homarus americanus). ICESMar. Sci. Symp. 199: 349-356.
Miller, RJ., J.-O. Dessureault, B.D. Beanlands and OJ. Sharp. 1996. Benthic temperature,light, and water speed (TLS) recorder. J. Exp. Mar. BioI. EcoI.: 205:83-89.
O'Dor, RK and D. Webber. 1991. Ultrasonic telemetry. The Lobster Newsletter 4(1): 1.
O'Dor, RK, Y. Andrade, D.M. Webber, W.H.H. Sauer, MJ. Roberts, M.J. Smale and P.M.Voegeli. 1998. Applications and performance of radio-acoustic positioning and telemetry(RAPT) systems. Hydrobiologia 371/372: 1-8.
O'Dor, RK, Y. Andrade and J. Tremblay. 2000. High resolution post-analysis of lobstertracks from radio-acoustic positioning and telemetry. Pages 248-256 in J. H. Eiler, D. 1Alcorn, and M. R Neuman (editors). Biotelemetry 15: Proceeding of the 15th InternationalSymposium on Biotelemetry. Juneau, Alaska USA International Society on Biotelemetry.Wageningen, The Netherlands.
Sauer, W.H.H, M.l Roberts, M.R Lipinski, MJ. Smale, RT. Hanlon, D.M. Webber and RKO'Dor. 1997. Choreography of the squid's "nuptial dance". BioI. Bull. 192:203-207.
Skajaa, KA, A Ferno, S. Lokkeborg and E.K Haugland. 1998. Basic movement pattern andchemo-oriented search towards baited pots in edible crab (Cancer pagurus L.)Hydrobiologia 371/372: 143-153.
Smith, I.P., K Collins and AC. Jensen 1998. Electomagnetic telemetry oflobster (Homarusgammarus (L.» movements and activity: preliminary results. Hydrobiologia 371/372: 133142.

19
Stewart, L.L. 1972. The seasonal movements, population dynamics and ecology of thelobster Homarus americanus (Milne-Edwards), off Ram Island, Connecticut. Ph.D.Thesis, University of Connecticut.
Tremblay, M.J. and S.J. Smith 2001. Lobster (Homarus americanus) catchability in differenthabitats in late spring and early fall. Mar. Freshwater Res. 52:1321-1332.
Watson, W.H, A. Vetrovs and W.H. Howell. 1999. Lobster movements in an estuary. Mar.BioI. 134: 65-75.