small worlds and regional innovation
TRANSCRIPT

OrganizationScienceVol. 18, No. 6, November–December 2007, pp. 938–954issn 1047-7039 !eissn 1526-5455 !07 !1806 !0938
informs ®
doi 10.1287/orsc.1070.0289©2007 INFORMS
Small Worlds and Regional Innovation
Lee FlemingHarvard Business School, Morgan Hall 485, Boston, Massachusetts 02163, [email protected]
Charles King IIIGreylock McKinnon Associates, One Memorial Drive, Suite 1410, Cambridge, Massachusetts 02142, and
Pleiades Consulting Group, Inc., P.O. Box 711, Lincoln, Massachusetts 01773, [email protected]
Adam I. JudaGoogle, Inc., 76 Ninth Avenue, 4th Floor, New York, New York 10011, [email protected]
Small-world networks have attracted much theoretical attention and are widely thought to enhance creativity. Yet empir-ical studies of their evolution and evidence of their benefits remain scarce. We develop and exploit a novel database on
patent coauthorship to investigate the effects of collaboration networks on innovation. Our analysis reveals the existenceof regional small-world structures and the emergence and disappearance of giant components in patent collaboration net-works. Using statistical models, we test and fail to find evidence that small-world structure (cohesive clusters connectedby occasional nonlocal ties) enhances innovative productivity within geographic regions. We do find that both shorter pathlengths and larger connected components correlate with increased innovation. We discuss the implications of our findingsfor future social network research and theory as well as regional innovation policies.
Key words : small-world networks; innovation; regional advantage
Why are some regions more innovative than others?This question merits study because innovation drivesproductivity and, ultimately, economic growth (Solow1957). Many answers have been put forward. Financeresearchers focus on the importance of venture capi-tal to innovative risk-taking (Gompers and Lerner 1996,Davila et al. 2003). Labor researchers cite the impor-tance of skilled labor to innovation (Florida 2004) andthe creation of a regional infrastructure to support newfirm formation (Feldman 2001). Legal scholars and soci-ologists (Gilson 1999, Hyde 2003, Stuart and Sorenson2003) propose that lax enforcement of laws designed torestrict the flow of people and ideas (including nondis-closure and noncompetition agreements) contributes tojob mobility and higher levels of innovation. Manydescriptions of innovative regions cite social networks asthe crux of innovation (Marshall 1919, Piore and Sabel1984, Almeida and Kogut 1999, Singh 2005). SiliconValley’s success, for example, has been attributed toits informal networks of friendship and collaboration(Saxenian 1994).Despite the acknowledged importance of social net-
works to innovation, little research has systematicallyinvestigated the relationship between network propertiesand innovation within geographic regions.The development and application of formal models
of macro structure facilitates our understanding of howsocial networks influence regional productivity. Recenttheoretical research on macro networks has focused on
the properties of “small-world” networks (Watts andStrogatz 1998, Watts 1999). Small-world networks aredefined as clusters of locally dense interaction con-nected via a few bridging ties. Empirical research hasbegun to investigate how small-world structure influ-ences economic and sociological outcomes. The pre-dominant hypothesis is that small-world networks shouldenhance innovative creativity (Watts 1999; Hargadon2003; Cowan and Jonard 2003, 2004; Baum et al. 2003;Verspagen and Duysters 2003; Schilling and Phelps2007; Uzzi and Spiro 2006). More innovation is arguedto occur because small-world networks enable dense andclustered relationships to coexist with distant and morediverse relationships. The dense and clustered relation-ships enable trust and close collaboration, while dis-tant ties bring fresh and nonredundant information tothe cluster. These attractive hypotheses remain relativelyuntested (for exceptions, see Uzzi and Spiro 2006 onBroadway musicals and Schilling and Phelps 2007 onstrategic alliances and patenting).In this paper, we first review the nearly universal pre-
dictions that small worlds should enhance innovativeproductivity, explain our differences with those predic-tions, and develop our hypotheses. Next, we developand exploit a novel database on patent coauthorshipto investigate the effects of small world and collab-oration networks on innovation. Because our data onpatent coauthorship ties have not been widely used orcharacterized in the prior literature, we report our field
938
INFO
RMS
holds
copy
righ
tto
this
article
and
distrib
uted
this
copy
asa
courtesy
tothe
author(s).
Add
ition
alinform
ation,
includ
ingrig
htsan
dpe
rmission
policies,
isav
ailableat
http://journa
ls.in
form
s.org/.
Fleming, King, and Juda: Small Worlds and Regional InnovationOrganization Science 18(6), pp. 938–954, © 2007 INFORMS 939
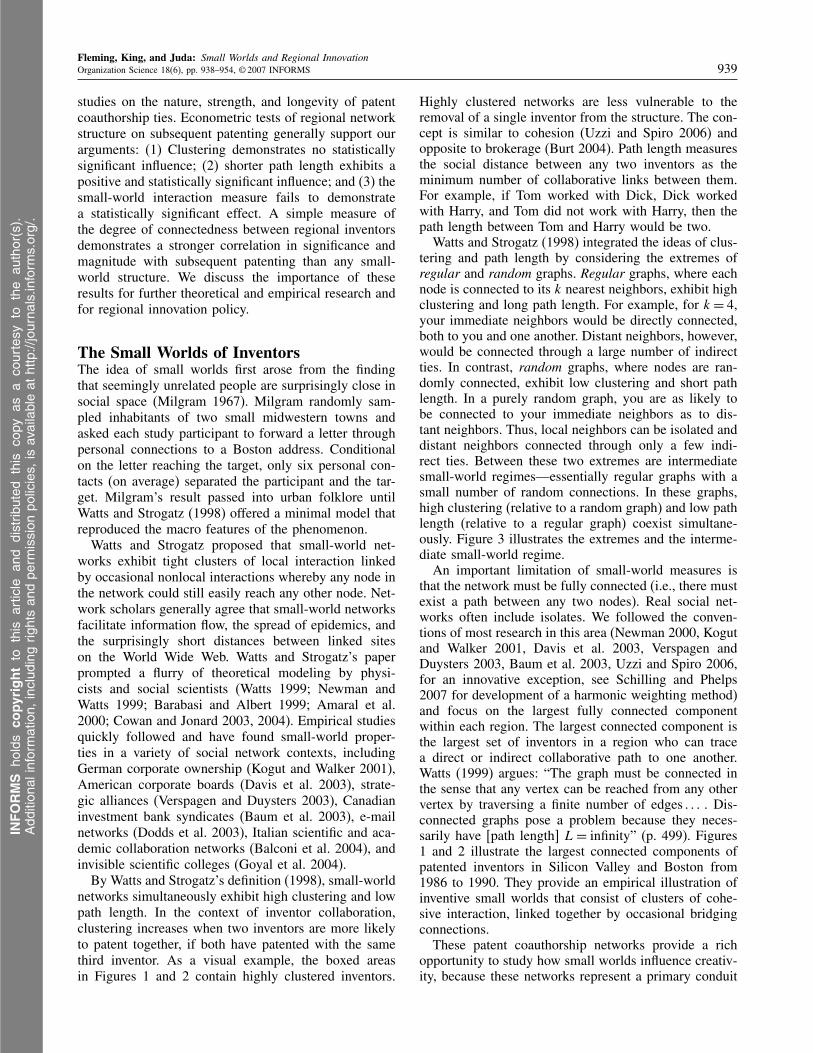
studies on the nature, strength, and longevity of patentcoauthorship ties. Econometric tests of regional networkstructure on subsequent patenting generally support ourarguments: (1) Clustering demonstrates no statisticallysignificant influence; (2) shorter path length exhibits apositive and statistically significant influence; and (3) thesmall-world interaction measure fails to demonstratea statistically significant effect. A simple measure ofthe degree of connectedness between regional inventorsdemonstrates a stronger correlation in significance andmagnitude with subsequent patenting than any small-world structure. We discuss the importance of theseresults for further theoretical and empirical research andfor regional innovation policy.
The Small Worlds of InventorsThe idea of small worlds first arose from the findingthat seemingly unrelated people are surprisingly close insocial space (Milgram 1967). Milgram randomly sam-pled inhabitants of two small midwestern towns andasked each study participant to forward a letter throughpersonal connections to a Boston address. Conditionalon the letter reaching the target, only six personal con-tacts (on average) separated the participant and the tar-get. Milgram’s result passed into urban folklore untilWatts and Strogatz (1998) offered a minimal model thatreproduced the macro features of the phenomenon.Watts and Strogatz proposed that small-world net-
works exhibit tight clusters of local interaction linkedby occasional nonlocal interactions whereby any node inthe network could still easily reach any other node. Net-work scholars generally agree that small-world networksfacilitate information flow, the spread of epidemics, andthe surprisingly short distances between linked siteson the World Wide Web. Watts and Strogatz’s paperprompted a flurry of theoretical modeling by physi-cists and social scientists (Watts 1999; Newman andWatts 1999; Barabasi and Albert 1999; Amaral et al.2000; Cowan and Jonard 2003, 2004). Empirical studiesquickly followed and have found small-world proper-ties in a variety of social network contexts, includingGerman corporate ownership (Kogut and Walker 2001),American corporate boards (Davis et al. 2003), strate-gic alliances (Verspagen and Duysters 2003), Canadianinvestment bank syndicates (Baum et al. 2003), e-mailnetworks (Dodds et al. 2003), Italian scientific and aca-demic collaboration networks (Balconi et al. 2004), andinvisible scientific colleges (Goyal et al. 2004).By Watts and Strogatz’s definition (1998), small-world
networks simultaneously exhibit high clustering and lowpath length. In the context of inventor collaboration,clustering increases when two inventors are more likelyto patent together, if both have patented with the samethird inventor. As a visual example, the boxed areasin Figures 1 and 2 contain highly clustered inventors.
Highly clustered networks are less vulnerable to theremoval of a single inventor from the structure. The con-cept is similar to cohesion (Uzzi and Spiro 2006) andopposite to brokerage (Burt 2004). Path length measuresthe social distance between any two inventors as theminimum number of collaborative links between them.For example, if Tom worked with Dick, Dick workedwith Harry, and Tom did not work with Harry, then thepath length between Tom and Harry would be two.Watts and Strogatz (1998) integrated the ideas of clus-
tering and path length by considering the extremes ofregular and random graphs. Regular graphs, where eachnode is connected to its k nearest neighbors, exhibit highclustering and long path length. For example, for k= 4,your immediate neighbors would be directly connected,both to you and one another. Distant neighbors, however,would be connected through a large number of indirectties. In contrast, random graphs, where nodes are ran-domly connected, exhibit low clustering and short pathlength. In a purely random graph, you are as likely tobe connected to your immediate neighbors as to dis-tant neighbors. Thus, local neighbors can be isolated anddistant neighbors connected through only a few indi-rect ties. Between these two extremes are intermediatesmall-world regimes—essentially regular graphs with asmall number of random connections. In these graphs,high clustering (relative to a random graph) and low pathlength (relative to a regular graph) coexist simultane-ously. Figure 3 illustrates the extremes and the interme-diate small-world regime.An important limitation of small-world measures is
that the network must be fully connected (i.e., there mustexist a path between any two nodes). Real social net-works often include isolates. We followed the conven-tions of most research in this area (Newman 2000, Kogutand Walker 2001, Davis et al. 2003, Verspagen andDuysters 2003, Baum et al. 2003, Uzzi and Spiro 2006,for an innovative exception, see Schilling and Phelps2007 for development of a harmonic weighting method)and focus on the largest fully connected componentwithin each region. The largest connected component isthe largest set of inventors in a region who can tracea direct or indirect collaborative path to one another.Watts (1999) argues: “The graph must be connected inthe sense that any vertex can be reached from any othervertex by traversing a finite number of edges ! ! ! ! Dis-connected graphs pose a problem because they neces-sarily have [path length] L= infinity” (p. 499). Figures1 and 2 illustrate the largest connected components ofpatented inventors in Silicon Valley and Boston from1986 to 1990. They provide an empirical illustration ofinventive small worlds that consist of clusters of cohe-sive interaction, linked together by occasional bridgingconnections.These patent coauthorship networks provide a rich
opportunity to study how small worlds influence creativ-ity, because these networks represent a primary conduit
INFO
RMS
holds
copy
righ
tto
this
article
and
distrib
uted
this
copy
asa
courtesy
tothe
author(s).
Add
ition
alinform
ation,
includ
ingrig
htsan
dpe
rmission
policies,
isav
ailableat
http://journa
ls.in
form
s.org/.

Fleming, King, and Juda: Small Worlds and Regional Innovation940 Organization Science 18(6), pp. 938–954, © 2007 INFORMS
Figure 1 Inventors of Silicon Valley’s Largest Component in 1986–1990 by Assignee and Importance of Inventions
Byer
Risk
Kozlovsky
Kino
ScottGuion
Ribi
Khanna
IBM corporation
Syntex (U.S.A.) Inc.
Stanford University
Xerox corporation
Biocircuits corporation
Notes. Node sizes reflect the number of future prior art cites to an inventor, normalized by the number of collaborators (future prior art citescorrelate with value, see Albert et al. 1991). Tie width indicates number of collaborations, tie color indicates age of tie (red is five yearsprior, blue is two to four years prior, and green is prior year), and colors indicate assignee. Boxed area provides example of highly clusteredinventors. Note that the figures do not illustrate the thousands of other (by definition) smaller components in each region; inventors neednot connect to any extant component – or even another node. They can connect to small components, such as dyads or triads, or worktheir entire careers in complete isolation. Graphed in Pajek with Kamada-Kawai/Free algorithm (Batagelj and Mrvar 1998). Adapted fromFleming and Marx (2006).
of information for inventors. Although inventors do usenonsocial sources of novel information, detailed studiesindicate that they rely heavily on social sources (Allen1977). Social sources are particularly important for thetransfer of tacit information.1 Inventors are less likelyto read documentation, textbooks, or scientific litera-ture and more likely to approach a friend or colleaguewho has appropriate experience or does read the sci-entific and technical literature. Because asking for helpby definition requires an admission of need, engineersare careful about whom they approach (Borgatti andCross 2003). They tend to ask colleagues who recip-rocate their requests or those who have little effect ontheir career evaluation—for example, outside suppliersand friends at other firms (Allen 1977). An engineer atthe design firm IDEO remarked, “Where I worked for(sic) before, you just didn’t ask for help. It was a signof weakness” (Sutton and Hargadon 1996). Our field-work corroborates these observations and reveals that
prior coauthors are prime candidates for information.This evidence implies that an inventor’s past collabora-tion network will strongly influence subsequent produc-tivity and, therefore, provide a powerful context in whichto investigate how small worlds influence creativity andinnovation.
Small Worlds and InnovationOrganizational researchers have adopted the formalmodels of small-world structure and argued that smallworlds improve creativity and innovation. These argu-ments can be organized into the influences of cluster-ing, path length, and their interaction. Uzzi and Spiro(2006) focus on clustering and argue that it improvescreativity in musical productions “because clusteringpromotes collaboration, resource pooling, and risk shar-ing.” These beneficial effects result from the increasedtrust that occurs within closed and embedded social con-texts (Granovetter 1985, Uzzi and Spiro 2006, Obstfeld
INFO
RMS
holds
copy
righ
tto
this
article
and
distrib
uted
this
copy
asa
courtesy
tothe
author(s).
Add
ition
alinform
ation,
includ
ingrig
htsan
dpe
rmission
policies,
isav
ailableat
http://journa
ls.in
form
s.org/.

Fleming, King, and Juda: Small Worlds and Regional InnovationOrganization Science 18(6), pp. 938–954, © 2007 INFORMS 941
Figure 2 Inventors of Boston’s Largest Component in 1986–1990 by Assignee and Importance of Inventions
Perlman
Koning
Kaufman
Stewart
Digital equipment corporation
Hewlett-Packard company
Notes. Node sizes reflect the number of future prior art cites to an inventor, normalized by the number of collaborators. Tie width indicatesnumber of collaborations, tie color indicates age of tie (red is five years prior, blue is two to four years prior, and green is prior year), andcolors indicate assignee. Boxed area provides example of highly clustered inventors. Graphed in Pajek with Kamada-Kawai/Free algorithm(Batagelj and Mrvar 1998). Adapted from Fleming and Marx (2006).
2005). Schilling and Phelps (2007) make similar argu-ments for clustering and also propose that once informa-tion crosses between clusters (made possible in a smallworld because the clusters are connected), it flows moreeasily within clusters. Uzzi and Spiro (2006) add thatthe effect of clustering is nonmonotonic because extremeclustering promotes recirculation of redundant informa-tion. All the work that we reviewed on small worldsand innovation (Cowan and Joward 2004, Uzzi andSpiro 2006, Schilling and Phelps 2007, Hargadon 2003,Verspagen and Duysters 2003) argued that decreasedpath length should improve innovation because of easierand improved information transfer.
Figure 3 Idealized Examples of Regular, Small-World, andRandom Networks (From Watts and Strogatz 1998)
p = 0 p = 1Increasing randomness
Small-world RandomRegular
Notes. Only the middle configuration represents a small-world net-work that simultaneously exhibits high clustering and short pathlength. It is essentially a regular network with a few randomlyrewired connections. Reprinted by permission from Macmillan Pub-lishers Ltd: Nature, 393, 440–442 (1998).
We agree with the path length argument and expectthat decreased path length will improve innovative pro-ductivity. Inventors will almost always profit from expo-sure to new information, although at some extremethey may face cognitive overload and be better offif they limited or filtered their exposure. Short pathlengths expose inventors to new information becausethey connect them with different sources and nonlocalperspectives. Short path lengths in a network indicatethat distant information—where distance can be techno-logical, organizational, or geographical—is surprisinglyclose in social space (Singh 2005). Supporting thesearguments, Cowan and Jonard (2004) develop an agent-based model that demonstrates the benefit of decreasedpath length for the diffusion of innovations. Withoutthis exposure to new information and perspectives fromothers, inventors will become insular and less creative.Faster diffusion of innovations and the juxtaposition ofdiverse knowledge flows should increase the subsequentinnovative productivity of regions whose largest compo-nents exhibit short average path length.
Hypothesis 1 (H1). Decreased path length within aregion’s largest connected component will correlate pos-itively with increased future patenting in the region.
Independent of the path length within components, theformation of connections across components should alsoimprove regional innovative productivity. Similar to thepath length argument, the aggregation2 of inventor com-ponents increases subsequent innovativeness because itenhances information flow and knowledge spillovers.
INFO
RMS
holds
copy
righ
tto
this
article
and
distrib
uted
this
copy
asa
courtesy
tothe
author(s).
Add
ition
alinform
ation,
includ
ingrig
htsan
dpe
rmission
policies,
isav
ailableat
http://journa
ls.in
form
s.org/.

Fleming, King, and Juda: Small Worlds and Regional Innovation942 Organization Science 18(6), pp. 938–954, © 2007 INFORMS
Regions whose inventors stay isolated will lack a largeconnected component. Isolates and small clusters willbe left without access to new ideas and results. Becausenew results will remain unknown outside local contextswhere the breakthrough occurred, opportunities to applythem will remain unexploited. A promising new combi-nation will not occur because knowledge of a previouscombination will not diffuse into a new and potentiallyfertile context. Network aggregation also enables greateropportunities for technological brokerage between pre-viously disconnected technological communities (Stuartand Podolny 1999, Hargadon 2003, Burt 2004). Theconnecting bridges encourage cross-disciplinary fertil-ization, as is illustrated in Figure 1. As with decreasedpath length, and for similar reasons, we expect thatthe connection and aggregation of isolated componentswill correlate positively with subsequent patenting in theregion.
Hypothesis 2 (H2). The size of a region’s largestconnected component will correlate positively withincreased future patenting in the region.
We agree with many of the arguments for the bene-fits of clustering but can cite alternative arguments forits detrimental (Burt 2004) and contingent (Nerkar andParuchuri 2005, McEvily and Reagans 2005, Fleminget al. 2007a) effects as well. The main problem, read-ily acknowledged even by the proponents of clustering(Uzzi and Spiro 2006), is that clustering can lead to insu-larity, lack of exposure to new and diverse perspectives,and ultimately decreased creativity. Clustering still hasbenefits, however, and its optimal degree depends on avariety of technical, psychological, and social dynamics.Clustering probably improves productivity, for example,in groups with scientific training that generate originaland pertinent knowledge as part of their inventive efforts.The group in this case will benefit more from inter-nal communication and focus than external search andexploration. A similar situation would hold for nonsci-entific inventors who were ahead in the invention of anew-to-the-world technology. Because they would knowmore internally than any other group in the world, theirmarginal benefit from external connections would beless. They might be distracted, and/or lose their creativeedge, if competitors gained access to their proprietarylead, or pressured the group into less creative processes.To the extent, however, that a group does not gener-ate all the needed information internally, then clusteringbecomes less efficient.Psychological and social dynamics further modify the
optimal degree of clustering. Following the formation ofa new team, inventors typically become more produc-tive as they build team cohesion, learn from one another,and gain an appreciation of the location and abilitiesof expertise within the team. Clustering at this earlystage probably improves inventive productivity. After
some time, however, a group that stops importing newcomponents, perspectives, or information (Katz 1982)will grow stale and productivity will stall. The effectwill be contingent on the original diversity of trainingand experience within the group. Greater initial diversitywould make clustering more helpful and delay the stallin productivity. In contrast, if management hires similarindividuals, promotes in-group pressures for conformity(Hunt et al. 2003), or does not encourage contrary opin-ions and risk-taking, this will hasten the stall.These examples illustrate how clustering can have a
multitude of contingent effects, depending on the tech-nical challenge, modes of knowledge generation andtransfer, structural history, demographics, and norms ofinteraction. This implies that the benefit of clusteringwill vary greatly and conceivably—or even frequently—turn negative. As illustrated in Figures 1 and 2, a sin-gle firm or region might encompass a great variety ofcontingencies, with the result that the average value ofclustering across the network would miss individual con-tingencies. Each organization in the figures works in adifferent technology (from pharmaceuticals to optics);employs different strategies and goals (from profit mak-ing to teaching and research); and provides differentincentives for collaboration, resource pooling, and risksharing. This locally contingent influence of clusteringmakes it difficult to predict the influence of averagecohesion on the innovative productivity of the entire net-work. We therefore make no predictions about the inde-pendent influence of clustering on regional innovation.Despite the difficulty of predicting the first-order
effect of clustering, it remains a crucial component ofsmall-world structure. The heart of the small-world andcreativity argument lies not in the first-order effects butin the interaction of increased clustering and decreasedpath length. A small-world network should be morecreative, to the extent that its clusters are tighter andthe path lengths between the clusters are shorter. Denseclusters of collaboration within a larger network shouldbecome more creative as the path lengths of the largernetwork decrease. This occurs because inventors canrely on their close collaborators to collect and inter-pret increased amounts and diversity of external infor-mation. Alternately, if path lengths are held constant,the network should become more productive as cluster-ing increases because increased information flow willbe exploited more effectively. As a result, embeddedclusters can maintain their productive focus withoutbecoming distracted or stale. Independent of any main oradditive effects of clustering or path length, an increaseof one in the presence of the other should still create apositive interaction.
Hypothesis 3 (H3). The interaction of decreasedpath length and increased clustering within a region’slargest connected component will correlate positivelywith increased future patenting in the region.
INFO
RMS
holds
copy
righ
tto
this
article
and
distrib
uted
this
copy
asa
courtesy
tothe
author(s).
Add
ition
alinform
ation,
includ
ingrig
htsan
dpe
rmission
policies,
isav
ailableat
http://journa
ls.in
form
s.org/.

Fleming, King, and Juda: Small Worlds and Regional InnovationOrganization Science 18(6), pp. 938–954, © 2007 INFORMS 943
Figure 4 Regional Small-World Structures of U.S. Patented Inventors
0
25
50
75
100
19791980
19811982
19831984
19851986
19871988
19891990
19911992
19931994
19951996
19971998
1999
Small-world structure of largest component
BostonSilicon Valley
Notes. The small-world variable is calculated as clustering divided by path length for inventors within the largest component of eachregion. It is without units, because clustering and path length are both normalized. The x axis indicates the last year in a five-year movingwindow; the box plots illustrate quartile percentiles, upper and lower adjacency values, and outliers, for all 337 U.S. Metropolitan StatisticalAreas.
Data and MethodsEach U.S. patent lists (1) inventors (also referred to asthe authors), (2) assignee (i.e., the owner, typically afirm or university, but also individuals), (3) technologi-cal classes and subclasses, and (4) hometown(s) of theinventors. The patent does not, however, provide con-sistent listings of inventor names or unique identifiersfor the inventors. Using a variety of conditional match-ing algorithms (described in the appendix), we identified2,058,823 unique individual inventors and their patentcoauthors from all U.S. patents granted from 1975 to2002 (a total of 2,862,967 patents). These data enabledus to construct regional collaboration networks for mov-ing five-year windows3 in all 337 U.S. Metropolitan Sta-tistical Areas (MSAs). An MSA is a geographic regionwith a large population, together with adjacent commu-nities, that has a high degree of economic and socialintegration within that nucleus. Silicon Valley, for exam-ple, encompasses San Jose and the surrounding cities inSanta Clara County, California. Boston includes all ofeastern Massachusetts and a small part of southeasternNew Hampshire.We identify small-world regimes following the liter-
ature’s empirical conventions (Kogut and Walker 2001,Davis et al. 2003, Verspagen and Duysters 2003, Baumet al. 2003) and calculate normalized clustering dividedby normalized path length for the largest connected com-ponent in each geographical region.4 We normalize themeasure to account for differing numbers of inventorsin different connected components. Because clusteringdoes not vary greatly according to component size, themain importance of normalization is for path length.
Without normalization, a large network might appear tohave long path lengths relative to a small but poorlyconnected network. For example, a few inventors con-nected in a line might have a similar path length to theinventors in Figures 1 and 2. We also restrict consider-ation to each region’s largest component because smallworlds remain undefined across disconnected compo-nents. Figure 4 shows how the small-world measure hasbeen increasing—thus demonstrating that inventor col-laboration structure has become more small-world formany MSAs, Silicon Valley in particular, since the early1990s. Figure 5 graphs the aggregation measure overtime for all MSAs.
The Emergence of Innovative Small WorldsTo investigate the nature, characteristics, ties, anddynamics of inventive small worlds, we interviewedinventors in Silicon Valley and Boston from the 1986–1990 timeframe as part of a larger qualitative study(Fleming et al. 2007b).5 That study sampled inventorswho linked—and did not link—smaller components intothe emerging giant component of Silicon Valley (andbased on his graphically compelling position in Figure2, the person at the center of the disintegration of DigitalEquipment Corporation (DEC) in 1990).6 Researchersprovided each inventor with an illustration of their col-laborative network in 1990 and asked them if it wasaccurate (or whether it missed important collaborationsthat remained unpatented), the nature of the collaborativetie, whether information flowed across the tie, whetherthey had maintained personal or technical contact withtheir patent coauthors, and the details of their collabora-tive mobility.
INFO
RMS
holds
copy
righ
tto
this
article
and
distrib
uted
this
copy
asa
courtesy
tothe
author(s).
Add
ition
alinform
ation,
includ
ingrig
htsan
dpe
rmission
policies,
isav
ailableat
http://journa
ls.in
form
s.org/.

Fleming, King, and Juda: Small Worlds and Regional Innovation944 Organization Science 18(6), pp. 938–954, © 2007 INFORMS
Figure 5 Regional Largest Component of U.S. Patented Inventors
0
0.25
0.50
0.75
1.00
19791980
19811982
19831984
19851986
19871988
19891990
19911992
19931994
19951996
19971998
1999
Proportion of MSA inventors in largest component
Time periodof Figures 1–2
Notes. The measure is the largest proportion of the number of patented inventors in a region that can trace an indirect collaborative pathto one another. The x axis indicates the last year in a five-year moving window; the box plots illustrate quartile percentiles, upper and loweradjacency values, and outliers, for all 337 U.S. Metropolitan Statistical Areas. Adapted from Fleming and Marx (2006).
The results of our interviews suggest that the aggre-gation of Silicon Valley’s giant component in 1990occurred primarily for three reasons. First, the IBMAlmaden Valley Labs provided a stable structural back-bone for the region (the tan-colored nodes of the upperright in Figure 1 denotes IBM inventors). At the time,IBM still invested heavily in research and hiring. Sec-ond, several Stanford University doctoral graduates tookemployment at IBM (Risk 2003). This is shown bythe ties that connect the multicolored but predominantlypink Stanford University nodes on the upper left part ofFigure 1. Specifically, William Risk connected ProfessorGordon Kino’s microscopy students and most of theGintzon Applied Physics Lab when he began patentingat IBM in 1989 (Kino 2003). William Kozlovsky didthe same a year later when he departed from ProfessorRobert Byer’s optical technology lab (Kozlovsky 2003).The third linkage occurred across the now failed Bio-Circuits, a pioneering startup that attempted to integratebiology and engineering (Ribi 2003). The dark greennodes connected by a web of green ties in the lower rightof Figure 1 illustrate the BioCircuits bridge betweenIBM’s optical and computer technology and the pharma-ceutical technology of Syntex. Glenda Choate providedthe pharmaceutical abutment for the bridge when shemoved to BioCircuits from Microgenics, a drug-testingtechnology firm. The IBM abutment resulted from apostdoctoral program that intentionally seeded localindustry with scientists after a 1- or 2-year appointmentat Almaden Valley Labs. Todd Guion, who worked forBioCircuits after his IBM postdoctoral program, recom-mended bringing in his former advisor, Campbell Scott,to solve a particular optical problem (interviewed by
authors July 9, 2003). IBM reluctantly allowed Camp-bell Scott to act as a scientific advisor—and patent withBioCircuits—while maintaining his IBM employment.For a variety of reasons, Boston failed to aggregate
in the same period despite similar numbers of inven-tors, technologies, firms, and greater university patent-ing. First, Boston lacked a stable structural backbone.In Silicon Valley, IBM Almaden Valley Lab inventorsbecame the basis of the largest component in 1989and have since remained within the largest component.In Boston, dominance of the largest component passedback and forth between Massachusetts Institute of Tech-nology (MIT) and DEC. DEC dominated in 1990 and1992; MIT dominated in the prior and intervening yearsand permanently since 1993. The immediate cause ofthis instability is dramatically illustrated by the expiringred ties in the middle of Figure 2. Robert Stewart is theonly inventor to integrate the three major subcomponentsat DEC. Stewart (2004) said that his brokering role arosefrom his popularity as a design reviewer across differentDEC product lines. The immediate cause of the uppertie disintegrations was that many related patents werefiled just before product shipments (in this case, DEC’sNautilus project in early January 1986). The lowerleft tie had been one of several collaborations betweenStewart and the research and development (R&D) andnetworking groups, and happened to expire at the sametime. Second, graduate students (or at least those withpatents) did not leave MIT to join DEC. MIT gradu-ated many electrical engineers, but DEC maintained anofficial (if imperfect) hiring freeze during this period.Instead, MIT graduates took nonlocal employment, oftenwith other academic institutions (Cohen 2003). Had they
INFO
RMS
holds
copy
righ
tto
this
article
and
distrib
uted
this
copy
asa
courtesy
tothe
author(s).
Add
ition
alinform
ation,
includ
ingrig
htsan
dpe
rmission
policies,
isav
ailableat
http://journa
ls.in
form
s.org/.

Fleming, King, and Juda: Small Worlds and Regional InnovationOrganization Science 18(6), pp. 938–954, © 2007 INFORMS 945
taken local employment, as the Stanford students did,Boston’s largest components would have merged, similarto what occurred in Silicon Valley. Finally, both regionshad little movement of established inventors from IBMor DEC to other large, established firm components inthe region. Even though DEC was having problems dur-ing this period, all four DEC inventors we interviewedtold us they were technically challenged and profession-ally content. They did not feel it necessary to changeemployers (Kaufman 2003, Koning 2003, Perlman 2003,Stewart 2004).Although the disintegration of large components, such
as occurred in Boston, has received little attention, thedramatic emergence of a largest or giant componentsuch as happened in Silicon Valley (and happened inBoston three years later) has been modeled robustly,using a variety of assumptions and mechanisms. Thephenomenon is consistent with critical transitions andpercolation models (Amaral et al. 2000), the spread offads or epidemics (Newman and Watts 1999), and theaggregation of isolated scientific collaborators (Newmanet al. 2002). Such a dominant largest component size isnot without precedent, for example, 50% of the entirenetwork for economics collaboration networks (Goyalet al. 2004), and 90% and 100% for Canadian invest-ment banks (Baum et al. 2003). In the current empiricalcontext, we observe that as inventors work within largercomponents, the network reaches a critical point wherethe isolated components aggregate into a giant compo-nent. The significant and positive correlation betweenthe measures of Figures 1 and 2 (the small-world inter-action and size of the largest component, r = 0!32,p < 0!001) indicates that, at least for inventor collabora-tion networks, one cannot ignore the aggregation processwhen studying the dynamics of small-world networks.
Characterization of Patent Collaboration TiesCoauthorship ties provide attractive illustrations andcompelling stories of formation, but what do they rep-resent, particularly with regard to information flow andthe effect of that flow on subsequent inventive pro-ductivity? Singh (2005) reports significant informationflow between patent coauthors, as measured by cita-tions from future patents linked by direct—and evenindirect—collaborative ties. The results hold even aftereconometrically controlling for the greater likelihood ofa citation simply because the inventors work in similartechnologies. Singh goes on to demonstrate that a largefraction of the geographical citation spillover (Jaffe et al.1993) results from coauthorship networks. (Breschi andLissoni 2004 find similar results for European inventors.)All but three of our 16 interviewees reported some
degree of technical interaction after a patent coauthor-ship (Fleming et al. 2007b). Most important, givenour interest in spillovers and regional innovation, theyreported these interactions even when they no longer
worked at the same firm. Only three inventors deniedany technical communication across firm boundaries inthe years following a collaborative tie. Hans Ribi, CEOof the failed BioCircuits company that bridged IBM andthe pharmaceutical component in the Valley, stated thatpatents exist to protect intellectual property (Ribi 2003).He argued that patents guarantee that information doesnot flow across organizational boundaries after inventorsno longer work for the same firm. A prominent inventorwithin the pharmaceutical abutment, Pyare Khanna, kepthis inventors in organizational silos to avoid such flows(Khanna 2003; he is now CEO of a biotech startup).Khanna’s negative and strong managerial reaction can beinterpreted as evidence that the potential for such flowsis real. A third inventor, Salvador Umatoy from AppliedMaterials (not illustrated in the figures), also stated thatsuch flows did not exist, at least across firm bound-aries (although he has only patented with colleagues atApplied Materials and most of them remain with him atthe firm; Umatoy 2003).These were the most negative responses to our ques-
tion about whether technical information flowed betweenpast collaborators. Other responses varied from tepid tostrong affirmation. University professors and their stu-dents, in particular, maintain close ties at conferences,and continue to visit each other long after their inven-tive collaboration (Gordon Kino and William Risk hadmet the week before the interview). Michael Froix (notillustrated) quit Raychem in the late 1980s and becamea self-employed inventor within the Valley (Froix 2003).According to his account, Froix relied on his friendsand former coauthors for infrastructural as well as infor-mational support (for example, access to lab facilitiesafter hours).7 The first three DEC inventors at the coreof Boston’s 1990 largest component (Charles Kaufman,Paul Koning, and Radia Perlman, illustrated in Figure 2)still maintain close contact and have continued collab-orating on patents and scientific papers across the firmboundaries of their subsequent employers; in fact, theyhad all communicated just before our independent inter-views (Kaufman 2003, Koning 2003, Perlman 2003).Robert Stewart planned to see the collaborator to hislower left the following weekend (Stewart 2004).These descriptions and the network graphs in Fig-
ures 1 and 2 indicating the number of dyadic col-laborations by tie width imply a wide distribution ofthe strength of ties. This issue is important. Researchcorrelates weak ties with nonredundant information(Granovetter 1973) and codified information transfer,strong ties with tacit information transfer (Kogut andZander 1992, Szulanski 1996, Hansen 1999); cohesiveand redundant ties with more accurate information trans-fer (Ahuja 2000, Sorenson and Stuart 2001, Reagans andMcEvily 2003); and intraboundary ties with advantagedtransfer of moderately complex information (Sorensonet al. 2006). Some ties would be extremely weak even
INFO
RMS
holds
copy
righ
tto
this
article
and
distrib
uted
this
copy
asa
courtesy
tothe
author(s).
Add
ition
alinform
ation,
includ
ingrig
htsan
dpe
rmission
policies,
isav
ailableat
http://journa
ls.in
form
s.org/.

Fleming, King, and Juda: Small Worlds and Regional Innovation946 Organization Science 18(6), pp. 938–954, © 2007 INFORMS
during their initial formation, for example, if two inven-tors on a patent had hardly worked together. At the otherend of the distribution, some collaborative ties would beexceptionally strong.Whereas different types of small-world networks vary
in their capability to transfer different types of knowl-edge, prior collaborative patenting ties are potentiallyeffective for all types of information, including het-erogeneous and difficult to transfer information. Withredundant ties, Figures 1 and 2 indicate an impres-sive cohesion within organizations, but also obviousvulnerabilities across the boundaries, particularly if theconnections narrow to a single cut-point.8 We discussedthis issue at length with Campbell Scott, the IBM sci-entist who took part in the BioCircuits bridge (inter-viewed by authors July 9, 2003). He said that he workedwith every member of the startup, even though his nameappears only with a subset of collaborators as patentcoauthors. It is therefore likely that patent data overstatesome ties and miss other redundant information paths.Robert Stewart (2004) also explained that although hewas the integrating center of DEC’s patent network, hehad many nonpatent interactions with other inventors onthe other side of each bridge.In summary, we argue that the amount of technical
information that flows along an observed collaborativetie in later years varies greatly—from none to a greatdeal. Given this distribution, we argue that, on average,the information flow between former patent coauthorsis nonnegative and occasionally substantial. The distri-bution of tie strength varies from exceptionally weak toextremely strong, such that ties support a variety of dif-ferent types of information flows. Because patent collab-oration ties span a wide distribution of tie strengths andcharacteristics, we do not make any assumption aboutthe content of information flow or the capability of atie to transmit information. Rather, we introduce mea-sures of information heterogeneity and alternate diffu-sion paths within our statistical models.
Statistical ModelsTo more systematically explore the relationship betweenstructure and innovative productivity, we modeledregional patenting from 1980 to 2000 with fixed-effectconditional likelihood estimators (Hausman et al. 1984).Count models are appropriate because the dependentvariable, regional patent counts by year, takes on wholenumber values. Using linear models for count data canresult in biased and inconsistent coefficient estimates(Greene 2002). Negative binomial models are preferredbecause our data demonstrate overdispersion (rejectionof Poisson model at p < 0!0001). Though it sacrificesefficiency, a fixed-effects model is preferred because itconsiders within-region variation only, i.e., it controlsfor time-invariant, regionally idiosyncratic characteris-tics. A Hausman test rejects random effects specification
at p < 0!0001. An additional benefit of the Hausmanmodel is that it allows dispersion to vary by region. Weran all analyses in STATA Version 7.
Dependent VariableThe models estimated the influence of small-world andlargest component measures during moving five-yearwindows on the number of successful patent applica-tions in the following year. The count included all utilitypatents granted to the region that had been applied forwithin the subsequent year, up to the end of the data inJuly 2002. Longer lags and different window sizes didnot demonstrate substantively different results.
Explanatory VariablesWatts and Strogatz (1998) calculate clustering by con-sidering the number of “triples” or the pairs of aninventor’s collaborators who work with one another. Wefollow their approach (as has most subsequent empiricalresearch) and calculate individual clustering as the num-ber of actual triples for an inventor, divided by the num-ber of potential triples, and average the inventor scoresacross the largest component (Clustering of LC). Inven-tors with one or zero ties receive a clustering score ofzero. We normalized clustering by dividing the averageclustering by the theoretical clustering of a fully con-nected regular graph (Watts and Strogatz 1998). Simi-larly, we calculated normalized path length (Inverse PathLength of LC) as the average path length divided bythe theoretical path length of a comparable fully con-nected regular graph of size (N ) and mean degree (z).We approximate the theoretical path length for a regulargraph as N/2z when N > 2z, and as 2− "z/"N − 1##when N ≤ 2z. We determine N and z empirically for thelargest component for each period and region.Because the small-world measure requires path length
in the denominator, we inverted the measure. After cen-tering the cluster and inverse path length variables tofacilitate interpretation of their effects (Friedrich 1982),we calculated the small-world measure as clusteringmultiplied by the inverse of path length (Cluster∗InverseLength). To measure the extent of network aggregation,we calculated the proportion of inventors within eachregion who had a collaborative tie within the largestcomponent in the region (Size of LC). Inventors withinregions with small values of this variable remain moreisolated. We tested the robustness of all proportion mea-sures with Herfindahl indices and found similar results.The third author programmed network construction andvariable measurement in C.
Control VariablesThe models include the log of the number of inventorsin the region (Ln inventors) to account for the numberof people actively engaged in invention. We logged allcount variables to account for their entry in exponential
INFO
RMS
holds
copy
righ
tto
this
article
and
distrib
uted
this
copy
asa
courtesy
tothe
author(s).
Add
ition
alinform
ation,
includ
ingrig
htsan
dpe
rmission
policies,
isav
ailableat
http://journa
ls.in
form
s.org/.

Fleming, King, and Juda: Small Worlds and Regional InnovationOrganization Science 18(6), pp. 938–954, © 2007 INFORMS 947
form into the models (and added 0.01 to variables witha zero minimum). Ln extra-regional inventors measuresthe number of inventors outside the region who coauthorwith the region’s inventors. Besides increasing the avail-able resources, such collaborations provide additionallearning and nonlocal insight for a region (Gittleman2003). Given the importance of institutions in the for-mation of regional networks (particularly universities,see Owen-Smith and Powell 2004, McEvily and Zaheer2004), the models include the number of patents in aregion with a university assignee (Ln university patents).Labor mobility is higher during changes in employmentlevels (Angel 1989; measured as Ln employment; datafrom University of Virginia 2004). To control for generalchanges in wealth, the models include personal incomeper capita PCPI (in thousands of dollars), deflated byBureau of Labor Statistics’ Consumer Price Index for2002 (Bureau of Economic Analysis 2004). Minimumvalues of the variable tended to occur early in the timeseries within New Mexico and Arizona. Ideally, themodels would include the amount of research and devel-opment spending in each region, but this remains impos-sible to measure. Even though R&D data are availablefor publicly traded firms, the data are not broken downby region (even within firms’ internal accounting data),nor are private firm data available. Proxies such as tech-nical professional employment would also be desirable,but are not available as a time series over the years ofour study (Acs et al. 2002). Given that location patternsof R&D laboratories tend to be stable over time (Acset al. 2002), the fixed effects models should account formuch of the variation.Because regions vary in their adoption and generation
of new technologies, the models include the age of eachregion’s technology (Technology age: measured by theaverage of the sequential prior art patent numbers citedby patents within a region). Technology Herfindahl con-trols for technological heterogeneity and diversity withineach MSA by indexing the U.S. Patent Office technologyclasses by patent. The Patent Office divides all patentsinto approximately 400 technological classes, for exam-ple, class 437 (Semiconductor Device Manufacturing:Process) and 935 (Genetic Engineering: RecombinantDNA Technology, Hybrid). The models include the aver-age number of assignees for each inventor in a regionover the five-year period (Assignees/inventor). This is adirect measure of employee movement and its poten-tial influence on network formation and creative efficacy.It also controls for the potentially greater fertility of tiesthat span organizations. An alternate control measure ofthe number of cross-organizational ties returned simi-lar results. To account for the overall number of tiesbetween inventors, the models include Tie density. Wecalculated density as the actual number of ties divided bythe potential number of ties (actual ties/number of inven-tors in the region, choose 2). To measure the influence of
alternate sources of collaborative norms and informationdiffusion mechanisms, we first determined the largestemployer within each region’s largest component andthen calculated the proportion of inventors who workedfor that employer (Largest org in LC). We also foundno substantive difference with restricted models of onlyhomogenous largest components (for example, regionswhere the networks are similar to Figure 2, where thelargest component is predominantly DEC).One empirical challenge with coauthorship data is that
coauthors are clustered by definition (that is, all coinven-tors listed on any one patent will automatically be clus-tered with one another). This is common to all affiliationdata—for example, musical collaborations, projects, orattendance at meetings—and creates a bipartite graph.As a result, the empirical measure of clustering can bebiased. Newman (2001) develops a simulation modelthat estimates unipartite clustering from a bipartite graphbased on the distribution of affiliation events (in thiscase, patents) and individuals (in this case, inventors) ofthe original graph. Uzzi and Spiro (2006) use Newman’ssimulations to estimate the clustering coefficient of asimilarly distributed random graph, but we prefer a moredirect approach of including controls for the number ofpatents and inventors within the graph (Ln LC inven-tors and Ln LC patents). Simple inclusion of controlsallows more parsimonious modeling of the data andavoids the distributional and parametric assumptions ofthe Newman model. Although not shown, all modelsincluded categorical variables for each year with theexception of 1980 to control for systematic trends inpatenting. 61 regions did not patent during the years ofobservation, and economic data were unavailable for 835early observations. Models with all patent data demon-strate similar results (that is, including data points with-out economic data). Tables 1 and 2 list summary andcorrelation statistics, respectively.
Table 1 Summary Statistics !n= 6"242#
Variable Mean Std. dev. Min Max
Patents year t+1 231$00 528$49 0$00 9"162$00Ln regional inventors 5$34 1$54 0$70 10$55Ln extra-regional inventors 4$13 2$73 −4$61 9$82Ln employment 11$63 1$14 9$28 15$12PCPI (000s) 19$99 5$04 0$00 50$94Ln university patents −0$04 3$53 −4$61 7$41Technology age 3$88 0$45 2$29 5$13Technology Herfindahl 0$05 0$04 0$01 0$50Ave assignees/inventor 1$16 0$09 1$00 2$00Average tie density 0$01 0$02 0$00 0$42Ln LC inventors 3$27 1$50 0$70 9$93Ln LC patents 2$92 1$88 0$01 10$12Largest org in LC 0$67 0$24 0$04 1$00Clustering in LC 0$02 0$25 −0$98 0$35Inverse path length in LC −0$07 4$82 −1$90 130$73Size of LC 0$11 0$10 0$01 0$75
INFO
RMS
holds
copy
righ
tto
this
article
and
distrib
uted
this
copy
asa
courtesy
tothe
author(s).
Add
ition
alinform
ation,
includ
ingrig
htsan
dpe
rmission
policies,
isav
ailableat
http://journa
ls.in
form
s.org/.

Fleming, King, and Juda: Small Worlds and Regional Innovation948 Organization Science 18(6), pp. 938–954, © 2007 INFORMS
Table 2 Correlation Statistics !n= 6"242#
1 2 3 4 5 6 7 8 9 10 11 12 13 14 15
(1) Patents year t+1(2) Ln regional inventors 0$65(3) Ln extra-regional 0$38 0$45
inventors(4) Ln employment 0$61 0$85 0$46(5) PCPI (000s) 0$40 0$50 0$22 0$40(6) Ln university patents 0$48 0$74 0$40 0$63 0$37(7) Technology age 0$31 0$47 0$09 0$27 0$52 0$48(8) Technology Herfindahl −0$22 −0$54 −0$33 −0$44 −0$22 −0$44 −0$20(9) Ave assignees/inventor 0$23 0$37 0$06 0$24 0$43 0$38 0$67 −0$16
(10) Tie density −0$23 −0$64 −0$34 −0$49 −0$28 −0$44 −0$22 0$58 −0$18(11) Ln LC inventors 0$65 0$84 0$42 0$65 0$51 0$63 0$60 −0$37 0$46 −0$42(12) Ln LC patents 0$59 0$81 0$41 0$62 0$45 0$57 0$52 −0$34 0$43 −0$45 0$93(13) Largest org in LC −0$28 −0$33 −0$18 −0$27 −0$18 −0$29 −0$19 0$18 −0$37 0$21 −0$31 −0$34(14) Clustering in LC −0$10 −0$16 −0$09 −0$14 0$03 −0$05 0$08 0$00 0$04 0$17 −0$13 −0$35 0$11(15) Inverse path 0$64 0$44 0$16 0$32 0$25 0$30 0$26 −0$14 0$21 −0$16 0$62 0$55 −0$18 −0$07
length in LC(16) Size of LC 0$03 −0$20 −0$16 −0$27 −0$05 −0$19 0$15 0$36 0$08 0$45 0$28 0$23 0$06 0$00 0.40
ResultsTable 3 presents the modeling results. The models in-clude explanatory terms individually, then the small-world interaction, followed by a full model. Notsurprisingly, the number of inventors, both within andoutside the region, demonstrated large positive and sta-tistically significant effects. General employment in theregion exhibits no significant influence, and personalincome generally exhibits negative significance. This isprobably because some very poor regions patent a greatdeal (for example, New Mexico, where Pueblo Commu-nities and National Research Labs colocate) and some
Table 3 Conditional Fixed-Effect Negative Binomial Models of Patenting in Year t+1, by Metropolitan Statistical Area 1980–2000+
Model 1 Model 2 Model 3 Model 4 Model 5
Ln regional inventors 0$4708∗∗∗ (0.0193) 0$4623∗∗∗ (0.0193) 0$4633∗∗∗ (0.0193) 0$4717∗∗∗ (0.0191) 0$4661∗∗∗ (0.0192)Ln extra-regional inventors 0$0663∗∗∗ (0.0015) 0$0661∗∗∗ (0.0015) 0$0661∗∗∗ (0.0015) 0$0666∗∗∗ (0.0015) 0$0663∗∗∗ (0.0015)Ln employment 0$0051 (0.0251) 0$0218 (0.0254) 0$0225 (0.0255) 0$0202 (0.0254) 0$0271 (0.0256)PCPI (000s) −0$0089∗∗∗ (0.0015) −0$0089∗∗∗ (0.0015) −0$0093∗∗∗ (0.0016) −0$0090∗∗∗ (0.0015) −0$0093∗∗∗ (0.0016)Ln university patents −0$0029 (0.0023) −0$0024 (0.0023) −0$0024 (0.0023) −0$0025 (0.0023) −0$0022 (0.0023)Technology age 0$2561∗∗∗ (0.0363) 0$2501∗∗∗ (0.0363) 0$2493∗∗∗ (0.0363) 0$2678∗∗∗ (0.0364) 0$2589∗∗∗ (0.0366)Technology Herfindahl 1$3974∗∗∗ (0.2004) 1$3897∗∗∗ (0.2004) 1$3981∗∗∗ (0.2005) 1$3369∗∗∗ (0.2008) 1$3653∗∗∗ (0.2010)Ave assignees/inventor −0$0994 (0.0748) −0$0866 (0.0749) −0$0833 (0.0749) −0$0998 (0.0744) −0$0867 (0.0747)Tie density 1$0436 (0.7074) 0$9565 (0.7076) 1$0173 (0.7077) 0$6905 (0.7126) 0$8329 (0.7134)Ln LC inventors −0$0026 (0.0091) −0$0175∗ (0.0080) −0$0124 (0.0096) −0$0263∗∗ (0.0092) −0$0213∗ (0.0105)Ln LC patents 0$0371∗∗∗ (0.0079) 0$0423∗∗∗ (0.0061) 0$0374∗∗∗ (0.0079) 0$0409∗∗∗ (0.0061) 0$0363∗∗∗ (0.0079)Largest org in LC 0$0337∗ (0.0156) 0$0354∗ (0.0155) 0$0359∗ (0.0157) 0$0348∗ (0.0156) 0$0355∗ (0.0157)Clustering in LC −0$0240 (0.0241) −0$0217 (0.0243) −0$0237 (0.0243)Inverse path length in LC 0$0016∗∗∗ (0.0004) 0$0016∗∗∗ (0.0004) 0$0012∗∗ (0.0004)Clustering ∗ Inverse length 0$0027 (0.0030) 0$0024 (0.0030)Size of LC 0$2191∗∗∗ (0.0594) 0$1384∗ (0.0671)Constant −0$6305∗ (0.2719) −0$7261∗∗ (0.2728) −0$7356∗∗ (0.2729) −0$8030∗∗ (0.2756) −0$8172∗∗ (0.2756)
Max likelihood −24"358$22 −24"350$52 −24"349$80 −24"351$94 −24"347$68n 6"242 6"242 6"242 6"242 6"242
Notes. Dependent variables in year t + 1; independent variables calculated from years t − 4 to t. All models include yearly indicatorvariables with 1980 omitted.
+% p < 0$1, ∗% p < 0$05, ∗∗% p < 0$01, ∗∗∗% p < 0$001, standard errors in parentheses.
very rich regions, such as New York City, do not. Thenumber of university patents is not statistically signifi-cant, which might occur if graduate students leave theregion for employment elsewhere. Regions with newerand less diverse technologies patent more, and bothresults are statistically significant. Regions with a highernumber of assignees per inventor and tie density do notdemonstrate significantly different rates of subsequentpatenting. The presence of a single, large organization,however, demonstrates significantly increased rates ofsubsequent patenting. Of the bipartite controls (Ln LCinventors and Ln LC patents), only the number of patents
INFO
RMS
holds
copy
righ
tto
this
article
and
distrib
uted
this
copy
asa
courtesy
tothe
author(s).
Add
ition
alinform
ation,
includ
ingrig
htsan
dpe
rmission
policies,
isav
ailableat
http://journa
ls.in
form
s.org/.

Fleming, King, and Juda: Small Worlds and Regional InnovationOrganization Science 18(6), pp. 938–954, © 2007 INFORMS 949
in the largest component consistently correlates signifi-cantly (and positively) with future patenting. The lack ofresult for employee mobility (as proxied by the assigneesper inventor variable) is surprising, as personnel move-ment across firms should arguably increase creativity.As demonstrated below, however, greater creativity mayresult from simple connection and aggregation of inven-tor networks.Clustering correlates with a consistently negative but
insignificant correlation with subsequent patenting. Allof the count models demonstrated a positive and sig-nificant influence of decreased path length on the nextyear’s patent counts. To correctly form the interaction ofclustering divided by path length, we center and enterthe inverse of normalized path length; a positive effectof the variable indicates a positive influence of shorterpath length. The effect is robust but small: A one stan-dard deviation decrease in path length corresponds to a0.6% increase in patenting.9 The small-world interactionnever demonstrates even marginal significance. The sizeof the largest component variable demonstrates a largeand positive correlation of 1.4% with subsequent patent-ing. We infer from these results that clustering and thesmall-world interaction are of much less consequenceto subsequent patenting than decreased path length andthe size of the largest component. These results are con-sistent with career models of patenting at the inventorlevel, which demonstrate a negative influence of clus-tering on generative creativity and a very small positiveinteraction of clustering and external ties (Fleming et al.2007b).These results support the first two hypotheses on
path length and aggregation: (1) Shorter path lengthand (2) larger connected components correlate with anincrease in subsequent patenting. The small-world effectis not observed in our patent data, and so the thirdhypothesis, on the small-world interaction of clusteringdivided by path length, fails to receive empirical support.
DiscussionThese models should be interpreted cautiously for sev-eral reasons. First, if the influence of clustering oncreativity depends strongly on local contingencies, it isdifficult to generalize across a network of different clus-ters, let alone different creative endeavors. Contempora-neous evaluations of Broadway musicals (Uzzi and Spiro2006) and patent counts in subsequent years (Schillingand Phelps 2007) represent different realms and makeit difficult to directly compare results. Second, giventhat small worlds are connected by definition, we canonly regress the largest component’s structure againstregional patenting. This may be a reasonable approxima-tion in regions with small, connected inventor commu-nities or large, aggregated communities, such as Bostonor Silicon Valley because the largest component will
comprise a large fraction of all inventors in a region.Still, as illustrated in Figure 5, most inventor com-munities remain fragmented, and the resultant decreasein the size of the largest component will increase thestandard errors of the small-world structure estimates.Methods to develop a weighted average across discon-nected components (Schilling and Phelps 2007) provideone alternative, but potentially conflate the influencesof small-world structure and simple connection. Third,given that the small-world measure averages cluster-ing and path lengths, the possibility of aggregation biasexists (Robinson 1950). Other biases due to unobservedlinkages may also exist: For example, while one miss-ing tie may not greatly bias the clustering measure, itmight have a large impact on the path length and size ofthe largest component. While the regressions covered allregions, our deeper analyses covered only Silicon Val-ley and Boston. Other regions, such as San Francisco,California; Rochester, New York; and Pittsburgh, Penn-sylvania, also underwent dramatic transitions. While SanFrancisco closely followed Silicon Valley, Rochester,and Pittsburgh split apart. Our understanding of phasetransitions would benefit from qualitative study. Finally,given the difficulty of finding a natural experiment onsmall worlds or instrumental variables at the regionallevel of analysis, the results should be regarded as pri-marily descriptive.These results motivate the exploration of several
issues in future empirical research on small worlds.First, given that the regressions’ strongest results comefrom the size of the largest component, future modelsof small worlds need to include it at least as a con-trol variable. If the simple size measure continues todemonstrate stronger influence than the internal struc-tural measures, it would appear that the current focus onsmall-world structure and creativity is misplaced. Sup-porting this possibility, the path length variable lost itssignificance in a robustness check that used weightedcitations instead of patents as a dependent variable (allother results remained essentially unchanged). We inter-pret this result as indicating that the importance ofpath length rapidly decreases with longer paths. Thisis consistent with Singh (2005) who demonstrated thatdiffusion along collaborative paths drops off rapidly.One theoretical implication of the loss of path lengthsignificance is that individual gatekeepers may be ofless importance than the redundant connections thatbegin to form as the size of the largest componentincreases. For example, Figure 1 illustrates an increas-ingly redundant core of connections, in which a singleconnecting gatekeeper becomes redundant. (Althoughnot presented, graphs of bigger largest components illus-trate even thicker and more redundant cores.)Second, future work should proceed simultaneously
at the individual and regional level to fully capture the
INFO
RMS
holds
copy
righ
tto
this
article
and
distrib
uted
this
copy
asa
courtesy
tothe
author(s).
Add
ition
alinform
ation,
includ
ingrig
htsan
dpe
rmission
policies,
isav
ailableat
http://journa
ls.in
form
s.org/.

Fleming, King, and Juda: Small Worlds and Regional Innovation950 Organization Science 18(6), pp. 938–954, © 2007 INFORMS
complex dynamics of the process. Indeed, all small-world research might benefit from proceeding alongmicro and macro fronts simultaneously. Micro analy-sis would allow modeling of local contingencies andmake the macro results less vulnerable to aggrega-tion (Robinson 1950) and unipartite graph (Newman2001) biases. To illustrate the value of such a combinedapproach, assume that researchers perform only macrostudies. Further assume that clustering has a negativeinfluence on creativity by itself, but that the marginalinfluence of clustering is positive when the participantsbring diverse creative backgrounds to the collaboration.In other words, assume that clustering has not only afirst-order negative effect, but also a positive interactionwith a measure of the group’s creative diversity (Fleminget al. 2007b demonstrate such effects). If the highly clus-tered groups in regions with high average clustering alsohave diverse creative backgrounds, and particularly ifaverage diversity in the region remained unmeasured,then clustering might incorrectly appear to have a posi-tive effect overall.Micro studies would provide additional benefits. Con-
sider the complex question about whether ties acrossinstitutions (universities and firms, for example) orindustries provide more fertile inventions. Such a mech-anism could provide many of the creative benefits ofa small world and be masked by macro measures suchas the size of the largest component and path length.An appropriate instrument for an individual would pro-vide a natural experiment or control for the inherentendogeneity of such a mechanism (for example, did theinventor create the tie to take advantage of a previouslyidentified opportunity, or did the tie enable the flowof fresh information that triggered more fertile inven-tions?). Consistent results at multiple levels of analysiswould strengthen the inference and the foundation forsubsequent theory building.Third, future work should develop more nuanced and
longitudinal measures of creativity. Although clusteringmay inhibit seminal creativity, it may aid in the diffusionof ideas (Fleming et al. 2007b). This simple observa-tion might resolve the differing results on clustering andcreativity. Building on this point, measures need to becarefully defined from a deep understanding of the con-textual dynamics. To motivate this concern in the currentresearch and to more fully understand its limitations,consider inventive creativity versus inventive productiv-ity. Small worlds and network aggregation, because theymake local inventors more aware of outside work, prob-ably increase competitive pressures, particularly if theycross firm boundaries. While the influence of compe-tition and pressure on creativity remains controversial(Amabile et al. 2002), it is possible that small worldsincrease productivity, as measured by patent counts, atthe expense of breakthrough creativity. Because most
patents represent only incremental and relatively uncre-ative improvements, better measures of creativity versusproductivity are needed to resolve this question.In addition to the implications for research, the results
have implications for policy and management. Figures 4and 5 reveal large differences and rapid changes inthe connectivity of regional collaboration networks. Forexample, even though Boston and Silicon Valley are sim-ilarly dynamic technological regions, our data supportSaxenian’s assertion that the Valley is much more con-nected (though the emergence of the giant componentcomes after the main focus of her study, see Saxenian1994). Managers already take note of spillovers whenthey locate in a region (Feinberg and Gupta 2004). Anunderstanding of the local collaborative networks mayprovide an additional benefit to entrepreneurs who foundfirms in their home region (Sorenson and Audia 2000).Location in a connected region means quicker access tobetter qualified personnel, a greater likelihood of univer-sity and scientific research, and most important, fasteraccess to technological spillovers. But it also means adecision to live life in the fast lane. Personnel are proba-bly more expensive, can leave more easily, and are prob-ably better connected—even during employment—withexternally employed professionals in the region.We are also struck by the importance—completely
unintended by its founders—of the IBM postdoctoralhiring program in creating the Silicon Valley structure.Campbell Scott and William Risk stated that IBM’s mainmotivations for hiring postdoctorals included less expen-sive labor and new ideas (IBM rarely hired postdoc-torals permanently unless their contributions were out-standing). IBM apparently also wished to seed the Val-ley with friendly professionals. The explanation makesmore sense in light of the firm’s dominant position, whenthe program was originally set up. The program hadnot been intended to provide spillovers, in either direc-tion, across the firm’s boundaries. Spillovers obviouslyoccurred between IBM and BioCircuits, but these wereof no competitive threat to the larger firm. Scott saidthat he did learn some biology while visiting at Bio-Circuits, and that he is applying this learning as IBMmoves into life science technologies. In the spirit ofunintended innovative benefits for all involved, managersmight recreate these positive benefits with institutions,such as the IBM postdoctoral hiring program, while alsotaking care to avoid competitively harmful spillovers.Our results should also be of interest to regional pol-
icymakers who seek to enhance social welfare. Eventhough the emergence of small worlds does not appearto greatly improve innovation, decreased path length andcomponent aggregation correlate strongly with subse-quent patenting. Simple prescriptions to encourage per-sonnel movement and knowledge spillovers will not bepopular with firms, however, and might dampen man-agerial enthusiasm to locate in the region. Such benefits,
INFO
RMS
holds
copy
righ
tto
this
article
and
distrib
uted
this
copy
asa
courtesy
tothe
author(s).
Add
ition
alinform
ation,
includ
ingrig
htsan
dpe
rmission
policies,
isav
ailableat
http://journa
ls.in
form
s.org/.

Fleming, King, and Juda: Small Worlds and Regional InnovationOrganization Science 18(6), pp. 938–954, © 2007 INFORMS 951
unfortunately, appear to come at the expense of privatefirms. The conflict between regional welfare and firms’protection of their intellectual property strikes us as animportant topic for future research.
ConclusionDespite attracting significant theoretical and more re-cently, empirical attention, our understanding of thedynamics and impact of small-world networks remainsincomplete. Using the patent collaboration histories ofover 2 million inventors, we showed that large, tech-nologically dynamic regions undergo dramatic aggre-gations of isolated inventor components into giantcomponents. Contrary to the growing consensus thatsmall worlds should always improve innovative produc-tivity, we argued that universal predictions remain prob-lematic due mainly to the locally contingent effects ofclustering. Count models of network structure and sub-sequent patenting support these arguments. Decreasedpath length and increased aggregation increased subse-quent patenting. The small-world interaction of cluster-ing divided by path length demonstrated no statisticallysignificant influence on subsequent inventive productiv-ity, once the region’s network aggregation was taken intoaccount. While we hesitate to make strong claims basedon a null result, it appears that small-world structure isless important than the basic degree of connection withina region.This research makes several theoretical, methodologi-
cal, and empirical contributions to our understanding ofsmall-world networks and regional innovation. Theoret-ical contributions include the separation of the compo-nents of the small-world argument and recognition thatthe structure of a network may have less influence oninnovation than the fact that a connected network exists.Methodological contributions include the use of the newrelationship measure of patent coauthorship; its charac-terization through interviews; and the use of large sam-ple databases, visual analysis, and hierarchical clusteringalgorithms to identify representative inventors for fieldstudy. Empirical contributions include the identificationand visualization of critical junctures in network evolu-tion, and the first analysis of the effect of small worldson whole network productivity (as opposed to the effectson firms or groups within a small-world network).Our results suggest a possible tension between
regional policy planners and managers. Ironically, whilenetwork aggregation improves regional productivity, italso makes it more likely that firms will suffer unwantedknowledge spillovers. Our discovery that collaborationnetworks are growing, along with the quantitative andqualitative evidence that spillovers occur quite easilyalong current and historical collaborative ties, impliesthat managers must pay increasing attention to the incen-tives, socialization, and collaborative opportunities oftheir primary inventors.
AcknowledgmentsThe authors thank Ivin Baker and Jonathan McPhie for
their help in compiling data. The authors gratefully acknowl-edges support from the Harvard Business School Division ofResearch. The authors also thank Debbie Strumsky for hercompilation of regional economic data, and two anonymousreviewers for their reviews and constructive comments; com-ments from Santiago Mingo, Melissa Schilling, Jasjit Singh,Olav Sorenson, Mark Szigety, Brian Uzzi, Giovanni Valen-tini, Woody Powell, Dave Waguespack, and seminar partici-pants at Stanford University, Harvard University, and the SantaFe Institute benefited our work greatly. Mistakes and errorsremain the responsibility of the authors.
Appendix. Matching AlgorithmWe extracted source data on all U.S. utility patents grantedfrom 1975 to 2002 (U.S. Patent Office 2003) and MSA datafor 2003 (ZIPList5 MSA 2003). Every patent includes theinventor’s last name(s) (with varying degrees of first andmiddle names or initials), home town, detailed informationabout the technology in class and subclass references (over100,000 subclasses exist), and the owner or assignee of thepatent (if not owned by the inventor, generally a firm, orless often a university). The U.S. Patent Office indexes sourcedata by patent number, not by inventor. We therefore devisedan inventor-matching algorithm to determine each inventor’spatents and other inventors with whom the focal inventor coau-thored at least one patent. The database includes 2,058,823inventors and 2,862,967 patents.
The matching algorithm refines previous approaches (New-man 2001). If last names match, first initials and middle ini-tials (if given) then must match. Whole first names and wholemiddle names (if given) then are compared. If all comparisonsare positive, the algorithm then requires an additional non-name similarity: hometown (and city and state), corporation(via assignee codes), or technology (via technology subclas-sifications). We also implemented a common name parameterthat ignored the additional match requirement if the last namecomprised less than 0.05% of the U.S. population, as deter-mined by the 1995 U.S. census. For 26 randomly selectedinventors, the algorithm correctly assigned 215 of 226 patents(as determined by resume searches and personal contact). The11 incorrectly determined patents were assigned to four iso-lated nodes (that is, they did not create spurious cut-points).Given the sensitivity of the measures to cut-points, false nega-tives remain preferable to false positives or incorrectly match-ing two different inventors.
Endnotes1Even though we study patent collaboration networks, whichare based on the codified publication of patent records, muchinformation remains tacit, private, and not communicated. Thisoccurs because written documents can rarely capture all therichness of a technology and because inventors and their firmsoften withhold information contained in patents for strategicreasons.2We define network aggregation as the process whereby pre-viously isolated components become connected, in the currentempirical case, through collaborative mobility. The term isintentionally dissimilar to the word agglomeration used in theeconomics literature, which refers to economies that firms gain
INFO
RMS
holds
copy
righ
tto
this
article
and
distrib
uted
this
copy
asa
courtesy
tothe
author(s).
Add
ition
alinform
ation,
includ
ingrig
htsan
dpe
rmission
policies,
isav
ailableat
http://journa
ls.in
form
s.org/.

Fleming, King, and Juda: Small Worlds and Regional Innovation952 Organization Science 18(6), pp. 938–954, © 2007 INFORMS
by clustering together and sharing pooled labor availability,infrastructure, suppliers, and other services.3Alternate window sizes had little effect on illustrated pro-cesses (surprisingly, even the cut-point or crucial bridginginventors), substantive trends as illustrated in Figures 3 and 4,and econometric results. The illustrations include inventorsboth within and outside the MSA and the models control foreach of these quantities independently.4The small-world measure lacks units because the normalizedmeasures of clustering and path length lack units.5We chose the period 1986–1990 because it encompasses theinitial differentiation that eventually turned into the runawayaggregation of Silicon Valley. Boston, in contrast, demon-strated no appreciable change until three to five years later.The regions also demonstrated remarkably similar trends inseveral factors, including patents, inventors, isolated inven-tors, corporate ownership of patents, number of collaborators,tie density, age and diversity of technologies, and number ofassignees per inventor (a measure of personnel movement).There remain a few differences: Boston has more universitypatents and its inventors cite nonpatent references more heav-ily (Fleming et al. 2007b).6The study focused on the connection dynamics of the sixlargest components in Silicon Valley and Boston in the 1986–1990 time-frame. The top six were chosen because the first,second, and sixth components aggregated in the Valley, com-pared with no aggregation of the top six components inBoston. The inventors that linked smaller components into agiant component were identified and interviewed, along withsimilar “counter-factual” nonlinking inventors. The nonlinkinginventors were chosen by minimizing their distance to a link-ing inventor with a hierarchical clustering algorithm, along avariety of personal and network variables (see Fleming et al.2007b for details). Despite our best efforts to find inventorswith similar social structure, selection bias remains possible,since inventors that left firms and bridged components maydiffer from those that did not. They may, for example, be lessrisk averse and perceive the processes of invention and infor-mation flow differently.7Froix stressed that this support was not financial; that is, hepaid for any incremental expenses he caused during his use oflaboratory facilities.8A cut-point is an actor or node in a graph whose removalwould separate the graph into two subcomponents (Wassermanand Faust 1994, pp. 112–114). In the case of Campbell Scott,it would separate the IBM and pharmaceutical components ofthe Silicon Valley graph.9We estimate effect sizes from model 5 unless otherwise noted.For the path length example, effect size from model 5 is0.0012 and the standard deviation of the measure is 4.82.Hence, e"0!0012∗4!82# = 1!0058, and 100 ∗ "1!0058− 1#= 0!6%.
ReferencesAcs, Z., L. Anselin, A. Varga. 2002. Patents and innovation counts as
measures of regional production of new knowledge. Res. Policy31 1069–1085.
Ahuja, G. 2000. Collaboration networks, structural holes, and inno-vation: A longitudinal study. Admin. Sci. Quart. 45(3) 425–457.
Albert, M. B., F. Narin, D. Avery, P. McAllister. 1991. Direct vali-dation of citation counts as indicators of industrially importantpatents. Res. Policy 20 251–259.
Allen, T. J. 1977. Managing the Flow of Technology: TechnologyTransfer and the Dissemination of Technological InformationWithin the R&D Organization. MIT Press, Cambridge, MA.
Almeida, P., B. Kogut. 1999. Localization of knowledge and themobility of engineers in regional networks. Management Sci.45(7) 905–917.
Amabile, T., C. N. Hadley, S. J. Kramer. 2002. Creativity under thegun. Special issue on the innovative enterprise: Turning ideasinto profits. Harvard Bus. Rev. 80(8) 52–61.
Amaral, L., A. Scala, M. Barthelemy, H. Stanley. 2000. Classesof small-world networks. Proc. National Acad. Sci. 97(21)11149–11152.
Angel, D. 1989. The labor market for engineers in the U.S. semicon-ductor industry. Econom. Geography 65(2) 99–112.
Balconi, M., S. Breschi, F. Lissoni. 2004. Networks of inventors andthe role of academia: An exploration of Italian patent data. Res.Policy 33 127–145.
Barabasi, A., R. Albert. 1999. Emergence of scaling in random net-works. Science 286 509–512.
Batagelj, V., A. P. Mrvar. 1998. A program for large network anal-ysis. Connections 21, 47–57. Pajek v. 0.91, 2003. http://vlado.fmf.uni-lj.si/pub/networks/pajek/.
Baum, J. A. C., A. V. Shipilov, T. J. Rowley. 2003. Where do smallworlds come from? Indust. Corporate Change 12 697–725.
Borgatti, S. P., R. Cross. 2003. A relational view of information seek-ing and learning in social networks. Management Sci. 49(4)432–445.
Breschi, S., F. Lissoni. 2004. knowledge networks from patent data:Methodological issues and research targets. Working Paper 150,Centro di Ricerca sui Processi di Innovazione e Internazionaliz-zazione.
Bureau of Economic Analysis. 2004. Bureau of economicanalysis, regional economic accounts local area personalincome. http://www.bea.doc.gov/bea/regional/reis/. Deflationdata http://www.census.gov/hhes/income/income02/cpiurs.html.
Burt, R. 2004. Structural holes and good ideas. Amer. J. Sociol. 110349–399.
Cohen, R. 2003. Interview by author. Cambridge, MA (November 12).
Cowan, R., N. Jonard. 2003. The dynamics of collective invention.J. Econom. Behav. Organ. 52 513–532.
Cowan, R., N. Jonard. 2004. Network structure and the diffusion ofknowledge. J. Econom. Dynam. Control 28 1557–1575.
Davila, A., G. Foster, et al. (2003). Venture capital financing and thegrowth of startup firms. J. Bus. Venturing 18(6) 689–708.
Davis, G. F., M. Yoo, W. E. Baker. 2003. The small world ofthe American corporate elite, 1982–2001. Strategic Organ. 1301–326.
Dodds, P., R. Muhamad, D. Watts. 2003. An experimental study ofsearch in global social networks. Science 301 827–829.
Feinberg, S. E., A. K. Gupta. 2004. Knowledge spillovers and theassignment of R&D responsibilities to foreign subsidiaries.Strategic Management J. 25 823–845.
Feldman, M. 2001. The entrepreneurial event revisited: Firm for-mation in a regional context. Indust. Corporate Change 10(4)861–892.
Fleming, L., M. Marx. 2006. Managing creativity in small worlds.California Management Rev. 48(4) 6–27.
INFO
RMS
holds
copy
righ
tto
this
article
and
distrib
uted
this
copy
asa
courtesy
tothe
author(s).
Add
ition
alinform
ation,
includ
ingrig
htsan
dpe
rmission
policies,
isav
ailableat
http://journa
ls.in
form
s.org/.

Fleming, King, and Juda: Small Worlds and Regional InnovationOrganization Science 18(6), pp. 938–954, © 2007 INFORMS 953
Fleming, L., S. Mingo, D. Chen. 2007a. Collaborative brokerage,geuevative creativity, and creative success. Admin. Sci. Quart.52 443–475.
Fleming, L., L. Colfer, A. Marin, J. McPhie. 2007b. Why the val-ley went first: Aggregation and emergence in regional inventornetworks. W. Powell, J. Padgett, eds. Market Emergence andTransformation. Santa Fe Institute, Santa Fe, NM. Forthcoming.
Florida, R. 2004. America’s looming creativity crisis. Harvard Bus.Rev. 82(10) 122–124, 126, 128.
Friedrich, R. 1982. In defense of multiplicative terms in multipleregression equations. Amer. J. Political Sci. 26(4) 797–833.
Froix, M. 2003. Personal interview by author. Palo Alto, CA (July 8).
Gilson, R. J. 1999. The legal infrastructure of high technology indus-trial districts: Silicon Valley, Route 128, and covenants not tocompete. New York University Law Rev. 74 575–629.
Gittleman, M. 2003. Does geography matter for science based firms?Epistemic communities and the geography of patenting andresearch in biotechnology. Working paper, Stern School ofBusiness.
Gompers, P., J. Lerner. 1996. The use of covenants: An empiricalanalysis of venture partnership agreements. J. Law Econom. 39463–498.
Goyal, S., M. Leij, J. Moraga-Gonzalez. 2004. Economics: An emerg-ing small world? Tinbergen Institute Discussion Paper TI2004-001/1.
Granovetter, M. 1973. The strength of weak ties. Amer. J. Sociol. 781360–1380.
Granovetter, M. 1985. Economic action and social structure: Theproblem of embeddedness. Amer. J. Sociol. 91(3) 481–510.
Greene, W. 2002. Econometric Analysis. Prentice Hall, New York.
Hansen, M. 1999. The search-transfer problem: The role of weak tiesin sharing knowledge across organization subunits. Admin. Sci.Quart. 44(1) 82–112.
Hargadon, A. 2003. How Breakthroughs Happen: The SurprisingTruth About How Companies Innovate. Harvard Business SchoolPress, Boston, MA.
Hausman, J., B. Hall, Z. Griliches. 1984. Econometric models forcount data with an application to the patents R&D relationship.Econometrica 52 909–938.
Hunt, M., T. Ogden, M. Neale. 2003. Who’s really sharing? Effects ofsocial and expert status on knowledge exchange within groups.Management Sci. 49(4) 464–477.
Hyde, A. 2003. Working in Silicon Valley: Economics and Legal Anal-ysis of a High-Velocity Labor Market. M.E. Sharpe, Armonk,NY.
Jaffe, A. B., M. Trajtenberg, R. Hendeson. 1993. Geographic local-ization of knowledge spillovers as evidenced by patent citations.Quart. J. Econom. 434 578–598.
Katz, A. 1982. The effects of group longevity on project communi-cation and performance. Admin. Sci. Quart. 27 81–104.
Kaufman, C. 2003. Interview by author. Westford, MA (August).
Khanna, P. 2003. Interview by author. Fremont, CA (July 10).
Kino, G. 2003. Interview by author. Stanford, CA (July 8).
Kogut, B., G. Walker. 2001. The small world of Germany and thedurability of national networks. Amer. Sociol. Rev. 66 317–335.
Kogut, B., U. Zander. 1992. Knowledge of the firm, combinativecapabilities, and the replication of technology. Organ. Sci. 3383–397.
Koning, P. 2003. Interview by author. Cambridge, MA (August).
Kozlovsky, W. 2003. Interview by author. Stanford, CA (Decem-ber 11).
Marshall, A. 1919. Industry and Trade. MacMillan, London.McEvily, W., R. Reagans. 2005. Networks and knowledge trans-
fer: The search-transfer problem reconsidered. Working paper,Tepper School of Business.
McEvily, W., A. Zaheer. 2004. Architects of trust: The role of networkfacilitators in geographical clusters. R. Kramer, K. Cook, eds.Trust and Distrust in Organizations. Rusell Sage Foundation,New York.
Milgram, S. 1967. The small world problem. Psych. Today 1 60–67.Nerkar, A., S. Paruchuri. 2005. Evolution of R&D capabilities: The
role or knowledge networks within the firm. Management Sci.51(5) 771–785.
Newman, M. 2001. The structure of scientific collaboration networks.Proc. National Acad. Sci. of the United States of America 98404–409.
Newman, M., D. Watts. 1999. Scaling and percolation in the small-world network model. Physical Rev. Part E 60 7332–7342.
Newman, M., D. Watts, S. Strogatz. 2002. Random graph models ofsocial networks. Proc. National Acad. Sci. of the United Statesof America 99 2566–2572.
Obstfeld, D. 2005. Social networks, the tertius iungens orientation,and involvement in innovation. Admin. Sci. Quart. 50 100–130.
Owen-Smith, J., W. W. Powell. 2004. Knowledge networks as chan-nels and conduits: The effects of spillovers in the Bostonbiotechnology community. Organ. Sci. 15(1) 5–21.
Perlman, R. 2003. Interview with author. Cambridge, MA (August).Piore, M., C. Sabel. 1984. The Second Industrial Divide$ Possibilities
for Prosperity. Basic Books, New York.Reagans, R., B. McEvily. 2003. Network structure and knowledge
transfer: The effects of cohesion and range. Admin. Sci. Quart.48 240–267.
Ribi, H. 2003. Interview by author. Cambridge, MA to Burlingame,CA (June 12).
Risk, W. 2003. Interview by author. San Jose, CA (July 9).Robinson, W. 1950. Ecological correlations and the behavior of indi-
viduals. Amer. Sociol. Rev. 15(3) 351–357.Saxenian, A. 1994. Regional Advantage. Harvard University Press,
Cambridge, MA.Schilling, M. A., C. C. Phelps. 2007. Interfirm collaboration networks:
The impact of large-scale network structure on firm innovation.Management Sci. 53 1113–1126.
Singh, J. 2005. Collaborative networks as determinants of knowledgediffusion patterns. Management Sci. 51 756–770.
Solow, R. 1957. Technical change and the aggregate production func-tion. Rev. Econom. Statist. 39 312–320.
Sorenson, O., P. Audia. 2000. The social structure of entrepreneurialactivity: Geographic concentration of footwear production in theU.S., 1940–1989. Amer. J. Sociol. 106 324–362.
Sorenson, O., T. Stuart. 2001. Syndication networks and spatial dis-tribution of venture capital investments. Amer. J. Sociol. 106(6)1546–1588.
Sorenson, O., J. Rivkin, Fleming. 2006. Complexity, networks andknowledge flow. Res. Policy 35 994–1017.
Stewart, R. 2004. Interview by author. Cambridge, MA (June 17).Stuart, T., J. Podolny. 1996. Local search and the evolution of tech-
nological capabilities. Strategic Management J. (Summer).Stuart, T., J. Podolny. 1999. Positional causes and correlates of
strategic alliances in the semiconductor industry. S. Andrews,D. Knoke, eds. Research in the Sociology of Organizations. JAIPress, Greenwich, CT, 161–182.
INFO
RMS
holds
copy
righ
tto
this
article
and
distrib
uted
this
copy
asa
courtesy
tothe
author(s).
Add
ition
alinform
ation,
includ
ingrig
htsan
dpe
rmission
policies,
isav
ailableat
http://journa
ls.in
form
s.org/.

Fleming, King, and Juda: Small Worlds and Regional Innovation954 Organization Science 18(6), pp. 938–954, © 2007 INFORMS
Stuart, T., O. Sorenson. 2003. Liquidity events and the geographicdistribution of entrepreneurial activity. Admin. Sci. Quart. 48175–201.
Sutton, R., A. Hargadon. 1996. Brainstorming groups in context:Effectiveness in a product design firm. Admin. Sci. Quart. 41(4)685–718.
Szulanski, G. 1996. Exploring internal stickiness: Impediments to thetransfer of best transfer within the firm. Strategic Management J.17 27–43.
Umatoy, S. 2003. Interview by author. San Jose, CA, July 9.
University of Virginia. 2004. County business patterns online.Geospatial and Statistical Data Center, University of VirginiaLibrary. http://fisher.lib.virginia.edu/collections/stats/cbp/.
U.S. Patent Office. 2003. Patents BIB (January).
Uzzi, B., J. Spiro. 2006. Collaboration and creativity: The small worldproblem. Amer. J. Sociol. 111(2) 447–504.
Verspagen, B., G. Duysters. 2003. The small worlds of strategic tech-nology alliances. Technovation 23.
Wasserman, S., K. Faust. 1994. Social Network Analysis: Meth-ods and Applications. Cambridge University Press, Cam-bridge, MA.
Watts, D. 1999. Networks, dynamics, and the small-world phe-nomenon. Amer. J. Sociol. 105 493–527.
Watts, D., S. Strogatz. 1998. Collective dynamics of small-world net-works. Nature 393 440–442.
ZIPList5 MSA. 2003. CD Light, LLC. http://www.zipinfo.com/products/z5msa/z5msa.htm.
INFO
RMS
holds
copy
righ
tto
this
article
and
distrib
uted
this
copy
asa
courtesy
tothe
author(s).
Add
ition
alinform
ation,
includ
ingrig
htsan
dpe
rmission
policies,
isav
ailableat
http://journa
ls.in
form
s.org/.