smart beta, scrabble and simian indices - welcome to cass · smart beta, scrabble and simian...
TRANSCRIPT

© Nick Motson Cass Business School Smart Beta, Scrabble and Simian Indices
Smart Beta, Scrabble and Simian Indices Presented by Dr. Nick Motson Associate Dean MSc Program Cass Business School

© Nick Motson Cass Business School Smart Beta, Scrabble and Simian Indices
INTRODUCTION

© Nick Motson Cass Business School Smart Beta, Scrabble and Simian Indices
INTRODUCTION
3

© Nick Motson Cass Business School Smart Beta, Scrabble and Simian Indices
INTRODUCTION
● In 2013 we released two research papers commissioned by AON Hewitt[1][2]
● We examined 8 alternative index methodologies which are all available as commercial products and have become collectively known as “Smart Beta”
● We used a common set of stocks* over a 43 year period in order to make an “apples to apples” comparison
● Today I will share some updated insights from that research based on a series of white papers commissioned by Invesco PowerShares
*In the original papers we use the largest 1,000 US stocks from CRSP, today I will use the results from the largest 500 stocks, where our market-cap benchmark is 99.71% correlated with the S&P 500 and extend the results through 2014.
4

© Nick Motson Cass Business School Smart Beta, Scrabble and Simian Indices
THE ACADEMIC ORIGINS OF SMART BETA
5
Building on Markowitz’s mean variance analysis Sharpe develops the Capital Asset Pricing Model (CAPM)
1960s 1970s 1980s 1990s 2000s
Haugen and Heins find strong negative relationship between return and volatility.
Banz finds that small cap stocks outperformed large cap stocks Basu finds low PE stocks generate higher returns relative to high PE stocks
Practitioners begin to launch investment products based on the academic evidence of “anomalies”
Jegadeesh and Titman found buying past winners and selling past losers was highly profitable.

© Nick Motson Cass Business School Smart Beta, Scrabble and Simian Indices
WHY ALTERNATIVE WEIGHTING SCHEMES?
● A major advantage of a cap-weighted index is low turnover, (the weights of the stocks in the index change as the market value of the stocks change) hence tracking is easy and expenses will be low.
• However, a counter argument is that market-cap weighting can put more weight on companies that might be most overvalued by the stock market and less weight on companies that are possibly undervalued
• Cap-weighted indices can also be quite concentrated with a small proportion of stocks making up the bulk of the index weights
• Alternative indices might seek to exploit other risk premium or known anomalies such as size, value, momentum or low-beta
6

© Nick Motson Cass Business School Smart Beta, Scrabble and Simian Indices
THE SET OF ALTERNATIVES
● The eight alternative approached considered:
• Equally Weighted
• Diversity Weighted
• Inverse Volatility
• Equal Risk Contribution
• Minimum Variance
• Maximum Diversification
• Risk Efficient
• Fundamentally Weighted
*Please see the appendix for the research justifying each alternative as well as the methodology
7

© Nick Motson Cass Business School Smart Beta, Scrabble and Simian Indices
DATA AND METHODOLOGY
● Equity data from CRSP
• Selected 500 largest market cap universe with requirement of 5 years of continuous historical returns
• Sample period December 1968 to December 2014
• Rebalanced annually in December
● We followed as closely as possible the index providers methodology but stress we were looking at the spirit as opposed to the law of construction using the academic papers as our guide
8

© Nick Motson Cass Business School Smart Beta, Scrabble and Simian Indices
0
1,000
2,000
3,000
4,000
5,000
6,000
7,000
8,0001969
1970
1971
1972
1973
1974
1976
1977
1978
1979
1980
1981
1983
1984
1985
1986
1987
1988
1990
1991
1992
1993
1994
1995
1997
1998
1999
2000
2001
2002
2004
2005
2006
2007
2008
2009
2011
2012
2013
2014
THE BENCHMARK MARKET CAP INDEX
9
99.8% correlation to the S&P 500

© Nick Motson Cass Business School Smart Beta, Scrabble and Simian Indices
THE MARKET CAP INDEX IS INDEED QUITE CONCENTRATED
• The largest 50 stocks make up almost half the index and the largest 100 make up almost two thirds
10
2.0% 2.4% 2.8% 3.4% 4.2% 5.2% 6.7%
9.1%
14.5%
49.5%
0%
10%
20%
30%
40%
50%
60%
1 2 3 4 5 6 7 8 9 10
We
igh
t b
y S
ize
De
cil
e
Decile

© Nick Motson Cass Business School Smart Beta, Scrabble and Simian Indices
Mean Return
Standard Deviation
Sharpe Ratio
Market Cap-Weighted 10.62% 15.00% 0.38
Equally-Weighted 11.93% 16.15% 0.43
Diversity-Weighted 10.98% 15.27% 0.39
Inverse Volatility-Weighted 11.79% 14.13% 0.48
Equal Risk Contribution 11.88% 14.93% 0.46
Minimum Variance Portfolio 10.83% 12.04% 0.49
Maximum Diversification 11.62% 14.16% 0.47
Risk Efficient 12.03% 15.62% 0.45
Fundamentally-Weighted 11.89% 14.81% 0.47
FULL SAMPLE RESULTS 1969-2014 RETURN AND RISK
• All 8 of the alternative indices have a higher return
• 5 out of 8 have lower volatility
• All 8 have a higher Sharpe Ratio
11

© Nick Motson Cass Business School Smart Beta, Scrabble and Simian Indices
RESULTS BY DECADE
• Similar pattern in the 1970s, 1980s & 2000s
• In the bull market of the 1990s Market Cap beat everything
12
1970s 1980s 1990s 2000s
Mean Return
Sharpe Ratio
Mean Return
Sharpe Ratio
Mean Return
Sharpe Ratio
Mean Return
Sharpe Ratio
Market Cap-Weighted 6.76% 0.04 16.84% 0.51 17.57% 0.97 1.03% -0.11
Equally-Weighted 8.91% 0.15 17.41% 0.53 16.13% 0.83 5.52% 0.17
Diversity-Weighted 7.33% 0.07 17.06% 0.52 17.08% 0.93 2.34% -0.03
Inverse Volatility-Weighted 9.04% 0.18 18.71% 0.68 13.51% 0.72 6.06% 0.24
Equal Risk Contribution 9.03% 0.17 18.18% 0.61 14.61% 0.77 5.84% 0.21
Minimum Variance Portfolio 7.73% 0.12 19.78% 0.90 10.31% 0.49 6.46% 0.31
Maximum Diversification 7.92% 0.10 19.61% 0.77 13.28% 0.68 5.48% 0.22
Risk Efficient 9.45% 0.18 18.17% 0.60 14.56% 0.74 6.06% 0.21
Fundamentally-Weighted 9.40% 0.21 18.21% 0.63 16.19% 0.92 4.15% 0.09

© Nick Motson Cass Business School Smart Beta, Scrabble and Simian Indices
MOST OF THE ALTERNATIVES SUFFER FROM PERIODS OF SOMETIMES SEVERE UNDERPERFORMANCE
13
-80%
-60%
-40%
-20%
0%
20%
40%
60%
80%
1972
1975
1978
1981
1984
1987
1990
1993
1996
1999
2002
2005
2008
2011
2014
Equal Weighted 3 Year Rolling vs Market Cap
© Nick Motson Cass Business School Smart Beta, Scrabble and Simian Indices
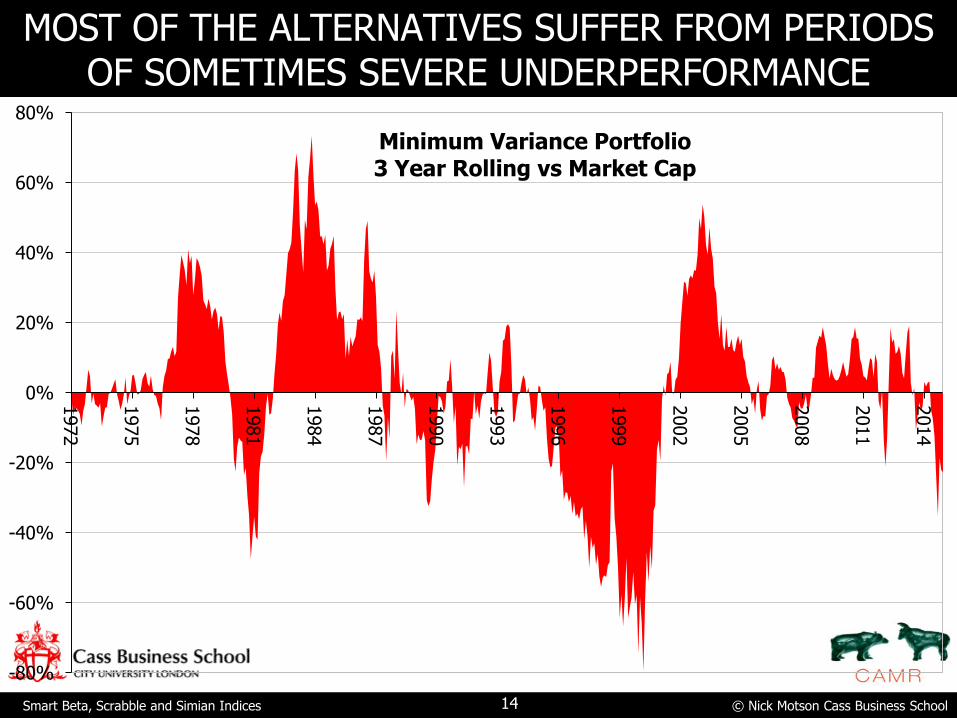
MOST OF THE ALTERNATIVES SUFFER FROM PERIODS OF SOMETIMES SEVERE UNDERPERFORMANCE
14
-80%
-60%
-40%
-20%
0%
20%
40%
60%
80%
1972
1975
1978
1981
1984
1987
1990
1993
1996
1999
2002
2005
2008
2011
2014
Minimum Variance Portfolio 3 Year Rolling vs Market Cap

© Nick Motson Cass Business School Smart Beta, Scrabble and Simian Indices
MOST OF THE ALTERNATIVES SUFFER FROM PERIODS OF SOMETIMES SEVERE UNDERPERFORMANCE
15
-80%
-60%
-40%
-20%
0%
20%
40%
60%
80%
1972
1975
1978
1981
1984
1987
1990
1993
1996
1999
2002
2005
2008
2011
2014
Fundamental Weighted 3 Year Rolling vs Market Cap

© Nick Motson Cass Business School Smart Beta, Scrabble and Simian Indices
Sharpe Ratio p-value
Market Cap-Weighted 0.38 -
Equally-Weighted 0.43 17.3%
Diversity-Weighted 0.39 17.6%
Inverse Volatility-Weighted 0.48 5.1%
Equal Risk Contribution 0.46 5.2%
Minimum Variance Portfolio 0.49 37.4%
Maximum Diversification 0.47 12.9%
Risk Efficient 0.45 11.0%
Fundamentally-Weighted 0.47 5.5%
ARE THE SHARPE RATIOS SIGNIFICANTLY DIFFERENT FROM THE MARKET CAP INDEX?
• From the previous slides it might be argued that in fact all we are seeing is noise and the Sharpe ratios are in fact not different.
• Testing whether Sharpe ratios are statistically different from each other is non-trivial. We use a robust procedure proposed by Ledoit
and Wolf (2008) [12]
• Only 3 of the 8 are statistically different……………..
16

© Nick Motson Cass Business School Smart Beta, Scrabble and Simian Indices
CAPM Beta CAPM Alpha
Market Cap-Weighted 1.00 0.00%
Equally-Weighted 1.06 0.84%
Diversity-Weighted 1.02 0.20%
Inverse Volatility-Weighted 0.89 2.31%**
Equal Risk Contribution 0.96 1.68%*
Minimum Variance Portfolio 0.51 4.73%*
Maximum Diversification 0.82 2.34%*
Risk Efficient 1.01 1.44%*
Fundamentally-Weighted 0.96 1.75%**
DO SMART BETA INDICES HAVE ALPHA?
● A single factor CAPM model would suggest that 6 of the 8 alternatives have positive and significant alpha
17

© Nick Motson Cass Business School Smart Beta, Scrabble and Simian Indices
Alpha Rm-Rf SMB HML R2
Equally-Weighted 0.01% 0.98** -0.17** 0.02** 100%
[1.00] [318.06] [-39.49] [4.77]
Diversity-Weighted 0.02% 1.02** 0.04** 0.17** 97%
[0.47] [124.44] [3.45] [13.85]
Inverse Volatility-Weighted 0.01% 0.99** -0.12** 0.07** 99%
[0.76] [276.46] [-22.82] [12.29]
Equal Risk Contribution 0.03% 0.91** -0.08** 0.30** 93%
[0.66] [84.14] [-4.92] [17.97]
Minimum Variance Portfolio 0.03% 0.96** -0.03* 0.24** 95%
[0.70] [104.00] [-2.00] [17.02]
Maximum Diversification 0.06% 0.64** -0.18** 0.39** 62%
[0.67] [29.42] [-5.77] [11.89]
Risk Efficient 0.08% 0.86** -0.01 0.16** 87%
[1.27] [57.29] [-0.30] [6.89]
Fundamentally-Weighted 0.00% 0.99** 0.04* 0.27** 95%
[0.08] [101.53] [2.55] [18.38]
DO SMART BETA INDICES HAVE ALPHA?
● However adding the Fama French factors for size and value removes all sign of any alpha
18

© Nick Motson Cass Business School Smart Beta, Scrabble and Simian Indices
SEEMS THE ALTERNATIVES HAVE A SMALL CAP BIAS
● All of the alternatives hold much smaller stocks
● Except perhaps the fundamentally weighted index
19
$0 $10,000,000,000 $20,000,000,000 $30,000,000,000 $40,000,000,000 $50,000,000,000
Market Cap-Weighted
Equally-Weighted
Diversity-Weighted
Inverse Volatility-Weighted
Equal Risk Contribution
Minimum Variance Portfolio
Maximum Diversification
Risk Efficient
Fundamentally-Weighted
Weighted Average Market Cap

© Nick Motson Cass Business School Smart Beta, Scrabble and Simian Indices
WHAT ABOUT TRANSACTIONS COSTS?
● Good performance is one thing, but none of our results incorporate transactions costs
● What we did was:
• calculate the turnover involved in rebalancing the index every year and
• then calculate how high transactions costs would need to be to eliminate the performance difference
● In our view, in most cases bid-ask spreads would need to have been unbelievably high to have eliminated all of the difference
20

© Nick Motson Cass Business School Smart Beta, Scrabble and Simian Indices
TURNOVER
● All of the alternatives have higher turnover than market cap
21
5.4%
17.9%
7.2%
16.5%
16.9%
37.3%
47.9%
29.6%
11.7%
0.0% 10.0% 20.0% 30.0% 40.0% 50.0% 60.0%
Market Cap-Weighted
Equally-Weighted
Diversity-Weighted
Inverse Volatility-Weighted
Equal Risk Contribution
Minimum Variance Portfolio
Maximum Diversification
Risk Efficient
Fundamentally-Weighted
One Way Turnover

© Nick Motson Cass Business School Smart Beta, Scrabble and Simian Indices
TRANSACTIONS COSTS
● So how high would transactions costs have to have been to eliminate the performance difference?
● In almost all cases, transaction costs would have had to be unfeasibly high to eliminate the alternative index’s outperformance of the cap-weighted index
22
1-Way
Turnover
Transaction Cost to Equalize
Return
Transaction Cost to Equalize Sharpe
Ratio
Market Cap-Weighted 5.4% - -
Equally-Weighted 17.9% 5.4% 3.8%
Diversity-Weighted 7.2% 10.3% 7.9%
Inverse Volatility-Weighted 16.5% 5.4% 6.7%
Equal Risk Contribution 16.9% 5.6% 5.8%
Minimum Variance Portfolio 37.3% 0.3% 2.1%
Maximum Diversification 47.9% 1.2% 1.6%
Risk Efficient 29.6% 3.0% 2.6%
Fundamentally-Weighted 11.7% 10.3% 10.7%

© Nick Motson Cass Business School Smart Beta, Scrabble and Simian Indices
THE STORY SO FAR……..
● We have 8 alternative indices all of which have had a higher Sharpe ratio than market-cap over a 46 year sample period.
• 3 have statistically different Sharpe ratios than market-cap
• Nearly all have CAPM alpha
• None have FF alpha
• All are being offered as commercial products
23

© Nick Motson Cass Business School Smart Beta, Scrabble and Simian Indices
WE INTERRUPT THIS PRESENTATION FOR
A COMMERCIAL BREAK

© Nick Motson Cass Business School Smart Beta, Scrabble and Simian Indices
THE SCRABBLETM INDEX
● Knowing that the market cap index is poorly diversified
• 10% of the stocks make up 50% of the weight
● We can construct a better diversified index by using an “innovative” weighting scheme
• Using the ticker symbol for each stock we calculate the ScrabbleTM score for each stock
– (1 point)-A, E, I, O, U, L, N, S, T, R.
– (2 points)-D, G.
– (3 points)-B, C, M, P.
– (4 points)-F, H, V, W, Y.
– (5 points)-K.
– (8 points)- J, X.
– (10 points)-Q, Z
• We then sum the scores and divide each stocks score by the total to calculate the weight e.g. XOM has twice the weight of AAPL
25

© Nick Motson Cass Business School Smart Beta, Scrabble and Simian Indices
THE SCRABBLETM INDEX PERFORMED WELL (MUCH BETTER THAN MARKET-CAP)
Mean Return
Standard Deviation
Sharpe Ratio
Maximum Drawdown
Tracking Error
Information Ratio
Active Share
1-Way Turnover
Cass Scrabble Index 12.1% 16.3% 0.44 -49.3% 4.0% 0.38 46.9% 18.3%
Market Cap-Weighted 10.6% 15.0% 0.38 -48.5% - - - 5.4%
0
2,500
5,000
7,500
10,000
12,500
15,000
1969 1972 1975 1978 1981 1984 1987 1990 1993 1996 1999 2002 2005 2008 2011 2014
Mkt Cap Cass Scrabble Index
26
© Nick Motson Cass Business School Smart Beta, Scrabble and Simian Indices
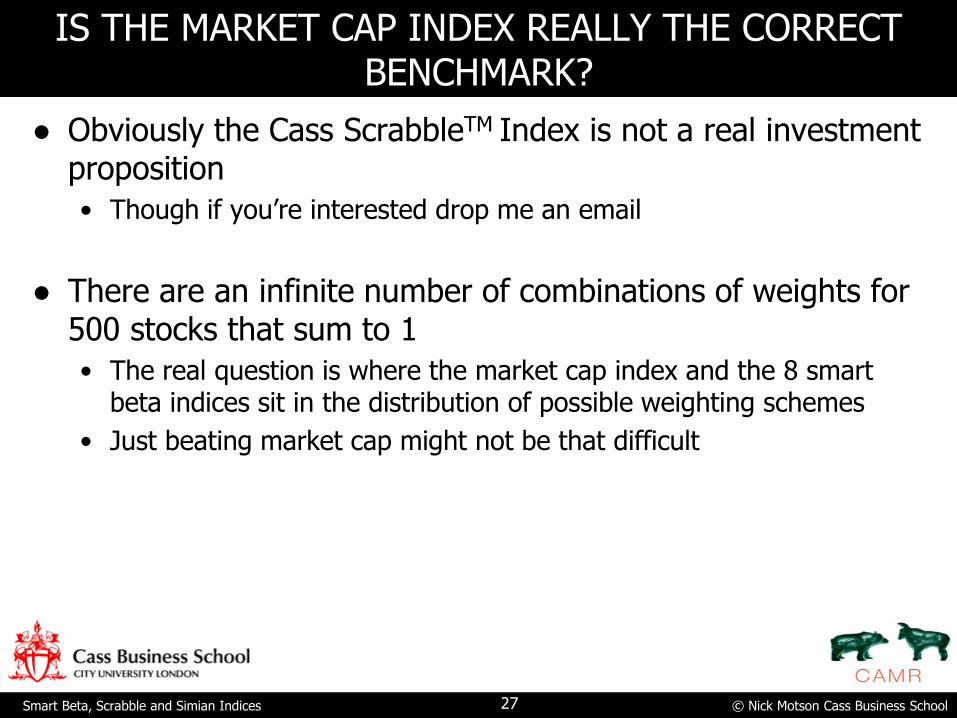
IS THE MARKET CAP INDEX REALLY THE CORRECT BENCHMARK?
● Obviously the Cass ScrabbleTM Index is not a real investment proposition
• Though if you’re interested drop me an email
● There are an infinite number of combinations of weights for 500 stocks that sum to 1
• The real question is where the market cap index and the 8 smart beta indices sit in the distribution of possible weighting schemes
• Just beating market cap might not be that difficult
27

© Nick Motson Cass Business School Smart Beta, Scrabble and Simian Indices
BRING ON THE MONKEYS!
"If one puts an infinite number of monkeys in front of (strongly built) typewriters and lets them clap away (without destroying the machinery), there is a certainty that one of them will come out with an exact version of the 'Iliad.' Once that hero among monkeys is found, would any reader invest [their] life's savings on a bet that the monkey would write the 'Odyssey' next?“[13]
28

© Nick Motson Cass Business School Smart Beta, Scrabble and Simian Indices
WHERE TO FIND AN INFINITE NUMBER OF MONKEYS? (NO MONKEYS WERE HARMED IN THIS EXPERIMENT)
● Even though Cass is located in the square mile we did not have access to an infinite number of monkeys (or typewriters for that matter)
● Instead we devised a robust procedure* to generate 500 random weights that sum to one with a minimum increment of 0.2% and then relied on some serious computer power.
● We constructed 10 million randomly weighted indices and calculated various performance metrics
*See Appendix 2 for details of the algorithm
29

© Nick Motson Cass Business School Smart Beta, Scrabble and Simian Indices
10 MILLION SIMIAN INDICES vs SMART BETA & SCRABBLE INDICES
Equal W
eig
hte
d
Mark
et
Cap W
eig
hte
d
Scr
abble
Weig
hte
d D
ivers
ity W
eig
hte
d
Invers
e V
ola
tilit
y W
eig
hte
d
Equal Ris
k C
ontr
ibution
Fundam
enta
l W
eig
hte
d
Min
imum
Variance
Port
folio
Maxim
um
Div
ers
ific
ation
Ris
k E
ffic
ient
0%
10%
20%
30%
40%
50%
60%
70%
80%
90%
100%
0.0%
0.5%
1.0%
1.5%
2.0%
2.5%
3.0%
3.5%
4.0%
4.5%
5.0%
0.36 0.37 0.38 0.39 0.40 0.41 0.42 0.43 0.44 0.45 0.46 0.47 0.48 0.49 0.50
Cu
mu
lati
ve
Fre
qu
en
cy
Fre
qu
en
cy
Sharpe Ratio
30

© Nick Motson Cass Business School Smart Beta, Scrabble and Simian Indices
10 MILLION SIMIAN INDICES VERSUS MARKET CAP OVER TIME
31
10
100
1,000
10,000
100,000
1969 1971 1973 1975 1977 1979 1981 1983 1985 1987 1989 1991 1993 1995 1997 1999 2001 2003 2005 2007 2009 2011 2013
1% 5% 10%
© Nick Motson Cass Business School Smart Beta, Scrabble and Simian Indices
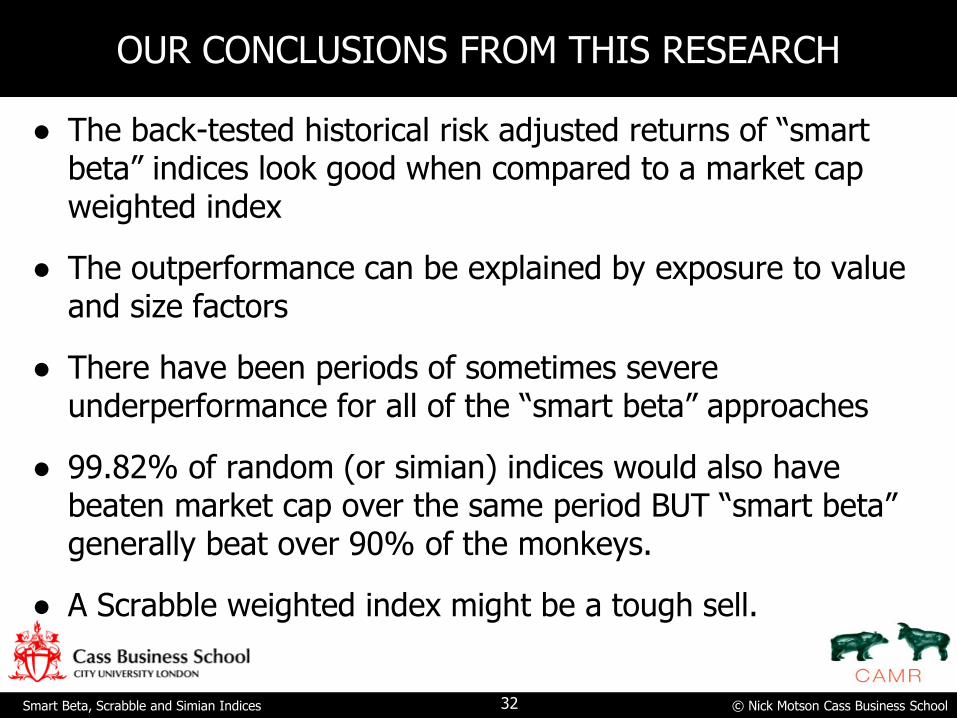
OUR CONCLUSIONS FROM THIS RESEARCH
● The back-tested historical risk adjusted returns of “smart beta” indices look good when compared to a market cap weighted index
● The outperformance can be explained by exposure to value and size factors
● There have been periods of sometimes severe underperformance for all of the “smart beta” approaches
● 99.82% of random (or simian) indices would also have beaten market cap over the same period BUT “smart beta” generally beat over 90% of the monkeys.
● A Scrabble weighted index might be a tough sell.
32
© Nick Motson Cass Business School Smart Beta, Scrabble and Simian Indices
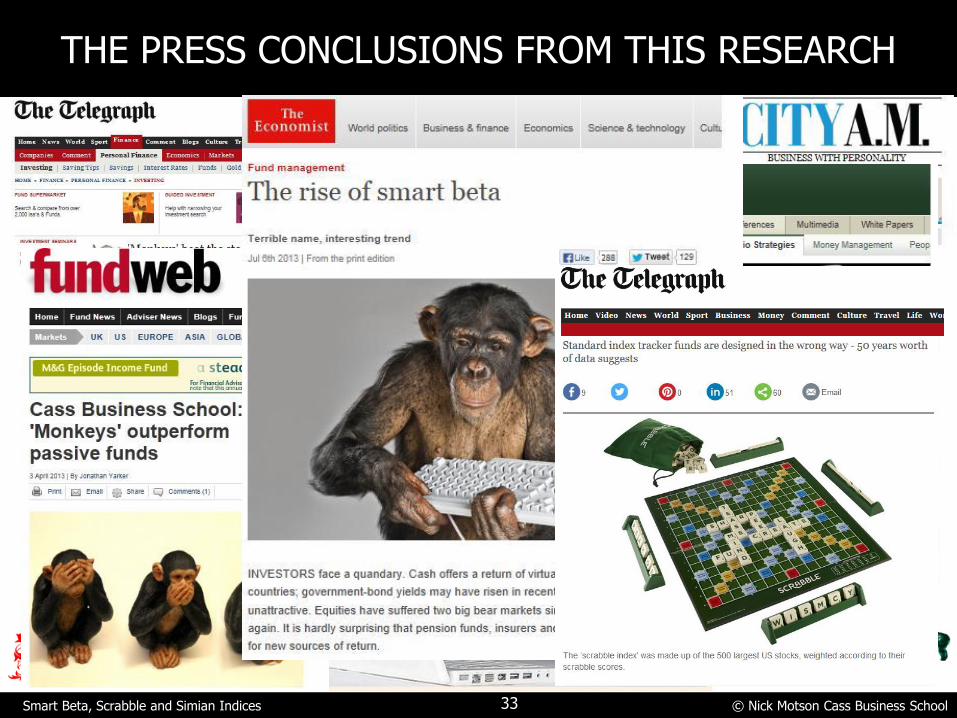
THE PRESS CONCLUSIONS FROM THIS RESEARCH
33

© Nick Motson Cass Business School Smart Beta, Scrabble and Simian Indices
34

© Nick Motson Cass Business School Smart Beta, Scrabble and Simian Indices
Appendix 1:
Constructing The Alternatives

© Nick Motson Cass Business School Smart Beta, Scrabble and Simian Indices
CONSTRUCTING THE SET OF ALTERNATIVES
● Equally-weighted • Each stock is given a weight of 1/n. This very simple and perhaps somewhat
naive approach to determining weights was examined by DeMiguel, Garlappi and Uppal (2009) [3] and found to outperform many more sophisticated methods due to the avoidance of parameter estimation errors. Numerous investable equal weight indices are available e.g. S&P, MSCI, Russell etc.
● Diversity-weighted • This approach was first proposed by Fernholz et al (1998) [4] Effectively it
involves raising the Market-cap weight (w) of each constituent by the value p, that is wp, where p is bounded between 1 and 0. The weight of each index constituent is then calculated by dividing its wp weight by the sum of all wps of all of the constituents in the index. When p is set to 1 then the constituent weights are equal to Market-cap weights and when p is set to 0 the weights are equivalent to equal weights. We use p=0.76 which is the value used in the original paper. INTECH Investment Management LLC apply the diversity approach.
36

© Nick Motson Cass Business School Smart Beta, Scrabble and Simian Indices
CONSTRUCTING THE SET OF ALTERNATIVES
● Inverse volatility • In the mid-1970s Haugen and Heins [5] published a paper that demonstrated
that low volatility stocks tended to outperform high volatility stocks, since then there has been much research on the “low-volatility anomaly”. We calculate the historical return variance of each stock using five years of monthly data. We then calculate the inverse of this value, so that the stock with the lowest volatility will have the highest inverted volatility. We then simply summed these inverted variances. The weight of stock i is then calculated by dividing the inverse of its return variance by the total inverted return variance. This process therefore assigns the biggest weight to the stock with the lowest volatility, and the lowest weight to the stock with the highest return volatility. Various investable indices based on this concept are available e.g. S&P Low Vol, MSCI Risk Weighted
37

© Nick Motson Cass Business School Smart Beta, Scrabble and Simian Indices
CONSTRUCTING THE SET OF ALTERNATIVES
● Equal risk contribution • Maillard et al (2008) [6] propose weighting each stock such that that the
contribution of each stock to the risk of the overall portfolio is equal. We use a covariance matrix based on 5 years history (shrunk using Ledoit and Wolf [7]) and the algorithm proposed in this paper to calculate equal risk contribution weights. Investable indices based on this concept are produced by Lyxor e.g. FTSE Lyxor SmartIX ERC
● Minimum variance • The minimum variance approach uses historical data in an attempt to
identify the weights of the global minimum variance portfolio. Authors such as Clarke, de Silva, and Thorley (2006) [8] have identified strong performance of minimum variance portfolios. We use the same shrunk covariance matrix as before and cap individual weights at a maximum of 5%. Various investable version of minimum variance indices are available e.g. FTSE Global Minimum Variance Index Series, MSCI Minimum Variance etc.
38

© Nick Motson Cass Business School Smart Beta, Scrabble and Simian Indices
CONSTRUCTING THE SET OF ALTERNATIVES
● Maximum diversification • Choueifaty and Coignard (2008)[9] introduce a measure of portfolio
diversification, called the “Diversification Ratio”, which is defined as the ratio of a portfolio’s weighted average volatility to its overall volatility. Poorly diversified portfolios that have either concentrated weights, highly correlated holdings or even both will exhibit relatively low diversification ratios. Choueifaty and Coignard propose an optimisation process to identify the ‘most diversified portfolio’ which is defined as the portfolio with the highest diversification ratio. Intuitively it is apparent that if expected returns are proportional to their volatility, the maximum diversification portfolio will be the same as the maximum Sharpe ratio portfolio (this can be proven mathematically). Again we use the same shrunk covariance matrix and cap individual weights at a maximum of 5%. This index is investable via the FTSE TOBAM Maximum Diversification Indices.
39

© Nick Motson Cass Business School Smart Beta, Scrabble and Simian Indices
CONSTRUCTING THE SET OF ALTERNATIVES
● Risk efficient • Amenc, Goltz, Martellini, and Retkowsky (2010) [10] propose a very similar
methodology to maximum diversification except that they assume that the expected return on each constituent is assumed to be linearly related to the downside-deviation of its return. They also group stocks into deciles of semi-deviation and assign each stock the median of its decile. The second stage then involves finding the portfolio with the maximum expected return (proxied by the median downside deviation of each stock’s decile) with the lowest portfolio return standard deviation. To prevent the optimiser from creating a portfolio with concentrated single stock exposures, they impose restrictions on the constituent weights:
– lower limit = 1/(λ x N) x 100%
– upper limit = λ/N x 100%
• where N represents the total number of stocks under consideration and λ is a free parameter. We set λ equal to 2 and use the same shrunk covariance matrix. This index is investable via the FTSE EDHEC Risk Efficient Indices.
40

© Nick Motson Cass Business School Smart Beta, Scrabble and Simian Indices
CONSTRUCTING THE SET OF ALTERNATIVES
● Fundamental Indexing • Arnott et al. (2005) [11] argue that alternative measures of the size or scale
of a company may be just as appropriate a basis for determining constituent weights as the more commonly used metric of market capitalisation. We calculate four different indices that weight stocks according the 5 year historical average of total dividends, cash-flow, book value of equity and sales. We then take the average weights of these four indices to form a fundamental composite index. Research Affiliates, LLC produce investable fundamental indices.
41

© Nick Motson Cass Business School Smart Beta, Scrabble and Simian Indices
Appendix 2:
Constructing The Random Indices

© Nick Motson Cass Business School Smart Beta, Scrabble and Simian Indices
WHERE TO FIND AN INFINITE NUMBER OF MONKEYS? (NO MONKEYS WERE HARMED IN THIS EXPERIMENT)
● There are an infinite number of combinations of weights for 500 stocks that sum to 1
• 1st step is to make this a finite universe by specifying a minimum increment w of 0.2%
• Objective is to sample randomly and uniformly from the set of feasible weights
• For example with 3 stocks, the set of feasible weights form a hyper-plane
43

© Nick Motson Cass Business School Smart Beta, Scrabble and Simian Indices
WHERE TO FIND AN INFINITE NUMBER OF MONKEYS? (NO MONKEYS WERE HARMED IN THIS EXPERIMENT)
● Use an algorithm adapted from Smith and Tromble (2004)[14]
● Given n stocks, 4 steps: 1. Sample n-1 numbers uniformly at random from the set {1, 2, ...
(1/w)+n-1)} without replacement.
2. Sort the numbers in ascending order and append a zero to the beginning of the sequence and (1/w +n) to the end of the sequence.
3. Take the difference between successive numbers in the sample and subtract 1 from each.
4. Multiply these numbers by w.
44

© Nick Motson Cass Business School Smart Beta, Scrabble and Simian Indices
WHERE TO FIND AN INFINITE NUMBER OF MONKEYS? (NO MONKEYS WERE HARMED IN THIS EXPERIMENT)
● Scatter plot of the result of 10,000 repetitions of the above algorithm for n=3 and w=0.1%
45
© Nick Motson Cass Business School Smart Beta, Scrabble and Simian Indices
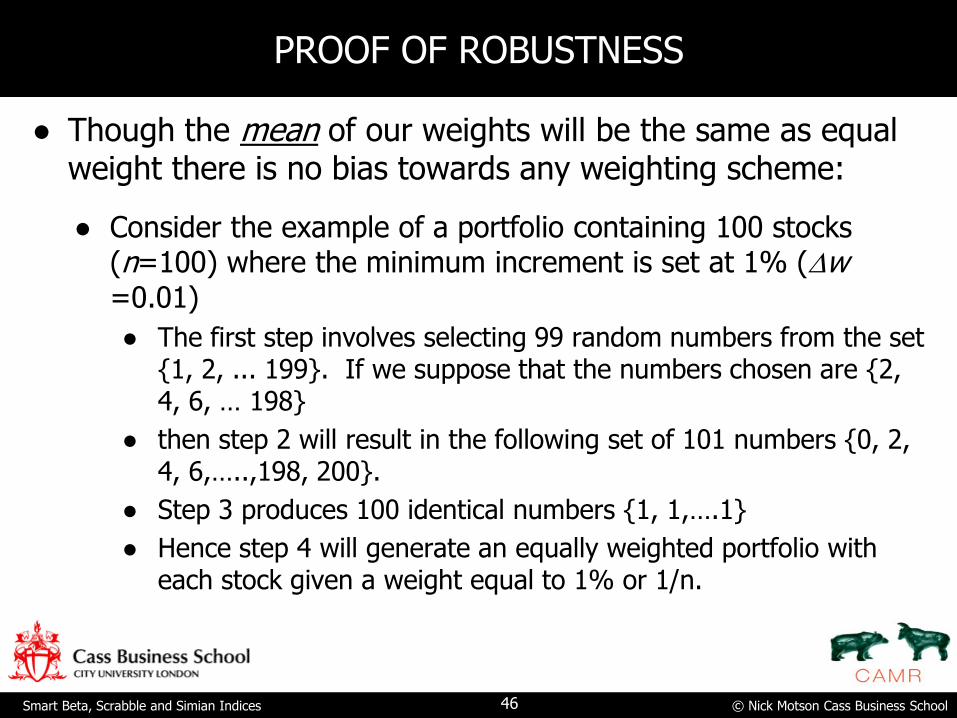
PROOF OF ROBUSTNESS
● Though the mean of our weights will be the same as equal weight there is no bias towards any weighting scheme:
● Consider the example of a portfolio containing 100 stocks (n=100) where the minimum increment is set at 1% (w =0.01)
● The first step involves selecting 99 random numbers from the set {1, 2, ... 199}. If we suppose that the numbers chosen are {2, 4, 6, … 198}
● then step 2 will result in the following set of 101 numbers {0, 2, 4, 6,…..,198, 200}.
● Step 3 produces 100 identical numbers {1, 1,….1}
● Hence step 4 will generate an equally weighted portfolio with each stock given a weight equal to 1% or 1/n.
46

© Nick Motson Cass Business School Smart Beta, Scrabble and Simian Indices
PROOF OF ROBUSTNESS
● If instead the 99 random numbers chosen had been {1, 2, 3, ... 99} then the set of weights produced would be zero for the first 99 stocks and 100% in the 100th stock.
● Since choosing {2, 4, 6, … 198} and choosing {1, 2, 3, …, 99} are equally likely hopefully this demonstrates that the randomly generated portfolio weights are unbiased.
47
© Nick Motson Cass Business School Smart Beta, Scrabble and Simian Indices
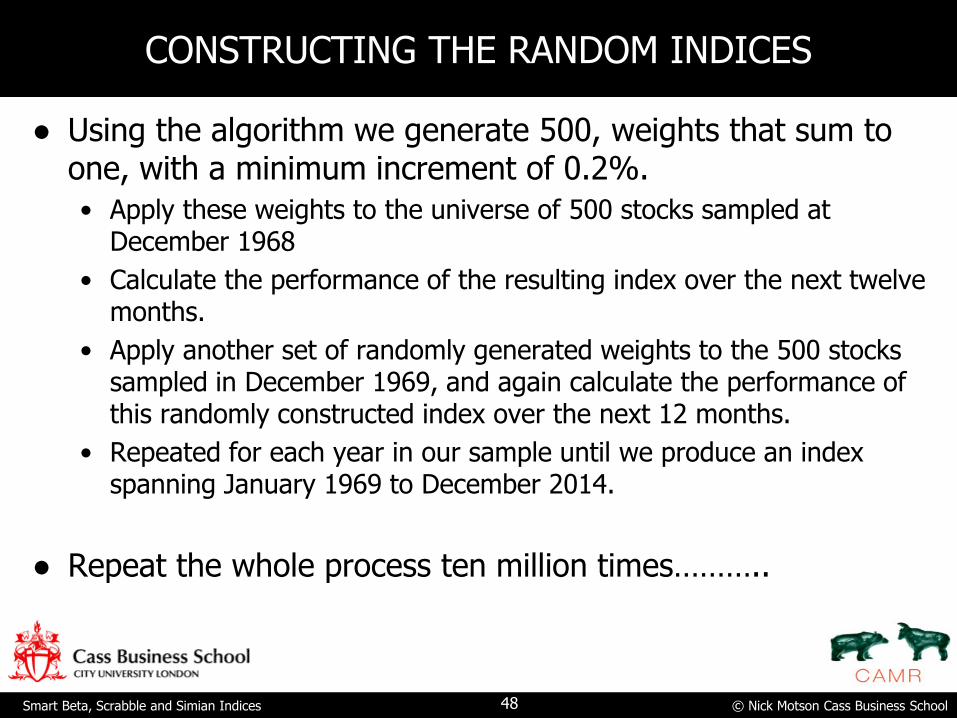
CONSTRUCTING THE RANDOM INDICES
● Using the algorithm we generate 500, weights that sum to one, with a minimum increment of 0.2%.
• Apply these weights to the universe of 500 stocks sampled at December 1968
• Calculate the performance of the resulting index over the next twelve months.
• Apply another set of randomly generated weights to the 500 stocks sampled in December 1969, and again calculate the performance of this randomly constructed index over the next 12 months.
• Repeated for each year in our sample until we produce an index spanning January 1969 to December 2014.
● Repeat the whole process ten million times………..
48

© Nick Motson Cass Business School Smart Beta, Scrabble and Simian Indices
REFERENCES
[1] Clare, Motson, and Thomas (2013) “An Evaluation Of Alternative Equity Indices. Part 1: Heuristic And Optimised Weighting Schemes” Cass Working Paper
[2] Clare, Motson, and Thomas (2013) “An Evaluation Of Alternative Equity Indices. Part 2: Fundamental Weighting Schemes” Cass Working Paper
[3] DeMiguel, V., Garlappi, L., Uppal, R., 2009. Optimal versus naive diversification: How inefficient is the 1/N portfolio strategy?. Review of Financial Studies 22.5, 1915-1953.
[4] Fernholz, Robert, Robert Garvy, and John Hannon. "Diversity-weighted indexing." The Journal of Portfolio Management 24, no. 2 (1998): 74-82.
[5] Haugen, Robert A., and James Heins. (1975) “Risk and Rate of Return on Financial Assets: Some Old Wine in New Bottles,” Journal of Financial and Quantitative Analysis, vol. 10 no. 5 775–784.
[6] Maillard, Sébastien, Thierry Roncalli, and Jérôme Teïletche (2010) "The properties of equally weighted risk contribution portfolios." The Journal of Portfolio Management
[7] Ledoit, Olivier, and Michael Wolf. "Honey, I Shrunk the Sample Covariance Matrix." The Journal of Portfolio Management 30.4 (2004): 110-119.
[8] Clarke, R. G., de Silva, H., & Thorley, S. (2006). Minimum-variance portfolios in the US equity market. The journal of portfolio management, 33(1), 10-24.
[9] Choueifaty, Y., & Coignard, Y. (2008). Toward maximum diversification. The Journal of Portfolio Management, 35(1), 40-51.
[10] Amenc, Noël, Felix Goltz, Lionel Martellini, and Patrice Retkowsky.(2010). “Efficient Indexation: An Alternative to Cap-Weighted Indices.” EDHEC-Risk Institute
[11] Arnott, R. D., Hsu, J., & Moore, P. (2005). Fundamental Indexation. Financial Analysts Journal, 61(2).
[12] Ledoit, O., & Wolf, M. (2008). Robust performance hypothesis testing with the Sharpe ratio. Journal of Empirical Finance, 15(5), 850-859.
[13] Fooled by Randomness: The Hidden Role of Chance in Life and in the Markets by Nassim Nicholas Taleb
[14] Smith, N.A., Tromble, R.W., 2004. Sampling Uniformly From The Unit Simplex. Johns Hopkins University, Tech. Rep
49